net reclassification risk: a graph to clarify the potential … · framingham case study cohort:...
TRANSCRIPT
Net Reclassification Risk: a graph to clarify the potential
prognostic utility of new markers
Ewout Steyerberg Professor of Medical Decision Making
Dept of Public Health, Erasmus MC
Birmingham July, 2013

Ideas from
Colleagues
Michael Pencina
Stuart Baker
Douwe Posmus
Ben van Calster
PhD students:
Moniek Vedder
Maarten Leening

Overview
Performance evaluation:
Prediction vs classification
Graphical displays
Traditional and novel measures
Additional value of markers: NRI and other measures
Apparent vs external validation

Performance evaluation of predictions
First requirement: statistical significance
Likelihood ratio test
Model vs no model
Marker vs without marker
Do not use other test (DeLong for ROC area; NRI test; ..)
Traditional: focus on prediction
Model fit (R2/ Brier/..)
Calibration (testing; recalibration; graphics)
AUC (c statistic / ..)
…
Steyerberg, Vickers, …, Kattan, Epidemiology 2010
Performance evaluation: value of markers
Better decision making by adding a marker
Net Reclassification Improvement (Pencina, Stat Med 2008, weigthed version: 2011; AJE 2012)
Net Benefit and decision curves (Vickers, MDM 2006)
Relative Utility (Baker, JNCI 2009)
Focus shifts from continuous predictions to categorization
NRI often considered in CVD
3 categories (thresholds: 6%, 20%)
NB popular in (prostate) cancer
2 categories (biopsy threshold 10-40%)
Aim
Compare graphical formats and summary measures to quantify usefulness of adding a marker to a model
Framingham case study
Cohort: 3264 participants in Framingham Heart Study
Age 30 to 74 years
183 developed CHD (10 year risk: 5.6%)
Incremental value of adding HDL to Framingham model
HR=0.65; p<.0001
Data used in
Pencina, Stat Med 2008, >1000 citations
Steyerberg, Rev Esp Cardiol 2011, 7 citations
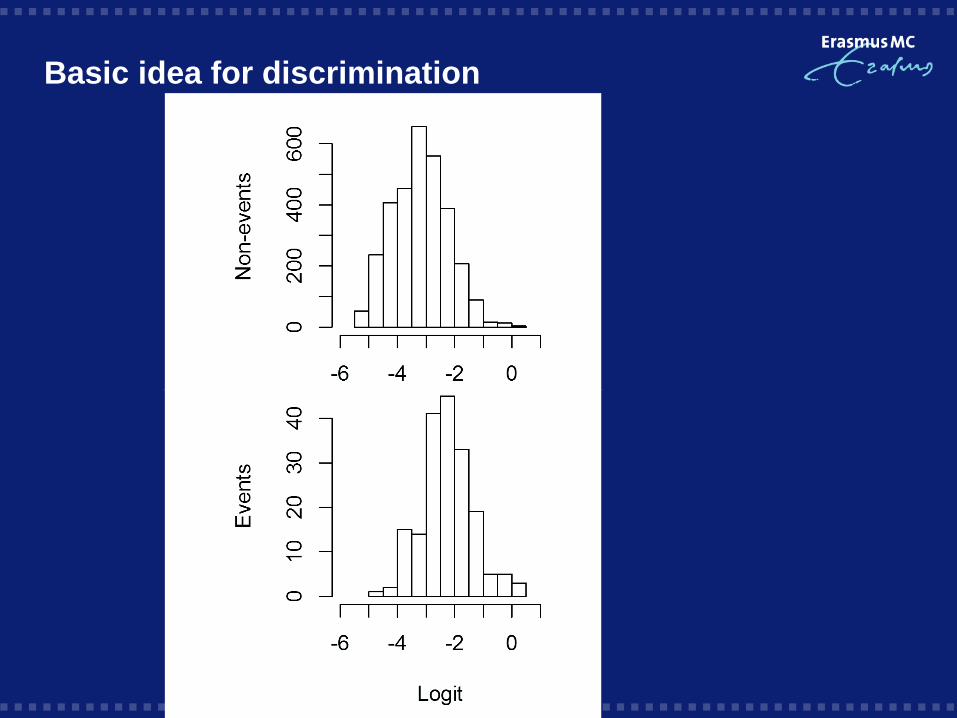
Basic idea for discrimination
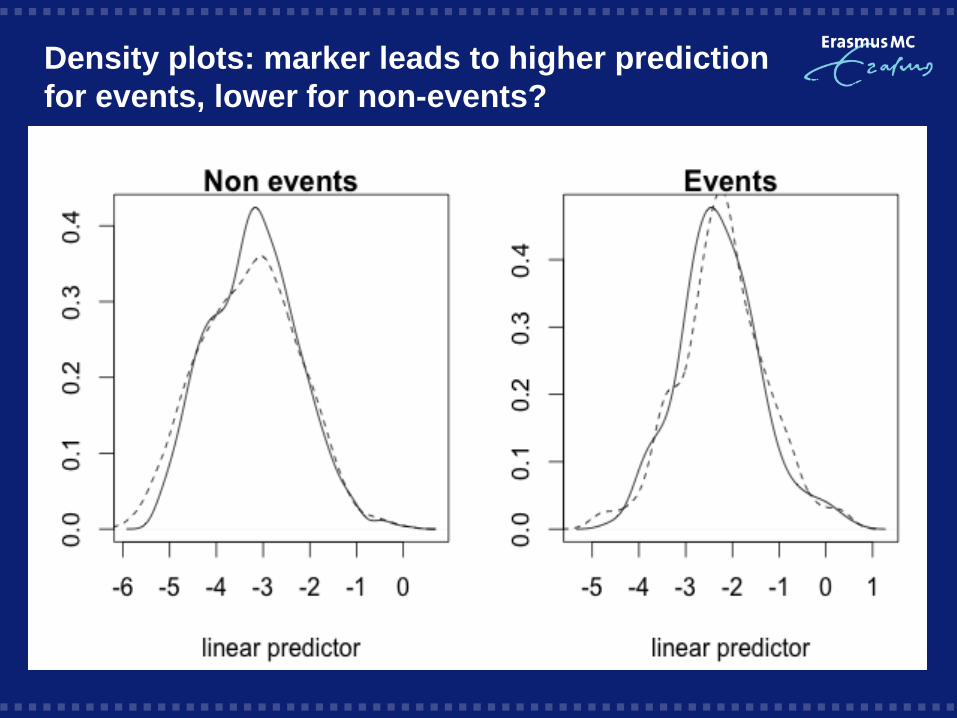
Density plots: marker leads to higher prediction for events, lower for non-events?
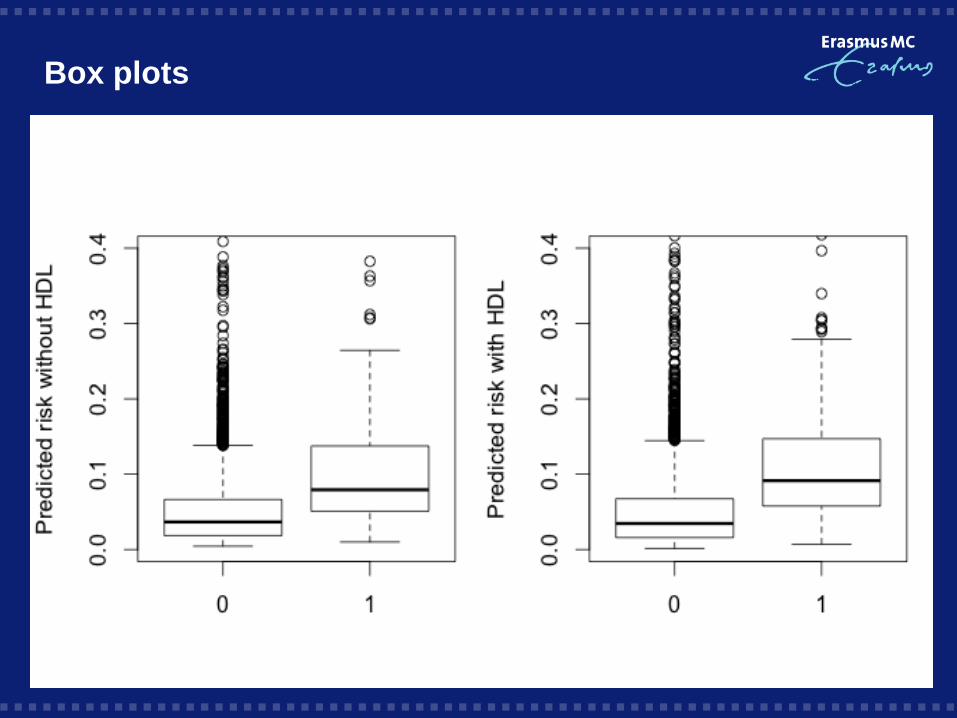
Box plots
Summarize differences in distributions
Difference in mean + SD delta c statistic: +0.012
Log based scoring rules; Nagelkerke R2: +1.6%
Mean prediction by outcome: discrimination slope ≈ Pearson R2 ≈ scaled Brier: +1.9%
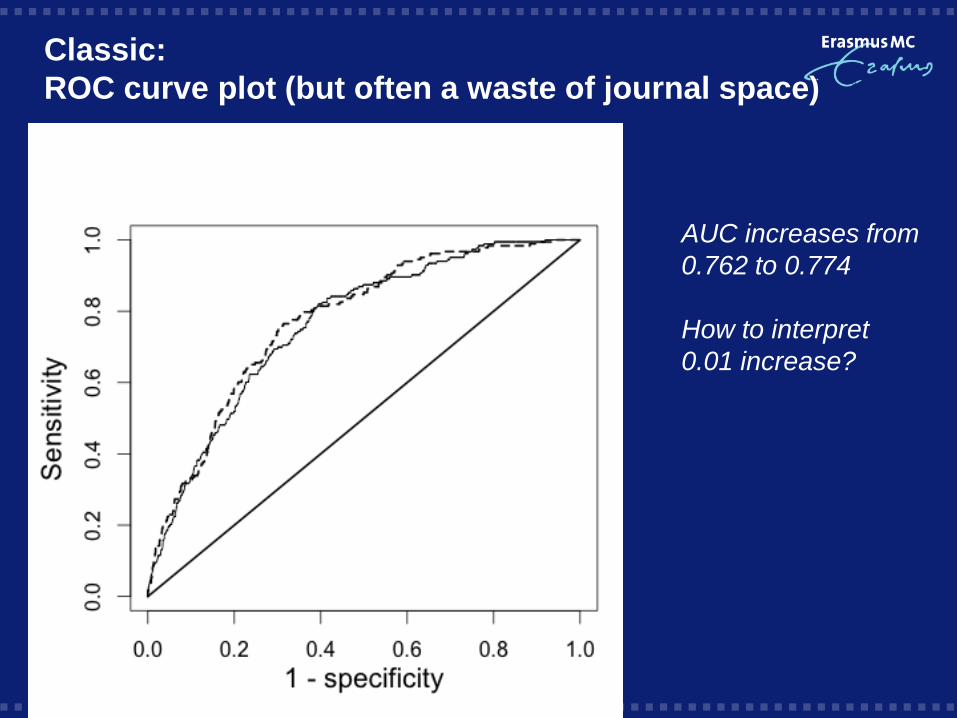
Classic: ROC curve plot (but often a waste of journal space)
AUC increases from 0.762 to 0.774 How to interpret 0.01 increase?
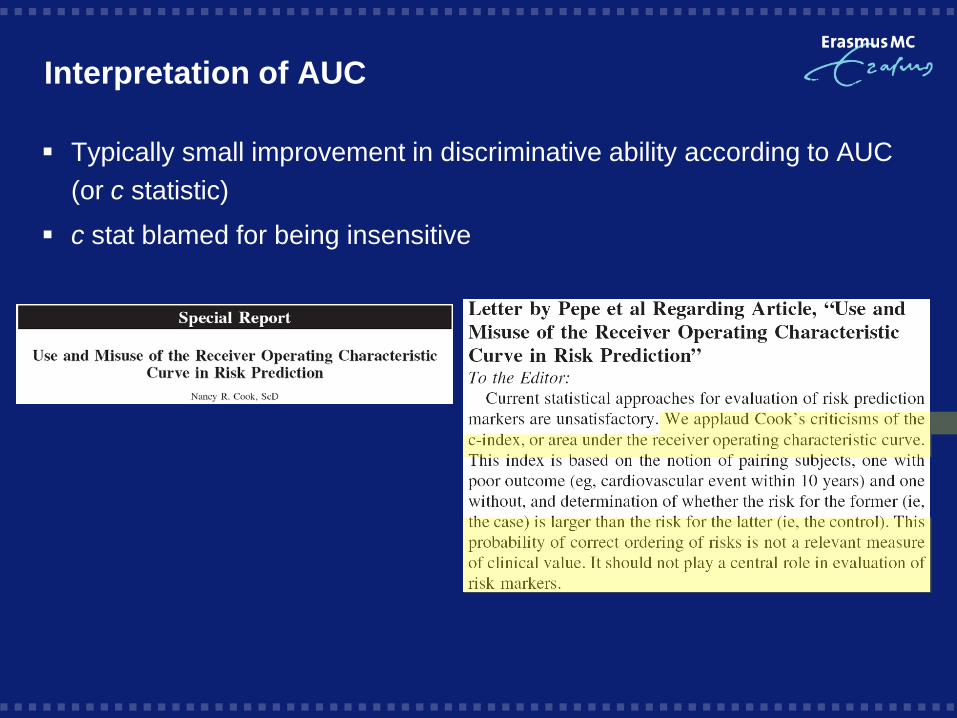
Interpretation of AUC
Typically small improvement in discriminative ability according to AUC (or c statistic)
c stat blamed for being insensitive
A new perspective: reclassification

Net Reclassification Improvement:
(move up | event– move down | event) + (move down | non-event – move up | non-event)

29 7
173 174
22/183=12%
1/3081=.03%
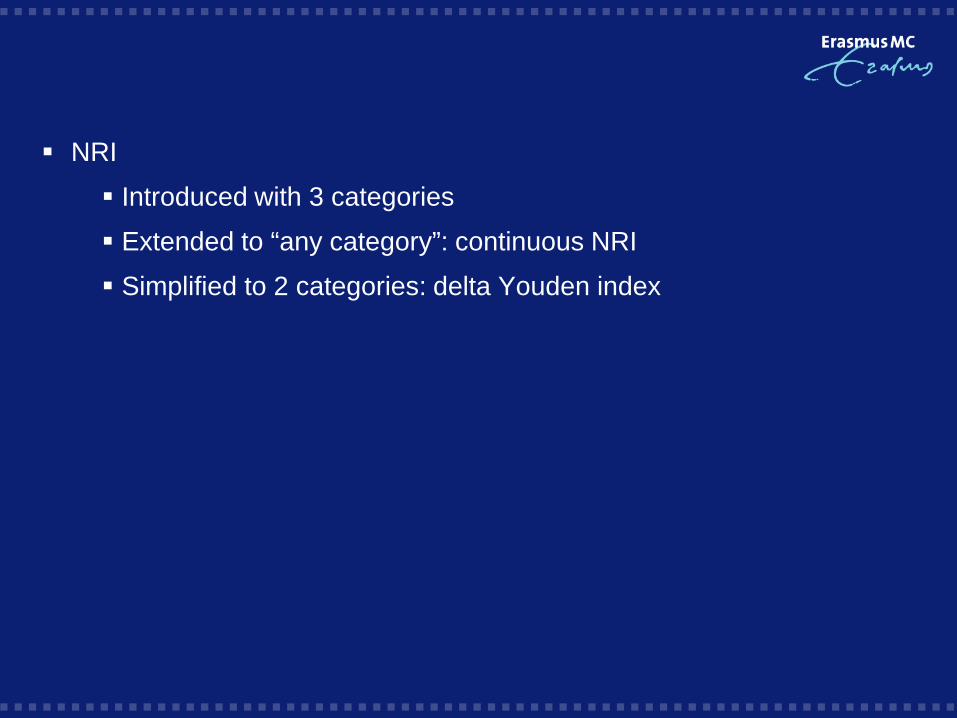
NRI
Introduced with 3 categories
Extended to “any category”: continuous NRI
Simplified to 2 categories: delta Youden index
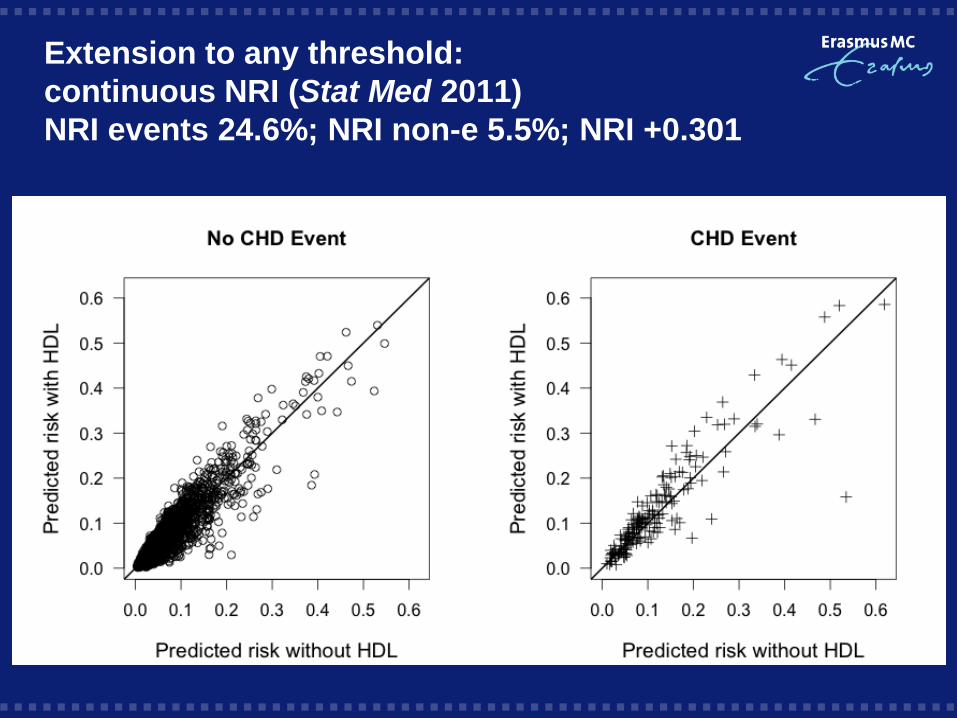
Extension to any threshold: continuous NRI (Stat Med 2011) NRI events 24.6%; NRI non-e 5.5%; NRI +0.301
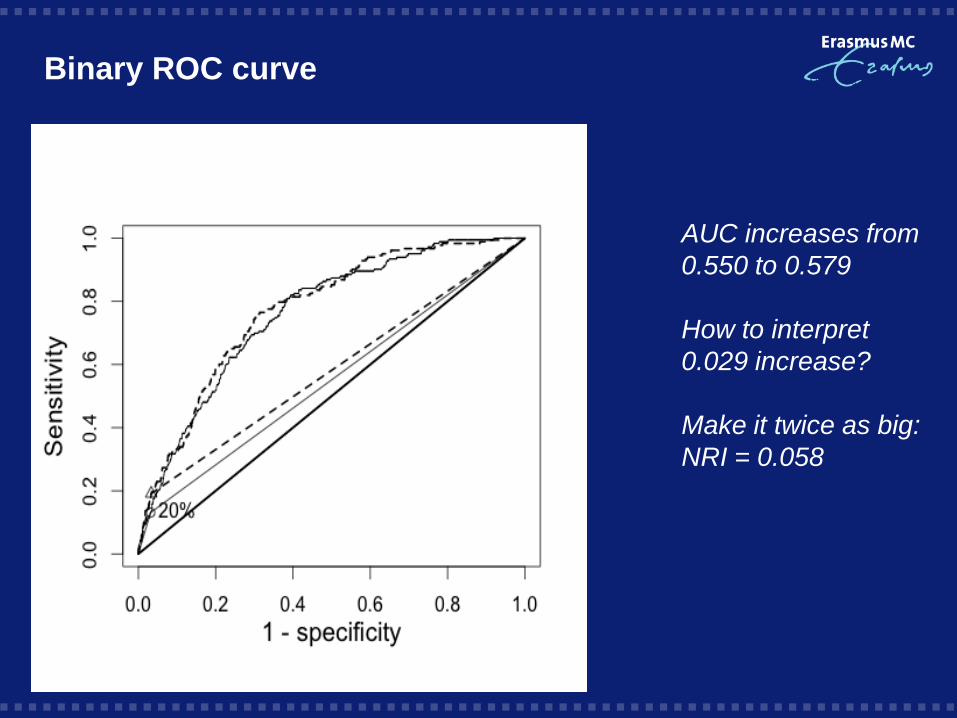
Binary ROC curve
AUC increases from 0.550 to 0.579 How to interpret 0.029 increase? Make it twice as big: NRI = 0.058
Criticism on NRI
‘Nothing new’; related to other measures
for binary classiifcation NRI = delta sens + delta spec
AUC for binary classification = (sens + spec) / 2
NRI = 2 x delta AUC
Interpretation:
delta AUC larger with fewer cut-offs; NRI larger with more cut-offs
Interpretation as ‘net reclassified in population’ (%)
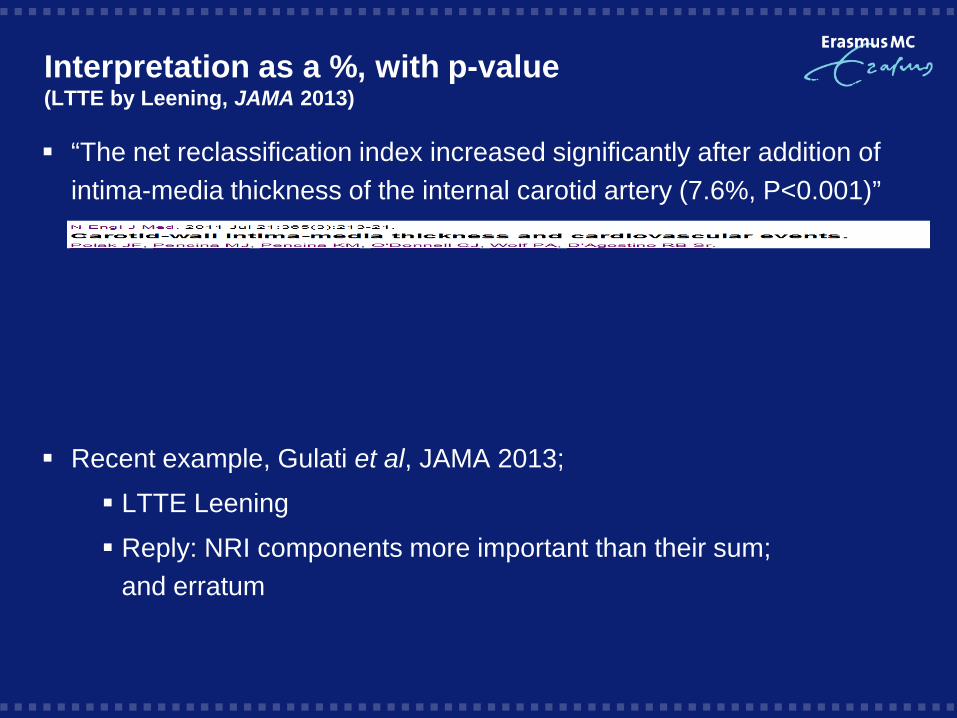
Interpretation as a %, with p-value (LTTE by Leening, JAMA 2013)
“The net reclassification index increased significantly after addition of intima-media thickness of the internal carotid artery (7.6%, P<0.001)”
Recent example, Gulati et al, JAMA 2013;
LTTE Leening
Reply: NRI components more important than their sum; and erratum
Limitation of NRI
Nothing new
Interpretability / misleadingness
Utility / weighting
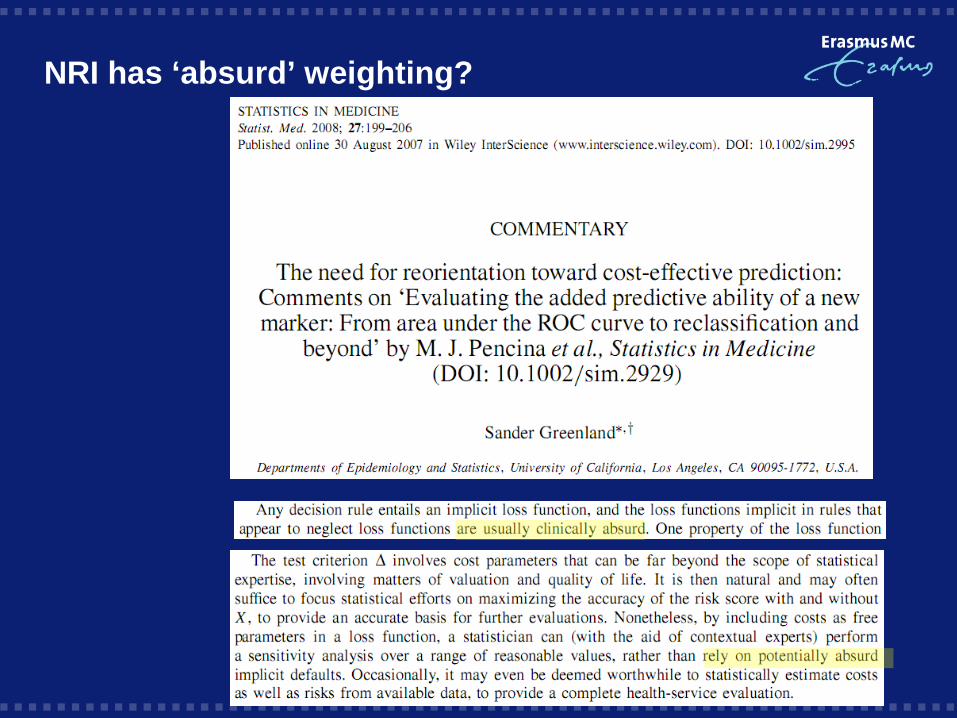
NRI has ‘absurd’ weighting?

Loss function in NRI
Binary NRI = sum (delta(sens) + delta(spec))
Improvements for events / non-events are weighted equally; implies weighting TP (or FN, for events) and FP (or TN, for non-events) by odds(non-events vs events)
E.g. incidence 5.6%, relative weight 94.4 vs 5.6≈17
But cut-off of 20% implies 80:20=4
Inconsistent?
Choosing a cut-off on the probability scale implies a relative weight of TP vs FP, or harm vs benefit ; and vice versa (Peirce Science 1884; Pauker NEJM 1975; Localio AR, Goodman S: Beyond the usual prediction accuracy metrics: reporting results for clinical decision making. Ann Intern Med. 2012 Aug 21Ann Int Med 2012)
Decision-analytic
Decision analytic, e.g. Net Benefit in Decision Curve
Net Benefit = (TP – w FP) / N w = threshold probability / (1-threshold probability) e.g.: threshold 50%: w = .5/.5=1; threshold 20%: w=.2/.8=1/4
Number of true-positive classifications, penalized for false-positive classifications
Vickers & Elkin, MDM 2006

Reclassification table
Reclassification risk table
NRI events = 14-3=11 on 183 events = 6.0% NRI non events = 26 – 31 = –5 on 3081 non events = –0.2% NB = (11 - 0.25*5) / 3264 = 0.003 Test tradeoff = 1/0.003 = 335
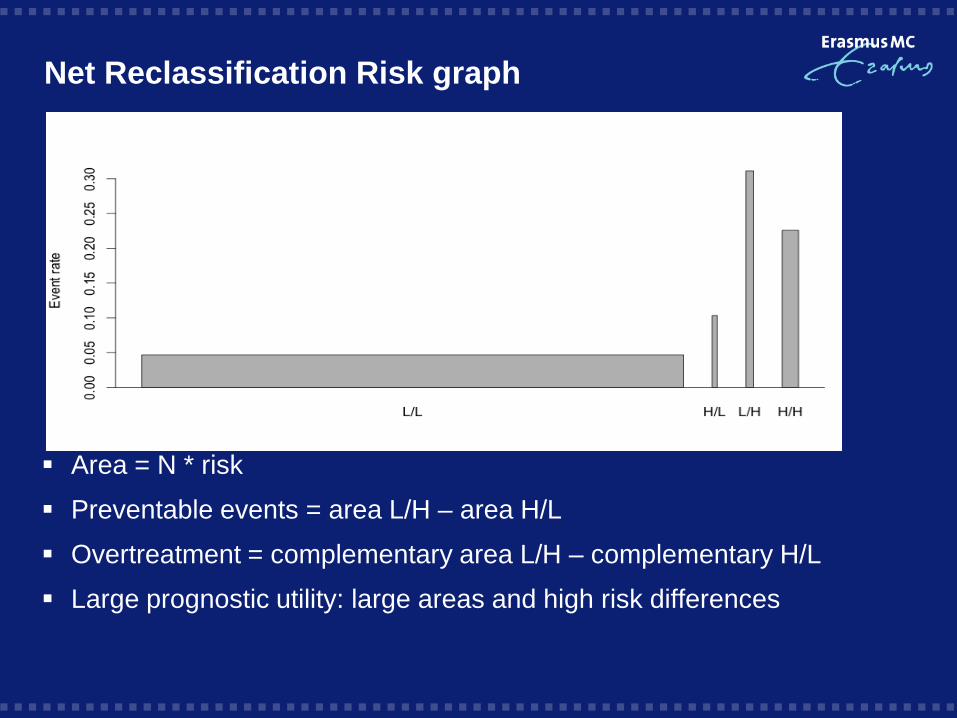
Net Reclassification Risk graph
Area = N * risk
Preventable events = area L/H – area H/L
Overtreatment = complementary area L/H – complementary H/L
Large prognostic utility: large areas and high risk differences
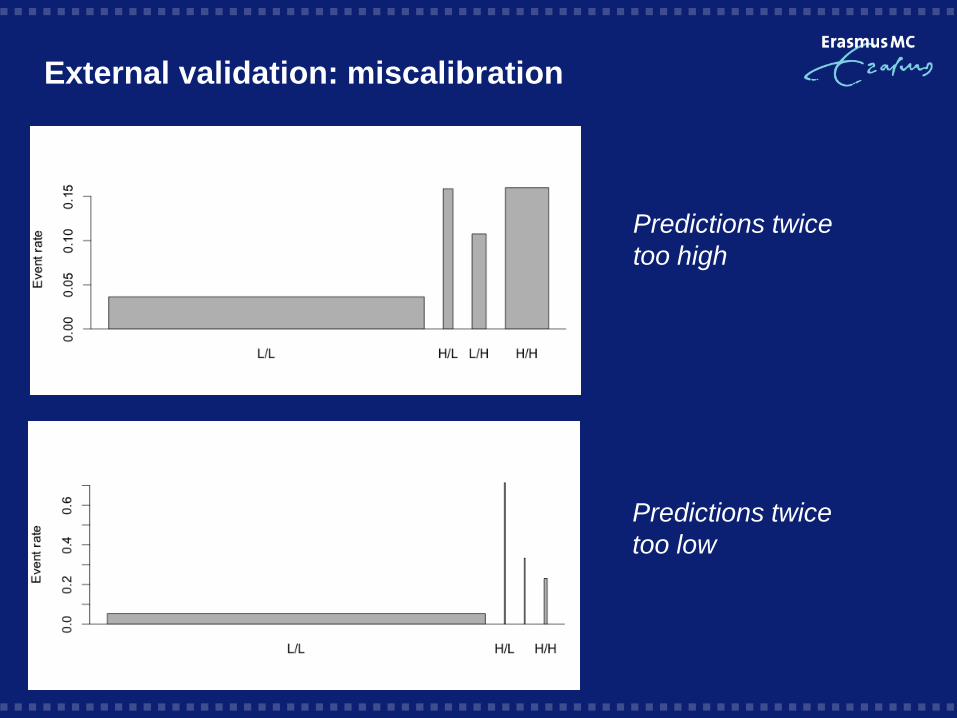
External validation: miscalibration
Predictions twice too high
Predictions twice too low
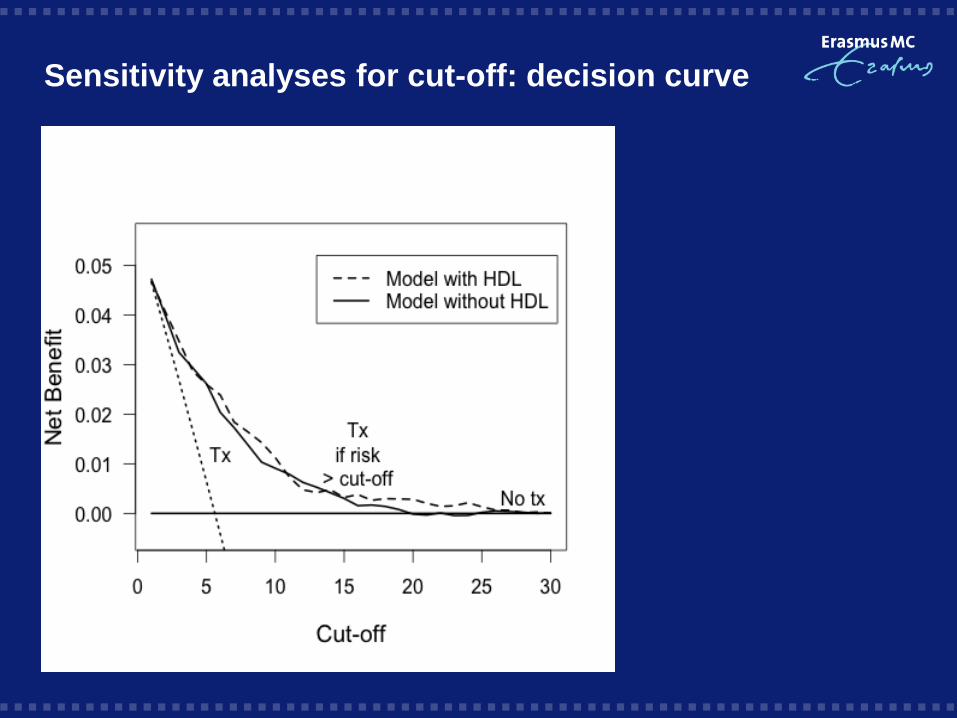
Sensitivity analyses for cut-off: decision curve
Conclusions
Evaluation of improvement in predictive ability requires different graphs and measures for continuous predictions than for classifications
Overall discriminative ability: delta AUC
Usefulness for decision making
Utility-respective measures such as Net Benefit and test tradeoff
Net Reclassification Risk graph for visual assessment and Decision Curve as a sensitivity analysis
Limitations of utility-respecting measures
Properties of Net Reclassification Risk need more work
External validation: model misspecification / miscalibration
Extension to survival / competing risk
Indicators of uncertainty
Definition of ‘important gain’ remains arbitrary; vs p<.05 well accepted; formal cost-effectiveness at the end of evaluation pyramid
References Assessing the performance of prediction models: a framework for traditional and novel measures.
Steyerberg EW, Vickers AJ, Cook NR, Gerds T, Gonen M, Obuchowski N, Pencina MJ, Kattan MW.
Epidemiology. 2010 Jan;21(1):128-38.
Assessing the incremental value of diagnostic and prognostic markers: a review and illustration.
Steyerberg EW, Pencina MJ, Lingsma HF, Kattan MW, Vickers AJ, Van Calster B.
Eur J Clin Invest. 2012 Feb;42(2):216-28.
[Performance measures for prediction models and markers: evaluation of predictions and classifications].
Steyerberg EW, Van Calster B, Pencina MJ. Rev Esp Cardiol. 2011 Sep;64(9):788-94.
Evaluating a new marker for risk prediction using the test tradeoff: an update.
Baker SG, Van Calster B, Steyerberg EW. Int J Biostat. 2012 Mar 22;8(1)
Evaluation of markers and risk prediction models: Overview of relationships between NRI and decision-analytic measures. Ben Van Calster, Vickers AJ, Pencina MJ, Baker SG, Timmerman D, Steyerberg EW. Medical Decision Making, in press