net revenue - monitoring · pdf fileunlike cost of service regulation, ... net revenue is the...
TRANSCRIPT
Section 7 Net Revenue
2016 Quarterly State of the Market Report for PJM: January through September 277© 2016 Monitoring Analytics, LLC
Net RevenueThe Market Monitoring Unit (MMU) analyzed measures of PJM energy market structure, participant conduct and market performance. As part of the review of market performance, the MMU analyzed the net revenues earned by combustion turbine (CT), combined cycle (CC), coal plant (CP), diesel (DS), nuclear (NU), solar, and wind generating units.
OverviewNet Revenue• Energy net revenues are significantly affected by fuel prices and energy
prices. Coal and natural gas prices and energy prices were lower in the first nine months of 2016 than in the first nine months of 2015. Net revenues from the energy market for all plant types were affected by the lower prices.
• In the first nine months of 2016, average energy market net revenues decreased from the first nine months of 2015 by 23 percent for a new CT, 22 percent for a new CC, 60 percent for a new CP, 71 percent for a new DS, 34 percent for a new nuclear plant, 25 percent for a new wind installation, and 33 percent for a new solar installation.
Historical New Entrant CT and CC Revenue AdequacyTotal unit net revenues include both energy and capacity revenues. Analysis of the total unit revenues of new entrant CTs and CCs for three representative locations shows that units that entered the PJM markets in 2007 have not covered their total costs including the return on and of capital through the third quarter of 2016. The analysis also shows that new entrant CTs and CCs that entered the PJM markets in 2012 have covered their total costs in the eastern PSEG and BGE zones but have not covered their total costs in the western ComEd Zone through the third quarter of 2016. The analysis also shows the critical role of capacity market revenue in covering total costs. Energy market revenues were not sufficient to cover total costs in any
scenario except the new entrant CC unit that went into operation in 2012 in BGE through the third quarter of 2016.
ConclusionWholesale electric power markets are affected by externally imposed reliability requirements. A regulatory authority external to the market makes a determination as to the acceptable level of reliability which is enforced through a requirement to maintain a target level of installed or unforced capacity. The requirement to maintain a target level of installed capacity can be enforced via a variety of mechanisms, including government construction of generation, full-requirement contracts with developers to construct and operate generation, state utility commission mandates to construct capacity, or capacity markets of various types. Regardless of the enforcement mechanism, the exogenous requirement to construct capacity in excess of what is constructed in response to energy market signals has an impact on energy markets. The reliability requirement results in maintaining a level of capacity in excess of the level that would result from the operation of an energy market alone. The result of that additional capacity is to reduce the level and volatility of energy market prices and to reduce the duration of high energy market prices. This, in turn, reduces net revenue to generation owners which reduces the incentive to invest. The exact level of both aggregate and locational excess capacity is a function of the calculation methods used by RTOs and ISOs.
Unlike cost of service regulation, markets do not guarantee that units will cover their costs. New CT and CC units that began operation in 2007 have not covered their total costs from energy market and capacity market revenues through September 2016 in the ComEd Zone, in the PSEG Zone and in the BGE Zone. New CT and CC units that began operation on June 1, 2012, have covered or more than covered their total costs in the PSEG Zone and the BGE Zone through September 2016 and have not covered their total costs in the ComEd Zone through September 2016.
2016 Quarterly State of the Market Report for PJM: January through September
278 Section 7 Net Revenue © 2016 Monitoring Analytics, LLC
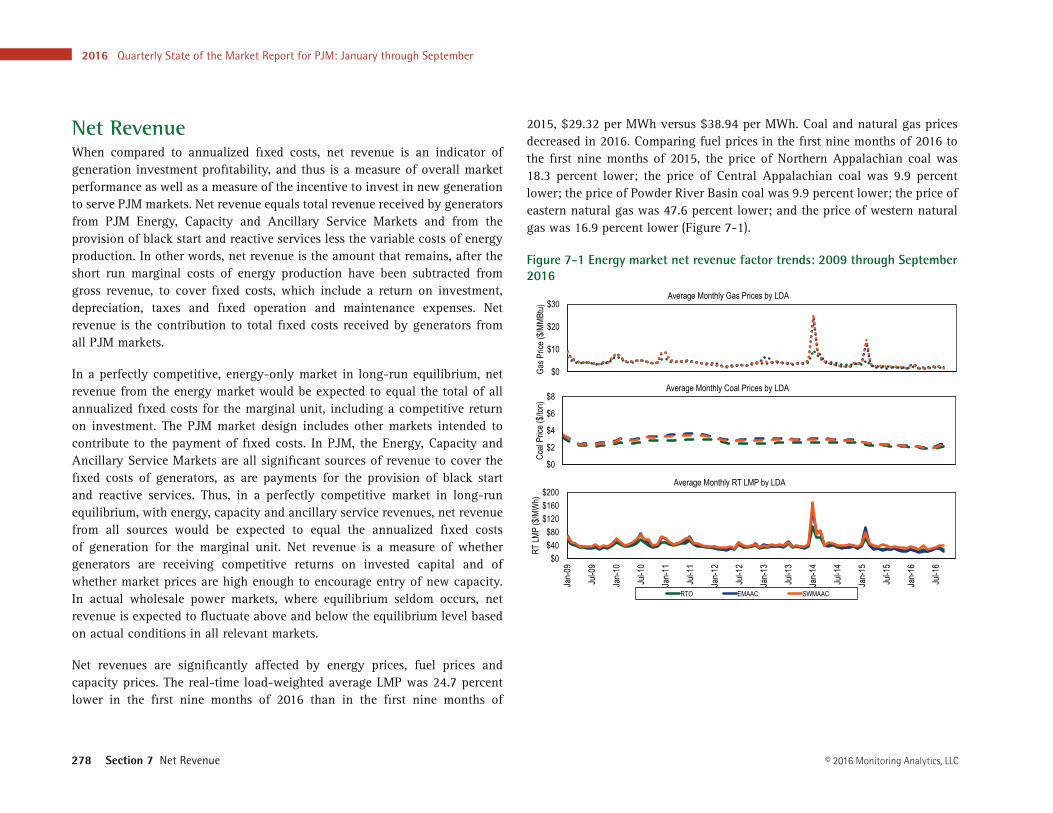
2015, $29.32 per MWh versus $38.94 per MWh. Coal and natural gas prices decreased in 2016. Comparing fuel prices in the first nine months of 2016 to the first nine months of 2015, the price of Northern Appalachian coal was 18.3 percent lower; the price of Central Appalachian coal was 9.9 percent lower; the price of Powder River Basin coal was 9.9 percent lower; the price of eastern natural gas was 47.6 percent lower; and the price of western natural gas was 16.9 percent lower (Figure 7-1).
Figure 7-1 Energy market net revenue factor trends: 2009 through September 2016
$0$40$80
$120$160$200
Jan-
09
Jul-0
9
Jan-
10
Jul-1
0
Jan-
11
Jul-1
1
Jan-
12
Jul-1
2
Jan-
13
Jul-1
3
Jan-
14
Jul-1
4
Jan-
15
Jul-1
5
Jan-
16
Jul-1
6
RT LM
P ($
/MW
h)
Average Monthly RT LMP by LDA
RTO EMAAC SWMAAC
$0
$2
$4
$6
$8
Coal
Price
($/to
n)
Average Monthly Coal Prices by LDA
$0
$10
$20
$30
Gas P
rice (
$/MMB
tu) Average Monthly Gas Prices by LDA
Net RevenueWhen compared to annualized fixed costs, net revenue is an indicator of generation investment profitability, and thus is a measure of overall market performance as well as a measure of the incentive to invest in new generation to serve PJM markets. Net revenue equals total revenue received by generators from PJM Energy, Capacity and Ancillary Service Markets and from the provision of black start and reactive services less the variable costs of energy production. In other words, net revenue is the amount that remains, after the short run marginal costs of energy production have been subtracted from gross revenue, to cover fixed costs, which include a return on investment, depreciation, taxes and fixed operation and maintenance expenses. Net revenue is the contribution to total fixed costs received by generators from all PJM markets.
In a perfectly competitive, energy-only market in long-run equilibrium, net revenue from the energy market would be expected to equal the total of all annualized fixed costs for the marginal unit, including a competitive return on investment. The PJM market design includes other markets intended to contribute to the payment of fixed costs. In PJM, the Energy, Capacity and Ancillary Service Markets are all significant sources of revenue to cover the fixed costs of generators, as are payments for the provision of black start and reactive services. Thus, in a perfectly competitive market in long-run equilibrium, with energy, capacity and ancillary service revenues, net revenue from all sources would be expected to equal the annualized fixed costs of generation for the marginal unit. Net revenue is a measure of whether generators are receiving competitive returns on invested capital and of whether market prices are high enough to encourage entry of new capacity. In actual wholesale power markets, where equilibrium seldom occurs, net revenue is expected to fluctuate above and below the equilibrium level based on actual conditions in all relevant markets.
Net revenues are significantly affected by energy prices, fuel prices and capacity prices. The real-time load-weighted average LMP was 24.7 percent lower in the first nine months of 2016 than in the first nine months of
Section 7 Net Revenue
2016 Quarterly State of the Market Report for PJM: January through September 279© 2016 Monitoring Analytics, LLC
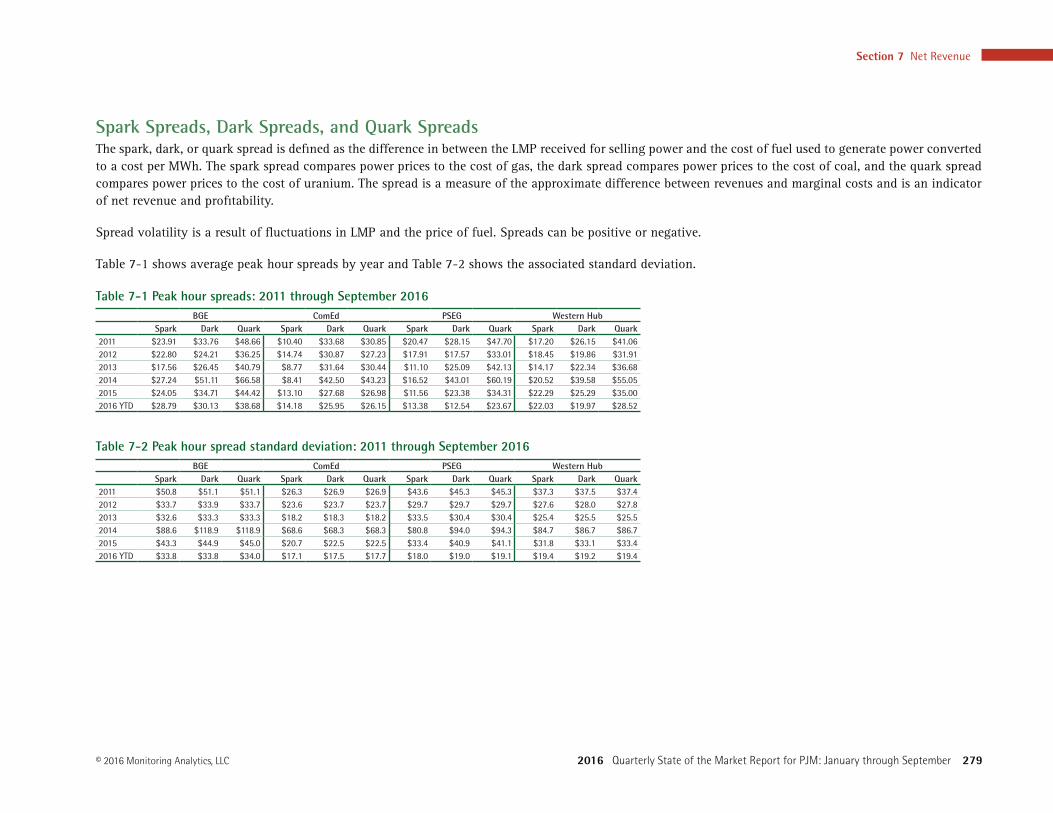
Spark Spreads, Dark Spreads, and Quark SpreadsThe spark, dark, or quark spread is defined as the difference in between the LMP received for selling power and the cost of fuel used to generate power converted to a cost per MWh. The spark spread compares power prices to the cost of gas, the dark spread compares power prices to the cost of coal, and the quark spread compares power prices to the cost of uranium. The spread is a measure of the approximate difference between revenues and marginal costs and is an indicator of net revenue and profitability.
Spread volatility is a result of fluctuations in LMP and the price of fuel. Spreads can be positive or negative.
Table 7-1 shows average peak hour spreads by year and Table 7-2 shows the associated standard deviation.
Table 7-1 Peak hour spreads: 2011 through September 2016BGE ComEd PSEG Western Hub
Spark Dark Quark Spark Dark Quark Spark Dark Quark Spark Dark Quark2011 $23.91 $33.76 $48.66 $10.40 $33.68 $30.85 $20.47 $28.15 $47.70 $17.20 $26.15 $41.06 2012 $22.80 $24.21 $36.25 $14.74 $30.87 $27.23 $17.91 $17.57 $33.01 $18.45 $19.86 $31.91 2013 $17.56 $26.45 $40.79 $8.77 $31.64 $30.44 $11.10 $25.09 $42.13 $14.17 $22.34 $36.68 2014 $27.24 $51.11 $66.58 $8.41 $42.50 $43.23 $16.52 $43.01 $60.19 $20.52 $39.58 $55.05 2015 $24.05 $34.71 $44.42 $13.10 $27.68 $26.98 $11.56 $23.38 $34.31 $22.29 $25.29 $35.00 2016 YTD $28.79 $30.13 $38.68 $14.18 $25.95 $26.15 $13.38 $12.54 $23.67 $22.03 $19.97 $28.52
Table 7-2 Peak hour spread standard deviation: 2011 through September 2016BGE ComEd PSEG Western Hub
Spark Dark Quark Spark Dark Quark Spark Dark Quark Spark Dark Quark2011 $50.8 $51.1 $51.1 $26.3 $26.9 $26.9 $43.6 $45.3 $45.3 $37.3 $37.5 $37.4 2012 $33.7 $33.9 $33.7 $23.6 $23.7 $23.7 $29.7 $29.7 $29.7 $27.6 $28.0 $27.8 2013 $32.6 $33.3 $33.3 $18.2 $18.3 $18.2 $33.5 $30.4 $30.4 $25.4 $25.5 $25.5 2014 $88.6 $118.9 $118.9 $68.6 $68.3 $68.3 $80.8 $94.0 $94.3 $84.7 $86.7 $86.7 2015 $43.3 $44.9 $45.0 $20.7 $22.5 $22.5 $33.4 $40.9 $41.1 $31.8 $33.1 $33.4 2016 YTD $33.8 $33.8 $34.0 $17.1 $17.5 $17.7 $18.0 $19.0 $19.1 $19.4 $19.2 $19.4
2016 Quarterly State of the Market Report for PJM: January through September
280 Section 7 Net Revenue © 2016 Monitoring Analytics, LLC
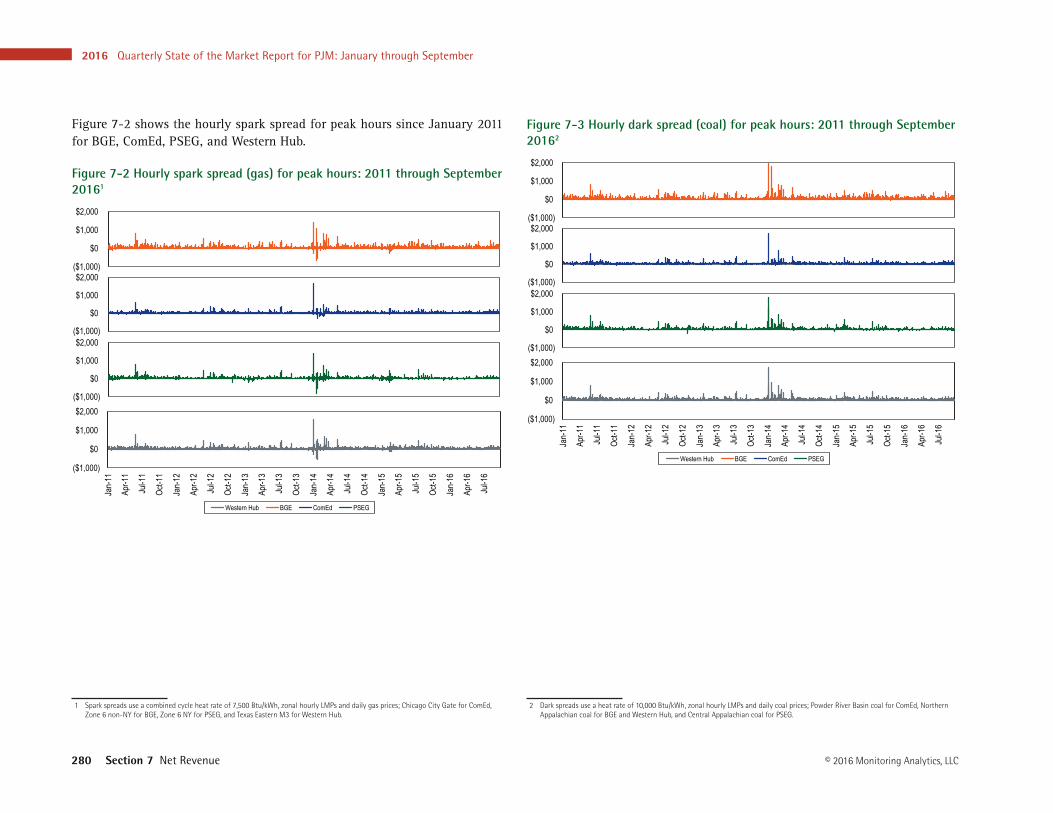
Figure 7-2 shows the hourly spark spread for peak hours since January 2011 for BGE, ComEd, PSEG, and Western Hub.
Figure 7-2 Hourly spark spread (gas) for peak hours: 2011 through September 20161
($1,000)
$0
$1,000
$2,000
Jan-
11
Apr-1
1
Jul-1
1
Oct-1
1
Jan-
12
Apr-1
2
Jul-1
2
Oct-1
2
Jan-
13
Apr-1
3
Jul-1
3
Oct-1
3
Jan-
14
Apr-1
4
Jul-1
4
Oct-1
4
Jan-
15
Apr-1
5
Jul-1
5
Oct-1
5
Jan-
16
Apr-1
6
Jul-1
6
Western Hub BGE ComEd PSEG
($1,000)
$0
$1,000
$2,000
($1,000)
$0
$1,000
$2,000
($1,000)
$0
$1,000
$2,000
1 Spark spreads use a combined cycle heat rate of 7,500 Btu/kWh, zonal hourly LMPs and daily gas prices; Chicago City Gate for ComEd, Zone 6 non-NY for BGE, Zone 6 NY for PSEG, and Texas Eastern M3 for Western Hub.
Figure 7-3 Hourly dark spread (coal) for peak hours: 2011 through September 20162
($1,000)
$0
$1,000
$2,000
Jan-
11
Apr-1
1
Jul-1
1
Oct-1
1
Jan-
12
Apr-1
2
Jul-1
2
Oct-1
2
Jan-
13
Apr-1
3
Jul-1
3
Oct-1
3
Jan-
14
Apr-1
4
Jul-1
4
Oct-1
4
Jan-
15
Apr-1
5
Jul-1
5
Oct-1
5
Jan-
16
Apr-1
6
Jul-1
6
Western Hub BGE ComEd PSEG
($1,000)
$0
$1,000
$2,000
($1,000)
$0
$1,000
$2,000
($1,000)
$0
$1,000
$2,000
2 Dark spreads use a heat rate of 10,000 Btu/kWh, zonal hourly LMPs and daily coal prices; Powder River Basin coal for ComEd, Northern Appalachian coal for BGE and Western Hub, and Central Appalachian coal for PSEG.
Section 7 Net Revenue
2016 Quarterly State of the Market Report for PJM: January through September 281© 2016 Monitoring Analytics, LLC
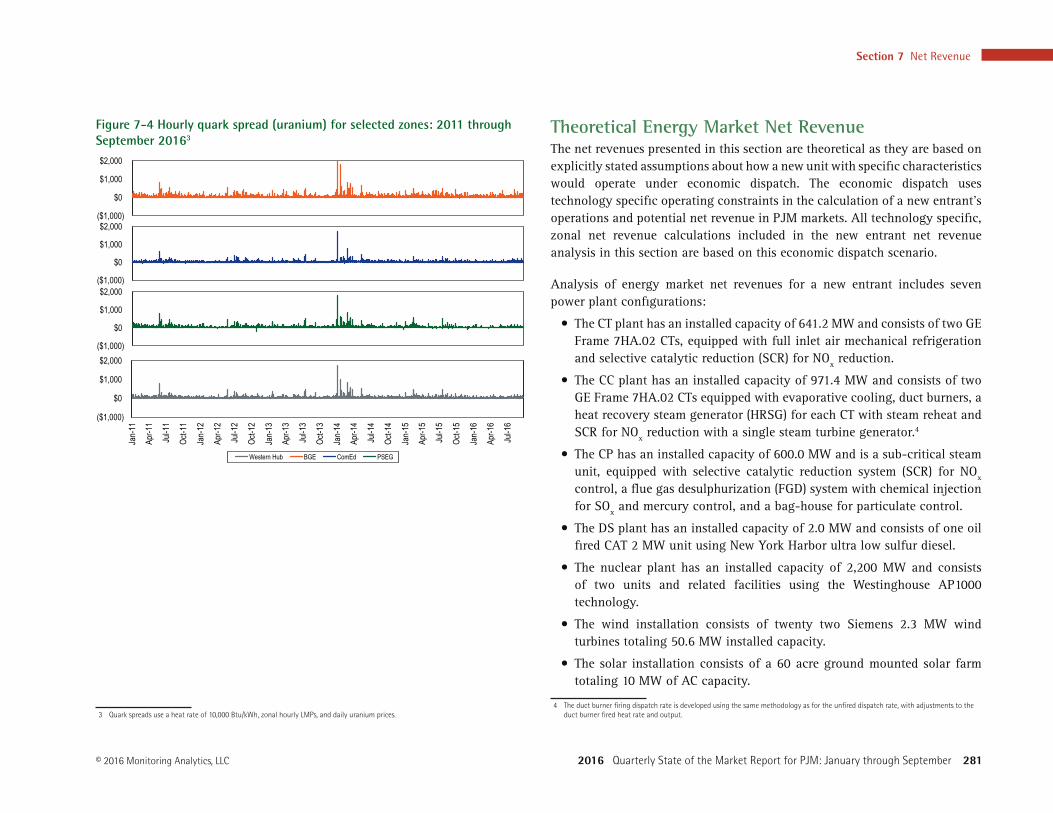
Figure 7-4 Hourly quark spread (uranium) for selected zones: 2011 through September 20163
($1,000)
$0
$1,000
$2,000
Jan-
11
Apr-1
1
Jul-1
1
Oct-1
1
Jan-
12
Apr-1
2
Jul-1
2
Oct-1
2
Jan-
13
Apr-1
3
Jul-1
3
Oct-1
3
Jan-
14
Apr-1
4
Jul-1
4
Oct-1
4
Jan-
15
Apr-1
5
Jul-1
5
Oct-1
5
Jan-
16
Apr-1
6
Jul-1
6
Western Hub BGE ComEd PSEG
($1,000)
$0
$1,000
$2,000
($1,000)
$0
$1,000
$2,000
($1,000)
$0
$1,000
$2,000
3 Quark spreads use a heat rate of 10,000 Btu/kWh, zonal hourly LMPs, and daily uranium prices.
Theoretical Energy Market Net RevenueThe net revenues presented in this section are theoretical as they are based on explicitly stated assumptions about how a new unit with specific characteristics would operate under economic dispatch. The economic dispatch uses technology specific operating constraints in the calculation of a new entrant’s operations and potential net revenue in PJM markets. All technology specific, zonal net revenue calculations included in the new entrant net revenue analysis in this section are based on this economic dispatch scenario.
Analysis of energy market net revenues for a new entrant includes seven power plant configurations:
• The CT plant has an installed capacity of 641.2 MW and consists of two GE Frame 7HA.02 CTs, equipped with full inlet air mechanical refrigeration and selective catalytic reduction (SCR) for NOx reduction.
• The CC plant has an installed capacity of 971.4 MW and consists of two GE Frame 7HA.02 CTs equipped with evaporative cooling, duct burners, a heat recovery steam generator (HRSG) for each CT with steam reheat and SCR for NOx reduction with a single steam turbine generator.4
• The CP has an installed capacity of 600.0 MW and is a sub-critical steam unit, equipped with selective catalytic reduction system (SCR) for NOx control, a flue gas desulphurization (FGD) system with chemical injection for SOx and mercury control, and a bag-house for particulate control.
• The DS plant has an installed capacity of 2.0 MW and consists of one oil fired CAT 2 MW unit using New York Harbor ultra low sulfur diesel.
• The nuclear plant has an installed capacity of 2,200 MW and consists of two units and related facilities using the Westinghouse AP1000 technology.
• The wind installation consists of twenty two Siemens 2.3 MW wind turbines totaling 50.6 MW installed capacity.
• The solar installation consists of a 60 acre ground mounted solar farm totaling 10 MW of AC capacity.
4 The duct burner firing dispatch rate is developed using the same methodology as for the unfired dispatch rate, with adjustments to the duct burner fired heat rate and output.
2016 Quarterly State of the Market Report for PJM: January through September
282 Section 7 Net Revenue © 2016 Monitoring Analytics, LLC
Net revenue calculations for the CT, CC and CP include the hourly effect of actual local ambient air temperature on plant heat rates and generator output for each of the three plant configurations.5 6 Plant heat rates account for the efficiency changes and corresponding cost changes resulting from ambient air temperatures.
CO2, NOx and SO2 emission allowance costs are included in the hourly plant dispatch cost, the short run marginal cost. CO2, NOx and SO2 emission allowance costs were obtained from daily spot cash prices.7
A forced outage rate for each class of plant was calculated from PJM data and incorporated into all revenue calculations.8 Each CT, CC, CP, and DS plant was assumed to take a continuous 14 day planned annual outage in the fall season.
Zonal net revenues reflect zonal fuel costs based on locational fuel indices and zone specific delivery charges.9 The delivered fuel cost for natural gas reflects the zonal, daily delivered price of natural gas and is from published commodity daily cash prices, with a basis adjustment for transportation costs.10 The delivered cost of coal reflects the zone specific, delivered price of coal and was developed from the published prompt-month price, adjusted for rail transportation cost.11
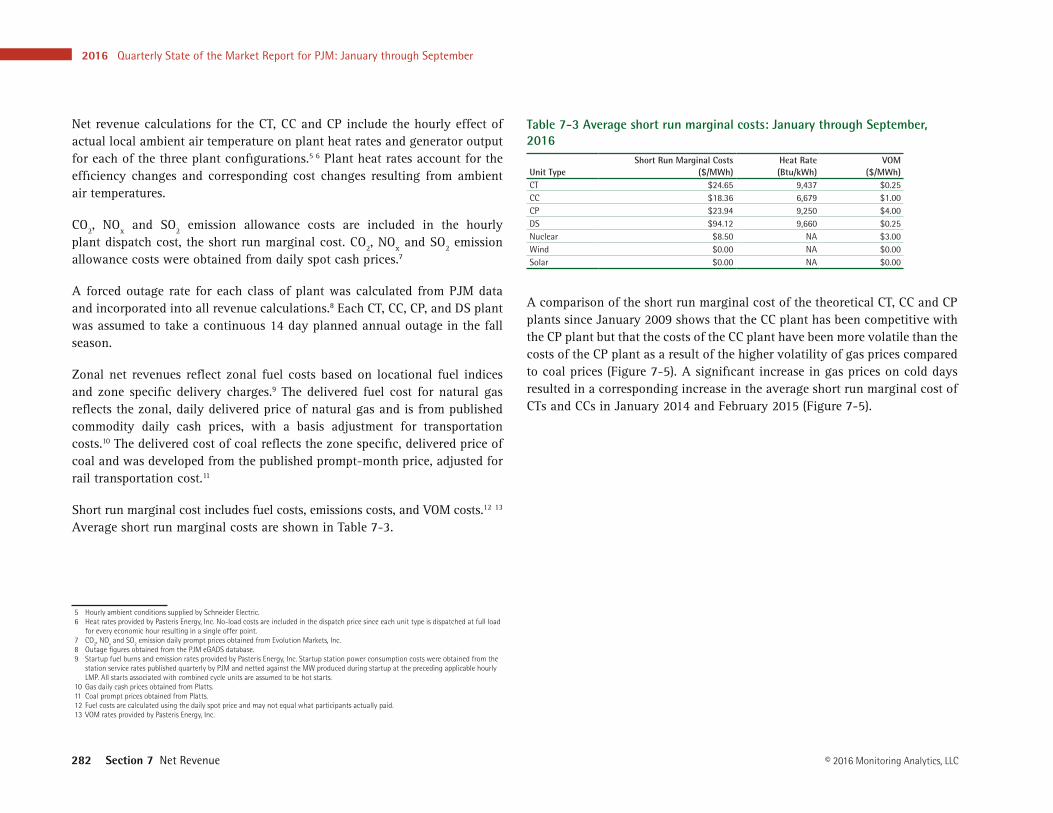
Short run marginal cost includes fuel costs, emissions costs, and VOM costs.12 13 Average short run marginal costs are shown in Table 7-3.
5 Hourly ambient conditions supplied by Schneider Electric.6 Heat rates provided by Pasteris Energy, Inc. No-load costs are included in the dispatch price since each unit type is dispatched at full load
for every economic hour resulting in a single offer point.7 CO2, NOx and SO2 emission daily prompt prices obtained from Evolution Markets, Inc.8 Outage figures obtained from the PJM eGADS database.9 Startup fuel burns and emission rates provided by Pasteris Energy, Inc. Startup station power consumption costs were obtained from the
station service rates published quarterly by PJM and netted against the MW produced during startup at the preceding applicable hourly LMP. All starts associated with combined cycle units are assumed to be hot starts.
10 Gas daily cash prices obtained from Platts.11 Coal prompt prices obtained from Platts.12 Fuel costs are calculated using the daily spot price and may not equal what participants actually paid.13 VOM rates provided by Pasteris Energy, Inc.
Table 7-3 Average short run marginal costs: January through September, 2016
Unit TypeShort Run Marginal Costs
($/MWh)Heat Rate (Btu/kWh)
VOM ($/MWh)
CT $24.65 9,437 $0.25 CC $18.36 6,679 $1.00 CP $23.94 9,250 $4.00 DS $94.12 9,660 $0.25 Nuclear $8.50 NA $3.00 Wind $0.00 NA $0.00 Solar $0.00 NA $0.00
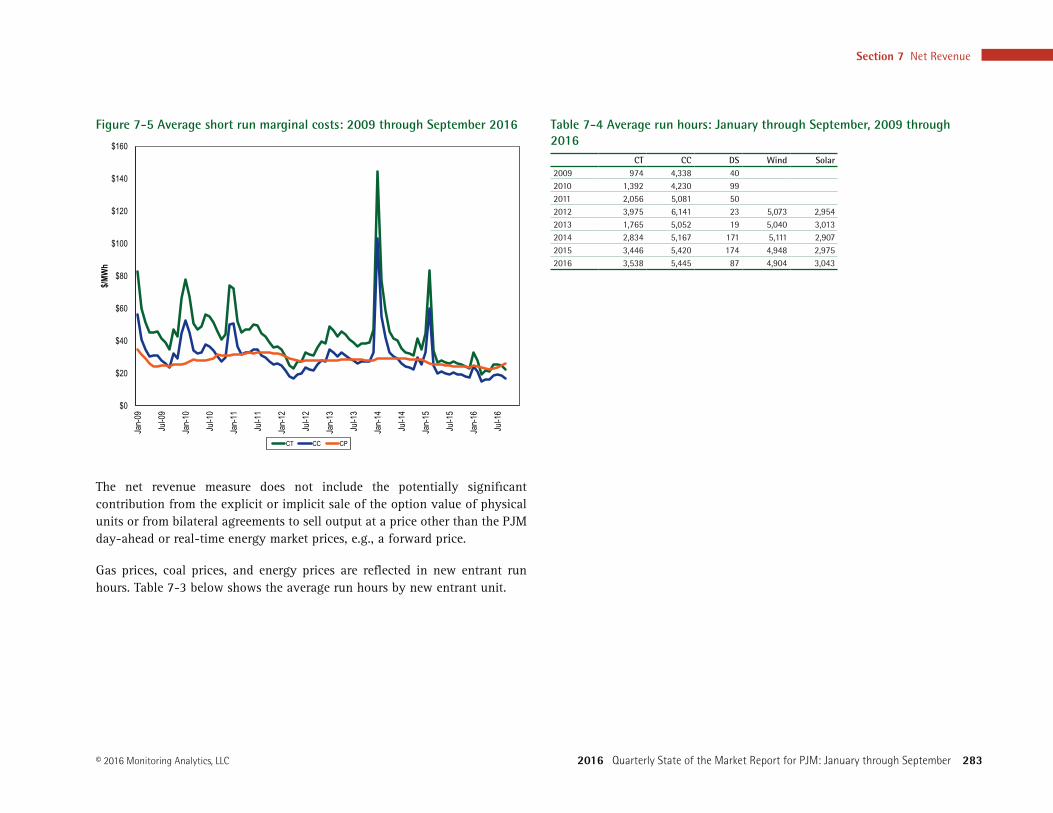
A comparison of the short run marginal cost of the theoretical CT, CC and CP plants since January 2009 shows that the CC plant has been competitive with the CP plant but that the costs of the CC plant have been more volatile than the costs of the CP plant as a result of the higher volatility of gas prices compared to coal prices (Figure 7-5). A significant increase in gas prices on cold days resulted in a corresponding increase in the average short run marginal cost of CTs and CCs in January 2014 and February 2015 (Figure 7-5).
Section 7 Net Revenue
2016 Quarterly State of the Market Report for PJM: January through September 283© 2016 Monitoring Analytics, LLC
Figure 7-5 Average short run marginal costs: 2009 through September 2016
$0
$20
$40
$60
$80
$100
$120
$140
$160Jan-09
Jul-0
9
Jan-10
Jul-1
0
Jan-11
Jul-1
1
Jan-12
Jul-1
2
Jan-13
Jul-1
3
Jan-14
Jul-1
4
Jan-15
Jul-1
5
Jan-16
Jul-1
6
$/MW
h
CT CC CP
The net revenue measure does not include the potentially significant contribution from the explicit or implicit sale of the option value of physical units or from bilateral agreements to sell output at a price other than the PJM day-ahead or real-time energy market prices, e.g., a forward price.
Gas prices, coal prices, and energy prices are reflected in new entrant run hours. Table 7-3 below shows the average run hours by new entrant unit.
Table 7-4 Average run hours: January through September, 2009 through 2016
CT CC DS Wind Solar2009 974 4,338 40 2010 1,392 4,230 99 2011 2,056 5,081 50 2012 3,975 6,141 23 5,073 2,954 2013 1,765 5,052 19 5,040 3,013 2014 2,834 5,167 171 5,111 2,907 2015 3,446 5,420 174 4,948 2,975 2016 3,538 5,445 87 4,904 3,043
2016 Quarterly State of the Market Report for PJM: January through September
284 Section 7 Net Revenue © 2016 Monitoring Analytics, LLC
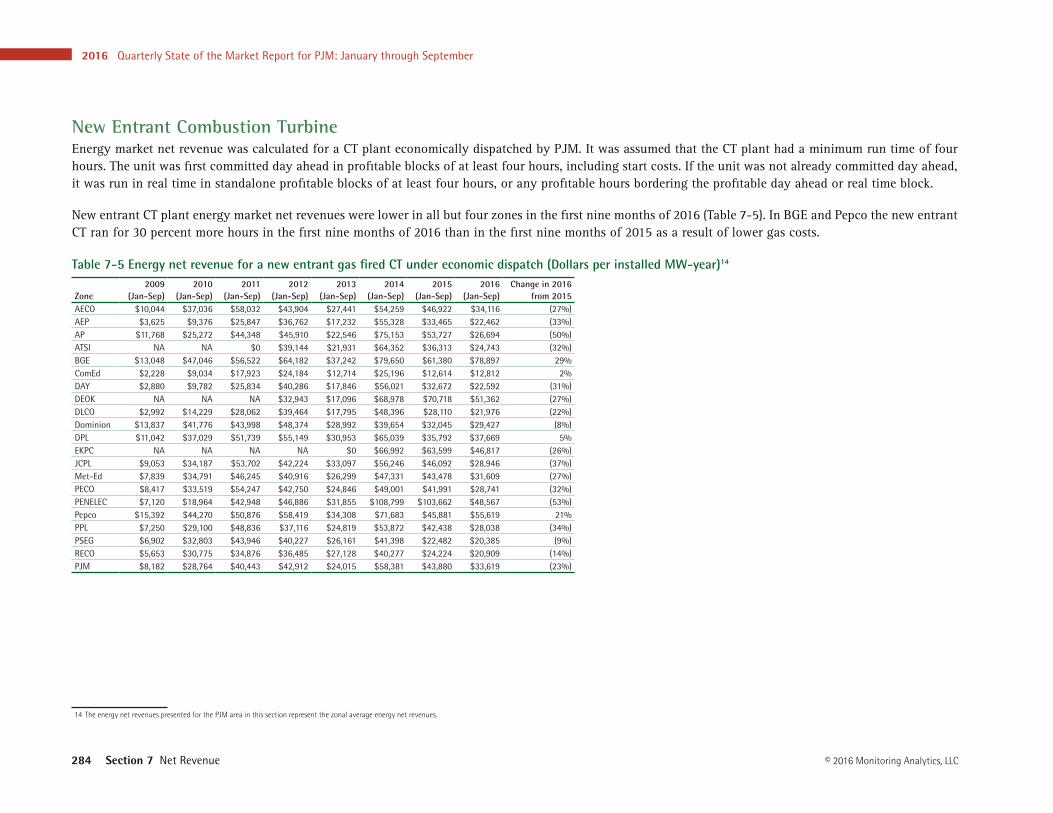
New Entrant Combustion TurbineEnergy market net revenue was calculated for a CT plant economically dispatched by PJM. It was assumed that the CT plant had a minimum run time of four hours. The unit was first committed day ahead in profitable blocks of at least four hours, including start costs. If the unit was not already committed day ahead, it was run in real time in standalone profitable blocks of at least four hours, or any profitable hours bordering the profitable day ahead or real time block.
New entrant CT plant energy market net revenues were lower in all but four zones in the first nine months of 2016 (Table 7-5). In BGE and Pepco the new entrant CT ran for 30 percent more hours in the first nine months of 2016 than in the first nine months of 2015 as a result of lower gas costs.
Table 7-5 Energy net revenue for a new entrant gas fired CT under economic dispatch (Dollars per installed MW-year)14
Zone2009
(Jan-Sep)2010
(Jan-Sep)2011
(Jan-Sep)2012
(Jan-Sep)2013
(Jan-Sep)2014
(Jan-Sep)2015
(Jan-Sep)2016
(Jan-Sep)Change in 2016
from 2015AECO $10,044 $37,036 $58,032 $43,904 $27,441 $54,259 $46,922 $34,116 (27%)AEP $3,625 $9,376 $25,847 $36,762 $17,232 $55,328 $33,465 $22,462 (33%)AP $11,768 $25,272 $44,348 $45,910 $22,546 $75,153 $53,727 $26,694 (50%)ATSI NA NA $0 $39,144 $21,931 $64,352 $36,313 $24,743 (32%)BGE $13,048 $47,046 $56,522 $64,182 $37,242 $79,650 $61,380 $78,897 29% ComEd $2,228 $9,034 $17,923 $24,184 $12,714 $25,196 $12,614 $12,812 2% DAY $2,880 $9,782 $25,834 $40,286 $17,846 $56,021 $32,672 $22,592 (31%)DEOK NA NA NA $32,943 $17,096 $68,978 $70,718 $51,362 (27%)DLCO $2,992 $14,229 $28,062 $39,464 $17,795 $48,396 $28,110 $21,976 (22%)Dominion $13,837 $41,776 $43,998 $48,374 $28,992 $39,654 $32,045 $29,427 (8%)DPL $11,042 $37,029 $51,739 $55,149 $30,953 $65,039 $35,792 $37,669 5% EKPC NA NA NA NA $0 $66,992 $63,599 $46,817 (26%)JCPL $9,053 $34,187 $53,702 $42,224 $33,097 $56,246 $46,092 $28,946 (37%)Met-Ed $7,839 $34,791 $46,245 $40,916 $26,299 $47,331 $43,478 $31,609 (27%)PECO $8,417 $33,519 $54,247 $42,750 $24,846 $49,001 $41,991 $28,741 (32%)PENELEC $7,120 $18,964 $42,948 $46,886 $31,855 $108,799 $103,662 $48,567 (53%)Pepco $15,392 $44,270 $50,876 $58,419 $34,308 $71,683 $45,881 $55,619 21% PPL $7,250 $29,100 $48,836 $37,116 $24,819 $53,872 $42,438 $28,038 (34%)PSEG $6,902 $32,803 $43,946 $40,227 $26,161 $41,398 $22,482 $20,385 (9%)RECO $5,653 $30,775 $34,876 $36,485 $27,128 $40,277 $24,224 $20,909 (14%)PJM $8,182 $28,764 $40,443 $42,912 $24,015 $58,381 $43,880 $33,619 (23%)
14 The energy net revenues presented for the PJM area in this section represent the zonal average energy net revenues.
Section 7 Net Revenue
2016 Quarterly State of the Market Report for PJM: January through September 285© 2016 Monitoring Analytics, LLC
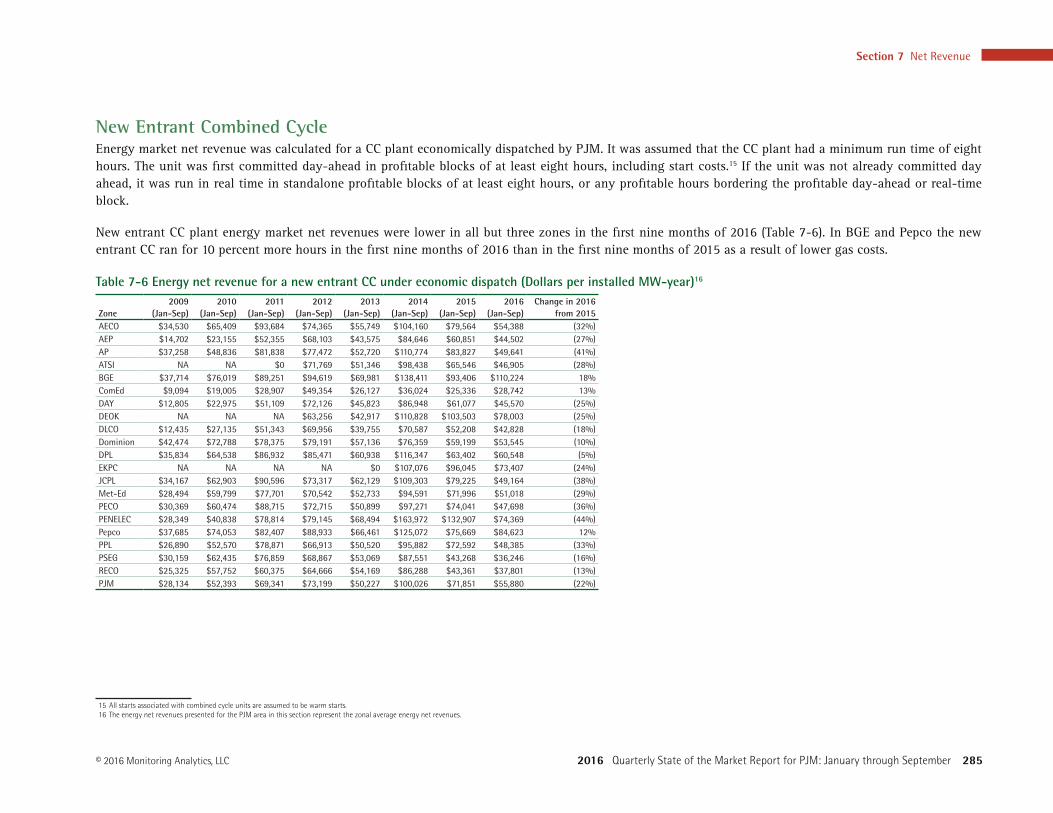
New Entrant Combined CycleEnergy market net revenue was calculated for a CC plant economically dispatched by PJM. It was assumed that the CC plant had a minimum run time of eight hours. The unit was first committed day-ahead in profitable blocks of at least eight hours, including start costs.15 If the unit was not already committed day ahead, it was run in real time in standalone profitable blocks of at least eight hours, or any profitable hours bordering the profitable day-ahead or real-time block.
New entrant CC plant energy market net revenues were lower in all but three zones in the first nine months of 2016 (Table 7-6). In BGE and Pepco the new entrant CC ran for 10 percent more hours in the first nine months of 2016 than in the first nine months of 2015 as a result of lower gas costs.
Table 7-6 Energy net revenue for a new entrant CC under economic dispatch (Dollars per installed MW-year)16
Zone2009
(Jan-Sep)2010
(Jan-Sep)2011
(Jan-Sep)2012
(Jan-Sep)2013
(Jan-Sep)2014
(Jan-Sep)2015
(Jan-Sep)2016
(Jan-Sep)Change in 2016
from 2015AECO $34,530 $65,409 $93,684 $74,365 $55,749 $104,160 $79,564 $54,388 (32%)AEP $14,702 $23,155 $52,355 $68,103 $43,575 $84,646 $60,851 $44,502 (27%)AP $37,258 $48,836 $81,838 $77,472 $52,720 $110,774 $83,827 $49,641 (41%)ATSI NA NA $0 $71,769 $51,346 $98,438 $65,546 $46,905 (28%)BGE $37,714 $76,019 $89,251 $94,619 $69,981 $138,411 $93,406 $110,224 18% ComEd $9,094 $19,005 $28,907 $49,354 $26,127 $36,024 $25,336 $28,742 13% DAY $12,805 $22,975 $51,109 $72,126 $45,823 $86,948 $61,077 $45,570 (25%)DEOK NA NA NA $63,256 $42,917 $110,828 $103,503 $78,003 (25%)DLCO $12,435 $27,135 $51,343 $69,956 $39,755 $70,587 $52,208 $42,828 (18%)Dominion $42,474 $72,788 $78,375 $79,191 $57,136 $76,359 $59,199 $53,545 (10%)DPL $35,834 $64,538 $86,932 $85,471 $60,938 $116,347 $63,402 $60,548 (5%)EKPC NA NA NA NA $0 $107,076 $96,045 $73,407 (24%)JCPL $34,167 $62,903 $90,596 $73,317 $62,129 $109,303 $79,225 $49,164 (38%)Met-Ed $28,494 $59,799 $77,701 $70,542 $52,733 $94,591 $71,996 $51,018 (29%)PECO $30,369 $60,474 $88,715 $72,715 $50,899 $97,271 $74,041 $47,698 (36%)PENELEC $28,349 $40,838 $78,814 $79,145 $68,494 $163,972 $132,907 $74,369 (44%)Pepco $37,685 $74,053 $82,407 $88,933 $66,461 $125,072 $75,669 $84,623 12% PPL $26,890 $52,570 $78,871 $66,913 $50,520 $95,882 $72,592 $48,385 (33%)PSEG $30,159 $62,435 $76,859 $68,867 $53,069 $87,551 $43,268 $36,246 (16%)RECO $25,325 $57,752 $60,375 $64,666 $54,169 $86,288 $43,361 $37,801 (13%)PJM $28,134 $52,393 $69,341 $73,199 $50,227 $100,026 $71,851 $55,880 (22%)
15 All starts associated with combined cycle units are assumed to be warm starts.16 The energy net revenues presented for the PJM area in this section represent the zonal average energy net revenues.
2016 Quarterly State of the Market Report for PJM: January through September
286 Section 7 Net Revenue © 2016 Monitoring Analytics, LLC
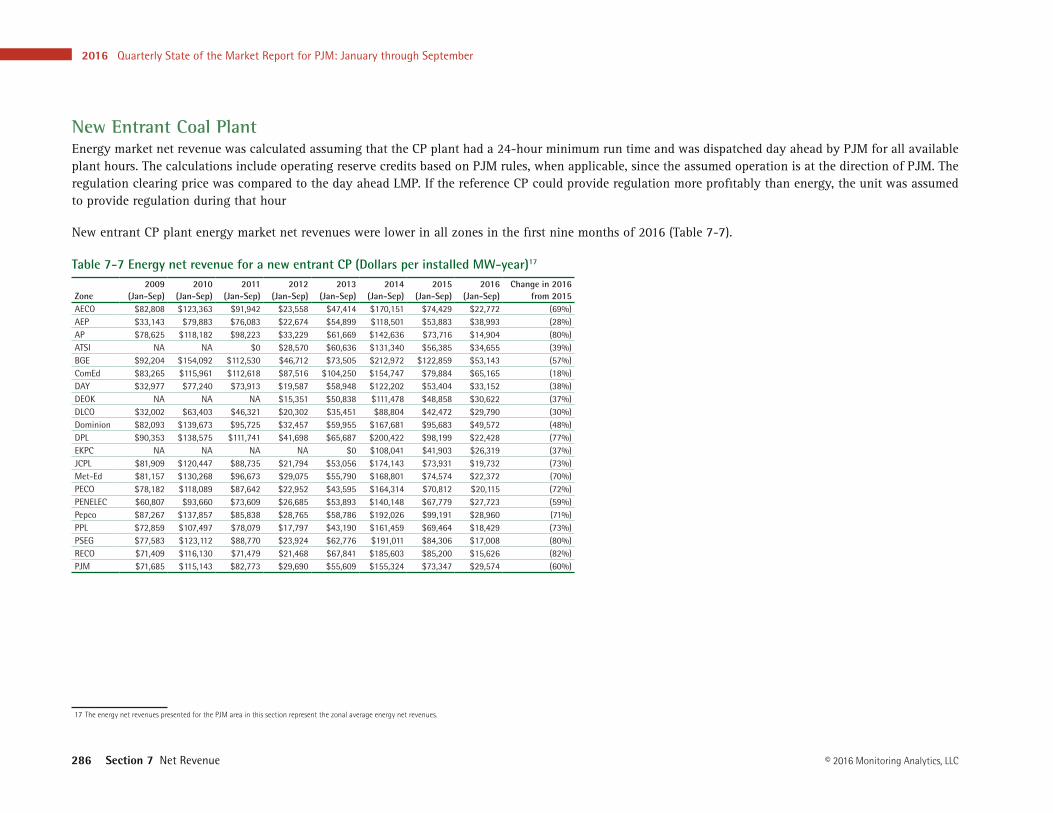
New Entrant Coal PlantEnergy market net revenue was calculated assuming that the CP plant had a 24-hour minimum run time and was dispatched day ahead by PJM for all available plant hours. The calculations include operating reserve credits based on PJM rules, when applicable, since the assumed operation is at the direction of PJM. The regulation clearing price was compared to the day ahead LMP. If the reference CP could provide regulation more profitably than energy, the unit was assumed to provide regulation during that hour
New entrant CP plant energy market net revenues were lower in all zones in the first nine months of 2016 (Table 7-7).
Table 7-7 Energy net revenue for a new entrant CP (Dollars per installed MW-year)17
Zone2009
(Jan-Sep)2010
(Jan-Sep)2011
(Jan-Sep)2012
(Jan-Sep)2013
(Jan-Sep)2014
(Jan-Sep)2015
(Jan-Sep)2016
(Jan-Sep)Change in 2016
from 2015AECO $82,808 $123,363 $91,942 $23,558 $47,414 $170,151 $74,429 $22,772 (69%)AEP $33,143 $79,883 $76,083 $22,674 $54,899 $118,501 $53,883 $38,993 (28%)AP $78,625 $118,182 $98,223 $33,229 $61,669 $142,636 $73,716 $14,904 (80%)ATSI NA NA $0 $28,570 $60,636 $131,340 $56,385 $34,655 (39%)BGE $92,204 $154,092 $112,530 $46,712 $73,505 $212,972 $122,859 $53,143 (57%)ComEd $83,265 $115,961 $112,618 $87,516 $104,250 $154,747 $79,884 $65,165 (18%)DAY $32,977 $77,240 $73,913 $19,587 $58,948 $122,202 $53,404 $33,152 (38%)DEOK NA NA NA $15,351 $50,838 $111,478 $48,858 $30,622 (37%)DLCO $32,002 $63,403 $46,321 $20,302 $35,451 $88,804 $42,472 $29,790 (30%)Dominion $82,093 $139,673 $95,725 $32,457 $59,955 $167,681 $95,683 $49,572 (48%)DPL $90,353 $138,575 $111,741 $41,698 $65,687 $200,422 $98,199 $22,428 (77%)EKPC NA NA NA NA $0 $108,041 $41,903 $26,319 (37%)JCPL $81,909 $120,447 $88,735 $21,794 $53,056 $174,143 $73,931 $19,732 (73%)Met-Ed $81,157 $130,268 $96,673 $29,075 $55,790 $168,801 $74,574 $22,372 (70%)PECO $78,182 $118,089 $87,642 $22,952 $43,595 $164,314 $70,812 $20,115 (72%)PENELEC $60,807 $93,660 $73,609 $26,685 $53,893 $140,148 $67,779 $27,723 (59%)Pepco $87,267 $137,857 $85,838 $28,765 $58,786 $192,026 $99,191 $28,960 (71%)PPL $72,859 $107,497 $78,079 $17,797 $43,190 $161,459 $69,464 $18,429 (73%)PSEG $77,583 $123,112 $88,770 $23,924 $62,776 $191,011 $84,306 $17,008 (80%)RECO $71,409 $116,130 $71,479 $21,468 $67,841 $185,603 $85,200 $15,626 (82%)PJM $71,685 $115,143 $82,773 $29,690 $55,609 $155,324 $73,347 $29,574 (60%)
17 The energy net revenues presented for the PJM area in this section represent the zonal average energy net revenues.
Section 7 Net Revenue
2016 Quarterly State of the Market Report for PJM: January through September 287© 2016 Monitoring Analytics, LLC
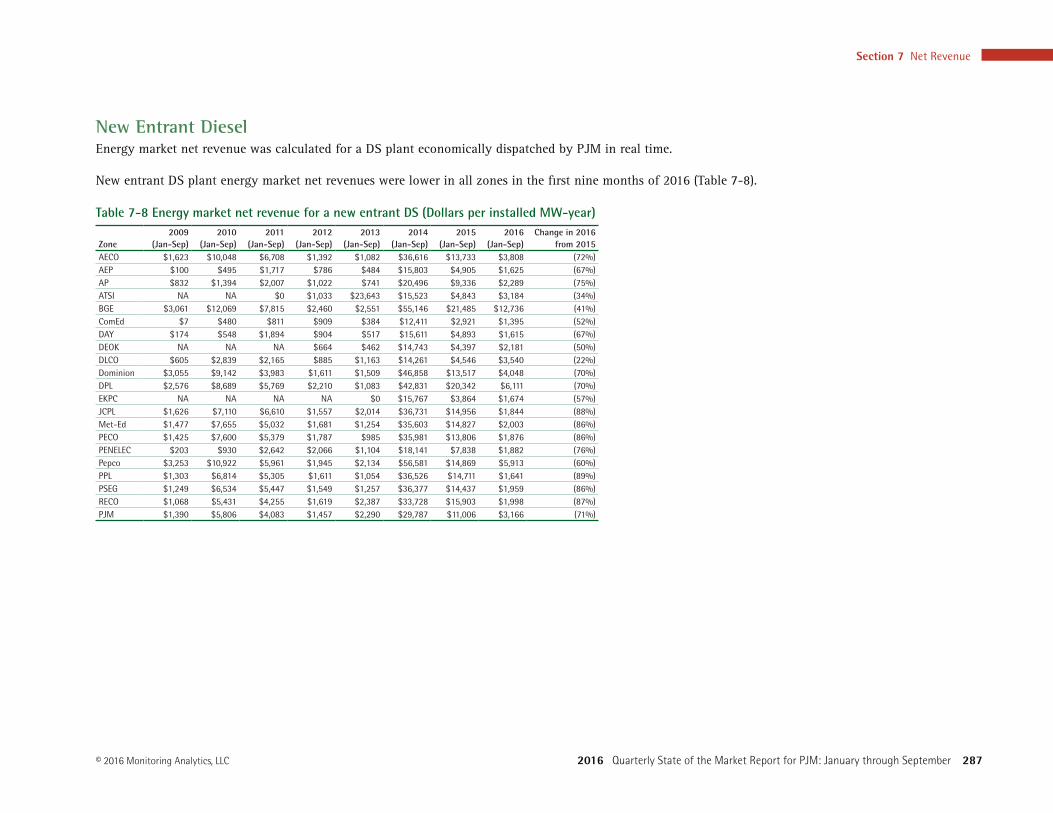
New Entrant DieselEnergy market net revenue was calculated for a DS plant economically dispatched by PJM in real time.
New entrant DS plant energy market net revenues were lower in all zones in the first nine months of 2016 (Table 7-8).
Table 7-8 Energy market net revenue for a new entrant DS (Dollars per installed MW-year)
Zone2009
(Jan-Sep)2010
(Jan-Sep)2011
(Jan-Sep)2012
(Jan-Sep)2013
(Jan-Sep)2014
(Jan-Sep)2015
(Jan-Sep)2016
(Jan-Sep)Change in 2016
from 2015AECO $1,623 $10,048 $6,708 $1,392 $1,082 $36,616 $13,733 $3,808 (72%)AEP $100 $495 $1,717 $786 $484 $15,803 $4,905 $1,625 (67%)AP $832 $1,394 $2,007 $1,022 $741 $20,496 $9,336 $2,289 (75%)ATSI NA NA $0 $1,033 $23,643 $15,523 $4,843 $3,184 (34%)BGE $3,061 $12,069 $7,815 $2,460 $2,551 $55,146 $21,485 $12,736 (41%)ComEd $7 $480 $811 $909 $384 $12,411 $2,921 $1,395 (52%)DAY $174 $548 $1,894 $904 $517 $15,611 $4,893 $1,615 (67%)DEOK NA NA NA $664 $462 $14,743 $4,397 $2,181 (50%)DLCO $605 $2,839 $2,165 $885 $1,163 $14,261 $4,546 $3,540 (22%)Dominion $3,055 $9,142 $3,983 $1,611 $1,509 $46,858 $13,517 $4,048 (70%)DPL $2,576 $8,689 $5,769 $2,210 $1,083 $42,831 $20,342 $6,111 (70%)EKPC NA NA NA NA $0 $15,767 $3,864 $1,674 (57%)JCPL $1,626 $7,110 $6,610 $1,557 $2,014 $36,731 $14,956 $1,844 (88%)Met-Ed $1,477 $7,655 $5,032 $1,681 $1,254 $35,603 $14,827 $2,003 (86%)PECO $1,425 $7,600 $5,379 $1,787 $985 $35,981 $13,806 $1,876 (86%)PENELEC $203 $930 $2,642 $2,066 $1,104 $18,141 $7,838 $1,882 (76%)Pepco $3,253 $10,922 $5,961 $1,945 $2,134 $56,581 $14,869 $5,913 (60%)PPL $1,303 $6,814 $5,305 $1,611 $1,054 $36,526 $14,711 $1,641 (89%)PSEG $1,249 $6,534 $5,447 $1,549 $1,257 $36,377 $14,437 $1,959 (86%)RECO $1,068 $5,431 $4,255 $1,619 $2,387 $33,728 $15,903 $1,998 (87%)PJM $1,390 $5,806 $4,083 $1,457 $2,290 $29,787 $11,006 $3,166 (71%)
2016 Quarterly State of the Market Report for PJM: January through September
288 Section 7 Net Revenue © 2016 Monitoring Analytics, LLC
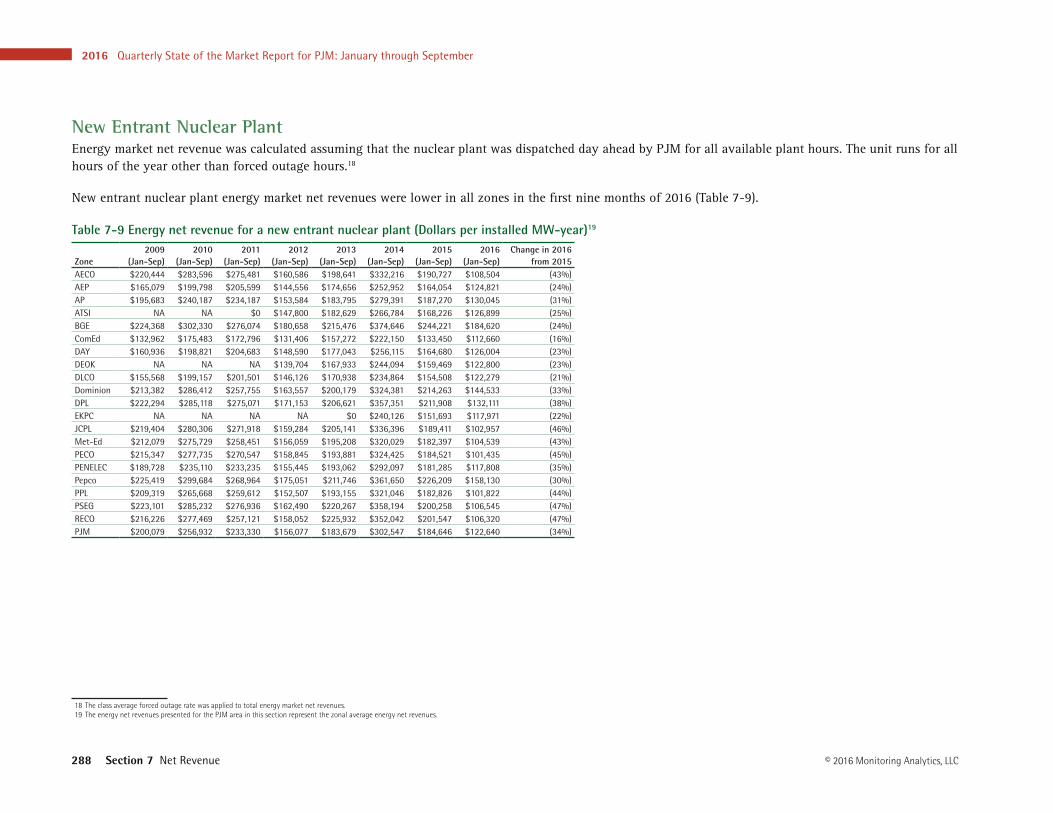
New Entrant Nuclear PlantEnergy market net revenue was calculated assuming that the nuclear plant was dispatched day ahead by PJM for all available plant hours. The unit runs for all hours of the year other than forced outage hours.18
New entrant nuclear plant energy market net revenues were lower in all zones in the first nine months of 2016 (Table 7-9).
Table 7-9 Energy net revenue for a new entrant nuclear plant (Dollars per installed MW-year)19
Zone2009
(Jan-Sep)2010
(Jan-Sep)2011
(Jan-Sep)2012
(Jan-Sep)2013
(Jan-Sep)2014
(Jan-Sep)2015
(Jan-Sep)2016
(Jan-Sep)Change in 2016
from 2015AECO $220,444 $283,596 $275,481 $160,586 $198,641 $332,216 $190,727 $108,504 (43%)AEP $165,079 $199,798 $205,599 $144,556 $174,656 $252,952 $164,054 $124,821 (24%)AP $195,683 $240,187 $234,187 $153,584 $183,795 $279,391 $187,270 $130,045 (31%)ATSI NA NA $0 $147,800 $182,629 $266,784 $168,226 $126,899 (25%)BGE $224,368 $302,330 $276,074 $180,658 $215,476 $374,646 $244,221 $184,620 (24%)ComEd $132,962 $175,483 $172,796 $131,406 $157,272 $222,150 $133,450 $112,660 (16%)DAY $160,936 $198,821 $204,683 $148,590 $177,043 $256,115 $164,680 $126,004 (23%)DEOK NA NA NA $139,704 $167,933 $244,094 $159,469 $122,800 (23%)DLCO $155,568 $199,157 $201,501 $146,126 $170,938 $234,864 $154,508 $122,279 (21%)Dominion $213,382 $286,412 $257,755 $163,557 $200,179 $324,381 $214,263 $144,533 (33%)DPL $222,294 $285,118 $275,071 $171,153 $206,621 $357,351 $211,908 $132,111 (38%)EKPC NA NA NA NA $0 $240,126 $151,693 $117,971 (22%)JCPL $219,404 $280,306 $271,918 $159,284 $205,141 $336,396 $189,411 $102,957 (46%)Met-Ed $212,079 $275,729 $258,451 $156,059 $195,208 $320,029 $182,397 $104,539 (43%)PECO $215,347 $277,735 $270,547 $158,845 $193,881 $324,425 $184,521 $101,435 (45%)PENELEC $189,728 $235,110 $233,235 $155,445 $193,062 $292,097 $181,285 $117,808 (35%)Pepco $225,419 $299,684 $268,964 $175,051 $211,746 $361,650 $226,209 $158,130 (30%)PPL $209,319 $265,668 $259,612 $152,507 $193,155 $321,046 $182,826 $101,822 (44%)PSEG $223,101 $285,232 $276,936 $162,490 $220,267 $358,194 $200,258 $106,545 (47%)RECO $216,226 $277,469 $257,121 $158,052 $225,932 $352,042 $201,547 $106,320 (47%)PJM $200,079 $256,932 $233,330 $156,077 $183,679 $302,547 $184,646 $122,640 (34%)
18 The class average forced outage rate was applied to total energy market net revenues.19 The energy net revenues presented for the PJM area in this section represent the zonal average energy net revenues.
Section 7 Net Revenue
2016 Quarterly State of the Market Report for PJM: January through September 289© 2016 Monitoring Analytics, LLC
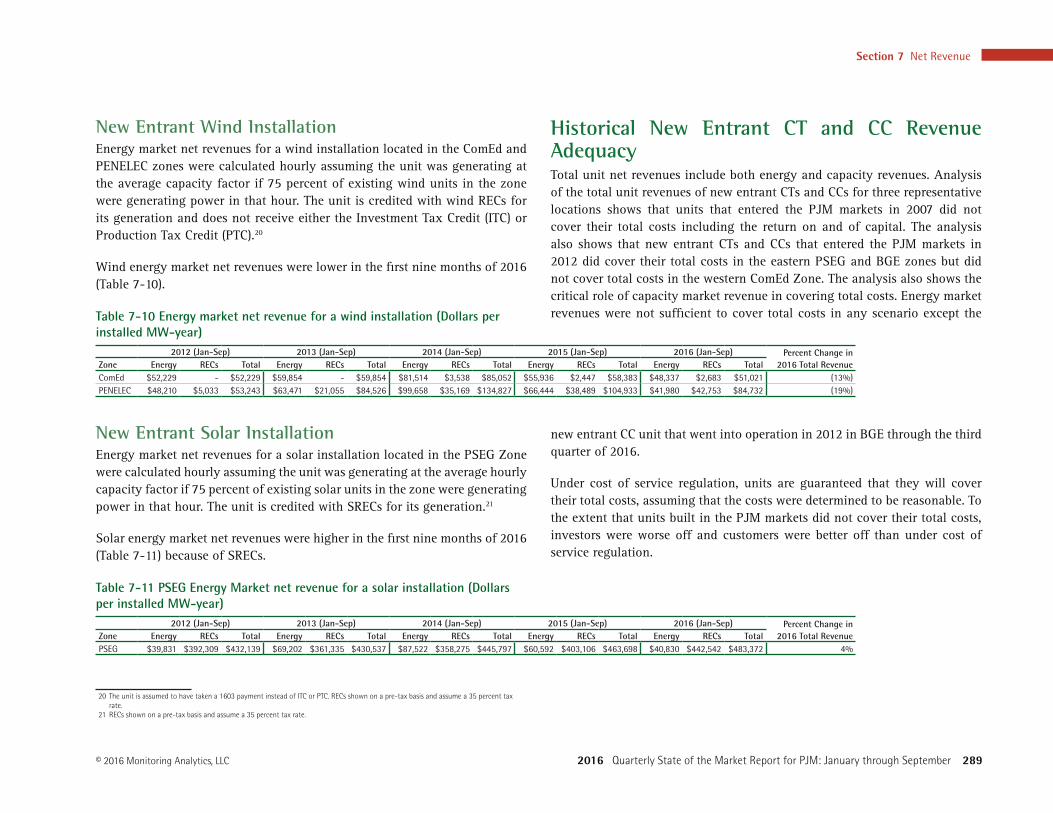
New Entrant Wind InstallationEnergy market net revenues for a wind installation located in the ComEd and PENELEC zones were calculated hourly assuming the unit was generating at the average capacity factor if 75 percent of existing wind units in the zone were generating power in that hour. The unit is credited with wind RECs for its generation and does not receive either the Investment Tax Credit (ITC) or Production Tax Credit (PTC).20
Wind energy market net revenues were lower in the first nine months of 2016 (Table 7-10).
Table 7-10 Energy market net revenue for a wind installation (Dollars per installed MW-year)
2012 (Jan-Sep) 2013 (Jan-Sep) 2014 (Jan-Sep) 2015 (Jan-Sep) 2016 (Jan-Sep) Percent Change in 2016 Total RevenueZone Energy RECs Total Energy RECs Total Energy RECs Total Energy RECs Total Energy RECs Total
ComEd $52,229 - $52,229 $59,854 - $59,854 $81,514 $3,538 $85,052 $55,936 $2,447 $58,383 $48,337 $2,683 $51,021 (13%)PENELEC $48,210 $5,033 $53,243 $63,471 $21,055 $84,526 $99,658 $35,169 $134,827 $66,444 $38,489 $104,933 $41,980 $42,753 $84,732 (19%)
New Entrant Solar InstallationEnergy market net revenues for a solar installation located in the PSEG Zone were calculated hourly assuming the unit was generating at the average hourly capacity factor if 75 percent of existing solar units in the zone were generating power in that hour. The unit is credited with SRECs for its generation.21
Solar energy market net revenues were higher in the first nine months of 2016 (Table 7-11) because of SRECs.
Table 7-11 PSEG Energy Market net revenue for a solar installation (Dollars per installed MW-year)
2012 (Jan-Sep) 2013 (Jan-Sep) 2014 (Jan-Sep) 2015 (Jan-Sep) 2016 (Jan-Sep) Percent Change in 2016 Total RevenueZone Energy RECs Total Energy RECs Total Energy RECs Total Energy RECs Total Energy RECs Total
PSEG $39,831 $392,309 $432,139 $69,202 $361,335 $430,537 $87,522 $358,275 $445,797 $60,592 $403,106 $463,698 $40,830 $442,542 $483,372 4%
20 The unit is assumed to have taken a 1603 payment instead of ITC or PTC. RECs shown on a pre-tax basis and assume a 35 percent tax rate.
21 RECs shown on a pre-tax basis and assume a 35 percent tax rate.
Historical New Entrant CT and CC Revenue AdequacyTotal unit net revenues include both energy and capacity revenues. Analysis of the total unit revenues of new entrant CTs and CCs for three representative locations shows that units that entered the PJM markets in 2007 did not cover their total costs including the return on and of capital. The analysis also shows that new entrant CTs and CCs that entered the PJM markets in 2012 did cover their total costs in the eastern PSEG and BGE zones but did not cover total costs in the western ComEd Zone. The analysis also shows the critical role of capacity market revenue in covering total costs. Energy market revenues were not sufficient to cover total costs in any scenario except the
new entrant CC unit that went into operation in 2012 in BGE through the third quarter of 2016.
Under cost of service regulation, units are guaranteed that they will cover their total costs, assuming that the costs were determined to be reasonable. To the extent that units built in the PJM markets did not cover their total costs, investors were worse off and customers were better off than under cost of service regulation.
2016 Quarterly State of the Market Report for PJM: January through September
290 Section 7 Net Revenue © 2016 Monitoring Analytics, LLC
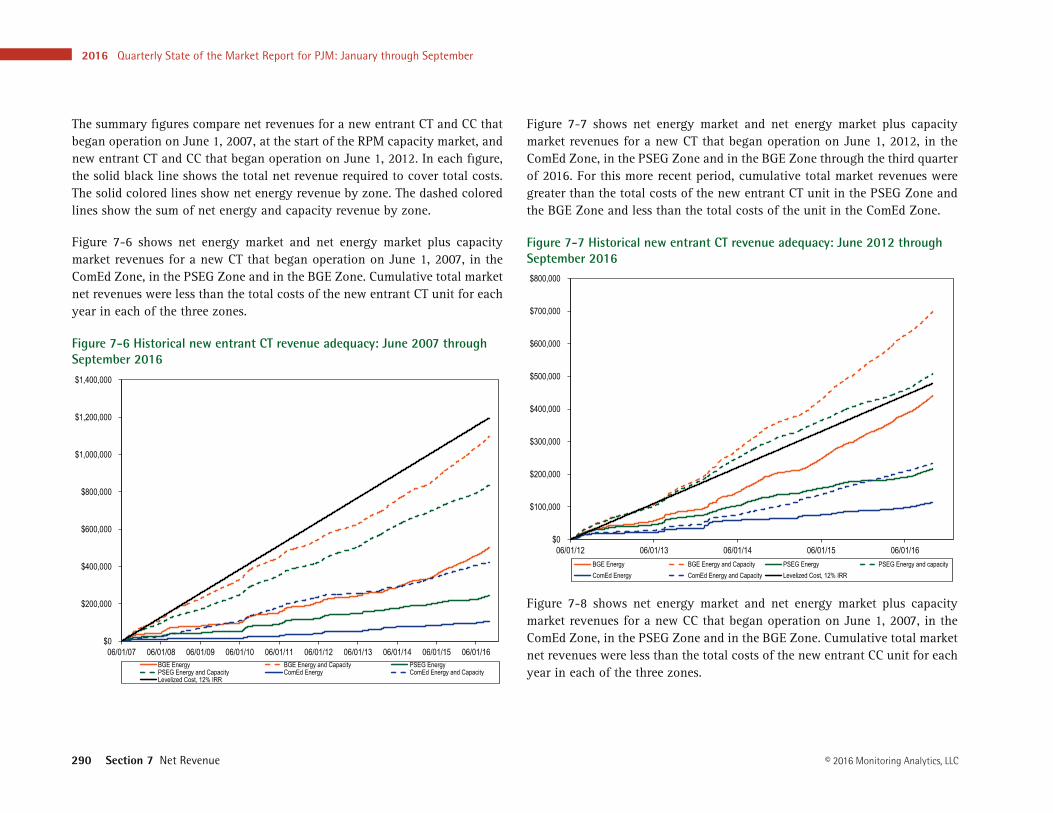
The summary figures compare net revenues for a new entrant CT and CC that began operation on June 1, 2007, at the start of the RPM capacity market, and new entrant CT and CC that began operation on June 1, 2012. In each figure, the solid black line shows the total net revenue required to cover total costs. The solid colored lines show net energy revenue by zone. The dashed colored lines show the sum of net energy and capacity revenue by zone.
Figure 7-6 shows net energy market and net energy market plus capacity market revenues for a new CT that began operation on June 1, 2007, in the ComEd Zone, in the PSEG Zone and in the BGE Zone. Cumulative total market net revenues were less than the total costs of the new entrant CT unit for each year in each of the three zones.
Figure 7-6 Historical new entrant CT revenue adequacy: June 2007 through September 2016
$0
$200,000
$400,000
$600,000
$800,000
$1,000,000
$1,200,000
$1,400,000
06/01/07 06/01/08 06/01/09 06/01/10 06/01/11 06/01/12 06/01/13 06/01/14 06/01/15 06/01/16BGE Energy BGE Energy and Capacity PSEG EnergyPSEG Energy and Capacity ComEd Energy ComEd Energy and CapacityLevelized Cost, 12% IRR
Figure 7-7 shows net energy market and net energy market plus capacity market revenues for a new CT that began operation on June 1, 2012, in the ComEd Zone, in the PSEG Zone and in the BGE Zone through the third quarter of 2016. For this more recent period, cumulative total market revenues were greater than the total costs of the new entrant CT unit in the PSEG Zone and the BGE Zone and less than the total costs of the unit in the ComEd Zone.
Figure 7-7 Historical new entrant CT revenue adequacy: June 2012 through September 2016
$0
$100,000
$200,000
$300,000
$400,000
$500,000
$600,000
$700,000
$800,000
06/01/12 06/01/13 06/01/14 06/01/15 06/01/16BGE Energy BGE Energy and Capacity PSEG Energy PSEG Energy and capacityComEd Energy ComEd Energy and Capacity Levelized Cost, 12% IRR
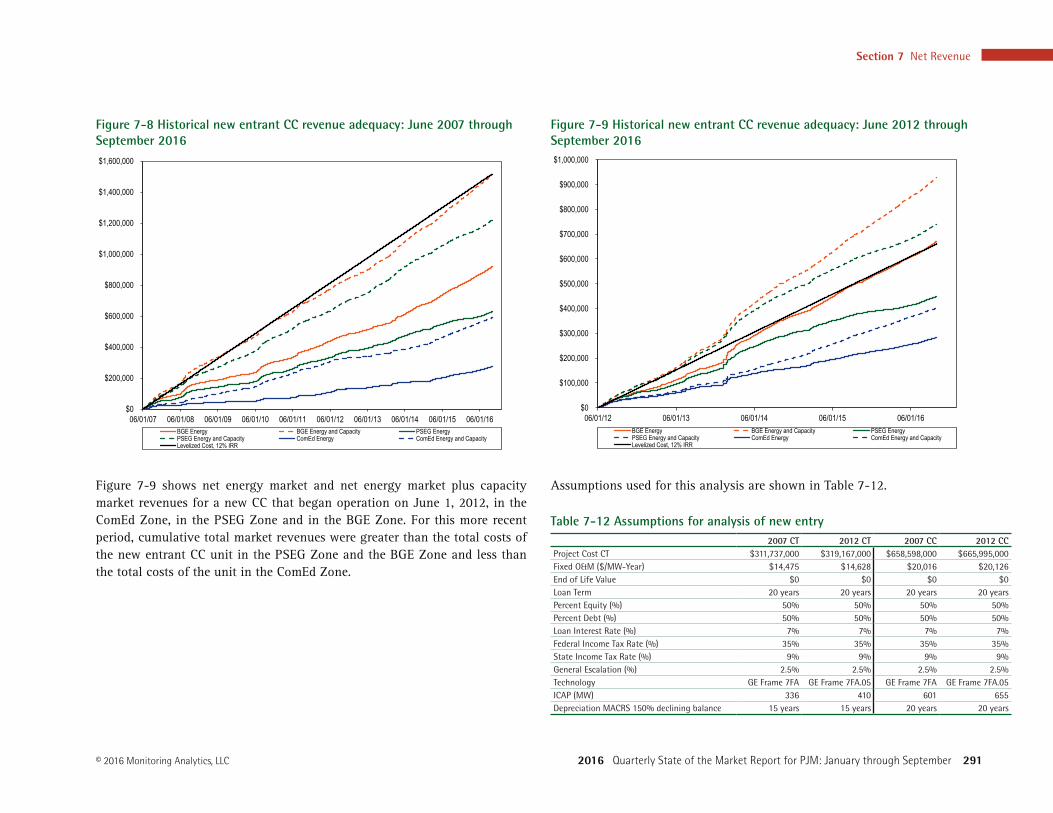
Figure 7-8 shows net energy market and net energy market plus capacity market revenues for a new CC that began operation on June 1, 2007, in the ComEd Zone, in the PSEG Zone and in the BGE Zone. Cumulative total market net revenues were less than the total costs of the new entrant CC unit for each year in each of the three zones.
Section 7 Net Revenue
2016 Quarterly State of the Market Report for PJM: January through September 291© 2016 Monitoring Analytics, LLC
Figure 7-8 Historical new entrant CC revenue adequacy: June 2007 through September 2016
$0
$200,000
$400,000
$600,000
$800,000
$1,000,000
$1,200,000
$1,400,000
$1,600,000
06/01/07 06/01/08 06/01/09 06/01/10 06/01/11 06/01/12 06/01/13 06/01/14 06/01/15 06/01/16BGE Energy BGE Energy and Capacity PSEG EnergyPSEG Energy and Capacity ComEd Energy ComEd Energy and CapacityLevelized Cost, 12% IRR
Figure 7-9 shows net energy market and net energy market plus capacity market revenues for a new CC that began operation on June 1, 2012, in the ComEd Zone, in the PSEG Zone and in the BGE Zone. For this more recent period, cumulative total market revenues were greater than the total costs of the new entrant CC unit in the PSEG Zone and the BGE Zone and less than the total costs of the unit in the ComEd Zone.
Figure 7-9 Historical new entrant CC revenue adequacy: June 2012 through September 2016
$0
$100,000
$200,000
$300,000
$400,000
$500,000
$600,000
$700,000
$800,000
$900,000
$1,000,000
06/01/12 06/01/13 06/01/14 06/01/15 06/01/16BGE Energy BGE Energy and Capacity PSEG EnergyPSEG Energy and Capacity ComEd Energy ComEd Energy and CapacityLevelized Cost, 12% IRR
Assumptions used for this analysis are shown in Table 7-12.
Table 7-12 Assumptions for analysis of new entry2007 CT 2012 CT 2007 CC 2012 CC
Project Cost CT $311,737,000 $319,167,000 $658,598,000 $665,995,000 Fixed O&M ($/MW-Year) $14,475 $14,628 $20,016 $20,126 End of Life Value $0 $0 $0 $0 Loan Term 20 years 20 years 20 years 20 yearsPercent Equity (%) 50% 50% 50% 50%Percent Debt (%) 50% 50% 50% 50%Loan Interest Rate (%) 7% 7% 7% 7%Federal Income Tax Rate (%) 35% 35% 35% 35%State Income Tax Rate (%) 9% 9% 9% 9%General Escalation (%) 2.5% 2.5% 2.5% 2.5%Technology GE Frame 7FA GE Frame 7FA.05 GE Frame 7FA GE Frame 7FA.05ICAP (MW) 336 410 601 655 Depreciation MACRS 150% declining balance 15 years 15 years 20 years 20 years

2016 Quarterly State of the Market Report for PJM: January through September
292 Section 7 Net Revenue © 2016 Monitoring Analytics, LLC