network operations report - 201103 - eurocontrol · monthly network operations report ... while the...
TRANSCRIPT

EUROCONTROL CFMU
Monthly Network Operations Report MARCH 2011
Amendment date: 08 April-2011 Version 1.0 1 Edited & produced by the CFMU/User Relations and Development Bureau
©2011 European Organisation for the Safety of Air Navigation (EUROCONTROL)
Monthly Network Operations Report Traffic & ATFM Delays
March 2011
HUhttp://www.cfmu.eurocontrol.int Edition No. : 1.0 Version Edition Issue date: 08th April 2011 Reporting Months : March 2011 Author : HWS/SMO Reference : File name : Network Operations Report Number of pages : 14

EUROCONTROL CFMU
Monthly Network Operations Report MARCH 2011
Amendment date: 08 April-2011 Version 1.0 2 Edited & produced by the CFMU/User Relations and Development Bureau
©2011 European Organisation for the Safety of Air Navigation (EUROCONTROL)
0BEXECUTIVE SUMMARY
• March experienced a small growth of traffic whereas ATFM delays have continued to decrease steadily for four months in a row.
• The traffic increased by 1.8% compared to the same month in 2010. However, events in Egypt and Tunisia
knocked about 180 and 25 flights/day off traffic (about 0.8 percentage points) which makes up the difference. (Japan's effect is about -15 flights/day). The current 2011 yearly traffic forecast is 4.3% including a 1.5% recovery of the ash crisis.
• Compared to March 2010, ATFM delays decreased by 25.3%, confirming the trend observed since
November. The average delay per flight was 0.9 minute.
• ATC delays accounted for half of all the Network delays. Most significant ATC delays were recorded in Spain (Madrid including Barajas, Canarias and Barcelona) Paris and Nicosia ACC’s mainly due to structural ATC Capacity (Lack of staff, sectors structure).
• Delays in Langen were due to the continuing staff shortage and the implementation of new airspace
structure. While the VAFORIT implementation was formally completed end of February, Rhein continued to experience delays due to the capacity
• Munich ACC started the implementation of the Paperless Strip System at week-ends.
• Frankfurt delays are due to a mix of bad weather conditions and aerodrome capacity.
• Weather conditions were generally good. However, wind and low visibility affected Gran Canaria,
Oslo, London airports and Amsterdam • Istanbul continues to experience delays due to Aerodrome Capacity.
• Situation in Libya had very limited impact on ATFM delays. However, the route structure in the surrounding
area (mainly Malta ACC) was modified to take on board the closure of the airspace and the military activity.
• Average en-route delay since the beginning of the year is 0.51 minutes per flight. The likelihood of achieving 0.7 minutes en-route delay at the end of the year is very low.
• ATFM slot adherence, the percentage of late departure decreased significantly compared to the previous
months.

EUROCONTROL CFMU
Monthly Network Operations Report MARCH 2011
Amendment date: 08 April-2011 Version 1.0 3 Edited & produced by the CFMU/User Relations and Development Bureau
©2011 European Organisation for the Safety of Air Navigation (EUROCONTROL)
1. 1BTRAFFIC ANALYSIS -TOTAL FLIGHTS Last 13 Months of the Average Daily Traffic
2521
8
2322
9
2751
9
2972
1
2987
7
2951
9
2977
5
2791
1
2501
2
2222
3
2329
7
2440
3
2568
4
16000
18000
20000
22000
24000
26000
28000
30000
MA
R
APR
MA
Y
JUN
JUL
AUG
SEP
OC
T
NO
V
DEC JA
N
FEB
MA
R
Monthly Traffic Trend
1.7%1.7%
5.3%
3.3%
-0.8%
3.8%3.4%
-10.7%
2.0%3.2% 2.9% 3.2% 2.4%
1.8%
-4.6%
-12.0%-10.0%-8.0%
-6.0%-4.0%-2.0%0.0%
2.0%4.0%6.0%
MAR
APR
MAY
JUN
JUL
AUG
SEP
OC
T
NO
V
DE
C
JAN
FEB
MAR
Average Daily Traffic for Last 5 Years
20000
22000
24000
26000
28000
30000
32000
JAN
FEB
MAR
APR
MAY
JUN
JUL
AU
G
SEP
OC
T
NO
V
DEC
2007 2008 2009 2010 2011 12 Months Traffic Trend
-2.9%-2.0%
-1.2%-0.3%
0.6% 0.8% 0.8%
1.4%
-4.6%-4.7%-3.9%
1.7%1.7%
-8.0%
-6.0%
-4.0%
-2.0%
0.0%
2.0%
MA
R
APR
MA
Y
JUN
JUL
AU
G
SEP
OC
T
NO
V
DEC JA
N
FEB
MA
R
Traffic increased 1.8% compared to the same month in 2010. However, events in Egypt and Tunisia knocked about 180 and 25 flights/day off traffic (about 0.8 percentage points) which makes up the difference. (Japan's effect is about -15 flights/day). March 2011 traffic was 5.3% higher than February 2011. The average daily traffic is above the level experienced in 2009 and 2010, but remains below the 2007/2008 levels. 1.7% is below the low forecast for March; traffic did grow more slowly than expected.

EUROCONTROL CFMU
Monthly Network Operations Report MARCH 2011
Amendment date: 08 April-2011 Version 1.0 4 Edited & produced by the CFMU/User Relations and Development Bureau
©2011 European Organisation for the Safety of Air Navigation (EUROCONTROL)
Ukraine and Turkey continued to experience the most significant increase in traffic. The most significant decrease of traffic was registered in Athens (-18.4%), London Stansted (-6.9%) and Palma de Mallorca (-6%). Both scheduled and low cost carriers continue to experience an increase in traffic: RYR (8.1%), EZY (12.1%), DLH (3.1%), and AFR (0.3%). The biggest increase was experienced by Pegasus Airlines (34.1%) and Cimber Air (22.6%). Aegean Airlines (-18.5%), Czech Airlines (-21.8%), Olympic Airlines (-22.4%) and BMI (-33.1%) experienced a significant decrease in traffic. Unidentified operators (mainly General Aviation) recorded a decrease of 6% in March.
2. ATFM DELAYS & REPARTITION

EUROCONTROL CFMU
Monthly Network Operations Report MARCH 2011
Amendment date: 08 April-2011 Version 1.0 5 Edited & produced by the CFMU/User Relations and Development Bureau
©2011 European Organisation for the Safety of Air Navigation (EUROCONTROL)
Average Daily ATFM Delays75
331 1060
82
1588
91
9704
8
1006
27
8062
7
4282
9 7688
6
2795
1
2933
3
2437
7
3120
0
3261
5
020000400006000080000
100000120000140000160000180000
MA
R
APR
MA
Y
JUN
JUL
AUG
SEP
OC
T
NO
V
DE
C
JAN
FEB
MA
R
A IRPORT ATC M ETEO OTHER Monthly ATFM Delays Trend
- 18 .3 %
52 .2 %
101.3%
135.8%
75.2%
128.8%
38.2%
47.0%
10.4%
48.8%
-39.5%-50.4%
-25.3%
95.0%92.9%
-60.0%-40.0%-20.0%
0.0%20.0%40.0%60.0%80.0%
100.0%120.0%140.0%
MAR
APR
MAY
JUN
JUL
AUG
SEP
OC
T
NO
V
DE
C
JAN
FEB
MAR
Average Daily ATFM Delay Repartition
4514 4301
16349
12247
72055541
45452287
13.8% 17.6%50.1% 50.2%22.1% 22.7% 9.4%13.9%0
5000
10000
15000
20000
201003 201103
AIRPORT ATC M ETEO OTHER Monthly Average Delay (min) per flight
Last 13 Months = 2.5 minutes
1.3
1.3
2.7
3.6
5.3
3.3
3.4
2.9
1.7
3.5
1.2
1.2
0.9
0.0
1.0
2.0
3.0
4.0
5.0
6.0
MAR
APR
MAY
JUN
JUL
AUG
SEP
OC
T
NO
V
DEC JA
N
FEB
MAR
All delays graph figures are represented as average minutes per day.
The average daily ATFM delays decreased from 32615 minutes in March 2010 to 24377 minutes in March 2011. March experienced a 25.3% decrease in delay compared to March 2010. The trend of ATFM delay shows a regular decrease since October last year. ATC delays remain the main reason for ATFM delays in March, accounting for 50.2% of all the Network delays. The average ATFM delay per all flight was 0.9 minutes.

EUROCONTROL CFMU
Monthly Network Operations Report MARCH 2011
Amendment date: 08 April-2011 Version 1.0 6 Edited & produced by the CFMU/User Relations and Development Bureau
©2011 European Organisation for the Safety of Air Navigation (EUROCONTROL)
1.1. ATC Delay
Top 20 Ref Loc for ATC Delays in March 2011
100145146152153178211223249265356393631643
92710331111
1554
1977
775
0.0%
3.0%
6.0%
9.0%
12.0%
15.0%
18.0%
MAD
RID
ALL
AC
C
CAN
ARIA
S AC
C/F
IC
PAR
IS A
LL A
CC
LAN
GEN
AC
C
RH
EIN
UAC
NIC
OSI
A AC
C
MAD
RID
/BAR
AJAS
BAR
CEL
ON
A AC
C
WAR
SZAW
A_AC
C
AMST
ERD
AM/S
CH
IPH
OL
STO
CKH
OLM
AC
C
MAA
STR
ICH
T U
AC
BRES
T U
/AC
C
MAR
SEIL
LE A
CC
GEN
EVA
ACC
PAR
IS-C
HAR
LES
DE
GAU
LLE
ZUR
ICH
_FLU
GH
AFEN
GEN
EVE
BREM
EN A
CC
REI
MS
U/A
CC
IND ACTION (ATC) ATC EQUIPM ENT ATC STAFFING ATC CAPACITY
.
EUROCONTROL CFMU
Monthly Network Operations Report MARCH 2011
Amendment date: 08 April-2011 Version 1.0 7 Edited & produced by the CFMU/User Relations and Development Bureau
©2011 European Organisation for the Safety of Air Navigation (EUROCONTROL)
Reasons for ATC Delays in March 2011
39.7%
8.5%
2.1%
0.0% 10.0% 20.0% 30.0% 40.0% 50.0%
ATC CAPACITY
ATC STAFFING
EQUIPM ENT(ATC)
Top 10 Ref Loc for ATC Capacity in March 2011
2683503563945786197181111
15401847
0.0%
5.0%
10.0%
15.0%
20.0%
MAD
RID
ALL
AC
C
CAN
ARIA
S_AC
C/F
IC
PAR
IS A
LL A
CC
NIC
OSI
A AC
C
BAR
CEL
ON
A AC
C
MAD
RID
/BAR
AJAS
LAN
GEN
AC
C
AMST
ERD
AM/S
CH
IPH
OL RH
EIN
UAC
WAR
SZAW
A AC
C
AirportEn Route
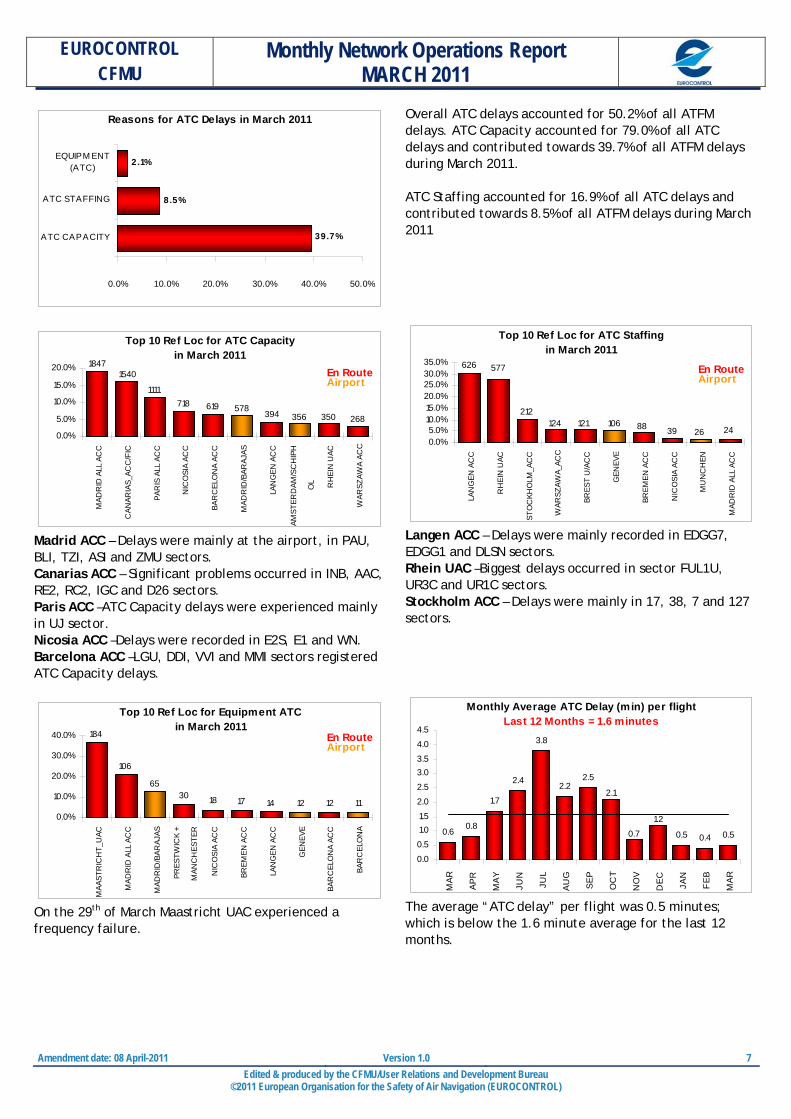
Madrid ACC – Delays were mainly at the airport, in PAU, BLI, TZI, ASI and ZMU sectors. Canarias ACC – Significant problems occurred in INB, AAC, RE2, RC2, IGC and D26 sectors. Paris ACC –ATC Capacity delays were experienced mainly in UJ sector. Nicosia ACC –Delays were recorded in E2S, E1 and WN. Barcelona ACC –LGU, DDI, VVI and MMI sectors registered ATC Capacity delays.
Top 10 Ref Loc for Equipment ATC in March 2011
1112121417183065
106
184
0.0%
10.0%
20.0%
30.0%
40.0%
MAA
STR
ICH
T_U
AC
MAD
RID
ALL
AC
C
MAD
RID
/BAR
AJAS
PRES
TWIC
K +
MAN
CH
ESTE
R
NIC
OSI
A AC
C
BREM
EN A
CC
LAN
GEN
AC
C
GEN
EVE
BAR
CEL
ON
A AC
C
BAR
CEL
ON
A
AirportEn Route
On the 29th of March Maastricht UAC experienced a frequency failure.
Overall ATC delays accounted for 50.2% of all ATFM delays. ATC Capacity accounted for 79.0% of all ATC delays and contributed towards 39.7% of all ATFM delays during March 2011. ATC Staffing accounted for 16.9% of all ATC delays and contributed towards 8.5% of all ATFM delays during March 2011
Top 10 Ref Loc for ATC Staffing in March 2011
24263988106121124212
577626
0.0%5.0%
10.0%15.0%20.0%25.0%30.0%35.0%
LAN
GEN
AC
C
RH
EIN
UAC
STO
CKH
OLM
_AC
C
WAR
SZAW
A_AC
C
BRES
T U
/AC
C
GEN
EVE
BREM
EN A
CC
NIC
OSI
A AC
C
MU
NC
HEN
MAD
RID
ALL
AC
C
AirportEn Route
Langen ACC – Delays were mainly recorded in EDGG7, EDGG1 and DLSN sectors. Rhein UAC –Biggest delays occurred in sector FUL1U, UR3C and UR1C sectors. Stockholm ACC – Delays were mainly in 17, 38, 7 and 127 sectors.
Monthly Average ATC Delay (min) per flightLast 12 Months = 1.6 minutes
0.6 0.8
1.7
2.4 2.5
0.4 0.5
2.1
1.2
0.7
2.2
3.8
0.5
0.0
0.5
1.01.5
2.0
2.5
3.03.5
4.0
4.5
MAR
APR
MAY
JUN
JUL
AUG
SEP
OC
T
NO
V
DEC JA
N
FEB
MAR
The average “ATC delay” per flight was 0.5 minutes; which is below the 1.6 minute average for the last 12 months.
EUROCONTROL CFMU
Monthly Network Operations Report MARCH 2011
Amendment date: 08 April-2011 Version 1.0 8 Edited & produced by the CFMU/User Relations and Development Bureau
©2011 European Organisation for the Safety of Air Navigation (EUROCONTROL)
1.2. 7BMeteo Delays
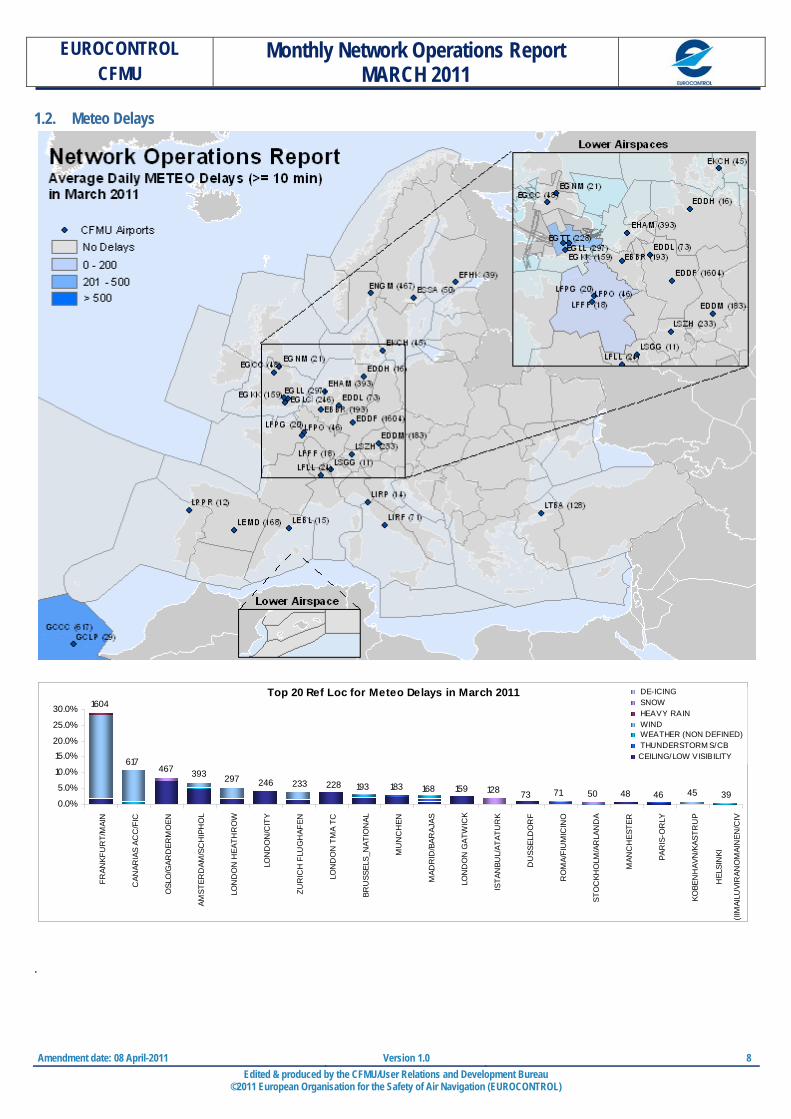
Top 20 Ref Loc for Meteo Delays in March 20111604
617467 393 297 246 233 228 193 183 168 159 128 73 71 50 48 46 45 39
0.0%
5.0%
10.0%
15.0%20.0%
25.0%
30.0%
FRAN
KFU
RT/
MAI
N
CAN
ARIA
S AC
C/F
IC
OSL
O/G
ARD
ERM
OEN
AMST
ERD
AM/S
CH
IPH
OL
LON
DO
N H
EATH
RO
W
LON
DO
N/C
ITY
ZUR
ICH
FLU
GH
AFEN
LON
DO
N T
MA
TC
BRU
SSEL
S_N
ATIO
NAL
MU
NC
HEN
MAD
RID
/BAR
AJAS
LON
DO
N G
ATW
ICK
ISTA
NBU
L/AT
ATU
RK
DU
SSEL
DO
RF
RO
MA/
FIU
MIC
INO
STO
CKH
OLM
/AR
LAN
DA
MAN
CH
ESTE
R
PAR
IS-O
RLY
KOBE
NH
AVN
/KAS
TRU
P
HEL
SIN
KI
(IIM
AILU
VIR
ANO
MAI
NEN
/CIV
DE-ICING SNOW HEAVY RAIN WIND WEATHER (NON DEFINED) THUNDERSTORM S/CBCEILING/LOW VISIBILITY
.

EUROCONTROL CFMU
Monthly Network Operations Report MARCH 2011
Amendment date: 08 April-2011 Version 1.0 9 Edited & produced by the CFMU/User Relations and Development Bureau
©2011 European Organisation for the Safety of Air Navigation (EUROCONTROL)
Reasons for Meteo Delays in March 2011
10.7%
8.9%
1.1%
1.0%
0.9%
0.1%
0.0% 10.0% 20.0% 30.0% 40.0% 50.0%
WIND
CEILING/LOWVISIBILITY
WEATHER(NON_DEFINED)
THUNDERSTORM S/CB
SNOW
HEAVY RAIN
Meteo delays accounted for 22.7% of all ATFM delays. Within the Meteo delays, Wind makes up 47.1% of this and contributes to 10.7% of all delays for March 2011
Top 10 Ref Loc for Wind in March 2011
1466
571
185 143 94 45 26 21 18 150.0%
10.0%20.0%30.0%40.0%50.0%60.0%
FRAN
KFU
RT/
MAI
N
CAN
ARIA
S AC
C/F
IC
LON
DO
N H
EATH
RO
W
ZUR
ICH
_FLU
GH
AFEN
AMST
ERD
AM/S
CH
IPH
OL
KOBE
NH
AVN
/KAS
TRU
P
RO
MA/
FIU
MIC
INO
BRU
SSEL
S N
ATIO
NAL
HEL
SIN
KI
(IIM
AILU
VIR
ANO
MAI
N
MU
NC
HEN
Frankfurt – 7 days were regulated due to Wind in March. Canarias – 5 days were registered with Wind in March.
Top 10 Ref Loc for Ceiling/Low Visibility in March 2011
79103112129132153228246282
412
0.0%
10.0%
20.0%
OSL
O/G
ARD
ERM
OEN
AMST
ERD
AM
SCH
IPH
OL
LON
DO
N/C
ITY
LON
DO
N T
MA
TC
LON
DO
N G
ATW
ICK
MU
NC
HEN
BRU
SSEL
S N
ATIO
NAL
LON
DO
N_H
EATH
RO
W
FRAN
KFU
RT/
MAI
N
ZUR
ICH
_FLU
GH
AFEN
Oslo – 4 days were recorded with low visibility andceiling in March. Amsterdam – 5 days were registered with low visibility in March.
Proportion of Meteo delays in March 2011
WEATHER (NON_DEFINED)
4.7%
THUNDER STORM S/CB
4.4%
HEAVY RAIN0.6%
SNOW4.1%
WIND47.1%
CEILING/LOW VISIBILITY
39.0%

EUROCONTROL CFMU
Monthly Network Operations Report MARCH 2011
Amendment date: 08 April-2011 Version 1.0 10 Edited & produced by the CFMU/User Relations and Development Bureau
©2011 European Organisation for the Safety of Air Navigation (EUROCONTROL)
1.3. 8BAirport Delays
Reasons for Airport Delays in March 2011
12.8%
2.6%
1.4%
0.4%
0.2%
0.1%
0.1%
0.0% 10.0% 20.0% 30.0% 40.0% 50.0%
AD CAPACITY
RUNWAY CONFIG
ACCIDENT/INCIDENT
WORK IN PROGRESS
EQUIP. (NON-ATC)
GROUND OPS ISSUE
ENVIRON. ISSUES
Airport delays accounted for 17.6% of all ATFM delays. Within the Airport delays, Aerodrome Capacity makes up 72.4% of all Airport Delays and accounts for 12.8% of all delays during March 2011.
Top 10 Ref Loc for Airport Delays in March 2011
114148168181213230253
867
1353
182
0.0%5.0%
10.0%15.0%20.0%25.0%30.0%35.0%
FRAN
KFU
RT/
MAI
N
ISTA
NBU
L/AT
ATU
RK
WIE
N-S
CH
WEC
HAT
MAD
RID
/BAR
AJAS
ISTA
NBU
L/SA
BIH
A
GO
KCEN
LON
DO
N/C
ITY
GR
AN C
ANAR
IA
BRU
SSEL
S_N
ATIO
NAL
OSL
O/G
ARD
ERM
OEN
LON
DO
N H
EATH
RO
W
WORK IN PROGRESS ACCIDENT/INCIDENT RUNWAY CONFIG AD CAPACITY
In March significant delays were recorded: EDDF (Frankfurt) experienced Aerodrome Capacity delays and on the 2nd of March Frankfurt experienced Runway constraints due to the Runway configuration. LTBA (Istanbul) experienced delays throughout the whole month. However the situation still continues to improve significantly compared to the previous months.

EUROCONTROL CFMU
Monthly Network Operations Report MARCH 2011
Amendment date: 08 April-2011 Version 1.0 11 Edited & produced by the CFMU/User Relations and Development Bureau
©2011 European Organisation for the Safety of Air Navigation (EUROCONTROL)
1.4. Other Delays
Reasons for Other Delays in March 2011
5.1%
3.4%
0.6%
0.2%
0.0% 10.0% 20.0% 30.0% 40.0% 50.0%
ATC ROUTEING
SPECIAL EVENT
AIRSPACEM ANAGEM ENT
OTHER
Other delays accounted for 9.4% of all ATFM delays. Within the Other delays, ATC Routeing makes up 54.2% of all Other Delays and accounts for 5.1% of all delays during March 2011.
Top 10 Ref Loc for Other Delays in March 2011
303745505682121168
609
1037
0.0%
10.0%
20.0%
30.0%
40.0%
50.0%
LAN
GEN
AC
C
MU
NC
HEN
AC
C
PRES
TWIC
K +
MAN
CH
ESTE
R A
CC
CAN
NES
-
MAN
DEL
IEU
FRAN
KFU
RT/
MAI
N
CO
PEN
HAG
EN_A
CC
OSL
O/G
ARD
ERM
OEN
REI
MS
U/A
CC
RH
EIN
UAC
GEN
EVE
OTHER ATC ROUTING AIRSPACE M ANAGEM ENT SPECIAL EVENTS
Significant “Other” delays were recorded in March. Langen ACC experienced delays due to the new Airspace Structure in the ACC West. Munich ACC experienced delays due to the Paperless Strip System implementation.

EUROCONTROL CFMU
Monthly Network Operations Report MARCH 2011
Amendment date: 08 April-2011 Version 1.0 12 Edited & produced by the CFMU/User Relations and Development Bureau
©2011 European Organisation for the Safety of Air Navigation (EUROCONTROL)
2. 3BATFM REGULATION IMPACT Top 20 ATFM Delay Locations in March 2011
198120822196
3046
775831965100910411129670 660 631 433 428 414 393 362 265 259
0.0%
5.0%
10.0%
15.0%
FRAN
KFU
RT/
MAI
N
CAN
ARIA
S AC
C/F
IC
LAN
GEN
AC
C
MAD
RID
ALL
AC
C
PAR
IS A
LL A
CC
MAD
RID
/BAR
AJAS
ISTA
NBU
L/AT
ATU
RK
RH
EIN
UAC
AMST
ERD
AM/S
CH
IPH
OL
NIC
OSI
A AC
C
OSL
O/G
ARD
ERM
OEN
MU
NC
HEN
AC
C
BAR
CEL
ON
A AC
C
LON
DO
N_H
EATH
RO
W
LON
DO
N/C
ITY
ZUR
ICH
FLU
GH
AFEN
WAR
SZAW
A AC
C
BRU
SSEL
S N
ATIO
NAL
STO
CKH
OLM
AC
C
LON
DO
N T
MA
TC
OTHER M ETEO AIRPORT ATC
Main delays were recorded in Frankfurt due to weather (Wind) and airport capacity. ATC Delays were recorded in Madrid, Canarias, Paris, Langen, Rhein, Nicosia, Madrid Barajas and Barcelona. Significant “Other” delays were experienced in Langen due to the New Airspace Structure in the ACC West and in Munich due to the Paperless Strip System implementation. Canarias, Oslo, Amsterdam and London Heathrow/City experienced delays due to bad weather conditions. Frankfurt and Istanbul caused significant delays due to Aerodrome capacity.
2.1. 10BAverage ATFM Delays per flight
Average Delay (min) per flight in March 2011
0.0
0.5
1.0
1.5
2.0
2.5
01 03 05 07 09 11 13 15 17 19 21 23 25 27 29 31
ATC AIRPORT M ETEO OTHER
Top 10 Ref Loc Average Delays per Regulated Flight in March 2011
20262626 1923 22283455
242
43242 32 43 145 3004 958 5034163
0102030405060
LON
DO
N/C
ITY
MAN
CH
ESTE
R
MAR
SEIL
LE A
CC
SIO
N
PISA
/S. G
IUST
O
(MIL
)C
ANN
ES-
MAN
DEL
IEU
CAN
ARIA
S AC
C/F
IC
OSL
O/G
ARD
ERM
OE
N
MAD
RID
/TO
RR
EJO
N
FRAN
KFU
RT/
MAI
N
A IRPORT ATC M ETEO OTHER
In March 2011, no day experienced an average delay per flight at or above 2 minutes. Wednesday 16th March: Bad weather condition was the main reason for delays particularly in Frankfurt and London. ATC Capacity delays were registered in Madrid, Cyprus and Barcelona. Langen recorded significant delays due to ATC Staffing and to the New Airspace Structure (ATC Routeings). Saturday 12th March: ATC Capacity was the main cause for delays in Madrid, Canarias, Marseille and Paris. Canarias recorded significant delays due to Runway configuration due to wind. Munich experienced delays due to the Paperless Strip System implementation. Sunday 13th March: Canarias registered significant delays due to Wind. ATC Capacity delays occurred in Madrid, Paris and Canarias. The implementation of the Paperless Strip System caused significant delays in Munich. LONDON/CITY had the highest impact on local traffic demand with an average of 55 minutes ATFM delay per flight for 242 flights. It was due to weather and one event involving terminal evacuation.
EUROCONTROL CFMU
Monthly Network Operations Report MARCH 2011
Amendment date: 08 April-2011 Version 1.0 13 Edited & produced by the CFMU/User Relations and Development Bureau
©2011 European Organisation for the Safety of Air Navigation (EUROCONTROL)
3. 4BIMPACT ON FLIGHTS Average Daily Flights > 30 Minutes Delay
170262 199
775
249
710
989
225383
762892874
1705
0200400600800
10001200140016001800
MA
R
APR
MA
Y
JUN
JUL
AU
G
SEP
OC
T
NO
V
DEC JA
N
FEB
MA
R
A IRPORT ATC M ETEO OTHER Average En-Route Daily Flights > 15 Min Delay
347501 561
902
302
1382
2258
352470
14941852
2200
3418
0500
1000150020002500300035004000
MA
R
APR
MA
Y
JUN
JUL
AU
G
SEP
OC
T
NO
V
DEC JA
N
FEB
MA
R
A IRPORT ATC M ETEO OTHER Cumulative YTD En-Route Daily Flights > 15 Min Dly
0200
400600800
100012001400
1600
JAN
FEB
MAR
APR
MAY
JUN
JUL
AUG
SEP
OC
T
NO
V
DE
C
2010 2011 En Route - Situation and YTD 2011
(target : 0.7)
0.200.300.400.500.600.700.800.90
P100 P50 P0 YTD 2011
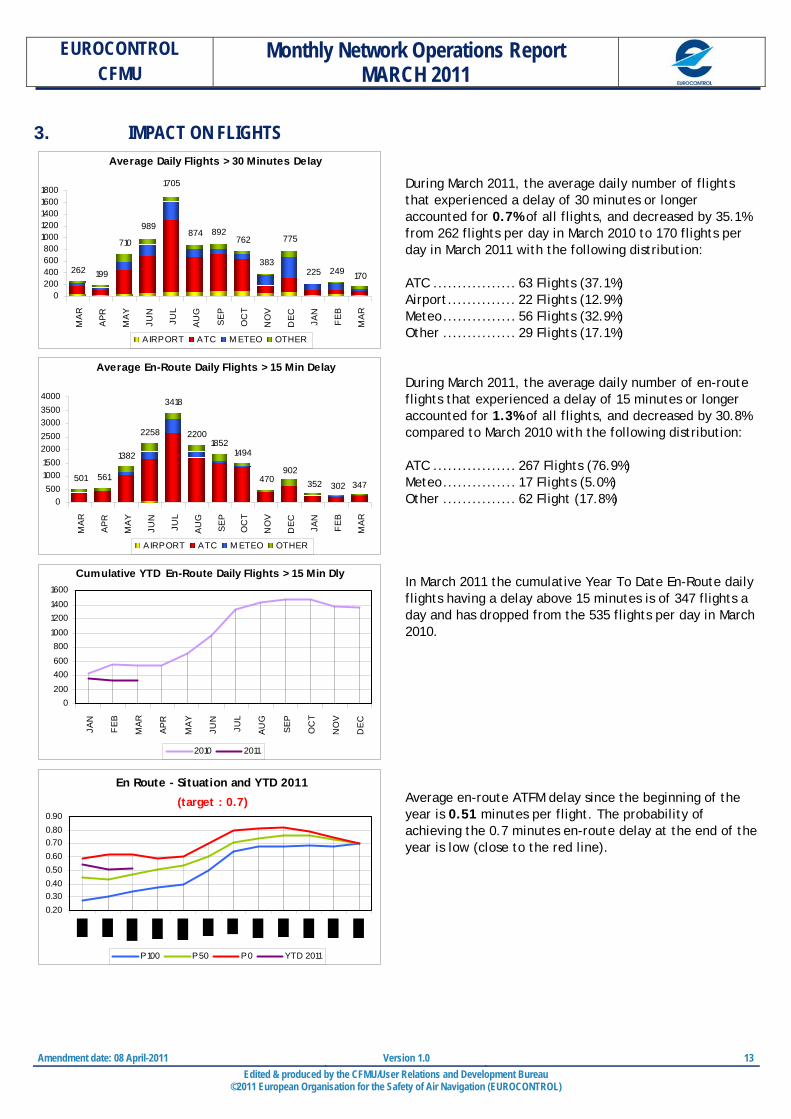
During March 2011, the average daily number of flights that experienced a delay of 30 minutes or longer accounted for 0.7% of all flights, and decreased by 35.1% from 262 flights per day in March 2010 to 170 flights per day in March 2011 with the following distribution: ATC ................. 63 Flights (37.1%) Airport.............. 22 Flights (12.9%) Meteo............... 56 Flights (32.9%) Other ............... 29 Flights (17.1%) During March 2011, the average daily number of en-route flights that experienced a delay of 15 minutes or longer accounted for 1.3% of all flights, and decreased by 30.8% compared to March 2010 with the following distribution: ATC ................. 267 Flights (76.9%) Meteo............... 17 Flights (5.0%) Other ............... 62 Flight (17.8%) In March 2011 the cumulative Year To Date En-Route daily flights having a delay above 15 minutes is of 347 flights a day and has dropped from the 535 flights per day in March 2010. Average en-route ATFM delay since the beginning of the year is 0.51 minutes per flight. The probability of achieving the 0.7 minutes en-route delay at the end of the year is low (close to the red line).
EUROCONTROL CFMU
Monthly Network Operations Report MARCH 2011
Amendment date: 08 April-2011 Version 1.0 14 Edited & produced by the CFMU/User Relations and Development Bureau
©2011 European Organisation for the Safety of Air Navigation (EUROCONTROL)
4. 5BSLOT ADHERENCE Average Daily Evolution of Early and Late Flights
0
200
400
600
800
1000
1200
2010
03
2010
04
2010
05
2010
06
2010
07
2010
08
2010
09
2010
10
2010
11
2010
12
2011
01
2011
02
2011
03
0.0%
2.0%
4.0%
6.0%
8.0%
10.0%
12.0%
Nº OF EARLY DEPARTURES Nº OF LATE DEPARTURES % EARLY DEPARTURES % LATE DEPARTURES
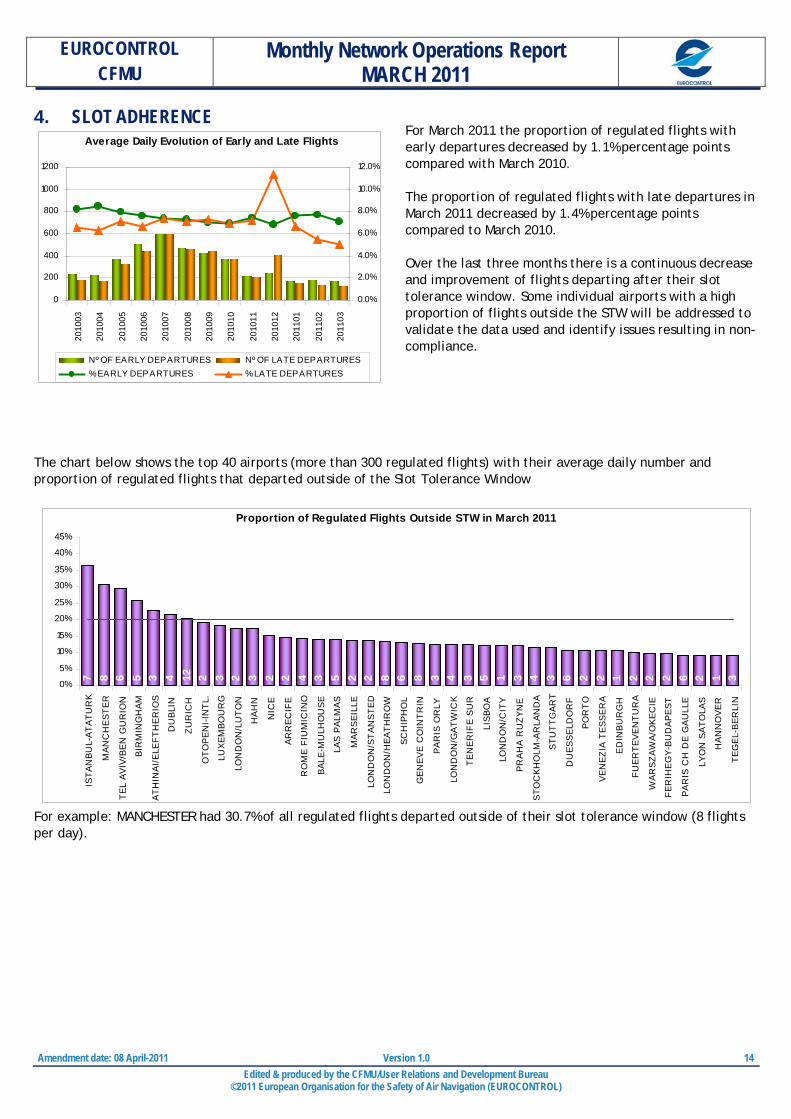
For March 2011 the proportion of regulated flights with early departures decreased by 1.1% percentage points compared with March 2010. The proportion of regulated flights with late departures in March 2011 decreased by 1.4% percentage points compared to March 2010. Over the last three months there is a continuous decrease and improvement of flights departing after their slot tolerance window. Some individual airports with a high proportion of flights outside the STW will be addressed to validate the data used and identify issues resulting in non-compliance.
The chart below shows the top 40 airports (more than 300 regulated flights) with their average daily number and proportion of regulated flights that departed outside of the Slot Tolerance Window
Proportion of Regulated Flights Outside STW in March 2011
8 6 5 3 4 12 2 3 2 3 2 2 4 3 5 2 2 8 6 8 3 4 3 5 1 3 4 3 6 2 2 1 2 2 2 6 2 1 37
0%
5%
10%
15%
20%
25%
30%
35%
40%
45%
IST
AN
BU
L-A
TA
TU
RK
MAN
CH
ES
TE
R
TE
L A
VIV
/BE
N G
UR
ION
BIR
MIN
GH
AM
AT
HIN
AI/
ELE
FTH
ER
IOS
DU
BLI
N
ZU
RIC
H
OT
OP
EN
I-IN
TL.
LUXE
MB
OU
RG
LON
DO
N/L
UT
ON
HA
HN
NIC
E
AR
RE
CIF
E
RO
ME
FIU
MIC
INO
BALE
-MU
LHO
USE
LAS
PA
LMA
S
MA
RS
EIL
LE
LON
DO
N/S
TA
NS
TE
D
LON
DO
N/H
EA
TH
RO
W
SC
HIP
HO
L
GE
NE
VE
CO
INT
RIN
PA
RIS
OR
LY
LON
DO
N/G
ATW
ICK
TE
NE
RIF
E S
UR
LISB
OA
LON
DO
N/C
ITY
PR
AH
A R
UZ
YN
E
ST
OC
KH
OLM
-AR
LAN
DA
ST
UT
TG
AR
T
DU
ES
SE
LDO
RF
PO
RT
O
VE
NE
ZIA
TE
SS
ER
A
ED
INB
UR
GH
FU
ER
TE
VE
NT
UR
A
WA
RS
ZA
WA
/OK
EC
IE
FE
RIH
EG
Y-B
UD
AP
ES
T
PA
RIS
CH
DE
GA
ULL
E
LYO
N S
ATO
LAS
HA
NN
OV
ER
TE
GE
L-B
ER
LIN
For example: MANCHESTER had 30.7% of all regulated flights departed outside of their slot tolerance window (8 flights per day).