network performance report 2017 - mcmc.gov.my · pdf filenetwork performance report 2017 2...
TRANSCRIPT

Published: 29 January 2018
Network Performance Report 2017 Measuring Malaysia Broadband and Voice Performance
Malaysian Communications and Multimedia Commission
Network Performance Report 2017
2
About this document The report contains data and analysis regarding the performance of Malaysia Public Cellular Services
(PCS - voice), Wireless (mobile) and Wired (fixed-line) broadband services delivered to consumers in
year 2017. Generally, the report provides information on the average performance of voice call, mobile
broadband including fixed wireless services such as WiMAX, fixed broadband of Digital Subscriber Line
(DSL- copper) and fibre packages, presented at a national level. The Network Performance Report draws
on data from measurement surveys and analysis conducted by the MCMC on a nationwide scale from
January to December 2017.
This report is produced to provide consumers with useful information on the performance of the
mentioned services. The publishing of this report is in accordance with the MCMC effort to carry out and
publish research on the quality of service experienced by the consumers based on the relevant
Commission Determination on the Mandatory Standards for Quality of Service.

Network Performance Report 2017
3
Contents
Section Page
1 Executive summary 1
2 Key metrics 2
3
3.1
3.2
3.3
Wireless broadband service performance
Background
Nationwide overall performance
Regional results
5
5
5
8
4
4.1
4.2
4.3
4.4
4.5
Wired broadband service performance
Background
Nationwide overall performance
Regional results
Results by speed subscribed
Results by location
62
62
62
63
66
68
5
5.1
5.2
5.3
Public cellular service performance
Background
Identified Route Results
Nationwide Results
70
70
74
77
6
6.1 Conclusion
FAQ 83
84

Network Performance Report 2017
1
1 This year, YES mobile broadband measurements were only conducted starting August 2017 due to the non-availability of
TDD-LTE supported test UE during early part of the assessment. Therefore, not all states were assessed for YES TDD-LTE
performance.
Section 1
Executive Summary Over the course of 2017, the MCMC embarked on another nationwide network performance measurement
following last year’s similar assessment activities, based on criteria stipulated in the three (3) Commission
Determination on the Mandatory Standards (MS) for Quality of Service (QoS). The 3 Determinations are:
1. Mandatory Standards for Quality of Service (Wireless Broadband Services);
http://www.skmm.gov.my/skmmgovmy/media/General/pdf/Comm-Det-MS-QoS-Wireless-Bb-
Access-Service-No-1-of-2016.pdf
2. Mandatory Standards for Quality of Service (Wired Broadband Services); and
http://www.skmm.gov.my/skmmgovmy/media/General/pdf/Comm-Det-MS-QoS-Wired-Bb-
Access-Service-No-2-of-2016.pdf
3. Mandatory Standards for Quality of Service (Public Cellular Services).
http://www.skmm.gov.my/Sectors/Celco/Quality-of-Service-%281%29/Public-Cellular-Quality-
of-Service/Commission-Determination-on-the-MSQoS-for-Public-C.aspx
As we are moving towards a digital nation, more people are able to be connected to the communications
they need and indirectly expectations on quality of service will likely increase as mobile and fixed
services becomes intertwined in their daily lives. The results provide snapshots of performance from
January to December 2017. During which all operators involved in the assessment may have carried out
varying degree of network maintenance and modernization on their network which may have impacted
the measurement results. All results were gathered based on the offered service at the particular tested
areas.
This report will focus on the results of the assessment and for ease of reference the report will also be
segregated into the performance on a regional level. The respective regions are Central, Southern,
Northern, Eastern, Sarawak and Sabah. The average performance for each region will be discussed state-
by-state where it matters.
Service providers involved in the assessment were Celcom, DiGi, Maxis, U Mobile, Webe and YES1 for
mobile broadband. As for fixed wireless broadband service (WiMAX), the only service provider involved
was YES. Therefore, YES is the only provider that have both data for mobile and fixed wireless
broadband - where YES (LTE) measurements involved. For wired broadband network performance,
service providers involved were Maxis, Time DotCom and Telekom Malaysia (TM). Lastly on voice call
performance, four (4) of the service providers evaluated were Celcom, DiGi, Maxis and U Mobile.
For mobile broadband, the test user equipment (UE) or mobile phones were not locked into any particular
technology band but measurements were done in 3G and LTE coverage areas. Meanwhile for fixed
wireless broadband, measurements were conducted in areas having WiMAX coverage. For wired
broadband, the measurements were conducted at customer’s premises who had subscribed to either fibre
or Digital Subscriber Line (DSL) type of broadband internet service.
Network Performance Report 2017
2
Section 2
Key Metrics The report focuses on the key metrics being measured based on the Mandatory Standards imposed by
MCMC which are relevant to the consumer experience. The network performance metrics being
measured for wireless and wired broadband were throughput (download and upload speeds), network
latency and packet loss. In terms of voice call performance, the parameters measured were call setup
success rate (CSSR) and dropped call rate (DCR). This report will present the average results across all
regions, as well as the distributions, to give a glimpse of the performance for the particular test areas.
Wireless broadband MS requirement – The proportion of tests that produced download throughput greater
than 650 kbps is considered as an addition to the overall averages. The required proportion for the
minimum throughput is 80% of the measured time for time division duplex (TDD) and 65% of the
measured time for frequency division duplex (FDD) type of services. Network latency requirements were
mandated to be less than 250 ms for at least 70% of the time, while packet loss must not be more than
3%.
Wired broadband MS requirement – Throughput measured must not be less than 70% of the subscribed
level for DSL and must not be less than 90% of the subscribed level for fibre. For both DSL and fibre, the
required proportion for the minimum throughput is 90% of the measured time. Network latency
requirements for fixed broadband were mandated to be less than 85 ms for at least 95% of the time, while
packet loss must not be more than 1%.
Voice call MS requirement – The minimum CSSR level required is set at 95% while the DCR must not be
more than 3%.
What we measured
Throughput – It refers to how much data can be transferred per unit of time across a network from one
location to another. In our measurement context, download throughput refers to the internet speed
experienced by the end user when data is transferred from a server to the end user equipment. While
upload throughput refers to the internet speed experienced by the end user when transferring data to the
server. Higher throughput means better internet speeds.
Network Latency – It refers to the timing of data transfers on a network, how long it takes for the data to
travel to its destination. Round trip time (RTT) refers to the time taken for a packet to travel and return
across the network between end user and the server. Low latency is considered better than high latency.
Packet Loss – It refers to amount of data sent which are unable to reach its intended destination. Low
packet loss indicates the network able to transfer data from the user end towards the destination host with
high reliability.
Call Setup Success Rate (CSSR) – Voice calls made by user and successfully established, allowing
communication. High CSSR indicates good network accessibility.
Dropped Call Rate (DCR) – Voice calls made by user and successfully established but was cut off
before the speaking parties able to finished the intended call or before any one of them hang up. Low
DCR indicates good network retainability.

Network Performance Report 2017
3
Limitation of this research
This report focuses on the relative performance of 4G, 3G and WiMAX networks (wireless broadband),
fibre and DSL (wired broadband), 2G and 3G networks (voice services), in the areas in which the MCMC
tested, in 2017.
These results provide valuable insight into each related service performance, but there are limitations of
this research, including:
The information presented in this report concerning wireless and wired broadband only relates to
download speeds, upload speeds, network latency and packet loss. Other factors relating to the
consumer experience of using broadband services (such as traffic management policies, web
browsing, Over-the-Top (OTT) applications, data allowances, customer service, billing etc.) are not
covered in this report.
In terms of mobile broadband and voice performance, the results may vary which is dependent on a
number of factors including distance from the base station, whether the user is inside a building or
outdoors, and whether stationary or in motion.
The number of people concurrently using a network in the same location or area can affect service
performance, and this means that the performance available to any individual consumer will vary both
by time and by location.
This report presents information on recorded results of the related service performance during the
measurement period in the locations in which the MCMC tested. However, the service providers are
continuously expanding and optimizing their networks, so the general performance results set out in
this report may not represent current or future performance.
It is important to note that the results shown here does not reflect the Malaysian-wide performance
and is limited to the areas being measured. However, the measurements were done in major cities for
each regional areas to reflect on the performance in high demand areas.
Causes of mobile network degradation that could affect quality in 2017
Performance of mobile broadband and voice performance may also be influenced by radio frequency
(RF) environment at the particular location. There are a number of RF interference (RFI) cases lodged
to the MCMC due to interference caused mainly by non-certified RF barrier gates, DECT phones, AV
Transmitters, Faulty Cellular/TV boosters or repeaters and jammers. This certainly will impact the
QoS to subscribers nearby the RFI areas. Number of recorded RFI complaint received in 2017
that would affect/degrade quality related to mobile service frequency band:

Network Performance Report 2017
4
RFID readers are usually used for barrier gates at housing areas, condominiums and offices. The
allowable operating spectrum for RFID is from 919 MHz to 923 MHz. But in most cases where the
interference is caused by RFID readers, it was found that a lot of the readers being utilized were non-
standard and operating outside the allowable spectrum range usually from 900 MHz to 925 MHz.
Those readers have caused interference with cellular mobile service uplink frequency of 880 MHz to
915 MHz. Indirectly the network performance in the interference area will degrade and causing poor
quality of service to the consumers.
Non-standard DECT phones or cordless phones used by public at homes and offices, would also
cause network degradation. The allowable frequency range is from 1880 MHz to 1900 MHz, but the
non-standard phones will have frequency outside the range and causing interference usually within
cellular mobile 2100 MHz uplink frequencies (interference in 1920 – 1935 MHz).
Interference case in LTE 2600 is found to be caused by faulty sensors such as that could be found on
a vehicle’s reverse sensors. The faulty sensors producing RF signals interfering with cellular mobile
2600 MHz uplink frequencies causing network and service quality degradation to the affected areas.
In 2017, the re-allocation of 900 MHz and 1800 MHz spectrum band could also affect the network
performance and service quality. Throughout the exercise, the mobile operators would have to replace
or retune existing equipment to ones that could support the new frequencies which involves major
downtime to the network and would certainly cause poor service quality to the consumers during the
period.
Note:
There will be no penalty for non-compliance on MS for QoS on Wireless Broadband and Public Cellular
Services for 2017 measurement. Relaxation of the said MS is due to the re-allocation of spectrum exercise
involving the mobile operators throughout 2017, a period during which network overhaul including
equipment replacement and optimization takes place.
Network Performance Report 2017
5
Section 3
Wireless Broadband Performance
3.1 Background
From January to November 2017, the MCMC conducted a state-by-state wireless broadband
measurement nationwide. The main KPIs being recorded are based on the key metrics mentioned earlier.
The measurement for wireless broadband has been divided into two categories which are; cellular mobile
broadband (3G, LTE) and fixed wireless broadband (WiMAX).
For wireless broadband, only download speeds were taken into account due to the dynamic characteristics
and asymmetrical design of the wireless network. The UE or smartphones used for cellular mobile
broadband measurement were category 4 (CAT4) phones with LTE capabilities and category 9 (CAT9)
phones which support LTE Carrier Aggregation (CA). Therefore, results shown hereafter only reflect the
capabilities of the test phones used.
The selection of the test location is based on a number of criteria, but must at least have 3G coverage and
typically the location measured are areas with high data usage such as commercial areas, business areas,
towns, tourist hotspots, complaint areas that are within coverage and government administration office
areas. Test location spots will be shown in map further in the report regional segment.
3.2 Nationwide overall performance
3.2.1 Average download throughput speeds - Nationwide
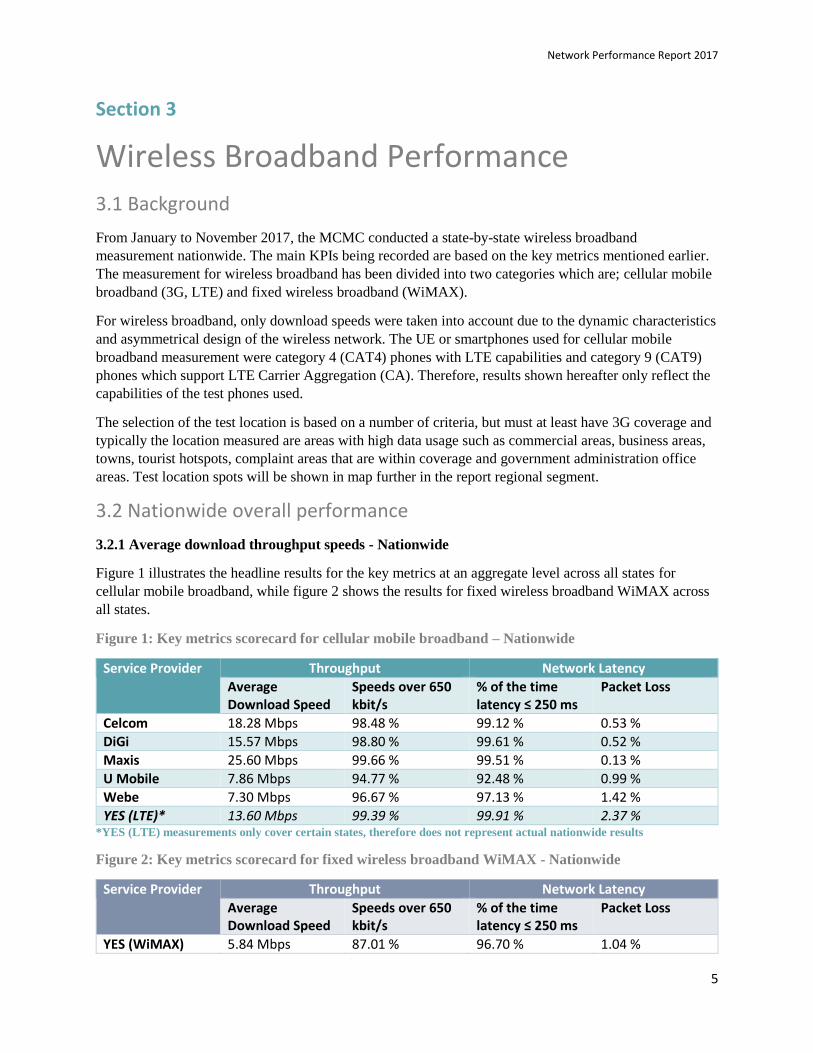
Figure 1 illustrates the headline results for the key metrics at an aggregate level across all states for
cellular mobile broadband, while figure 2 shows the results for fixed wireless broadband WiMAX across
all states.
Figure 1: Key metrics scorecard for cellular mobile broadband – Nationwide
Service Provider Throughput Network Latency
Average Download Speed
Speeds over 650 kbit/s
% of the time latency ≤ 250 ms
Packet Loss
Celcom 18.28 Mbps 98.48 % 99.12 % 0.53 %
DiGi 15.57 Mbps 98.80 % 99.61 % 0.52 %
Maxis 25.60 Mbps 99.66 % 99.51 % 0.13 %
U Mobile 7.86 Mbps 94.77 % 92.48 % 0.99 %
Webe 7.30 Mbps 96.67 % 97.13 % 1.42 %
YES (LTE)* 13.60 Mbps 99.39 % 99.91 % 2.37 % *YES (LTE) measurements only cover certain states, therefore does not represent actual nationwide results
Figure 2: Key metrics scorecard for fixed wireless broadband WiMAX - Nationwide
Service Provider Throughput Network Latency
Average Download Speed
Speeds over 650 kbit/s
% of the time latency ≤ 250 ms
Packet Loss
YES (WiMAX) 5.84 Mbps 87.01 % 96.70 % 1.04 %

Network Performance Report 2017
6
Based on average results obtained from measurements at an aggregate level nationwide, it could be
observed that Maxis offers the fastest download speeds compared to all other service providers with an
average speed of 25.60 Mbps. It has been a second year running for Maxis, as results from measurement
survey in 2016 also displayed Maxis as the fastest in terms of average download speeds nationwide. The
introduction of Webe and YES with their respective LTE offerings this year have widened the choice for
consumers to select from, and the performance shown by both during this year’s measurements were
commendable. In summary, all service providers passed the mandatory standards requirements for the
year 2017. Overall ranking (excluding YES-LTE) on the average download speed for all service providers
across all regions is shown in Figure 3 below:
Figure 3: Average Download Speeds Ranking - Nationwide (higher Mbps the better)
From the obtained throughput measurement results, Maxis recorded the fastest average download speeds
in majority of the states measured, which will be detailed out in following sub-sections. There is a gap
between the average speeds obtained from cellular mobile broadband against speeds obtained from fixed
wireless broadband. The WiMAX technology measured for fixed wireless broadband were not able to
offer similar or match the high data rate characteristics of LTE network. In fact, the only WiMAX service
provider; YES, is moving towards LTE by expanding LTE services nationwide.
It is important to note that the measurements were conducted mainly on a street level environment,
whereby the received signals on test devices are usually at good to optimum levels. This is to reflect on
the existing outdoor base stations which takes into account the street level network deployments.
Therefore, the experience might differ if not degraded if consumers were to access the network from
within a building due to signal attenuation caused by penetration loss – where walls and building
materials might absorb the signals.
3.2.2 Average network latency - Nationwide
Network latency or packet round-trip time (RTT) were measured to assess other internet activities that
require minimal delay such as data calls, video games, Skype or FaceTime. Based on the measurement
results of packet round-trip time (RTT) between the tested locations nationwide and MyIX, DiGi had the
quickest response time with an average of 37.79 ms. The overall ranking for the average network latency
is shown in Figure 4 below:
Network Performance Report 2017
7
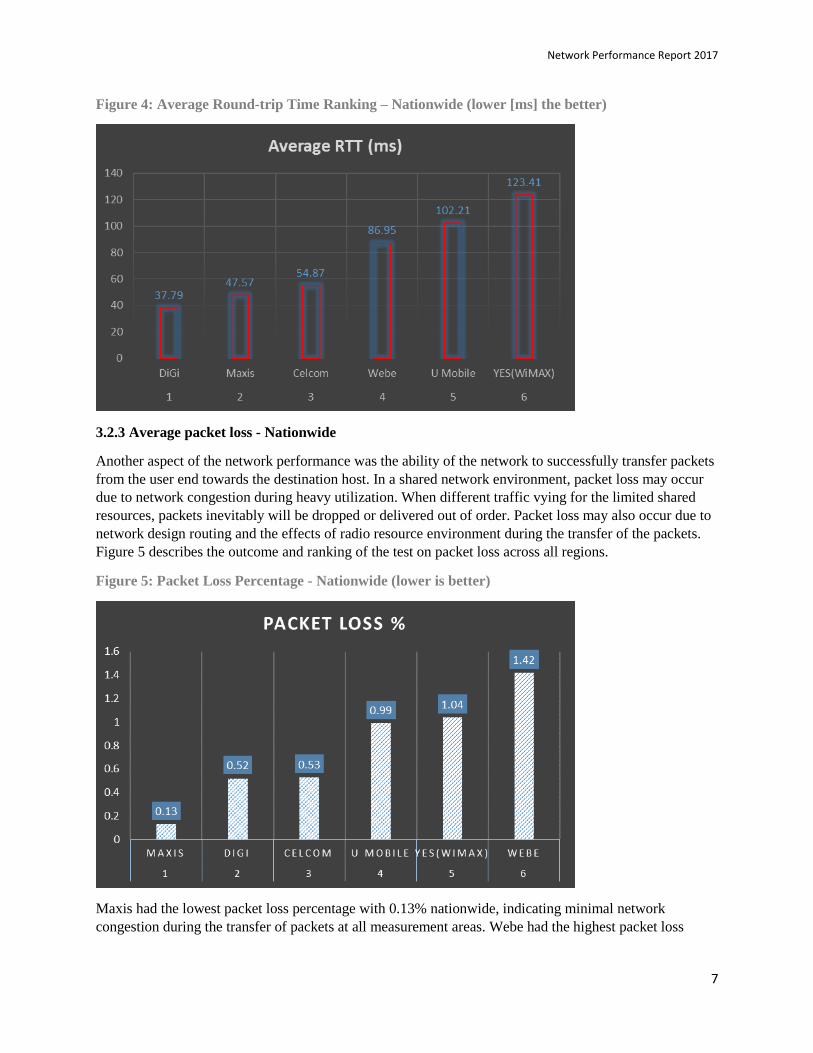
Figure 4: Average Round-trip Time Ranking – Nationwide (lower [ms] the better)
3.2.3 Average packet loss - Nationwide
Another aspect of the network performance was the ability of the network to successfully transfer packets
from the user end towards the destination host. In a shared network environment, packet loss may occur
due to network congestion during heavy utilization. When different traffic vying for the limited shared
resources, packets inevitably will be dropped or delivered out of order. Packet loss may also occur due to
network design routing and the effects of radio resource environment during the transfer of the packets.
Figure 5 describes the outcome and ranking of the test on packet loss across all regions.
Figure 5: Packet Loss Percentage - Nationwide (lower is better)
Maxis had the lowest packet loss percentage with 0.13% nationwide, indicating minimal network
congestion during the transfer of packets at all measurement areas. Webe had the highest packet loss

Network Performance Report 2017
8
percentage with 1.42%, contributed mainly from areas connected to 3G Domestic Roaming (DR). Detail
results of regional measurement will be shown in the following sub-sections.
3.3 Regional results
This section describes the aggregate measurement results of throughput test, network latency and packet
loss in each region.
3.3.1 Central region
Below chart describes the serving technology for the test UE during the measurement period in central
region. It must be noted that the test UE were not forced to lock on any specific technology. The test
carried out are mere reflections of what technology real consumers will get when using their mobile UE
in areas being measured.
Figure 6: Mobile broadband serving technology – Central Region
Based on measurement conducted in central region, Celcom test UE were connected to LTE technology at
most of the test locations with 94.06% of measurements were in LTE technology. Followed closely by
Maxis with 92.54%. DiGi test UE was served by LTE for 80.95% during the measurement. It can be seen
that U Mobile and Webe in central region have substantial test being served by 3G technology during
measurement, with 56.00% and 48.62% respectively for the two operators.
As for YES, only WiMAX technology performance were recorded using fixed wireless broadband
modem during the measurement in central region.
Network Performance Report 2017
9
3.3.1.1 State by state analysis:
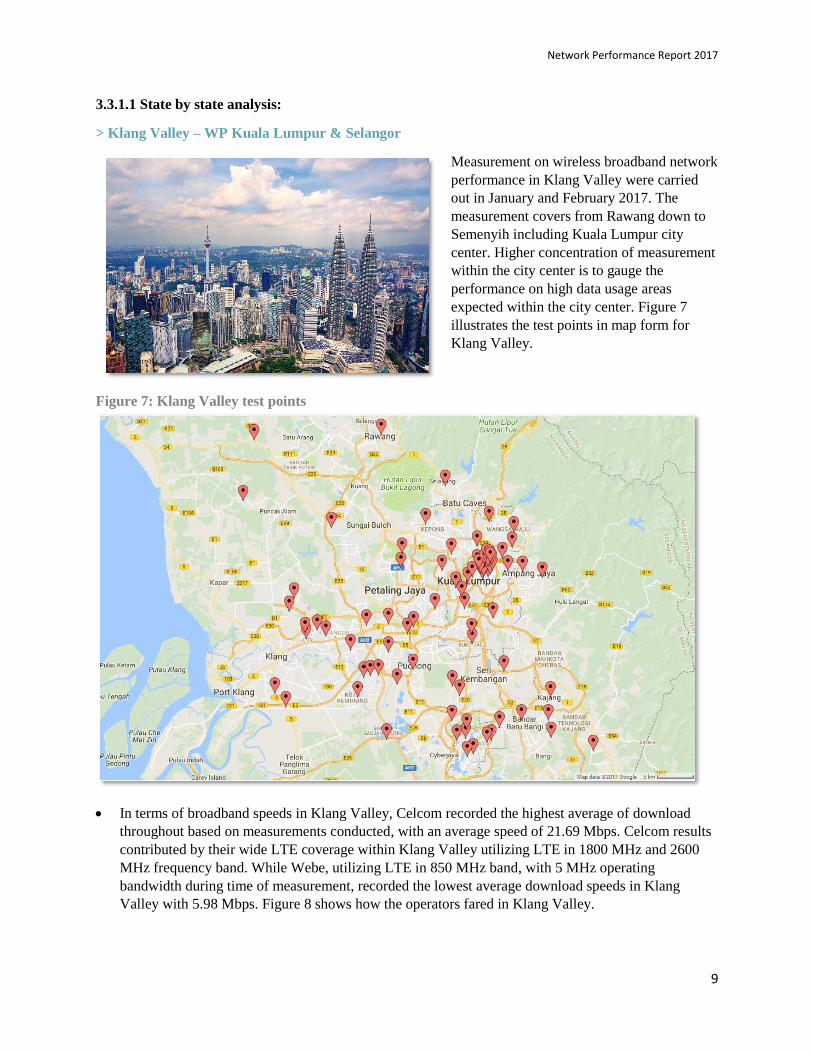
> Klang Valley – WP Kuala Lumpur & Selangor
Measurement on wireless broadband network
performance in Klang Valley were carried
out in January and February 2017. The
measurement covers from Rawang down to
Semenyih including Kuala Lumpur city
center. Higher concentration of measurement
within the city center is to gauge the
performance on high data usage areas
expected within the city center. Figure 7
illustrates the test points in map form for
Klang Valley.
Figure 7: Klang Valley test points
In terms of broadband speeds in Klang Valley, Celcom recorded the highest average of download
throughout based on measurements conducted, with an average speed of 21.69 Mbps. Celcom results
contributed by their wide LTE coverage within Klang Valley utilizing LTE in 1800 MHz and 2600
MHz frequency band. While Webe, utilizing LTE in 850 MHz band, with 5 MHz operating
bandwidth during time of measurement, recorded the lowest average download speeds in Klang
Valley with 5.98 Mbps. Figure 8 shows how the operators fared in Klang Valley.

Network Performance Report 2017
10
Figure 8: Klang Valley average throughput (cellular mobile & fixed wireless)
As for network latency performance, all service providers were able to meet both RTT and packet
loss percentage requirements. In average DiGi had the fastest response with an average RTT of 28.36
ms during tests conducted in Klang Valley areas. Maxis displayed good network reliability with
lowest packet lost percentage at 0.02%. Although Maxis did not have the fastest response, but based
on the very low packet loss percentage recorded, it can be assumed that packets sent through their
network have a higher degree of assurance to reach its destination. Detail results of network latency
for Klang Valley is shown in figure 9.

Network Performance Report 2017
11
Figure 9: Klang Valley network latency & packet loss performance

Network Performance Report 2017
12
Highlights
Some of the test locations were selected based on consumer complaints on broadband service. Test were
conducted on a street level statically nearby the complaint locations.
During last year’s assessment (2016), one example of a complaint area in Bandar Puteri Puchong,
shows Digi only able to achieve download speeds over 650 kbps for only 60% of the time and
high packet loss could also be observed for Digi (33.85%) and U Mobile (9.23%).
This year, the same location was assessed and improvement could be seen. It seems DiGi and U
Mobile have optimized their respective networks to improve the quality of service at the
complaint area.
Test results key metrics for complaint area in Bandar Puteri Puchong is shown in figure 10 with
improvement highlighted in green.
Figure 10: Bandar Puteri Puchong complaint area key metrics
Service Provider Throughput Network Latency
Average Download Speed
Speeds over 650 kbit/s
% of the time latency ≤ 250 ms
Packet Loss
Celcom 18.26 Mbit/s 100% 100% 0.2%
DiGi 6.61 Mbit/s 100% 98.89% 0%
Maxis 11.45 Mbit/s 100% 99.75% 0%
U Mobile 4.46 Mbit/s 88.89% 99.89% 0%
> Negeri Sembilan
Measurements on wireless broadband network
performance in Negeri Sembilan were conducted in
March 2017. The measurement covers Nilai,
Seremban, Kuala Pilah, Bahau, Rembau, Tampin,
Gemas, Jempol. Linggi and Port Dickson. Figure 11
illustrates the test points in map form.

Network Performance Report 2017
13
Figure 11: Negeri Sembilan test points
Negeri Sembilan consist of one main township that is Seremban, small towns, commercial and industrial
areas, new developed residential areas and popular tourist destination on its beaches. Measurements were
carried out at these places to gauge the network performance and how consumers would experience in
terms of wireless broadband service. Results show Maxis as the fastest service provider in terms of
average download speeds in Negeri Sembilan with 26.81 Mbps. While Webe recorded the lowest average
download speeds of 5.56 Mbps in Negeri Sembilan test areas. Further detail of average download speeds
for all operators is shown in figure 12.
Figure 12: Negeri Sembilan average throughput (cellular mobile & fixed wireless)

Network Performance Report 2017
14
Results show Celcom recorded an average download throughput of 20.07 Mbps, followed by DiGi at
14.61 Mbps, U Mobile at 7.09 Mbps and Webe at 5.56 Mbps. YES WiMAX in Negeri Sembilan have
an average download throughput of 5.95 Mbps.
As for network latency performance in Negeri Sembilan, DiGi recorded the fastest response with
average packet RTT of 37.06 ms. All operators achieved more than 90% of the time of packet RTT
less than 250 ms except for U Mobile which only recorded 61.78% of packet RTT that is less than
250 ms requirement. As for packet loss all operators recorded below 3% except one operator, Webe
which recorded 4.96% of packet loss during the measurement period. Details of network latency
described in figure 13.

Network Performance Report 2017
15
Figure 13: Negeri Sembilan network latency & packet loss performance

Network Performance Report 2017
16
3.3.1.2 Central region overall analysis:
Average throughput ranking:
Figure 14: Central region average throughput performance
Result shows that Maxis offers the fastest download speed in central region areas with an average
speed of 21.57 Mbps. Followed by Celcom at 21.22 Mbps, Digi at 15.95 Mbps, U Mobile at 7.91
Mbps and Webe at 5.86 Mbps. Meanwhile for sole WiMAX provider, YES recorded an average
speed of 6.16 Mbps. All service providers able to provide consistent speeds over 650 kbit/s for
more than 80% of the time during the measurement period with Celcom showing the best
consistency amongst the operators with 99.91% of the time throughput is more or equal than 650
kbps.
Network latency ranking:
Overall central region results show DiGi have the fastest response with average RTT of 32.71 ms.
Followed by Webe with average RTT of 56.55ms, Maxis with 59.55 ms, Celcom with 63.88 ms,
U Mobile with 104.89 ms and YES WiMAX with 124.85 ms.

Network Performance Report 2017
17
Figure 15: Central region network latency and packet loss performance
Maxis recorded lowest packet loss percentage for central region with 0.02% indicating high level
of network reliability in terms of packet delivery. Webe recorded the highest packet loss
percentage with 1.52%. Overall, all operators were able to achieve network latency and packet
loss requirements in central region.

Network Performance Report 2017
18
3.3.2 Southern region
Below chart describes the serving technology for the test UE during the measurement period in southern
region. Southern region consists of Johor and Melaka states.
Figure 16: Mobile broadband serving technology – Southern Region
During measurement in Southern region, Maxis showing high percentage of connection to LTE
technology with 98.42% of the measurements were served by LTE, followed by Celcom with 95.79%
served by LTE and Webe with 64%. DiGi and U Mobile measurements in majority were served by 3G
with 73.74% and 90.80% respectively. In Southern region, YES LTE performance was only measured in
Johor. 100% of YES LTE measurement is in the LTE 2300-2400 spectrum band.
3.3.2.1 State by state analysis:
> Johor
Measurements on wireless broadband network
performance in Johor were conducted in Q3, 2017.
The measurement covers Segamat, Kulai, Skudai,
Johor Bahru, Kota Tinggi, Pontian, Masai, Pasir
Gudang, Kluang, Batu Pahat and Muar. Figure 17
illustrates the test points in map form.

Network Performance Report 2017
19
Figure 17: Johor test points
In Johor, concentration of the measurement samples, was in city centers and townships. Particularly
areas covering Iskandar Malaysia, including the city of Johor Bahru, and the adjoining towns of
Pontian, Kulai and Pasir Gudang. Results show Maxis as the fastest service provider in terms of
average download speeds in Johor with 38.45 Mbps. The average download speeds recorded by
Maxis in Johor is quite impressive but it must be noted that network traffic do play a part in achieving
higher throughput. Areas in Iskandar Malaysia are well developed but it could be seen during the
testing period, there are some areas that may not have high network traffic due to low population.
This could contribute to higher average download speed performance overall. While for the lowest
average download speeds, YES WiMAX recorded an average speeds of 4.66 Mbps in Johor test
areas. Further detail of average download speeds for all operators is shown in figure 18.

Network Performance Report 2017
20
Figure 18: Johor average throughput (cellular mobile & fixed wireless)
In Johor, both WiMAX and LTE performance for YES were measured. YES LTE provided better
average download throughput with 13.32 Mbps compared to its WiMAX service which recorded 4.66
Mbps. Both Celcom and DiGi recorded average throughput of around 17 Mbps. Followed by Webe at
10.49 Mbps and U Mobile at 8.43 Mbps.
As for network latency performance in Johor, DiGi again recorded the fastest response with average
packet RTT of 31.48 ms. All operators achieved more than 90% of the time of packet RTT less than
250 ms. As for packet loss, all operators recorded below 3% during the measurement period.
As for packet loss all operators recorded below 3% of packet loss during the measurement period.
Details of network latency and packet loss described in figure 19.

Network Performance Report 2017
21
Figure 19: Johor network latency & packet loss performance
Network Performance Report 2017
22
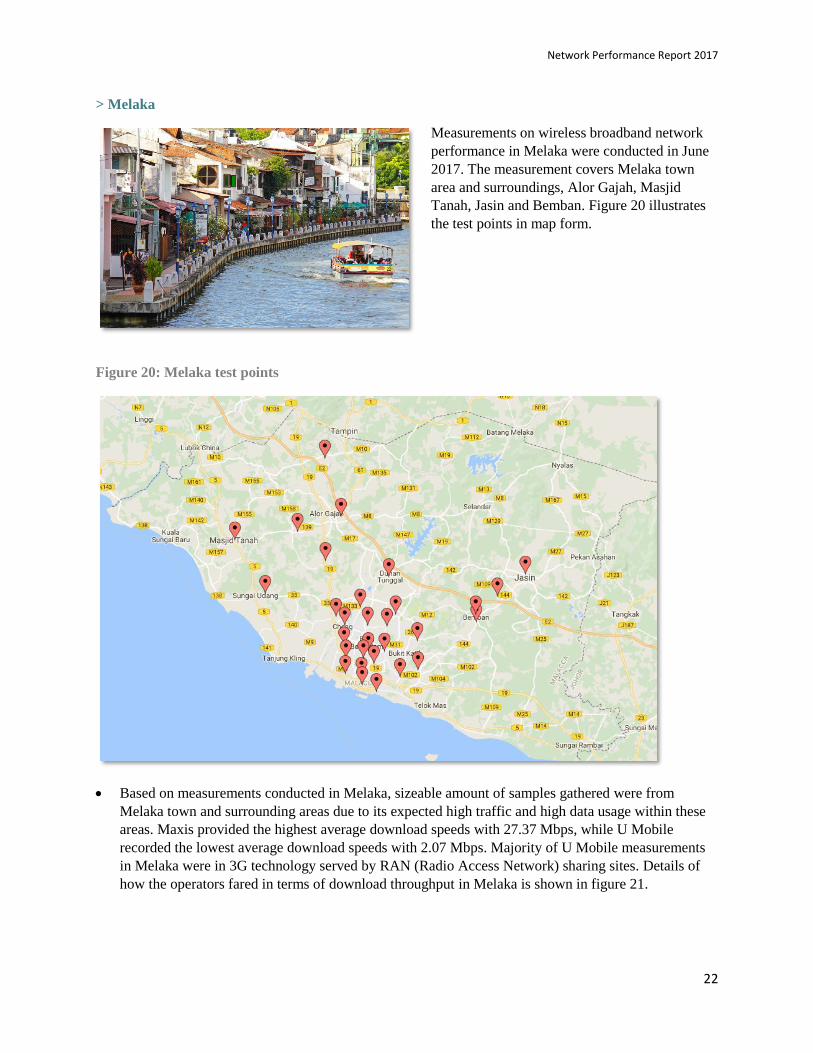
> Melaka
Measurements on wireless broadband network
performance in Melaka were conducted in June
2017. The measurement covers Melaka town
area and surroundings, Alor Gajah, Masjid
Tanah, Jasin and Bemban. Figure 20 illustrates
the test points in map form.
Figure 20: Melaka test points
Based on measurements conducted in Melaka, sizeable amount of samples gathered were from
Melaka town and surrounding areas due to its expected high traffic and high data usage within these
areas. Maxis provided the highest average download speeds with 27.37 Mbps, while U Mobile
recorded the lowest average download speeds with 2.07 Mbps. Majority of U Mobile measurements
in Melaka were in 3G technology served by RAN (Radio Access Network) sharing sites. Details of
how the operators fared in terms of download throughput in Melaka is shown in figure 21.

Network Performance Report 2017
23
Figure 21: Melaka average throughput (cellular mobile & fixed wireless)
Average download throughput in Melaka shows that DiGi comes in second to Maxis but with quite a
difference with DiGi recorded 13.03 Mbps compared to Maxis speeds of 27.37 Mbps. Celcom comes
next with 12.69 Mbps, followed by Webe with 5.48 Mbps and U Mobile with 2.07 Mbps. YES
WiMAX average throughput in Melaka is 3.49 Mbps.
U Mobile only managed to record speeds ≥ 650 kbps for 54.27% of the time in Melaka. This could be
contributed by majority of the measurements made were in 3G RAN sharing sites. As for YES
WiMAX, consistency of getting throughput ≥ 650 kbps is at 72.38% of the time. All other operators
managed to consistently provide above required throughput for more than 90% of the time.
In terms of network latency performance, DiGi recorded the fastest response with average packet
RTT of 31.37 ms. Followed closely by Maxis and Celcom with both recording 35.50 ms and 38.55
ms respectively. YES WiMAX service has the slowest response with average packet RTT of 180.70
ms.
As for packet loss, all operators recorded below 3% of packet loss during the measurement period.
Figure 22 describes Melaka network latency and packet loss measurement results.

Network Performance Report 2017
24
Figure 22: Melaka network latency & packet loss performance

Network Performance Report 2017
25
3.3.2.2 Southern region overall analysis:
Average throughput ranking:
Figure 23: Southern region average throughput performance
Result shows that Maxis offers the fastest download speed in southern region areas with an
average speed of 32.96 Mbps. Followed by DiGi at 15.42 Mbps, Celcom at 15.40 Mbps, U Webe
at 7.99 Mbps and U Mobile at 6.22 Mbps. Meanwhile YES recorded an average speed of 4.08
Mbps for its WiMAX service in southern region. All service providers able to provide consistent
speeds over 650 kbit/s for more than 80% of the time during the measurement period with Maxis
showing the best consistency amongst the operators with 100% of the time throughput is more or
equal than 650 kbps.
Network latency ranking:
Overall, southern region results show DiGi have the fastest response with average RTT of 31.43
ms. Followed by Maxis with average RTT of 35.38 ms, Celcom with 40.26 ms, Webe with 57.48
ms, U Mobile with 153.99 ms and YES WiMAX with 177.69 ms.
*YES LTE only measured in Johor, hence the service performance is not ranked.

Network Performance Report 2017
26
Figure 24: Southern region network latency and packet loss performance
Celcom recorded lowest packet loss percentage in southern region with 0.17%. YES WiMAX
recorded the highest packet loss percentage with 1.73%. Overall, all operators were able to
achieve network latency and packet loss requirements in southern region.
*YES LTE only measured in Johor, hence the service performance is not ranked.

Network Performance Report 2017
27
3.3.3 Northern region
Below chart describes the serving technology for the test UE during measurement period in northern
region. Northern region consists of Perak, Penang, Kedah and Perlis states.
Figure 25: Mobile broadband serving technology – Northern Region
Based on measurements conducted in northern region, Maxis test UE connected to LTE technology for
98.84% during measurement. Followed by Celcom at 88.96%, DiGi at 82.80% and Webe at 61.78%.
Majority of U Mobile measurements were in 3G technology with 79.52%. YES only have LTE
technology for their mobile broadband services and measurements for YES LTE only covers Kedah and
Perlis. 100% of YES LTE measurement is in the LTE 2300-2400 spectrum band. As usual for fixed
wireless broadband, YES WiMAX performance were measured for all states in northern region.
3.3.3.1 State by state analysis:
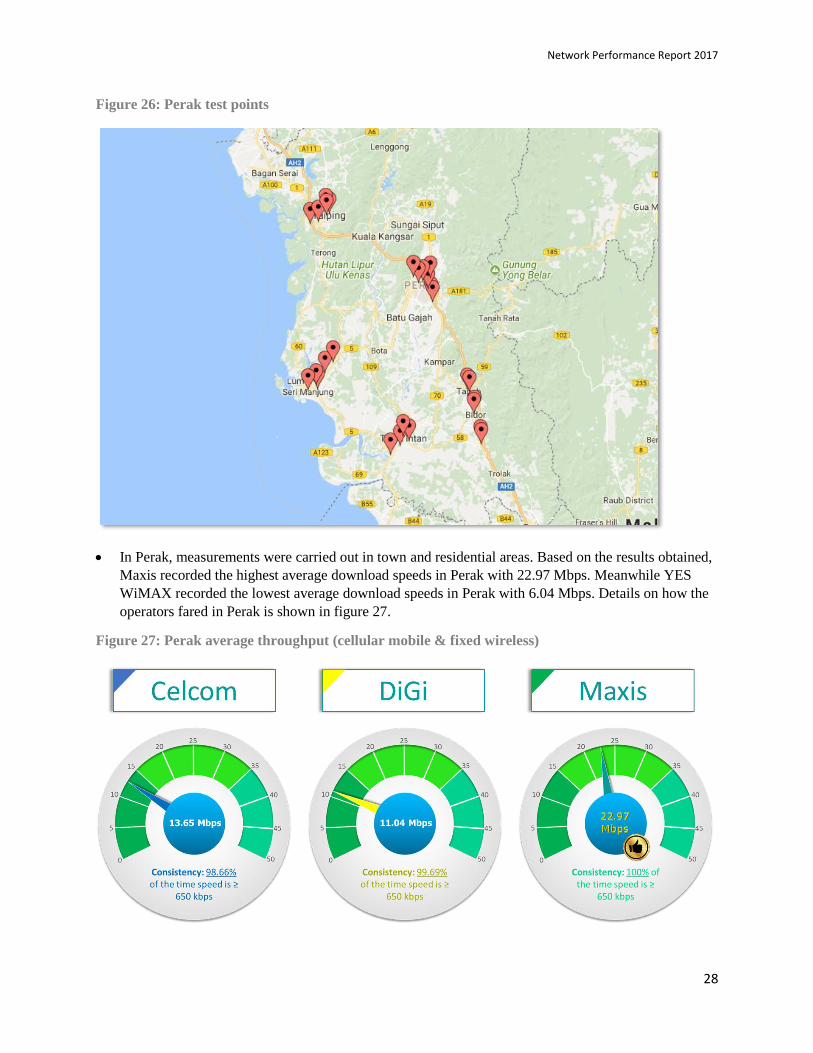
> Perak
Wireless broadband performance measurement in Perak
covers Ipoh, Sungkai, Tapah, Bidor, Manjung, Lumut,
Taiping, Ayer Tawar and Teluk Intan. Measurements were
carried out in July 2017. Figure 26 illustrates the test points
in Perak.
Network Performance Report 2017
28
Figure 26: Perak test points
In Perak, measurements were carried out in town and residential areas. Based on the results obtained,
Maxis recorded the highest average download speeds in Perak with 22.97 Mbps. Meanwhile YES
WiMAX recorded the lowest average download speeds in Perak with 6.04 Mbps. Details on how the
operators fared in Perak is shown in figure 27.
Figure 27: Perak average throughput (cellular mobile & fixed wireless)
Network Performance Report 2017
29
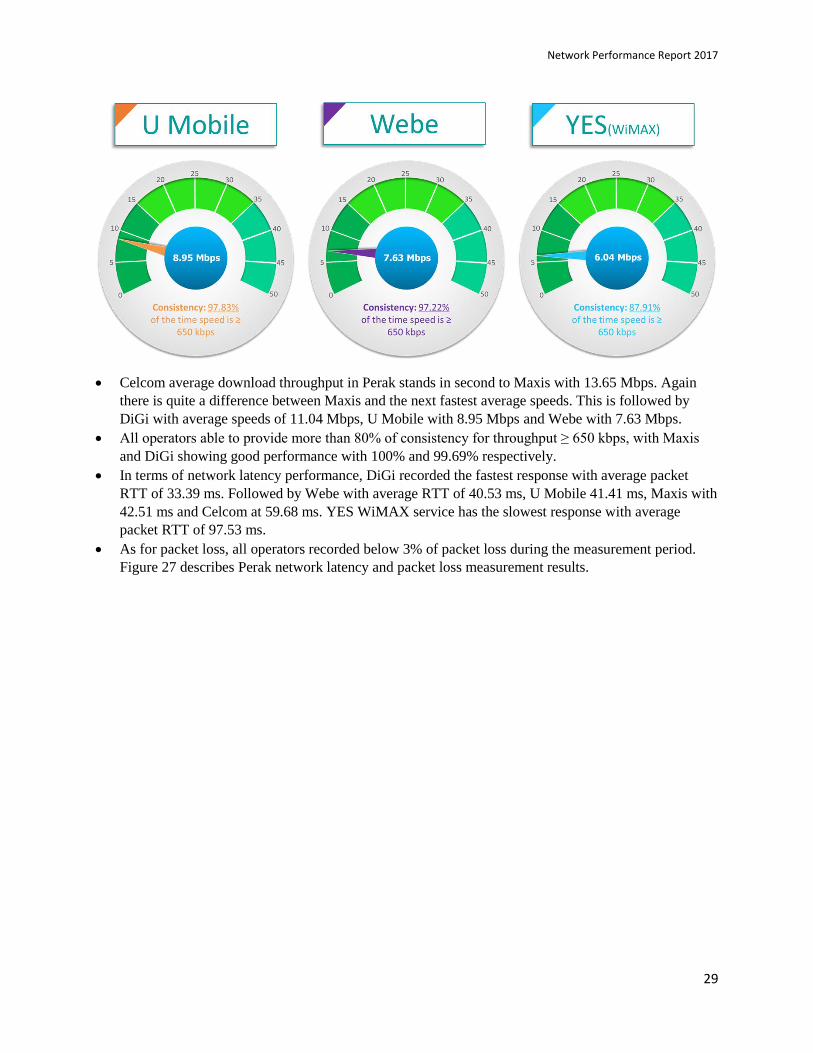
Celcom average download throughput in Perak stands in second to Maxis with 13.65 Mbps. Again
there is quite a difference between Maxis and the next fastest average speeds. This is followed by
DiGi with average speeds of 11.04 Mbps, U Mobile with 8.95 Mbps and Webe with 7.63 Mbps.
All operators able to provide more than 80% of consistency for throughput ≥ 650 kbps, with Maxis
and DiGi showing good performance with 100% and 99.69% respectively.
In terms of network latency performance, DiGi recorded the fastest response with average packet
RTT of 33.39 ms. Followed by Webe with average RTT of 40.53 ms, U Mobile 41.41 ms, Maxis with
42.51 ms and Celcom at 59.68 ms. YES WiMAX service has the slowest response with average
packet RTT of 97.53 ms.
As for packet loss, all operators recorded below 3% of packet loss during the measurement period.
Figure 27 describes Perak network latency and packet loss measurement results.

Network Performance Report 2017
30
Figure 28: Perak network latency and packet loss performance

Network Performance Report 2017
31
> Penang
Measurements in Penang were conducted in
May 2017 covering Penang city center
including Georgetown, northeast and south
west of Penang island, Seberang Perai
including Butterworth, Permatang Pauh,
Perda, Kepala Batas, Simpang Ampat and
Nibong Tebal. Figure 29 illustrates the test
points in Penang.
Figure 29: Penang test points
In Penang, the measurements were carried out both within the Penang island and Seberang Perai on
the peninsular. Samples were taken in town areas, residential, industrial and tourist attraction areas.
Based on measurements conducted in Penang, results show Maxis is again the highest in terms of
average download throughput with 22.82 Mbps. YES WiMAX recorded the lowest average download

Network Performance Report 2017
32
throughput with average speeds of 5.71 Mbps. Figure 29 describes the average download throughput
for all operators for measurement in Penang.
Figure 30: Penang average throughput (cellular mobile & fixed wireless)
Celcom recorded commendable average speeds of 20.79 Mbps in Penang, just behind Maxis.
Followed by DiGi with 15.93 Mbps, U Mobile with 8.59 Mbps and Webe with 7.59 Mbps.
All operators could provide average speeds ≥ 650 kbps for more than 80% of the time except for YES
WiMAX which recorded 78.17% of the time.
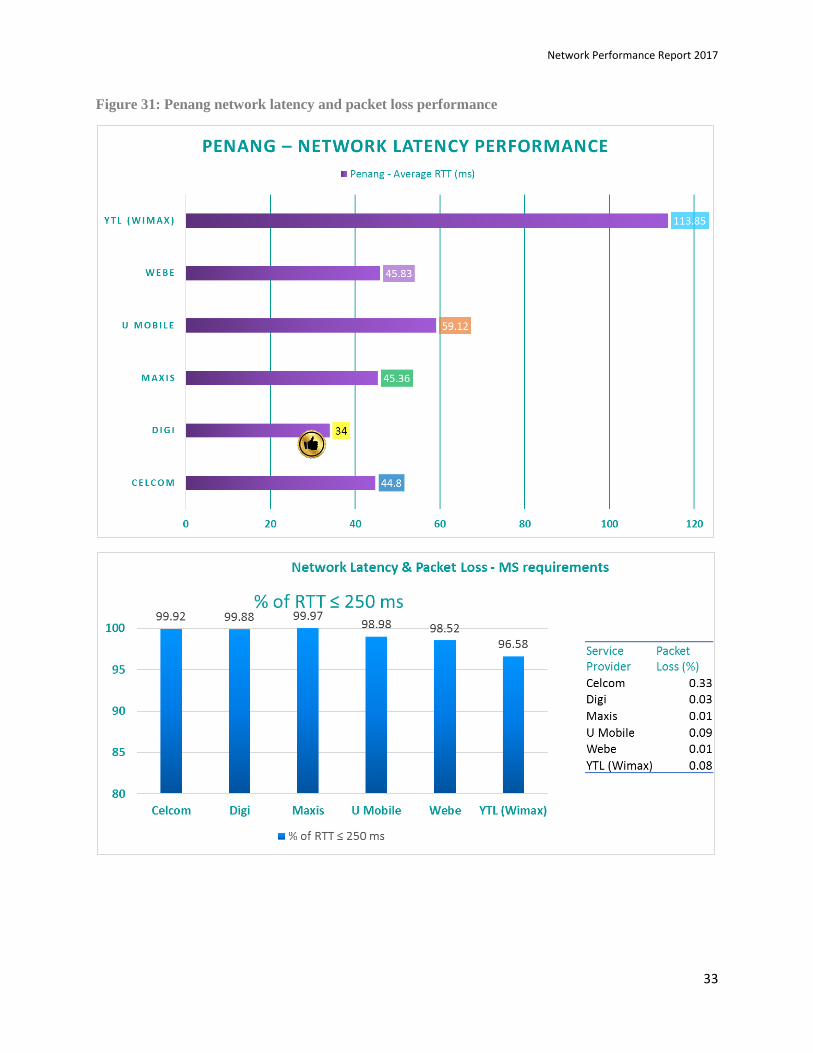
In terms of network latency performance in Penang, again DiGi showing consistency of having the
fastest response of average packet RTT with 34 ms. YES WiMAX has the slowest response with
113.85 ms.
Meanwhile for packet loss in Penang, all operators recorded very good performance during the
measurement period. All operators have packet loss below 1%. Details on network latency and packet
loss performance in Penang is shown in figure 31.
Network Performance Report 2017
33
Figure 31: Penang network latency and packet loss performance

Network Performance Report 2017
34
> Kedah and Perlis
Due to its geographical area, measurement
for Perlis has been combined with Kedah
state during the measurement period in
October 2017. The measurement covers
Sungai Petani, Alor Setar, Kuala Kedah,
Jitra, Changlun, Bukit Kayu Hitam, Arau,
Kangar and Kuala Perlis. The test points are
shown in figure 32.
Figure 32: Kedah and Perlis test points
Kedah:
During measurements in Kedah, samples were taken focusing on township and residential areas.
Considerable data gathered within Alor Setar and its surrounding areas and also down south in Sungai
Petani town and towards north of Changlun and Bukit Kayu Hitam town centers. Based on
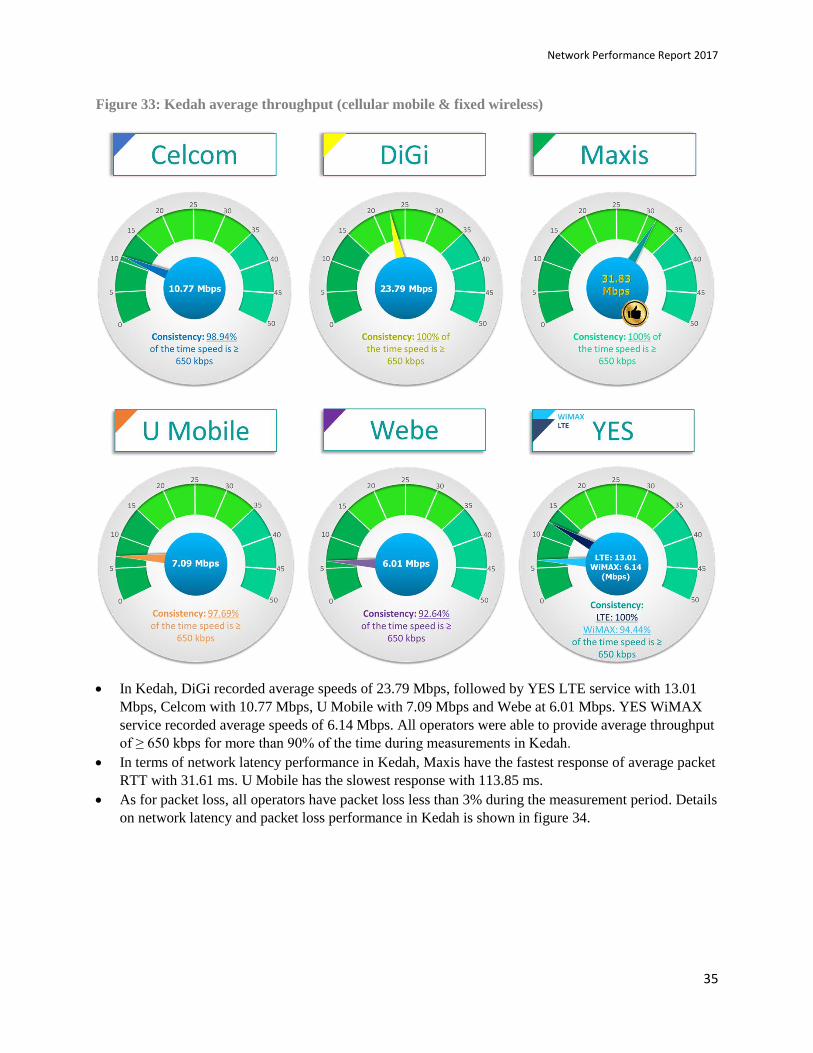
measurements in Kedah, Maxis recorded the highest average download throughput with 31.83 Mbps.
While Webe recorded the lowest average download throughput with 6.01 Mbps. As for YES, both its
LTE and WiMAX services were measured in Kedah with their LTE service edging the WiMAX
service in terms of download speeds. Figure 33 describes how the operators fared in Kedah.
Network Performance Report 2017
35
Figure 33: Kedah average throughput (cellular mobile & fixed wireless)
In Kedah, DiGi recorded average speeds of 23.79 Mbps, followed by YES LTE service with 13.01
Mbps, Celcom with 10.77 Mbps, U Mobile with 7.09 Mbps and Webe at 6.01 Mbps. YES WiMAX
service recorded average speeds of 6.14 Mbps. All operators were able to provide average throughput
of ≥ 650 kbps for more than 90% of the time during measurements in Kedah.
In terms of network latency performance in Kedah, Maxis have the fastest response of average packet
RTT with 31.61 ms. U Mobile has the slowest response with 113.85 ms.
As for packet loss, all operators have packet loss less than 3% during the measurement period. Details
on network latency and packet loss performance in Kedah is shown in figure 34.

Network Performance Report 2017
36
Figure 34: Kedah network latency and packet loss performance
Network Performance Report 2017
37
Perlis:
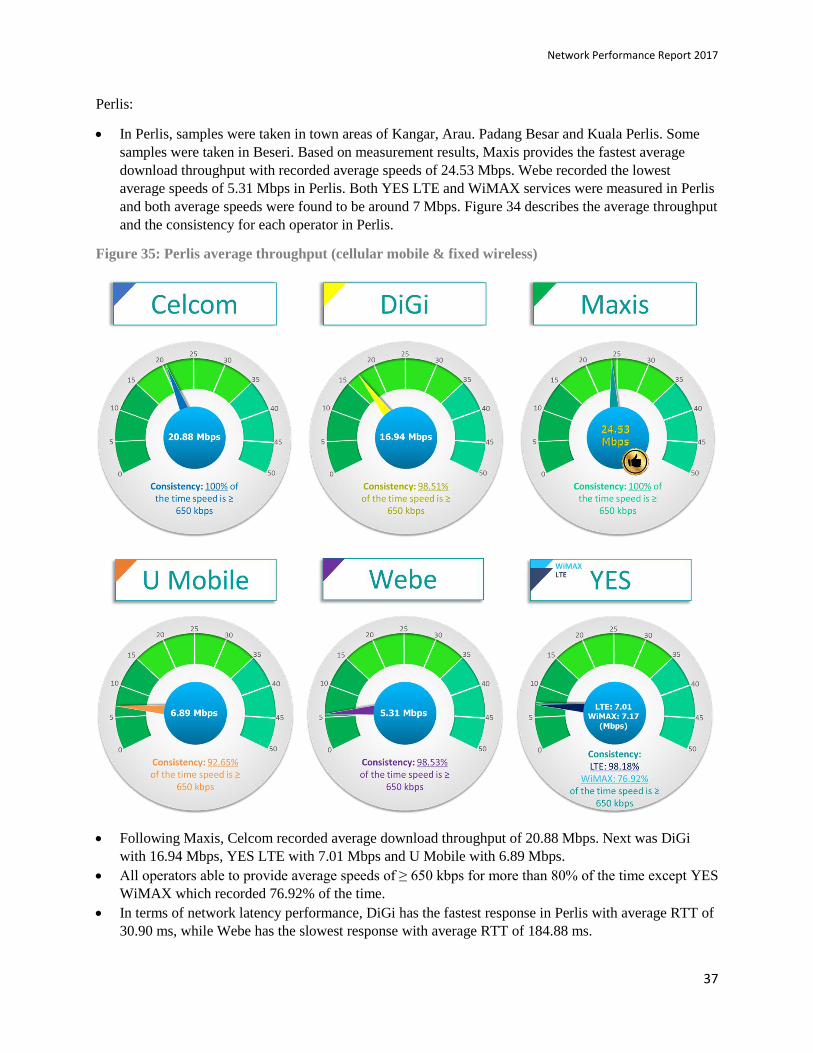
In Perlis, samples were taken in town areas of Kangar, Arau. Padang Besar and Kuala Perlis. Some
samples were taken in Beseri. Based on measurement results, Maxis provides the fastest average
download throughput with recorded average speeds of 24.53 Mbps. Webe recorded the lowest
average speeds of 5.31 Mbps in Perlis. Both YES LTE and WiMAX services were measured in Perlis
and both average speeds were found to be around 7 Mbps. Figure 34 describes the average throughput
and the consistency for each operator in Perlis.
Figure 35: Perlis average throughput (cellular mobile & fixed wireless)
Following Maxis, Celcom recorded average download throughput of 20.88 Mbps. Next was DiGi
with 16.94 Mbps, YES LTE with 7.01 Mbps and U Mobile with 6.89 Mbps.
All operators able to provide average speeds of ≥ 650 kbps for more than 80% of the time except YES
WiMAX which recorded 76.92% of the time.
In terms of network latency performance, DiGi has the fastest response in Perlis with average RTT of
30.90 ms, while Webe has the slowest response with average RTT of 184.88 ms.

Network Performance Report 2017
38
High packet loss could be seen for DiGi with 5.71% of packets sent unable to reached the destination,
3.05% for Webe and 9.15% for YES LTE. Details of network latency and packet loss performance
shown in figure 36.
Figure 36: Perlis network latency and packet loss performance
Network Performance Report 2017
39
3.3.3.2 Northern region overall analysis:
Average throughput ranking:
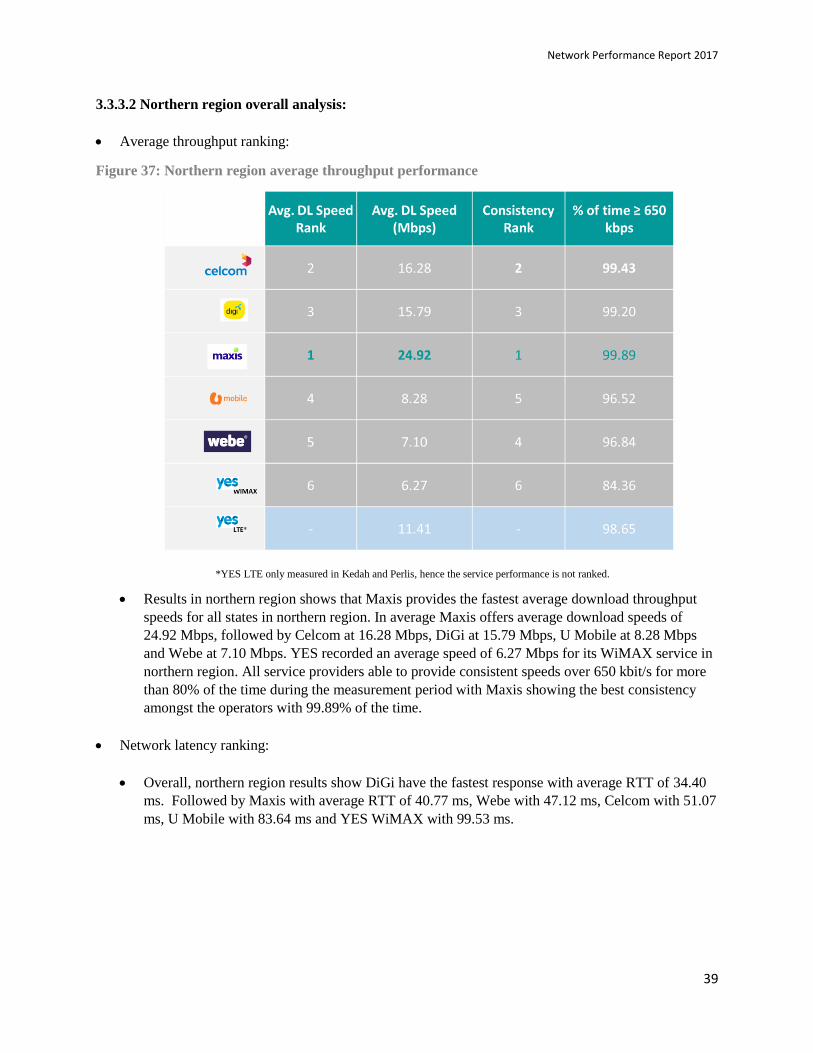
Figure 37: Northern region average throughput performance
Results in northern region shows that Maxis provides the fastest average download throughput
speeds for all states in northern region. In average Maxis offers average download speeds of
24.92 Mbps, followed by Celcom at 16.28 Mbps, DiGi at 15.79 Mbps, U Mobile at 8.28 Mbps
and Webe at 7.10 Mbps. YES recorded an average speed of 6.27 Mbps for its WiMAX service in
northern region. All service providers able to provide consistent speeds over 650 kbit/s for more
than 80% of the time during the measurement period with Maxis showing the best consistency
amongst the operators with 99.89% of the time.
Network latency ranking:
Overall, northern region results show DiGi have the fastest response with average RTT of 34.40
ms. Followed by Maxis with average RTT of 40.77 ms, Webe with 47.12 ms, Celcom with 51.07
ms, U Mobile with 83.64 ms and YES WiMAX with 99.53 ms.
*YES LTE only measured in Kedah and Perlis, hence the service performance is not ranked.

Network Performance Report 2017
40
Figure 38: Northern region network latency and packet loss performance
Webe recorded the lowest packet loss percentage in northern region with 0.07%. YES LTE
recorded the highest packet loss percentage with 2.46%. Overall, all operators were able to
achieve network latency and packet loss requirements in northern region.
*YES LTE only measured in Kedah and Perlis, hence the service performance is not ranked.
Network Performance Report 2017
41
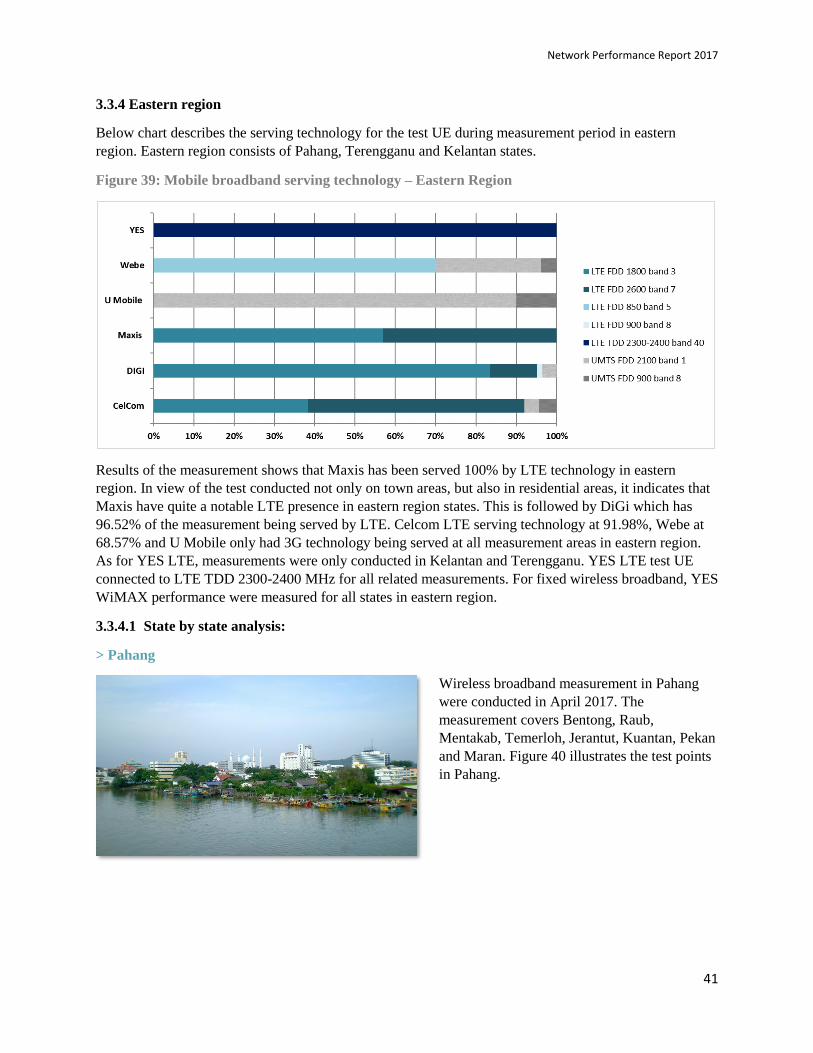
3.3.4 Eastern region
Below chart describes the serving technology for the test UE during measurement period in eastern
region. Eastern region consists of Pahang, Terengganu and Kelantan states.
Figure 39: Mobile broadband serving technology – Eastern Region
Results of the measurement shows that Maxis has been served 100% by LTE technology in eastern
region. In view of the test conducted not only on town areas, but also in residential areas, it indicates that
Maxis have quite a notable LTE presence in eastern region states. This is followed by DiGi which has
96.52% of the measurement being served by LTE. Celcom LTE serving technology at 91.98%, Webe at
68.57% and U Mobile only had 3G technology being served at all measurement areas in eastern region.
As for YES LTE, measurements were only conducted in Kelantan and Terengganu. YES LTE test UE
connected to LTE TDD 2300-2400 MHz for all related measurements. For fixed wireless broadband, YES
WiMAX performance were measured for all states in eastern region.
3.3.4.1 State by state analysis:
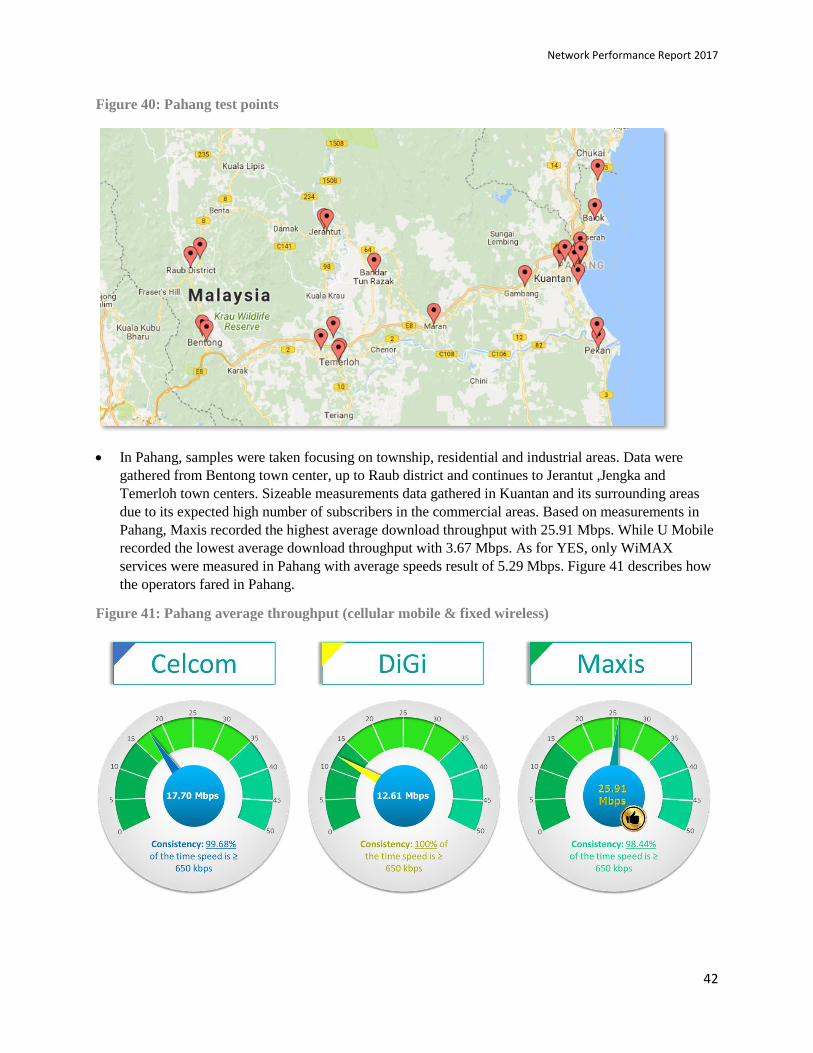
> Pahang
Wireless broadband measurement in Pahang
were conducted in April 2017. The
measurement covers Bentong, Raub,
Mentakab, Temerloh, Jerantut, Kuantan, Pekan
and Maran. Figure 40 illustrates the test points
in Pahang.
Network Performance Report 2017
42
Figure 40: Pahang test points
In Pahang, samples were taken focusing on township, residential and industrial areas. Data were
gathered from Bentong town center, up to Raub district and continues to Jerantut ,Jengka and
Temerloh town centers. Sizeable measurements data gathered in Kuantan and its surrounding areas
due to its expected high number of subscribers in the commercial areas. Based on measurements in
Pahang, Maxis recorded the highest average download throughput with 25.91 Mbps. While U Mobile
recorded the lowest average download throughput with 3.67 Mbps. As for YES, only WiMAX
services were measured in Pahang with average speeds result of 5.29 Mbps. Figure 41 describes how
the operators fared in Pahang.
Figure 41: Pahang average throughput (cellular mobile & fixed wireless)

Network Performance Report 2017
43
Celcom recorded average download throughput of 17.70 Mbps in Pahang, followed by DiGi with
12.61 Mbps and Webe with 5.00 Mbps.
All operators able to provide consistency of average speeds ≥ 650 kbps for more than 80% of the time
during measurement period in Pahang.
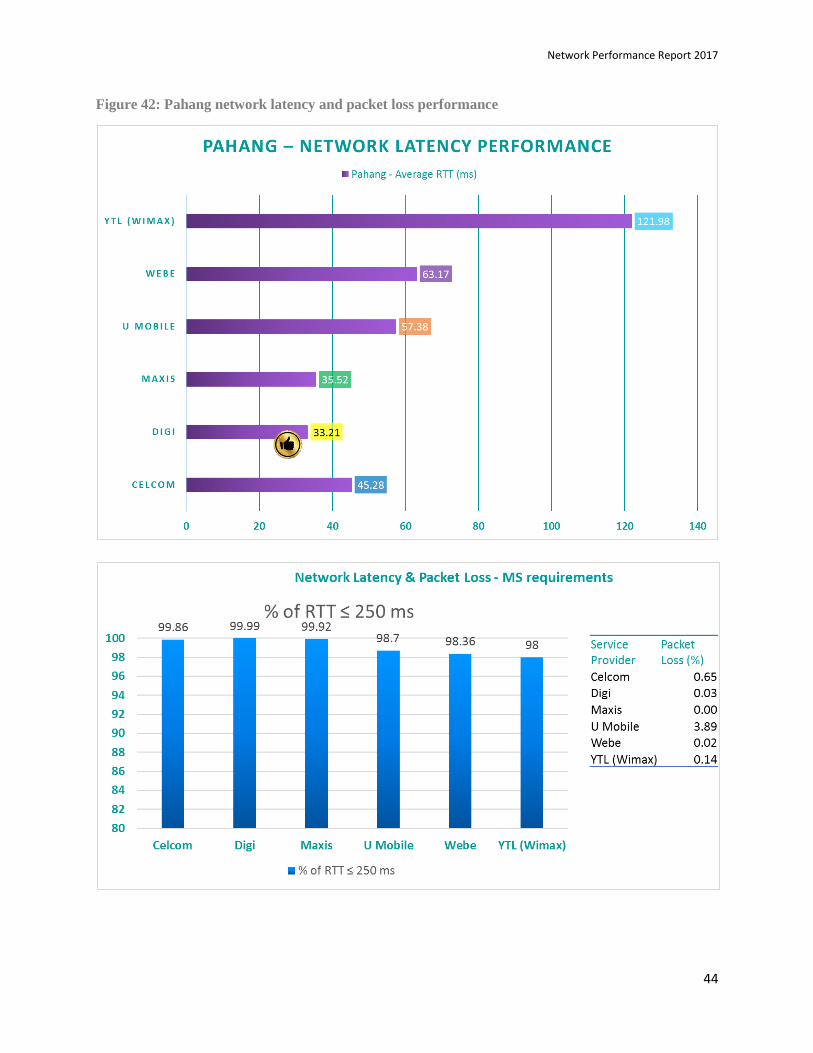
In terms of network latency, DiGi has the fastest response with average packet RTT of 33.21 ms,
followed closely by Maxis which recorded 35.52 ms, and then it is Celcom with 45.28 ms, U Mobile
with 57.38 ms, Webe with 63.17 ms. YES WiMAX has the slowest response with 121.98 ms.
All operators have recorded packet loss below 3% except for U Mobile which recorded 3.89% of
packet loss. This could be due to all measurement areas are connected to 3G technology for U Mobile
which might have impacted the outcome of the results. Figure 41describes the network latency and
packet loss performance for each operator.
Network Performance Report 2017
44
Figure 42: Pahang network latency and packet loss performance

Network Performance Report 2017
45
>Kelantan
Wireless broadband measurements in Kelantan
were conducted in September 2017. Areas covered
were Gua Musang, Kuala Krai, Machang, Tanah
Merah, Kota Bharu, Pasir Mas, Tumpat, Pasir
Puteh and Bachok. Figure 43 illustrates the
Kelantan test points.
Figure 43: Kelantan test points
Based on measurements conducted in Kelantan with concentration of samples around town,
commercial and residential areas, the highest average download throughput was recorded by Maxis
with average speeds of 27.02 Mbps. U Mobile recorded the lowest average download throughput with
Network Performance Report 2017
46
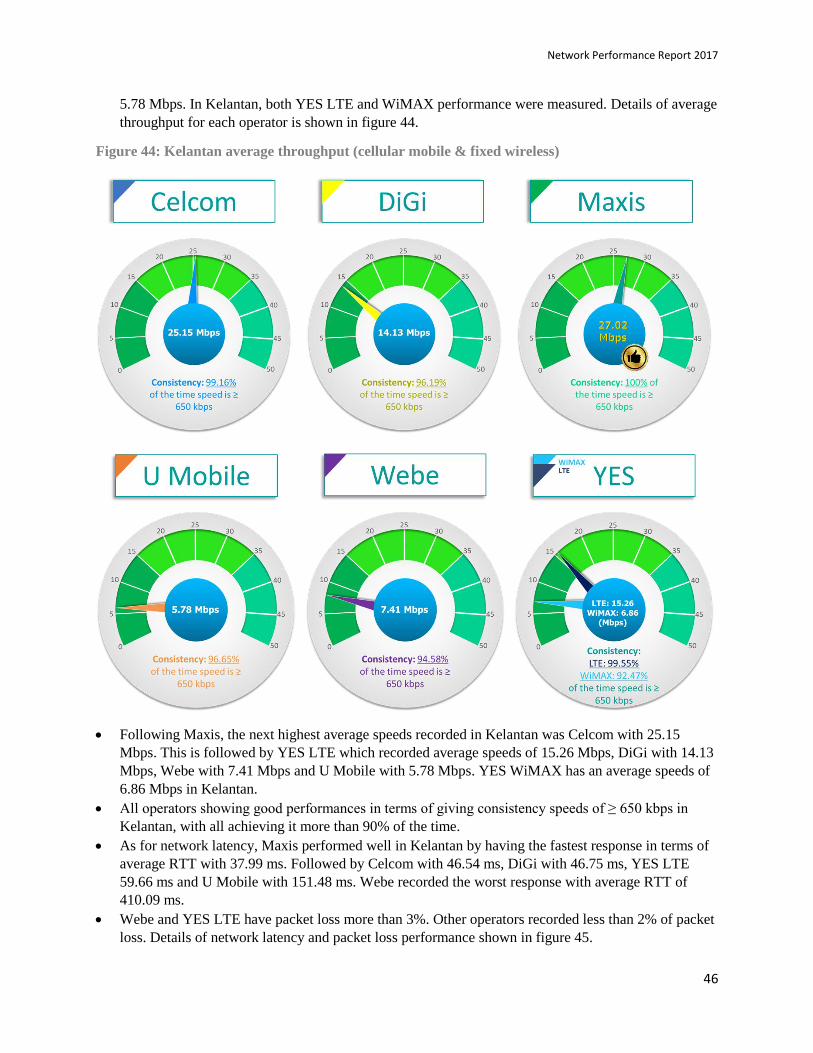
5.78 Mbps. In Kelantan, both YES LTE and WiMAX performance were measured. Details of average
throughput for each operator is shown in figure 44.
Figure 44: Kelantan average throughput (cellular mobile & fixed wireless)
Following Maxis, the next highest average speeds recorded in Kelantan was Celcom with 25.15
Mbps. This is followed by YES LTE which recorded average speeds of 15.26 Mbps, DiGi with 14.13
Mbps, Webe with 7.41 Mbps and U Mobile with 5.78 Mbps. YES WiMAX has an average speeds of
6.86 Mbps in Kelantan.
All operators showing good performances in terms of giving consistency speeds of ≥ 650 kbps in
Kelantan, with all achieving it more than 90% of the time.
As for network latency, Maxis performed well in Kelantan by having the fastest response in terms of
average RTT with 37.99 ms. Followed by Celcom with 46.54 ms, DiGi with 46.75 ms, YES LTE
59.66 ms and U Mobile with 151.48 ms. Webe recorded the worst response with average RTT of
410.09 ms.
Webe and YES LTE have packet loss more than 3%. Other operators recorded less than 2% of packet
loss. Details of network latency and packet loss performance shown in figure 45.

Network Performance Report 2017
47
Figure 45: Kelantan network latency and packet loss performance
Network Performance Report 2017
48
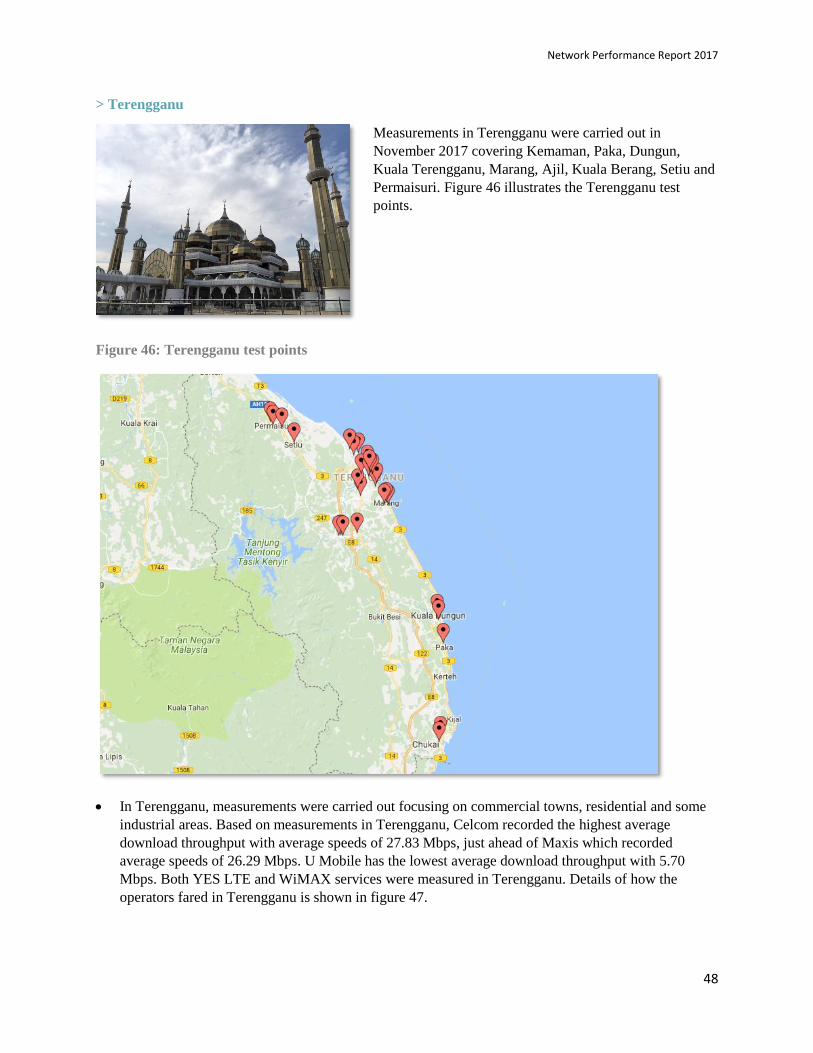
> Terengganu
Measurements in Terengganu were carried out in
November 2017 covering Kemaman, Paka, Dungun,
Kuala Terengganu, Marang, Ajil, Kuala Berang, Setiu and
Permaisuri. Figure 46 illustrates the Terengganu test
points.
Figure 46: Terengganu test points
In Terengganu, measurements were carried out focusing on commercial towns, residential and some
industrial areas. Based on measurements in Terengganu, Celcom recorded the highest average
download throughput with average speeds of 27.83 Mbps, just ahead of Maxis which recorded
average speeds of 26.29 Mbps. U Mobile has the lowest average download throughput with 5.70
Mbps. Both YES LTE and WiMAX services were measured in Terengganu. Details of how the
operators fared in Terengganu is shown in figure 47.

Network Performance Report 2017
49
Figure 47: Terengganu average throughput (cellular mobile & fixed wireless)
DiGi also recorded a commendable average download throughput in Terengganu with 22.04 Mbps,
followed by YES LTE with 12.23 Mbps, Webe with 7.63 Mbps and U Mobile with 5.70 Mbps. YES
WiMAX recorded average speeds of 5.91 Mbps.
All operators showing good performances in terms of giving consistency speeds of ≥ 650 kbps in
Terengganu, with all achieving it more than 90% of the time.
In terms of network latency, Maxis slightly edges DiGi for the fastest response with average packet
RTT of 42.28 ms against DiGi’s 43.17 ms. Nonetheless, both network indicates good performance for
network latency. Results show Webe had the slowest response with average packet RTT of 215.58
ms.
As for packet loss percentage, all operators have packet loss less than 3% except for Webe which
recorded 4.59% of packet loss. Details of network latency and packet loss as shown in figure 48.

Network Performance Report 2017
50
Figure 48: Terengganu network latency and packet loss performance

Network Performance Report 2017
51
3.3.4.2 Eastern region overall analysis:
Average throughput ranking:
Figure 49: Eastern region average throughput performance
Results in eastern region shows that Maxis again, provides the fastest average download
throughput speeds for all states in the region. In average Maxis offers average download speeds
of 26.14 Mbps, followed by Celcom at 23.16 Mbps, DiGi at 16.41 Mbps, Webe at 6.61 Mbps and
U Mobile at 4.99 Mbps. YES recorded an average speed of 6.02 Mbps for its WiMAX service in
eastern region. All service providers able to provide consistent speeds over 650 kbit/s for more
than 80% of the time during the measurement period with Maxis showing the best consistency
amongst the operators with 99.31% of the time throughput is more or equal than 650 kbps.
Network latency ranking:
Overall, eastern region results show Maxis has the fastest response with average RTT of 38.77
ms. Followed by DiGi with average RTT of 40.55 ms, Celcom with 48.14 ms, YES WiMAX
with 124.98 ms, U Mobile with 126.83 ms and Webe with 220.02 ms.
*YES LTE only measured in Kelantan and Terengganu, hence the service performance is not ranked.
Network Performance Report 2017
52
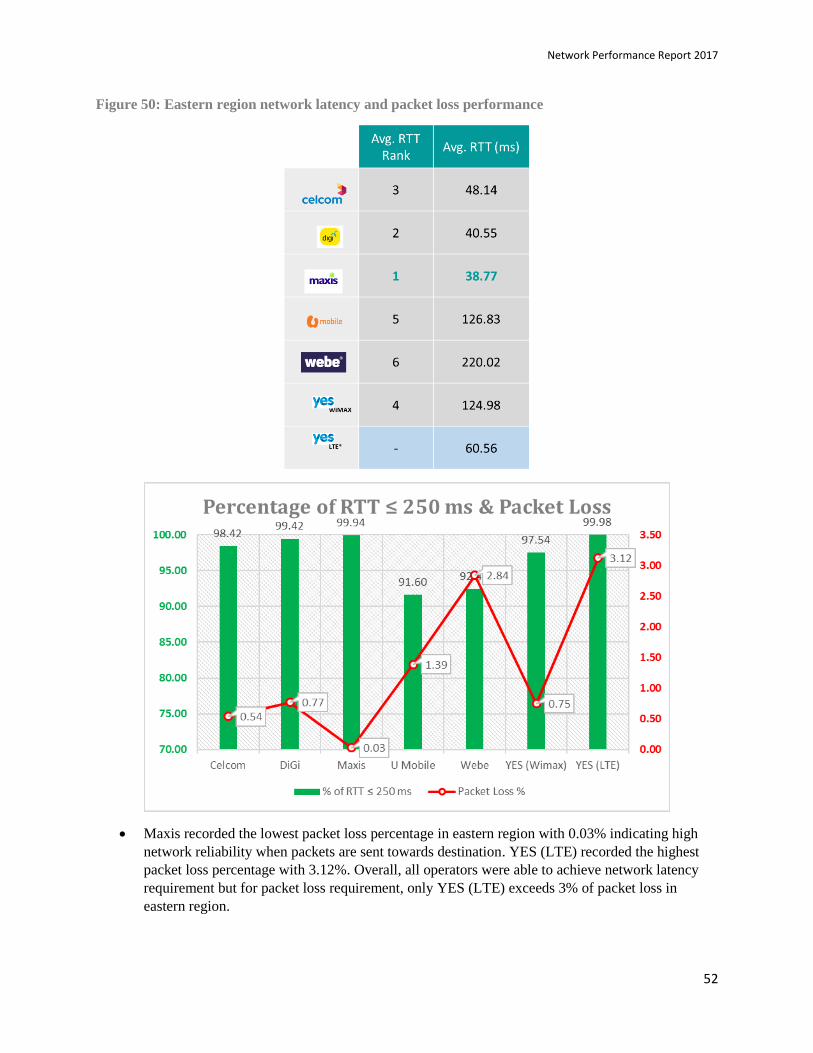
Figure 50: Eastern region network latency and packet loss performance
Maxis recorded the lowest packet loss percentage in eastern region with 0.03% indicating high
network reliability when packets are sent towards destination. YES (LTE) recorded the highest
packet loss percentage with 3.12%. Overall, all operators were able to achieve network latency
requirement but for packet loss requirement, only YES (LTE) exceeds 3% of packet loss in
eastern region.

Network Performance Report 2017
53
3.3.5 Sabah region
Chart below describes the serving technology for the test UE during measurement period in Sabah region.
Figure 51: Mobile broadband serving technology – Sabah Region
Based on measurement conducted in Sabah region, Digi and Maxis test UE were connected to LTE
technology for almost 100% of the measurement, whereby Celcom at 94.4% and Webe at 88.9% in LTE
technology. As for U Mobile, 88.2% of the measurements were in 3G technology. In Sabah, YES LTE
network was deployed in LTE TDD 2600 MHz and due to the limitation of supporting band in the test
UE, no results could be measured for YES LTE. However, measurements for YES WiMAX were
conducted where the service is available.
3.3.5.1 Sabah state analysis
Wireless broadband performance
measurement in Sabah covers Kota
Kinabalu, Tuaran, Kota Belud and Putatan
district. Measurements were carried out in
October 2017. Figure 52 illustrates the test
points in the selected district.
Source image: Google

Network Performance Report 2017
54
Figure 52: Sabah test points
In Sabah, measurements were carried out at selected locations in commercial areas such as shopping
complex, banking institute, and universities, tourist area such Lok Kawi Wildlife Park and Jesselton
Point and also including the residential areas.
Download throughput performance:
Maxis recorded the fastest average download throughput in Sabah with average speeds of 21.68 Mbps
while YES WiMAX recorded the lowest for average download speeds with 6.44 Mbps. Details on
how the operators fared in Sabah is shown in Figure 53.

Network Performance Report 2017
55
Figure 53: Sabah average throughput (cellular mobile & fixed wireless)
Digi stands in second after Maxis for the fastest average download throughput with 9.37 Mbps
although both were mostly in LTE technology during the measurement, Maxis performance was
better. Webe and U Mobile performance was on par with an average download throughput of 8.96
Mbps and 8.66 Mbps respectively. Celcom achieved 7.79 Mbps of average download throughput for
assessment carried out at the selected test locations in Sabah region.
All operators able to deliver download throughput ≥ 650 kbps consistently throughout the
measurements where Digi and Maxis achieved 100% consistency, followed by U Mobile, Webe and
YES WiMAX at 98.13%, 98.76% and 92.88%, while Celcom achieved 80.12% of average download
speed consistency. Figure 54 describes Sabah average download throughput ranking performance.

Network Performance Report 2017
56
Figure 54: Sabah average throughput ranking performance (cellular mobile & fixed wireless)
Results show Maxis have the best download throughput performance in Sabah as Maxis ranked first
in both the average download speed and also in terms of throughput consistency.
Network latency performance
In terms of network latency performance, Digi and Maxis average packet RTT were on par by a
difference of only 0.46 ms. Digi recorded the fastest average RTT with 50.79 ms while Maxis at
51.25 ms. Webe and Celcom RTT performance is 66.50 ms and 68.87 ms respectively, while YES
WiMAX and U Mobile achieved 102.76 ms and 125.40 ms of average packet RTT. Figure 55
describes network latency performance in Sabah.
Figure 55: Sabah network latency performance
Network Performance Report 2017
57
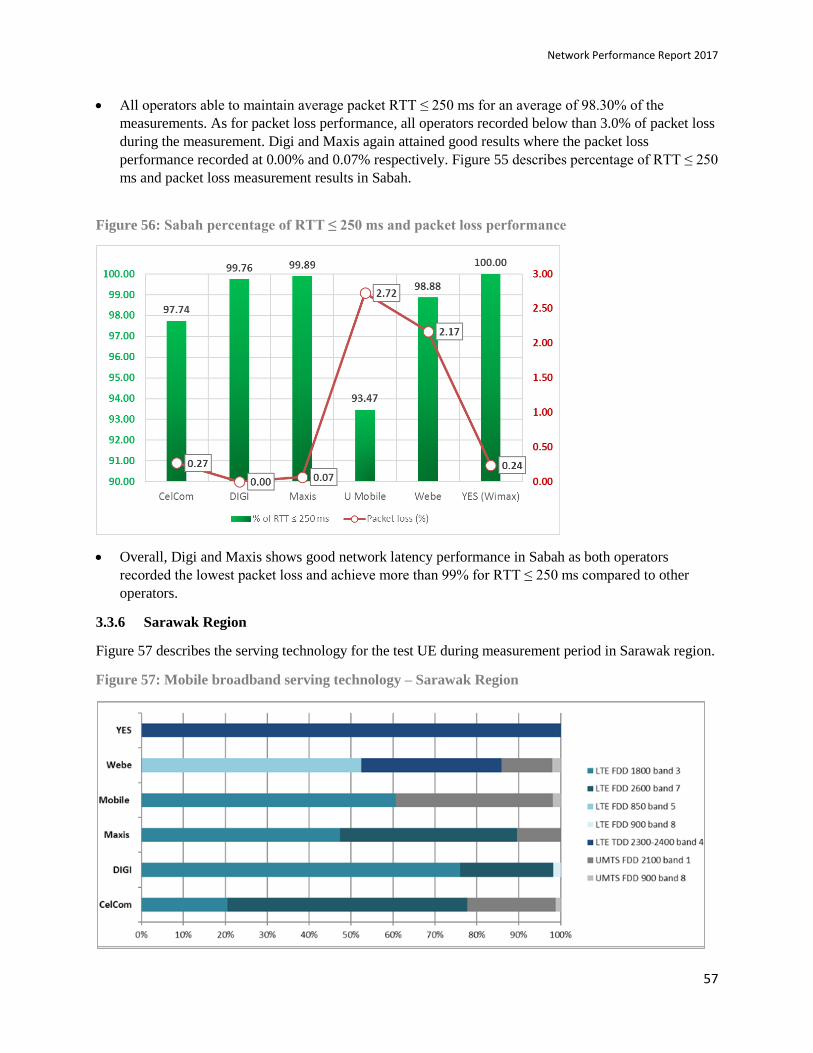
All operators able to maintain average packet RTT ≤ 250 ms for an average of 98.30% of the
measurements. As for packet loss performance, all operators recorded below than 3.0% of packet loss
during the measurement. Digi and Maxis again attained good results where the packet loss
performance recorded at 0.00% and 0.07% respectively. Figure 55 describes percentage of RTT ≤ 250
ms and packet loss measurement results in Sabah.
Figure 56: Sabah percentage of RTT ≤ 250 ms and packet loss performance
Overall, Digi and Maxis shows good network latency performance in Sabah as both operators
recorded the lowest packet loss and achieve more than 99% for RTT ≤ 250 ms compared to other
operators.
3.3.6 Sarawak Region
Figure 57 describes the serving technology for the test UE during measurement period in Sarawak region.
Figure 57: Mobile broadband serving technology – Sarawak Region

Network Performance Report 2017
58
Based on measurements conducted in Sarawak region, Digi and Maxis test UE were connected to LTE
technology for more than 90% of the time during measurement, followed by Webe and Celcom at 85.7%
and 77.8% respectively. More than half of U Mobile measurements were in LTE technology (60.7%) and
100% of YES LTE measurements were connected to the LTE TDD 2300 – 2400 MHz band. No YES
WiMAX service available in Sarawak.
3.3.6.1 Sarawak state analysis
Wireless broadband performance measurement in
Sarawak covers Kuching, Kota Samarahan, Lundu
and Sematan. Measurements were carried out in
September 2017. Figure 58 illustrates the test point
in Sarawak.
Figure 58: Sarawak test points
In Sarawak, measurements were carried out at selected locations comprising commercial, residential,
tourist spot and public access areas such as Kuching International Airport, Palm Beach Resort
Sematan, Kampung Tupong Tengah and UNIMAS.
Source image: Google

Network Performance Report 2017
59
Download throughput performance
Based on the results, Maxis recorded the fastest average download throughput with 26.41 Mbps while
the lowest was Webe with 11.78 Mbps. Details on how the operators fared is shown in Figure 59.
Figure 59: Sarawak average throughput
Digi recorded the second fastest average download throughput after Maxis with 16.93 Mbps,
followed by YES (LTE) and U Mobile with both recording 16.50 Mbps and 15.87 Mbps respectively.
Celcom recorded an average download throughput of 12.42 Mbps.
Maxis and YES (LTE) achieved 100.00% for average download throughput ≥ 650 kbps, while
Celcom, Digi, U Mobile and Webe achieved 99.67%, 99.66%, 99.26% and 97.45% respectively.
Figure 60 illustrates Sarawak average download throughput performance.
Network Performance Report 2017
60
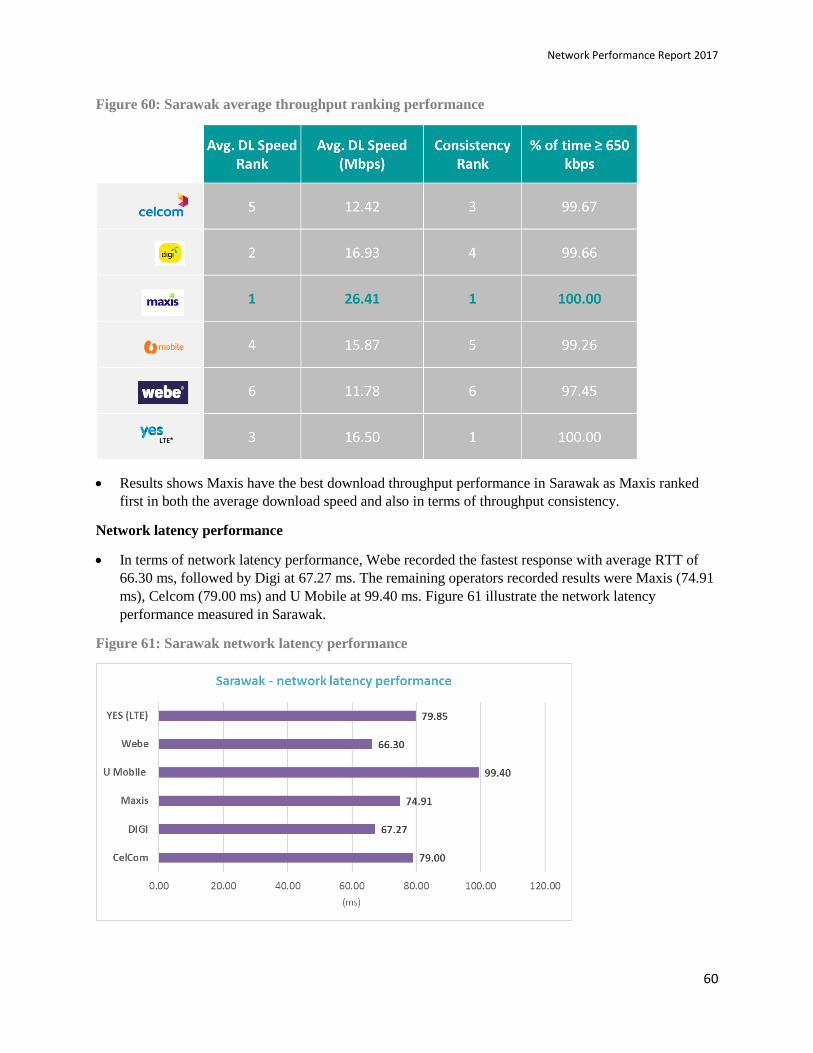
Figure 60: Sarawak average throughput ranking performance
Results shows Maxis have the best download throughput performance in Sarawak as Maxis ranked
first in both the average download speed and also in terms of throughput consistency.
Network latency performance
In terms of network latency performance, Webe recorded the fastest response with average RTT of
66.30 ms, followed by Digi at 67.27 ms. The remaining operators recorded results were Maxis (74.91
ms), Celcom (79.00 ms) and U Mobile at 99.40 ms. Figure 61 illustrate the network latency
performance measured in Sarawak.
Figure 61: Sarawak network latency performance

Network Performance Report 2017
61
All service provider able to maintain the average packet RTT ≤ 250 ms for more than 90% of the time
during measurement, with the best performance at 99.94% recorded by YES (LTE). As for packet
loss, all operators recorded below 3% of packet loss based on the measurement. Figure 62 illustrate
the detail results for percentage of average RTT and packet loss.
Figure 62: Percentage of average RTT ≤ 250 ms and packet loss
Celcom, Digi, Maxis and U Mobile were able to keep packet loss lower than 0.5% and show good
performance on the percentage of packet RTT ≤ 250 ms by more than 95% of the time during
measurements in Sarawak region.
Network Performance Report 2017
62
Section 4
Wired Broadband Performance
4.1 Background
From January to December 2017, MCMC conducted a nationwide wired broadband network performance
measurement based on the Mandatory Standards for Quality of Service (QoS) on Wired Broadband
Services.
A total of 192 locations were selected for the measurement and selection is based on MCMC complaints
portal and Service Providers subscriber’s list. Presentation of the wired broadband result is divided into two
different technologies; copper(DSL) as a last mile and fibre to the home.
4.2 Nationwide overall performance
Figure 63 outlines the overall results of the measurement for the key metrics at an aggregate level across
all regions for wired broadband.
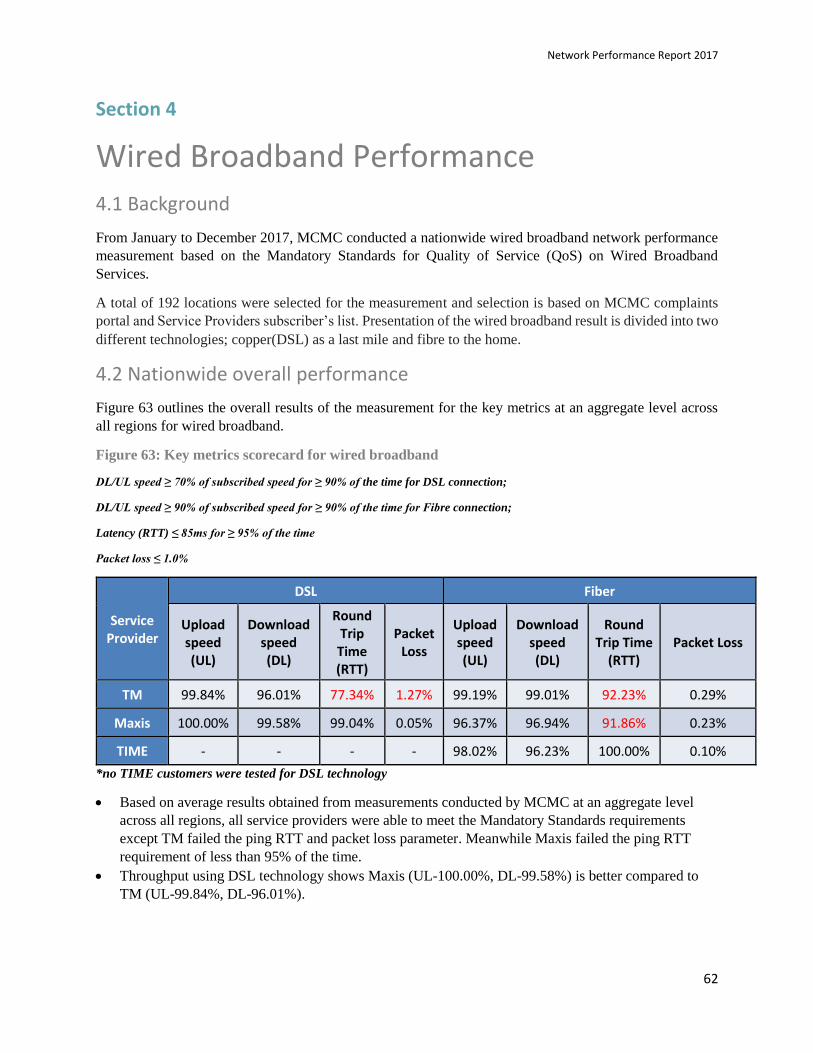
Figure 63: Key metrics scorecard for wired broadband
DL/UL speed ≥ 70% of subscribed speed for ≥ 90% of the time for DSL connection;
DL/UL speed ≥ 90% of subscribed speed for ≥ 90% of the time for Fibre connection;
Latency (RTT) ≤ 85ms for ≥ 95% of the time
Packet loss ≤ 1.0%
Service Provider
DSL Fiber
Upload speed (UL)
Download speed (DL)
Round Trip Time (RTT)
Packet Loss
Upload speed (UL)
Download speed (DL)
Round Trip Time
(RTT) Packet Loss
TM 99.84% 96.01% 77.34% 1.27% 99.19% 99.01% 92.23% 0.29%
Maxis 100.00% 99.58% 99.04% 0.05% 96.37% 96.94% 91.86% 0.23%
TIME - - - - 98.02% 96.23% 100.00% 0.10%
*no TIME customers were tested for DSL technology
Based on average results obtained from measurements conducted by MCMC at an aggregate level
across all regions, all service providers were able to meet the Mandatory Standards requirements
except TM failed the ping RTT and packet loss parameter. Meanwhile Maxis failed the ping RTT
requirement of less than 95% of the time.
Throughput using DSL technology shows Maxis (UL-100.00%, DL-99.58%) is better compared to
TM (UL-99.84%, DL-96.01%).
Network Performance Report 2017
63
For throughput using fiber as a last mile, shows the highest percentage of the time is TM (UL-
99.19%, DL-99.01%) followed by TIME (UL-98.02%, DL-96.23%) and the lowest is Maxis (UL-
96.37%, DL-96.94).
For DSL technology, TM failed to meet the requirement on both RTT and packet loss with recorded
measurement results of 77.34% and 1.27% respectively.
As for fibre, both TM and Maxis unable to meet RTT requirement with recorded measurement results
of 92.23% and 91.86% respectively.
Overall performance shows that TIME, based on its offered package, and measurements done at
consumers’ premises, has better quality and more stable internet connection compared to others, but it
must be noted that TIME only offers fiber type of broadband connection.
4.3 Regional results
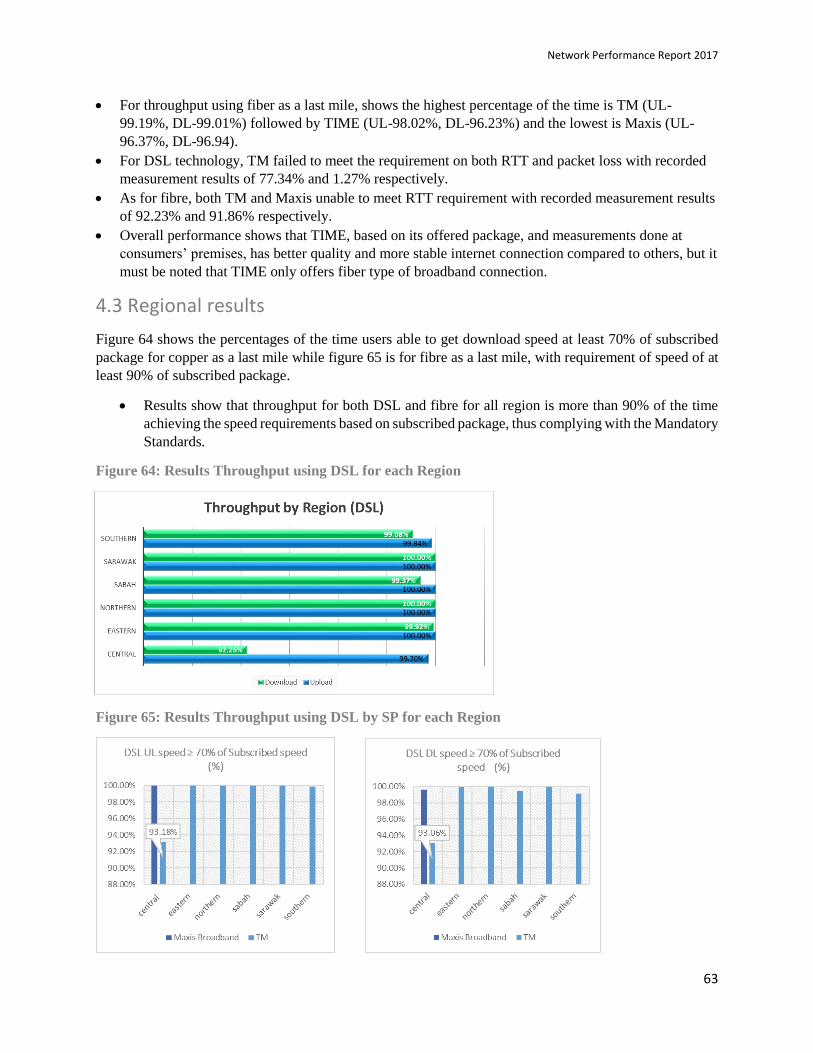
Figure 64 shows the percentages of the time users able to get download speed at least 70% of subscribed
package for copper as a last mile while figure 65 is for fibre as a last mile, with requirement of speed of at
least 90% of subscribed package.
Results show that throughput for both DSL and fibre for all region is more than 90% of the time
achieving the speed requirements based on subscribed package, thus complying with the Mandatory
Standards.
Figure 64: Results Throughput using DSL for each Region
Figure 65: Results Throughput using DSL by SP for each Region
Network Performance Report 2017
64
Figure 65 shows TM exceeds the specified 70% requirement for DSL for all regions. While Maxis only
tested in Central region using DSL as a last mile shows good UL and DL speed results with 100.00%
and 99.62% respectively.
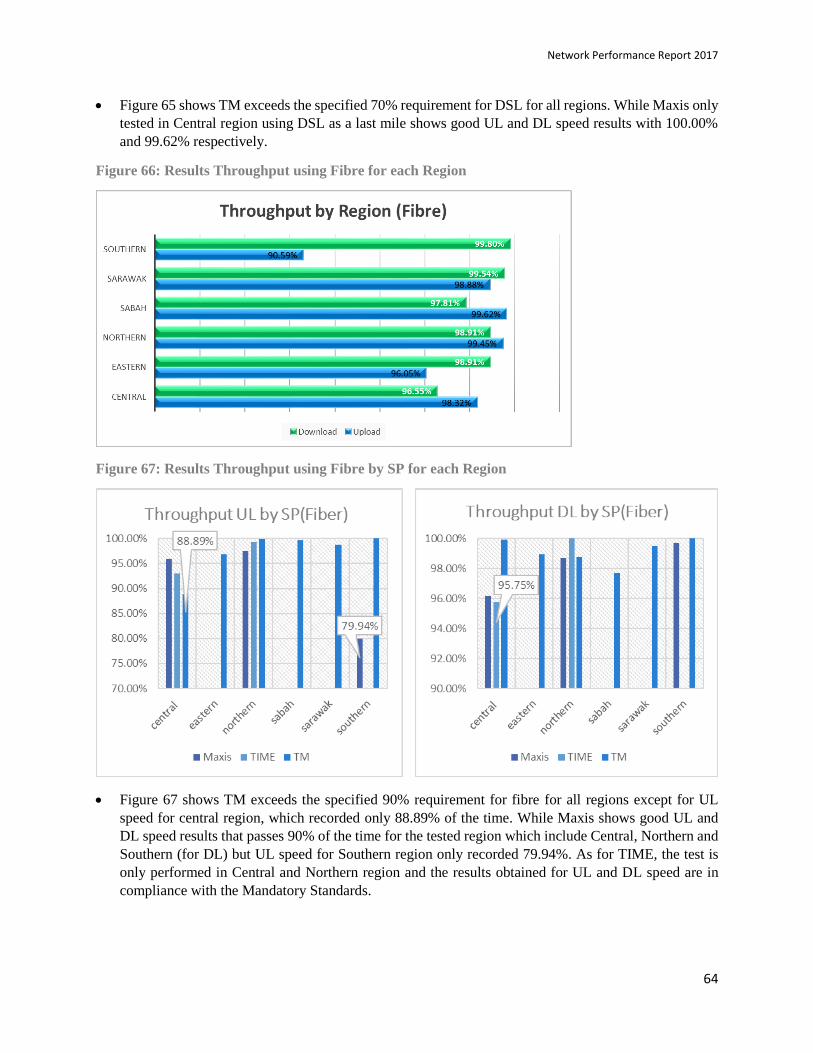
Figure 66: Results Throughput using Fibre for each Region
Figure 67: Results Throughput using Fibre by SP for each Region
Figure 67 shows TM exceeds the specified 90% requirement for fibre for all regions except for UL
speed for central region, which recorded only 88.89% of the time. While Maxis shows good UL and
DL speed results that passes 90% of the time for the tested region which include Central, Northern and
Southern (for DL) but UL speed for Southern region only recorded 79.94%. As for TIME, the test is
only performed in Central and Northern region and the results obtained for UL and DL speed are in
compliance with the Mandatory Standards.

Network Performance Report 2017
65
Figure 68: Results Network Latency for each Region
Figure 68 shows the highest percentage of average RTT ≤ 85 ms is in southern region with 95.54%
while the lowest is in Sarawak region with 81.20%.
For packet loss, lowest packet loss percentage recorded in Sarawak region with 0.05% while the
highest packet loss percentage recorded in central region with 0.66%. This could be contributed by
the number of test location samples difference between both regions.
Figure 69: Results Network Latency using DSL by SP for each Region
The DSL latency graph describes that TM complies with the Mandatory standard for only Sarawak
region but other regions recorded below 95% of the time. Maxis recorded 98.98% in Central region.
Packet loss performance for DSL as a last mile shows that TM complies with the requirements for all
regions except central with a reading of 2.03%. Maxis recorded 0.05% of packet loss for central region.

Network Performance Report 2017
66
Figure 70: Results Network Latency using Fibre by SP for each Region
The fibre latency graph describes that TM complies with the mandatory standards for the Central,
Northern and Southern regions but other regions recorded below 95% of the time with Eastern at
91.74%, Sabah at 83.13% and Sarawak at 84.85%. For Maxis, Southern and Northern recorded
100.00% while Central only at 89.44%. TIME shows 100.00% of the time for the tested locations which
were in Central and Northern regions.
Packet loss performance for fibre as a last mile shows that TM complies with the requirements for all
regions except Southern which recorded 1.33% of packet loss. For Maxis, the areas tested were Central,
Northern and Southern recorded below 1%. While TIME recorded 0% packet loss for Northern region
and 0.11% for Central.
4.4 Results by Speed Subscribed
Results here shows the overall percentage of the time for user to get the download speed at least 70% of
subscribed package for copper as a last mile and as for fibre is at least 90% of subscribed package.
Figure 71: Throughput Performance using Copper as a last mile

Network Performance Report 2017
67
Figure 71 shows that most of the users will experience the speed of at least 70% of the subscribed
package more than 90% of the time, which is in compliance with the Mandatory Standards. Except
for users subscribed to speed packages of 2.0 Mbps and below, specifically for download
throughput, showing that it only achieves 86.51% of the time.
Figure 72: Throughput performance using optical fibre as a last mile
Figure 72 shows that most of the users will experience the speed of at least 90% of the subscribed
package more than 90% of the time, which is in compliance with the Mandatory Standards.
Figure 73: Network latency performance using copper as a last mile
Figure 73 shows the highest percentage of RTT ≤ 85 ms is speed subscribed between 10 to 20Mbps
while the lowest is the speed subscribed between 3 to 4 Mbps. In general, RTT results for all
subscribed speed category failed to meet the requirement which is at least 95% of the time.
For packet loss, users subscribed to speeds between 3 to 4 Mbps and 10 to 20 Mbps recorded
lower packet loss percentage compared to speeds subscribed of 1 to 2 Mbps and 5 to 9 Mbps.
Network Performance Report 2017
68
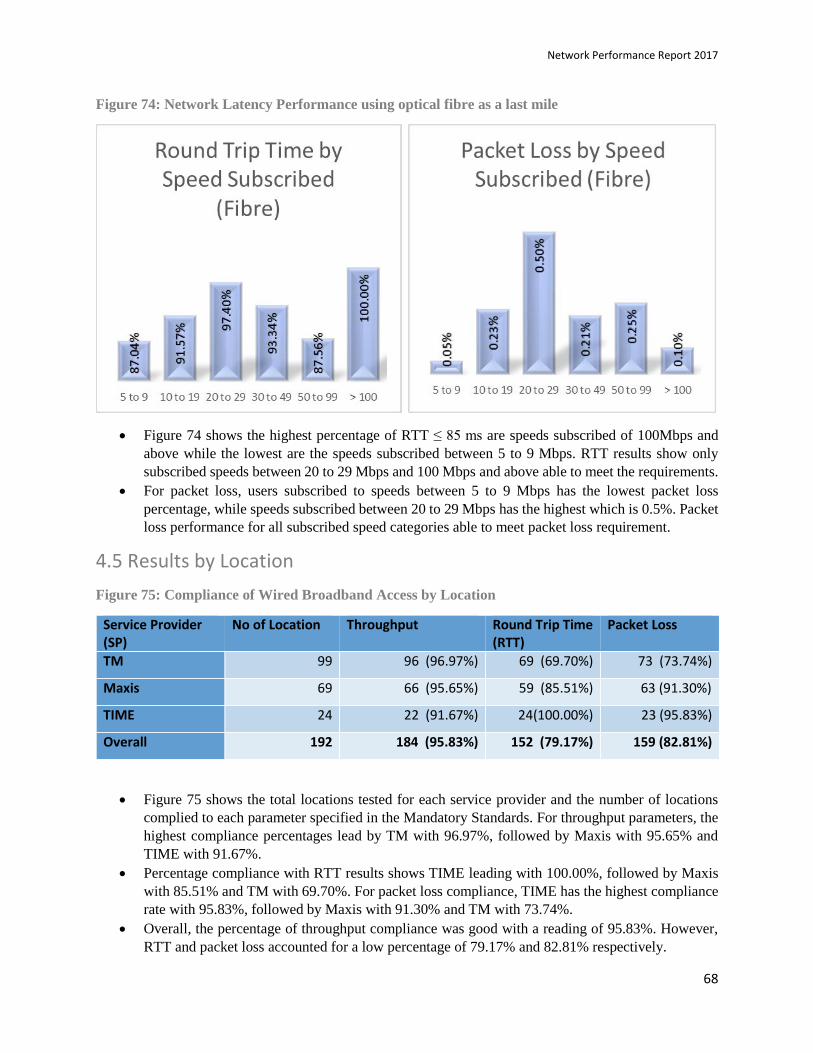
Figure 74: Network Latency Performance using optical fibre as a last mile
Figure 74 shows the highest percentage of RTT ≤ 85 ms are speeds subscribed of 100Mbps and
above while the lowest are the speeds subscribed between 5 to 9 Mbps. RTT results show only
subscribed speeds between 20 to 29 Mbps and 100 Mbps and above able to meet the requirements.
For packet loss, users subscribed to speeds between 5 to 9 Mbps has the lowest packet loss
percentage, while speeds subscribed between 20 to 29 Mbps has the highest which is 0.5%. Packet
loss performance for all subscribed speed categories able to meet packet loss requirement.
4.5 Results by Location
Figure 75: Compliance of Wired Broadband Access by Location
Service Provider (SP)
No of Location Throughput Round Trip Time (RTT)
Packet Loss
TM 99 96 (96.97%) 69 (69.70%) 73 (73.74%)
Maxis 69 66 (95.65%) 59 (85.51%) 63 (91.30%)
TIME 24 22 (91.67%) 24(100.00%) 23 (95.83%)
Overall 192 184 (95.83%) 152 (79.17%) 159 (82.81%)
Figure 75 shows the total locations tested for each service provider and the number of locations
complied to each parameter specified in the Mandatory Standards. For throughput parameters, the
highest compliance percentages lead by TM with 96.97%, followed by Maxis with 95.65% and
TIME with 91.67%.
Percentage compliance with RTT results shows TIME leading with 100.00%, followed by Maxis
with 85.51% and TM with 69.70%. For packet loss compliance, TIME has the highest compliance
rate with 95.83%, followed by Maxis with 91.30% and TM with 73.74%.
Overall, the percentage of throughput compliance was good with a reading of 95.83%. However,
RTT and packet loss accounted for a low percentage of 79.17% and 82.81% respectively.

Network Performance Report 2017
69
Highlights
In general, although the throughput results surpassed the requirements, there are still improvement
needed in terms of network latency and congestions. The results indicate that users are still
experiencing less satisfying browsing experience. This is also in line with the feedback received
during the test conducted at user’s premises.
Issues raised by users include video streaming buffering, required more time to open website
compared to using cellular broadband, online gaming lagging etc. Consumers also informed that
after acquiring the free upgrade offer, they experiencing poor internet performance and claimed the
experience before the free upgrade was better. Test results also show users upgrading packages
from 10 to 20 Mbps and 30 to 50 Mbps getting RTT and packet loss results that are not very good
which could lead to not meeting the required standards.
For rural areas, users who depends on DSL technology, could experience poor quality on RTT
when the distance between user's home to the Access Node is more than 1km. From our test results,
rural areas having poor quality on RTT were Kuala Klawang and Juaseh in Negeri Sembilan,
Jenjarom in Selangor, Bukit Gambir in Johor and Kuala Kangsar in Perak.
Based on feedback while conducting the measurement, consumers at large were still unaware of
the differences between using Ethernet cable and Wi-Fi. Consumers unaware that the ability to surf
the internet using Wi-Fi will be reduced due to distance, obstacles such as walls and also Wi-Fi
signal disruptions from different sources. This problem could be reduced through an extra effort by
service providers when installing equipment at user's premises, to explain about the advantages and
disadvantages of using Wi-Fi.
Apart from that, service provider like TM have also introduced Wi-Fi optimizer application that
can help and provide users with an optimum Wi-Fi method. It is hoped that all service providers
will have the initiative to assist and educate users in using the related broadband devices.
Nowadays, users also tend to use internet more than the ability that the subscribed package could
cater. As an example in one premise, user subscribed to 10 Mbps package have a total of more than
5 devices connected to the internet at the same time. In average each device will only get 2 Mbps
or lower. Users also will experience lower internet speeds if one of the device is a smart TV.
Normally, smart TV will consume at least 8Mbps for full HD resolution display and usually the
balance bandwidth will be shared with the other devices.

Network Performance Report 2017
70
Section 5
Public Cellular Service Performance
5.1 Background
The MCMC conducted quality of services measurement for public cellular services throughout the year
2017. The measurement is conducted to ensure the quality of voice services reaches a satisfactory level to
subscribers based on Mandatory Standards for Quality of Service (Public Cellular Service). Dropped Call
Rate (DCR) and Call Setup Successful Rate (CSSR) were the two main criteria that were monitored and
recorded throughout the cellular test.
The test route selected is mainly on the highways, main road, industrial area, tourist spot, commercial
areas and town ship. Table below shows the test route categories and also the summary of measurements
covered by the MCMC from January to December 2017.
No Category Location Total distance covered
Total hours measurement
1 Designated routes and area
a. Area in Putrajaya b. Area in Cyberjaya c. MEX highway d. KLIA to Subang Airport via
ELITE highway e. Subang Airport to Jalan
Duta via NKVE highway
3,736 km 81 hours
2 Nationwide
a. Northern region (NRO) b. Central region (CRO) c. Eastern region (ERO) d. Southern region (SRO) e. Sabah region (SBRO) f. Sarawak region (SWRO)
a. 9,834 km b. 4,183 km c. 8,380 km d. 4,552km e. 8,433 km f. 4,526 km
a. 250 hours b. 112 hours c. 258 hours d. 122 hours e. 246 hours f. 188 hours
The MCMC has managed to cover about 43,644 km of test routes and 1257 hours of data collection
measured from 13 states in Malaysia. Figure 76 shows the summary of the drive test routes covered.

Network Performance Report 2017
71
Figure 76: Drive test route covered
Northern Region (Perlis, Penang, Kedah, Perak)
Eastern Region (Kelantan, Terengganu, Pahang)

Network Performance Report 2017
72
Central Region (Selangor, Kuala Lumpur, Negeri Sembilan)
Southern Region (Malacca, Johor)

Network Performance Report 2017
73
Sabah Region
Sarawak Region
Network Performance Report 2017
74
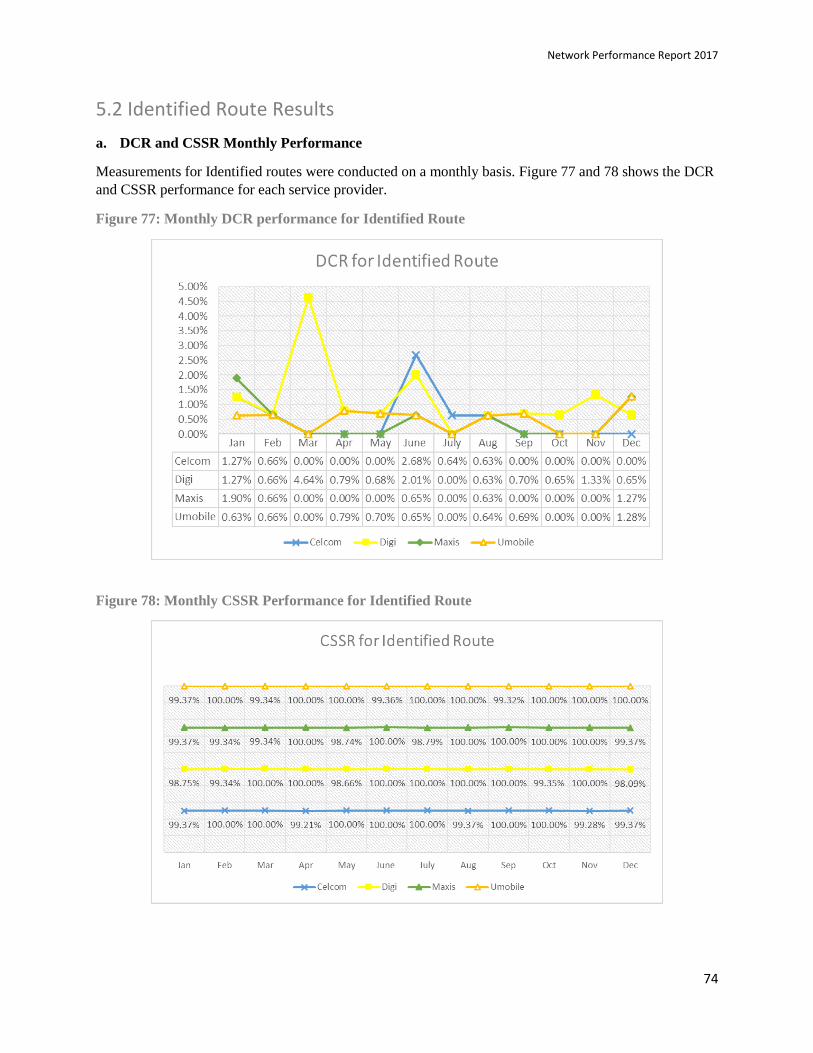
5.2 Identified Route Results
a. DCR and CSSR Monthly Performance
Measurements for Identified routes were conducted on a monthly basis. Figure 77 and 78 shows the DCR
and CSSR performance for each service provider.
Figure 77: Monthly DCR performance for Identified Route
Figure 78: Monthly CSSR Performance for Identified Route

Network Performance Report 2017
75
Celcom and Maxis successfully maintained no dropped calls for seven out of twelve
measurements, followed by U Mobile with four and the least Digi with only one.
Digi recorded DCR above the 2% threshold in March and June, while Celcom in June. Other
service providers able to keep DCR below the 2% during measurement period.
In terms of the CSSR performance, all service providers recorded good performance by achieving
above the 95% threshold each month.
An average of 150 voice calls made during each month of the measurement for every service
provider, with Call Setup Timeout set at 20 seconds to gauge the CSSR and 120 seconds Call
Holding Time for the DCR assessment.
b. Service Provider ranking
Figure 79 and 80 shows the ranking of each service provider based on the overall DCR and CSSR result
from January – December 2017.
Figure 79: Overall DCR performance ranking
Figure 80: Overall CSSR performance ranking

Network Performance Report 2017
76
Figure 79 shows Maxis recorded the lowest percentage of DCR with 0.44%, followed by U
Mobile with 0.50%, and Celcom measured at 0.51%. The highest DCR for identified routes was
Digi with 1.16%.
All service providers recorded the percentage more than 99% of CSSR as illustrated in Figure 80.
U Mobile had the highest CSSR among the operators with 99.78% and Digi has the lowest CSSR
with 99.50%.
c. Final Score
Figure 81 summarized the overall results for each service provider based on the Identified Route
assessment conducted for year 2017.
Figure 81: Summary of identified route performance
Based on the overall results, all four service providers achieved the Mandatory Standard
requirements for Dropped Call Rate (DCR ≤ 2%) and Call Setup Successful Rate (CSSR ≥ 95%)
in year 2017.
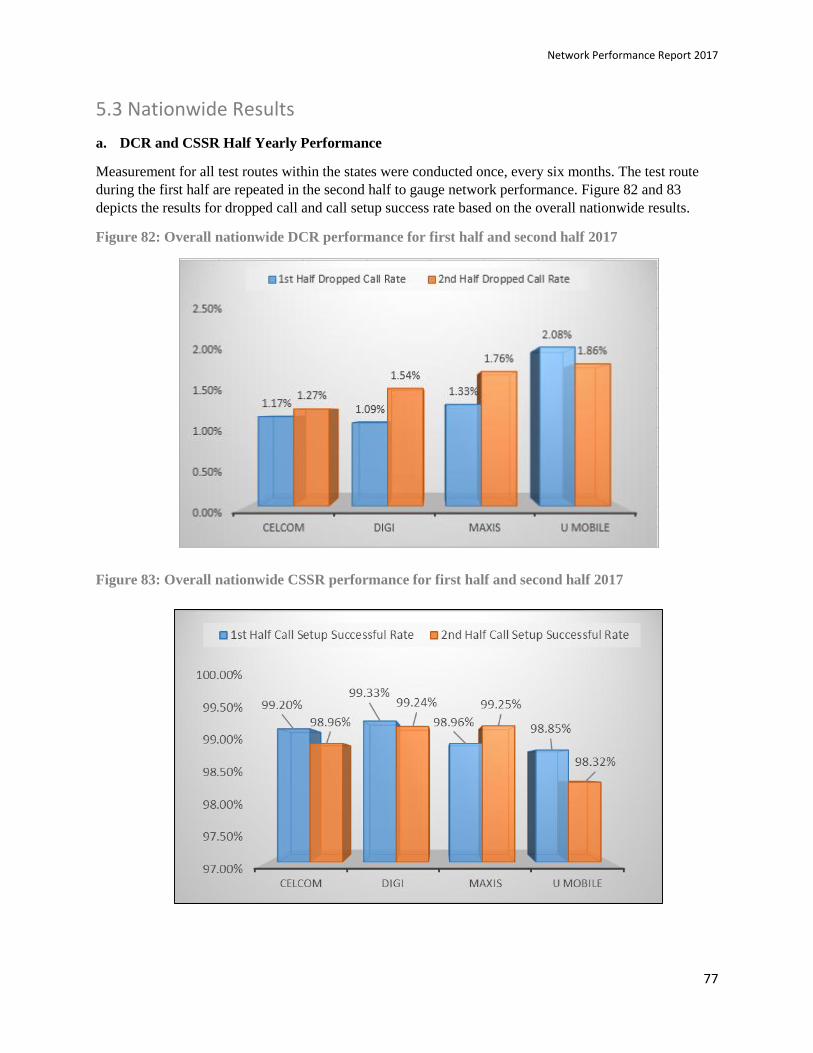
Network Performance Report 2017
77
5.3 Nationwide Results
a. DCR and CSSR Half Yearly Performance
Measurement for all test routes within the states were conducted once, every six months. The test route
during the first half are repeated in the second half to gauge network performance. Figure 82 and 83
depicts the results for dropped call and call setup success rate based on the overall nationwide results.
Figure 82: Overall nationwide DCR performance for first half and second half 2017
Figure 83: Overall nationwide CSSR performance for first half and second half 2017

Network Performance Report 2017
78
All service providers met the 3.0% DCR requirement for both first half and second half of the year
2017. U Mobile showed a slight improvement of 0.22% in the second half of the year whereas
others shown slight degradation.
In terms of CSSR performance, all service providers complied with MS requirement of 95.0%.
Celcom, Digi and U Mobile recorded a slight degradation between 0.09% to 0.53% in the second
half of the year, while Maxis showed an improvement of 0.29% from the first half result.
A total of 18,812 average number of voice calls for each service provider were made for this
assessment, with average of 9,775 voice calls for each service provider in the first half and 9,037
voice calls in the second half.
b. Statistics by Region
Figure 84, 85, 86 and 87 depicts the DCR performance for Celcom, Digi, Maxis and U Mobile in
different region for each half of 2017.
Figure 88, 89, 90 and 91 depicts the CSSR performance for Celcom, Digi, Maxis and U Mobile in different
region for each half of 2017.
Figure 84: Celcom DCR nationwide Figure 85: Digi DCR nationwide
Figure 86: Maxis DCR nationwide Figure 87: U Mobile DCR nationwide

Network Performance Report 2017
79
Figure 92 and 93 shows the overall performance of the dropped call and call setup success rate for
each region.
Figure 88: Celcom CSSR nationwide Figure 89: Digi CSSR nationwide
Figure 90: Maxis CSSR nationwide Figure 91: UMobile CSSR nationwide

Network Performance Report 2017
80
Figure 92: DCR overall results per region
Figure 93: CSSR overall results per region
For overall performance, all service providers achieved the required performance for both DCR
and CSSR in all region for year 2017.
Sabah recorded the highest average percentage of DCR amongst the four service providers with
2.24%. Meanwhile, Sarawak region showed the lowest average DCR with 0.62%.
Celcom revealed the lowest DCR results in four regions (Northern, Central, Eastern, Southern)
compared to other service providers. Maxis recorded the best DCR performance in Sabah and
Sarawak.

Network Performance Report 2017
81
The CSSR results indicated all service providers meet the requirement of 95% of CSSR for year
2017. Sarawak region recorded the highest average CSSR with 99.64% followed by Central
region with 99.24%.
Digi performed the best in four regions (Eastern, Southern, Sabah and Sarawak) for the CSSR
performance, followed by Maxis in Northern region and U Mobile in Central.
However, U Mobile recorded the lowest CSSR in five regions (Northern, Eastern, Southern,
Sabah and Sarawak) while Maxis in Central region.
c. Service Provider ranking
Figure 94 and 95 shows the ranking of service provider based on the nationwide assessment on
CSSR and DCR conducted from January to December 2017.
Figure 94: Nationwide DCR ranking
Figure 95: Nationwide CSSR ranking
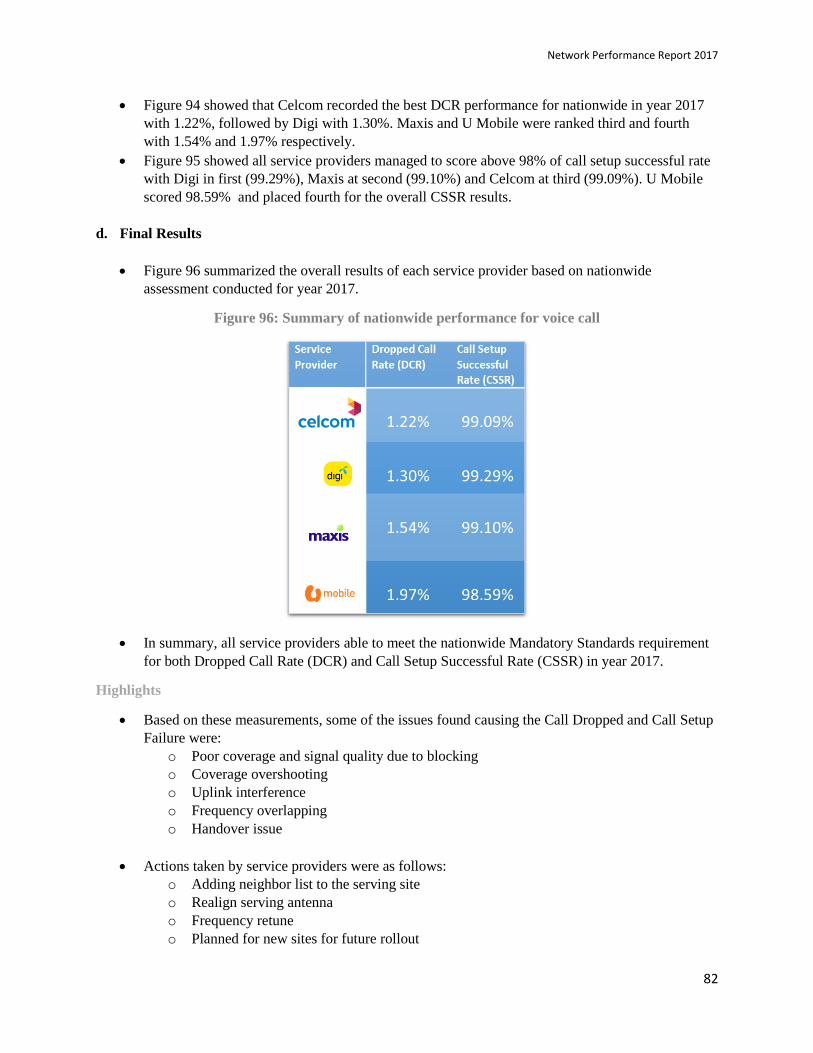
Network Performance Report 2017
82
Figure 94 showed that Celcom recorded the best DCR performance for nationwide in year 2017
with 1.22%, followed by Digi with 1.30%. Maxis and U Mobile were ranked third and fourth
with 1.54% and 1.97% respectively.
Figure 95 showed all service providers managed to score above 98% of call setup successful rate
with Digi in first (99.29%), Maxis at second (99.10%) and Celcom at third (99.09%). U Mobile
scored 98.59% and placed fourth for the overall CSSR results.
d. Final Results
Figure 96 summarized the overall results of each service provider based on nationwide
assessment conducted for year 2017.
Figure 96: Summary of nationwide performance for voice call
In summary, all service providers able to meet the nationwide Mandatory Standards requirement
for both Dropped Call Rate (DCR) and Call Setup Successful Rate (CSSR) in year 2017.
Highlights
Based on these measurements, some of the issues found causing the Call Dropped and Call Setup
Failure were:
o Poor coverage and signal quality due to blocking
o Coverage overshooting
o Uplink interference
o Frequency overlapping
o Handover issue
Actions taken by service providers were as follows:
o Adding neighbor list to the serving site
o Realign serving antenna
o Frequency retune
o Planned for new sites for future rollout

Network Performance Report 2017
83
Section 6
Conclusion Results presented in this report provide insights on how the service providers fared during the 2017
measurement period. Overall, the network performance on both wireless broadband and cellular voice call
services are satisfactory. While the network performance on wired broadband have much room for
improvement.
In general, service providers providing wireless broadband able to cater for download speeds above 650
kbps consistently in areas being measured nationwide. For areas requiring improvement, the related
service providers are expected to make network improvements for sites serving the areas concerned.
Maxis topped the throughput charts for all regions. Displaying dominant performance in terms of
providing fast internet speeds in all the measured areas. Network latency results have shown that DiGi
had the fastest response in four (Central, Southern, Northern & Sabah) out of the six regions measured.
While both Celcom and Maxis have lowest packet loss percentage in two regions each. Average
nationwide download throughput for mobile broadband in all regions is 15.50 Mbps.
Overall wired broadband performance shows that service providers able to provide the required
throughput based on the speed package subscribed by consumers in all regions. But network latency
performance is still the main concern, with measurement results showing TM unable to achieve required
latency standards in five regions (Central, Southern, Northern, Eastern & Sabah) for DSL and in three
regions (Eastern, Sabah & Sarawak) for fibre services. Maxis home broadband service utilizing fibre
which is leased from TM also did not meet the required latency standards in central region. Penalty for
non-compliance of the mandatory standards based on the 2017 wired broadband results may be issued to
the relevant service providers.
In terms of successfully establishing and maintaining a cellular voice call, all mobile operators showing
satisfactory results with average call setup success rate above 97% and dropped call rate below 3% in all
regions. Maxis had the lowest dropped call rate in identified routes, while Celcom recorded the lowest
dropped call rate nationwide.
The MCMC will embark on another nationwide network performance measurement in 2018 with
minimum requirement for wireless broadband speed is set at 1 Mbps as specified in the MS for QoS on
Wireless Broadband Services. Other parameters for all services including wired broadband and voice will
remain, whereas the MCMC may from time to time conduct additional test of web browsing - http, to
simulate customer’s experience for the purpose of additional analysis.

Network Performance Report 2017
84
FAQ
Broadband
1. How does MCMC measure the wireless broadband network performance?
MCMC is using an LTE capable smartphone installed with measurement software to capture the
measurement data. Measurement is conducted while stationary at selected locations confirming to the
requirement in guidelines for wireless broadband access service. Test file will be downloaded from
MCMC server in MyIX to the smartphone to measure download speeds, while a packet of 64 bytes
will be sent to a destination host in MyIX to measure the network latency and packet loss.
2. What is the criteria of the test locations for wireless broadband?
The identified test locations are set based on one of the followings:
i. Confirmation from the wireless broadband Service Provider (SP)
ii. SP coverage information as advertised in website
iii. Through signal indicator level on smartphone with minimum 3 bars or -90 dBm
iv. MCMC complaint portal
3. Why MCMC only measures the download throughput for wireless broadband?
Most of the mobile broadband network connections were designed to support more download
activities compared to upload since majority of consumers online behaviour involves downloading of
data from the server or host to the mobile user – such as streaming, loading web pages and getting
news feed from social media platforms.
4. What are the differences between MCMC network performance data and other report
published by independent party such as Ookla, Opensignal, Akamai, etc?
MCMC practices measurement in a controlled environment to gauge real network capabilities without
disturbances from any third party that may cause the results to be inaccurate. While maintaining the
controlled test environment, the test configuration itself was developed to represent normal user
experience when using their devices. Factors such as network failure due to issues out of SPs control,
user device issues, user data quota exceeded and user extreme usage behaviour – multiple devices;
more than subscribed package could cater, could be prevented when producing the measurement data.
Indirectly MCMC test measurement results takes into account both network capacity and user
behaviour requirements.
As for the independent party published report such as Ookla and Opensignal, they developed their
own crowdsourced application allowing the users to download and perform network speed test. The
users will then be able to see the network performance for their particular service provider, and in
returned the developer will also have all their results collected on a large scale but not in a controlled
environment as mentioned above.
Another independent party such as Akamai who is offering Content Delivery Network (CDN)
services mostly to service providers and content developers collected their enormous data on many
metrics passively, including internet connection speeds and traffic patterns through their servers
across the world. However, the issue resides in the sample size as the connection speed and other
metrics were measured based on the size of the content accessed in the CDN servers. Connection to
download smaller size may be short-lived enough that they do not reach maximum throughput rates.

Network Performance Report 2017
85
5. What are the technologies measured for the wireless broadband performance report?
To simulate real user experience when using smartphone, the best available technology for each
service provider at that particular test point will be taken for measurement. However, only locations
that have a minimum of 3G connectivity will be measured. 2G technology (GSM network) was not
designed for mobile data services. Service provider with an LTE network will have an advantage on
the results over 3G. This indirectly promotes service provider to further deploy LTE networks across
Malaysia and provide better performance to their subscribers.
6. What can impact the performance of the wireless network?
There are range of factors that can impact network performance from time to time. The loads on the
network, i.e how many people using the same network at once will greatly impact network
performance as wireless network operate on a shared resource.
The type of device a user uses also plays a role in the performance of mobile network. Latest high end
smartphone nowadays supports LTE-Advanced (LTE-A) features, and one of the major advantage for
LTE-A is the Carrier Aggregation (CA). Carrier aggregation allows combination of multiple
frequency to provide 2-3 times faster throughput compared to the normal LTE network.
The service providers regularly need to maintain and optimize their networks since technology
evolved very often and every equipment have their own lifespan. Things like external interference,
hardware upgrade, frequency re-farming and adding new site will cause downtime to the area
involved impacting network performance.
7. I am able to get 10Mbps download speed from the Speedtest apps, but why am I still
experiencing slow browsing and video streaming?
Results from the Speedtest apps were measured between the mobile device to the nearest Speedtest
server (automatic server selection). If the user conducting Speedtest located in Malaysia, high chances
that the test server selected will also be in Malaysia. When a user in Malaysia is browsing websites or
watching video streaming, the data transmitted from the host; where the website or video content
resides, does not always be in Malaysia, it may also be hosted outside Malaysia. There could be
network congestion outside Malaysia internet exchange gateway or even submarine cable fault that
connects to other region internet exchange, which is beyond the service provider jurisdiction.
Furthermore, too many users accessing the same content can also cause slow browsing or buffering
videos if the host servers are not able to cater for high number of users.
8. What is the difference between DSL and Fibre technology?
DSL is a wireline transmission technology that transmits data over traditional copper telephone lines
already installed in homes and businesses while fiber technology transmits data over fiber optic
cables from system/access node to the user premise.
9. Why using fibre optic as a last mile is better compared to copper connection?
Fibre optic harnesses the speed, clarity and power of light compared to copper which makes use of
frequencies to transmit digital signals, in the range of 25 kHz to 1.5 MHz and the quality varies due to
a number of factors including network configuration, line quality and length.
10. Why in suburban or rural areas the offered wired broadband package are mostly at lower
speed packages e.g. 1 or 2 Mbps only?
Normally population in suburban/rural area is scattered and have a distance apart from each other.

Network Performance Report 2017
86
Therefore, the DSL technology available in the areas are less likely to offer high speed packages due
to the distance (maximum distance from the access node to the user is not more than 3KM subject to
the cooper quality).
11. Why during downloading files the transfer rate shows only 1.2 MBps but the package
subscribed is 10 Mbps?
Mbps is Megabits per second and MBps is MegaBytes per second. Bits and Bytes is a different unit. 1
byte is equal to 8 bits. Normally connection speed (download and upload) will be displayed in bit per
second (bps), but for downloading or transferring files is in Byte per second (Bps). Therefore, 1.2
Mbps is equal to 9.6 Mbps.
12. Why video streaming using Wi-Fi in bedroom is buffering but streaming in living room is
good?
The performance of the WiFi routers can degrade due to various factors as follows:
a. Distance
The further you are from your WiFi router, the weaker the WiFi signal will be.
i. Place your WiFi router near to the area where you usually surf the internet.
ii. If your WiFi router is fixed, get a WiFi extender to extend your WiFi coverage.
b. Obstruction
Physical obstructions like thick walls, mirrors, glass or solid objects can affect your WiFi signal
strength
i. Place your WiFi router in an open area away from obstructions to reduce risk of physical
interference.
ii. Avoid placing your Wi-Fi router in a closed cabinet, secluded room or under the staircase.
iii. Place your Wi-Fi router to high place at least 0.6 meter or 2 feet from the floor
c. Heat
Electronic devices including your WiFi router will be less efficient when it's overheating.
i. Place your WiFi router in well-ventilated area to allow heat disperse.
ii. Don’t stack your broadband equipment on top of each other.
d. Electromagnetic Interference
Home appliances that generate electromagnetic interference can interfere with your WiFi
connectivity.
i. Place your WiFi router away from microwave ovens and refrigerators to reduce the risk of
electromagnetic interference.
ii. Avoid sharing the same power socket used for your WiFi router with these types of home
appliances.
13. What is contention ratio?
Contention ratio refers to the maximum number of users could share the same bandwidth. As an
example, a contention ratio of 20:1 means the bandwidth is shared with 19 other subscribers at one
time. The lower contention ratio will have better performance.

Network Performance Report 2017
87
Public Cellular Service
14. How does MCMC measure the voice call performance?
MCMC is using the UE (test phone) installed with dedicated software and tests carried out while
moving (drive test) and stationary (static test). The test call number will be a switch terminating
number i.e the test will only measure the call set up success rate (CSSR) and dropped call rates of the
mobile originating call (Calling Party) network. This is to attain accurate data of the performance of
the calling party network while avoiding failure caused by mobile terminating (Called Party).
15. What is the criteria of the chosen route or test location?
The test is to be carried out along routes or locations that have been ascertained to have cellular
coverage. The coverage ascertained by:
Confirmation from the public cellular service provider;
Through the coverage information advertised by the Public Cellular Service Providers; or
Through the network indicator display on the test phone
16. What is a "dropped call?"
Dropped calls occur when a phone conversation is cut off either on originating call end (calling party)
or from the terminating end (called party).
17. What are the causes of dropped calls?
Among the causes are:
• Caller moves into an area which has no signal or coverage sometimes also known as blind spots;
• Interference created from re-use of frequencies;
• Faulty hardware in base station or transmission equipment;
• Disconnected due to inability of devices to sustain weak signal from base station to base station
(call handover failure)
18. Does it have anything to do with the quality/ type of the mobile phone?
Yes, some phones are better than others. E.g. Where the mobile phone antenna is located on/within
the device may sometimes influence the quality of the call.
Complaint
19. How do the public lodge a report on broadband issues and dropped calls?
The public is encouraged to report occurrence of broadband issues and dropped calls to MCMC at Aduan SKMM Portal : http://aduan.skmm.gov.my/ or call 1-800-888-030