network visualization: fine-tuning layout techniques for different types of networks
TRANSCRIPT

Network visualization: Fine-tuning
layout techniques for different types of
networks
Nees Jan van Eck and Ludo Waltman
Centre for Science and Technology Studies (CWTS), Leiden University
Fifth International Workshop on Social Network Analysis (ARS'15)
Capri, Italy, April 30, 2015
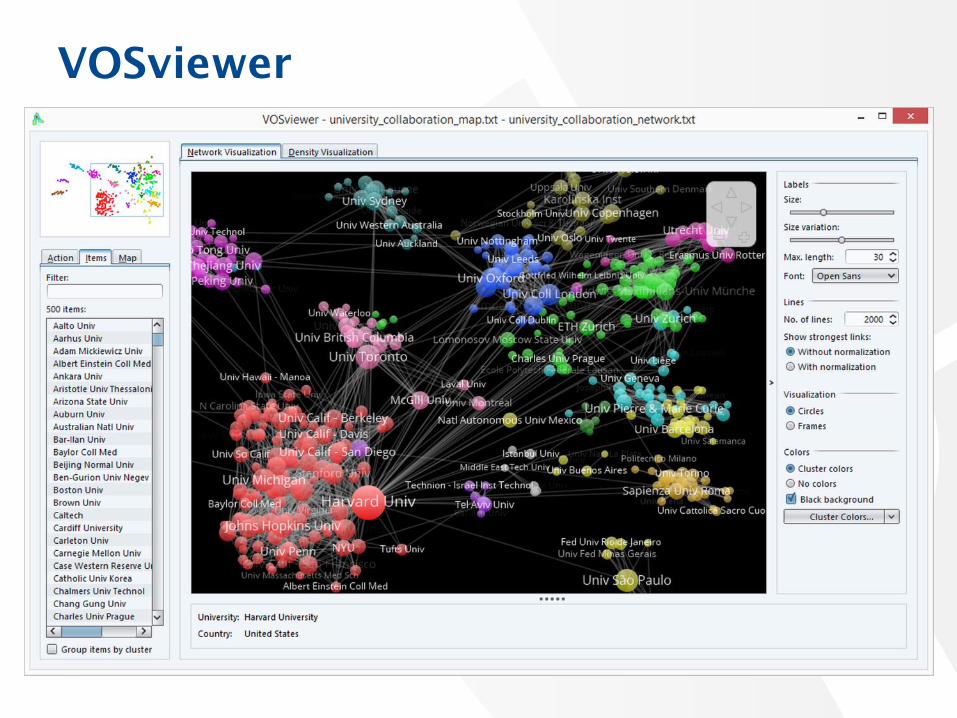
VOSviewer
1

Example
2

Layout problem
• How to position the nodes of a network in a 2D
space in an attractive way?
• What do we mean by ‘attractive’?
– Related nodes are located close to each other
– Groups of related nodes are clustered together
– Sufficient empty space between nodes; no overlapping nodes
– ...
• Attractiveness may depend on:
– Type of visualization (static vs. interactive)
– Type of network (small vs. large; sparse vs. dense)
3

VOS (visualization of similarities)
layout technique
• Quality function to be minimized:
xi: Location of node i in 2D space
aij: Weight of edge between nodes i and j
α and β: Attraction and repulsion parameters (α > β)
• Traditional VOS layout technique is obtained by
setting α = 2 and β = 1
• Technique similar to LinLog (Noack, 2009) is
obtained by setting α = 1 and β = 0
4
ji
β
ji
ji
α
jiijn
βa
αQ xxxxxx
11),,(
1
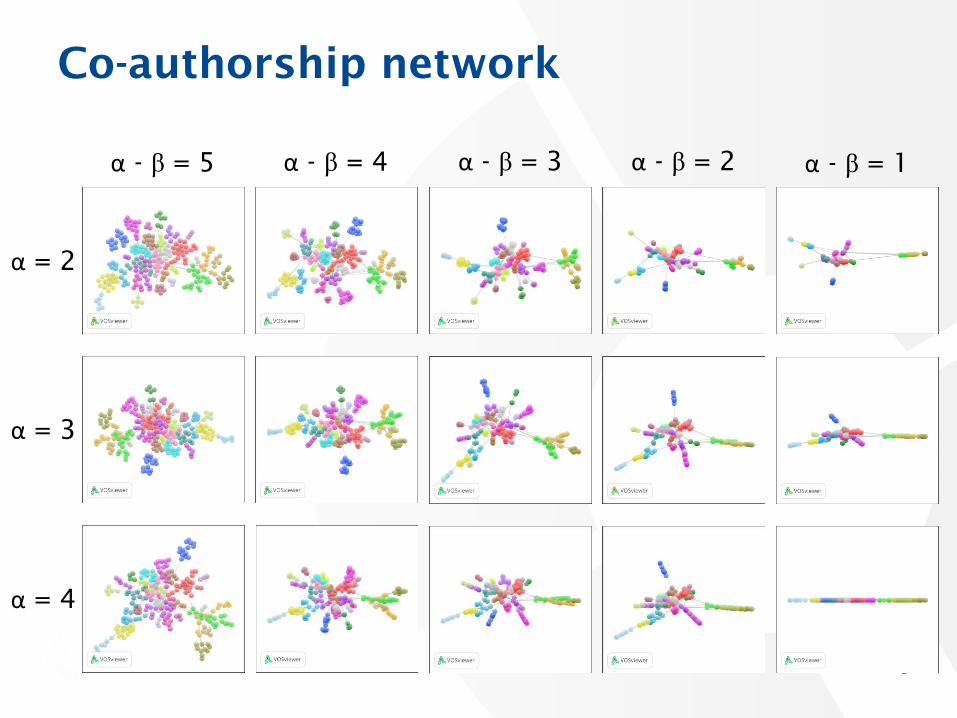
Co-authorship network
5
α = 2
α = 3
α = 4
α - β = 5 α - β = 4 α - β = 3 α - β = 2 α - β = 1
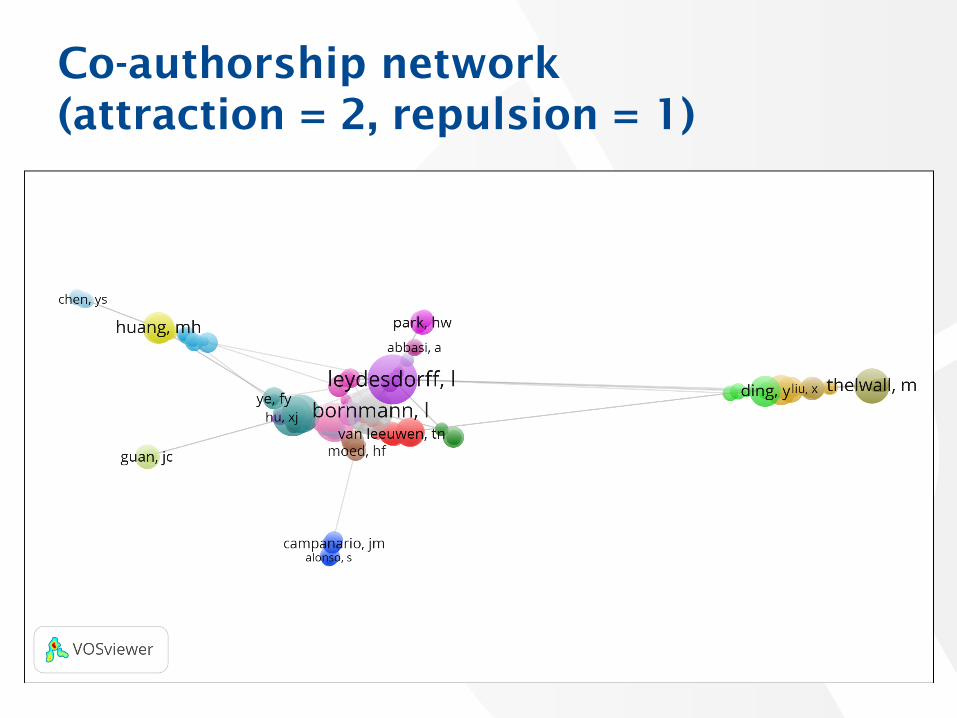
Co-authorship network
(attraction = 2, repulsion = 1)
6

Co-authorship network
(attraction = 2, repulsion = 0)
7

Co-authorship network
(attraction = 2, repulsion = -1)
8
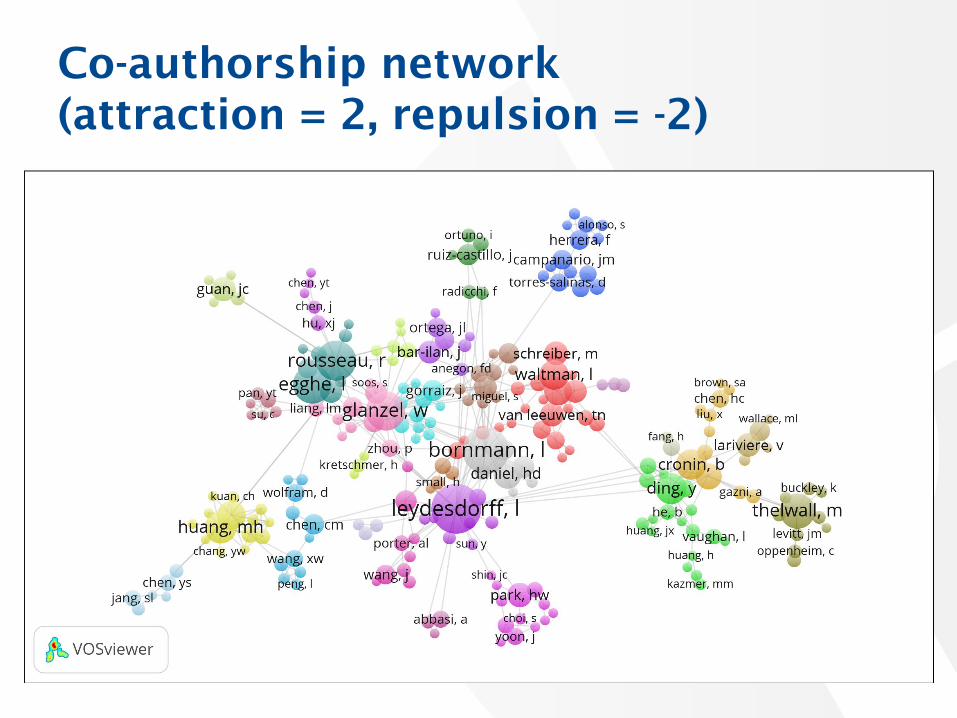
Co-authorship network
(attraction = 2, repulsion = -2)
9
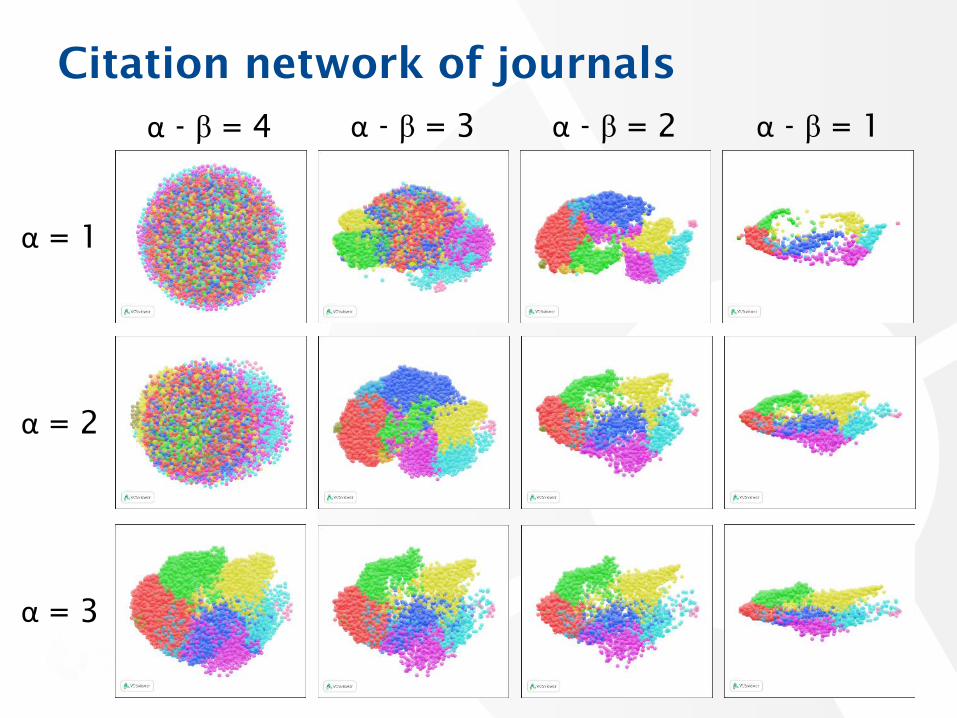
Citation network of journals
10
α = 1
α = 2
α = 3
α - β = 4 α - β = 3 α - β = 2 α - β = 1

Citation network of journals
(attraction = 2, repulsion = 1)
11
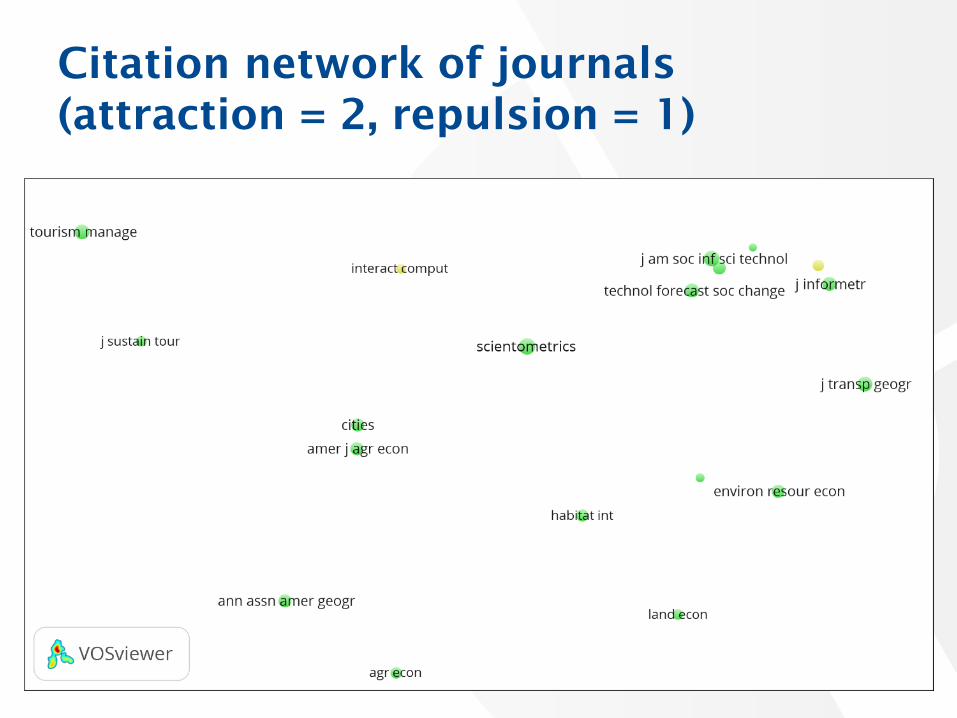
Citation network of journals
(attraction = 2, repulsion = 1)
12
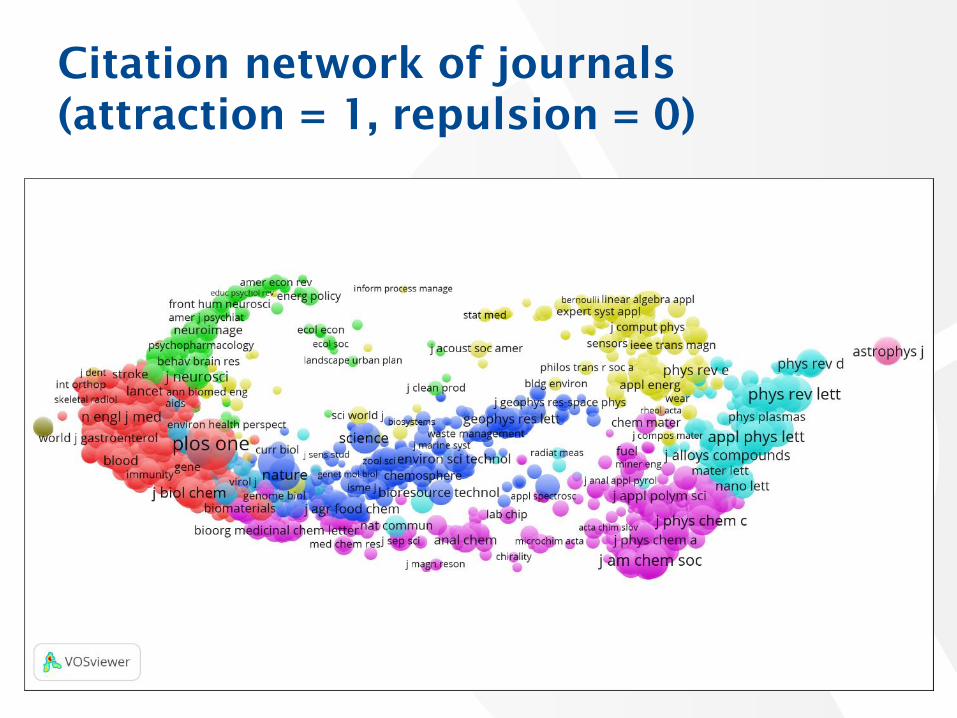
Citation network of journals
(attraction = 1, repulsion = 0)
13

Citation network of journals
(attraction = 1, repulsion = 0)
14

Citation network of journals
(attraction = 1, repulsion = 0)
15

Systematic layout comparison using a
meta criterion
• Meta criterion of Chen and Buja (2009) can be used
to set the attraction and repulsion parameters:
1. For each node, select the k most strongly related nodes
2. For each node, select the k nearest neighbors in the 2D space
3. Calculate the overlap of the two sets of nodes
4. Meta criterion equals the sum of the overlap over all nodes
• We set k = 25
16

Network data
• Bibliometric networks:
– Co-authorship networks
– Citation networks
– Co-citation networks
– Bibliographic coupling networks
– Co-occurrence networks
• Other networks:
– Zachary's karate club
– Les Miserables
– American College football
– Dolphin social network
– US political books
– Power grid
17

Optimal attraction and repulsion
values according to meta criterion
18
Network Attraction Repulsion
Author bib. coup. 1 0
Author cocitation 1 0
Journal citation 1 0
Journal cocitation 1 1 0
Journal cocitation 2 1 0
Term cooccurrence 1 0
Univ. coauthorship 1 0
Publication citation 1 -1
Author coauthorship 1 -3
Network Attraction Repulsion
Football 1 0
Dolphins 1 -1
Les Miserables 1 -1
Political books 1 -1
Power grid 1 -1
Karate club 1 -4
Conclusions
• Attraction = 2 and repulsion = 1 (default values)
usually work reasonably well both for static and for
interactive visualization
• Attraction = 1 and repulsion = 0 (LinLog) often yield
best layout for interactive visualization
• Very sparse networks (e.g., co-authorship) may
benefit from a negative repulsion
• Low repulsion leads to more uniform and less
clustered layouts, which may be attractive for static
visualization
19

Thank you for your attention!
20
References
Chen, L.S., & Buja, A. (2009). Local multidimensional scaling for
nonlinear dimension reduction, graph drawing, and proximity
analysis. Journal of the American Statistical Association, 104(485),
209–219. http://dx.doi.org/10.1198/jasa.2009.0111
Noack, A. (2009). Modularity clustering is force-directed layout. Physical
Review E, 79(2), 026102.
http://dx.doi.org/10.1103/PhysRevE.79.026102
Van Eck, N.J., & Waltman, L. (2010). Software survey: VOSviewer, a
computer program for bibliometric mapping. Scientometrics, 84(2),
523-538. http://dx.doi.org/10.1007/s11192-009-0146-3
Van Eck, N.J., Waltman, L., Dekker, R., & Van den Berg, J. (2010). A
comparison of two techniques for bibliometric mapping:
Multidimensional scaling and VOS. JASIST, 61(12), 2405–2416.
http://dx.doi.org/10.1002/asi.21421
21

Network statistics
22
NetworkNo.
nodes
No.
edgesDensity
Avg.
degree
St. dev.
degreeRadius Diameter
Avg.
path
length
Avg.
clustering
coefficient
Global
clustering
coefficient
Author bib. coup. 174 11739 0.780 134.93 34.38 2 3 1.22 0.89 0.72
Author coauthorship 242 562 0.019 4.64 4.07 6 12 4.87 0.56 0.17
Author cocitation 552 49090 0.323 177.86 86.24 2 3 1.68 0.58 0.27
Journal citation 5000 1155096 0.092 462.04 352.36 2 4 1.94 0.42 0.16
Journal cocitation 1 420 38188 0.434 181.85 73.20 1 2 1.57 0.64 0.31
Journal cocitation 2 232 4112 0.153 35.45 20.41 2 4 1.97 0.49 0.18
Pub. citation 1955 5636 0.003 5.77 6.22 10 18 5.59 0.13 0.05
Term cooccurrence 597 51186 0.288 171.48 92.41 2 2 1.71 0.53 0.22
Univ. coauthorship 500 103870 0.833 415.48 64.83 1 2 1.17 0.88 0.69

Network statistics
23
NetworkNo.
nodes
No.
edgesDensity
Avg.
degree
St. dev.
degreeRadius Diameter
Avg.
path
length
Avg.
clustering
coefficient
Global
clustering
coefficient
Karate club 34 78 0.139 4.59 3.88 3 5 2.41 0.57 0.10
Les Miserables 77 254 0.087 6.60 6.04 3 5 2.64 0.57 0.25
Football 115 613 0.094 10.66 0.89 3 4 2.51 0.40 0.19
Dolphins 62 159 0.084 5.13 2.96 5 8 3.36 0.26 0.13
Political books 105 441 0.081 8.40 5.47 4 7 3.08 0.49 0.15
Power grid 4941 6594 0.001 2.67 1.79 23 46 18.99 0.08 0.04