networked insights - how dirty is big data?
TRANSCRIPT

© Networked Insights1 of 18 March 2015
How Dirty is Big Data? How dirty data and non-consumer posts distort the insights brands gain from social media.

© Networked Insights2 of 18
Summary
• Based on a recent analysis of social media data by Networked Insights, nearly 10% of the social media posts brands analyze to understand their consumer’s behavior do not actually come from real consumers. Non-consumers include social bots, celebrities, brand handles and inactive accounts. Spam is a particularly big issue with forums, which have almost 28% of all posts written by non-consumers.
• Social spam is a massive problem on brand conversations; some brands have over 90% social media posts classified as spam.
• An illustrative example will show that removing spam and non-consumers from your dataset can drastically change the insights you gain from consumer conversations.

© Networked Insights3 of 18
Why brands need to clean up social spam

© Networked Insights4 of 18
Garbage In, Garbage Out
• Brands today are becoming more sophisticated about analyzing social media to discover consumer insights. But, if social data is filled with spam, brands’ analyses will not be accurate or actionable.
• The industry recognizes data is inherently dirty. According to a recent New York Times article, 50% to 80% of a data scientist’s time now involves cleaning data.
• Efforts are being made to clean up social spam, but it’s an uphill battle for social media sites.
• Machine learning algorithms identify spam. Networked Insights’ models can identify social spam with an accuracy of greater than 80% and have the ability to process millions of data points quickly.

© Networked Insights5 of 18
What is social spam?
Social spam includes posts, reviews or blog comments containing:
1. Coupons – coupons, product listings, contests and giveaways 2. Adult Content – adult or pornographic content 3. General Spam – posts which contain gibberish or nonsense
SPAM=Coupons + Adult Content + General Spam (5.8%) (2.2%) (1.3%)
Percent of Total Posts
Coupon Adult Content General Spam
5.8%
2.2%
1.3%
© Networked Insights6 of 18
Percent Spam
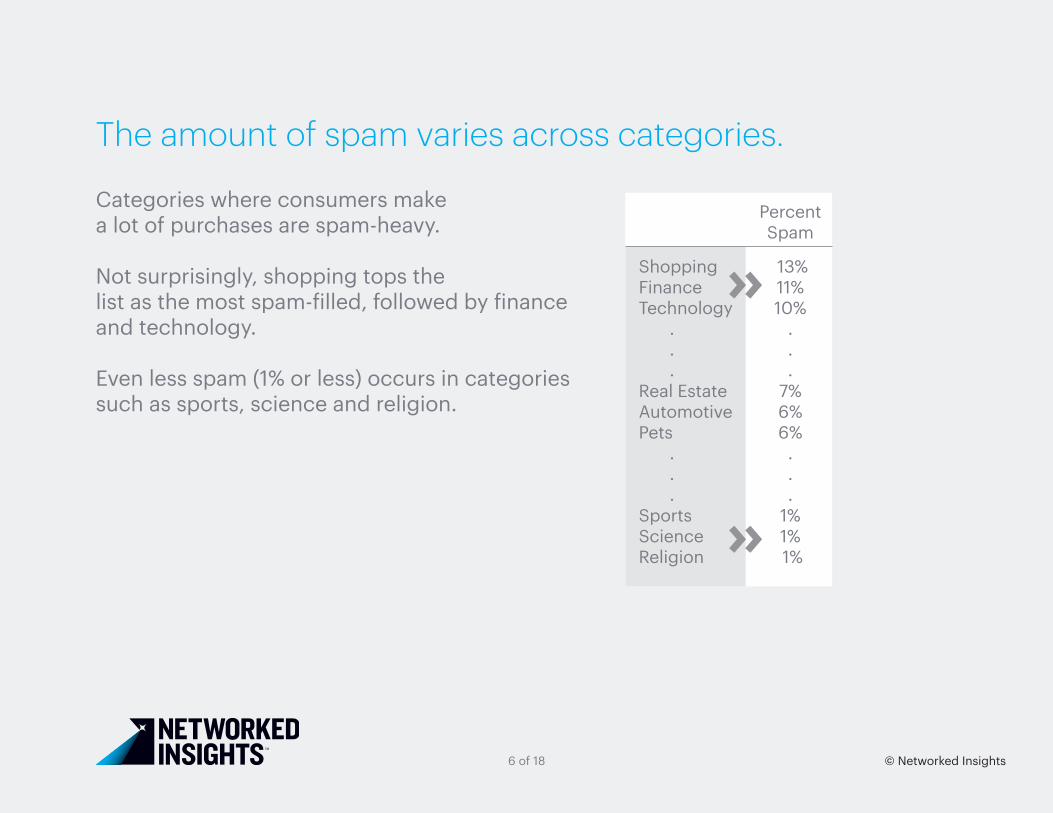
Shopping 13%Finance 11%Technology 10% . . . . . .Real Estate 7% Automotive 6%Pets 6% . . . . . .Sports 1%Science 1%Religion 1%
The amount of spam varies across categories.
Categories where consumers make a lot of purchases are spam-heavy.
Not surprisingly, shopping tops the list as the most spam-filled, followed by finance and technology.
Even less spam (1% or less) occurs in categories such as sports, science and religion.

© Networked Insights7 of 18
Brand Percent SpamElizabeth Arden 95%Rite Aid 95%Visa 81%MasterCard 76%Ulta 75%American Eagle Outfitters 73%Best Buy 72%Fisher-Price 70%Lancome 68%Victorinox 68%
There are branded posts and conversations about brand names happening across social media all the time. Although overall spam rates are less than 10% across social media platforms, conversations for some brands are dominated by non-consumer data.
Some brands are dominated by spam.

© Networked Insights8 of 18
Who is generating all that spam on social?(It’s not consumers)

© Networked Insights9 of 18
Across social media, many posts are not made by consumers.
What are non-consumers?• Social Bots - computer algorithms that masquerade as humans• Verified/Brands - brands, spokespeople or celebrities with authenticated Twitter accounts• Suspended or Inactive Accounts - Bots that have been detected and cancelled by the social media site or people who cancel their own account
Source: Networked Insights Fall 2014
Percent of Non-Consumer Types
Misclassified10%
SuspendedDisabled orCancelled
11%
Protected3%
Social Bots 53%
Verified/Brands23%

© Networked Insights10 of 18
What are social bots?
A social bot is a piece of software designed to have a presence on social media and appear as if they are real people.
Can bots be identified and removed?Networked Insights uses a machine-learning algorithm to model social users’ monthly behaviors and classify posts across the social web made by bots. This algorithm works by analyzing language and more than 39 numeric features including posts per month, number of followers, number following, number of retweets to discern consumer data from non-consumer data with 90% accuracy.

© Networked Insights11 of 18
Example of a social bot
This social account posts links for items for sale that at first glance seem harmless
But, posting at a pace that does not fit the profile of a consumer, the account was suspended by the social site. Averaging 995 tweets a day on a small subset of brands such as Ford, Apple and Sony, this one user has the ability to skew any analysis of these brands.
Ford : Mustang Boss 302 6-‐SPD Coupe 12 5.0 v8 boss
manual sirius recaro sport 1 owner warranty 6 speed 22k
texas:... bit.ly/1o41Jlg
Apple iPhone 4s -‐ 32GB -‐ Black (Unlocked)
Smartphone: $170.00 (2 Bids) End Date: Sunday Aug-‐3-‐2014 20:30:49 PDT... bit.ly/1o3XiGY
Source: Networked Insights Fall 2014

© Networked Insights12 of 18
What happens when you remove non-consumer data?

© Networked Insights13 of 18
How Spam Changes Conversation Themes
• Networked Insights examined conversations about the food and drink category with and without spam. To examine the difference in themes between the two sets of conversations, we leveraged Networked Insights’ discovery technology, Doppler™.
• After removing the 14% of posts that were tagged as spam, we found that more nuanced conversations such as healthy food, food cravings, and ethnic fast food conversations emerged.
The following slides contain Doppler™ generated images.• Each circle represents a theme cluster.• Like posts are clustered together, so the larger the cluster, the more posts.• The more related the conversations, the closer the clusters are in proximity to each other.
For more information about Doppler™, contact us.

© Networked Insights14 of 18
Food and Beverage Conversations Themes
The fact is, clusters around adult content and spam are getting in the way.
*Source: Networked Insights Doppler™ thematic discovery tool, Food and Beverage Posts, All Posts, Fall 2014
Many brands use discovery technology to analyze social data and organically uncover themes, preferences and consumer conversation around their product or category.
For example, looking at all food and beverage posts at a given time, the posts are categorized into groups that represent what is on consumers’ minds.
– In the accompanying chart, the bigger the circle, the “louder” the conversation consumers are having about that topic. • People seem to be talking about pizza, beer, coffee and cake. – The closer the dots are to each other, the more related the conversations are. • One has to ask: Why then, is “pizza” positioned so far away from “beer?” That doesn’t seem right.
Food and Beverage – All Posts* Unfiltered clusters of all posts including 14% spam and adult content.
Cakes
Tea
DrinkingIce Cream SPAM
Foods your feel like
Junk FoodWine
Restaurants
ADULT CONTENT
ADULT CONTENT
Cooking
Juice
Pizza Beer

© Networked Insights15 of 18
Cut the spam and the conversation changes.Once posts generated by non-consumers, spammers and bots are removed, a clearer, more nuanced picture is uncovered.- More granular topics now surface. - Related topics position more accurately (For example, pizza is now much closer to beer). - Finer topics emerge such as healthy food, ethnic fast food and food cravings.- Brands can now interpret the results with confidence that they are accurate to how consumers feel and behave.
†Source: Networked Insights Doppler™ thematic discovery tool, Food and Beverage Posts, Consumer Audience, Fall 2014
With Spam Without Spam†
Cakes
Tea
DrinkingIce Cream SPAM
Foods your feel like
Junk FoodWine
Restaurants
ADULT CONTENT
ADULT CONTENT
Cooking
Juice
Pizza Beer
Restaurants
Cakes
Drinking
Juice
Tea
Ice Cream
Taco Bell
ChickenFood & LoveCooking
Food Cravings
Healthy Food (Vegan)
Fast Food
Ethnic Fast Food
Food Related Speech
Appearance
Wine
Beer
Pizza

© Networked Insights16 of 18
Brand Takeaways• Spam and non-consumer generated posts are problems that cannot be ignored when analyzing social media data.• In particular, brand to brand comparisons can have unknown results due to differing amounts of spam occurring among brands.• If brands are able to remove non-consumer noise from social data, consumer insight analysis is more accurate and marketers can make more confident marketing decisions.
Audiences of Consumers, Not Bots Focusing on data from consumers, not spammers and bots gives brands: • True understanding of the topics your audience discusses and shares most. • Accurate counts of brand and campaign total volume, shares, and earned media. • Ability to discover more granular consumer conversations that surface opportunities and risks.

© Networked Insights17 of 18
About Networked InsightsAt Networked Insights, we help brands make faster, smarter and more audience-centric decisions. Our marketing solution analyzes and organizes real-time consumer data from the social web to produce strategic, actionable insights that inform better audience segmentation, content strategy, media investment, brand health and more.
Learn more at networkedinsights.com and follow @netinsights.