neurological findings in aged rats using translational imaging technologies: pet ... · 2018. 5....
TRANSCRIPT
Neurological Findings in Aged Rats Using Translational Imaging
Technologies: PET, SPECT and MRIJussi Rytkönen1, Pekka Poutiainen2, 3, Artem Shatillo1, Kimmo Lehtimäki1, Karoliina Soininen1,Tuulia Huhtala1
1 INTRODUCTIONWe have shown that aging causes neurological and memory deficits. Mild neurological changes in
neurological function, including minor impairment in memory and cognition can result naturally from
aging. In this study, the neurological changes caused by aging were studied with translational imaging
techniques in healthy naturally aged rats. Small animal imaging is an important tool for preclinical drug
research as it can provide valuable information of disease progression and treatment longitudinally. In
this study, we imaged young and aged male rats (2 and 19 months, respectively) with MRI, SPECT and
PET to measure changes in blood-brain barrier (BBB) integrity, cerebral blood flow (CBF) and
neuroinflammation to study the effects of aging.
3 RESULTSWhen BBB integrity was measured with contrast enhanced MRI, a trend of signal ratio of pre- and
post-images in aged rats was observed both in cortex and striatum. However, high variation in the
signal ratio was observed in aged group when compared to young animals (Figure 1). Accumulation of
Gd was seen in the pineal gland (sagittal sinus area between cerebrum and cerebellum). This
phenomenon was seen in all aged rats, which also showed enlarged pineal gland mass compared to
young rats (Figure 2). Pineal gland doesn’t contain BBB, which explains the higher Gd permeability in
aged rats at that region.
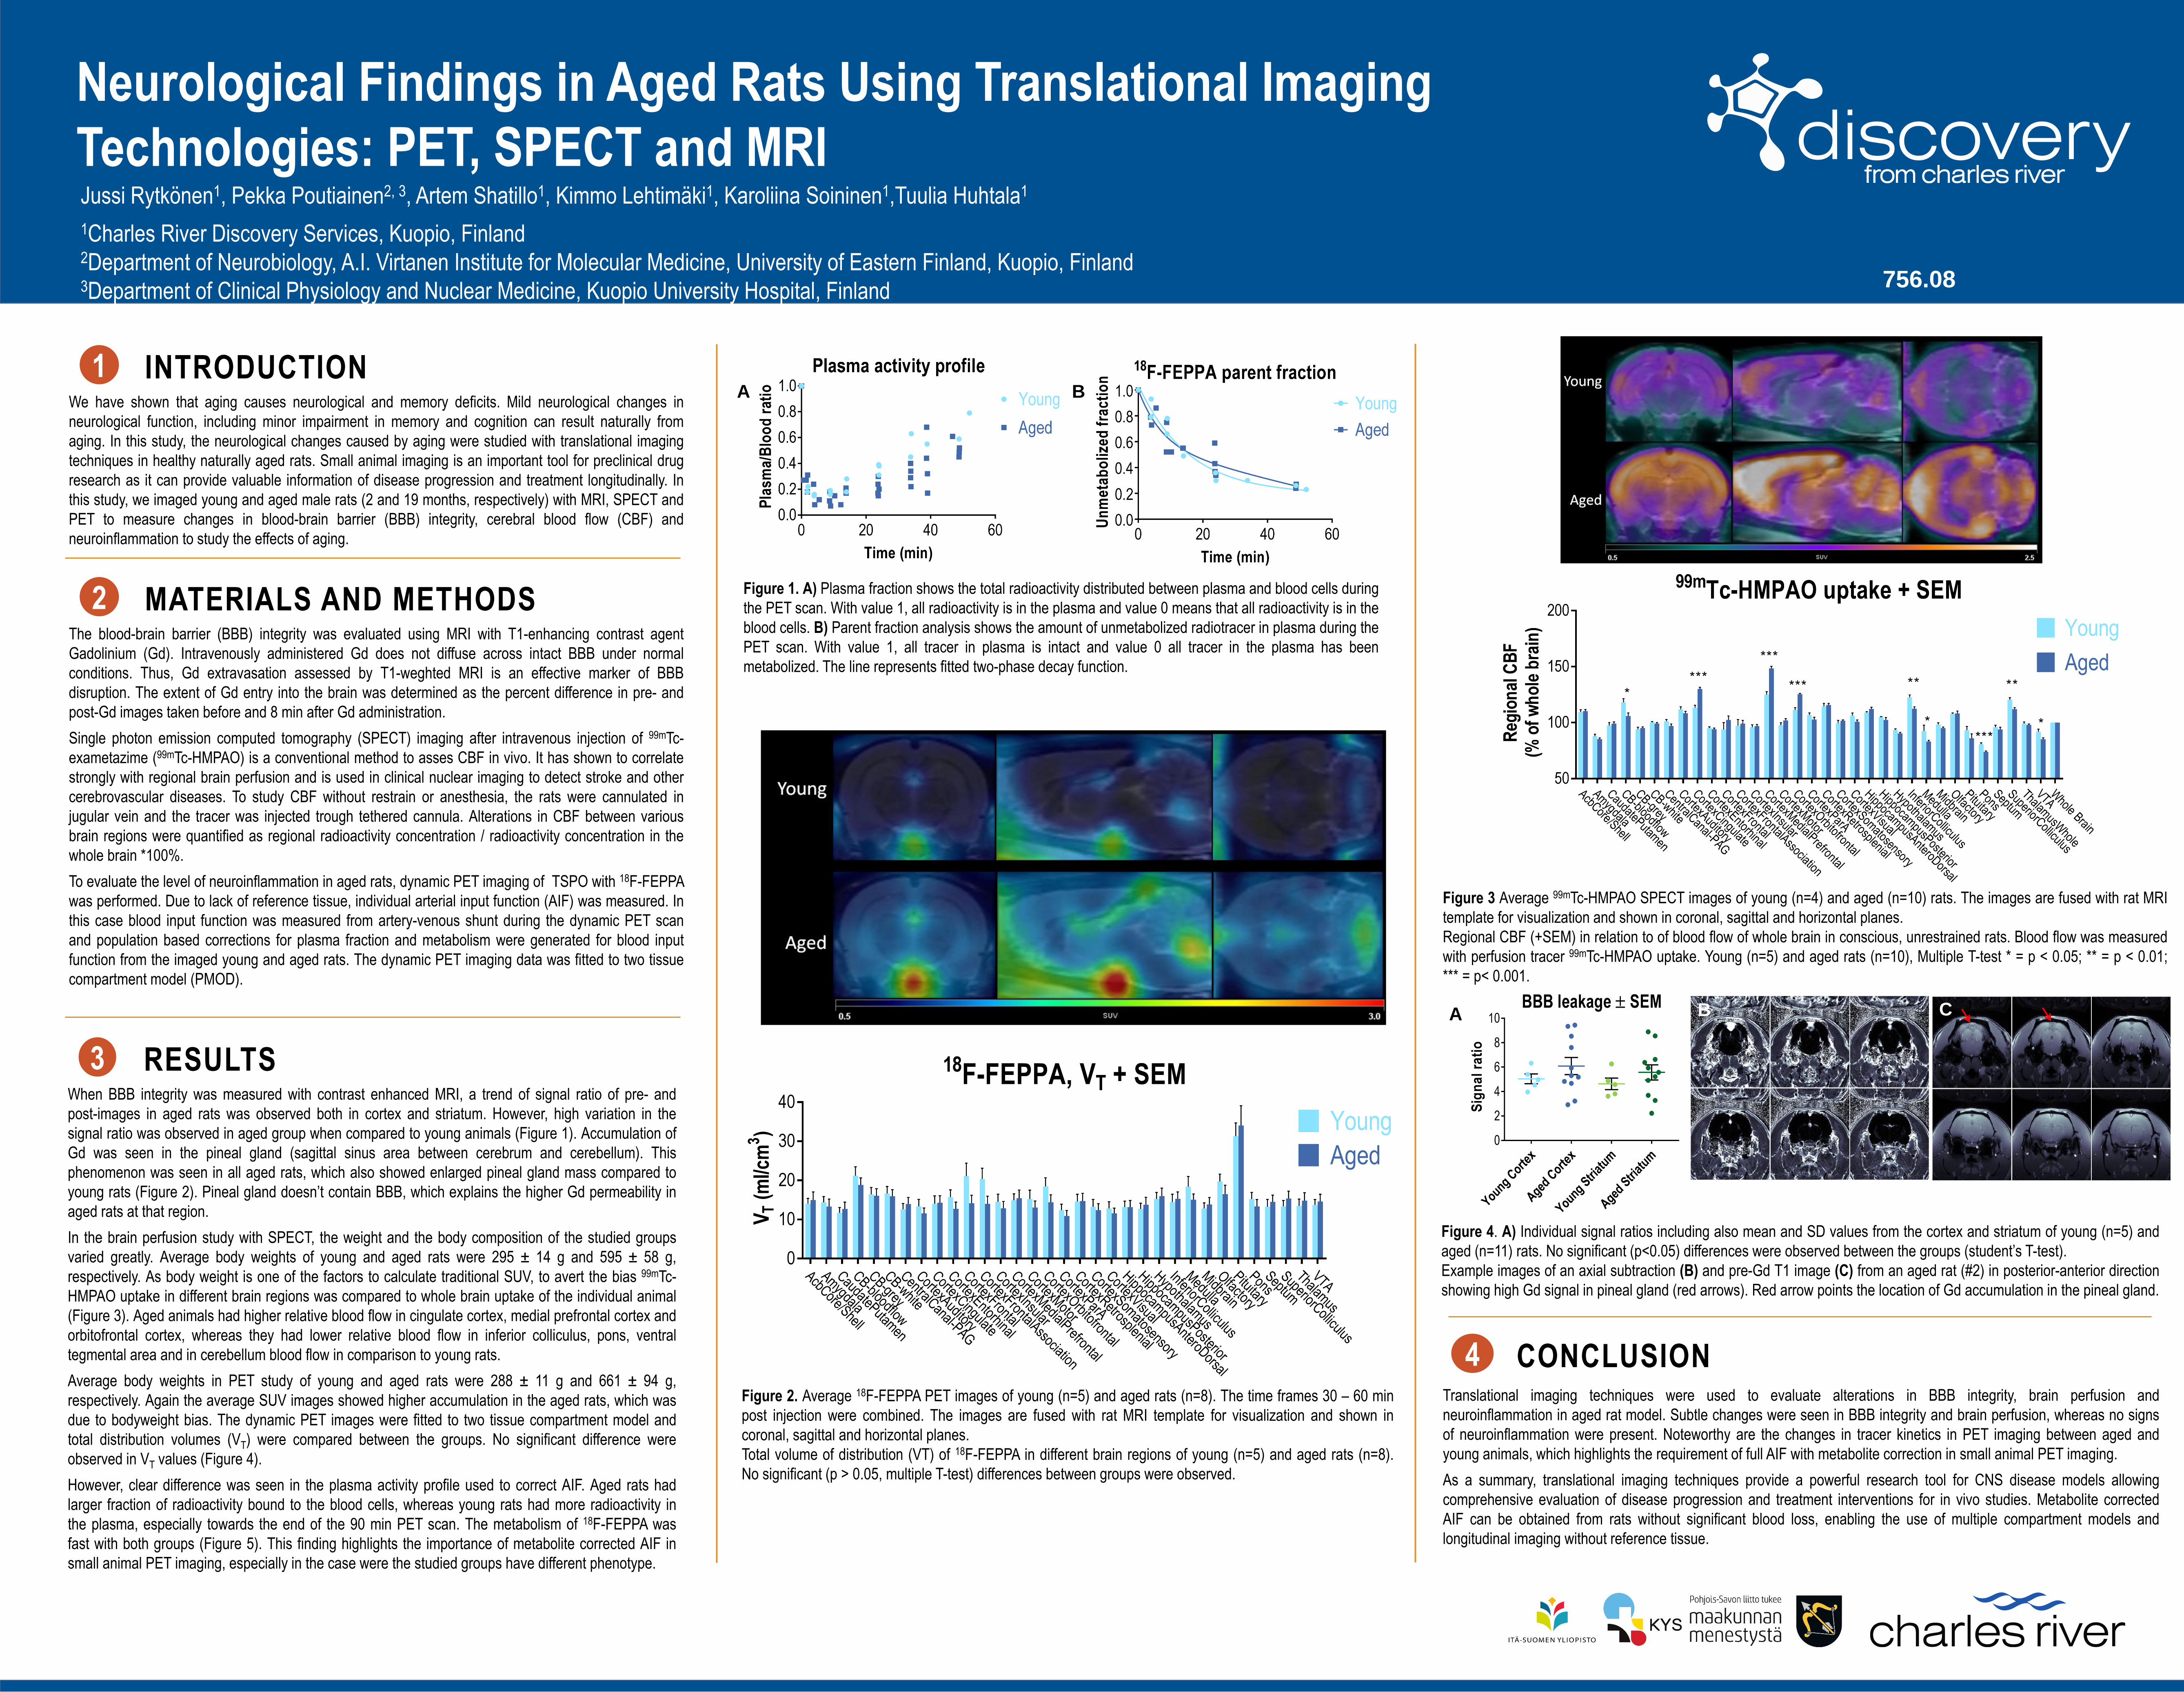
In the brain perfusion study with SPECT, the weight and the body composition of the studied groups
varied greatly. Average body weights of young and aged rats were 295 ± 14 g and 595 ± 58 g,
respectively. As body weight is one of the factors to calculate traditional SUV, to avert the bias 99mTc-
HMPAO uptake in different brain regions was compared to whole brain uptake of the individual animal
(Figure 3). Aged animals had higher relative blood flow in cingulate cortex, medial prefrontal cortex and
orbitofrontal cortex, whereas they had lower relative blood flow in inferior colliculus, pons, ventral
tegmental area and in cerebellum blood flow in comparison to young rats.
Average body weights in PET study of young and aged rats were 288 ± 11 g and 661 ± 94 g,
respectively. Again the average SUV images showed higher accumulation in the aged rats, which was
due to bodyweight bias. The dynamic PET images were fitted to two tissue compartment model and
total distribution volumes (VT) were compared between the groups. No significant difference were
observed in VT values (Figure 4).
However, clear difference was seen in the plasma activity profile used to correct AIF. Aged rats had
larger fraction of radioactivity bound to the blood cells, whereas young rats had more radioactivity in
the plasma, especially towards the end of the 90 min PET scan. The metabolism of 18F-FEPPA was
fast with both groups (Figure 5). This finding highlights the importance of metabolite corrected AIF in
small animal PET imaging, especially in the case were the studied groups have different phenotype.
4 CONCLUSIONTranslational imaging techniques were used to evaluate alterations in BBB integrity, brain perfusion and
neuroinflammation in aged rat model. Subtle changes were seen in BBB integrity and brain perfusion, whereas no signs
of neuroinflammation were present. Noteworthy are the changes in tracer kinetics in PET imaging between aged and
young animals, which highlights the requirement of full AIF with metabolite correction in small animal PET imaging.
As a summary, translational imaging techniques provide a powerful research tool for CNS disease models allowing
comprehensive evaluation of disease progression and treatment interventions for in vivo studies. Metabolite corrected
AIF can be obtained from rats without significant blood loss, enabling the use of multiple compartment models and
longitudinal imaging without reference tissue.
756.08
1Charles River Discovery Services, Kuopio, Finland2Department of Neurobiology, A.I. Virtanen Institute for Molecular Medicine, University of Eastern Finland, Kuopio, Finland3Department of Clinical Physiology and Nuclear Medicine, Kuopio University Hospital, Finland
2 MATERIALS AND METHODSThe blood-brain barrier (BBB) integrity was evaluated using MRI with T1-enhancing contrast agent
Gadolinium (Gd). Intravenously administered Gd does not diffuse across intact BBB under normal
conditions. Thus, Gd extravasation assessed by T1-weghted MRI is an effective marker of BBB
disruption. The extent of Gd entry into the brain was determined as the percent difference in pre- and
post-Gd images taken before and 8 min after Gd administration.
Single photon emission computed tomography (SPECT) imaging after intravenous injection of 99mTc-
exametazime (99mTc-HMPAO) is a conventional method to asses CBF in vivo. It has shown to correlate
strongly with regional brain perfusion and is used in clinical nuclear imaging to detect stroke and other
cerebrovascular diseases. To study CBF without restrain or anesthesia, the rats were cannulated in
jugular vein and the tracer was injected trough tethered cannula. Alterations in CBF between various
brain regions were quantified as regional radioactivity concentration / radioactivity concentration in the
whole brain *100%.
To evaluate the level of neuroinflammation in aged rats, dynamic PET imaging of TSPO with 18F-FEPPA
was performed. Due to lack of reference tissue, individual arterial input function (AIF) was measured. In
this case blood input function was measured from artery-venous shunt during the dynamic PET scan
and population based corrections for plasma fraction and metabolism were generated for blood input
function from the imaged young and aged rats. The dynamic PET imaging data was fitted to two tissue
compartment model (PMOD).
Figure 4. A) Individual signal ratios including also mean and SD values from the cortex and striatum of young (n=5) and
aged (n=11) rats. No significant (p<0.05) differences were observed between the groups (student’s T-test).
Example images of an axial subtraction (B) and pre-Gd T1 image (C) from an aged rat (#2) in posterior-anterior direction
showing high Gd signal in pineal gland (red arrows). Red arrow points the location of Gd accumulation in the pineal gland.
Figure 3 Average 99mTc-HMPAO SPECT images of young (n=4) and aged (n=10) rats. The images are fused with rat MRI
template for visualization and shown in coronal, sagittal and horizontal planes.
Regional CBF (+SEM) in relation to of blood flow of whole brain in conscious, unrestrained rats. Blood flow was measured
with perfusion tracer 99mTc-HMPAO uptake. Young (n=5) and aged rats (n=10), Multiple T-test * = p < 0.05; ** = p < 0.01;
*** = p< 0.001.
Figure 2. Average 18F-FEPPA PET images of young (n=5) and aged rats (n=8). The time frames 30 – 60 min
post injection were combined. The images are fused with rat MRI template for visualization and shown in
coronal, sagittal and horizontal planes.
Total volume of distribution (VT) of 18F-FEPPA in different brain regions of young (n=5) and aged rats (n=8).
No significant (p > 0.05, multiple T-test) differences between groups were observed.
Figure 1. A) Plasma fraction shows the total radioactivity distributed between plasma and blood cells during
the PET scan. With value 1, all radioactivity is in the plasma and value 0 means that all radioactivity is in the
blood cells. B) Parent fraction analysis shows the amount of unmetabolized radiotracer in plasma during the
PET scan. With value 1, all tracer in plasma is intact and value 0 all tracer in the plasma has been
metabolized. The line represents fitted two-phase decay function.
A B
A B C