neutral slower than expected industry banks (as on 20 jan … mahindra bank - 3qfy20 - hdfc...
TRANSCRIPT

RESULTS REVIEW 3QFY20 21 JAN 2020
Kotak Mahindra Bank NEUTRAL
Slower than expected KMB’s earnings were slightly below estimates as opex (led by a one-off) and provisions came in higher. GNPAs continued to rise, though not alarmingly. Maintain NEUTRAL with a TP of Rs 1,681 (4.25x Dec-21E core ABV of Rs 309 + Rs 367 for subs), as valuations are expensive. HIGHLIGTHS OF THE QUARTER Slowing Loan Growth Persists: KMB’s book growth
moderated further to ~10% (vs. 15% in 2Q). While this was broad-based, corporate (+3/1%) and CV/CE (+6/-4%) loan growth reported sharp dips. Growth in mortgages (+20/4%), agri (+17/3%), and small biz., PL & CC (+15/2%) loans was relatively steadier. Even as KMB (with adequate capital), is well-placed to tap any growth opportunity, given broader macros and its conservative approach, we’ve lowered our growth estimates to ~16% over FY20-22E.
GNPAs Rise: KMB saw elevated stress in certain corporate a/cs and unsecured loans. GNPAs increased by ~31/8% to ~Rs 54bn (2.46%, +39/14bps) as slippages remained elevated at ~Rs 11bn (3x YoY/+6%, ~2% ann.). We do not find this too disconcerting and draw comfort from (1) Historical asset quality trends, (2)
Limited exposure to known stressed sectors, and a (3) Reduction in SMA II to 13bps (-7bps QoQ), after a sustained uptick over 1HFY20. We model slippages of ~1.4% over FY20-22E.
Margins Expand: A continued downtrend in the CoF (-47/22bps) aided by falling CoD, resulted in sequential NIM expansion for the 5th straight qtr to ~4.7% (+36/8bps), even as calc. yields faced some pressure (-23/-27bps). High CRAR continues to amplify NIMs. Greater/ faster than anticipated reduction in CoF, causes us to increase our NIM estimates to ~4.5% over FY20-22E.
STANCE KMB’s strong fundamentals (CRAR, liability franchise, minimal reported stress) should enable the bank to deliver an improvement in already strong return ratios. We do not find the current slowdown in growth and uptick in stress worrisome. Our NEUTRAL stance reflects discomfort on rich valuations. The contentious issue of promoter holding remains unresolved, and the next hearing is slated in Mar-20.
FINANCIAL SUMMARY Standalone (Rs mn) 3QFY20 3QFY19 YoY (%) 2QFY20 QoQ (%) FY19 FY20E FY21E FY22E Net Interest Income 34,295 29,391 16.7% 33,496 2.4% 112,590 136,030 156,057 182,512 PPOP 23,881 19,384 23.2% 25,086 -4.8% 83,482 100,469 115,172 135,175 PAT 15,959 12,909 23.6% 17,245 -7.5% 48,653 63,621 73,716 88,177 EPS (Rs) 8.4 6.8 23.5% 9.0 -7.5% 25.5 33.3 38.6 46.2 Core ROAE (%) 13.0 14.6 14.5 15.1 Core ROAA (%) 1.70 1.94 1.99 2.07 Core Adj. BVPS (Rs) 201 237 275 320 P/E (x)# 51.3 39.5 33.2 27.0 P/ABV (x)# 6.52 5.55 4.65 3.90 Source: Bank, HDFC sec Inst Research; Note: # adjusted for embedded value of subs.
INDUSTRY BANKS CMP (as on 20 Jan 2020) Rs 1,618 Target Price Rs 1,681 Nifty 12,225 Sensex 41,529 KEY STOCK DATA Bloomberg KMB IN No. of Shares (mn) 1,911 MCap (Rs bn) / ($ mn) 3,092/43,459 6m avg traded value (Rs mn) 4,472 STOCK PERFORMANCE (%) 52 Week high / low Rs 1,735/1,210 3M 6M 12M Absolute (%) 0.2 7.9 30.5 Relative (%) (5.5) (0.4) 16.3 SHAREHOLDING PATTERN (%) Jun-19 Sept-19 Promoters 30.0 30.0 FIs & Local MFs 12.0 12.2 FPIs 40.2 39.8 Public & Others 17.8 18.0 Pledged Shares Nil Nil Source : BSE Darpin Shah [email protected] +91-22-6171-7328 Aakash Dattani [email protected] +91-22-6171-7337 Punit Bahlani [email protected] +91-22-3021-2081
HDFC securities Institutional Research is also available on Bloomberg ERH HDF <GO> & Thomson Reuters

KOTAK MAHINDRA BANK : RESULTS REVIEW 3QFY20
Strong SA Growth: Overall deposits grew slightly ahead of advances at ~12/3%. CASA deposits registered a strong ~19/3% growth (53.7%, +300/10bps, best in class), led by strong SA growth (+20/6%) even as CA dipped ~4% QoQ (+16% YoY). SA accretion appears to be unaffected by the earlier SA rate cut, indicative of KMB’s granular, rather sticky and low cost liability profile.
Opex Hit By One-Off Staff Costs: Opex registered a sharp ~21/15% growth, led by 30/19% growth in staff costs, as other opex grew ~15/12% (after 2 qtrs of flattish QoQ growth). The sharp rise in staff costs appears transient as it was due to ~Rs 2bn (existing 2k employees and retired 3k employees of e-VYSB) of non-recurring charges on changes in actuarial assumptions. Spends on 811 and the cards biz. drove
other op-costs. The C-I ratio jumped ~480bps QoQ to ~50%, due to the sharp jump in opex and slower income growth. We expect a ~200bps improvement in the C-I over FY20-22E. Scaling up of 811, digital customer acquisitions and faster income growth will facilitate this improvement.
Subsidiaries: The share of subs in consolidated PAT increased ~370bps QoQ as KMB’s standalone PAT registered a ~7% QoQ fall. The downtrend in KMP’s advances continued (-7/-5% YoY/QoQ), led by a fall in car loans (-11/-5%). PAT registered a sharp rise, growing 35/9%, driven by higher NIMs. K-Life registered a ~33/15% growth in PAT. K-Sec’s PAT dipped ~14% QoQ, albeit up ~29% YoY. K-AMC’s AUMs grew ~29/9%, while its PAT grew ~20/7%.
SOTP
Rs bn Per Share Rationale Kotak Mahindra Bank – Standalone 2,508.2 1,314.0 4.25x Dec-21E core ABV of Rs 283 Kotak Mahindra Prime - Car Finance 255.2 133.7 3.0x Dec-21E core NW Kotak Mahindra Investments – LAS 66.0 34.6 3.0x Dec-21E core NW Kotak Securities – Broking 82.2 43.1 15x Dec-21E Earnings Kotak Mahindra AMC - Asset Management 142.9 74.9 8% of FY21E AUM Kotak Life - Life Insurance 293.5 153.8 FY20 EV + 20x FY21E VNB KMCC - Investment Banking 9.4 4.9 1.5x Dec-21E core NW Kotak Alternative Assets 9.1 4.8 7.5% of FY21E AUM Offshore Funds 16.8 8.8 5% of FY21E AUM Total Value of Subsidiaries 875 458.4 Less : 20% Holding Co. Discount 175.0 91.7 Total SOTP Value 3,208.2 1,680.8 Current Value 3,088.4 1,618.0 Upside (%) 3.9 3.9 Source: HDFC sec Inst Research
Page | 2

KOTAK MAHINDRA BANK : RESULTS REVIEW 3QFY20
Five Quarters At A Glance
Source: HDFC sec Inst Research
Rs mn 3QFY19 4QFY19 1QFY20 2QFY20 3QFY20 YoY Growth QoQ Growth Net Interest Income 29,391 30,479 31,730 33,496 34,295 16.7% 2.4% Non Interest Income 9,639 12,703 13,047 12,244 13,414 39.2% 9.6% Fee Income 10,380 11,870 11,500 11,620 11,360 9.4% -2.2% Operating Income 39,030 43,182 44,778 45,740 47,710 22.2% 4.3% Operating Expenses 19,646 20,359 20,789 20,654 23,829 21.3% 15.4% Pre provision Profits 19,384 22,823 23,989 25,086 23,881 23.2% -4.8% Provisions (323) 1,713 3,168 4,079 4,440 NA 8.8%
NPA Provisions 2,550 2,397 2,726 3,977 4,320 69.4% 8.6% PBT 19,707 21,110 20,822 21,006 19,441 -1.4% -7.5% Provision For Tax 6,798 7,032 7,220 3,762 3,482 -48.8% -7.4% PAT 12,909 14,078 13,602 17,245 15,959 23.6% -7.5% Balance Sheet items/ratios Deposits (Rs bn) 2,138 2,259 2,329 2,331 2,394 12.0% 2.7%
CASA (%) 50.7 52.5 50.7 53.6 53.7 298 bps 10 bps Advances (Rs bn) 1,964 2,057 2,080 2,133 2,168 10.4% 1.6%
CV And CE (%) 9.2 9.6 9.6 9.2 8.8 -40 bps -47 bps Agri Finance (%) 12.1 13.1 12.5 12.7 12.8 71 bps 10 bps Mortgage Loans (%) 19.5 19.8 20.3 20.8 21.2 173 bps 43 bps Small biz., PL/CC (%) 15.8 16.1 16.2 16.3 16.4 61 bps 10 bps Corp + Business Banking (%) 41.2 38.9 39.1 38.6 38.5 -274 bps -14 bps Others (%) 2.2 2.4 2.3 2.3 2.3 9 bps -3 bps
CD ratio (%) 91.9 91.1 89.3 91.5 90.6 -131 bps -95 bps CAR (%) 18.1 17.5 17.8 18.2 18.2 10 bps 0 bps
Tier I (%) 17.6 16.9 17.3 18.0 17.7 10 bps -30 bps Profitability Calc. Yield On Advances (%) 10.00 9.90 10.03 10.04 9.77 -23 bps -27 bps Calc. Cost Of Funds (%) 5.50 5.36 5.35 5.25 5.03 -47 bps -22 bps NIM (%) 4.33 4.48 4.49 4.61 4.69 36 bps 8 bps Cost-Income Ratio (%) 50.3 47.1 46.4 45.2 49.9 -39 bps 479 bps Tax Rate (%) 34.5 33.3 34.7 17.9 17.9 -1658 bps 0 bps Asset Quality Gross NPA (Rs bn) 41.29 44.7 46.1 50.3 54.1 31.1% 7.5% Net NPA (Rs bn) 13.97 15.4 15.2 18.1 19.3 37.8% 6.3% Gross NPAs (%) 2.07 2.14 2.19 2.32 2.46 39 bps 14 bps Net NPAs (%) 0.71 0.75 0.73 0.85 0.89 18 bps 4 bps Slippages (% ann.) 0.72 1.81 1.45 1.90 1.98 -72 bps -190 bps Coverage Ratio (%) 66.2 65.4 67.0 64.0 64.4 -172 bps 42 bps SMA II (%) 0.18 0.07 0.16 0.20 0.13 -5 bps -8 bps
Overall growth, dragged by slower growth in corporate (3%) and CV/CE (3%)
CASA grew ~19% YoY, led by a 20/16% rise in SA/CA
LLPs at 80bps vs. 76bps QoQ
Slippages of ~Rs 11bn were from the corporate, SME, CV/ CE and unsecured retail segments
SMA II (Rs 2.7bn) dipped 36% QoQ
Driven by ~10% loan growth and a 36bps increase in NIMs; Fees grew ~9% YoY, with lower TPD; misc. income (~Rs 2.05bn, vs. loss YoY) boosted growth Incl. Rs 2bn related to one-off staff costs; faster other opex growth was driven by 811 related spends
Driven by lower cost of SA (-40/10bps YoY/QoQ) and faster CASA growth
~85-90% of CC and ~50% of PL are internally sourced
Page | 3
KOTAK MAHINDRA BANK : RESULTS REVIEW 3QFY20
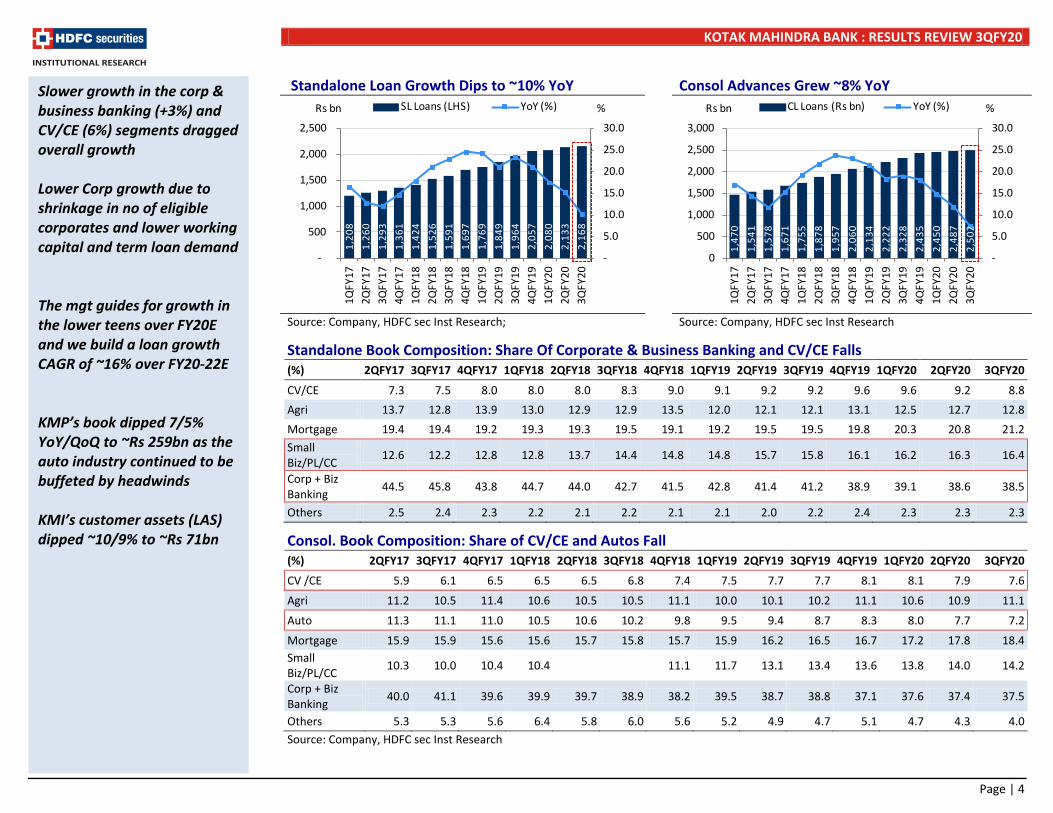
Standalone Loan Growth Dips to ~10% YoY Consol Advances Grew ~8% YoY
Source: Company, HDFC sec Inst Research; Source: Company, HDFC sec Inst Research
Standalone Book Composition: Share Of Corporate & Business Banking and CV/CE Falls (%) 2QFY17 3QFY17 4QFY17 1QFY18 2QFY18 3QFY18 4QFY18 1QFY19 2QFY19 3QFY19 4QFY19 1QFY20 2QFY20 3QFY20
CV/CE 7.3 7.5 8.0 8.0 8.0 8.3 9.0 9.1 9.2 9.2 9.6 9.6 9.2 8.8 Agri 13.7 12.8 13.9 13.0 12.9 12.9 13.5 12.0 12.1 12.1 13.1 12.5 12.7 12.8 Mortgage 19.4 19.4 19.2 19.3 19.3 19.5 19.1 19.2 19.5 19.5 19.8 20.3 20.8 21.2 Small Biz/PL/CC 12.6 12.2 12.8 12.8 13.7 14.4 14.8 14.8 15.7 15.8 16.1 16.2 16.3 16.4
Corp + Biz Banking 44.5 45.8 43.8 44.7 44.0 42.7 41.5 42.8 41.4 41.2 38.9 39.1 38.6 38.5
Others 2.5 2.4 2.3 2.2 2.1 2.2 2.1 2.1 2.0 2.2 2.4 2.3 2.3 2.3
Consol. Book Composition: Share of CV/CE and Autos Fall (%) 2QFY17 3QFY17 4QFY17 1QFY18 2QFY18 3QFY18 4QFY18 1QFY19 2QFY19 3QFY19 4QFY19 1QFY20 2QFY20 3QFY20
CV /CE 5.9 6.1 6.5 6.5 6.5 6.8 7.4 7.5 7.7 7.7 8.1 8.1 7.9 7.6
Agri 11.2 10.5 11.4 10.6 10.5 10.5 11.1 10.0 10.1 10.2 11.1 10.6 10.9 11.1
Auto 11.3 11.1 11.0 10.5 10.6 10.2 9.8 9.5 9.4 8.7 8.3 8.0 7.7 7.2
Mortgage 15.9 15.9 15.6 15.6 15.7 15.8 15.7 15.9 16.2 16.5 16.7 17.2 17.8 18.4 Small Biz/PL/CC 10.3 10.0 10.4 10.4 11.1 11.7 13.1 13.4 13.6 13.8 14.0 14.2
Corp + Biz Banking 40.0 41.1 39.6 39.9 39.7 38.9 38.2 39.5 38.7 38.8 37.1 37.6 37.4 37.5
Others 5.3 5.3 5.6 6.4 5.8 6.0 5.6 5.2 4.9 4.7 5.1 4.7 4.3 4.0 Source: Company, HDFC sec Inst Research
Slower growth in the corp & business banking (+3%) and CV/CE (6%) segments dragged overall growth Lower Corp growth due to shrinkage in no of eligible corporates and lower working capital and term loan demand The mgt guides for growth in the lower teens over FY20E and we build a loan growth CAGR of ~16% over FY20-22E KMP’s book dipped 7/5% YoY/QoQ to ~Rs 259bn as the auto industry continued to be buffeted by headwinds KMI’s customer assets (LAS) dipped ~10/9% to ~Rs 71bn
1,20
8 1,
260
1,29
3 1,
361
1,42
4 1,
526
1,59
1 1,
697
1,76
9 1,
849
1,96
4 2,
057
2,08
0 2,
133
2,16
8
-
5.0
10.0
15.0
20.0
25.0
30.0
-
500
1,000
1,500
2,000
2,500
1QFY
172Q
FY17
3QFY
174Q
FY17
1QFY
182Q
FY18
3QFY
184Q
FY18
1QFY
192Q
FY19
3QFY
194Q
FY19
1QFY
202Q
FY20
3QFY
20
SL Loans (LHS) YoY (%)Rs bn %
1,47
01,
541
1,57
81,
671
1,75
51,
878
1,95
72,
060
2,13
42,
222
2,32
82,
435
2,45
02,
487
2,50
2
-
5.0
10.0
15.0
20.0
25.0
30.0
0
500
1,000
1,500
2,000
2,500
3,000
1QFY
172Q
FY17
3QFY
174Q
FY17
1QFY
182Q
FY18
3QFY
184Q
FY18
1QFY
192Q
FY19
3QFY
194Q
FY19
1QFY
202Q
FY20
3QFY
20
CL Loans (Rs bn) YoY (%)Rs bn %
Page | 4

KOTAK MAHINDRA BANK : RESULTS REVIEW 3QFY20
KMP: Total Advances Dip 7/5% QoQ LAS Customer Assets: -9% QoQ (After -13% In 2Q)
Source: Bank, HDFC sec Inst Research Source: Bank, HDFC sec Inst Research
Deposit Growth: ~12/3% YoY/QoQ CASA Grew 19/3% YoY/QoQ
Source: Bank, HDFC sec Inst Research; Source: Bank, HDFC sec Inst Research
Deposits Break-up : Strong QoQ Growth in SA (%) 2QFY17 3QFY17 4QFY17 1QFY18 2QFY18 3QFY18 4QFY18 1QFY19 2QFY19 3QFY19 4QFY19 1QFY20 2QFY20 3QFY20 CA 15.6 16.2 17.6 17.0 15.5 14.3 16.7 15.1 15.0 14.8 17.2 15.7 16.4 15.4 SA 23.4 25.8 26.4 26.9 32.3 32.3 34.0 35.1 35.3 35.9 35.3 35.0 37.2 38.3 TD 61.0 58.0 56.0 49.3 52.2 53.3 49.2 49.7 49.8 49.3 47.5 49.3 46.4 46.3 Source: Company, HDFC sec Inst Research
KMP’s car loan book shrank ~11/5% YoY/QoQ while other advances grew 2% YoY (down 5% QoQ) SA growth was healthy at ~20/6% YoY/QoQ and CA grew at 16% (down 4% QoQ) CASA Ratio jumped ~300bps YoY to 53.7% (highest amongst peers) TDs grew ~5% YoY and TD sweep bal. grew 24/7% YoY/QoQ Sweep deposits formed 7.4% of the total deposits Avg CA grew ~19% and SA grew ~20% CASA and TD below Rs 50mn constituted ~87% (vs. 80% YoY and 86% QoQ) of total deposits More conducive e-KYC norms and the resumption of 811 has boosted SA mobilisation
(15.0)(10.0)(5.0)-5.0 10.0 15.0 20.0 25.0 30.0
050
100150200250300350
1QFY
172Q
FY17
3QFY
174Q
FY17
1QFY
182Q
FY18
3QFY
184Q
FY18
1QFY
192Q
FY19
3QFY
194Q
FY19
1QFY
202Q
FY20
3QFY
20
Total Loans Car Loans Total Loans YoY - RHS Car Loans YoY - RHS
Rs bn %
48.7
55.3
59.6
69.1
65.0
72.3
77.6
79.0
77.1
79.6
79.2
92.4
90.3
78.3
71.5
-10.0 20.0 30.0 40.0 50.0 60.0 70.0 80.0 90.0
100.0
1QFY
17
2QFY
17
3QFY
17
4QFY
17
1QFY
18
2QFY
18
3QFY
18
4QFY
18
1QFY
19
2QFY
19
3QFY
19
4QFY
19
1QFY
20
2QFY
20
3QFY
20
Rs bn
1,40
0 1,
410
1,49
4 1,
574
1,63
5 1,
657
1,80
8 1,
926
1,89
7 2,
058
2,13
8 2,
259
2,32
9 2,
331
2,39
4
-
5.0
10.0
15.0
20.0
25.0
30.0
0
500
1,000
1,500
2,000
2,500
3,000
1QFY
172Q
FY17
3QFY
174Q
FY17
1QFY
182Q
FY18
3QFY
184Q
FY18
1QFY
192Q
FY19
3QFY
194Q
FY19
1QFY
202Q
FY20
3QFY
20
Deposits (LHS) YoY (%)Rs bn %
524
550
628
693
718
792
844
978
954
1,03
41,
084
1,18
61,
181
1,24
91,
285
-5.0 10.0 15.0 20.0 25.0 30.0 35.0 40.0 45.0 50.0
-200 400 600 800
1,000 1,200 1,400
1QFY
172Q
FY17
3QFY
174Q
FY17
1QFY
182Q
FY18
3QFY
184Q
FY18
1QFY
192Q
FY19
3QFY
194Q
FY19
1QFY
202Q
FY20
3QFY
20
CASA (LHS) YoY % Rs bn %
Page | 5

KOTAK MAHINDRA BANK : RESULTS REVIEW 3QFY20
NIM Healthy, ~At 4.7%, +36/8bps YoY/QoQ Fee Growth Moderated To ~9% YoY
Source: Bank, HDFC sec Inst Research Source: Bank, HDFC sec Inst Research
Non-Interest Income Growth Boosted By Misc. Income Rs mn 2QFY17 3QFY17 4QFY17 1QFY18 2QFY18 3QFY18 4QFY18 1QFY19 2QFY19 3QFY19 4QFY19 1QFY20 2QFY20 3QFY20
Fees 6,300 7,250 7,570 8,050 8,100 8,290 10,100 9,890 10,190 10,380 11,870 11,500 11,620 11,360
% Of loans 2.04 2.27 2.28 2.31 2.20 2.13 2.46 2.28 2.25 2.18 2.36 2.22 2.21 2.11
Total 8,311 9,102 10,030 9,070 9,540 10,400 11,510 11,650 12,050 9,640 12,703 13,050 12,244 13,414
% of Total inc 29.4 30.7 31.7 28.8 29.2 30.3 30.8 31.1 30.9 24.7 29.4 29.1 26.8 28.1 % of Avg. Assets 1.73 1.83 1.93 1.65 1.65 1.71 1.79 1.74 1.72 1.14 1.45 1.66 1.55 1.68
Source: Bank, HDFC sec Inst Research
Cost of SA dipped ~10bps QoQ (after 15bps dip in 2Q) to 5.27% A rise in CASA % and a cut in SA rates drove NIMs ~10bps QoQ to ~4.7%, even as yields dipped QoQ Fees as a % of avg. advances were stable at ~2.1% Fee growth moderated, led by third party distribution fees even as traction in general banking fees sustained
3.9 4.0 4.1 4.2 4.3 4.4 4.5 4.6 4.7 4.8
-
2.0
4.0
6.0
8.0
10.0
12.0
1QFY
172Q
FY17
3QFY
174Q
FY17
1QFY
182Q
FY18
3QFY
184Q
FY18
1QFY
192Q
FY19
3QFY
194Q
FY19
1QFY
202Q
FY20
3QFY
20
Calc YoA Calc CoF NIM RHS% %
-
0.5
1.0
1.5
2.0
2.5
3.0
0.0
2.0
4.0
6.0
8.0
10.0
12.0
14.0
1QFY
172Q
FY17
3QFY
174Q
FY17
1QFY
182Q
FY18
3QFY
184Q
FY18
1QFY
192Q
FY19
3QFY
194Q
FY19
1QFY
202Q
FY20
3QFY
20
Fee income (Rs bn) % of loans (RHS)
Page | 6

KOTAK MAHINDRA BANK : RESULTS REVIEW 3QFY20
Standalone Asset Quality: Marginal Deterioration Consol Asset Quality Too Slips, Marginally
Source : Bank, HDFC sec Inst Research Source: Bank, HDFC sec Inst Research Subs’ NNPAs Trended Upwards
Source : Bank, HDFC sec Inst Research
Slippages were ~Rs 10.6bn (198bps vs. 190bps QoQ) KMB saw stress in some corporate a/cs, SME, unsecured retail products and CVs The SMA-II book fell ~36% QoQ to a mere ~Rs 2.7bn (13bps vs. 20bps QoQ) KMP’s NNPAs jumped 9bps QoQ to ~0.61% KMI’s NNPAs increased considerably QoQ to ~1.3% (Rs 929mn, +40%)
-
0.5
1.0
1.5
2.0
2.5
3.0
-
10.0
20.0
30.0
40.0
50.0
60.0
1QFY
172Q
FY17
3QFY
174Q
FY17
1QFY
182Q
FY18
3QFY
184Q
FY18
1QFY
192Q
FY19
3QFY
194Q
FY19
1QFY
202Q
FY20
3QFY
20
GNPA (LHS) NNPA (LHS)GNPA (%) NNPA (%)Rs bn %
-
0.5
1.0
1.5
2.0
2.5
-10.0 20.0 30.0 40.0 50.0 60.0 70.0
1QFY
172Q
FY17
3QFY
174Q
FY17
1QFY
182Q
FY18
3QFY
184Q
FY18
1QFY
192Q
FY19
3QFY
194Q
FY19
1QFY
202Q
FY20
3QFY
20
GNPA (LHS) NNPA (LHS)GNPA (%) NNPA (%)Rs bn %
-
0.2
0.4
0.6
0.8
1.0
1.2
1.4
1QFY
17
2QFY
17
3QFY
17
4QFY
17
1QFY
18
2QFY
18
3QFY
18
4QFY
18
1QFY
19
2QFY
19
3QFY
19
4QFY
19
1QFY
20
2QFY
20
3QFY
20
KMP KMI%
Page | 7

KOTAK MAHINDRA BANK : RESULTS REVIEW 3QFY20
PAT Contribution: Share of Lending Businesses Dips 300bps QoQ to ~79%, Led By KMB (%) 2QFY17 3QFY17 4QFY17 1QFY18 2QFY18 3QFY18 4QFY18 1QFY19 2QFY19 3QFY19 4QFY19 1QFY20 2QFY20 3QFY20 PAT Rs bn 12.0 12.7 14.0 13.5 14.4 16.2 17.9 15.7 17.5 18.4 20.4 19.3 24.1 23.5 KMB 67.2 69.5 69.5 67.8 69.0 64.8 62.8 65.1 65.4 70.0 69.1 70.4 71.6 67.9 KMP 10.8 10.5 9.5 9.8 10.4 9.1 8.9 8.8 9.0 7.5 8.0 7.9 7.1 8.0 Invest. Co. (LAS) 4.4 3.8 4.0 3.3 3.8 3.1 5.3 3.0 2.6 2.2 3.6 3.3 2.8 2.7 K Sec 7.9 6.7 8.6 9.3 8.2 9.5 7.5 8.3 6.4 5.4 5.4 5.7 6.2 5.4 Kotak AMC 0.6 1.3 0.9 1.1 1.6 2.3 2.2 3.2 3.0 4.1 3.7 3.8 3.5 3.9 KMCC (IB) 0.4 0.6 0.8 0.4 (0.1) 2.2 1.4 1.6 0.8 0.2 1.0 2.3 0.0 1.7 Kotak Life 5.2 5.4 7.2 7.6 6.9 6.0 6.4 7.4 7.3 6.8 6.8 6.9 6.0 7.1 International Sub. 2.6 1.7 1.5 1.3 1.9 2.0 2.1 2.1 2.7 2.0 1.6 1.5 1.4 1.1 Investment Adv. 0.1 (0.7) (0.9) (0.1) (0.1) 0.7 0.1 1.8 0.7 0.6 0.7 0.9 0.9 1.3 MI 0.8 1.3 (1.1) (0.5) (1.7) 0.2 3.2 (1.4) 2.2 1.2 0.0 (2.7) 0.4 0.9 Total 100.0 100.0 100.0 100.0 100.0 100.0 100.0 100.0 100.0 100.0 100.0 100.0 100.0 100.0 KMP: AUM Dips, NIMs Improve Rs bn 2QFY17 3QFY17 4QFY17 1QFY18 2QFY18 3QFY18 4QFY18 1QFY19 2QFY19 3QFY19 4QFY19 1QFY20 2QFY20 3QFY20 Total Loans 233 235 251 276 284 288 280 279 285 279 283 277 273 259 YoY (%) 16.5 7.4 12.8 24.5 21.7 22.7 11.5 1.0 0.6 (3.1) 0.9 (0.6) (4.4) (7.4) Car Loans 172 173 182 184 198 200 201 204 207 202 203 196 190 180 YoY (%) 9.5 5.3 8.8 9.1 15.0 15.4 10.6 10.9 4.6 1.1 0.8 (4.0) (8.2) (10.9) % of total loans 74.0 73.8 72.4 66.5 69.9 69.3 71.8 73.0 72.7 72.4 71.7 70.5 69.8 69.6 NII 2.5 2.6 2.7 2.7 2.8 2.9 2.8 2.7 2.7 2.7 2.9 3.0 3.1 3.1 YoY (%) 4.2 6.5 7.3 12.4 11.7 8.7 5.7 (0.4) (3.6) (4.2) 4.3 10.3 14.7 13.9 Calc. NIM (%) 4.3 4.5 4.4 4.1 3.9 4.0 3.9 3.9 3.8 3.9 4.2 4.3 4.4 4.7 Total Income 30.8 31.0 33.0 32.9 34.0 34.7 35.4 32.8 35.5 33.0 37.7 36.2 36.9 37.7 YoY (%) 3.4 4.4 8.6 11.9 10.4 11.9 7.3 (0.3) 4.4 (4.9) 6.5 10.4 3.9 14.2 PBT 2.0 2.0 2.0 2.0 2.3 2.3 2.4 2.1 2.4 2.1 2.4 2.4 2.3 2.5 YoY (%) 1.5 5.2 1.0 10.9 15.7 11.3 20.2 5.4 3.9 (5.8) (1.6) 9.8 (1.7) 17.4 PAT 1.3 1.3 1.3 1.3 1.5 1.5 1.6 1.4 1.6 1.4 1.6 1.5 1.7 1.9 YoY (%) 2.4 5.6 2.3 10.0 15.4 11.3 20.3 5.3 4.7 (6.1) 2.5 10.1 9.6 34.5 NNPA (Rs mn) 979.1 657.0 904.4 995.1 1,163.3 1,152.0 1,036.7 1,088.4 1,141.8 1,200.0 1,243.8 1,498.4 1,528.7 1,577.2 NNPA (%) 0.42 0.28 0.36 0.36 0.41 0.40 0.37 0.39 0.40 0.43 0.44 0.54 0.56 0.61 Source : Bank, HDFC sec Inst Research
Page | 8

KOTAK MAHINDRA BANK : RESULTS REVIEW 3QFY20
Kotak Sec Snapshot: PAT And M-Share Dip QoQ Rs mn. 2QFY17 3QFY17 4QFY17 1QFY18 2QFY18 3QFY18 4QFY18 1QFY19 2QFY19 3QFY19 4QFY19 1QFY20 2QFY20 3QFY20 K Sec Vol. (bn) 73.3 87.4 104.3 109.8 124.1 150.3 158.4 143.7 341.7 380.8 189.0 212.1 - - Market Share (%) 2.3 2.2 2.2 1.9 1.9 2.0 1.9 1.7 2.5 2.9 2.6 1.7 1.7 1.6 Total Income 2,940 2,870 3,660 3,650 3,510 4,520 4,480 4,150 4,070 3,630 3,960 4,110 4,070 4,090 YoY (%) 8.9 25.9 62.7 53.4 19.4 57.5 22.4 13.7 16.0 (19.7) (11.6) (1.0) - 12.7 Yield (calc.) 0.07 0.05 0.06 0.06 0.05 0.05 0.05 0.05 0.02 0.02 0.03 0.03 NA NA PBT 1,440 1,250 1,820 1,870 1,770 2,310 2,010 1,960 1,690 1,490 1,650 1,680 1,810 1,710 YoY (%) 20.0 50.6 142.7 103.3 22.9 84.8 10.4 4.8 (4.5) (35.5) (17.9) (14.3) 7.1 14.8 PAT 960 850 1,210 1,250 1,180 1,540 1,340 1,300 1,120 990 1,110 1,100 1,490 1,280 YoY (%) 23.1 54.5 137.3 108.3 22.9 81.2 10.7 4.0 (5.1) (35.7) (17.2) (15.4) 33.0 29.3 Kotak AMC Snapshot: AUM Grew ~29/9% and PAT Jumped 20/7% YoY/QoQ Rs mn 2QFY17 3QFY17 4QFY17 1QFY18 2QFY18 3QFY18 4QFY18 1QFY19 2QFY19 3QFY19 4QFY19 1QFY20 2QFY20 3QFY20 AUM (Rs bn) 1,207 1,331 1,413 1,522 1,692 1,829 1,825 1,992 1,994 2,032 2,253 2,368 2,420 2,630 Debt (%) 42.9 44.7 43.1 44.2 41.6 39.2 36.8 40.0 39.0 39.0 39.0 39.0 37.0 38.0 Equity (%) 16.0 16.8 19.6 21.3 23.9 25.6 26.8 26.0 27.0 29.0 28.0 29.0 30.0 30.0 Alt assets (%) 9.0 8.2 5.1 4.3 3.6 3.0 2.7 3.0 3.0 3.0 5.0 5.0 6.0 6.0 Offshore Funds (%) 17.3 16.5 17.4 15.6 16.9 18.0 18.9 17.0 17.0 16.0 14.0 13.0 13.0 12.0 Insurance (%) 14.2 13.0 13.7 13.0 12.3 12.1 12.7 12.0 12.0 12.0 12.0 12.0 13.0 13.0 PMS (%) 0.6 0.8 1.1 1.5 1.7 2.0 2.1 2.0 2.0 1.0 2.0 2.0 1.0 1.0 PBT 110 240 200 210 340 570 580 770 790 1150 1160 1110 1040 1220 YoY (%) (54.2) 84.6 (37.5) (27.6) 209.1 137.5 190.0 266.7 132.4 101.8 100.0 44.2 31.6 6.1 PAT 70 160 130 150 230 380 390 510 520 760 750 730 850 910 YoY (%) (69.6) 300.0 (48.0) (21.1) 228.6 137.5 200.0 240.0 126.1 100.0 92.3 43.1 63.5 19.7 Source : Bank, HDFC sec Inst Research
Page | 9

KOTAK MAHINDRA BANK : RESULTS REVIEW 3QFY20
K M Investment (LAS) Financial Snapshot: Customer Assets Dip, NPAs Rise Rs mn 2QFY17 3QFY17 4QFY17 1QFY18 2QFY18 3QFY18 4QFY18 1QFY19 2QFY19 3QFY19 4QFY19 1QFY20 2QFY20 3QFY20 Customer Assets 55,320 59,590 69,050 65,000 72,300 77,620 79,000 77,050 79,550 79,150 92,420 90,300 78,280 71,470 YoY (%) 37.5 25.2 44.0 33.4 30.7 30.3 14.4 18.5 10.0 2.0 17.0 17.2 (1.6) (9.7) NII 720 740 770 730 760 770 780 720 610 680 920 870 890 870 YoY (%) 14.3 5.7 8.5 9.0 5.6 4.1 1.3 (1.4) (19.7) (11.7) 17.9 20.8 45.9 27.9 Calc. NIM (%) 5.5 5.2 4.8 4.4 4.4 4.1 4.0 3.7 3.1 3.4 4.3 3.8 4.2 4.6 Total Income 930 850 1,000 800 1,000 930 1,530 880 850 800 1,350 1,140 1,120 1,090 YoY (%) 36.8 16.4 17.6 11.1 7.5 9.4 53.0 10.0 (15.0) (14.0) (11.8) 29.5 31.8 36.3 PBT 760 710 830 690 840 770 1380 740 700 610 1110 940 870 840 YoY (%) 38.2 18.3 10.7 13.1 10.5 8.5 66.3 7.2 (16.7) (20.8) (19.6) 27.0 24.3 37.7 PAT 530 480 560 450 550 500 950 480 450 400 730 630 670 640 YoY (%) 47.2 23.1 12.0 12.5 3.8 4.2 69.6 6.7 (18.2) (20.0) (23.2) 31.3 48.9 60.0 NNPA (Rs mn) 66.4 53.6 48.3 58.5 43.4 38.8 7.9 - 31.8 372.0 268.0 577.9 665.4 929.1 NNPA (%) 0.12 0.09 0.07 0.09 0.06 0.05 0.01 - 0.04 0.47 0.29 0.64 0.85 1.30 Source : Bank, HDFC sec Inst Research Change In Estimates
Rs mn FY20E FY21E FY22E
Old New Change Old New Change Old New Change NII 134,535 136,030 1.1% 158,748 156,057 -1.7% 187,351 182,512 -2.6% PPOP 101,473 100,469 -1.0% 119,735 115,172 -3.8% 141,502 135,175 -4.5% PAT 65,128 63,621 -2.3% 77,053 73,716 -4.3% 92,473 88,177 -4.6% ABV (Rs) 239 237 -0.9% 277 275 -0.6% 323 320 -0.8%
Source: HDFC sec Inst Research
Page | 10

KOTAK MAHINDRA BANK : RESULTS REVIEW 3QFY20
Peer Set Comparison
BANK Mcap (Rs bn)
CMP (Rs) Rating TP
(Rs) ABV (Rs) P/E (x) P/ABV (x) ROAE (%) ROAA (%)
FY20E FY21E FY22E FY20E FY21E FY22E FY20E FY21E FY22E FY20E FY21E FY22E FY20E FY21E FY22E ICICIBC# 3,448 535 BUY 580 155 178 207 31.9 16.5 12.0 2.72 2.33 1.97 6.9 12.8 15.4 0.83 1.40 1.65 KMB # 3,092 1,618 NEU 1,681 239 277 323 38.6 31.8 25.8 5.51 4.64 3.87 14.9 15.1 15.7 1.96 2.01 2.07 AXSB 2,049 727 BUY 992 272 314 363 34.1 15.5 12.6 2.57 2.22 1.92 7.5 13.7 14.8 0.68 1.31 1.41 IIB 944 1,332 BUY 1,990 515 582 690 17.5 13.9 11.1 2.59 2.29 1.93 16.8 16.8 18.1 1.78 1.90 1.97 FB 186 94 BUY 122 65 74 84 11.2 9.3 7.5 1.45 1.27 1.12 11.9 13.0 14.4 0.98 1.04 1.12 CUBK 175 239 BUY 265 68 79 91 22.0 19.1 16.7 3.54 3.04 2.61 15.3 15.2 15.0 1.62 1.62 1.61 RBK 167 328 NEU 347 189 211 238 32.2 14.3 10.1 1.74 1.55 1.38 5.7 10.4 13.4 0.58 1.08 1.24 DCBB 61 197 BUY 252 97 113 130 14.9 12.2 9.8 2.04 1.75 1.51 12.4 13.5 14.9 1.07 1.14 1.22 KVB 45 56 NEU 64 54 60 65 13.4 7.6 5.2 1.04 0.94 0.86 5.2 8.9 12.4 0.47 0.76 0.98 SBIN # 2,802 314 BUY 418 182 215 250 12.0 7.6 5.2 1.27 1.07 0.83 7.6 10.9 13.0 0.45 0.64 0.77 AUBANK 268 888 BUY 853 121 148 184 39.5 28.6 22.2 7.31 5.99 4.83 18.1 19.6 20.8 1.80 1.91 1.93
Source: Company, HDFC sec Inst Research, # Adjusted for embedded value of subs
Page | 11

KOTAK MAHINDRA BANK : RESULTS REVIEW 3QFY20
Income Statement (Rs mn) FY18 FY19 FY20E FY21E FY22E
Interest Earned 197,485 239,432 278,184 314,741 364,607
Interest Expended 102,168 126,842 142,154 158,684 182,095
Net Interest Income 95,317 112,590 136,030 156,057 182,512
Other Income 40,522 46,040 51,072 57,419 65,143
Fee Income (CEB) 27,645 33,908 37,142 42,158 48,451 Treasury Income 2,123 709 1,750 2,000 2,250 Total Income 135,839 158,630 187,102 213,476 247,655
Total Operating Exp 64,257 75,148 86,633 98,304 112,481
Employee Expense 29,502 31,836 38,707 44,401 50,738 PPOP 71,582 83,482 100,469 115,172 135,175
Provisions & Contingencies 9,400 9,624 15,449 16,661 17,339
Prov. For NPAs (Incl. Std Prov.) 7,375 9,589 14,549 16,161 16,839 PBT 62,182 73,858 85,020 98,511 117,836
Provision For Tax 21,339 25,205 21,400 24,795 29,659
PAT 40,843 48,653 63,621 73,716 88,177 Source: Bank, HDFC sec Inst Research
Balance Sheet (Rs mn) FY18 FY19 FY20E FY21E FY22E
SOURCES OF FUNDS Share Capital 9,528 9,544 9,544 9,544 9,544
Reserves 365,288 414,440 473,575 542,805 625,936
Shareholders' Funds 374,817 423,984 483,119 552,349 635,480
Savings 655,292 796,847 964,185 1,157,022 1,388,426 Current 322,458 389,010 427,911 470,702 508,358 Term Deposit 948,683 1,072,947 1,153,248 1,275,205 1,493,959 Total Deposits 1,926,433 2,258,804 2,545,344 2,902,929 3,390,743
Borrowings 251,563 327,504 335,691 360,866 396,950
Other Liabilities 96,521 111,430 122,573 140,959 162,103
Total Liabilities 2,649,334 3,121,721 3,486,726 3,957,103 4,585,276
APPLICATION OF FUNDS Cash & Bank Balance 196,201 246,755 269,819 281,771 288,396
Investments 645,623 711,891 781,314 870,167 993,796
G-Secs 517,577 580,630 649,063 725,732 837,514
Advances 1,697,179 2,056,948 2,321,353 2,685,209 3,177,126
Fixed Assets 15,272 16,516 17,341 18,208 19,119
Other Assets 95,059 89,611 96,898 101,746 106,838
Total Assets 2,649,334 3,121,721 3,486,726 3,957,103 4,585,276 Source: Bank, HDFC sec Inst Research
Page | 12

KOTAK MAHINDRA BANK : RESULTS REVIEW 3QFY20
Key Ratios
FY18 FY19 FY20E FY21E FY22E VALUATION RATIOS EPS (Rs) 21.4 25.5 33.3 38.6 46.2 Earnings Growth (%) 19.7 19.1 30.8 15.9 19.6 BVPS (Rs) 183.7 208.9 247.6 283.9 327.5 Core Adj. BVPS (Rs) 175.0 200.8 236.9 275.4 320.4 DPS (Rs) 0.8 0.8 0.8 0.9 0.9 ROAA (%) 1.72 1.70 1.94 1.99 2.07 ROAE (%) 12.5 12.2 14.0 14.2 14.8 P/E (x) 63.0 51.3 39.5 33.2 27.0 P/ABV (x) 7.71 6.52 5.55 4.65 3.90 P/PPOP (x) 21.5 18.5 15.4 13.4 11.4 Dividend Yield (%) 0.0 0.0 0.0 0.0 0.1 PROFITABILITY Yield On Advances (%) 9.63 9.79 10.04 9.99 9.96 Yield On Investment (%) 7.17 7.18 7.00 7.00 7.00 Cost Of Funds (%) 5.16 5.32 5.20 5.16 5.16 Cost Of Deposits (%) 5.11 5.26 5.07 5.04 5.03 Core Spread (%) 4.48 4.46 4.84 4.83 4.79 NIM (%) 4.32 4.20 4.42 4.48 4.54 OPERATING EFFICIENCY Cost/Avg. Asset Ratio (%) 2.7 2.6 2.6 2.6 2.6 Cost-Income Ratio (Ex. Treasury) 48.1 47.6 46.7 46.5 45.8 BALANCE SHEET STRUCTURE Loan Growth (%) 24.7 21.2 12.9 15.7 18.3 Deposit Growth (%) 22.4 17.3 12.7 14.0 16.8 C/D Ratio (%) 88.1 91.1 91.2 92.5 93.7 Equity/Assets (%) 14.1 13.6 13.9 14.0 13.9 Equity/Advances (%) 22.1 20.6 20.8 20.6 20.0 CASA (%) 50.8 52.5 54.7 56.1 55.9 Capital Adequacy Ratio (CAR, %) 18.2 17.5 18.5 18.5 18.1 W/w Tier I CAR (%) 17.6 16.9 18.2 18.2 17.9
FY18 FY19 FY20E FY21E FY22E ASSET QUALITY Gross NPLs (Rs bn) 38.3 44.7 57.2 59.0 61.1 Net NPLs (Rs bn) 16.7 15.4 20.6 16.2 13.4 Gross NPLs (%) 2.22 2.14 2.47 2.20 1.92 Net NPLs (%) 0.98 0.75 0.89 0.60 0.42 Slippages (%) 1.22 1.06 1.60 1.30 1.20 Coverage Ratio (%) 56.5 65.4 64.1 72.6 78.0 Provision/Avg. Loans (%) 0.5 0.5 0.66 0.65 0.57 ROAA TREE Net Interest Income 3.98% 3.90% 4.12% 4.19% 4.27% Non Interest Income 1.69% 1.60% 1.55% 1.54% 1.53% Treasury Income 0.09% 0.02% 0.05% 0.05% 0.05% Operating Cost 2.68% 2.60% 2.62% 2.64% 2.63% Provisions 0.39% 0.33% 0.47% 0.45% 0.41% Provisions For NPAs 0.26% 0.29% 0.42% 0.41% 0.37% Tax 0.89% 0.87% 0.65% 0.67% 0.69% ROAA 1.70% 1.69% 1.93% 1.98% 2.06% Leverage (x) 7.37 7.22 7.29 7.19 7.19 ROAE 12.55% 12.18% 14.03% 14.24% 14.85%
Source: Bank, HDFC sec Inst Research
Page | 13

KOTAK MAHINDRA BANK : RESULTS REVIEW 3QFY20
RECOMMENDATION HISTORY
Rating Definitions BUY : Where the stock is expected to deliver more than 10% returns over the next 12 month period NEUTRAL : Where the stock is expected to deliver (-)10% to 10% returns over the next 12 month period SELL : Where the stock is expected to deliver less than (-)10% returns over the next 12 month period
Date CMP Reco Target 8-Jan-19 1,248 BUY 1,415
22-Jan-19 1,268 BUY 1,400 9-Apr-19 1,342 BUY 1,458 2-May-19 1,387 BUY 1,481 9-Jul-19 1,475 BUY 1,481
22-Jul-19 1,454 NEU 1,531 22-Sep-19 1,539 NEU 1,584 9-Oct-19 1,612 NEU 1,638
23-Oct-19 1,614 NEU 1,622 9-Jan-20 1,655 NEU 1,690
21-Jan-20 1,618 NEU 1,681
1,100
1,200
1,300
1,400
1,500
1,600
1,700
1,800
Jan-
19
Feb-
19
Mar
-19
Apr-
19
May
-19
Jun-
19
Jul-1
9
Aug-
19
Sep-
19
Oct
-19
Nov
-19
Dec-
19
Jan-
20
Kotak Mahindra Bank TP
HDFC securities Institutional Equities Unit No. 1602, 16th Floor, Tower A, Peninsula Business Park, Senapati Bapat Marg, Lower Parel, Mumbai - 400 013 Board : +91-22-6171 7330 www.hdfcsec.com
Page | 14

KOTAK MAHINDRA BANK : RESULTS REVIEW 3QFY20
Disclosure: We, Darpin Shah, MBA, Aakash Dattani, ACA & Punit Bahlani, ACA, authors and the names subscribed to this report, hereby certify that all of the views expressed in this research report accurately reflect our views about the subject issuer(s) or securities. HSL has no material adverse disciplinary history as on the date of publication of this report. We also certify that no part of our compensation was, is, or will be directly or indirectly related to the specific recommendation(s) or view(s) in this report. Research Analyst or his/her relative or HDFC Securities Ltd. does not have any financial interest in the subject company. Also Research Analyst or his relative or HDFC Securities Ltd. or its Associate may have beneficial ownership of 1% or more in the subject company at the end of the month immediately preceding the date of publication of the Research Report. Further Research Analyst or his relative or HDFC Securities Ltd. or its associate does not have any material conflict of interest. Any holding in stock –No HDFC Securities Limited (HSL) is a SEBI Registered Research Analyst having registration no. INH000002475. Disclaimer: This report has been prepared by HDFC Securities Ltd and is solely for information of the recipient only. The report must not be used as a singular basis of any investment decision. The views herein are of a general nature and do not consider the risk appetite or the particular circumstances of an individual investor; readers are requested to take professional advice before investing. Nothing in this document should be construed as investment advice. Each recipient of this document should make such investigations as they deem necessary to arrive at an independent evaluation of an investment in securities of the companies referred to in this document (including merits and risks) and should consult their own advisors to determine merits and risks of such investment. The information and opinions contained herein have been compiled or arrived at, based upon information obtained in good faith from sources believed to be reliable. Such information has not been independently verified and no guaranty, representation of warranty, express or implied, is made as to its accuracy, completeness or correctness. All such information and opinions are subject to change without notice. Descriptions of any company or companies or their securities mentioned herein are not intended to be complete. HSL is not obliged to update this report for such changes. HSL has the right to make changes and modifications at any time. This report is not directed to, or intended for display, downloading, printing, reproducing or for distribution to or use by, any person or entity who is a citizen or resident or located in any locality, state, country or other jurisdiction where such distribution, publication, reproduction, availability or use would be contrary to law or regulation or what would subject HSL or its affiliates to any registration or licensing requirement within such jurisdiction. If this report is inadvertently sent or has reached any person in such country, especially, United States of America, the same should be ignored and brought to the attention of the sender. This document may not be reproduced, distributed or published in whole or in part, directly or indirectly, for any purposes or in any manner. Foreign currencies denominated securities, wherever mentioned, are subject to exchange rate fluctuations, which could have an adverse effect on their value or price, or the income derived from them. In addition, investors in securities such as ADRs, the values of which are influenced by foreign currencies effectively assume currency risk. It should not be considered to be taken as an offer to sell or a solicitation to buy any security. This document is not, and should not, be construed as an offer or solicitation of an offer, to buy or sell any securities or other financial instruments. This report should not be construed as an invitation or solicitation to do business with HSL. HSL may from time to time solicit from, or perform broking, or other services for, any company mentioned in this mail and/or its attachments. HSL and its affiliated company(ies), their directors and employees may; (a) from time to time, have a long or short position in, and buy or sell the securities of the company(ies) mentioned herein or (b) be engaged in any other transaction involving such securities and earn brokerage or other compensation or act as a market maker in the financial instruments of the company(ies) discussed herein or act as an advisor or lender/borrower to such company(ies) or may have any other potential conflict of interests with respect to any recommendation and other related information and opinions. HSL, its directors, analysts or employees do not take any responsibility, financial or otherwise, of the losses or the damages sustained due to the investments made or any action taken on basis of this report, including but not restricted to, fluctuation in the prices of shares and bonds, changes in the currency rates, diminution in the NAVs, reduction in the dividend or income, etc. HSL and other group companies, its directors, associates, employees may have various positions in any of the stocks, securities and financial instruments dealt in the report, or may make sell or purchase or other deals in these securities from time to time or may deal in other securities of the companies / organizations described in this report. HSL or its associates might have managed or co-managed public offering of securities for the subject company or might have been mandated by the subject company for any other assignment in the past twelve months. HSL or its associates might have received any compensation from the companies mentioned in the report during the period preceding twelve months from t date of this report for services in respect of managing or co-managing public offerings, corporate finance, investment banking or merchant banking, brokerage services or other advisory service in a merger or specific transaction in the normal course of business. HSL or its analysts did not receive any compensation or other benefits from the companies mentioned in the report or third party in connection with preparation of the research report. Accordingly, neither HSL nor Research Analysts have any material conflict of interest at the time of publication of this report. Compensation of our Research Analysts is not based on any specific merchant banking, investment banking or brokerage service transactions. HSL may have issued other reports that are inconsistent with and reach different conclusion from the information presented in this report. Research entity has not been engaged in market making activity for the subject company. Research analyst has not served as an officer, director or employee of the subject company. We have not received any compensation/benefits from the subject company or third party in connection with the Research Report. HDFC securities Limited, I Think Techno Campus, Building - B, "Alpha", Office Floor 8, Near Kanjurmarg Station, Opp. Crompton Greaves, Kanjurmarg (East), Mumbai 400 042 Phone: (022) 3075 3400 Fax: (022) 2496 5066 Compliance Officer: Binkle R. Oza Email: [email protected] Phone: (022) 3045 3600 HDFC Securities Limited, SEBI Reg. No.: NSE, BSE, MSEI, MCX: INZ000186937; AMFI Reg. No. ARN: 13549; PFRDA Reg. No. POP: 11092018; IRDA Corporate Agent License No.: HDF 2806925/HDF C000222657; SEBI Research Analyst Reg. No.: INH000002475; SEBI Investment Adviser Reg. No.: INA000011538; CIN - U67120MH2000PLC152193 Mutual Funds Investments are subject to market risk. Please read the offer and scheme related documents carefully before investing.
Page | 15