neutron imaging study of the water transport in operating ... · neutron imaging study of the water...
TRANSCRIPT

Neutron Imaging Study of the Water Transport in Operating Fuel Cells
Presented by: David Jacobson Daniel Hussey
Eli Baltic Muhammad Arif, PI
Physical Measurement Laboratory
National Institute of Standards and Technology Gaithersburg, MD 20899
Thursday May 17, 2012
This presentation does not contain any proprietary, confidential, or otherwise restricted information
FC021

Overview Timeline
Project Start Date: Fiscal Year (FY) 2001 Project End Date: Project continuation
and direction determined annually by DOE
Percent Complete:100% for each year
Barriers
Budget Partners/Users/Collaborators
(A) Durability (C) Performance (D) Water Transport within the Stack
Project Lead: National Institute of Standards and Technology
• Ballard • Ford • General Motors • Georgia Tech • Lawrence Berkeley
National Laboratory • Los Alamos National
Laboratory • Michigan Technological
University • Nissan • NOVA Scientific • Nuvera • Oak Ridge National
Laboratory
• Pennsylvania State University
• Rochester Institute of Technology
• Sandia National Laboratories
• Sensor Sciences • University of California,
Berkeley • University of Connecticut • University of Kansas • University of Michigan • University of Tennessee • Wayne State University
Project funding FY 2011 DOE: $ 590 k NIST: $ 2100 k Industry: $ 275 k
Project funding FY 2012 DOE: $ 300 k NIST : $ 600 k Industry: $ 250 k Total $ 1,175 k
Relevance/Objectives
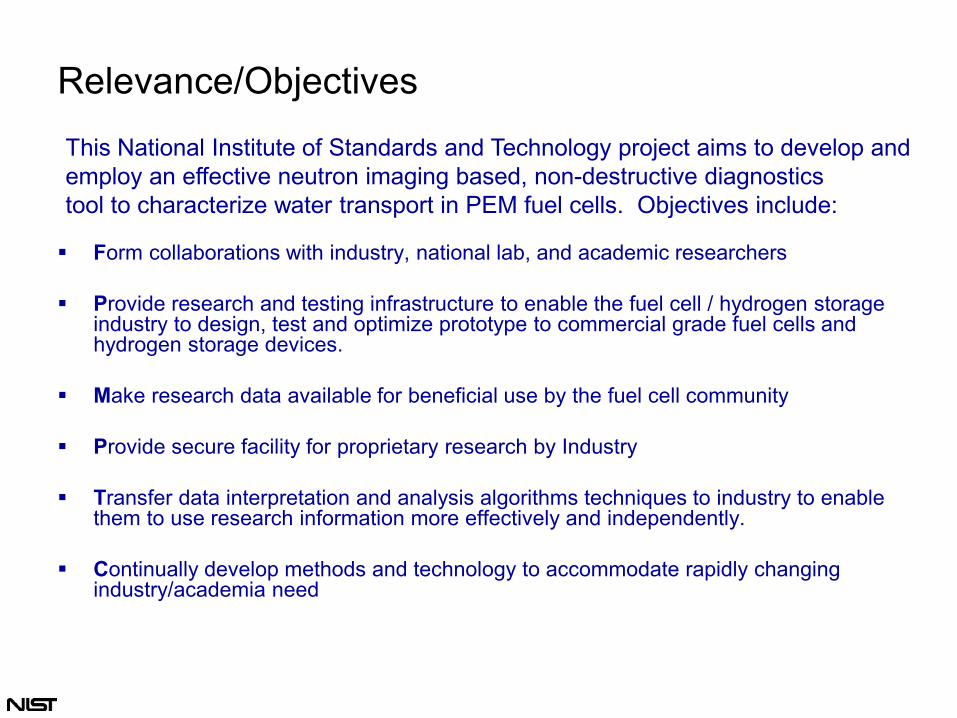
Form collaborations with industry, national lab, and academic researchers Provide research and testing infrastructure to enable the fuel cell / hydrogen storage
industry to design, test and optimize prototype to commercial grade fuel cells and hydrogen storage devices.
Make research data available for beneficial use by the fuel cell community
Provide secure facility for proprietary research by Industry
Transfer data interpretation and analysis algorithms techniques to industry to enable them to use research information more effectively and independently.
Continually develop methods and technology to accommodate rapidly changing industry/academia need
This National Institute of Standards and Technology project aims to develop and employ an effective neutron imaging based, non-destructive diagnostics tool to characterize water transport in PEM fuel cells. Objectives include:
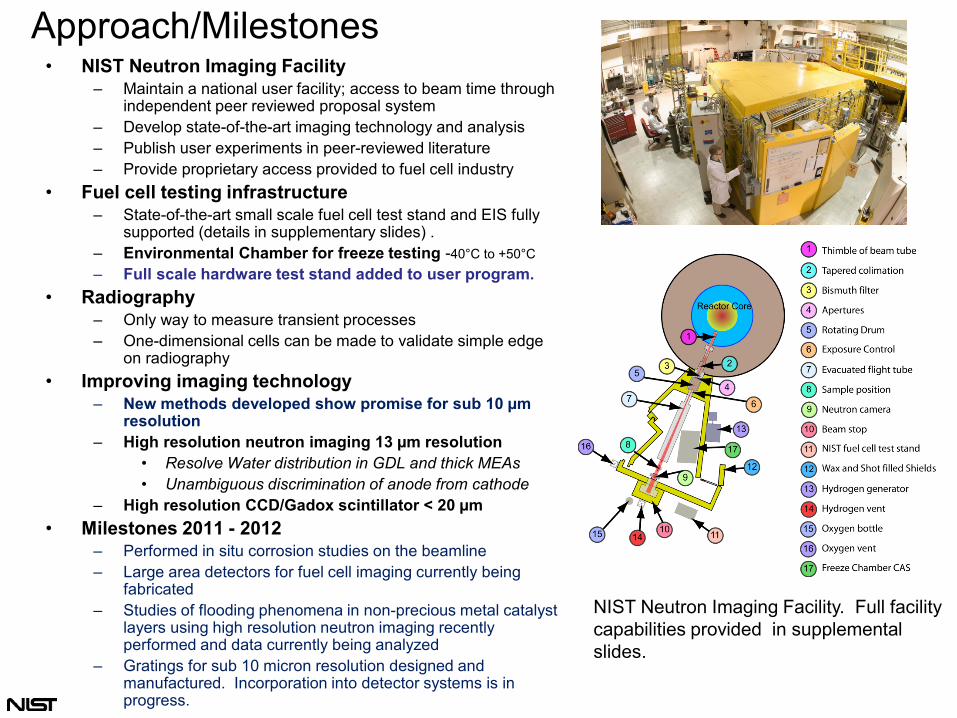
Approach/Milestones • NIST Neutron Imaging Facility
– Maintain a national user facility; access to beam time through independent peer reviewed proposal system
– Develop state-of-the-art imaging technology and analysis – Publish user experiments in peer-reviewed literature – Provide proprietary access provided to fuel cell industry
• Fuel cell testing infrastructure – State-of-the-art small scale fuel cell test stand and EIS fully
supported (details in supplementary slides) . – Environmental Chamber for freeze testing -40°C to +50°C – Full scale hardware test stand added to user program.
• Radiography – Only way to measure transient processes – One-dimensional cells can be made to validate simple edge
on radiography • Improving imaging technology
– New methods developed show promise for sub 10 µm resolution
– High resolution neutron imaging 13 µm resolution • Resolve Water distribution in GDL and thick MEAs • Unambiguous discrimination of anode from cathode
– High resolution CCD/Gadox scintillator < 20 µm • Milestones 2011 - 2012
– Performed in situ corrosion studies on the beamline – Large area detectors for fuel cell imaging currently being
fabricated – Studies of flooding phenomena in non-precious metal catalyst
layers using high resolution neutron imaging recently performed and data currently being analyzed
– Gratings for sub 10 micron resolution designed and manufactured. Incorporation into detector systems is in progress.
NIST Neutron Imaging Facility. Full facility capabilities provided in supplemental slides.

NCNR Expansion/Shutdown April 2010 – April 2011

New facility infrastructure Full Scale Hardware Test Stand • Allows testing full scale hardware • Hydrogenics G300 • Full scale hardware • 800 W • Hydrogen: 0.065 slpm – 11.31 slpm • Air: 0.239 slpm – 26.92 slpm • Load bank:
– Current: 6 A -1000 A @ 0.2 V – Voltage: 0 V – 50 V – Liquid cell coolant D2O or DI-water
• Temperature: 20 ºC – 85 ºC • Pressure: 0 – 400 kPaA • Contact humidification:
– Dewpoint: 35 ºC – 85 ºC – Gas Temp: 95 ºC
Micro test stand upgrades • Dual liquid coolant control • Upgraded pressure transducers allows
for running sub atmospheric pressure
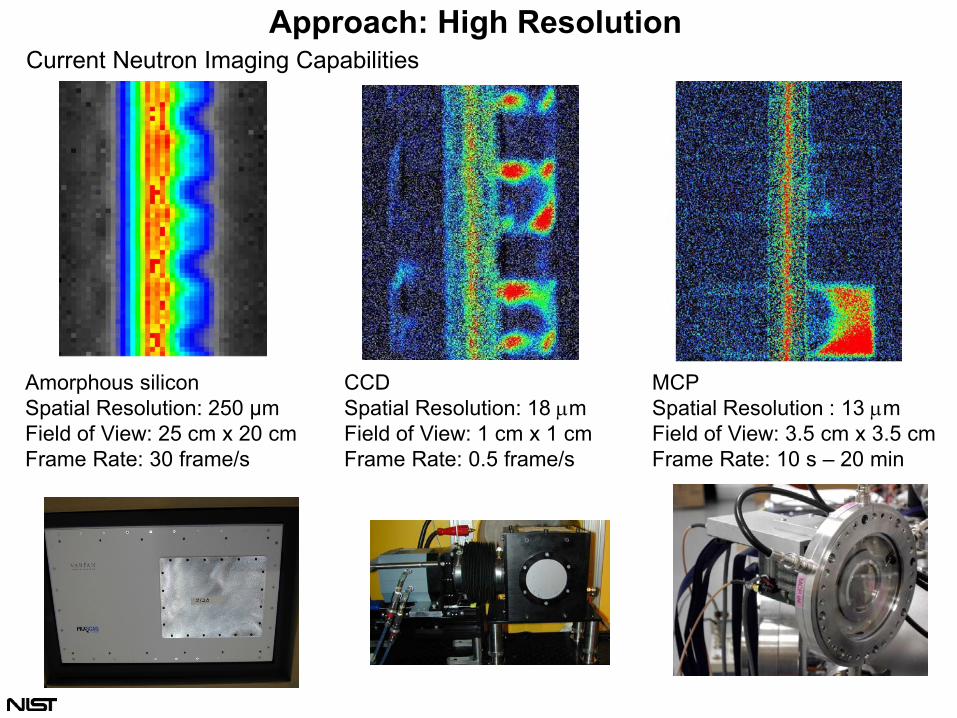
Approach: High Resolution
Amorphous silicon Spatial Resolution: 250 µm Field of View: 25 cm x 20 cm Frame Rate: 30 frame/s
MCP Spatial Resolution : 13 µm Field of View: 3.5 cm x 3.5 cm Frame Rate: 10 s – 20 min
CCD Spatial Resolution: 18 µm Field of View: 1 cm x 1 cm Frame Rate: 0.5 frame/s
Current Neutron Imaging Capabilities

Technical Accomplishments
• Large Format CCD Camera – Big CCD: 100 MP (10k x 10k) two
readout modes, 10 s, 120 s, – 4 e- read noise. – 9 um pixel pitch
• Large Format MCP – 10 cm field of view – 15 micron resolution
• sCMOS – 5 MP camera, – 6.5 um pixel pitch, – 100 fps (rolling) 1 e- read noise, – cools to -40°C

New 10 cm x 10 cm MCP Detector making progress New improved micro-channel plate coatings were tested and show enhanced performance and almost no loss in performance with use. Left is a photo of a plate and right shows the uniform gain map of the new plate. New coating technology results in better tuned plates and increases the lifetime of the system.
Left shows new electron centroiding grid.
Right shows new readout electronics mounted on detector.
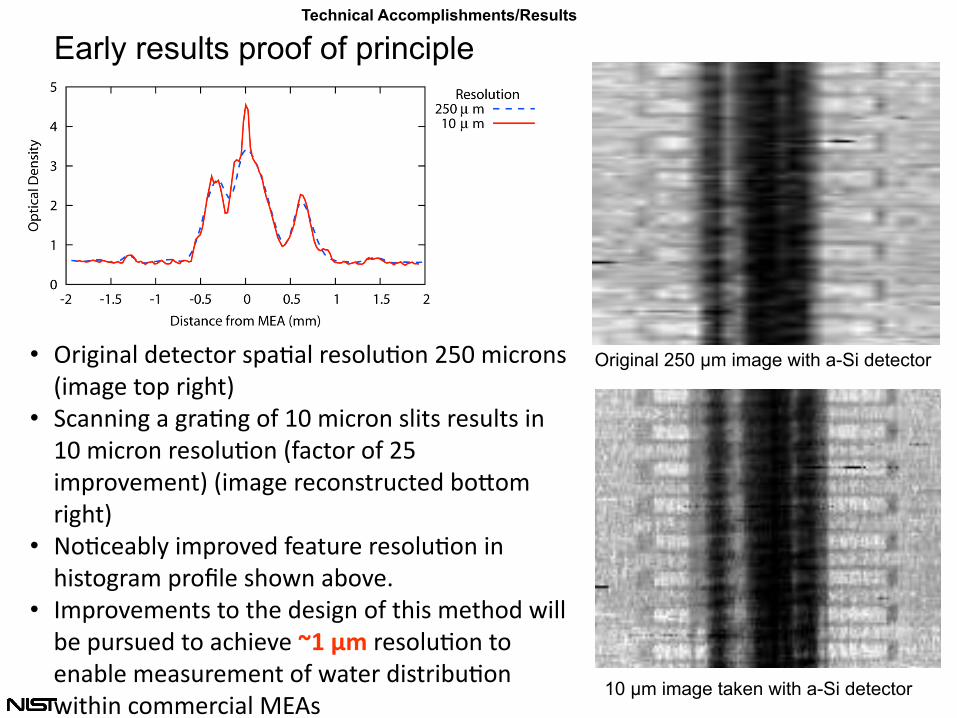
Early results proof of principle
•! ?(%4%0/1$+"2",2)($5'/3/1$("5)173)0$@AB$&%,()05$C%&/4"$2)'$(%4.2D$
•! E,/00%04$/$4(/304$)6$FB$&%,()0$51%25$("57125$%0$FB$&%,()0$("5)173)0$C6/,2)($)6$@A$%&'()*"&"02D$C%&/4"$(",)052(7,2"+$<)=)&$(%4.2D$
•! !)3,"/<1;$%&'()*"+$6"/27("$("5)173)0$%0$.%52)4(/&$'()G1"$5.)#0$/<)*"8$
•! H&'()*"&"025$2)$2."$+"5%40$)6$2.%5$&"2.)+$#%11$<"$'7(57"+$2)$/,.%"*"$!"#$%#("5)173)0$2)$"0/<1"$&"/57("&"02$)6$#/2"($+%52(%<73)0$#%2.%0$,)&&"(,%/1$IJK5$
Original 250 !m image with a-Si detector
10 !m image taken with a-Si detector
Technical Accomplishments/Results

Path towards 2 µm spatial resolution…
• Spatial resolution is limited by physics to approximately 10 µm.
• However a sub 10 µm neutron absorbing mask can overcome this limitation.
• Mask must be scanned in order to form an image.
• Optimized mask is a series of slits know as a grating.
• NIST Nanofab lab is a national user facility that is being used to fabricate gratings.
• Gadolinium has a very neutron large cross section and is ideal for grating fabrication.
Gadolinium grating: Optical microscope image of Gd-coated 2 µm wide combs on 25 µm period.
Create 1-2 µm wide combs in Si on 25 µm -50 µm periods
Coat surface with thick Gd film (5 µm -10 µm)
Use chemical-mechanical polishing to expose silicon resulting in a 1 µm -2 µm
wide neutron slit

New Energy Selective Neutron Imaging Feature
Thermal Neutron Imaging Max Beam = 26 cm in diameter (at sample) L/d Ratio = 6000 - 300 Fluence = 7.5x10⁵ - 3.0x10⁷
Resolution = < 15 micrometer Detectors = CCD, MCP, aSi, sCMOS Low Temp. = - 40 OC (Fuel Cells) = Cryostat for hydrogen storage Energy Selective Neutron Imaging • Vertical Double Crystal PG(002)
Monochromator Assembly • Range 0.075 nm – 0.35 nm • Refined Quantification of Polychromatic
Images

Imaging with cold neutrons • In the process of
designing a beamline for cold neutron imaging
• Multi-purpose facility • Fuel cell applications:
– Determine volume fraction of ice and water by tuning wavelengths
– High resolution imaging may realize better counting statistics through use of new optics
• Anticipate design complete summer 2012
• Begin testing 2013
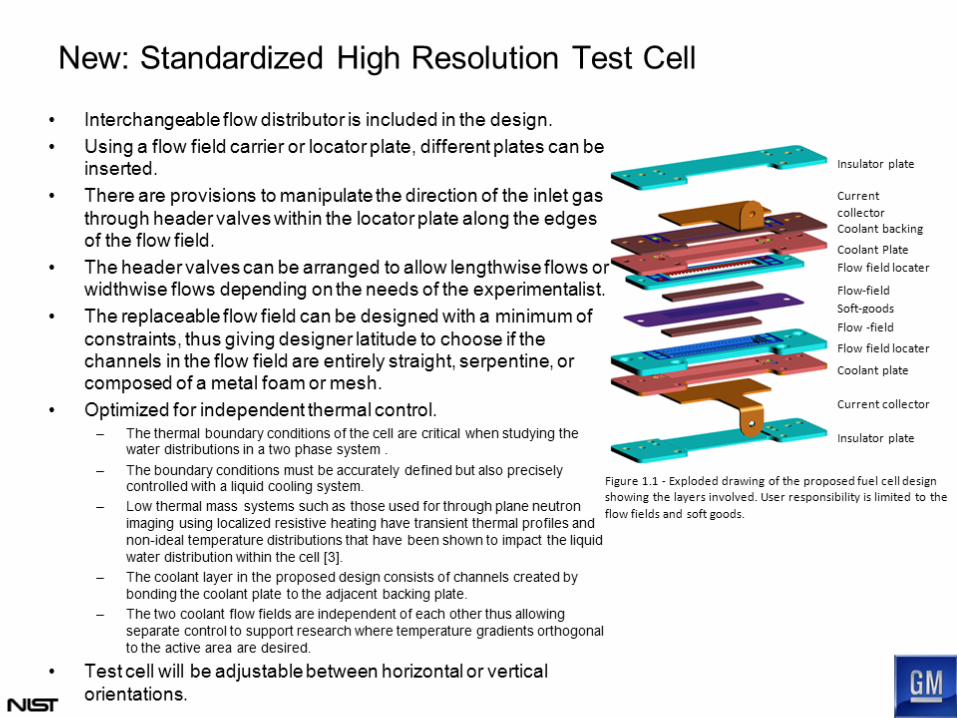

New: Standardized High Resolution Test Cell Fixture • The cell fixture shown with the cell carriage oriented in the two
directions. • The adjustment process is simple but rigid and gives the user the
opportunity to quickly re-build the cell in place regardless of experimental configuration.
• To ensure repeatable and well controlled build conditions for material studies, two measurement systems related to displacement are included in the cell fixture.
• Users can choose either fixed displacement or load compression by using the load cell and/or the linear variable differential transformer (LVDT) measuring systems that are fully integrated into the fixture.
– The load and displacement measured by the transducers will be displayed on digital interfaces mounted onto the fixture.
– A precision screw jack is used to provide displacement and its shaft is mated to a load cell attached to the fuel cell.
– The LVDTs measure the relative distance between the compression plates at both ends to ensure the correct compression.
– The end plates, bearings and guide rails are all sized to ensure uniform compression in the cell.
• These interfaces will sever two purposes, first the complex experimental set-up will be more organized, and second the test fixture can be installed and removed from the beamline quickly.
• Status: – Built. – Documentation and validation in progress.
• Demo video: – http://www.pemfcdata.org – http://www.youtube.com/watch?v=E9VRnb1_qKg

Collaborator work presented here • J.J. Gagliardo, J.P. Owejan, General Motors
• R. Borup, R. Mukundan, J. Davey, J. Spendelow,
T. Rockward, D. Spernjak, J. Fairweather, G. Wu, B. Li, P. Zelenay, Los Alamos National Laboratory
• William A. Rigdon, Xinyu Huang, University of South Carolina
• Kyu Taek Cho, Lawrence Berkeley National Laboratory
• Ahmet Turhan, and Matthew M. Mench Electrochemical Energy Storage and Conversion Laboratory, Mechanical, Aerospace, and Biomedical Engineering, The University of Tennessee/Oak Ridge National Laboratory
Technical Accomplishments/Results
University of South Carolina

0.2 A/cm2 OCV
Cathode: Pt/C 50-55 µm thick
RH100, 206 kPa, 80°C
Nafion ®117, Cloth GDL
3 mm
0 mm
Water thickness
0.4 A/cm2
Flooding in non-precious metal cathode catalysts
Cathode: NPMC (PANI) 70-80 µm thick
RH100, 206 kPa, 80°C
Nafion ®117, Cloth GDL
D. Spernjak, J. Fairweather, P. Zelenay, G. Wu, M. Rangachary, R. Borup, LANL
PEM Cathode Catalyst
The OCV data suggests that the NPMC / PEM interface maybe hygroscopic. The component demarcations are for the NPMC and not exact for the Pt. In general, the NPMC has ~2x the water holdup as the Pt/C catalyst.
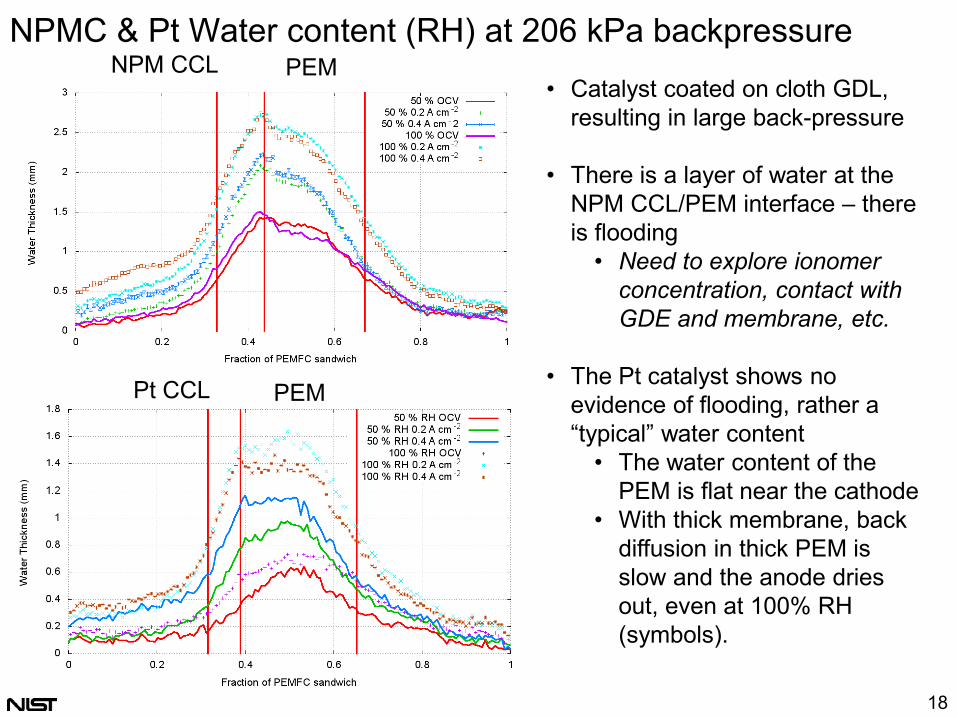
NPMC & Pt Water content (RH) at 206 kPa backpressure • Catalyst coated on cloth GDL,
resulting in large back-pressure
• There is a layer of water at the NPM CCL/PEM interface – there is flooding • Need to explore ionomer
concentration, contact with GDE and membrane, etc.
• The Pt catalyst shows no
evidence of flooding, rather a “typical” water content • The water content of the
PEM is flat near the cathode • With thick membrane, back
diffusion in thick PEM is slow and the anode dries out, even at 100% RH (symbols).
PEM NPM CCL
18
PEM Pt CCL
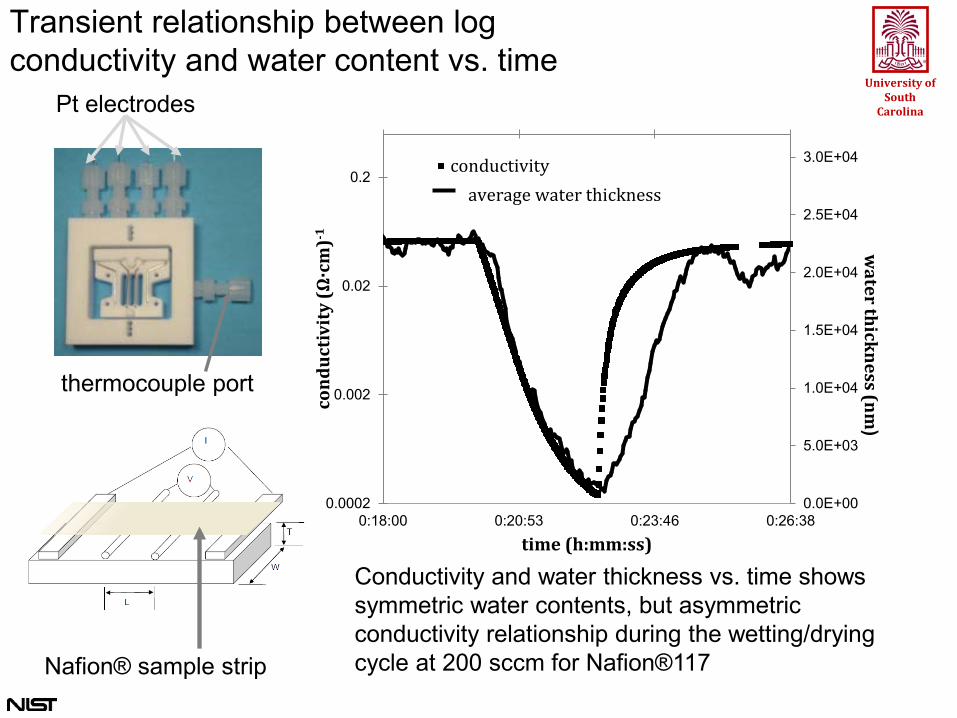
Nafion® sample strip
Pt electrodes
thermocouple port
Conductivity and water thickness vs. time shows symmetric water contents, but asymmetric conductivity relationship during the wetting/drying cycle at 200 sccm for Nafion®117
Transient relationship between log conductivity and water content vs. time
University of South
Carolina
0.0E+00
5.0E+03
1.0E+04
1.5E+04
2.0E+04
2.5E+04
3.0E+04
0.0002
0.002
0.02
0.2
0:18:00 0:20:53 0:23:46 0:26:38
cond
uctiv
ity
(Ω·c
m)-1
time (h:mm:ss)
conductivity
water thickness (nm
)
average water thickness

H2-D2 contrast NR
DM: SGL 10BA W/O MPL 0.2A/cm2 with H2/Air(2/2)
60°C (RH80%)
Switch To D2
Water accumulation Replaced with D2O |AND CH|DM|MEA|DM|CTD CH|
0 - 6 min 6 - 15 min 15 - 27 min
Land
Land
Land
Basic principle - Light water (H2O) is a strong attenuator for neutron beams in comparison to heavy water (D2O) which is almost transparent.
Large difference in neutron attenuation of the D2O produced at the cathode used to track the movement of the product water

H2-D2 contrast NR: DM W/O MPL
- Water decreased in cathode DM : generated D2O mainly moves to cathode DM, whereas its moving to anode DM is negligible
Water amount variation with D2O generation
- Significant fraction of water remained in DM at the steady condition : immobile water was different for location.

H2-D2 contrast NR: DM W/ MPL
: Water amount decreased in anode DM as well as cathode DM generated D2O moves to anode DM as well as cathode DM. validate the capillary barrier to pressurize and force liquid water away from cathode DM to anode
Redistribution of generated water
Main role of MPL: redistribution of generated water

H2-D2 contrast: Conclusion
• Role of MPL was understood - Redistribute the generated water through porous cell components mitigate flooding in the cathode side and increase tolerance to drier gas condition on the anode side • Effect of operating current on water content - At low current, water resides in disconnected and randomly distributed form (pendular regime). As current increases, the water state changes to the correlated distribution (or funicular regime), promoting water transport out of the pores by capillary action and accordingly decreasing water content • Immobile liquid water - Significant fraction of water was found to be immobile during operation - Amount was changed with operating condition and application of MPL

Future Work • Continue to develop advanced imaging methods for fuel cell research
– Apply encouraging new high resolution techniques to improve the spatial resolution to sub 10 micrometers with a goal of 1-2 micrometer
– Can be applied to large scale fuel cell stacks. • Continued advancement of imaging technology and capabilities at the
facility – Improve field of view while maintaining spatial resolution to look at larger fuel
cells – Measure the water content in an operating fuel cell membrane electrode
assembly with a resolution of at least 5 micrometers. – Correction algorithms for systematic uncertainties in the measurement of the
in-plane water content of fuel cells are demonstrated and published. • Add new cold neutron imaging capabilities by designing new facility to be
built for expansion of the NCNR

Summary of Technical Accomplishments/Results Presented • Ultra-High Resolution Experiments
– Developed illumination system to achieve ~1 micrometer spatial resolution to overcome conventionally accepted 10 micrometer resolution limit for MEA imaging.
– Demonstrated method by improving a detector with 250 micrometer resolution to a spatial resolution of 10 µm; a 25 fold improvement.
• LANL Study of non-precious metal catalysts – Neutron imaging showed that the PANI-derived catalyst is hygroscopic – Fabrication methods can be modified to reduce pressure drop and boost performance
• USC Transient Membrane Hydration & Conductivity – On wetting, conductivity rises more quickly than steady-state correlation with λ – On drying, conductivity follows steady-state correlation with λ
• U Tenn D2/H2 contrast radiography – MPL is seen to distribute generated water throughout the PEMFC sandwich – Without an MPL, generated water is primarily in the cathode GDL

Technical Back-Up Slides
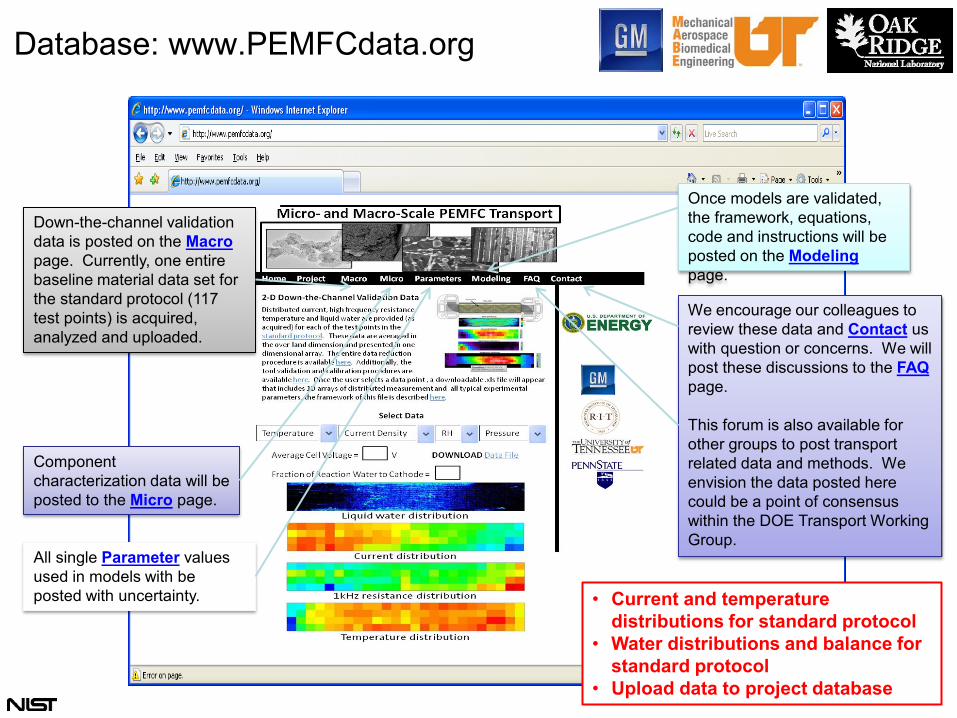
Database: www.PEMFCdata.org
• Current and temperature distributions for standard protocol
• Water distributions and balance for standard protocol
• Upload data to project database
Down-the-channel validation data is posted on the Macro page. Currently, one entire baseline material data set for the standard protocol (117 test points) is acquired, analyzed and uploaded.
We encourage our colleagues to review these data and Contact us with question or concerns. We will post these discussions to the FAQ page. This forum is also available for other groups to post transport related data and methods. We envision the data posted here could be a point of consensus within the DOE Transport Working Group.
Component characterization data will be posted to the Micro page.
Once models are validated, the framework, equations, code and instructions will be posted on the Modeling page.
All single Parameter values used in models with be posted with uncertainty.

Insulator plate
Current collector Coolant backing plate Coolant Plate Flow field locater plate Flow-field Soft-goods Flow -field Flow field locater plate Coolant plate
Insulator plate
Current collector
Figure 1.1 - Exploded drawing of the proposed fuel cell design showing the layers involved. User responsibility is limited to the flow fields and soft goods.
Standardized High Resolution Test Cell and Mounting Fixture
Engineered with multiple flow fields so that users only need to bring soft goods. Soft goods can be exchanged in situ. Additional details in backup slides Demo video: http://www.pemfcdata.org http://www.youtube.com/watch?v=E9VRnb1_qKg

Neutrons are an excellent probe for hydrogen in metal since metals can have a much smaller cross section to thermal neutrons than hydrogen does.
Comparison of the relative size of the x-ray and thermal neutron scattering cross section for various elements.
x-ray cross section H D C O Al Si Fe
neutron cross section
0I tNeII σ−= 0
Sample
t
• N – numerical density of sample atoms per cm3
• I0 - incident neutrons per second per cm2
• σ - neutron cross section in ~ 10-24 cm2
• t - sample thickness
Why Neutrons
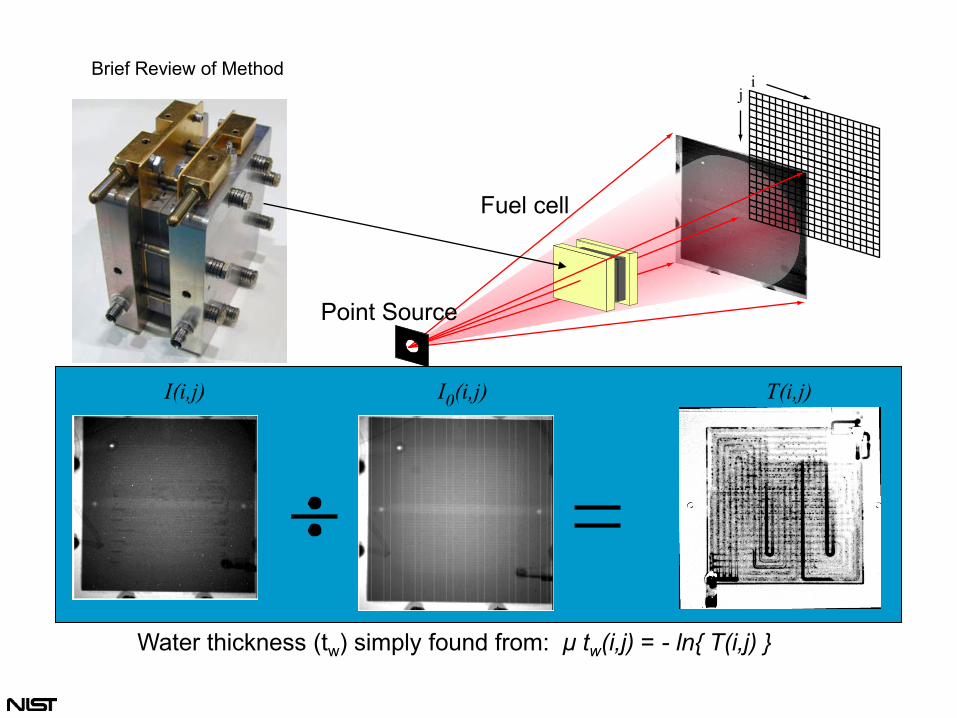
Point Source
Fuel cell
Water thickness (tw) simply found from: μ tw(i,j) = - ln{ T(i,j) }
Brief Review of Method
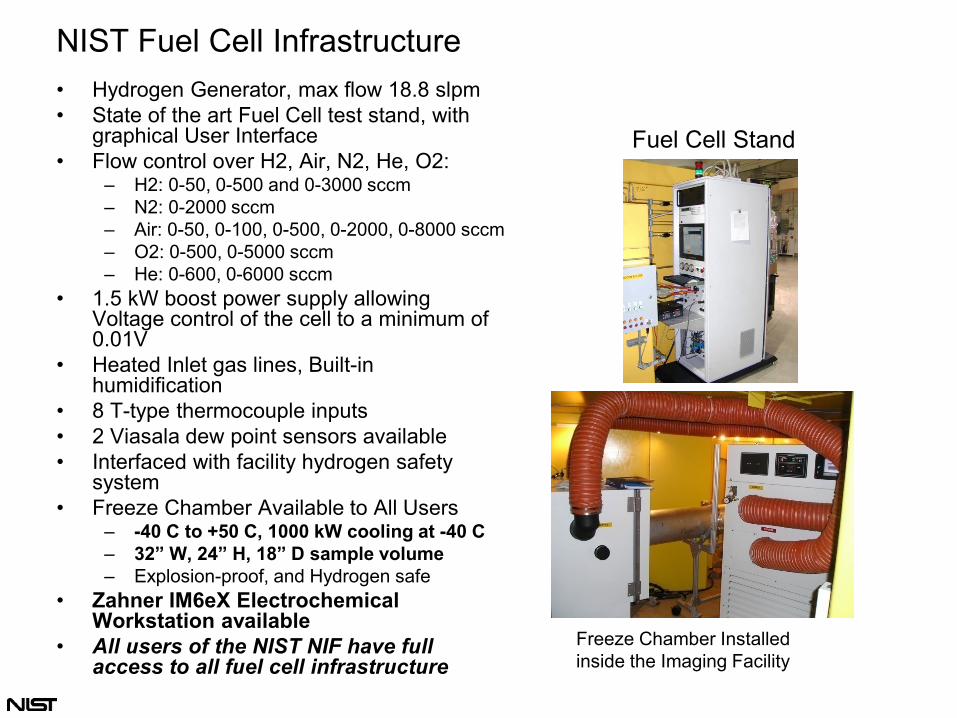
NIST Fuel Cell Infrastructure • Hydrogen Generator, max flow 18.8 slpm • State of the art Fuel Cell test stand, with
graphical User Interface • Flow control over H2, Air, N2, He, O2:
– H2: 0-50, 0-500 and 0-3000 sccm – N2: 0-2000 sccm – Air: 0-50, 0-100, 0-500, 0-2000, 0-8000 sccm – O2: 0-500, 0-5000 sccm – He: 0-600, 0-6000 sccm
• 1.5 kW boost power supply allowing Voltage control of the cell to a minimum of 0.01V
• Heated Inlet gas lines, Built-in humidification
• 8 T-type thermocouple inputs • 2 Viasala dew point sensors available • Interfaced with facility hydrogen safety
system • Freeze Chamber Available to All Users
– -40 C to +50 C, 1000 kW cooling at -40 C – 32” W, 24” H, 18” D sample volume – Explosion-proof, and Hydrogen safe
• Zahner IM6eX Electrochemical Workstation available
• All users of the NIST NIF have full access to all fuel cell infrastructure
Fuel Cell Stand
Freeze Chamber Installed inside the Imaging Facility