new books - actuaries.org.hk · new books for your company’s ... reserve 3,276 3,343 3,331 3,304...
TRANSCRIPT

New BooksFor Your Company’s
Financial Statements and Financial LibraryIAS • US GAAP • M&A
An hour and a half presentation on the directions, outcomes and timetables for International Accounting Standards
andAn introduction of the new content in two new Society of Actuaries textbooks
U.S. GAAP for Life Insurers, Second Edition and
Insurance Industry Mergers & Acquisitions
Presented byR. Thomas (Tom) Herget, FSA, MAAA
PolySystems, [email protected] January, 2006

2
IntroductionIntroduction
• My firm – PolySystems– Employees– Locations: Chicago
and Philadelphia– Clients– Products
• Software• Installation• Consulting
– Specialties• Valuation• Projections• Financial reporting• Experience Measurement• Asset Liability Management
• Education– University of Illinois – Fellow of Society of Actuaries
• Employment– Two larger insurers– CPA firm– PolySystems
• Volunteer work– American Academy of Actuaries
• SFAS 97 testimony• Financial Reporting Council
– Society of Actuaries• Financial Reporting chair• Board of Governors• Strategic Action Team –
Knowledge Management

3
Financial Reporting EvolutionFinancial Reporting Evolution
• Balance sheet– Retrospective or prospective– Significant estimates for insurance
• Income statement– Estimates impacting timing of profits, not actual profits– Operating income or “below the line”
• Investors’ needs in 1970– U.S. statutory – good year was a bad year; bad year was a good year– Needed focus on earnings
• Initial GAAP focused on revenue/expense matching• Investment-oriented products (1980s)• SFAS 115 and shift from income statement to balance
sheet orientation– Concern that GAAP value does not come close to market capitalization

4
U.S. GAAP Today – F.A.S.B.U.S. GAAP Today – F.A.S.B.
• Financial Accounting Standards Board
– Authority• SEC (created by Congress) has
authority for financial accounting and reporting standards
• SEC created FASB in 1973 and delegated this authority to it
• Is independent of all business and professional organizations
– Composition• Seven members• Serve for 5 years• From public, private and academic;
diverse backgrounds sought• Members must sever connections
with prior firm• Terms staggered so one or two new
members each year
– Selection – by oversight body (Financial Accounting Foundation)
– Staff• Nearly 70 professions from
public accounting, industry, academia and government
• Project management, research, roundtable meetings, analysis of comments, recommendation preparation
– Funding – from two sources• Fees assessed against issuers of
securities• Fees for publications and
securities

5
U.S. GAAP TodayU.S. GAAP Today
• Shapers, users and environment of U.S. GAAP and financial reporting today
• SEC• FASB• AICPA• Company management• Stock analysis• Rating agencies• Accounting firms
• Fair Value Direction– Desire to consider FV direction
(stated in SFAS 115, paragraph 56)– Should conform to International Accounting Standards (IAS)

6
IAS Inception to DateIAS Inception to Date
• IASB (International Accounting Standards Board)– Independent, privately funded (200 organizations), London-based– Why common standard?
• Widely different practices in different countries• Globalization of business and capital markets
– Objective – develop accounting standards that result in• Clear financial statements• Understood by knowledgeable users• Can be compared across countries and companies
• Earlier Accomplishments in Insurance– Started 1997– 1999 Issues paper – generated 138 comments which led to– 2001 Draft Statement of Principles– Not do-able by 2005, so split into Phases 1 and 2
• Allowed to use existing GAAP as long as it had loss recognition and more disclosures provided
• IFRS 4 – a temporary standard (International Financial Reporting Standard)• IAS 39 Financial Instruments (International Accounting Standard)

7
IAS Inception to DateIAS Inception to Date
• IFRS 4 – a temporary standard Defined insurance risk
– Defined insurance contract– Disclosures – information that helps
users to understand the amount, timing and uncertainty of future cash flows from insurance contracts
• Key assumptions• Effect of changes in assumptions• RM objectives• Analysis of risks, including
concentration, interest rate and credit risk
• Information about guarantees• Sensitivity analyses
– Definition of significance– Par products treated similarly to
insurance products– Product classifications – significant
insurance risk must be present
• IAS 39 Financial Instruments– Covers valuation of financial
instruments that don’t meet definition of insurance
– GICs, term certain annuities, Pure unit-linked (variable annuities without guarantees)
– Initial measurement at FV– Subsequent measurement either at FV
or amortized cost• Recent/current accomplishments –
Phase 2 – started mid 2004– IASB taking fresh look
• Past work a useful resource, but will not by bound by it
• Can learn from national or industry practices, but not bound by it

8
IAS “On the Table”IAS “On the Table”
– Will need to address• Number of models – single model for all contracts?• Gain or loss at inception – any restrictions?• Model parameters – unlocking, PADs, scenarios, taxes• Policyholder behavior – should models include expectations of future renewal
premiums?• Discount rate – risk free, adjustments, insurers’ own assets, entity’s own credit
standing• Identification and deferral of acquisition costs• A deposit floor• Treatment of discretionary participation features• Discounting non-life claim reserves with interest• Methods for calculating liabilities (four)
– Two are historical cost-based» Similar to SFAS 60» Locked in» Loss recognition testing
– Entry value– Exit value

9
Entry and Exit ValuesEntry and Exit Values
• Entry Value– The amount an insurer would charge a policyholder today for a contract
with the same rights and obligations as the existing contract– Assumption estimates are unlocked at each reporting date, using
current assumptions– Margins stay locked– No gain at issue
• Exit Value– The amount an insurer would expect to pay today to sell or transfer all
its remaining obligations for a policy– Estimates are unlocked at each reporting date, using current
market conditions– Margins unlocked to calibrate to external value

10
Comparative Financial Statements for a Single Product – Term LifeComparative Financial Statements for a Single Product – Term Life
• Description of Product – Term life insurance• Economic and business environment
– Start with no business; issue business in year one; no issues in year two– No taxes– Scenario 1: assumptions emerge as priced for– Scenario 2: increase in interest rates in year 3
• Presentation of Balance Sheets and Income Statements under– U.S. statutory– Chinese statutory– Chinese statutory with embedded value– U.S. GAAP (SFAS 60)– IAS Entry value– IAS Exit value

11
Comparative Financial Statements for a Single Product – Term LifeComparative Financial Statements for a Single Product – Term Life
• Fair Value Example Details– Product data:
• Issue age 30• Male Non-smoker• Face amount $1,000,000• Annual mode policy with $70 policy fee
• U.S. Statutory Assumptions
Monthly interpolated mean reserveStatement Method
4.5%Interest rate
80 CSO Male Non-smoker with 20 year select factors (x factors for deficiency)
Mortality
1999 XXXReserve Method
12
Comparative Financial Statements for a Single Product – Term LifeComparative Financial Statements for a Single Product – Term Life
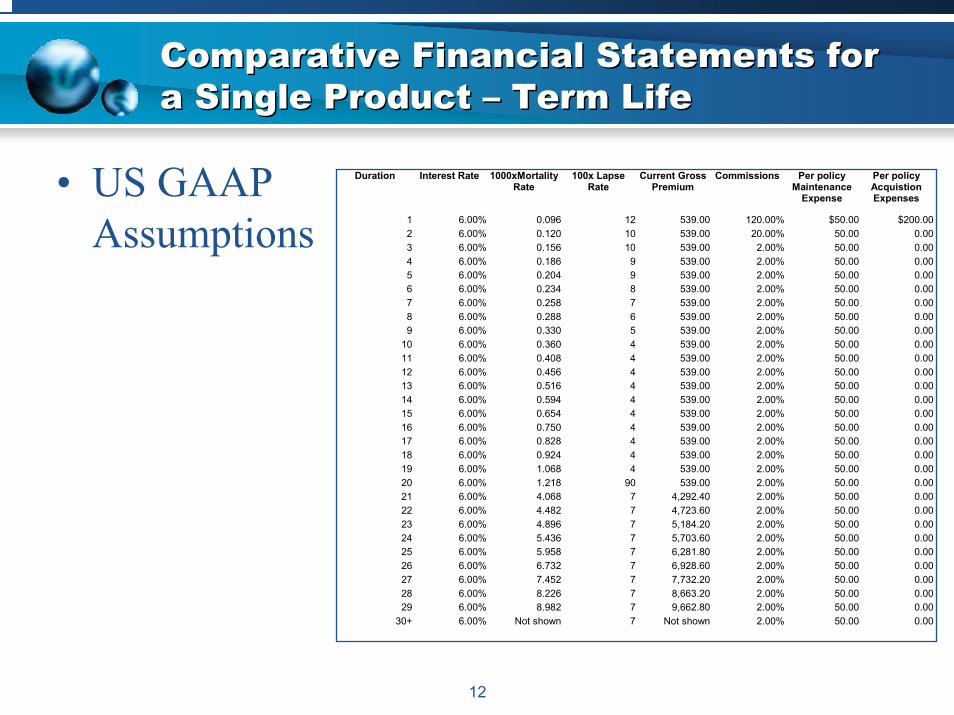
• US GAAP Assumptions
Duration Interest Rate 1000xMortalityRate
100x Lapse Rate
Current Gross Premium
Commissions Per policy Maintenance
Expense
Per policy Acquistion Expenses
1 6.00% 0.096 12 539.00 120.00% $50.00 $200.00 2 6.00% 0.120 10 539.00 20.00% 50.00 0.00 3 6.00% 0.156 10 539.00 2.00% 50.00 0.00 4 6.00% 0.186 9 539.00 2.00% 50.00 0.00 5 6.00% 0.204 9 539.00 2.00% 50.00 0.00 6 6.00% 0.234 8 539.00 2.00% 50.00 0.00 7 6.00% 0.258 7 539.00 2.00% 50.00 0.00 8 6.00% 0.288 6 539.00 2.00% 50.00 0.00 9 6.00% 0.330 5 539.00 2.00% 50.00 0.00
10 6.00% 0.360 4 539.00 2.00% 50.00 0.00 11 6.00% 0.408 4 539.00 2.00% 50.00 0.00 12 6.00% 0.456 4 539.00 2.00% 50.00 0.00 13 6.00% 0.516 4 539.00 2.00% 50.00 0.00 14 6.00% 0.594 4 539.00 2.00% 50.00 0.00 15 6.00% 0.654 4 539.00 2.00% 50.00 0.00 16 6.00% 0.750 4 539.00 2.00% 50.00 0.00 17 6.00% 0.828 4 539.00 2.00% 50.00 0.00 18 6.00% 0.924 4 539.00 2.00% 50.00 0.00 19 6.00% 1.068 4 539.00 2.00% 50.00 0.00 20 6.00% 1.218 90 539.00 2.00% 50.00 0.00 21 6.00% 4.068 7 4,292.40 2.00% 50.00 0.00 22 6.00% 4.482 7 4,723.60 2.00% 50.00 0.00 23 6.00% 4.896 7 5,184.20 2.00% 50.00 0.00 24 6.00% 5.436 7 5,703.60 2.00% 50.00 0.00 25 6.00% 5.958 7 6,281.80 2.00% 50.00 0.00 26 6.00% 6.732 7 6,928.60 2.00% 50.00 0.00 27 6.00% 7.452 7 7,732.20 2.00% 50.00 0.00 28 6.00% 8.226 7 8,663.20 2.00% 50.00 0.00 29 6.00% 8.982 7 9,662.80 2.00% 50.00 0.00
30+ 6.00% Not shown 7 Not shown 2.00% 50.00 0.00

13
Comparative Financial Statements for a Single Product – Term LifeComparative Financial Statements for a Single Product – Term Life
• Chinese Statutory Assumptions
6.0%Interest rate
Same as GAAPMortality
FPT; Benefit and premium are payable for 20 years only
Reserve Method

14
Comparative Financial Statements for a Single Product – Term LifeComparative Financial Statements for a Single Product – Term Life
• Embedded Value Assumptions– Embedded Value is the present value of
Statutory Insurance profits discounted at 9%.• Projection Assumptions
– Projection assumptions are the same as the GAAP assumptions.
$5,000Initial Assets
5% of premium plus 0.15% for net amount at risk plus 2.5% of reserves
Target Surplus
6%Earned Rate
15
Comparative Financial Statements for a Single Product – Term LifeComparative Financial Statements for a Single Product – Term Life
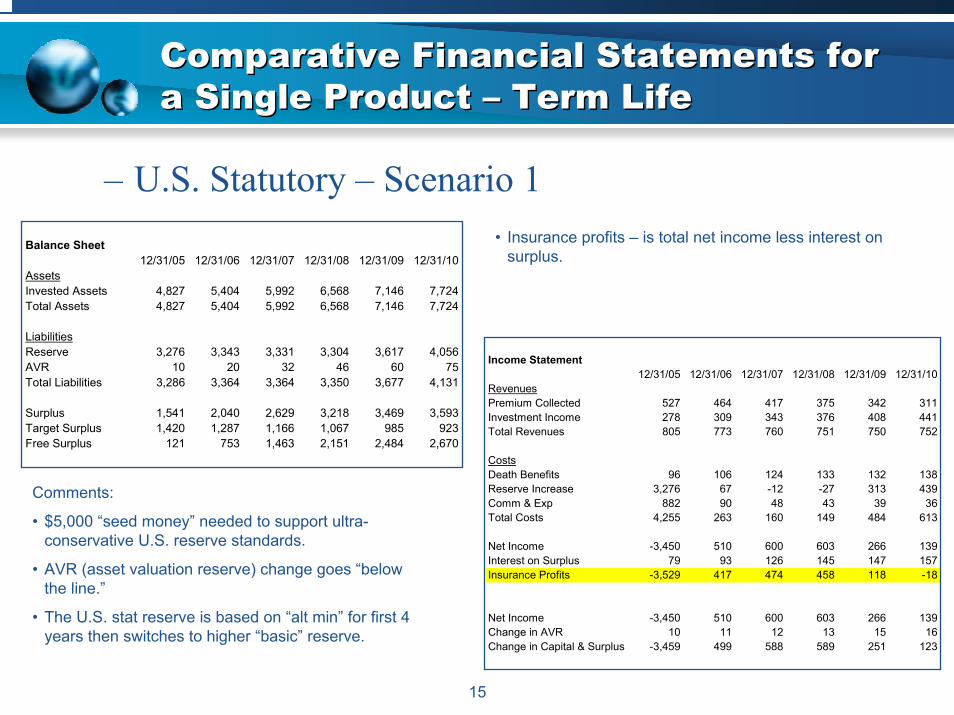
– U.S. Statutory – Scenario 1Balance Sheet
12/31/05 12/31/06 12/31/07 12/31/08 12/31/09 12/31/10AssetsInvested Assets 4,827 5,404 5,992 6,568 7,146 7,724Total Assets 4,827 5,404 5,992 6,568 7,146 7,724
LiabilitiesReserve 3,276 3,343 3,331 3,304 3,617 4,056AVR 10 20 32 46 60 75Total Liabilities 3,286 3,364 3,364 3,350 3,677 4,131
Surplus 1,541 2,040 2,629 3,218 3,469 3,593Target Surplus 1,420 1,287 1,166 1,067 985 923Free Surplus 121 753 1,463 2,151 2,484 2,670
Income Statement12/31/05 12/31/06 12/31/07 12/31/08 12/31/09 12/31/10
RevenuesPremium Collected 527 464 417 375 342 311Investment Income 278 309 343 376 408 441Total Revenues 805 773 760 751 750 752
CostsDeath Benefits 96 106 124 133 132 138Reserve Increase 3,276 67 -12 -27 313 439Comm & Exp 882 90 48 43 39 36Total Costs 4,255 263 160 149 484 613
Net Income -3,450 510 600 603 266 139Interest on Surplus 79 93 126 145 147 157Insurance Profits -3,529 417 474 458 118 -18
Net Income -3,450 510 600 603 266 139Change in AVR 10 11 12 13 15 16Change in Capital & Surplus -3,459 499 588 589 251 123
• Insurance profits – is total net income less interest on surplus.
Comments:
• $5,000 “seed money” needed to support ultra-conservative U.S. reserve standards.
• AVR (asset valuation reserve) change goes “below the line.”
• The U.S. stat reserve is based on “alt min” for first 4 years then switches to higher “basic” reserve.

16
Comparative Financial Statements for a Single Product – Term LifeComparative Financial Statements for a Single Product – Term Life
– Chinese Statutory – Scenario 1
Balance Sheet12/31/05 12/31/06 12/31/07 12/31/08 12/31/09 12/31/10
AssetsInvested Assets 4,827 5,404 5,992 6,568 7,146 7,724Total Assets 4,827 5,404 5,992 6,568 7,146 7,724
LiabilitiesReserve 3 240 417 552 658 740Total Liabilities 3 240 417 552 658 740
Surplus 4,823 5,163 5,576 6,016 6,488 6,984Target Surplus 1,343 1,214 1,097 1,002 916 845Free Surplus 3,480 3,949 4,478 5,013 5,573 6,139
Income Statement12/31/05 12/31/06 12/31/07 12/31/08 12/31/09 12/31/10
RevenuesPremium Collected 527 464 417 375 342 311Investment Income 278 309 343 376 408 441Total Revenues 805 773 760 751 750 752
CostsDeath Benefits 96 106 124 133 132 138Reserve Increase 3 237 176 135 106 83Comm & Exp 882 90 48 43 39 36Total Costs 982 433 348 311 277 256
Net Income -177 340 412 440 473 496Interest on Surplus 277 292 314 338 364 392Insurance Profits -453 48 99 102 108 104
Comments:
• The same starting assets are used for all six accounting bases.
17
Comparative Financial Statements for a Single Product – Term LifeComparative Financial Statements for a Single Product – Term Life
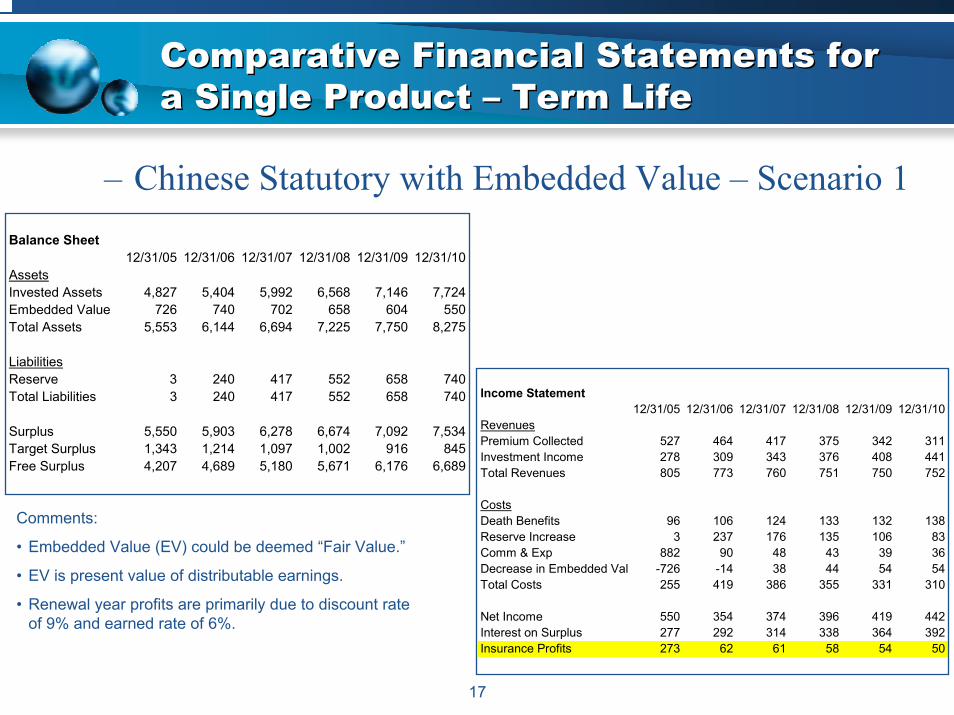
– Chinese Statutory with Embedded Value – Scenario 1Balance Sheet
12/31/05 12/31/06 12/31/07 12/31/08 12/31/09 12/31/10AssetsInvested Assets 4,827 5,404 5,992 6,568 7,146 7,724Embedded Value 726 740 702 658 604 550Total Assets 5,553 6,144 6,694 7,225 7,750 8,275
LiabilitiesReserve 3 240 417 552 658 740Total Liabilities 3 240 417 552 658 740
Surplus 5,550 5,903 6,278 6,674 7,092 7,534Target Surplus 1,343 1,214 1,097 1,002 916 845Free Surplus 4,207 4,689 5,180 5,671 6,176 6,689
Income Statement12/31/05 12/31/06 12/31/07 12/31/08 12/31/09 12/31/10
RevenuesPremium Collected 527 464 417 375 342 311Investment Income 278 309 343 376 408 441Total Revenues 805 773 760 751 750 752
CostsDeath Benefits 96 106 124 133 132 138Reserve Increase 3 237 176 135 106 83Comm & Exp 882 90 48 43 39 36Decrease in Embedded Val -726 -14 38 44 54 54Total Costs 255 419 386 355 331 310
Net Income 550 354 374 396 419 442Interest on Surplus 277 292 314 338 364 392Insurance Profits 273 62 61 58 54 50
Comments:
• Embedded Value (EV) could be deemed “Fair Value.”
• EV is present value of distributable earnings.
• Renewal year profits are primarily due to discount rate of 9% and earned rate of 6%.

18
Comparative Financial Statements for a Single Product – Term LifeComparative Financial Statements for a Single Product – Term Life
– U.S. GAAP (SFAS 60) – Scenario 1
Balance Sheet12/31/05 12/31/06 12/31/07 12/31/08 12/31/09 12/31/10
AssetsInvested Assets 4,827 5,404 5,992 6,568 7,146 7,724DAC 760 751 711 678 649 624Total Assets 5,587 6,155 6,703 7,245 7,795 8,349
LiabilitiesReserve 233 430 591 726 848 953Total Liabilities 233 430 591 726 848 953
Surplus 5,354 5,725 6,113 6,519 6,946 7,396
Income Statement12/31/05 12/31/06 12/31/07 12/31/08 12/31/09 12/31/10
RevenuesPremium Collected 527 464 417 375 342 311Investment Income 278 309 343 376 408 441Total Revenues 805 773 760 751 750 752
CostsDeath Benefits 96 106 124 133 132 138Reserve Increase 233 197 161 135 122 105Comm & Exp 882 90 48 43 39 36- Increase in DAC 760 -9 -40 -34 -29 -24Total Costs 451 402 372 345 323 303
Net Income 354 371 388 406 427 449Interest on Surplus 303 324 346 369 393 418Insurance Profits 51 47 42 38 34 31
Net Income 354 371 388 406 427 449Other Comprehensive Income 0 0 0 0 0 0Change in Retained Earnings (Surplus) 354 371 388 406 427 449
Comments:
• The insurance profits are a level percent of premium, consistent with SFAS 60 objectives.

19
Comparative Financial Statements for a Single Product – Term LifeComparative Financial Statements for a Single Product – Term Life
• Entry Value– Fair value reserve is the PV cash flows using a
discount rate of 3%. Assumptions are the same as GAAP. Margin as a percent of mortality is set so there is no gain or loss at issue.

20
Comparative Financial Statements for a Single Product – Term LifeComparative Financial Statements for a Single Product – Term Life
– IAS Entry Value – Scenario 1
Balance Sheet12/31/05 12/31/06 12/31/07 12/31/08 12/31/09 12/31/10
AssetsInvested Assets 4,827 5,404 5,992 6,568 7,146 7,724DAC 0 0 0 0 0 0Total Assets 4,827 5,404 5,992 6,568 7,146 7,724
LiabilitiesReserve -470 -219 17 212 382 522Total Liabilities -470 -219 17 212 382 522
Surplus 5,297 5,622 5,975 6,356 6,764 7,202
Income Statement12/31/05 12/31/06 12/31/07 12/31/08 12/31/09 12/31/10
RevenuesPremium Collected 527 464 417 375 342 311Investment Income 278 309 343 376 408 441Total Revenues 805 773 760 751 750 752
CostsDeath Benefits 96 106 124 133 132 138Reserve Increase -470 252 236 195 170 141Comm & Exp 882 90 48 43 39 36- Increase in DAC 0 0 0 0 0 0Total Costs 508 448 407 370 341 315
Net Income 297 325 353 381 409 438Interest on Surplus 300 318 338 359 382 407Insurance Profits -3 7 15 22 27 31
Comments:
• Reserves are negative in order to force no profit at issue.
• Insurance profit is negative first year because reserves are negative, which generates negative interest.

21
Comparative Financial Statements for a Single Product – Term LifeComparative Financial Statements for a Single Product – Term Life
• Exit Value– Assumptions are the same as the GAAP
assumptions including the mortality. Fair value reserve is the PV of cash flows discounted at 3% plus a margin which leads to a gain at issue.

22
Comparative Financial Statements for a Single Product – Term LifeComparative Financial Statements for a Single Product – Term Life
– IAS Exit Value – Scenario 1
Balance Sheet12/31/05 12/31/06 12/31/07 12/31/08 12/31/09 12/31/10
AssetsInvested Assets 4,827 5,404 5,992 6,568 7,146 7,724DAC 0 0 0 0 0 0Total Assets 4,827 5,404 5,992 6,568 7,146 7,724
LiabilitiesReserve -937 -688 -454 -261 -91 49Total Liabilities -937 -688 -454 -261 -91 49
Surplus 5,763 6,092 6,447 6,828 7,237 7,675
Income Statement12/31/05 12/31/06 12/31/07 12/31/08 12/31/09 12/31/10
RevenuesPremium Collected 527 464 417 375 342 311Investment Income 278 309 343 376 408 441Total Revenues 805 773 760 751 750 752
CostsDeath Benefits 96 106 124 133 132 138Reserve Increase -937 248 234 194 169 140Comm & Exp 882 90 48 43 39 36- Increase in DAC 0 0 0 0 0 0Total Costs 42 444 405 369 341 314
Net Income 763 329 355 382 409 438Interest on Surplus 325 346 365 387 410 434Insurance Profits 438 -17 -11 -5 0 4
Comments:
• A buyer really likes our company and is willing to pay for it.

23
Comparative Financial Statements for a Single Product – Term LifeComparative Financial Statements for a Single Product – Term Life
– U.S. Statutory – Scenario 2 (see page 15 for Scenario 1)
Balance Sheet12/31/05 12/31/06 12/31/07 12/31/08 12/31/09 12/31/10
AssetsInvested Assets 4,827 5,404 5,992 6,630 7,277 7,929Total Assets 4,827 5,404 5,992 6,630 7,277 7,929
LiabilitiesReserve 3,276 3,343 3,331 3,304 3,617 4,056AVR 10 20 32 46 60 76Total Liabilities 3,286 3,364 3,364 3,350 3,677 4,132
Surplus 1,541 2,040 2,629 3,280 3,600 3,797Target Surplus 1,420 1,287 1,166 1,067 985 923Free Surplus 121 753 1,463 2,213 2,614 2,873
Income Statement12/31/05 12/31/06 12/31/07 12/31/08 12/31/09 12/31/10
RevenuesPremium Collected 527 464 417 375 342 311Investment Income 278 309 343 438 476 515Total Revenues 805 773 760 814 818 826
CostsDeath Benefits 96 106 124 133 132 138Reserve Increase 3,276 67 -12 -27 313 439Comm & Exp 882 90 48 43 39 36Total Costs 4,255 263 160 149 484 613
Net Income -3,450 510 600 665 334 213Interest on Surplus 79 93 126 169 172 183Insurance Profits -3,529 417 474 496 162 30
Net Income -3,450 510 600 665 334 213Change in AVR 10 11 12 13 15 16Change in Capital & Surplus -3,459 499 588 652 319 197
Comments:
• The only impact is a higher earned rate on new investments leads to a higher profit in last 3 years.

24
Comparative Financial Statements for a Single Product – Term LifeComparative Financial Statements for a Single Product – Term Life
– Chinese Statutory – Scenario 2 (see page 16 for Scenario 1)
Balance Sheet12/31/05 12/31/06 12/31/07 12/31/08 12/31/09 12/31/10
AssetsInvested Assets 4,827 5,404 5,992 6,630 7,277 7,929Total Assets 4,827 5,404 5,992 6,630 7,277 7,929
LiabilitiesReserve 3 240 417 552 658 740Total Liabilities 3 240 417 552 658 740
Surplus 4,823 5,163 5,576 6,078 6,619 7,188Target Surplus 1,343 1,214 1,097 1,002 916 845Free Surplus 3,480 3,949 4,478 5,076 5,703 6,343
Income Statement12/31/05 12/31/06 12/31/07 12/31/08 12/31/09 12/31/10
RevenuesPremium Collected 527 464 417 375 342 311Investment Income 278 309 343 438 476 515Total Revenues 805 773 760 814 818 826
CostsDeath Benefits 96 106 124 133 132 138Reserve Increase 3 237 176 135 106 83Comm & Exp 882 90 48 43 39 36Total Costs 982 433 348 311 277 256
Net Income -177 340 412 503 541 569Interest on Surplus 277 292 314 394 425 458Insurance Profits -453 48 99 108 116 112
Comments:
• The only impact is a higher earned rate on new investments leads to a higher profit in last 3 years.

25
Comparative Financial Statements for a Single Product – Term LifeComparative Financial Statements for a Single Product – Term Life
– Chinese Statutory with Embedded Value – Scenario 2 (See page 17 for Scenario 1)
Balance Sheet12/31/05 12/31/06 12/31/07 12/31/08 12/31/09 12/31/10
AssetsInvested Assets 4,827 5,404 5,992 6,630 7,277 7,929Embedded Value 726 740 705 668 620 570Total Assets 5,553 6,144 6,697 7,298 7,896 8,499
LiabilitiesReserve 3 240 417 552 658 740Total Liabilities 3 240 417 552 658 740
Surplus 5,550 5,903 6,281 6,746 7,239 7,759Target Surplus 1,343 1,214 1,097 1,002 916 845Free Surplus 4,207 4,689 5,184 5,744 6,323 6,913
Income Statement12/31/05 12/31/06 12/31/07 12/31/08 12/31/09 12/31/10
RevenuesPremium Collected 527 464 417 375 342 311Investment Income 278 309 343 438 476 515Total Revenues 805 773 760 814 818 826
CostsDeath Benefits 96 106 124 133 132 138Reserve Increase 3 237 176 135 106 83Comm & Exp 882 90 48 43 39 36Decrease in Embedded Value -726 -14 35 37 48 49Total Costs 255 419 382 348 326 305
Net Income 550 354 378 465 492 520Interest on Surplus 277 292 314 394 425 458Insurance Profits 273 62 64 71 67 63
Comments:
• Changed EV discount rate to 11% at year-end 3.
26
Comparative Financial Statements for a Single Product – Term LifeComparative Financial Statements for a Single Product – Term Life
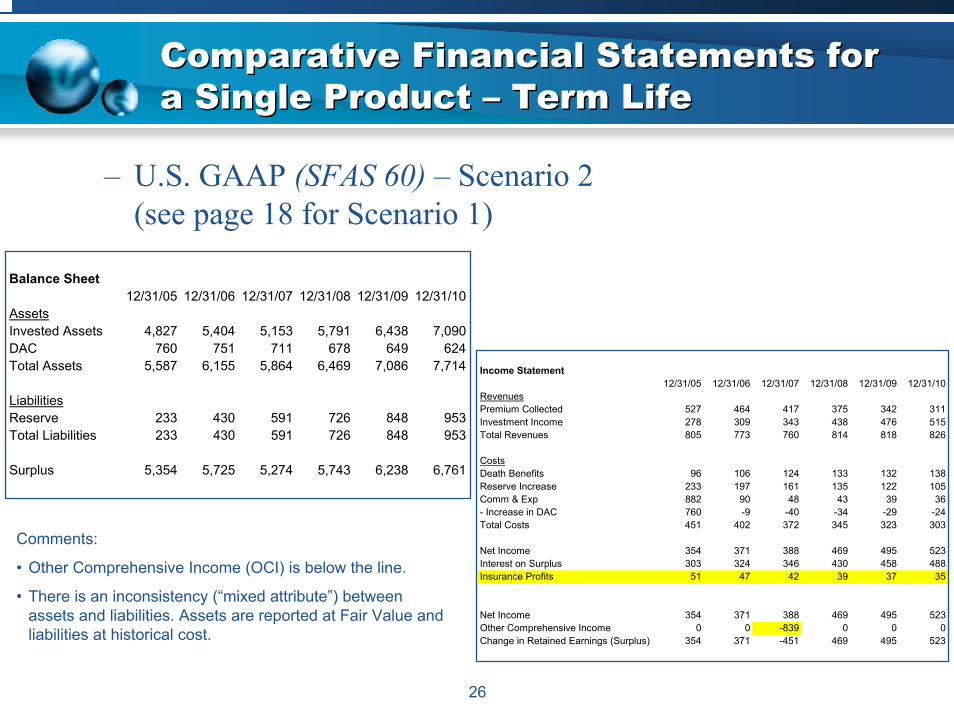
– U.S. GAAP (SFAS 60) – Scenario 2 (see page 18 for Scenario 1)
Balance Sheet12/31/05 12/31/06 12/31/07 12/31/08 12/31/09 12/31/10
AssetsInvested Assets 4,827 5,404 5,153 5,791 6,438 7,090DAC 760 751 711 678 649 624Total Assets 5,587 6,155 5,864 6,469 7,086 7,714
LiabilitiesReserve 233 430 591 726 848 953Total Liabilities 233 430 591 726 848 953
Surplus 5,354 5,725 5,274 5,743 6,238 6,761
Income Statement12/31/05 12/31/06 12/31/07 12/31/08 12/31/09 12/31/10
RevenuesPremium Collected 527 464 417 375 342 311Investment Income 278 309 343 438 476 515Total Revenues 805 773 760 814 818 826
CostsDeath Benefits 96 106 124 133 132 138Reserve Increase 233 197 161 135 122 105Comm & Exp 882 90 48 43 39 36- Increase in DAC 760 -9 -40 -34 -29 -24Total Costs 451 402 372 345 323 303
Net Income 354 371 388 469 495 523Interest on Surplus 303 324 346 430 458 488Insurance Profits 51 47 42 39 37 35
Net Income 354 371 388 469 495 523Other Comprehensive Income 0 0 -839 0 0 0Change in Retained Earnings (Surplus) 354 371 -451 469 495 523
Comments:
• Other Comprehensive Income (OCI) is below the line.
• There is an inconsistency (“mixed attribute”) between assets and liabilities. Assets are reported at Fair Value and liabilities at historical cost.

27
Comparative Financial Statements for a Single Product – Term LifeComparative Financial Statements for a Single Product – Term Life
– IAS Entry Value – Scenario 2 (See page 20 for Scenario 1)
Balance Sheet12/31/05 12/31/06 12/31/07 12/31/08 12/31/09 12/31/10
AssetsInvested Assets 4,827 5,404 5,153 5,791 6,438 7,090DAC 0 0 0 0 0 0Total Assets 4,827 5,404 5,153 5,791 6,438 7,090
LiabilitiesReserve -470 -219 -139 55 226 371Total Liabilities -470 -219 -139 55 226 371
Surplus 5,297 5,622 5,292 5,737 6,211 6,718
Income Statement12/31/05 12/31/06 12/31/07 12/31/08 12/31/09 12/31/10
RevenuesPremium Collected 527 464 417 375 342 311Investment Income 278 309 343 438 476 515Change in Market Value of Assets 0 0 -839 0 0 0Total Revenues 805 773 -79 814 818 826
CostsDeath Benefits 96 106 124 133 132 138Reserve Increase -470 252 80 193 172 145Comm & Exp 882 90 48 43 39 36- Increase in DAC 0 0 0 0 0 0Total Costs 508 448 251 369 343 319
Net Income 297 325 -330 445 475 507Interest on Surplus 300 318 338 419 446 474Insurance Profits -3 7 -668 26 29 32
Comments:
• Discount rate increased to 5% at year-end 3.
• Both assets and liabilities are marked to market.
• In our example, the liabilities have a shorter duration than assets leading to a loss when interest rates increase.

28
Comparative Financial Statements for a Single Product – Term LifeComparative Financial Statements for a Single Product – Term Life
– IAS Exit Value – Scenario 2 (See page 22 for Scenario 1)
Balance Sheet12/31/05 12/31/06 12/31/07 12/31/08 12/31/09 12/31/10
AssetsInvested Assets 4,827 5,404 5,153 5,791 6,438 7,090DAC 0 0 0 0 0 0Total Assets 4,827 5,404 5,153 5,791 6,438 7,090
LiabilitiesReserve -937 -688 -473 -283 -114 28Total Liabilities -937 -688 -473 -283 -114 28
Surplus 5,763 6,092 5,626 6,074 6,552 7,062 Income Statement12/31/05 12/31/06 12/31/07 12/31/08 12/31/09 12/31/10
RevenuesPremium Collected 527 464 417 375 342 311Investment Income 278 309 343 438 476 515Change in Market Value of Assets 0 0 -839 0 0 0Total Revenues 805 773 -79 814 818 826
CostsDeath Benefits 96 106 124 133 132 138Reserve Increase -937 248 215 190 168 142Comm & Exp 882 90 48 43 39 36- Increase in DAC 0 0 0 0 0 0Total Costs 42 444 387 366 340 316
Net Income 763 329 -466 448 478 510Interest on Surplus 325 346 365 451 478 507Insurance Profits 438 -17 -831 -3 0 3
Comments:
• Discount rate increased to 5% at year-end 3.

29
IASB Future ActivitiesIASB Future Activities
• Speculate on dates– October 2006 – Insurance Discussion paper– April 2008 – Exposure draft– April 2009 – Final standard– January 2012 – Effective

30
Key PlayersKey Players
• In the U.S.– FASB
• Agreed on convergence• Is letting IASB take the lead• Will circulate IASB literature• Will initiate its own due process
– AAA – will react, probably through FASB
– SoA – also will monitor and react– ACLI – no current plans to be an
advocate– Group of North American
Insurance Enterprises• Group of 12 U.S. companies• And large companies from Japan• Proactive in presenting
principles and examples– Individual companies
• IASB’s Insurance Working Group – comprises senior financial executives, analysts, actuaries, auditors and regulators
• IAA International Actuarial Association– Subcontracted to do…– International Association of
Insurance Supervisors (IAIS)…what is their role?
– CFO Forum – CFO’s from Europe’s leading life and P/C companies

31
New from SoA – 2nd Edition of US GAAP for Life InsurersNew from SoA – 2nd Edition of US GAAP for Life Insurers
• How/when written– Eleven authors– A year to write – 1,000 hours– 200 new pages– 100 new spreadsheets

32
New from SoA – 2nd Edition of US GAAP for Life InsurersNew from SoA – 2nd Edition of US GAAP for Life Insurers
• New topics– Sales Inducements (from SOP 03-1)
[3.11, 6.9, 7.5] (Trad, UL, Ann)• Initial bonus interest, day-one bonuses, persistency
bonuses, enhanced crediting rates• Assets or liabilities; establish using new rules
– 20 year term with high lapse rates [4.9]• The product has 80% lapse rate in year 20• Unusually high reserves and DAC at that point• Can produce negative reserves• Can a negative liability exist?

33
New from SoA – 2nd Edition ofUS GAAP for Life InsurersNew from SoA – 2nd Edition ofUS GAAP for Life Insurers
– Profits followed by losses, including Excess Death Benefits (from SOP 03-1) [6.12. 8.2.3.2, 8.2.4]
• Where losing periods follow gains periods• Establish a liability, funding from assessments
– Excess Annuitization and Death benefits (from SOP 03-1 and SFAS 133) [7.4.3, 8.2.3.2, 8.2.4, 8.2.5]
• For benefits in excess of fund value• Use multiple scenarios to determine possible values• Fund with level % benefit ratio• Always update

34
New from SoA – 2nd Edition ofUS GAAP for Life InsurersNew from SoA – 2nd Edition ofUS GAAP for Life Insurers
– Equity Indexed Annuities [8.3]• A new product since the first edition• From SFAS 133 and DIG• Contains point-to-point and ratchet examples
– Search for Embedded Derivatives (from SFAS 133and DIG) [13.12]
• Defines what is subject to SFAS 133• Discusses how to search by product type

35
New from SoA – 2nd Edition ofUS GAAP for Life InsurersNew from SoA – 2nd Edition ofUS GAAP for Life Insurers
– Business combinations and Goodwill (SFAS 141 and SFAS 142) [new 15]
• Rules for when an acquisition occurs; no more pooling• Goodwill amortization and impairment testing• Intangible Assets, including VOBA• Methods for producing liabilities
– Foreign Products• Added new countries [16.5]• Japan, Korea, Singapore, Malaysia, Taiwan, China, Philippines• How SOP 03-1 applies [16.7]
– Reinsurance• From SOP 03-1 [17.7]• From SFAS 133 and DIG B36 [17.8]
– Bifurcation of embedded derivatives that may exist in modco and funds withheld reinsurance treaties
– Several examples

36
New from SoA – 2nd Edition ofUS GAAP for Life InsurersNew from SoA – 2nd Edition ofUS GAAP for Life Insurers
– Fair Value reporting [18.3]• SFAS 133 requirements• FASB directions
– Demutualizations [18.4] – updated from draft SOP to actual SOP 00-3
– Financial Statement presentations [19]• Show 3 balance sheets and 2 income statements• Different economic scenarios and new business levels• Shows presentation of actual calculations• Nine different product lines – nine companies
– Index• Last index – done on the train• This time, a professional indexer

37
New from SoA – Insurance Industry Mergers & Acquisitions textbookNew from SoA – Insurance Industry Mergers & Acquisitions textbook
• Background – the need, the sponsor, the plan
• Writers – 2 editors, 10 authors
• How written – 3 face-to-face meetings; write, discuss, debate, party
• Unique Aspects– P&C Actuary – addressed Property & Casualty and
Life companies
– Purchase multiples – price to earnings, price to book value ratios
– PGAAP chapter – many examples of different approaches
– “Tales from the crypt” – 80 stories on what happens when you don’t follow the textbook advice

38
New from SoA – Insurance Industry Mergers & Acquisitions textbookNew from SoA – Insurance Industry Mergers & Acquisitions textbook
• Chapter 2 – M&A Process Overview– Introduction– M&A Drivers: An Overview– Preparing to Sell– Pre-Marketing– Marketing– Evaluating the Opportunity on
the Buy Side– Negotiating the Definitive
Agreement– The Path to Closing– Conclusion
• Chapter 1 – Introduction– What is Insurance?– Industry Characteristics– Regulatory Bodies– Insurance Rating Agencies– Insurance Accounting– Taxation– Distribution– A few Words about Actuaries– Overview

39
New from SoA – Insurance Industry Mergers & Acquisitions textbookNew from SoA – Insurance Industry Mergers & Acquisitions textbook
• Chapter 3 – Financing– Introduction– Sources of Funds– Financing Instruments– M&A Financing
Considerations– Summary
• Chapter 4 – Valuation Techniques– Introduction:
Valuation Techniques for Insurance M&A
– General Valuation Techniques– The Actuarial Appraisal– Basis for Assumptions– Components of the
Actuarial Appraisal– Life company valuation issues– P&C company
valuation Issues– Summary
40
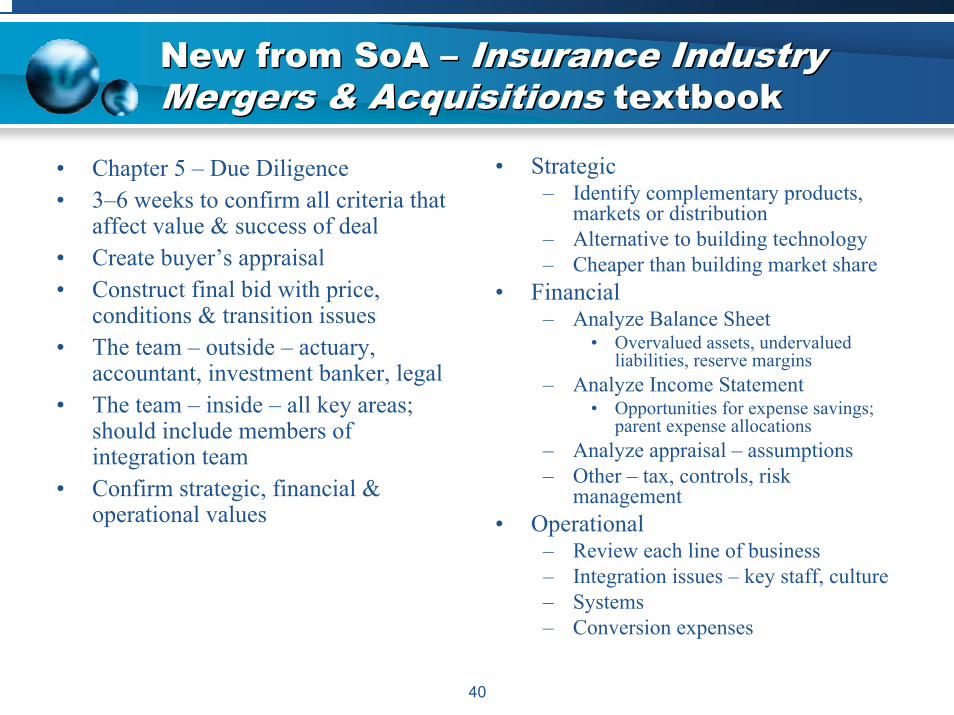
New from SoA – Insurance Industry Mergers & Acquisitions textbookNew from SoA – Insurance Industry Mergers & Acquisitions textbook
• Strategic– Identify complementary products,
markets or distribution– Alternative to building technology– Cheaper than building market share
• Financial– Analyze Balance Sheet
• Overvalued assets, undervalued liabilities, reserve margins
– Analyze Income Statement• Opportunities for expense savings;
parent expense allocations– Analyze appraisal – assumptions– Other – tax, controls, risk
management• Operational
– Review each line of business– Integration issues – key staff, culture– Systems– Conversion expenses
• Chapter 5 – Due Diligence• 3–6 weeks to confirm all criteria that
affect value & success of deal• Create buyer’s appraisal• Construct final bid with price,
conditions & transition issues• The team – outside – actuary,
accountant, investment banker, legal• The team – inside – all key areas;
should include members of integration team
• Confirm strategic, financial & operational values
41
New from SoA – Insurance Industry Mergers & Acquisitions textbookNew from SoA – Insurance Industry Mergers & Acquisitions textbook
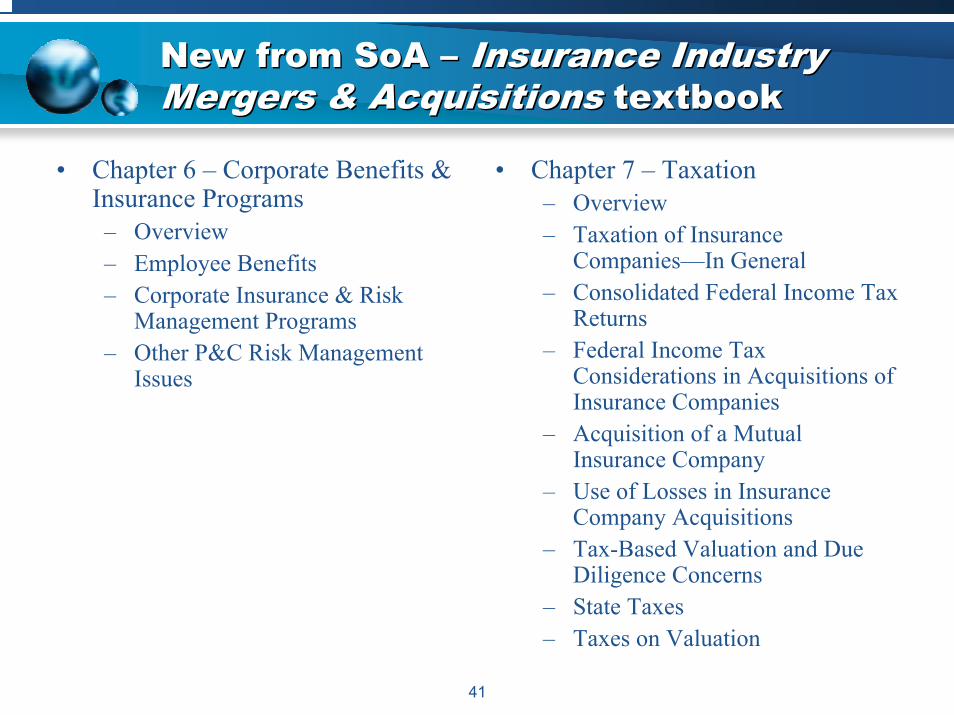
• Chapter 6 – Corporate Benefits & Insurance Programs– Overview– Employee Benefits– Corporate Insurance & Risk
Management Programs– Other P&C Risk Management
Issues
• Chapter 7 – Taxation– Overview– Taxation of Insurance
Companies—In General– Consolidated Federal Income Tax
Returns– Federal Income Tax
Considerations in Acquisitions of Insurance Companies
– Acquisition of a Mutual Insurance Company
– Use of Losses in Insurance Company Acquisitions
– Tax-Based Valuation and Due Diligence Concerns
– State Taxes– Taxes on Valuation

42
New from SoA – Insurance Industry Mergers & Acquisitions textbookNew from SoA – Insurance Industry Mergers & Acquisitions textbook
• Chapter 8 – Accounting– Introduction– US GAAP Purchase Accounting
• Business Combination• Identifying the Acquiring Entity• Purchase Accounting• Market Value of Investments (Including Derivatives) and
Other Assets• Deferred Taxes• Liabilities and Reserves• Identification of Intangible Assets• Acquisition Reserves• Goodwill• Comparison of HGAAP to PGAAP• Example A – Determine Purchase Price and Goodwill• Example B – Purchase Price and Goodwill Calculation• Assumption and
Indemnity Reinsurance– Statutory Accounting Principles
• Purchaser’s Accounting• Acquired Entity Accounting• Goodwill Admissibility
43
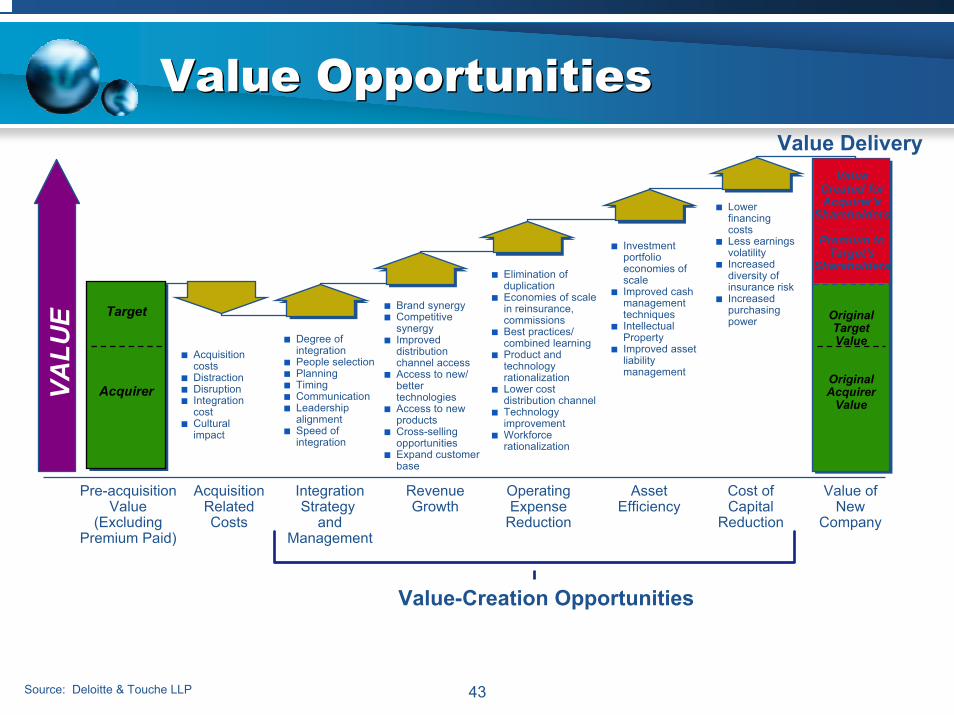
Value OpportunitiesValue Opportunities
Pre-acquisitionValue
(ExcludingPremium Paid)
AcquisitionRelatedCosts
IntegrationStrategy
andManagement
RevenueGrowth
OperatingExpense
Reduction
Asset Efficiency
Cost ofCapital
Reduction
Value ofNew
Company
Acquisition costsDistractionDisruptionIntegration costCultural impact
Degree ofintegrationPeople selectionPlanningTimingCommunicationLeadership alignmentSpeed of integration
Brand synergyCompetitive synergyImproved distribution channel accessAccess to new/better technologiesAccess to new productsCross-selling opportunitiesExpand customer base
Elimination of duplicationEconomies of scale in reinsurance, commissionsBest practices/combined learningProduct and technology rationalizationLower cost distribution channelTechnology improvementWorkforce rationalization
Investment portfolio economies of scaleImproved cash management techniquesIntellectual PropertyImproved asset liability management
Lower financingcostsLess earningsvolatilityIncreased diversity of insurance riskIncreased purchasing power Original
TargetValue
OriginalAcquirer
Value
OriginalTargetValue
OriginalAcquirer
Value
Target
Acquirer
Target
Acquirer
Value-Creation Opportunities
ValueCreated forAcquirer's
Shareholders
Premium toTarget's
Shareholders
VALU
E
Value Delivery
Source: Deloitte & Touche LLP

44
Consider the Importance of Culture —“Humanize” the MergerConsider the Importance of Culture —“Humanize” the Merger
Org
aniz
atio
n M
omen
tum “Change is exciting”
“Our company is taking a bold step”
“What does this mean for me?”“What are my priorities now?”
“I can’t act with all this uncertainty”“My highest priority is to stay on top of the integration news” “This is not
something I want to be a part of”
“I’ll do what is necessary to survive”
“The train is leaving, I better get on”“It’s hard, but we can do it”
“It is the right thing to do”“We will succeed”
Earlyeuphoria
Fear/uncertainty
Paralysis
Departure
Withdrawal
Adaptation
Commitment
85% of all integration failures have cultural undertones.

45
New from SoA – Insurance Industry Mergers & Acquisitions textbookNew from SoA – Insurance Industry Mergers & Acquisitions textbook
• Chapter 9 – Merger Integration– Integration team – organization, management; often doing
regular job too– No committees to select best practices– Don’t slash & burn – need institutional knowledge– Communicate to employees constantly– Incentives for key people to stay– Every deadline will seem aggressive– Celebrate success– Define new culture– Key off relationship building from due diligence– Financial – PGAAP appraisal models versus actual– Financial – get help first six months

46
New from SoA – Insurance Industry Mergers & Acquisitions textbookNew from SoA – Insurance Industry Mergers & Acquisitions textbook
• Appendix– Confidentiality Agreement– Bid Process Letter– Preliminary Bid Letter– Form A– Form E– Actuarial Standard of Practice– Sample Due Diligence: Life Insurance Company
Information Request– Sample Due Diligence: Employee Benefits Information
Request– Sample Due Diligence: Corporate Insurance Programs
Information Request
