new brunswick river ice manual - gnb.ca
TRANSCRIPT
Prepared by
THE NEW BRUNSWICK SUBCOMMITTEE ON RIVER ICEEnvironment Canada NB
Inland waters Directorate, Department of EnvironmentAugust 1989
This document was re-formatted and re-published in 2011.
New Brunswick River Ice Manual

New Brunswick River Ice Manual
Published by : Communication New-Brunswick
225 King Street Fredericton NB
E3B 1C8 Canada
CNB-7926
• TABLEOFCONTENTS
PREFACEACKNOWLEDGEMENTS
1.0 INTRODUCTION
2.0 RIVER ICE PROCESSES
• 2.1Freeze-up » 2.1.1 Border Ice » 2.1.2 Frazil Ice » 2.1.3 Thermal Ice Cover
• 2.2Breakup » 2.2.1 Winter Breakup » 2.2.2 Spring Breakup
• 2.3IceJam
3.0 RIVER ICE REGIME
• 3.1Climate• 3.2Morphology• 3.3NewBrunswickIceRegions
4.0 RIVER ICE MONITORING
• 4.1Ground-basedMonitoring » 4.1.1 Location of Monitoring Sites » 4.1.2 Frequency of Observations » 4.1.3 Freeze-up Observations » 4.1.4 Winter Observations » 4.1.5 Pre-breakup Observations » 4.1.6 Breakup Observations » 4.1.7 Ice Jam Observations » 4.1.8 Post-breakup Observations
• 4.2SatelliteMonitoring• 4.3AerialSurveys
5.0 PREDICTIVE METHODS
• 5.1Freeze-upJams• 5.2Breakup
» 5.2.1 Ice Decay » 5.2.2 Initiation of Breakup
• 5.3BreakupJams
6.0 ICE CONTROL
• 6.1IceJamMitigation » 6.1.1 Fixed Structures » 6.1.2 Ice Booms » 6.1.3 Channel Modification » 6.1.4 Dusting » 6.1.5 Blasting » 6.1.6 Ice Cutting » 6.1.7 Mechanical Ice Removal
• 6.2IceAdhesion• 6.3WinterNavigation
REFERENCES
..................................................................... 2
.............................................. 2................................................. 3
....................................... 3
.................................................. 4.......................................... 4
............................................ 5.............................. 6
..................................................... 6.................................. 7.................................. 7
...................................................... 7............................................. 8
...................................................... 8............................................ 11
.................... 11.................................. 13
..................... 13.............. 13
............... 14.................... 14
......................... 14................ 15
...................... 15....................... 16
............... 17
................................ 18......................................... 18
.................................... 19
....................................... 19................................................... 21
......................................... 21......................... 21
.......................................... 22................................................... 26
.................................. 26............................... 27
....................................... 27....................... 28
.......................................... 28
.......................................... 28...................................... 29
................... 29........................................... 29
................................... 30.......................................................... 31 New Brunswick River Ice Manual
New Brunswick River Ice ManualCNB-7926
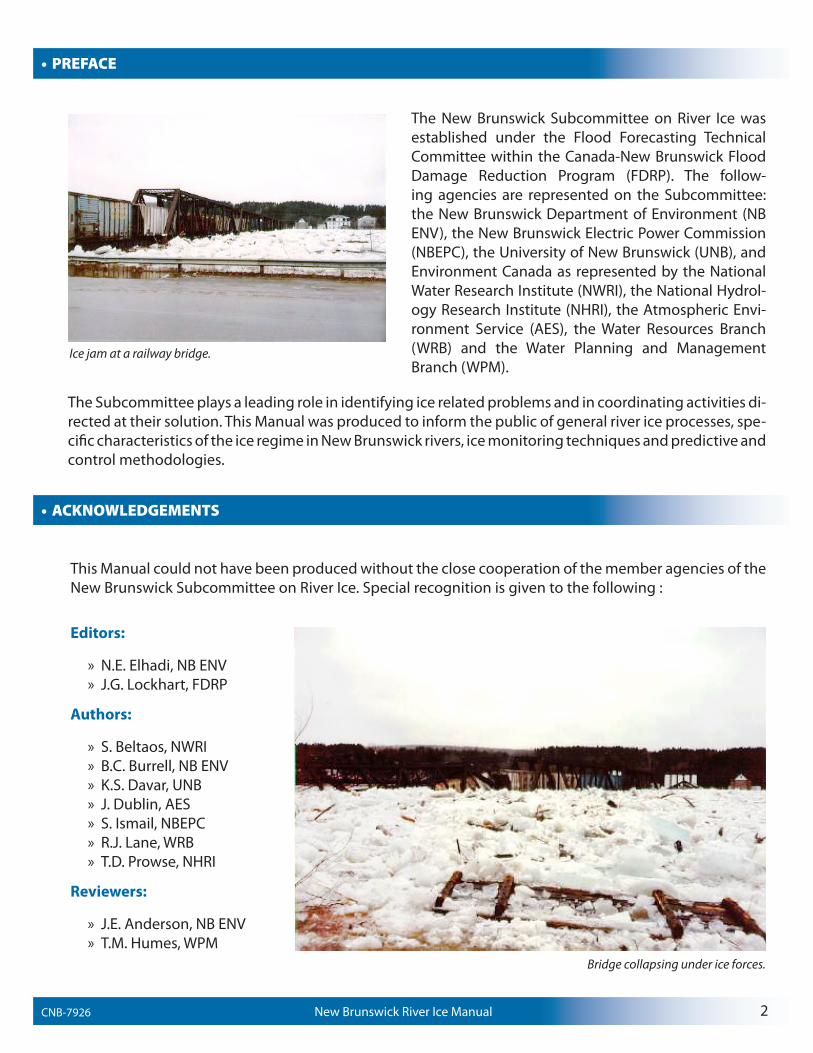
The New Brunswick Subcommittee on River Ice was established under the Flood Forecasting Technical Committee within the Canada-New Brunswick Flood Damage Reduction Program (FDRP). The follow-ing agencies are represented on the Subcommittee: the New Brunswick Department of Environment (NB ENV), the New Brunswick Electric Power Commission (NBEPC), the University of New Brunswick (UNB), and Environment Canada as represented by the National Water Research Institute (NWRI), the National Hydrol-ogy Research Institute (NHRI), the Atmospheric Envi-ronment Service (AES), the Water Resources Branch (WRB) and the Water Planning and Management Branch (WPM).
The Subcommittee plays a leading role in identifying ice related problems and in coordinating activities di-rected at their solution. This Manual was produced to inform the public of general river ice processes, spe-cific characteristics of the ice regime in New Brunswick rivers, ice monitoring techniques and predictive and control methodologies.
• PREFACE
• ACKNOWLEDGEMENTS
This Manual could not have been produced without the close cooperation of the member agencies of the New Brunswick Subcommittee on River Ice. Special recognition is given to the following :
Editors:
» N.E. Elhadi, NB ENV » J.G. Lockhart, FDRP
Authors:
» S. Beltaos, NWRI » B.C. Burrell, NB ENV » K.S. Davar, UNB » J. Dublin, AES » S. Ismail, NBEPC » R.J. Lane, WRB » T.D. Prowse, NHRI
Reviewers:
» J.E. Anderson, NB ENV » T.M. Humes, WPM
Bridge collapsing under ice forces.
Ice jam at a railway bridge.
2

New Brunswick River Ice ManualCNB-7926 3
River ice related problems are common in New Brunswick throughout the winter and spring seasons; from early winter when frazil and anchor ice are generated, through the formation and growth of ice covers, to the eventual breakup and jamming in the spring. In many areas of the Province, ice jams frequently cause flooding, destruction of bridges and extensive socio-economic damages. Residents of New Brunswick need hardly be reminded of recent ice related events which were of near catastrophic proportions. In 1970, ice runs and jams destroyed 32 bridges and resulted in about $ 14 million in damages, in 1987 dol-lars. In 1976, ice jams on the Saint John River resulted in severe flooding and damages at Perth-Andover and Woodstock that totalled $ 3.6 million. Most recently, in 1987, ice jamming at and below Perth-Andover resulted in about $30 million in damages. The undocumented and intangible damages would substan-tially increase these amounts.
Recently, considerable advances have been made in understanding and predicting ice problems and in minimizing the associated socioeconomic damages. It is appropriate that this progress in scientific knowl-edge be made available to the concerned public as their understanding and cooperation is crucial in effectively managing ice related problems in rivers. The prime purpose of this Manual is to present the basics of river ice processes, as well as to identify ice problems and mitigative techniques.
The scope of this Manual is limited to the presentation of a simple and concise review of current knowl-edge of the subject. In Section 2, a description of the various ice processes is presented. A summary of climatic conditions and a description of the ice regime in New Brunswick are presented in Section 3. In Section 4, various ice monitoring techniques as well as the essential data to be collected through ground-based monitoring programs are given. Predictive methods and quantitative applications are summarized in Section 5; while methods of ice control are described in Section 6. Many of the scientific and engineering analyses involve complex theoretical and computational procedures which cannot be described in a publi-cation of this nature. The interested reader is referred to the references cited herein for further information.
• 1.0INTRODUCTION
• 2.0RIVERICEPROCESSES
• 2.1Freeze-up
» 2.1.1 Border Ice » 2.1.2 Frazil Ice » 2.1.3 Thermal Ice Cover
• 2.2Breakup
» 2.2.1 Winter Breakup » 2.2.2 Spring Breakup » 2.3 Ice Jams
Most rivers in New Brunswick are ice-covered during much of the winter season. River ice processes can normally be classified as either freeze-up or breakup. The characteristics of these processes are depen-dent upon the weather and flow conditions prevalent during the freeze-up and breakup periods. The predominant river ice processes and characteristics observed in New Brunswick rivers are presented in the following sections.
New Brunswick River Ice ManualCNB-7926 4
Air temperature and flow velocity are the two most important factors affecting ice processes during the freeze-up period. Heat exchange at the open water surface is the primary process by which the river water temperature drops in the fall. Heat transfer depends upon: solar or short-wave radiation, long-wave radia-tion, evaporation or condensation, convection, and precipitation. Corresponding heat loss rates (rates of heat transferred per unit area) can be calculated according to hydrothermal and meteorologic principles (Michel, 1971). Minor heat hermal heat and flow friction. These means of heat exchange are generally neg-ligible but may become significant when an ice cover is present.
For simplicity, the heat loss rate is often calculated as the product of the difference between air and wa-ter temperatures and a factor reflecting local and meteorological conditions. For example, this factor was found to range from 20 to 60 watts/m2oC for the St. Lawrence River (Shen et al, 1984; Prowse, 1987). By knowing the rate of heat loss and stream hydraulics, it is possible to predict the water temperature. Ice formation is imminent when the water temperature drops to near 0oC.
A description of the freeze-up processes for the most common types of ice observed in New Brunswick rivers are described below.
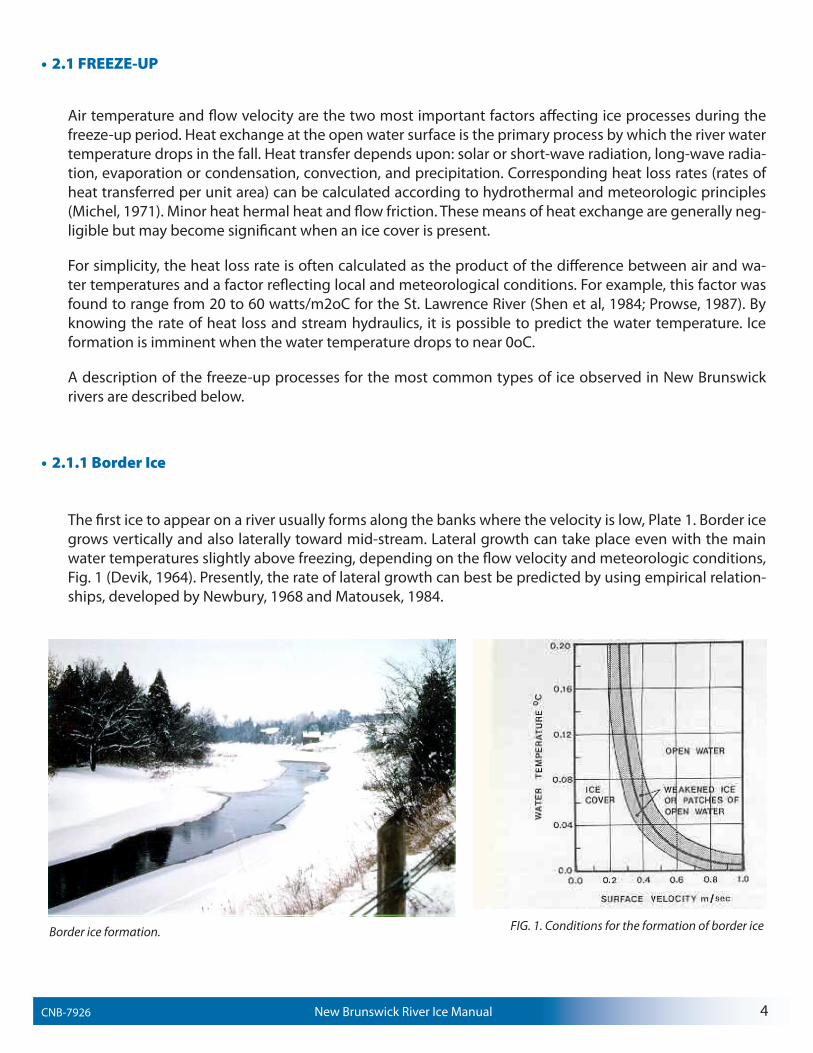
The first ice to appear on a river usually forms along the banks where the velocity is low, Plate 1. Border ice grows vertically and also laterally toward mid-stream. Lateral growth can take place even with the main water temperatures slightly above freezing, depending on the flow velocity and meteorologic conditions, Fig. 1 (Devik, 1964). Presently, the rate of lateral growth can best be predicted by using empirical relation-ships, developed by Newbury, 1968 and Matousek, 1984.
• 2.1FREEZE-UP
• 2.1.1BorderIce
Border ice formation. FIG. 1. Conditions for the formation of border ice
Frazil ice is very common in New Brunswick rivers at freeze-up as well as through the winter in ice-free turbulent reaches. It is made up of tiny ice particles which result from the slight supercooling of water (to approximately -0.05oC). The amount of frazil ice is proportional to the extent of the open water area and the rate of heat loss.
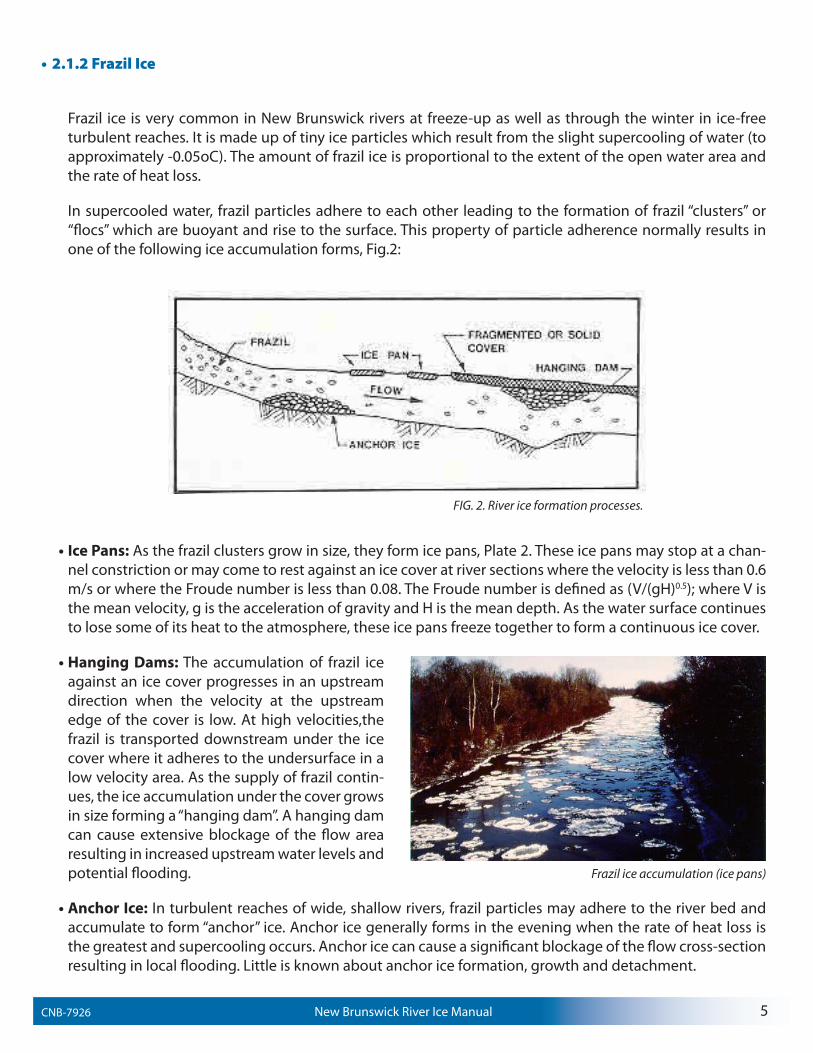
In supercooled water, frazil particles adhere to each other leading to the formation of frazil “clusters” or “flocs” which are buoyant and rise to the surface. This property of particle adherence normally results in one of the following ice accumulation forms, Fig.2:
• 2.1.2FrazilIce
• Ice Pans: As the frazil clusters grow in size, they form ice pans, Plate 2. These ice pans may stop at a chan-nel constriction or may come to rest against an ice cover at river sections where the velocity is less than 0.6 m/s or where the Froude number is less than 0.08. The Froude number is defined as (V/(gH)0.5); where V is the mean velocity, g is the acceleration of gravity and H is the mean depth. As the water surface continues to lose some of its heat to the atmosphere, these ice pans freeze together to form a continuous ice cover.
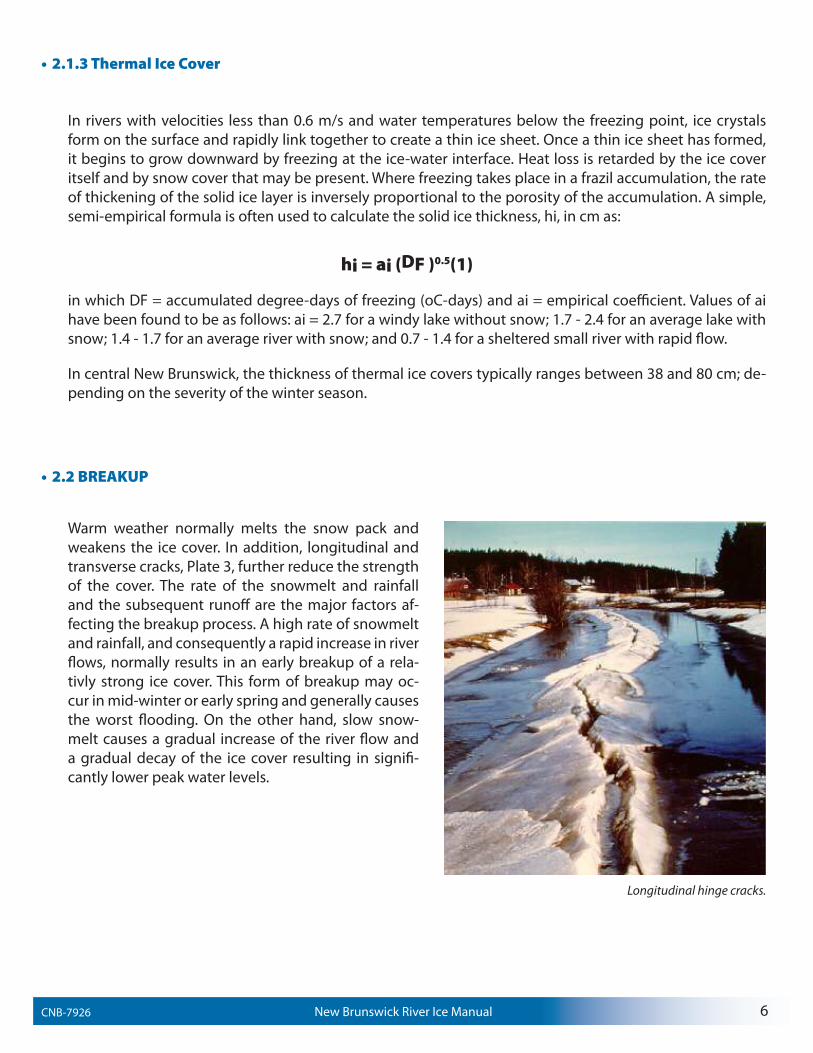
• Hanging Dams: The accumulation of frazil ice against an ice cover progresses in an upstream direction when the velocity at the upstream edge of the cover is low. At high velocities,the frazil is transported downstream under the ice cover where it adheres to the undersurface in a low velocity area. As the supply of frazil contin-ues, the ice accumulation under the cover grows in size forming a “hanging dam”. A hanging dam can cause extensive blockage of the flow area resulting in increased upstream water levels and potential flooding.
• Anchor Ice: In turbulent reaches of wide, shallow rivers, frazil particles may adhere to the river bed and accumulate to form “anchor” ice. Anchor ice generally forms in the evening when the rate of heat loss is the greatest and supercooling occurs. Anchor ice can cause a significant blockage of the flow cross-section resulting in local flooding. Little is known about anchor ice formation, growth and detachment.
FIG. 2. River ice formation processes.
Frazil ice accumulation (ice pans)
New Brunswick River Ice ManualCNB-7926 5
In rivers with velocities less than 0.6 m/s and water temperatures below the freezing point, ice crystals form on the surface and rapidly link together to create a thin ice sheet. Once a thin ice sheet has formed, it begins to grow downward by freezing at the ice-water interface. Heat loss is retarded by the ice cover itself and by snow cover that may be present. Where freezing takes place in a frazil accumulation, the rate of thickening of the solid ice layer is inversely proportional to the porosity of the accumulation. A simple, semi-empirical formula is often used to calculate the solid ice thickness, hi, in cm as:
hi=ai(DF)0.5(1)
in which DF = accumulated degree-days of freezing (oC-days) and ai = empirical coefficient. Values of ai have been found to be as follows: ai = 2.7 for a windy lake without snow; 1.7 - 2.4 for an average lake with snow; 1.4 - 1.7 for an average river with snow; and 0.7 - 1.4 for a sheltered small river with rapid flow.
In central New Brunswick, the thickness of thermal ice covers typically ranges between 38 and 80 cm; de-pending on the severity of the winter season.
• 2.1.3ThermalIceCover
• 2.2BREAKUP
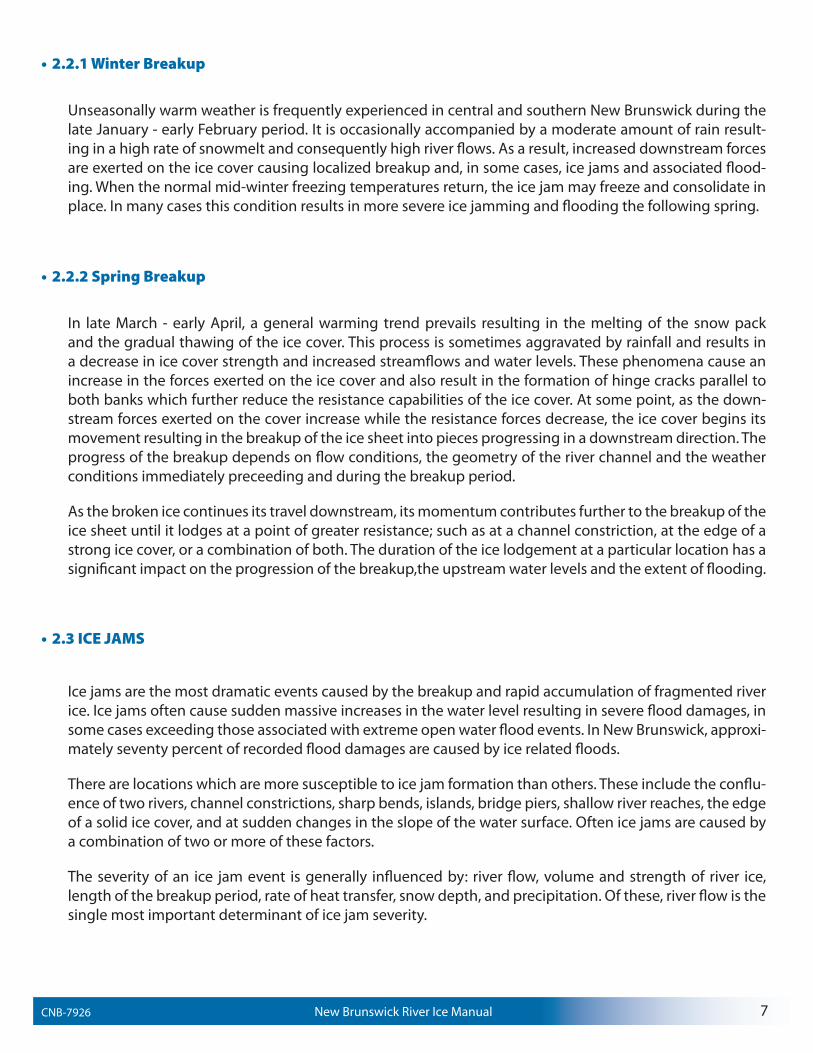
Warm weather normally melts the snow pack and weakens the ice cover. In addition, longitudinal and transverse cracks, Plate 3, further reduce the strength of the cover. The rate of the snowmelt and rainfall and the subsequent runoff are the major factors af-fecting the breakup process. A high rate of snowmelt and rainfall, and consequently a rapid increase in river flows, normally results in an early breakup of a rela-tivly strong ice cover. This form of breakup may oc-cur in mid-winter or early spring and generally causes the worst flooding. On the other hand, slow snow-melt causes a gradual increase of the river flow and a gradual decay of the ice cover resulting in signifi-cantly lower peak water levels.
Longitudinal hinge cracks.
New Brunswick River Ice ManualCNB-7926 6
Unseasonally warm weather is frequently experienced in central and southern New Brunswick during the late January - early February period. It is occasionally accompanied by a moderate amount of rain result-ing in a high rate of snowmelt and consequently high river flows. As a result, increased downstream forces are exerted on the ice cover causing localized breakup and, in some cases, ice jams and associated flood-ing. When the normal mid-winter freezing temperatures return, the ice jam may freeze and consolidate in place. In many cases this condition results in more severe ice jamming and flooding the following spring.
• 2.2.1WinterBreakup
• 2.2.2SpringBreakup
• 2.3ICEJAMS
In late March - early April, a general warming trend prevails resulting in the melting of the snow pack and the gradual thawing of the ice cover. This process is sometimes aggravated by rainfall and results in a decrease in ice cover strength and increased streamflows and water levels. These phenomena cause an increase in the forces exerted on the ice cover and also result in the formation of hinge cracks parallel to both banks which further reduce the resistance capabilities of the ice cover. At some point, as the down-stream forces exerted on the cover increase while the resistance forces decrease, the ice cover begins its movement resulting in the breakup of the ice sheet into pieces progressing in a downstream direction. The progress of the breakup depends on flow conditions, the geometry of the river channel and the weather conditions immediately preceeding and during the breakup period.
As the broken ice continues its travel downstream, its momentum contributes further to the breakup of the ice sheet until it lodges at a point of greater resistance; such as at a channel constriction, at the edge of a strong ice cover, or a combination of both. The duration of the ice lodgement at a particular location has a significant impact on the progression of the breakup,the upstream water levels and the extent of flooding.
Ice jams are the most dramatic events caused by the breakup and rapid accumulation of fragmented river ice. Ice jams often cause sudden massive increases in the water level resulting in severe flood damages, in some cases exceeding those associated with extreme open water flood events. In New Brunswick, approxi-mately seventy percent of recorded flood damages are caused by ice related floods.
There are locations which are more susceptible to ice jam formation than others. These include the conflu-ence of two rivers, channel constrictions, sharp bends, islands, bridge piers, shallow river reaches, the edge of a solid ice cover, and at sudden changes in the slope of the water surface. Often ice jams are caused by a combination of two or more of these factors.
The severity of an ice jam event is generally influenced by: river flow, volume and strength of river ice, length of the breakup period, rate of heat transfer, snow depth, and precipitation. Of these, river flow is the single most important determinant of ice jam severity.
New Brunswick River Ice ManualCNB-7926 7
» 3.1 Climate » 3.2 Morphology » 3.3 New Brunswick Ice Regions
• 3.1CLIMATE
Climate is an important factor affecting ice cover formation, growth and breakup. The climate of New Brunswick is affected by its proximity to the Atlantic Ocean and to a lesser degree by the Gulf of St. Law-rence. However, with the exception of the areas adjacent to the Bay of Fundy and the Gulf of St. Lawrence, the climate is predominantly continental, with warm humid summers and long cold winters but without a dry season.
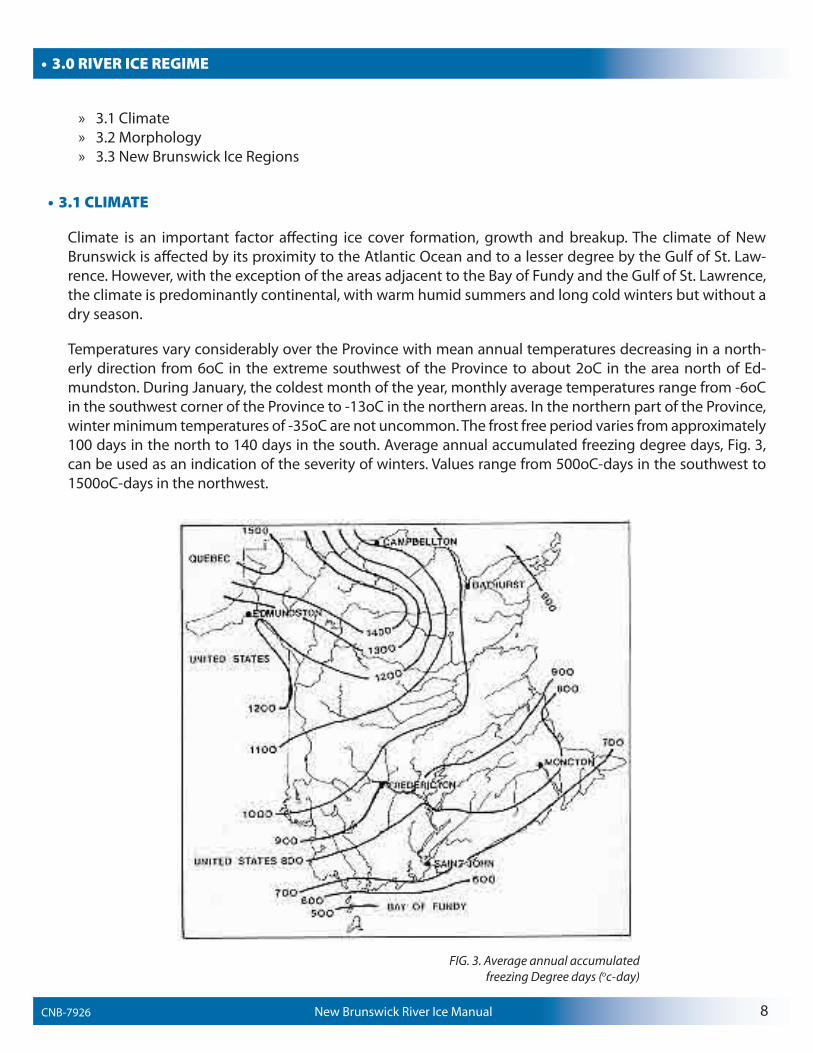
Temperatures vary considerably over the Province with mean annual temperatures decreasing in a north-erly direction from 6oC in the extreme southwest of the Province to about 2oC in the area north of Ed-mundston. During January, the coldest month of the year, monthly average temperatures range from -6oC in the southwest corner of the Province to -13oC in the northern areas. In the northern part of the Province, winter minimum temperatures of -35oC are not uncommon. The frost free period varies from approximately 100 days in the north to 140 days in the south. Average annual accumulated freezing degree days, Fig. 3, can be used as an indication of the severity of winters. Values range from 500oC-days in the southwest to 1500oC-days in the northwest.
• 3.0RIVERICEREGIME
FIG. 3. Average annual accumulated freezing Degree days (oc-day)
New Brunswick River Ice ManualCNB-7926 8
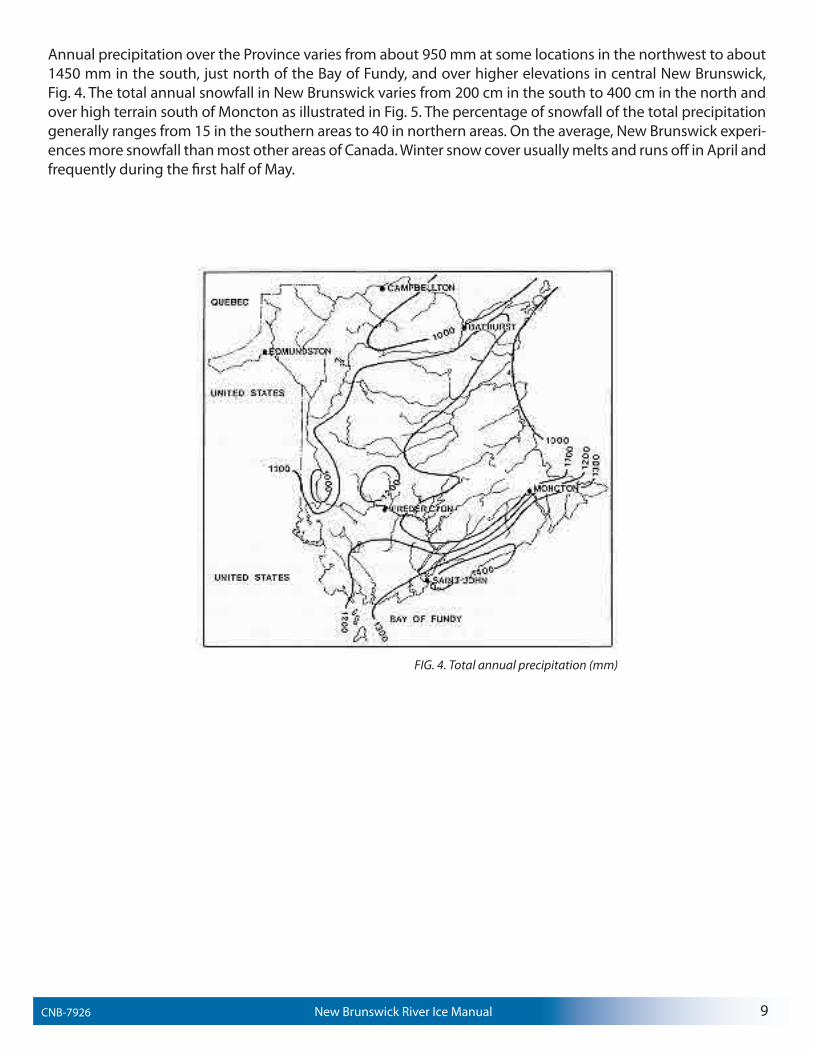
Annual precipitation over the Province varies from about 950 mm at some locations in the northwest to about 1450 mm in the south, just north of the Bay of Fundy, and over higher elevations in central New Brunswick, Fig. 4. The total annual snowfall in New Brunswick varies from 200 cm in the south to 400 cm in the north and over high terrain south of Moncton as illustrated in Fig. 5. The percentage of snowfall of the total precipitation generally ranges from 15 in the southern areas to 40 in northern areas. On the average, New Brunswick experi-ences more snowfall than most other areas of Canada. Winter snow cover usually melts and runs off in April and frequently during the first half of May.
FIG. 4. Total annual precipitation (mm)
New Brunswick River Ice ManualCNB-7926 9
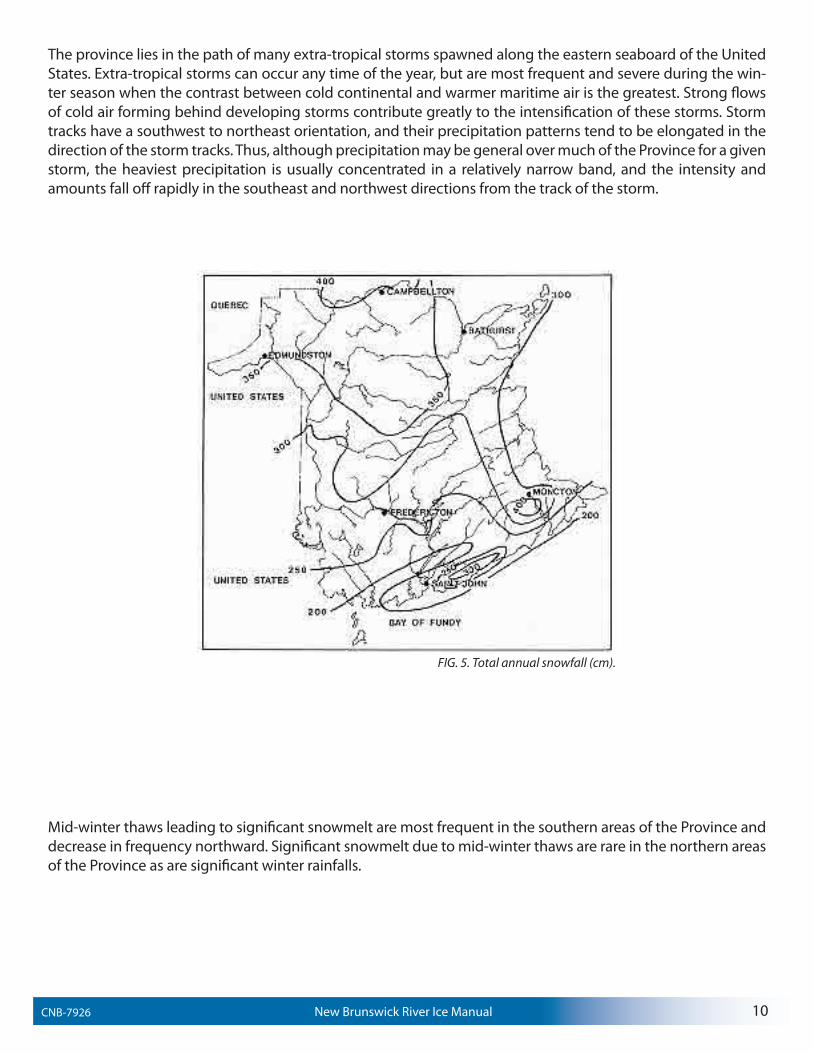
The province lies in the path of many extra-tropical storms spawned along the eastern seaboard of the United States. Extra-tropical storms can occur any time of the year, but are most frequent and severe during the win-ter season when the contrast between cold continental and warmer maritime air is the greatest. Strong flows of cold air forming behind developing storms contribute greatly to the intensification of these storms. Storm tracks have a southwest to northeast orientation, and their precipitation patterns tend to be elongated in the direction of the storm tracks. Thus, although precipitation may be general over much of the Province for a given storm, the heaviest precipitation is usually concentrated in a relatively narrow band, and the intensity and amounts fall off rapidly in the southeast and northwest directions from the track of the storm.
Mid-winter thaws leading to significant snowmelt are most frequent in the southern areas of the Province and decrease in frequency northward. Significant snowmelt due to mid-winter thaws are rare in the northern areas of the Province as are significant winter rainfalls.
FIG. 5. Total annual snowfall (cm).
New Brunswick River Ice ManualCNB-7926 10
• 3.2MORPHOLOGY
The physical characteristics of a river basin and channel geometry play an important role in the river ice regime. Although most New Brunswick rivers have some form of ice cover much of the year, there are a few rivers on which complete solid ice covers do not form. Strong ice covers may not form at the outlet of lakes or reservoirs where water is slightly warmer and more turbulent. An example is the St. Francis River near the outlet of Glasier Lake. Also ice covers may not form in steep, fast-flowing streams even though great quantities of frazil are produced. For example, the Dunbar Stream, a small steep tributary of the Nashwaak River, remains open for much of the winter season. Finally, ice covers may not form in streams which have a supply of warmer water from springs in the bed or banks. For example, an ice sheet usually does not form on most reaches of Cold Stream(Northeast of the Town of Hartland) although thick solid ice covers do form on neighbouring rivers.
Many New Brunswick rivers empty into the sea and the lower reaches are tidal. They are often characterized by wider cross-sections than the upstream reaches. Significant ice accumulations in these estuaries are be-lieved to result when a period of freezing temperatures coincides with the greatest differences in neap and subsequent spring tides. During this period, vertical ice walls can occur along the banks in a matter of days, such as in the upper reaches of the Petitcodiac and Memramcook Rivers where ice walls can reach a height of 5 m. During the spring, broken ice often accumulates near the upstream limits of estuaries, but severe ice jamming does not occur frequently (Desplanque and Bray, 1984).
• 3.3NEWBRUNSWICKICEREGIONS
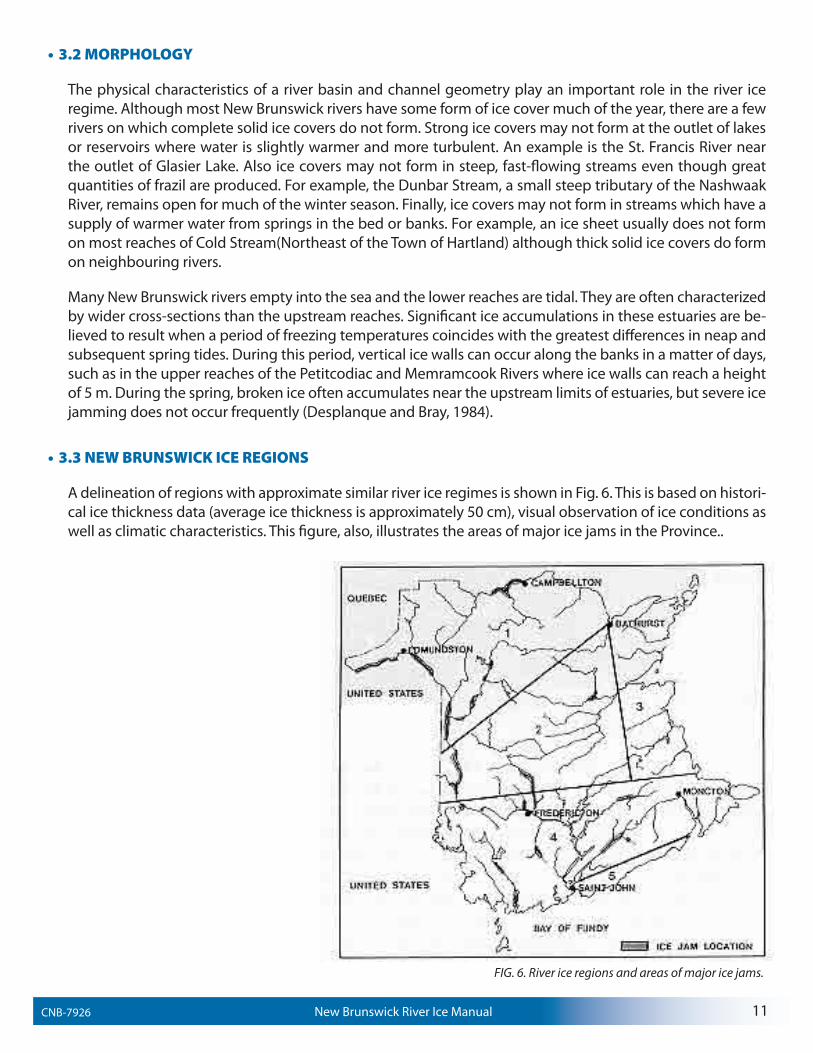
A delineation of regions with approximate similar river ice regimes is shown in Fig. 6. This is based on histori-cal ice thickness data (average ice thickness is approximately 50 cm), visual observation of ice conditions as well as climatic characteristics. This figure, also, illustrates the areas of major ice jams in the Province..
FIG. 6. River ice regions and areas of major ice jams.
New Brunswick River Ice ManualCNB-7926 11
Region 1, located in northwestern New Brunswick, is typified by the formation of above average ice thickness and a heavy snow cover. Severe mid-winter thaws and associated ice jams are very rare. Ice breakup normally occurs as a result of snowmelt during mid April. Resulting ice jams on rivers such as the Restigouche can be very severe.
In Region 2, located in central New Brunswick, river ice thickness is generally average to above average, and the snow cover is about average. The area seldom experiences mid-winter thaws that result in ice breakup but moderate to severe ice jams are prevalent in the spring.
Rivers in Region 3, which lies along the eastern coast, have average ice cover and above average snow cover. Mid-winter breakups are rare and spring breakup events are usually not severe.
In Region 4, extending across southern New Brunswick, rivers normally have a thin to average ice cover and a much lighter snow cover than northern areas. Mid-winter thaws and rain events are more common often re-sulting in early breakup and sometimes severe ice jams similar to that which occurred during February 1981 on the Kennebecasis River causing extensive flooding in the Sussex area.
In Region 5, along the Bay of Fundy, rivers form average ice cover with heavy snow cover. The area is subject to thaws and sometimes heavy mid-winter rains resulting in early breakup and ice jams of a spectacular nature. A six metre rise in water level has been recorded on the Point Wolfe River during such an event.
There are significant differences in the freeze-up and breakup dates between streams in the northern and southern portions of the province. Ice begins to form on northern rivers, such as the Restigouche, about two weeks earlier than on southern streams, such as the Kennebecasis. Typically, breakup on northern streams does not occur until mid-April while southern streams are generally ice free by mid-March.
Although, generalizations with respect to river ice regimes can be made on the basis of climate, it is not pos-sible to apply these generalizations to specific watercourses. An understanding of ice cover characteristics on a particular river is best obtained by monitoring ice conditions over a number of seasons.
New Brunswick River Ice ManualCNB-7926 12

• 4.1RIVERICEMONITORING
» 4.1.2 Ground-based Monitoring• 4.1.3 Location of Monitoring Sites• 4.1.4 Frequency of Observations• 4.1.5 Freeze-up Observations• 4.1.6 Winter Observations• 4.1.7 Pre-breakup Observations• 4.1.8 Breakup Observations• 4.1.7 Ice Jam Observations• 4.1.8 Post-breakup Observations
» 4.2 Satellite Monitoring » 4.3 Aerial Surveys
In most northern countries, some form of river ice monitoring is conducted either as part of a general data-collection program or to support specific studies. Ice monitoring can be conducted through the use of satel-lite, aerial or ground-based surveys.
At the National level, two agencies of Environment Canada - the Atmospheric Environment Service (AES) and the Water Survey of Canada (WSC) of the Inland Waters Directorate - conduct ice monitoring programs for general studies of river ice. In the Province of New Brunswick, AES collects ice information at approxi-mately 12 sites, eight of which are on rivers and four on lakes. WSC operates 84 hydrometric stations, at 18 of which detailed ice thickness surveys are conducted.
Detailed information on some New Brunswick rivers such as the Restigouche, Saint John, Meduxnekeag, Nashwaak, and Kennebecasis has been collected by Provincial agencies such as the New Brunswick Elec-tric Power Commission; the Department of Civil Engineering, University of New Brunswick; and the Water Resource Planning Branch, New Brunswick Department of Environment. A summary of historical ice thick-ness data is presented in LeBrun-Salonen (1983). River-ice monitoring can be conducted using a variety of approaches depending on the objectives and available resources. The suitability of ground-based surveys, satellite and aerial monitoring techniques for assessing river ice conditions in New Brunswick is considered in the following.
• 4.1GROUND-BASEDMONITORING
Most operational, river-ice monitoring programs rely on ground surveys to supply most of the ice data. Col-lection of detailed ice information from ground-based stations usually requires the long-term commitment of dedicated ice observers. Guidelines for ground-based monitoring of river ice are presented in the follow-ing sections.
• 4.1.1LocationofMonitoringSites
Ice observation sites should be selected at high elevation locations with more than one good vantage point from which to conduct upstream and downstream observations. It is also an advantage to have a hydromet-ric station and meteorological station in close proximity. Access to a bridge is ideal and creates the added opportunity of obtaining discharge measurements immediately following, and possibly during, breakup.
• 4.0SURVEILLANCEDELAGLACEFLUVIALE
New Brunswick River Ice ManualCNB-7926 13
• 4.1.2FrequencyofObservations
The frequency of site visits should correspond with the degree of river ice activity. During freeze-up, daily visits should be made. Once an intact ice cover has been established, visits can be reduced to one every two or four weeks, increasing the frequency as the breakup season approaches. In New Brunswick, the onset of breakup conditions can be very rapid when initiated by rain-on-snow events. Once any appreciable melt has occurred or when a major warming period is forecast, observations should be resumed on a daily basis with as many observations per day as possible during the breakup period.
• 4.1.3Freeze-UpObservations
Knowledge of the freeze-up processes is critical to the interpretation of stage records, the assessment of discharge, and ultimately to predictive modelling of freeze-up and the forecasting of breakup initiation. The main types of observations to be taken during freeze-up include:
• Stage and discharge: Monitor the stage leading to freeze-up, particularly at the time of formation of the first permanent ice cover. Measure or estimate discharge before and after freeze-up.
• Ice types and concentration: Note the type, thickness and lateral extent of border ice. Estimate the di-mensions, distribution, and concentration of frazil (or other) ice passing through the river reach. Where close inspection of the ice can be made, provide a qualitative estimate of ice strength and porosity and note the thickness and size of ice pans.
• Method of freeze-up: Describe whether the formation of the final complete ice cover results from the lodgement of ice particles across the section or from the accumulation of ice particles against a down-stream cover.
• Ice Appearance: Describe the surface of the final ice cover with particular reference to surface rough-ness and ice types. Estimate overall thickness.
• 4.1.4WinterObservations
Ice growth during the winter season determines the quantity and strength of the ice at the time of breakup. The major observations to be made during the main winter period include:
• Stage and discharge: Monitor the stage during the winter period paying particular attention to periods when the ice cover drops, forming hinge cracks. Discharge measurements can be made less frequently (say once a month).
• Snow and ice thickness: Measure the depth of the surface snow cover and thickness of the underly-ing ice cover at a number of points across the river.
• Cover composition: When measuring ice thickness, note the thickness of different ice layers and the presence of frazil accumulations beneath the main ice cover.
• Surface ice appearance: Note the surface roughness of the ice cover, including the location of pres-sure ridges and the presence of shear lines along the shore.
New Brunswick River Ice ManualCNB-7926 14
• 4.1.5Pre-breakupObservations
• Stage and discharge: Stage should be measured daily until the water level approaches that recorded at freeze-up. The frequency should then be increased (every eight to twelve hours) especially if mild weather has set in and significant runoff is anticipated. Special efforts should be made to obtain a flow measurement as close to the time of breakup as possible.
• Snow and ice thickness: Once the main snowmelt period has begun, a final survey of snow and ice thickness across the reach should be made before the surface becomes unsafe for travel.
• Cover composition: In conjunction with the final thickness survey, note the thickness of the different ice layers and the frazil accumulations beneath the ice cover.
• Surface conditions: Once surface travel is unsafe, note the percentage of area covered by snow, the presence of ponded meltwater, and when the water drains from the surface.
• Shore conditions: Note the depth and width of any water accumulating near the shore and if any flow is apparent. Also describe the formation, size, and position of any major cracks, and note when the main ice cover “lifts” and detaches from the shore.
• 4.1.6BreakupObservations
Of all the breakup observations, special efforts should be made to obtain accurate records of maximum stage. Crest-stage gauges and time-lapse cameras can be used effectively to monitor the breakup stage.
• Stage: Water levels should be monitored as frequently as possible. Points of specific interest include: the rate of rise in water level immediately prior to the initial fracturing and movement of the ice sheet, water levels at the time of first ice movement, the maximum water level, and changes in water level as fractured ice clears the reach.
• Breakup front: The character of a breakup front (upstream end) can vary considerably but there are usually two distinct styles. The first involves a rapid transition from intact ice cover to highly fractured ice. In such cases, estimate the rate at which this fractured breakup front moves downstream. The sec-ond style is characterized by a large scale fracturing of the ice sheet followed by a downstream move-ment of larger pans which often rotate and fracture. In this second case, estimate the speed at which the initial pans move downstream.
New Brunswick River Ice ManualCNB-7926 15
• 4.1.7IceJamObservations
Because ice jams are responsible for the highest water levels on many rivers, information should be col-lected regarding their mode of initiation and failure, their effect on stage, and even their size in terms of elementary parameters such as length, depth, and width.
• Stage and discharge: Water levels should be monitored as frequently as possible. Points of specific interest include: the rise in water level when the moving ice stops, the maximum water level while the jam is in place, and the water level when the jam breaks and ice begins to clear from the reach. Make notes or take photographs of the water level at the jam site relative to local objects. Any signifi-cant physical changes in the condition of the jam during the survey of water levels should be noted. Estimate the velocity of the breakup front which leads to formation of the ice jam and the velocity of surface ice when the ice jam releases.
• Areal extent of ice jam: Note whether the ice completely or only partially blocks the river cross-sec-tion. If visible, also record the location of the downstream (toe) and upstream (head) ends of the jam.
• Conditions at toe of ice jam: Describe whether the jam has been halted by some downstream ob-struction, such as an intact ice cover, man-made structure, shoal, sharp bend, channel constriction, etc. or stopped by the lodging of ice floes across the river channel.
• Conditions at head of ice jam: Estimate the size and concentration of incoming ice. Also note wheth-er the ice is accumulating and contributing to upstream progression of the jam or is being transport-ed downstream underneath the jam.
• Surface conditions: Note the roughness and texture of the ice jam surface. Estimate the distance from shore of any shear lines which have formed from differential movement within the ice jam. At-tempt to identify whether the jam is comprised of a single layer of floes or if there has been notice-able compaction and thickening of the jam. Note also if the surface is ‘buckled’ or has localized ice mounds. This may indicate that ice is grounded on the river bed.
New Brunswick River Ice ManualCNB-7926 16
• 4.1.8Post-breakupObservations
• Stage and discharge: Continue regular monitoring of water levels until the majority of floating ice has completely cleared from the reach. Where access is available, such as from a bridge, discharge should be measured as soon as the river becomes sufficiently clear of floating ice. Details should be provided regarding the stability of the flow at the time of the measurement and the relative location of any ice accumulations in the river both upstream and downstream of the measurement site. Obser-vations of stage and discharge should continue until backwater effects due to ice disappear.
• Ice thickness: Measure the thickness of ice floes that have been stranded along the shore. Where possible, use ice floes which were not badly deformed by ice jam forces. Provide a brief description of the quality or structural integrity of the ice floes, such as whether the ice is heavily candled or remains relatively competent.
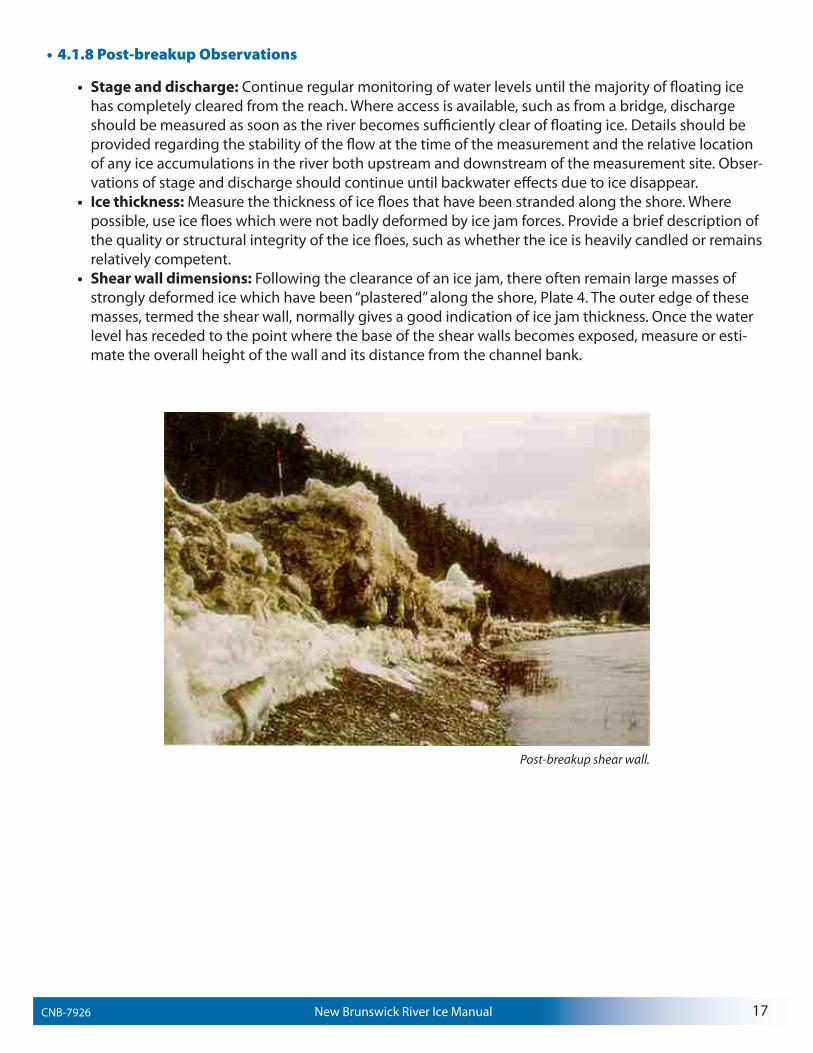
• Shear wall dimensions: Following the clearance of an ice jam, there often remain large masses of strongly deformed ice which have been “plastered” along the shore, Plate 4. The outer edge of these masses, termed the shear wall, normally gives a good indication of ice jam thickness. Once the water level has receded to the point where the base of the shear walls becomes exposed, measure or esti-mate the overall height of the wall and its distance from the channel bank.
Post-breakup shear wall.
New Brunswick River Ice ManualCNB-7926 17
• 4.2SATELLITEMONITORING
Satellites could provide data concerning river ice conditions during cloud-free days. Coverage could be obtained from one of the following satellites: GOES (Geostationary Operational Environmental Satellites), Landsat II (previously ERTS, Earth Resource Technology Satellite), NOAA (National Oceanographic and Atmo-spheric Administration; NOAA and TIROS series satellites), and SPOT (Systeme Pour l’Observation de la Terre).
The best ground resolution (10-20m) is provided by the new French SPOT satellite which also has a high orbital frequency and forward and backward observation capability. Using the steering capabilities of the instruments, successive images of New Brunswick can be obtained approximately every three days. The major drawback of the SPOT system is the very high cost of both visible image and computer tape products.
The next best ground resolution (40-80m) is provided by the polar orbiting Landsat. However, the long 18-day interval between successive passes precludes its use for monitoring short-term changes associated with river ice activity.
The most frequent imagery, as often as every 30 minutes, is provided by GOES. The GOES resolution (1-km visible imagery, 8-km in thermal imagery) is considerably worse than Landsat or SPOT. Furthermore, New Brunswick is close to the northern boundary of useful imagery (approx. 50oN)..
Daily coverage can also be obtained from the NOAA polar-orbiting satellites at a resolution of 1km. The AVHRR (Advanced High Resolution Radiometer) data collected by these satellites is particularly useful for river ice monitoring.
• 4.3AERIALSURVEYS
Most aerial surveys of ice conditions have employed oblique photography from which reasonably detailed information, such as ice conditions and concentration, or heights of water relative to local features can be extracted.
Aerial surveys can also provide much more detailed quantitative information when vertical, rather than oblique, photography is obtained. Details for con-ducting river ice aerial surveys are given in Watson (1988). Vertical photogra-phy permits the use of stereo-photogrammetric analysis which relies on direct measurement of relief features and ice/water elevations. Stereo-photography can also be used to obtain detailed measurements of surface ice velocities from which discharge during the freeze-up and breakup periods can be calcu-lated (Prowse et al. 1986; Sherstone 1980).
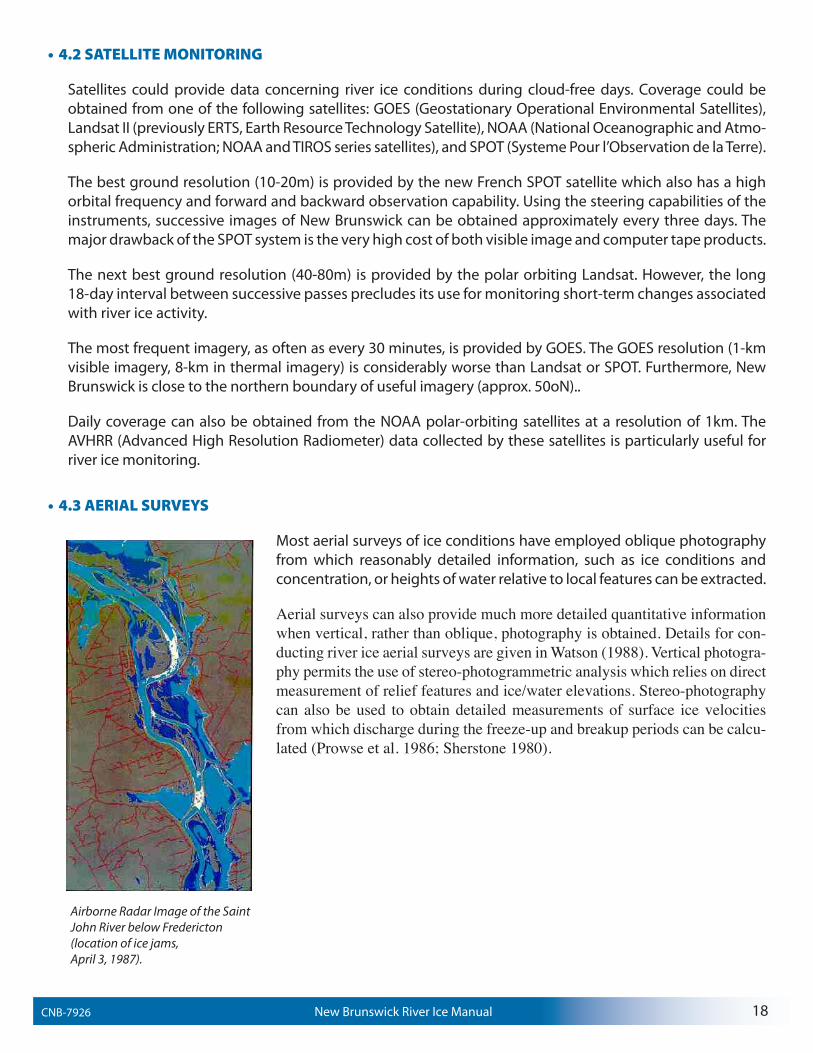
Airborne Radar Image of the Saint John River below Fredericton (location of ice jams, April 3, 1987).
New Brunswick River Ice ManualCNB-7926 18
» 5.1 Freeze-up Jamsl » 5.2 Breakup
• 5.2.1 Ice Decaye• 5.2.2 Initiation of Breakup
» 5.3 Breakup Jams
Practical questions pertaining to river ice usually involve such matters as forecasting and flood warning as well as the selection of remedial measures. It is possible in some instances to address such questions by simple application of the quantitative understanding and formulae summarized in this section.
Numerical models are well suited to solving a wide variety of river ice problems; however, certain con-ditions may preclude their use. Physical modelling might then be an alternative or complementary ap-proach. A major difficulty here lies in the scaling down of the strength characteristics of intact ice covers (Michel, 1978).
Often, however, it is essential to simulate the entire ice regime in detail. This can be accomplished using numerical models that are capable of taking into account the detailed geometry of the river, weather varia-tions and the physical ice processes which occur. It should be emphasized, however, that existing river ice knowledge has serious gaps. This is commonly circumvented by making “plausible” empirical assumptions backed by site-specific observations.
5.1FREEZE-UPJAMS
Full-width ice covers can start by gradual extension and closure of border ice, by arrest of a moving sheet ice, and by congestion of moving ice pans. The latter process is the most common in New Brunswick but not reliably predictable without field observations.
Where congestion occurs and the flow velocity or the Froude number is less than a critical value, a loose cover comprised of a single layer of ice floes is initiated. Critical velocities are typically 0.6 - 0.7 m/s for frazil and slush, while critical Froude numbers are typically 0.08 - 0.1. This cover subsequently solidifies by freezing of the interstitial water. If the leading edge, Plate 5, of this type of cover arrives at an area where the flow velocity or the Froude number is greater than the critical value, the incoming floes will submerge and two types of jams may form, depending on local conditions.
The first type is generally formed where the flow velocity is low enough to cause deposition of the sub-merging floes under the existing cover. A thickened, porous cover will then form and progress upstream with a thickness, t (Michel, 1971), as:
t = 6,25 Vu2 /(l-p) g (2)
in which Vu = average flow velocity under the accumulation, g = acceleration of gravity and p = porosity of the accumulation. This type of cover is also known as a “narrow” jam (Pariset et al., 1966).
• 5.0PREDICTIVEMETHODS
New Brunswick River Ice ManualCNB-7926 19
As a porous ice accumulation, or jam, propagates upstream, the forces applied on it increase and, under certain conditions, may exceed the jam’s capacity to resist them. The applied forces result primarily from the friction created by the flow at the lower boundary of the jam and the weight component of the ice. The jam collapses or “shoves” and thickens until it is just able to resist the applied forces. This type of ice process occurs frequently in hydraulically “wide” rivers. A useful indicator to classify rivers as “wide” or “nar-row” can be attained through the use of the relationship ( V2C2*/B ), where V=mean velocity upstream of the accumulation in m/s, C* is the Chezy’s roughness in m0.5/s and B is the river width in m (Acres Interna-tional Ltd., 1980). “Wide” river jams generally occur when the above relationship is less than 24; otherwise, “narrow” river jams occur.
The second type of jam is formed when the submerging floes are transported by the flow until they come to a region of reduced velocity, and are deposited under the cover. Very large accumulations, called hang-ing dams, can form in this manner.
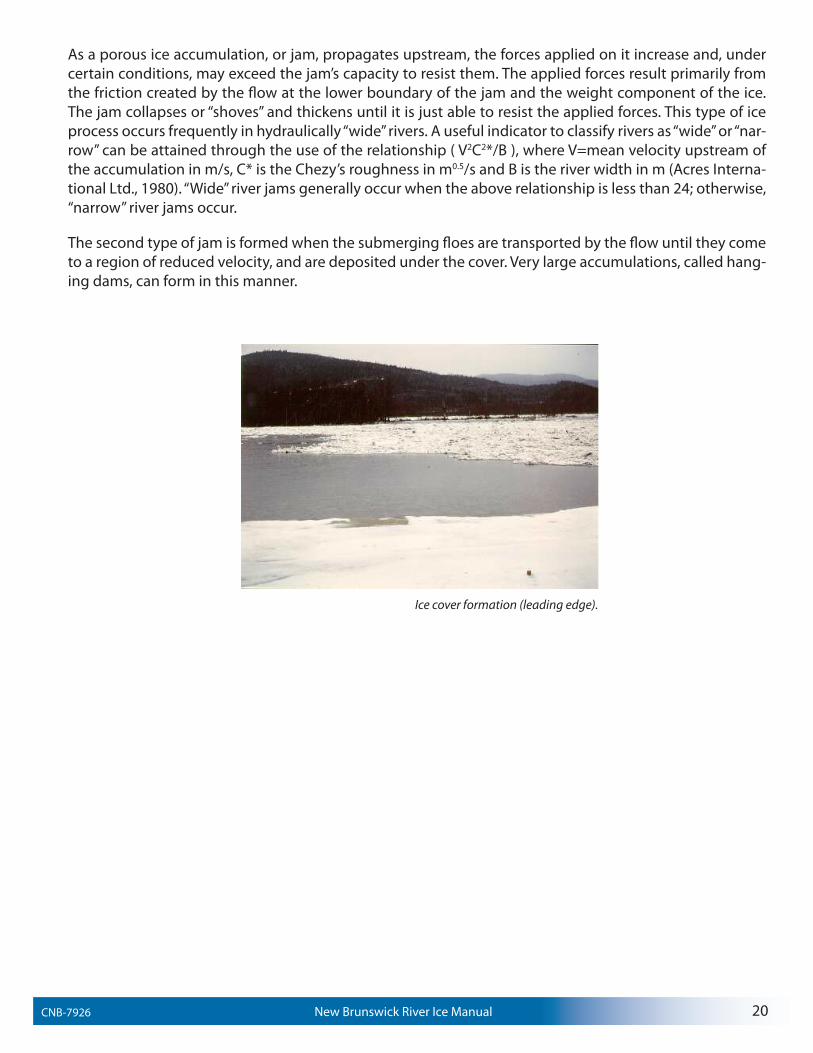
Ice cover formation (leading edge).
New Brunswick River Ice ManualCNB-7926 20
• 5.2BREAKUP
The decay, fracture, transport and eventual clearance of the ice from a river, are the main processes taking place during the so-called breakup period. Breakup is triggered by warmer weather and is of particular in-terest because major ice jams with serious potential for damage often result.
• 5.2.1IceDecay
Warmer weather brings about reductions in ice thickness and strength. Melting of the cover can occur at both top and bottom surfaces and is a complex hydrometerologic process. Bilello (1980) proposed a simple formula for thickness reductions in cm, hi, due to mild weather, as:
hi=a2 DT (3)
in which DT = accumulated degree-days of “thaw” (above a base of -5oC); and a2 = empirical coefficient, found between 0.4 and 1.0 cm/oC-d for Northern Canadian and Alaskan rivers.
Ice strength is reduced by penetrating solar radiation, following the increase of ice temperatures to 0oC. Excess heat melts the ice at crystal boundaries (Bulatov, 1972; Ashton, 1983). In extreme cases, the result is “candled” ice which has practically no strength. Prediction of ice strength reduction is, however, complex and uncertain where no calibration data exist (Prowse, 1987).
• 5.2.2InitiationofBreakup
When a runoff event is forecast for a specific river reach, it is important to be able to predict whether it will cause breakup of the ice cover. To address this problem in a quantitative manner, it is necessary to define what is the “onset” of breakup or breakup “initiation”. This is taken to be the time when the ice cover at a given site is set in motion for a sustained period.
A simple empirical approach has been used whereby the breakup is expected to start when the water level rises above that of the preceding freeze-up by a “critical” amount, HB. In turn, this rise depends on ice cover thickness, hi, and strength (Beltaos, 1984; and Shulyakovskii, 1963) and is represented as:
HB = c hi (4)
in which c = site-specific dimensionless coefficient. The coefficient c is dependent on several variables such as river bends and slope, flow shear stress, ice strength and thickness loss, and steepness of the river banks. Where the thermal effects (thickness/strength losses) on the ice cover are small, the value of c has a maxi-mum of c0 at a given site; where c0 generally falls in the range of 2.2 - 3.5 (Beltaos, 1989). Where the ther-mal effect is significant, the difference, c0hi- HB, has been empirically related to a thermal index (of which the simplest version is the accumulated degree-days of thaw). Such relationships are site-specific (Beltaos, 1984; Tang and Davar, 1984; Burrell et al., 1986) and more field data are needed to enable generalization.
New Brunswick River Ice ManualCNB-7926 21
• 5.3BREAKUPJAMS
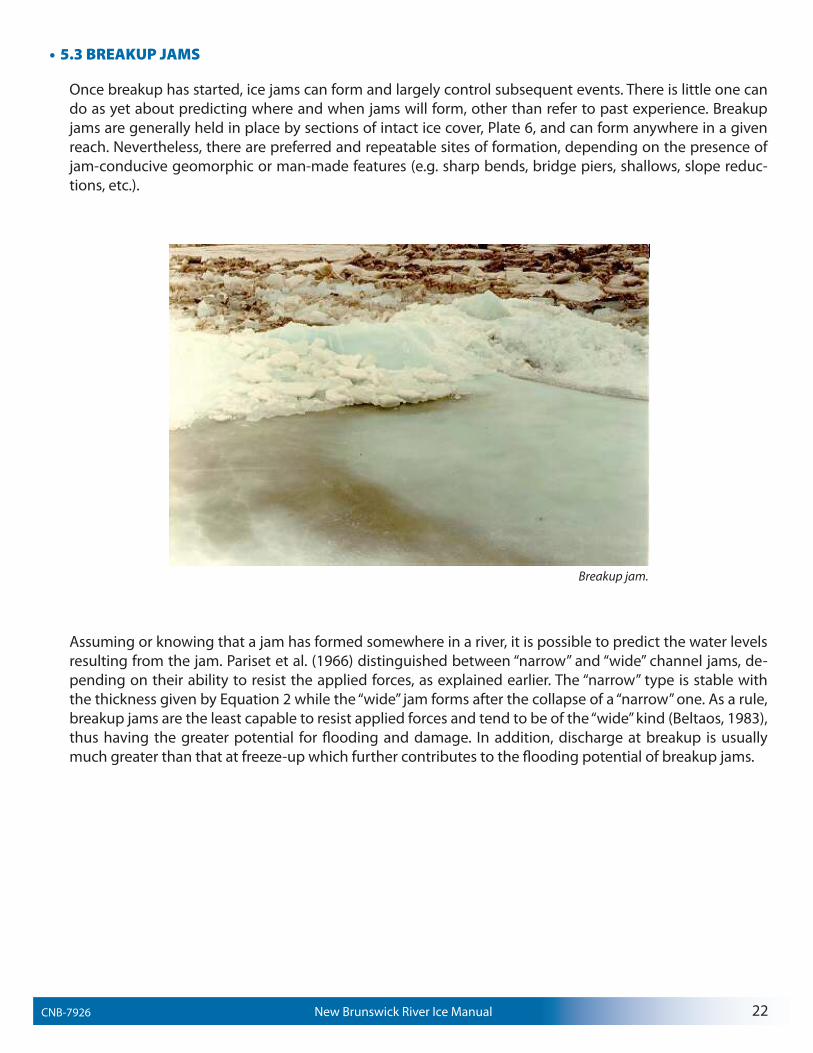
Once breakup has started, ice jams can form and largely control subsequent events. There is little one can do as yet about predicting where and when jams will form, other than refer to past experience. Breakup jams are generally held in place by sections of intact ice cover, Plate 6, and can form anywhere in a given reach. Nevertheless, there are preferred and repeatable sites of formation, depending on the presence of jam-conducive geomorphic or man-made features (e.g. sharp bends, bridge piers, shallows, slope reduc-tions, etc.).
Assuming or knowing that a jam has formed somewhere in a river, it is possible to predict the water levels resulting from the jam. Pariset et al. (1966) distinguished between “narrow” and “wide” channel jams, de-pending on their ability to resist the applied forces, as explained earlier. The “narrow” type is stable with the thickness given by Equation 2 while the “wide” jam forms after the collapse of a “narrow” one. As a rule, breakup jams are the least capable to resist applied forces and tend to be of the “wide” kind (Beltaos, 1983), thus having the greater potential for flooding and damage. In addition, discharge at breakup is usually much greater than that at freeze-up which further contributes to the flooding potential of breakup jams.
Breakup jam.
New Brunswick River Ice ManualCNB-7926 22
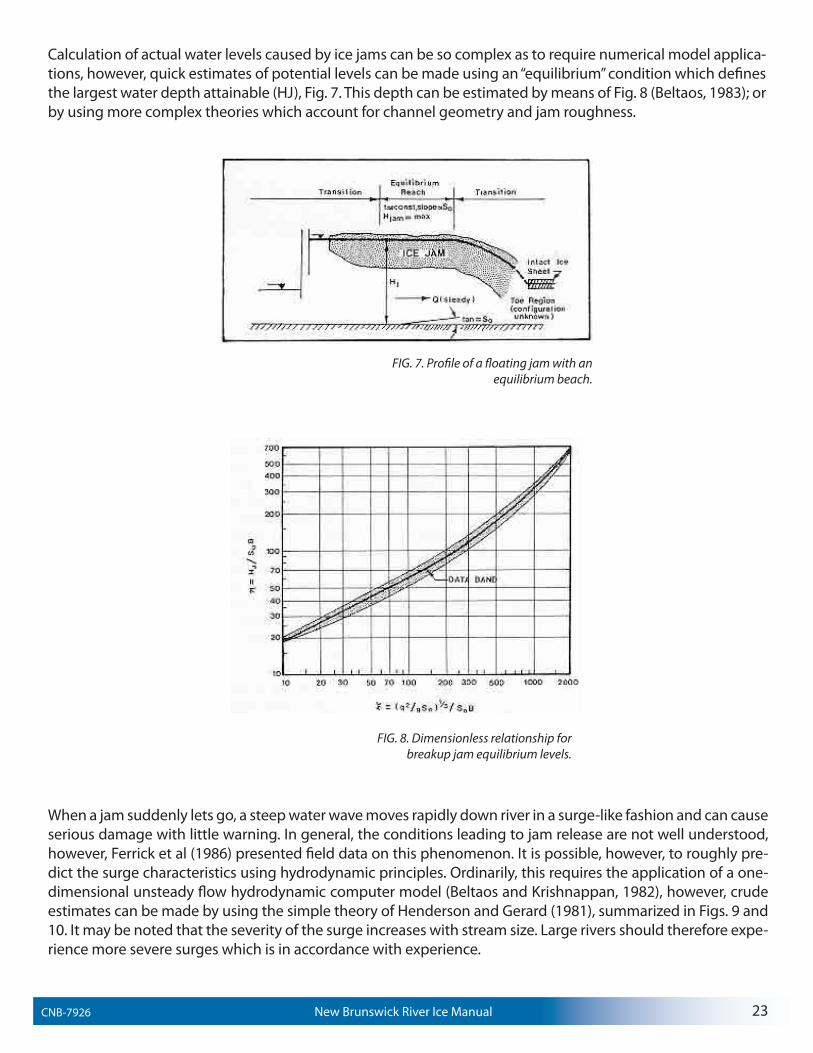
Calculation of actual water levels caused by ice jams can be so complex as to require numerical model applica-tions, however, quick estimates of potential levels can be made using an “equilibrium” condition which defines the largest water depth attainable (HJ), Fig. 7. This depth can be estimated by means of Fig. 8 (Beltaos, 1983); or by using more complex theories which account for channel geometry and jam roughness.
FIG. 7. Profile of a floating jam with an equilibrium beach.
FIG. 8. Dimensionless relationship for breakup jam equilibrium levels.
When a jam suddenly lets go, a steep water wave moves rapidly down river in a surge-like fashion and can cause serious damage with little warning. In general, the conditions leading to jam release are not well understood, however, Ferrick et al (1986) presented field data on this phenomenon. It is possible, however, to roughly pre-dict the surge characteristics using hydrodynamic principles. Ordinarily, this requires the application of a one-dimensional unsteady flow hydrodynamic computer model (Beltaos and Krishnappan, 1982), however, crude estimates can be made by using the simple theory of Henderson and Gerard (1981), summarized in Figs. 9 and 10. It may be noted that the severity of the surge increases with stream size. Large rivers should therefore expe-rience more severe surges which is in accordance with experience.
New Brunswick River Ice ManualCNB-7926 23
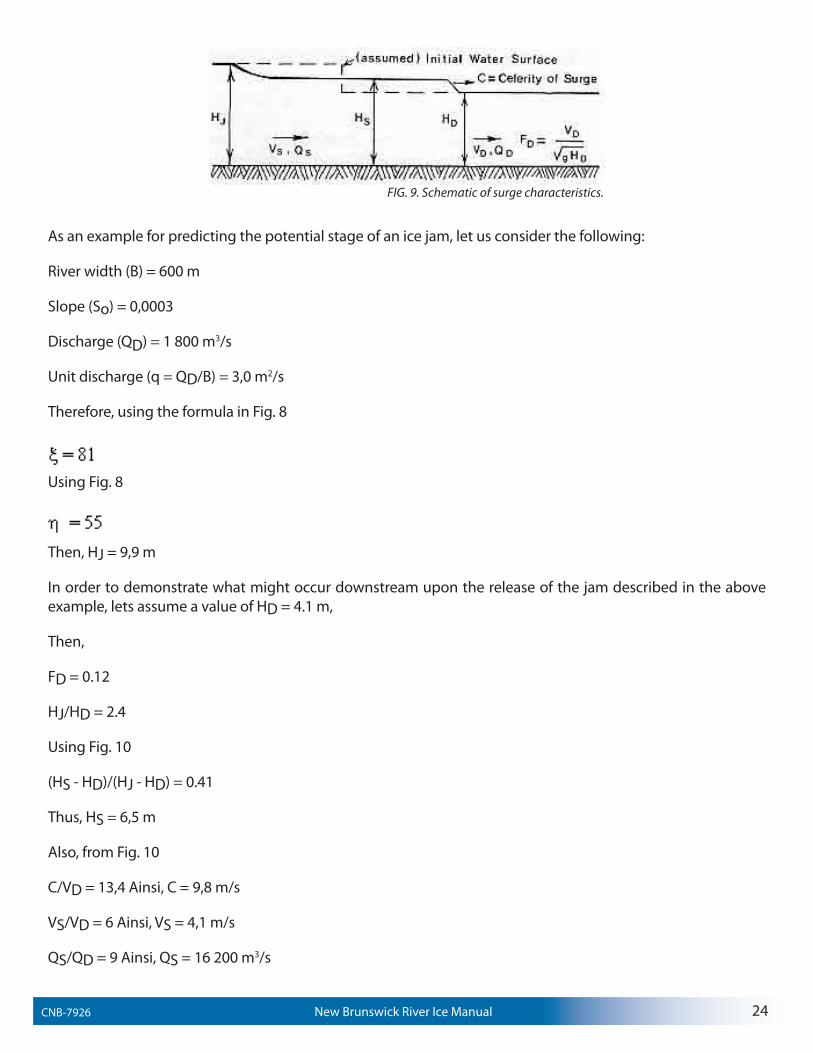
FIG. 9. Schematic of surge characteristics.
As an example for predicting the potential stage of an ice jam, let us consider the following:
River width (B) = 600 m
Slope (So) = 0,0003
Discharge (QD) = 1 800 m3/s
Unit discharge (q = QD/B) = 3,0 m2/s
Therefore, using the formula in Fig. 8
image
Using Fig. 8
image
Then, HJ = 9,9 m
In order to demonstrate what might occur downstream upon the release of the jam described in the above example, lets assume a value of HD = 4.1 m,
Then,
FD = 0.12
HJ/HD = 2.4
Using Fig. 10
(HS - HD)/(HJ - HD) = 0.41
Thus, HS = 6,5 m
Also, from Fig. 10
C/VD = 13,4 Ainsi, C = 9,8 m/s
VS/VD = 6 Ainsi, VS = 4,1 m/s
QS/QD = 9 Ainsi, QS = 16 200 m3/s
New Brunswick River Ice ManualCNB-7926 24
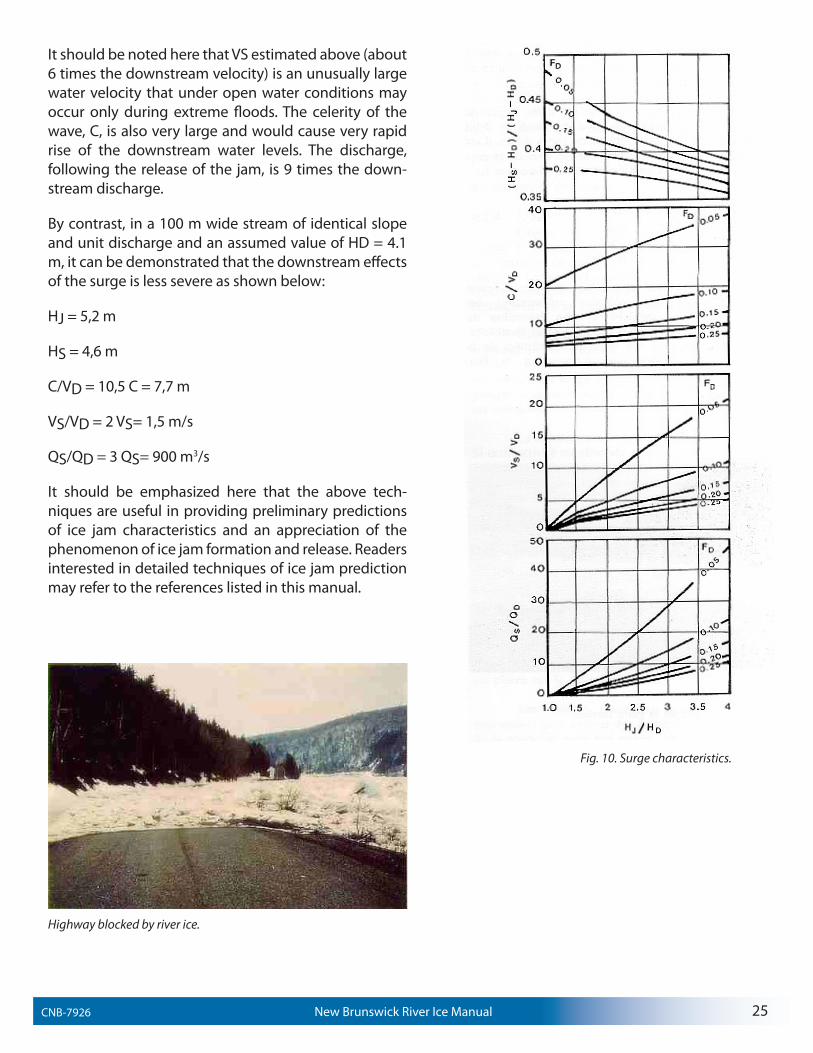
It should be noted here that VS estimated above (about 6 times the downstream velocity) is an unusually large water velocity that under open water conditions may occur only during extreme floods. The celerity of the wave, C, is also very large and would cause very rapid rise of the downstream water levels. The discharge, following the release of the jam, is 9 times the down-stream discharge.
By contrast, in a 100 m wide stream of identical slope and unit discharge and an assumed value of HD = 4.1 m, it can be demonstrated that the downstream effects of the surge is less severe as shown below:
HJ = 5,2 m
HS = 4,6 m
C/VD = 10,5 C = 7,7 m
VS/VD = 2 VS= 1,5 m/s
QS/QD = 3 QS= 900 m3/s
It should be emphasized here that the above tech-niques are useful in providing preliminary predictions of ice jam characteristics and an appreciation of the phenomenon of ice jam formation and release. Readers interested in detailed techniques of ice jam prediction may refer to the references listed in this manual.
Fig. 10. Surge characteristics.
Highway blocked by river ice.
New Brunswick River Ice ManualCNB-7926 25
• 6.0ICECONTROL
» 6.1 Ice Jam Mitigation• 6.1.1 Fixed Structures• 6.1.2 Ice Booms• 6.1.3 Channel Modification• 6.1.4 Dusting• 6.1.5 Blasting• 6.1.6 Ice Cutting• 6.1.7 Mechanical Ice Removal• 6.2 Ice Adhesion
» 6.3 Winter Navigation
• REFERENCES
It is sometimes desirable to control the ice regime in order to eliminate or lessen the impacts of ice related problems. These problems include ice jam flooding, the loss of hydroelectric power production, the block-age of navigable channels, and damage to hydraulic structures. Examples of various control measures are provided in this section.
• 6.1ICEJAMMITIGATION
Ice jam mitigation includes those measures done to eliminate or lessen the problems that may occur due to the formation or release of an ice jam. Considerable understanding of the ice regime, is required in the implementation of any of the following mitigation techniques.
New Brunswick River Ice ManualCNB-7926 26
• 6.1.1FixedStructures
Fixed structures are used to stabilize an ice cover or prevent the downstream movement of broken ice. Stabilization of an ice cover prevents its premature breakup thus increasing the chances of the ice melt-ing in place, while at the same time the retention of moving ice floes reduces the supply of ice to potential downstream ice jam locations.
Fixed structures must be designed to withstand applied forces. The forces include the impact of moving ice floes and the thermal expansion of ice sheets. Physical hydraulic modelling may be required during the design and installation of fixed structures to control ice (Perham, 1984).
Groins and jetties can be used to constrict the channel width (Cumming-Cockburn & Associates Limited, 1986) in order to promote “bridging” of ice floes during freeze-up and to raise upstream water levels thereby improving the upstream hydraulic conditions for ice cover stability. Such structures also create a storage place for ice floes at breakup, thus reducing the volume of ice moving downstream.
An ice control dam obstructs the passage of ice in order to prevent ice jam formation downstream (Michel, 1971). Depending on the available reservoir storage in relation to the spring flood magnitude, it may be possible for the flood control structure to retain all contributing upstream ice until it eventually melts. More commonly, however, the available storage is only sufficient to delay the passage of weaker ice. Ice control structures may, however, initiate ice jams near the upstream limit of the headpond since the momentum of moving ice is arrested considerably by stronger headpond ice and a significant reduction in the hydraulic gradient. An ice control dam does provide high reliability with minimal monitoring and operational require-ments; however, other environmental or economic realities may preclude its use.
Weirs are low-head overflow dams built across a stream to raise upstream water levels to create suitable conditions for formation of a stable ice cover or for the accumulation of frazil ice or ice pans. Properly de-signed weirs can provide reliable control of ice at suitable sites on small rivers during both the freeze-up and breakup periods.
• 6.1.2.IceBooms
Ice booms are installed across a watercourse to control the movement of ice. They can be used to reduce the supply of ice to downstream jamming sites by restricting the movement of upstream ice and prolonging the period of ice discharge. Ice booms are most commonly used, however, to stabilize or retain an upstream ice cover where velocities are less than 0.6 m/s or Froude numbers are less than 0.08. Ice booms usually consist of timbers shackled together by chains and held together by cables anchored to the river bed. Pier-mounted booms can also be constructed. For example, the Montreal ice control structure uses floating steel booms or stop logs placed between fixed concrete piers to collect ice floes and to help stabilize the ice cover earlier in winter than otherwise would be the case.
New Brunswick River Ice ManualCNB-7926 27
• 6.1.3.ChannelModification
Research and observations (Calkins et al., 1976) reveal that ice jams tend to form at sites where there are: surface obstructions, river bends, river channel slope changes, constrictions, low velocity pools and shallow river sections.
Channel modifications can be carried out in order to reduce the likelihood of ice jams. Such modifications include the removal of constrictions and surface obstructions such as piles, old bridge piers, and natural islands as well as the removal of sand and gravel bars. Channel diversions can also be constructed to by-pass an obstruction to ice and water flow. However, channel modifications should be evaluated on a site-specific basis.
In New Brunswick, a permit must be obtained before an alteration is made to the bed or banks of a water-course. Projects are reviewed in order to protect individuals or structures, as well as fish habitat and the environment, which may be affected by the alteration.
• 6.1.4Dusting
Dusting is the spreading of a thin layer of a dark substance over an ice cover in order to weaken it because of increased heat absorption. The dusting material could be sand, fly ash, or another dark substance that is environmentally safe.
Dusting can be done for the purpose of preventing the occurence of an ice jam at sites of known ice jam-ming or near highly developed flood prone areas. Dusting is not effective on rough ice surfaces such as ice jams since the heat absorption property of such surfaces is very low.
The timing of dusting operations is very important. If it is done too early, it could be covered by a late snow-fall which would reduce its effectiveness. If attempted too late, the ice could become too weak and unsafe to allow the spreading of the dusting material, or the ice could breakup and jam before the dusting material takes effect.
• 6.1.5Blasting
Blasting may be used to break an ice cover into floes which can be transported by the water downstream or to weaken a solid ice cover prior to the arrival of upstream ice. The explosive charge is usually placed in the water underneath the ice. A much greater charge would be required if it is placed on or within the ice.
Properly placed explosives may be used for removing ice jams by blasting the ice sheet holding the jam in place. The ideal time to release a jam is just after it has formed. If the flow has dropped, blasting the jam will be ineffective due to the lack of sufficient water to carry the loosened ice downstream.
Blasting ice jams is rarely effective and is dangerous to the blasting crew and neighbouring property. The placement of an explosive charge is dangerous work that must only be performed by trained personnel. Adequate safety, rescue and first aid measures should be in place before the commencement of work.
New Brunswick River Ice ManualCNB-7926 28
• 6.1.6.IceCutting
Ice cutting refers to the cutting, sawing, or splitting of an ice cover to cause it to melt faster or to break it into smaller pieces that will be transported more readily when water levels rise. Ice cutting can only be done if the ice cover is strong enough to support cutting machinery and crews.
The City of Ottawa has a program of cutting and blasting ice in the Rideau River to prevent the formation of ice jams. Strips of about 15 - 20 m wide are cut where the ice has a tendency to remain solid. Then crews drill and blast the ice at the downstream end prior to the arrival of spring flows.
Ice cutting has also been done to prevent ice jams in the Beaurivage River near Quebec City. Ice cutting has many advantages over blasting techniques; it breaks more ice than blasting, it is only one-third the cost, has no environmental impacts and is generally safer.
• 6.1.7.MechanicalIceRemoval
For small streams accessible from the banks, it may be possible to remove ice using construction equipment, such as back hoes and drag lines, before ice jams form. The efficient and safe removal of ice depends, in part, upon the equipment operator whose judgement must be exercised as ice removal operations progress.
• 6.2ICEADHESION
The adhesion of supercooled frazil ice to structures (trash racks, hydraulic gates, etc.) is another major prob-lem. Several solutions to this problem exist.
One approach is to heat the surface to which ice adheres. This can be accomplished by applying steam or warm water to the affected area, or by incorporating electrical resistance or steam/hot water heating within the structure. Usually the objective is to keep the surface temperature above the freezing point so that ice will not adhere to it.
Another approach is to use construction materials and coatings to which ice bonds weakly so that it can be easily removed. One coating that has been effective is a plastic type liner made from a copolymer solution of toulene and silicone oil (Ashton 1986).
New Brunswick River Ice ManualCNB-7926 29
• 6.3WINTERNAVIGATION
There is little or no inland navigation on New Brunswick rivers during the ice season, with the exception of ferry operations across rivers and limited penetration of ocean-going vessels into river estuaries. Icebreak-ers are commonly used to control river ice for the purpose of navigation.
Air bubbler systems can also be effective in preventing the growth of a solid ice cover at navigation locks, port facilities and ferry crossings, but are impractical for long river reaches. In a bubbler system, an air-driven warm water jet is directed upward to melt or suppress the growth of river ice. The plume of warm flowing water created by the rising air bubbles spreads as it rises and melts the ice cover (Ashton, 1986). The most important requirement for successful performance of an air bubbler system is a supply of warmer water near the channel bed (U.S. Department of the Army, 1982).
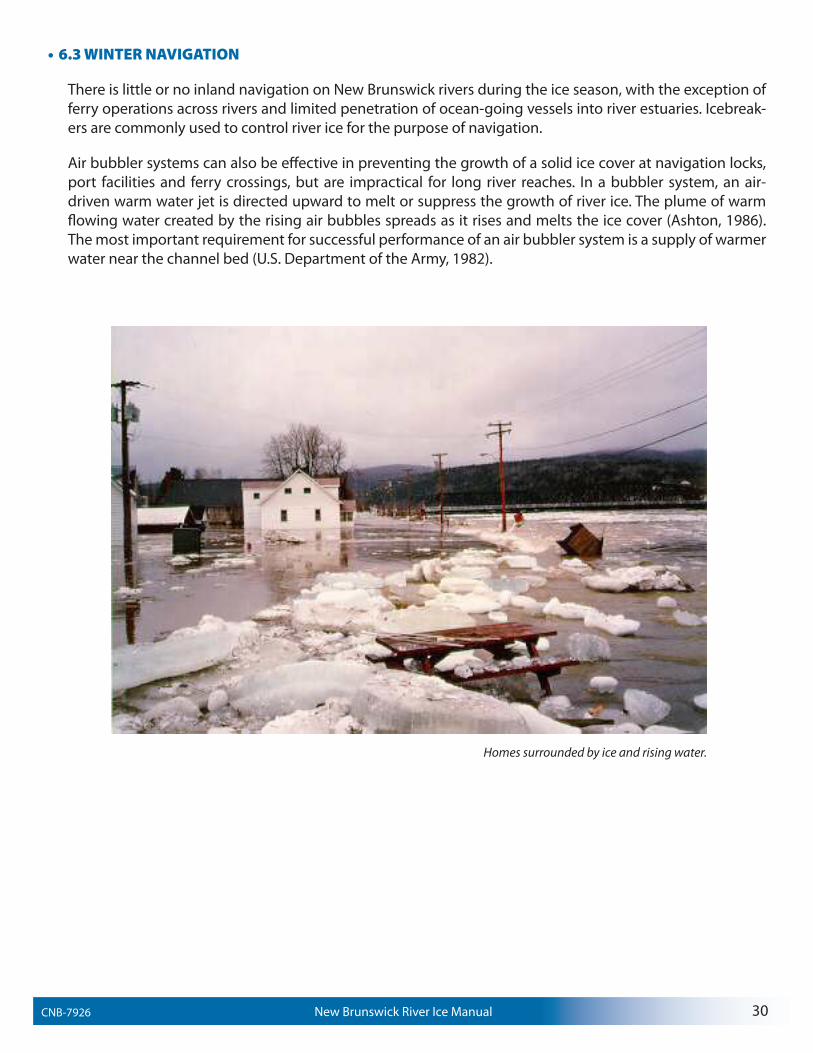
Homes surrounded by ice and rising water.
New Brunswick River Ice ManualCNB-7926 30
Acres International Ltd. (1980), “Behavior of Ice Covers Subject to Large Daily Flow and Level Fluctuations”, for the Canadian Electrical Association.
Ashton, G.D. (1983), “First Generation Model of Ice Deterioration”, Proc. of Conference on Frontiers in Hy-draulic Engineering, ASCE, New York, pp. 273-278.
Ashton, G.D. (1986), “River and Lake Ice Engineering”, Water Resources Publications, Littleton, Colorado, U.S.A.
Beltaos, S. and Krishnappan B.B. (1982), “Surges from Ice Jam Releases: A Case Study”, Canadian Journal of Civil Engineering, Vol. 9, No. 2, pp. 276-284.
Beltaos, S. (1983), “River Ice Jams: Theory, Case Studies and Applications”, Journal of Hydraulic Engineering, ASCE,Vol. 109, No. 10, pp. 1338-1359.
Beltaos, S. (1984), “Study of River Ice Breakup using Hydrometric Station Records”, Proceedings Workshop on the Hydraulics of River Ice, Fredericton, N.B., Canada, pp. 41-59.
Beltaos, S. (1989), “Initial Fracture and Breakup of River Ice Cover”, National Water Research Institute, Burl-ington, Ontario.
Bilello, M.A. (1980), “Maximum Thickness and Subsequent Decay of Lake, River and Fast Sea Ice in Canada and Alaska”, U.S. Army CRREL Report 80-6, Hanover, N.H.
Bulatov, S.N. (1972), “Computation of the Strength of the Melting Ice Cover of Rivers and Reservoirs and Forecasting of the Time of its Erosion”, Proc. Symposium on the Role of Snow and Ice in Hydrology, Banff, Canada, pp. 575-580.
Burrell, B.C.,Tang,P.W., Lane, R., and Beltaos, S. (1986), “Study of Ice Breakup in the Meduxnekeag River, N.B., Using Hydrometric Station Records”, Proc., Fourth Workshop on Hydraulics of River Ice, Montreal.
Calkins, D.J., Hulton, M.S. and Marlar, T.L. (1976), “Analysis of Potential Ice Jam Sites on the Connecticut River at Windsor, Vermont”, Report 76-31, Cold Regions Research and Engineering Laboratory, U.S. Army Corps of Engineers. Hanover, New Hampshire.
Cumming-Cockburn & Associates Ltd. (1986), “Ice Jams on Small Rivers, Remedial Measures and Monitor-ing”, Willowdale, Ontario.
Desplanque, C. and Bray, D.I. (1984), “Winter Regime in the Tidal Estuaries of the Northern Portion of the Bay of Fundy, N.B.”, Proceedings Workshop on Hydraulics of River Ice, Fredericton, N.B.
Devik,O. (1964), “Present Experience on Ice Problems Connected with the Utilization of Water Power in Nor-way”, Journal of the International Association of Hydraulic Research, vol. 2, no. 1, pp. 25-40.
Ferrick, M., Lemieux G., Mulherin N. and Dement W (1986), “Controlled River Ice Cover Breakup, Part 1. Hud-son River Field Experiements”, IAHR Symposium on Ice, Iowa City, Iowa, USA.
• REFERENCES
New Brunswick River Ice ManualCNB-7926 31
Henderson, F.M. and Gerard R. (1981), “Flood Waves Caused by Ice Jam Formation and Failure”, Proceedings IAHR Symposium on Ice, Quebec, Canada, Vol. 1, pp. 277-287.
Le Brun-Salonen, M.L. (1983), “Average Solid Ice Thickness in New Brunswick Rivers”, Report No. 2.03, Pre-pared under the New Employment Expansion Development Program, Fredericton, N.B.
Matousek, V. (1984), “Regularity of the Freezing-up of the Water Surface and Heat Exchange Between Water Body and Water Surface”, IAHR Ice Symposium Proceedings, Hamburg.
Michel, B. (1971), “Winter Regime of Rivers and Lakes”, U.S. Army CRREL Monograph 111-B1a, Hanover, N.H.
Michel, B. (1978), “Ice Mechanics”, Les Presses de l’Universite Laval, Quebec, Canada.
Newbury, R.W. (1968), “The Nelson River: A Study of Subarctic River Processes”, Ph.D. Thesis. John Hopkins University.
Pariset, E., Hausser R.and Gagnon A. (1966), “Formation of Ice Covers and Ice Jams in Rivers”, Journal of the Hydraulics Division, ASCE, Vol. 92 (HY6), pp. 1-24.
Perham R.E. (1984), “Ice Sheet Retention Structures”, Proceedings of the IAHR Ice Symposium, International Association for Hydraulic Research, Hamburg, West Germany. Vol. I, pp. 339-348.
Prowse, T.D., Anderson, J.C. and Smith R.L. (1986), “Discharge Measurement During River Ice Breakup”, Proc. 43rd Eastern Snow Conference, Hanover, New Hampshire, pp. 55-69.
Prowse, T.D. (1987), “Monograph on River Ice Jams, River Ice Processes”, Submitted to NRCC Working Group on River Ice Jams.
Shen, H.T., Foltyn E.P. and Daly S.F. (1984), “Forecasting Water Temperature Decline and Freeze-up in Rivers”, U.S. Army, CRREL Report 84-19, Hanover, N.H.
Sherstone, D.A. (1980), “Photogrammetric Measurement of Discharge in Ice-choked Northern Streams Dur-ing Spring Breakup” M.A. Thesis, Department of Geography, Carleton University, Ottawa, Canada.
Shulyakovskii, L.G. (1963), “Manual of Forecasting Ice Formation for Rivers and Inland Lakes”, Israel Program for Scientific Translations, Jerusalem.
Tang, P.W. and Davar K.S. (1984), “Forecasting the Initiation of Ice Breakup on the Nashwaak River, N.B.”, Proc. Workshop on Hydraulics of River Ice, Fredericton, N.B., pp. 65-93.
U.S. Department of the Army (1982), “Ice Engineering”, Engineers Manual, Corps of Engineers, Washington, D.C.
Watson, S.A. (1988), “Interpreting River Ice Breakup History from Photogrammetric Measurements of Ice Jams in the Liard-Mackenzie Rivers, Northwest Territories”, M.Sc. Thesis, Watershed Ecosystems Program, Trent University, Peterborough, Ontario.
updated September 30, 1996
New Brunswick River Ice ManualCNB-7926 32

Please direct inquiries regarding the information presented in this Manual and requests for additional cop-ies to Environmental Planning and Sciences Branch New Brunswick Department of Environment
P.O. Box 6000 Fredericton, N.B. E3B 5H1 (506) 457-4844
New Brunswick River Ice ManualCNB-7926 33