new iaq metrics to avoid being stupid, sick and...
TRANSCRIPT

New IAQ Metrics to Avoid Being Stupid, Sick and Tired
Ty Newell, PhD, PEBuild Equinox
Urbana, IL 61802www.buildequinox.com
SOLUTIONS FOR A HEALTHY, COMFORTABLE, AND SUSTAINABLE
LIFESTYLEMarch 8 & 9, 2017

Mission
Research & Education [1,2]
Develop solutions for healthy, comfortable and
sustainable lifestyles ….learning to live on our daily allowance of solar
energy.
How do we live on a piece of land without spoiling it?
Ben NewellTy Newell Alex Long
100% Solar Powered Business!
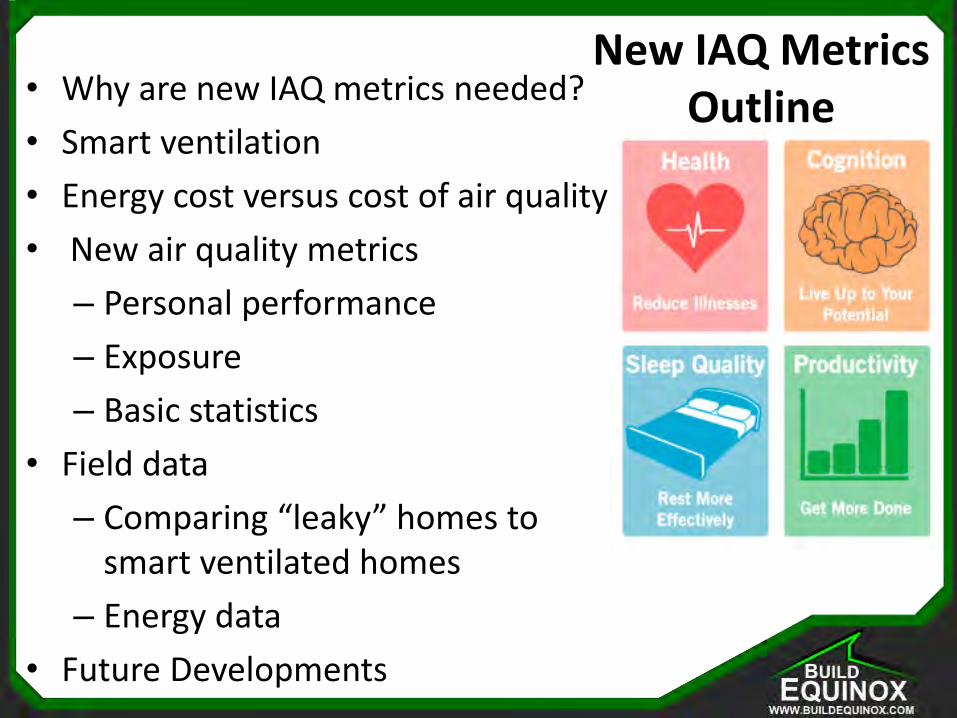
New IAQ MetricsOutline• Why are new IAQ metrics needed?
• Smart ventilation
• Energy cost versus cost of air quality
• New air quality metrics
– Personal performance
– Exposure
– Basic statistics
• Field data
– Comparing “leaky” homes to smart ventilated homes
– Energy data
• Future Developments

Our Homes and Buildings are making us
Stupid Sick
and, Tired
The cost of being stupid, sick and tired is staggering….

Health Cost
• Annual energy cost for 100M high performance residences = $160B/yr; $80B for people; ~$80B for climate– 4000kWh/person, 12cents/kWh, 325M people
• Annual cost of seasonal influenza and colds is $127B/yr– Influenza = $87B/y; Non-influenza viral infections = $40B/y [15,16]– Improved ventilation reduces contagion concentrations
• Asthma now afflicts nearly 10% of the population (~25% of households) for a total of $56B/yr total cost– Can we reduce asthma to 4% of populace where it used to be….or
even more?
• 10% Decrease of Human Cognition ~ $1.5T/year– $50K per human value; estimated cognition decrease due to carbon
dioxide concentration at typical ventilation levels (1100ppm, ~15-20cfm/person)

ASHRAE 62.2 is “Acceptable”…but• ASHRAE 62.2 is an agreed upon MINIMUM ventilation
standard. It is NOT an indoor air quality standard• Based on odor dissatisfaction threshold, not pollution
– 20% population dissatisfaction! [13]
• Does not account for higher pollution events/occupancy changes
• Nominal 20cfm/person will result in >1,000ppm CO2 concentration
• New studies show venting to 62.2 will result in significant reduction in health, cognition, and sleep quality [10, 11, 12, 14]
• Smart ventilation surpasses 62.2 standards that gets us to truly healthy and productive environments

“…..a critical shift in thinking from a goal of indoor environments that are acceptable to the occupants to those that are truly healthy and productive…” Bill Bahnfleth; 2013-2014 ASHRAE President
ASHRAE President Visits Equinox House

Great Progress Sealing Homes
0
0.2
0.4
0.6
0.8
1
1.2
1.4
1.6
1.8
2
1890 1910 1930 1950 1970 1990 2010 2030
No
rmal
ized
Lea
kage
(A
CH
)
Year
2010 data represents good construction (3ACH at 50Pa) and “Passive House” construction (0.6ACH at 50Pa)

But, Homes Become Unhealthy
00
2
4
6
8
10
12
1920 1940 1960 1980 2000 2020
Ind
oo
r V
OC
& P
arti
cula
te R
atio
(1
89
4 r
efer
ence
)
Year
Unventilated homes

0
2
4
6
8
10
12
0
2
4
6
8
10
12
1920 1930 1940 1950 1960 1970 1980 1990 2000 2010 2020
% A
sth
ma
Ind
oo
r V
OC
& P
arti
cula
te R
atio
Rat
io
(18
94
ref
eren
ce)
Year
Indoor Gen PM to 1894 Gen PM
% Asthma-CDC
% Asthma - NCHH
Why Has Asthma Increased?
-68.7% at home, ~115hours/week-18.2% other indoors, ~ 31hours/week-5.5% in vehicle, ~9hours/week-7.6% outdoors, ~13hours/week
1 week = 168 hours; 93% Indoors = 156hours
[3,4,5,6,7]
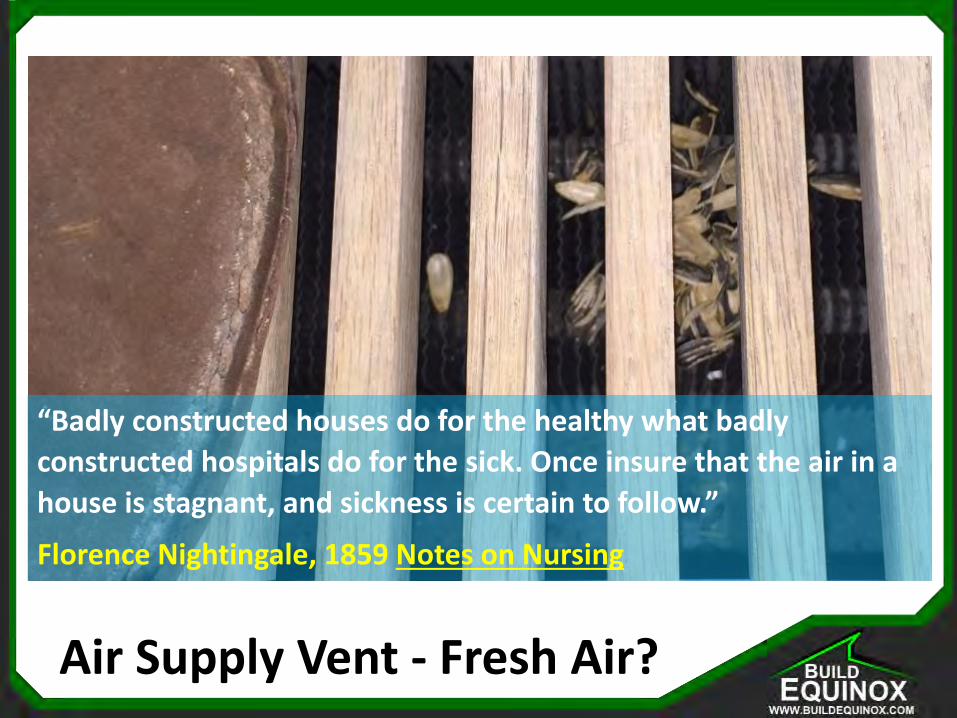
Air Supply Vent - Fresh Air?
“Badly constructed houses do for the healthy what badly
constructed hospitals do for the sick. Once insure that the air in a
house is stagnant, and sickness is certain to follow.”
Florence Nightingale, 1859 Notes on Nursing

Smart Ventilation Verification
“To have pure air, your house be so constructed as that the outer atmosphere shall find
its way with ease to every corner of it. House architects hardly ever consider this. The
object in building a house is to obtain the largest interest for the money, not to save
doctors' bills for the tenants.” Florence Nightingale, 1859 Notes on Nursing

Fresh AirPoor indoor air quality impacts:•Health•Human PerformanceHow do you know if your air stinks?
radon
CO2 VOC
H2O
Molds, etc
Exfiltration
GermsInfiltration
Filtered VentilationPesticides, dust, pollen

What is Smart Ventilation?“Smart” ventilators [9]
– Measure indoor air pollutants to ventilate when needed
– Sense when outdoor conditions are nicer than indoors, and maximize “free” conditioning
• Recharges home with fresh air
– Maintain high quality air throughout the entire house
– Achieve both increased energy efficiency and air quality above levels achieved with conventional ventilation systems
– Monitor and archive indoor air quality conditions over time
Smart ventilation systems allow us to define new sets of indoor air quality metrics providing us with information that quantifies our health and productivity

Conventional ventilator IAQ Trends
Insufficient ventilation when occupied
Excessive ventilation when unoccupied
Smart ventilator IAQ TrendsSmart ventilates when needed
With today’s sensors, automatic fresh air control improves our health and performance
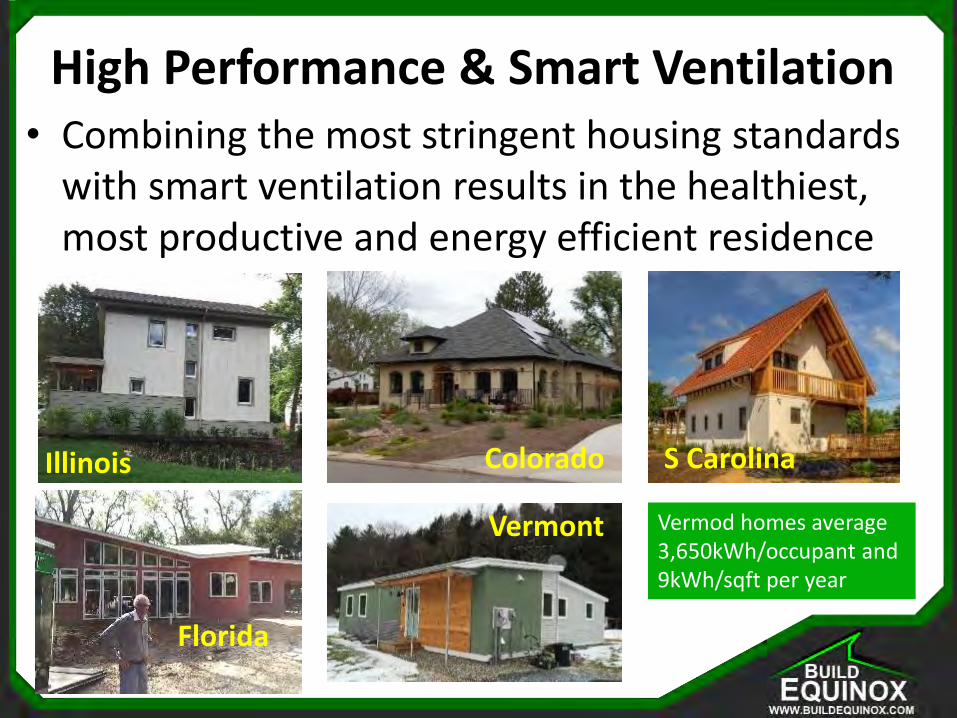
High Performance & Smart Ventilation• Combining the most stringent housing standards
with smart ventilation results in the healthiest, most productive and energy efficient residence
Illinois Colorado S Carolina
Florida
Vermont Vermod homes average 3,650kWh/occupant and 9kWh/sqft per year
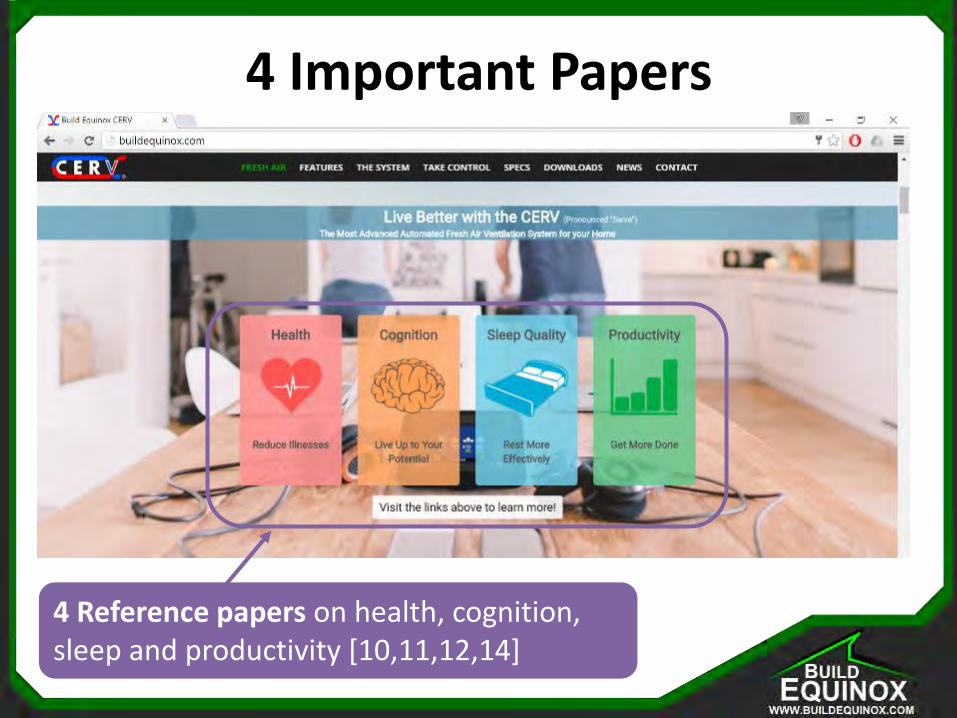
4 Important Papers
4 Reference papers on health, cognition, sleep and productivity [10,11,12,14]

4 Important Papers - Health

4 Important Papers - Cognition

4 Important Papers - Sleep

4 Important Papers - Productivity

Carbon Dioxide (CO2) Impairs Cognitive Performance
Strongly impairs: Initiative, Information Utilization, Breath of Approach, and Basic Strategy

Earnings vs Cognition PerformanceEarnings correlate with cognition performance (see “productivity” paper on BuildEquinox.com)
Cognition performance is directly linked to IAQ (see paper on “cognition” on BuildEquinox.com)
Doubling ASHRAE ventilation standards (20cfm to 40cfm per person) would increase productivity by $6500/person with an energy cost of less than $40/person
Doubled standard ventilation

Human Productivity $$ - Residential
ASHRAE 62.2 ventilation with nominal 20cfm per person of ventilation results in ~1100ppm CO2

New IAQ MetricsPersonal Metrics: Immediate impact of pollutants on cognition and productivity
Pollutant Exposure Time: Accumulation monitoring of pollutants
IAQ Statistics: Basic CO2 and VOC pollutant trends in your home

Your Performance
How do I compare with
others?
4 Reference papers on health, cognition, sleep and
productivity on Build Equinox Website
Defined as IAQ from 10pm to
7am“Sleep hangover”

Accumulated Health Impact
Energy efficient Smart Ventilation
Likely IAQ due to human occupancy from ASHRAE 62.2 ventilation standards
Range exceeding ASHRAE ventilation levels
Weekly trends over the past month

Pollutant Exposure
CO2 or VOC Exposure Units = 0 for <700ppm
CO2 or VOC Exposure Units = (X ppm – 400)/(1000-400)
0.0
0.5
1.0
1.5
2.0
2.5
3.0
3.5
0 500 1000 1500 2000 2500
CO
2 o
r V
OC
Exp
osu
re U
nit
s
Pollutant (ppm)
< 700ppm
= > 700ppm
Sum (Exposure Units X Time Increment) = Exposure-hours
Exposure units are defined:• Scale similar to “Olf”• 1person in a room with 10
liters/sec (~20cfm) is 1 Olf(Olfactory) ~ 1000ppm CO2
• Current research indicates less significant impact with CO2 less than 700ppm, but may change with future research
• VOC is a soup of chemicals, and current scale assumes similar impact to CO2
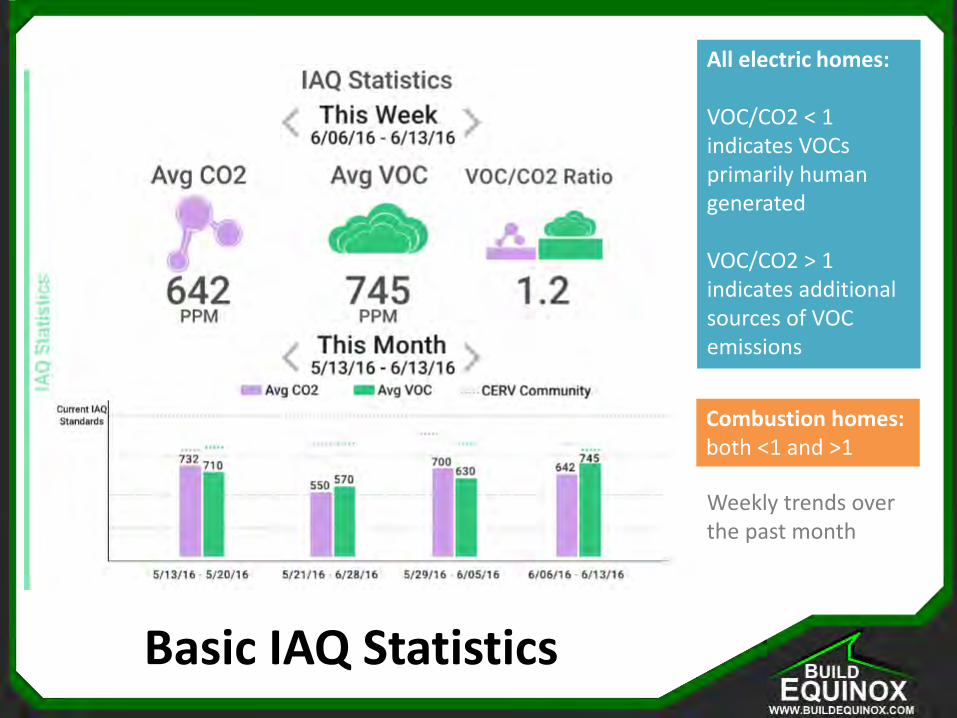
Basic IAQ Statistics
All electric homes:
VOC/CO2 < 1 indicates VOCs primarily human generated
VOC/CO2 > 1 indicates additional sources of VOC emissions
Weekly trends over the past month
Combustion homes: both <1 and >1

Watch Live IAQ Analytics
Online at: BuildEquinox.com

Conventional “Leaky” Homes
~2 week assessment period with Build Equinox IAQ monitoring technology (Black Box IAQ)
Various times of year
Homes in California, Colorado, Vermont, Minnesota, Illinois

Smart Ventilated Homes
~4 week assessment period (January 2016 data)
Winter vacation weekend
New Years!
January data (closed house)
Homes in Oregon, Vermont, Colorado, South Carolina, Illinois

14 Conventional “Leaky” Homes
~2 week assessment period with Build Equinox IAQ monitoring technology (Black Box IAQ)

10 Smart Ventilated (CERV) Homes
~4 week assessment period with CERV-ICE online monitoring (January 2016 data)
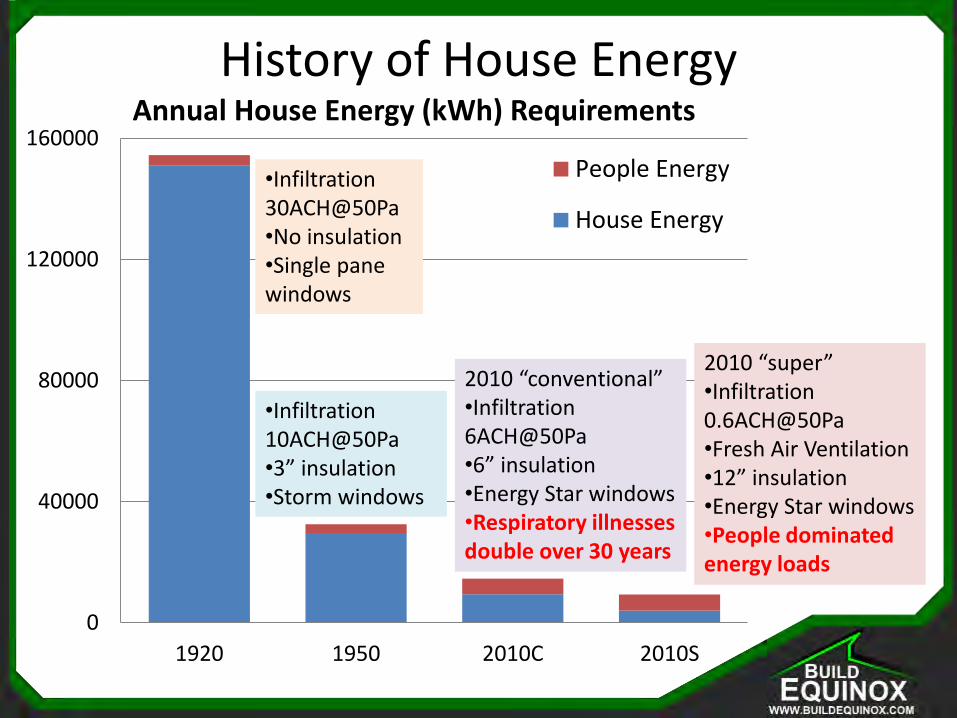
History of House Energy
0
40000
80000
120000
160000
1920 1950 2010C 2010S
Annual House Energy (kWh) Requirements
People Energy
House Energy
•Infiltration 30ACH@50Pa•No insulation•Single pane windows
•Infiltration 10ACH@50Pa•3” insulation•Storm windows
2010 “conventional”•Infiltration 6ACH@50Pa•6” insulation•Energy Star windows•Respiratory illnesses double over 30 years
2010 “super”•Infiltration 0.6ACH@50Pa•Fresh Air Ventilation•12” insulation•Energy Star windows•People dominated energy loads

February 4, 2016 Build Equinox and Efficiency Vermont
High Performance Homes vs Conventional
• Conventional homes use ~20,000 to 30,000kWh per year (~$2400-$3600 per year)
• High performance homes with smart ventilation use ~4000 to 10,000kWh per year (~$500-$1200 per year)

Upcoming Analytics - Particulate Management
0
20
40
60
80
100
120
140
160
0 0.1 0.2 0.3 0.4 0.5
Tota
l In
do
or
PM
(µ
g/m
^3
)
Air Exchange Rate (hr^-1)
House with PMo = 50µg/m^3 and Indoor Gen = 1.2µg/s
Unventilated House
40cfm ventilation
40cfm & recirculation Smart Vent

Upcoming Analytics - Reducing Epidemics
0.00
0.01
0.02
0.03
0.04
0.05
0.0
0.1
0.2
0.3
0.4
0.5
0.6
400 600 800 1000 1200 1400 1600 1800 2000
Reb
reat
hed
Fra
ctio
n
Pro
bab
ility
of
Infe
ctio
n
Room Carbon Dioxide Concentration (ppm)
Rebreathed Fraction & Probability of Infection (Rhinovirus) vs CO2
4 hour exposure
8 hour exposure
Rebreathed Fraction
ASHRAE Ventilation
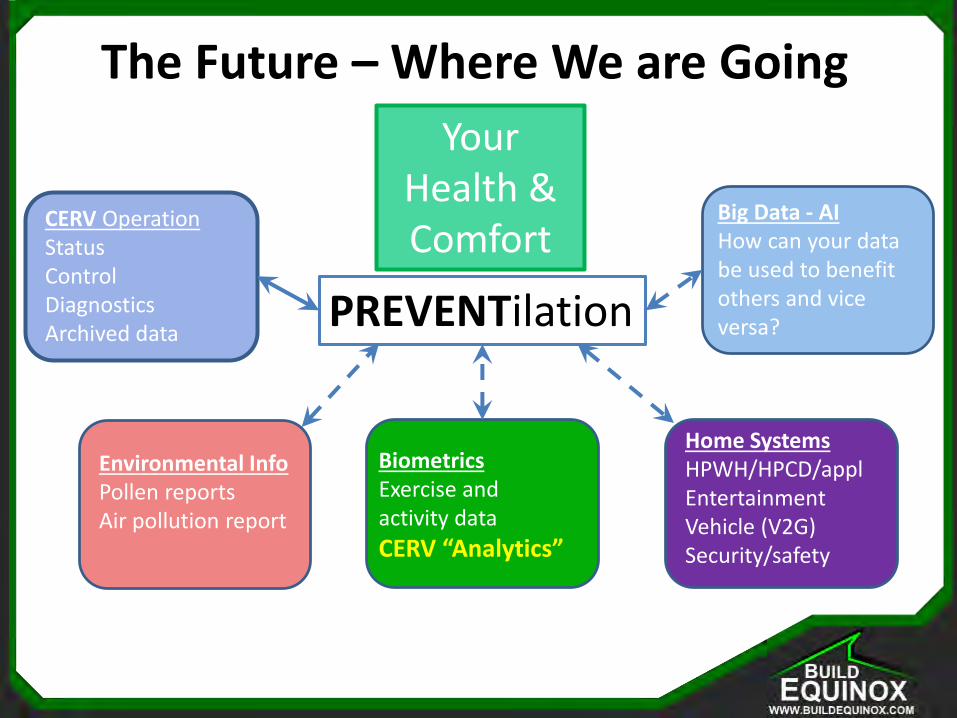
The Future – Where We are Going
PREVENTilation
CERV OperationStatusControlDiagnosticsArchived data
Your Health & Comfort
Environmental InfoPollen reportsAir pollution report
BiometricsExercise and activity data
CERV “Analytics”
Big Data - AIHow can your data be used to benefit others and vice versa?
Home SystemsHPWH/HPCD/applEntertainmentVehicle (V2G)Security/safety

Summary• The cost of poor IAQ at home and at work is much greater
than the cost of energy (and associated ventilation) in efficient homes and buildings
• New IAQ metrics will help building occupants understand estimated impact of IAQ on their health, cognition and sleep
• Monitoring of accumulated pollutants will provide information for understanding future health effects of our indoor environments
• IAQ metrics provide a quantitative basis for comparing quality of construction, selection of materials, and occupant activities
• Basic Research is needed to continue defining interaction of pollutants on our health and productivity
THANK YOU!

References:[1] T.Newell and B.Newell, 12 article NZEB design series, ASHRAE Journal, Sept 2010 – Aug 2011, available at BuildEquinox.com/publications
[2] T.Newell, “13 CERV® Homes in Vermont; Keeping Occupants Healthy, Comfortable and Energy Efficient”; Efficiency Vermont Report, June 2016, available at BuildEquinox.com/publications
[3] P. Ole Fanger, “What is IAQ?”; Indoor Air 2006; 16: 328–334, Technical University of Denmark
[4] M.Sherman, D Dickerhoff, “Air Tightness of U.S. Dwellings”, ASHRAE Transactions, Jan 1998
[5] L.J.Akimbami, “The State of Childhood Asthma; 1980-2005”, Advance Data from Vital and Health Statistics, No 381, CDC, US Dept of Health and Human Services, Dec 2006
[6] D.E. Jacobs, J.Wilson, S.L. Dixon, J. Smith, and A. Evens, “The Relationship of Housing and Population Health: A 30-Year Retrospective Analysis”, Environmental Health Perspectives, Vol 117, No 4, April 2009
[7] N.E.Klepeis, W.C. Nelson, W.R. Ott, J.P. Robinson, A.M. Tsang, P.Switzer, J.V. Behar, S.C. Hern, W.H. Engelmann, “The National Human Activity Pattern Survey (NHAPS): a resource for assessing exposure to environmental pollutants”, J Exposure Analysis and Environmental Epidemiology, Vol 11, pp231-252, 2001
[8] A.F. Rudd, J.W. Lstiburek, K. Ueno, “Residential Dehumidification Systems Research for Hot Humid Climates
September 1, 2001—December 30, 2003”, NREL Report, NREL/SR-550-36643, Feb 2005
[9] I. Walker, M. Sherman, B. Less,“Houses are Dumb Without Smart Ventilation”, LBNL paper LBNL-6747E, May, 2014
[10] Joseph G. Allen, Piers MacNaughton, Usha Satish, Suresh Santanam, Jose Vallarino, and John D. Spengler; “Associations of Cognitive Function Scores with Carbon Dioxide, Ventilation, and Volatile Organic Compound Exposures in Office Workers: A Controlled Exposure Study of Green and Conventional Office Environments”;Env Health Perspectives; Oct 2015
[11] DK Milton, PM Glencross, and MD Walters; “Risk of Sick Leave with Outdoor Air Supply Rates, Humidification, and Occupants Complaints”; Indoor Air; Vol 10, pp212-221; 2000
[12] P. Strøm-Tejsen, D. Zukowska, P. Wargocki, D. P. Wyon; “The effects of bedroom air quality on sleep and next-day performance”, Indoor Air; doi:10.1111/ina.12254; 2015
[13] Seichi Konzo; The Quiet Indoor Revolution; Small Homes Council-Building Research Council, University of Illinois, Urbana, IL 1992
[14] Piers MacNaughton, James Pegues, Usha Satish, Suresh Santanam, John Spengler, and Joseph Allen; “Economic, Environmental and Health Implications of Enhanced Ventilation in Office Buildings”; Int. J. Environ. Res. Public Health 2015, 12, 14709-14722; doi:10.3390/ijerph121114709[15] N-A. Molinari, I.R. Ortega-Sanchez, M/L. Messonnier, W.W. Thompson, P.M. Wortley, E. Weintraub, C.B. Bridges, The Annual Impact of Seasonal Influenza in the US: Measuring Disease Burden and Costs”, Vaccine, 25, pp5086-5096, 2007[16] A. Mark Fendrick, Arnold S. Monto, Brian Nightengale, Matthew Sarnes, “The Economic Burden of Non–Influenza-Related Viral Respiratory Tract Infection in the United States”, Arch Intern Med, 163, pp487-494, 2003