new jersey state investment council annual report · 2013-06-10 · nj state investment council...
TRANSCRIPT

New Jersey
State Investment Council
Annual Report for Fiscal and Calendar Year
2010

Table of Contents
OVERVIEW Page The State Investment Council ……………………………………………. 3 The Division of Investment ……………………………………………….. 4
Statutory Authority and Investment Parameters ………………. 4 Asset Allocations …………………………………………………. 5 Benchmarks ………………………………………………………. 6
Net Assets under Management …………………………………………. 8 FINANCIAL SECTION
10-Year Financial Summary ……………………………………………. 9 Benefits of Diversification ……………………….………………………. 10 Summary of Results for Fiscal Year 2010 ……………………………. 12
Total Pension Fund Performance …………………………….. 12 Total Public Equities ……………………………………………. 12 Total Public Fixed Income ……………………………………... 14 Alternative Investments ………………………………………… 15 Cash Management Fund ………………………………………. 17 Costs of Management ………………………………………….. 18
Summary of Results for Calendar Year 2010 ………………………… 20 OPERATIONS SECTION
Investment Program …………………………………………………….. 21 Council Regulations and Structure ……………………………. 21
Legislative and Regulatory Update…………………………………… .. 21 Regulatory Update ………………………...…………………… 21
Prohibited Investments …………..……………………………. 22 Northern Ireland Report ………………………………………... 22
Strengthening the Operation …………………………………………… 22 INDEPENDENT AUDITORS’ REPORT ……………………………………….. 1
Management’s Discussion and Analysis ……………………………... 3 BASIC FINANCIAL STATEMENTS
Statements of Net Assets ………………………………………………. 7 Statements of Changes in Net Assets ………………………………… 8 Notes to Financial Statements …………………………………………. 9
SUPPLEMENTAL SCHEDULES
Schedule 1: Combining Schedule of Net Assets …………………….. 32 Schedule 2: Combining Schedule of Changes in Net Assets ………. 33 Schedule 3: Portfolio of Investments – Common Fund A …………… 34 Schedule 4: Portfolio of Investments – Common Fund B …………… 58 Schedule 5: Portfolio of Investments – Common Fund D …………… 102 Schedule 6: Portfolio of Investments – Common Fund D
--Open Foreign Forward Currency Contracts ……………. 125 Schedule 7: Portfolio of Investments – Common Fund E …………… 126 Schedule 8: Portfolio of Investments – Other ………………………… 130

NJ State Investment Council Annual Report FY2010
3
The Division of Investment Timothy Walsh, Director
The State Investment Council
The State Investment Council was created by the New Jersey Legislature in 1950 to formulate policies governing the investment of funds by the Director of the Division of Investment, and to consult with the Director with respect to the work of the Division. The Council has initiated meetings, generally on a monthly basis, to discuss major investment policy issues, review Pension Fund performance and accept comments from members of the public. Other investment programs and returns are reviewed annually or as needed. The 13-member Council represents various constituent groups in the state: Seven members are appointed by the Governor for staggered five-year terms. Two members are appointed by the Governor for three-year terms from nominees submitted by the New Jersey State AFL-CIO and the New Jersey Education Association. Four members are elected to the Council for three-year terms by certain employee pension systems. Council meetings are open to the public. Agendas, meeting times and locations can be viewed at the Division’s website: www.state.nj.us/treasury/doinvest
1Appointed by the Governor from nominees submitted
jointly by the President of the Senate and Speaker of the Assembly. Vacated seat on January 27, 2011 2Appointed by the Governor, subject to the advice and
consent of the Senate. 3 Appointed by the Governor from nominees submitted
by the agencies noted.
Council Members Robert Grady
2, Chair
Managing Director, Cheyenne Capital Fund Chairman, Governor’s Council of Economic Advisors Nicholas Caprio, Vice Chair Elected by Public Employees’ Retirement System Marty Barrett Elected by Police & Firemen’s Pension Fund Board Brendan Thomas Byrne, Jr.
2
President Byrne Asset Management Andrew Michael Greaney Elected by State Police Retirement System Guy Haselmann
2
Director, U.S. Rate Sales & Strategy Scotia Capital (USA) James C. Kellogg
2
President J.C. Kellogg Foundation Richard Klockner Elected by Teachers’ Pension and Annuity Fund Orin Kramer
1
General Partner Boston Provident, L.P. James P. Marketti
3
Nominated by New Jersey State AFL-CIO Timothy McGuckin
3
Nominated by The New Jersey Education Association
Jeffrey Oram2
Director, National Office and Industrial Properties Group Marcus & Millichap
As of December 2010

NJ State Investment Council Annual Report FY2010
4
The New Jersey Division of Investment
The Division of Investment, under the supervision of the State Investment Council, is the 11th largest public pension fund manager in the United States and the 16th largest among public and corporate pension fund managers.* The Pension Fund supports the retirement plans of approximately 800,000 active and retired employees in seven public pension systems: the Consolidated Police & Firemen’s Pension Fund, the Judicial Retirement System, the Police & Firemen’s Retirement System, the Prison Officers Pension Fund, the Public Employees’ Retirement System, the State Police Retirement System and the Teachers’ Pension & Annuity Fund (collectively referred to in this report as the “Pension Fund”). The net asset value of the Pension Fund was $66.8 billion as of June 30, 2010, an increase of approximately $3.9 billion from June 30, 2009. In addition, approximately $7 billion was paid to plan beneficiaries during the fiscal year. The Division also manages the State of New Jersey Cash Management Fund, Supplemental Annuity Collective Trust (a 403b plan), a portion of the NJBEST Fund (a 529 college savings plan) and several funds under the New Jersey State Employees Deferred Compensation Program (a 457 plan). The Division ranks first in the percent of investments actively managed among 92 major U.S. public funds for fiscal year 2010, and third in the percent of assets managed internally.^ The Division has been nominated as Large Public Fund of the Year for Money Management Letter’s 10
th Annual Public Pension Fund Awards. The Division won the award for Large
Public Fund of the Year in 2008.
Statutory Authority The Division of Investment was created in 1950 by the New Jersey Legislature (P.L. 1950, c.270) to centralize all functions relating to the purchase, sale or exchange of securities for the State’s diverse funds under experienced and professional management. The statute also established a State Investment Council to formulate investment procedures and policies to be followed by the Director of the Division. The statute vests investment authority in the Director of the Division, who is appointed by the State Treasurer from candidates nominated by the Council. New and amended regulations adopted by the Council after public comment are filed with the Office of Administrative Law and reported in the New Jersey Register.
Investment Parameters All investments by the Director must conform to the heightened “prudent person” standard set by the New Jersey Legislature (P.L. 1997, c.26). This standard requires the Director “to manage and invest the portfolio solely in the interests of the beneficiaries of the portfolio and for the exclusive purpose of providing financial benefits to the beneficiaries of the portfolio.”
* Measured by assets as of 9/30/10. Reported by Pensions and Investments, February 7, 2011. ^ RVKuhns & Associates, Inc. “Public Funds Universe Analysis Period Ending June 30, 2010”
NJ State Investment Council Annual Report FY2010
5
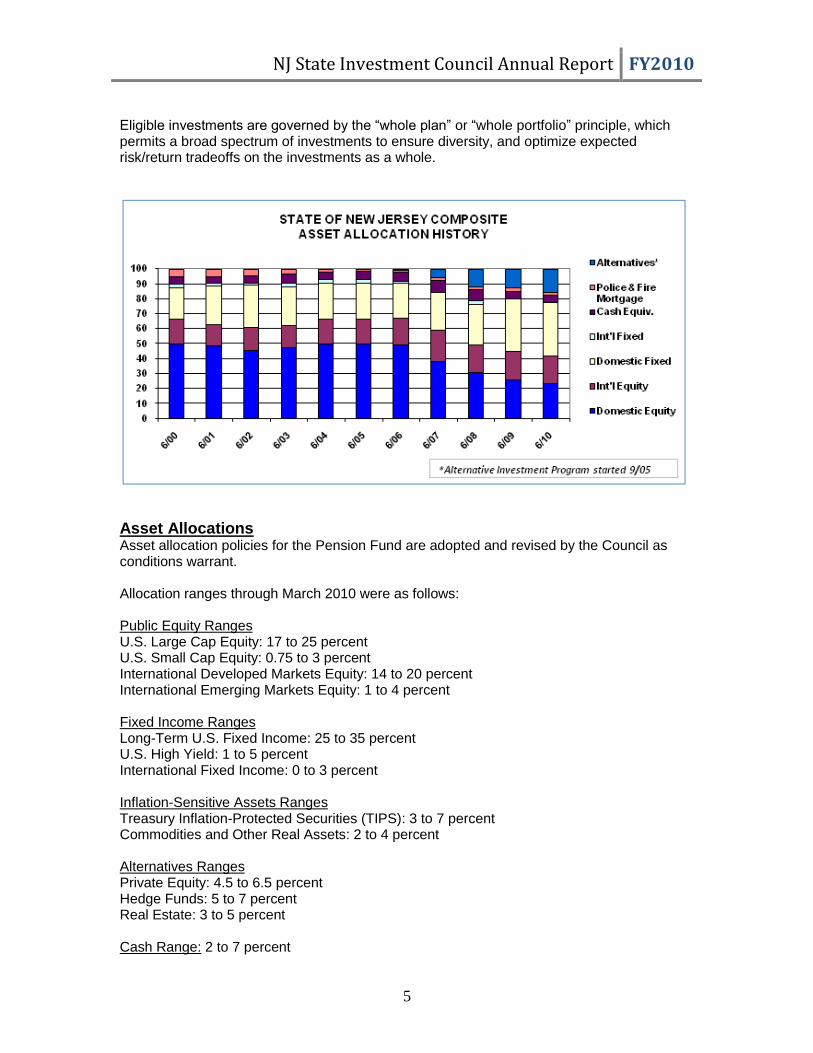
Eligible investments are governed by the “whole plan” or “whole portfolio” principle, which permits a broad spectrum of investments to ensure diversity, and optimize expected risk/return tradeoffs on the investments as a whole.
Asset Allocations Asset allocation policies for the Pension Fund are adopted and revised by the Council as conditions warrant. Allocation ranges through March 2010 were as follows: Public Equity Ranges U.S. Large Cap Equity: 17 to 25 percent U.S. Small Cap Equity: 0.75 to 3 percent International Developed Markets Equity: 14 to 20 percent International Emerging Markets Equity: 1 to 4 percent Fixed Income Ranges Long-Term U.S. Fixed Income: 25 to 35 percent U.S. High Yield: 1 to 5 percent International Fixed Income: 0 to 3 percent Inflation-Sensitive Assets Ranges Treasury Inflation-Protected Securities (TIPS): 3 to 7 percent Commodities and Other Real Assets: 2 to 4 percent Alternatives Ranges Private Equity: 4.5 to 6.5 percent Hedge Funds: 5 to 7 percent Real Estate: 3 to 5 percent Cash Range: 2 to 7 percent

NJ State Investment Council Annual Report FY2010
6
In March 2010 the asset allocation targets were revised and were as follows as of June 30, 2010: Public Equity Targets U.S. Large Cap Equity: 18 percent U.S. Small Cap Equity: 1 percent International Developed Markets Equity: 15 percent International Emerging Markets Equity: 5 percent Fixed Income Targets Long-Term U.S. Fixed Income: 30.25 percent U.S. High Yield: 3.50 percent Inflation-Sensitive Assets Targets Treasury Inflation-Protected Securities (TIPS): 5 percent Commodities and Other Real Assets: 4 percent Alternatives Targets Private Equity: 5.50 percent Hedge Funds: 6.75 percent Real Estate: 3 percent Cash Target: 3 percent
Benchmarks The Division of Investment measures its investment performance against standard and customized industry indices. Benchmarks for fiscal and calendar year 2010 were: Public Equity Benchmarks: U.S. Large Cap/Small Cap Equity: The Standard & Poor’s Composite 1500 Index International Market Equity: Custom International Market Index
This is a custom benchmark which is calculated by the Division and excludes those names deemed ineligible for investment under the State’s Sudan and Iran Divestment laws.*
Fixed Income Benchmarks: Long-Term U.S. Fixed Income, excluding Treasury Inflation-Protected Securities (TIPS) and
High Yield Securities: The Barclays Long Government/Credit Index. U.S. High-Yield: Barclays High Yield Index Inflation-Sensitive Assets Benchmarks: Commodities and Other Real Assets: The Dow Jones UBS Commodity Index Treasury Inflation-Protected Securities (TIPS): The Barclays TIPS Index Alternatives Benchmarks: Private Equity: Cambridge Associates U.S. Private Equity Index and S&P 1500 + 300bps Index

NJ State Investment Council Annual Report FY2010
7
Hedge Funds: The HFRI Fund of Funds Composite Index Real Estate: The National Council of Real Estate Investment Fiduciaries Property Index Cash Benchmark: 90-day Treasury Bill performance *International Market and Emerging Market Equities are managed in a single portfolio, which may contain International Fixed Income assets. The overall benchmark for these three asset classes is the Custom International Market Index. International Emerging Market Equity assets and International Fixed Income assets within the international portfolio are performance tested against specific indices.

NJ State Investment Council Annual Report FY2010
8
Net Assets under Management
Net Assets in Millions 6/30/10 6/30/09
Pension Fund $66,824 $62,923
The Pension Fund contains pension assets contributed by participants and by state and local employers for currently working and/or retired participants in seven statewide retirement plans. (Totals may not add due to
rounding)
Teachers’ Pension & Annuity Fund $25,670 $24,798 Public Employees’ Retirement System $21,794 $20,298 Police & Firemen’s Retirement System $17,440 $15,995 State Police Retirement System $1,639 $1,549 Judicial Retirement System $262 $261 Consolidated Police & Firemen’s Pension Fund $8 $10 Prison Officers’ Pension Fund $11 $12
State of New Jersey Cash Management Fund* $13,127 $14,563
This fund contains the cash balances of state government funds and “other-than-state” government entities (counties, municipalities, school districts and the agencies or authorities created by any of these).
Supplemental Annuity Collective Trust $137 $124
This fund contains voluntary investments by employees for retirement income separate from, and in addition to, their basic pension plan.
Trustees for the Support of Public Schools Fund $128 $125
This fund contains reserves required to support the rating of school bonds issued for the maintenance and support of the state’s public schools.
NJBEST Fund The Division manages some of the contributions of New Jersey residents for the state’s tax-advantaged 529 college savings program. On June 30, 2010, the Division-managed portion of this fund had a net asset value of $389.9 million ($359.5 million on 6/30/09). Deferred Compensation Program The Division manages some of the assets contributed by employees into the New Jersey State Employees Deferred Compensation Program. Prudential Retirement, a business of New Jersey-based Prudential Financial, serves as the third-party administrator for this plan. Funds managed by the Division include contributions to the Bond (Fixed Income) Fund, Equity Fund, Money Market (Cash Management) Fund and Small Capitalization Equity Fund. On June 30, 2010, these funds had a combined market value of $546 million ($552 million on 6/30/09). Police & Firemen’s Mortgages The Division manages a mortgage fund for the Police & Firemen’s Retirement System; the fund had a value of $1.3 billion on June 30, 2010, compared with $1.4 billion on June 30, 2009. Although these assets are included in the total Pension Fund value of $66.8 billion, they are not discussed separately in the summary of Pension Fund assets or included in the performance of the fund. *The total for the Cash Management Fund includes $3.3 billion in 2010 ($3.4 billion on 6/30/09) held for and included in the totals for the Pension Fund, the Supplemental Annuity Collective Trust, Trustees for the Support of Public Schools Fund, the NJBEST Fund and Deferred Compensation Program.

NJ State Investment Council Annual Report FY2010
9
10-Year Financial Summary
Pension Fund Net Assets and Total Rates of Return
for Fiscal Years ending June 301
$ Billion
Return
2010 66.8 13.4%
2009 62.9 -15.5%
2008 78.6 -2.7%
2007 82.5 17.1%
2006 73.1 9.8%
5-year annualized return (Through 6/30/10)
3.7%
2005 69.8 8.8%
2004 67.8 14.2%
2003 62.6 3.3%
2002 63.3 -8.6%
2001 72.2 -10.4%
10-year annualized return (Through 6/30/10)
2.4%
1 Returns exclude Police & Fire Mortgages
Gross Pension Payments to Pension Plan beneficiaries by fiscal year: (Billions)
2010 $7.0
2009 $6.6
2008 $6.1
2007 $5.6
2006 $5.2
2005 $4.8
2004 $4.4
2003 $4.1
2002 $3.6
2001 $3.2

NJ State Investment Council Annual Report FY2010
10
Benefits of Diversification Since 1990, the Division has pursued a policy of increased diversification which has improved the risk-adjusted returns of the Pension Fund. The following exhibits demonstrate the power of diversification. The first chart compares the growth of one dollar invested according the Pension Fund’s asset allocation to the growth of one dollar invested in single asset portfolios. The Pension Fund’s asset allocation has resulted in a higher return over the twenty year period shown. The second chart shows the unpredictability of asset class returns on an annual basis. The total return of the Fund since 1990 has been 377%, meaning that a dollar invested in the Pension Fund in 1990 would be worth $4.77 today, versus $4.39 if it has been invested in an all-equity portfolio embodied by the S&P 500, $3.86 if it had all been invested in government bonds, and $2.16 if it had all been invested in U.S. Treasury bills. Over that period of 20 years, the Pension Fund has returned 8.12% per year, outpacing the 7.67% annual return of an all-equity portfolio, the 6.99% annual return of an all-government bond portfolio, and the 3.95% annual return of an all-U.S.Treasury bill portfolio, while evincing a much lower standard deviation in returns, thus implying far less risk, than the all-equity portfolio.
Growth of $1 for 20 Years
Jul 90 - Jun 10
0.0
0.5
1.0
1.5
2.0
2.5
3.0
3.5
4.0
4.5
5.0
5.5
6.0
6.5
7.0
Grow
th of $1
Jun 90 Jun 91 Jun 92 Jun 93 Jun 94 Jun 95 Jun 96 Jun 97 Jun 98 Jun 99 Jun 00 Jun 01 Jun 02 Jun 03 Jun 04 Jun 05 Jun 06 Jun 07 Jun 08 Jun 09 Jun 10
$3.86
$2.16
Growth of $1 for 20 Year
$4.77
$4.39
Total Pension Plan BC Government
Merrill Lynch 3-month T-Bill S&P 500 Index

NJ State Investment Council Annual Report FY2010
11
Benefits of Diversification (continued) Annual Asset Class Returns:

NJ State Investment Council Annual Report FY2010
12
Summary of Results for Fiscal Year 2010 Total Pension Fund Performance Net Assets June 30, 2010: $66.8 billion Net Assets June 30, 2009: $62.9 billion Actual rate of return: 13.4 Benchmark (Weighted composite of indexed returns in each asset class): 13.5 percent Despite increased global equity and credit values due to stronger financial markets, fiscal year 2010 ended on a somewhat volatile note. New Jersey’s Pension Fund ended the fiscal year up 13.4 percent, approximating the performance of the benchmark, which was positive 13.5 percent. Net assets of the Pension Fund increased $3.9 billion during fiscal year 2010 despite $7 billion in gross benefit payments to retirees and beneficiaries in the various pension plans.
Total Public Equities
U.S. Equities: Investments at fair value June 30, 2010: $15.5 billion Investments at fair value June 30, 2009: $16.3 billion Annual Return: 15.8 percent Annual Return Benchmark*: 15.6 percent The U.S. Equities Portfolio outperformed the overall equity market by 0.2 percent in fiscal 2010 as measured against the Standard & Poor’s 1500 Composite Index. Stock selection within the energy, healthcare, telecom and industrial sectors were major factors contributing to the Division’s outperformance. The Division kept a pro-cyclical portfolio profile throughout fiscal 2010, lessening underexposure to financial stocks while maintaining a positive view toward technology and industrial stocks. This strategy allowed the portfolio to participate in the strong equity markets for the year. The Domestic Equity Portfolio is broadly diversified by economic sector and includes approximately 1,000 publicly traded stocks. While exposure to most sectors and industries in comparable to that of the overall market benchmark, the portfolio ended the fiscal year most overweight in the basic materials group and, despite significant purchases during the fiscal year, most underweight in the financial group.
15.8%
-7.3%
1.2%
15.6%
-9.4%
-0.5%
-15.0% -10.0% -5.0% 0.0% 5.0% 10.0% 15.0% 20.0%
1 Year
3 Year
5 Years
U.S. Equity 1, 3, and 5 Year Annualized Returns
S&P 1500 U.S. Equity
*S&P 1500 Composite Index

NJ State Investment Council Annual Report FY2010
13
International Equities: Investments at fair value June 30, 2010: $12.6 billion Investments at fair value June 30, 2009: $12.0 billion Annual Return: 6.7 percent Annual Return Benchmark*: 8.3 percent The International Equity Portfolio underperformed by 1.6 percent in fiscal 2010 as measured against the Custom International Market Index. For the year ending June 30, 2010, Emerging Markets as measured by the MSCI Emerging Market Index returned 23.5%, significantly outperforming the Developed Markets, as measured by the MSCI EAFE Index which returned 5.92%. The International Equity portfolio is broadly diversified by geography and sector. It includes approximately 800 publicly traded non-U.S. stocks. While the portfolio's geographic and sector exposures are broadly comparable to those of the index, in some cases the portfolio contains underweights and overweights to certain countries and sectors. These over and underweights will change over time. For example, the International Equity Portfolio was overweight in Emerging Markets relative to the benchmark for much of the year, but concluded the year underweight in Emerging Markets. At fiscal year end, the portfolio was also underweight the United Kingdom and overweight Japan. From a sector perspective, the portfolio was overweight in the Health Care, Information Technology, Telecommunication Services and Industrials sectors and underweight in the Financial, Materials, Energy, and Utilities sectors at fiscal year end.
*Custom international developed market index. This is a custom benchmark which is calculated by the Division and excludes those names deemed ineligible for investment under the State’s Sudan and Iran Divestment laws.

NJ State Investment Council Annual Report FY2010
14
Total Public Fixed Income U.S. High Grade Fixed Income Investments at fair value June 30, 2010: $21.8 billion Investments at fair value June 30, 2009: $20.1 billion Annual Return: 15.7 percent Annual Return Benchmark*: 16.5 percent For much of fiscal year 2010 long-term U.S. Treasury yields rose, peaking in March 2010. The yields then dropped significantly with fears of a “double-dip” recession and rumors that the U.S. Federal Reserve was going to initiate a second round of quantitative easing. Spread products during fiscal year 2010 saw a dramatic narrowing. The Division continued to overweight spread products in fiscal year 2010, but as spreads narrowed the Division started to slowly reduce its overweight position. Investments in Treasury Inflation-Protected Securities (TIPS) were positive for the fiscal year as inflation worries resurfaced. Approximately 16 percent of the portfolio was in longer-maturity US TIPS, which are not part of the Barclays Long Government/Credit Index. The fiscal year performance was 9.9 percent compared to the Barclays TIPS Index of 9.5 percent. As of June 30, 2010 the fund’s duration was 10.36 years, compared with 10.16 years at the end of fiscal year 2009.
* Barclays Long Government/Credit Index
15.7%
10.2%
6.8%
16.5%
9.4%
5.6%
0.0% 5.0% 10.0% 15.0% 20.0%
1 Year
3 Year
5 Years
Barclays Long Govt/Credit U.S. Fixed Income
U.S. Fixed Income 1, 3, and 5 Year Annualized Returns

NJ State Investment Council Annual Report FY2010
15
U.S. High Yield Investments at fair value June 30, 2010: $1.6 billion Investments at fair value June 30, 2009: $1.5 billion
Annual Return: 30.8 percent Annual Return Benchmark*: 26.8 percent
In fiscal year 2010 spread products narrowed significantly. In the high yield sector, the investment with the lowest credit ratings performed the best. For example, the spread on five year CCC-rated securities narrowed versus five year U.S. Treasury Notes by 59 percent, whereas B-rated security spreads narrowed by 42 percent.
The Division’s high yield investments, which began in fiscal year 2009, beat their benchmark by 4 percent in fiscal 2010. The out-performance of the portfolio was primarily due to investments concentrated in bank loans. Investment in corporate high yield bonds underperformed the index since the holdings are weighted more toward higher quality and more liquid investments reflecting our conservative approach to this sector. *Barclays High Yield Index
Alternative Investments
Private Equity: Net assets June 30, 2010: $4.2 billion Net assets June 30, 2009: $3.0 billion Net return on investment: 17.1 percent Annual Return Benchmark: 19.0 percent (S&P 1500 + 300bps Index) Annual Return Benchmark: 19.2 percent (Cambridge Associates U.S. Private Equity Index)
Hedge Funds: Net assets June 30, 2010: $3.4 billion Net assets June 30, 2009: $2.7 billion Net return on investment: 9.8 percent Annual Return Benchmark: 4.7 percent (The HFRI Fund of Funds Composite Index)
Real Estate: Net assets June 30, 2010: $1.9 billion Net assets June 30, 2009: $1.6 billion Net return on investment: -5.5 percent Annual Return Benchmark: -1.5 percent (The National Council of Real Estate Investment Fiduciaries Property Index)
NJ State Investment Council Annual Report FY2010
16
Commodities: Net assets June 30, 2010: $997 million Net assets June 30, 2009: $640 million Net return on investment: 4.8 percent Annual Return Benchmark: 2.8 percent (Dow Jones UBS Commodity Total Return Index) The gradual reduction of public equity holdings in favor of alternative investment classes has benefitted overall pension fund performance since the inception of the program. Private equity had a sharp recovery in fiscal year 2010, returning slightly below the Standard and Poor’s 1500 Index plus 300 basis point benchmark of 19 percent, and above the Division’s U.S. Equities portfolio of 15.8 percent. Hedge fund portfolio return was 9.8% while the hedge fund benchmark (HFRI Fund of Funds Index) returned 4.7%. Hedge fund portfolio return was below the S&P 1500 return of 15.6%. Hedge funds strive to keep pace or slightly underperform in the rising market and decline less than the market in declining markets. The result is equity-like returns with lower volatility than the public equity return volatility. Real estate investments declined more than its benchmark because of substantial drops in commercial real estate values, reduced financing availability for the sector, and the use of leverage by various investment managers. However, with the real estate market nearing its trough, expectations for recovery in 2011 remain strong. Additionally, as transaction volume and commercial real estate prices rise, the opportunity for increased value in a majority of property sectors is favorable. Commodity performance was strong on a relative basis due to an overweight position in crude oil and precious metals, both of which made substantial gains during the fiscal year, as well as returns generated by prudent rolling of futures contracts, which produced positive roll yield relative to the benchmark. The Pension Fund’s Alternative investment program is considered a developing portfolio. At the close of the fiscal year, the portfolio had $16.1 billion in approved commitments to alternatives, of which $10.8 billion had been invested. Of the total commitments, $8.5 billion was committed to private equity (including domestic and international buyout funds, venture capital, distressed and mezzanine debt funds); $4.0 billion to real estate (including core, value added and opportunistic); and $3.6 billion to hedge funds, both direct and fund of funds.

NJ State Investment Council Annual Report FY2010
17
Cash Management Fund Net assets June 30, 2010: $13.1 billion Net assets June 30, 2009: $14.6 billion Actual Return on Investment: 0.45 percent Annual Return Benchmark*: 0.15 percent The Cash Management Fund outperformed its 90-day Treasury bill benchmark during the 2010 fiscal year, earning a net investment income of $57 million even as Federal Reserve policies aimed at helping the overall economy for short-term interest rates remained at historically low levels in the same period. Despite the strong return, net assets in the Cash Management Fund declined by $1.4 billion for the fiscal year, primarily due to increased withdrawals from the Pension Fund for benefit payments. Fund holdings in the fiscal year remained consistent with changes in investment policy responding to the unprecedented disruptions in the markets for short-term securities. In particular, the percentage of Fund assets invested in securities issued by the U.S. Government and various U.S. Government Agencies was kept at significantly high levels, $10.8 billion at June 30, 2010 compared to $10.9 billion at June 30, 2009. Holdings in corporate bonds with maturities of less than two years increased, from $204.0 million to $207.0 million during fiscal year 2010, as market dislocations continued to drive corporate fixed income instruments to equity-like returns. The average daily rate of return for State participants was 0.45 percent, compared with 1.55 percent for the 2009 fiscal year, primarily the result of federal interest rate interventions in the marketplace. The average daily rate for “Other-Than-State” participants (counties, municipalities, school districts and the agencies or authorities created by any of these) was 0.34 percent versus 1.40 percent for the 2009 fiscal year. More than 195 state funds and more than 2,200 other-than-state entities invested in the fund in fiscal year 2010. The average maturity of the portfolio at fiscal yearend was 108 days, compared with 74 days in 2009, reflecting a decision by the Division to maintain its investment in slightly longer-term Treasury securities during fiscal 2010 to maintain rates against rate declines in the market.
*90-Day U.S. Treasury Bills
US Treasury Bills64.6%
Us Treasury Notes16.8%
Commercial Paper9.3%
Certificates of Deposit
3.4%
Government of Canada
2.9%
Industrial Bonds1.6%
Government Agency
1.1%
Canadian Province0.4%
Cash Management Fund 6-30-10

NJ State Investment Council Annual Report FY2010
18
Costs of Management Costs for managing all funds: 20 cents per each $100 under management The Division of Investment operates at among the lowest costs of all public pension funds, largely because approximately 80 percent of the Pension Fund’s $66.8 billion assets are actively managed by in-house staff. The Division relies on external fund managers only for investment in alternatives; it also utilizes the expertise of external investment advisors in the specialty areas of emerging market international equity investments and high-yield fixed income. The Division paid $127 million in fees and expenses in fiscal year 2010 to the managers of its alternative investments. These investments totaled $10.5 billion on June 30, 2010. Annual fees in this sector therefore represent 1.2% of the June 30 market value. The Division paid an additional $13.5 million to the advisors of its emerging market equity and high-yield fixed income portfolios in fiscal year 2010. Investments in these portfolios totaled $2.1 billion on June 30, 2010. Annual fees in this sector thus represent 0.6% of the June 30 market value. Operating expenses for staff compensation, overhead and equipment were $10.0 million for the fiscal year, and represent about 6.4 percent of total costs. Remaining expenses include fees for consulting services, custodial banking and legal services, as shown in the chart below. In total, costs to manage the portfolios totaled 0.2% of assets under management for the fiscal year.
Total Management Cost (millions) For Fiscal Year Ended June 30, 2010
Alternative Fees
and Expenses,
$127.0
High Yield and
Emerging Market
Advisor, $13.5
Agency
Operations, $10.0
Consulting Fees, $3.6
Legal Fees, $0.7Custody Fees,
$0.7

NJ State Investment Council Annual Report FY2010
19
Total Management Costs (millions) For fiscal year ended June 30, 2010
Costs (in millions):
Alternatives Fees & Expenses $127.0 High-Yield and Emerging Market Advisor Fees
13.5
Agency Operations 10.0
Consulting Fees 3.6
Legal Fees 0.7
Custodial Banking Fees
0.7
Total all costs $155.5 millions Total net assets under management $77.8 billions Costs as a percentage of assets under management
0.2%
Cost per each $100 under management
$0.20 cents
Commissions The Division incurred broker/dealer commission costs totaling $35.1 million for fiscal 2010 from equity security trades related to the $77.8 billion in assets under Division management. The brokerage commission total includes $4.3 million in “soft dollar” commissions used to procure systems and services critical to the Division’s trading and research. The Division purchases and sells certain investments with no involvement by a broker/dealer, including commercial paper, certificates of deposit, foreign currency transactions and investments in alternative investment funds by transacting directly with the issuer, partnership or fund; as a result, no commissions are paid.

NJ State Investment Council Annual Report FY2010
20
Summary of Results for Calendar Year 2010
Pension Fund Performance (Unaudited)
Total Market Value on December 31, 2010: $70.8 billion Total Market Value on December 31, 2009: $68.1 billion Annual Return as of December 31, 2009: 11.8 percent Total Fund Council Benchmark: 11.2 percent Despite the volatility experienced by the markets in 2010, the New Jersey Pension Fund ended calendar year 2010 at $70.8 billion. The Pension Fund returned an estimated 11.8 percent for the calendar year, versus 11.2 percent for the Council benchmark. The slight over-performance is attributable to the Fund’s overweighting in equities and outperformance on domestic stock selection. Within public equities, the U.S. equities portfolio returned 17.5 percent, versus a benchmark return of 16.4 percent for the calendar year. The international equity portfolio returned 8.9 for the calendar year, underperforming the custom benchmark’s 10.4% return. The fixed income portfolio also slightly outperformed the benchmark, returning 10.3 percent versus the benchmark’s 10.2 percent return. With respect to inflation-sensitive assets, commodities underperformed the benchmark, returning 13.0 percent versus the benchmark’s 16.8 percent return. Treasury Inflation-Protected Securities (TIPS) returned 8.5 percent. The duration of Public Fixed Income holdings, excluding TIPS and high yield investments, was 10.7 years as of December 2010. Alternative investments performed relatively well during calendar year 2010. The Private Equity portfolio returned 5.0 percent, Hedge Funds returned 7.4 percent and Real Estate returned 10.0 percent. This performance is based on the most recent market value reported and is reported on a lag. Cash assets within the Pension Fund ended the calendar year with an estimated return of 0.38 percent, against the Council benchmark of 0.13 percent.

NJ State Investment Council Annual Report FY2010
21
Investment Program
Council Regulations and Structure In addition to investment guidelines established by law, the State Investment Council is authorized by statute to establish investment policies consistent with economic and fiscal trends and in accordance with its fiduciary responsibility and the authority provided under P.L. 1950, c.270.
All proposed regulations and amendments are filed upon approval of the Council with the Office of Administrative Law for publication in The New Jersey Register, followed by a 60-day public comment period. Following the public comment period, each proposal is returned to the Council for adoption, along with any comments received. The adopted regulations of the State Investment Council are published in the New Jersey Administrative Code (N.J.A.C. 17:16), and are available for viewing on the Division’s website at: http://www.lexisnexis.com/njoal/
The Council underwent the following organizational changes between June 30, 2009 and December 31, 2010 (fiscal and calendar years 2010):
Welcomed four new members through gubernatorial appointments – Robert Grady, Guy Haselmann, Jeffrey Oram and Brendan Thomas Byrne, Jr.
Lost five gubernatorial appointments – Erika Irish Brown, W. Montgomery Cerf, Jose R. Claxton, Susan Crotty, and Dr. Douglas Love.
Lost four retirement system representatives – Jonathan Berg (Public Employees’ Retirement System), James Clemente (Teachers’ Pension & Annuity Fund), Mark Kandrac (Police & Firemen’s Retirement System) and Major Karl Kleeberg (State Police Retirement System).
Welcomed four new members elected by the members of their respective retirement systems:
o Nicholas Caprio for Public Employees Retirement System; o Richard Klockner for Teachers Pension and Annuity Fund; o Marty Barrett for Police and Firemen’s Retirement System; and o Andrew Michael Greaney for State Police Retirement System.
Elected Robert Grady as Council Chair and Nicholas Caprio as Council Vice Chair for a one year term, commencing September 2010.
Legislative and Regulatory Update
Regulatory Update On October 19, 2009, N.J.A.C. 17:16-17 governing investments in state and municipal general obligations, was amended allow investment in debt obligations of any state or any municipal or political subdivision thereof that are backed by the full faith and credit of the obligor (i.e., general obligation bonds); previously these investments were limited to the state of New Jersey or any subdivision or municipality in the State.
On December 21, 2009, N.J.A.C. 17:16-12, 16 and 40 governing investments in corporate obligations, international corporate obligations and non-convertible preferred stock, respectively, were amended to allow twenty percent of the high yield allocation to be invested in debt obligations or non-convertible preferred stock of companies that do not meet the required minimum market capitalization of $100 million. This change enabled investment in high yield debt and non-convertible preferred stock that trades at attractive levels even if the company’s securities are not publicly traded or the market capitalization falls below the $100 million threshold.

NJ State Investment Council Annual Report FY2010
22
On June 21, 2010, N.J.A.C. 17:16-2 governing the engagement of external investment managers was repealed as a result of an Appellate Court decision barring the use of external investment managers.
The State Investment Council has proposed regulations to increase limitations on individual alternative investment asset classes and increase the aggregate ceiling for alternative investments from 28% to 38%. This will provide the Division with greater flexibility and provide opportunities for further portfolio diversification. The proposed amendments for real estate, private equity and absolute return fund investments will allow for limitations of nine percent, twelve percent and fifteen percent, respectively from the current individual caps of seven percent. The 60 day comment period ended on these proposed regulations ended on February 4, 2011.
Prohibited Investments The Division maintains a list of international companies ineligible for New Jersey investment under two state laws: a Sudan divestiture law adopted in 2005, and an Iran divestiture law adopted in 2007. The Division utilizes an independent research firm to assist it in complying with the provisions of the statutes.
While the Division divested of its international holdings with equity ties to Sudan, it had until January 4, 2011 to divest of its holdings in violation of the Iran statute.
Divestitures pose three primary fiscal challenges to pension funds: they require the identification and sale of holdings on a timetable that doesn’t consider market conditions; they impact risk and return for the entire pension fund; and they permanently reduce the investment universe available to the pension fund. Together, the Sudan and Iran divestiture laws reduce New Jersey’s investment universe by almost 9 percent in developed markets and 9 percent in emerging markets, relative to its respective benchmarks. (Sudan law: P.L. 2005, c.162; Iran law P.L. 2007, c.250)
Northern Ireland Report The Division has been required since 1987 to report annually to the Legislature on whether the US companies and their subsidiaries in which it is invested and which do business in Northern Ireland are adhering to the “McBride Principles,” a name given to a body of employment laws aimed at reducing religious unrest in that country. (P.L. 1987, c.177)
Strengthening the Operation The Division transitioned from two custodians to a new, single custodian, State Street, for the Pension Fund effective July 1, 2010, consistent with the recommendations contained in Governor Christie’s Transition Report from January 2010. This transition will allow the Division to streamline operational and reporting capabilities, while adopting best industry practices. This was a difficult and herculean task championed by a small task force and is the first steppingstone in modernizing the technology of the division.
The Division’s Alternative Investment staff has been engaged in discussions with investment managers to reduce management fees. Negotiations have been completed with several “Fund-of-Fund” managers and all have agreed to substantial fee reductions, which will save the Pension Fund nearly $40 million in fees over the next five years. The Division is still in discussions with all remaining Fund-of-Fund managers to leverage our current relationships with an eye toward achieving similar levels of cost savings and mandate flexibility.
The Division has been actively working to reduce the amount of cash held in the Pension Fund. During 2010, the Division has reduced its average cash position by over 50 percent.

NJ State Investment Council Annual Report FY2010
23
State of New Jersey Department of Treasury
Division of Investment Mailing Address: P.O. Box 290 Trenton, NJ 08625-0290 Offices: 50 W. State St., 9th Floor, Trenton, NJ 08608
General Telephone: (609) 292-5106 Website: www.state.nj.us/treasury/doinvest
Cover Photo Credit
Leutze, Emanuel Gottlieb (1816-1868)
Washington Crossing the Delaware. 1851. Oil on canvas, 149 x 255 in. (378.5 x
647.7 cm).
Gift of John Stewart Kennedy, 1897 (97.34).
Location : The Metropolitan Museum of Art, New York, NY, U.S.A.
Photo Credit : Image copyright © The Metropolitan Museum of Art / Art Resource, NY
Image Reference : ART321272