new mexico agricultural - usda · agribusinesses, policy makers, ... 4 2003 new mexico agricultural...
TRANSCRIPT


The New Mexico Department of Agriculture (NMDA) and the New Mexico Statistical Office(NMSO) of the National Agricultural Statistics Service (NASS), United States Department ofAgriculture (USDA) are pleased to present this year’s edition of the New Mexico AgriculturalStatistics Bulletin 2003.
Please note the change in the Bulletin’s design when listing county data. In years past the countieswere listed alphabetically. This year the counties are listed alphabetically within regions of the state- northwest (District 10), northeast (District 30), southwest (District 70) and southeast (District 90).County Profiles have been added beginning on page 64. Other changes included are data revisionsdue to the completion of the 2002 Census of Agriculture.
New Mexico cash receipts increased to $2.14 billion in 2003, up 8.6 percent from 2002. Thelivestock increase of 14 percent from 2002 outweighed the 5.2 percent decrease in crops due to thedrought conditions during 2003.
Thanks to each of you who help us provide this important information to agricultural producers,agribusinesses, policy makers, and the public so sound business decisions can be based upon factrather than speculation and rumor. A few minutes spent completing a questionnaire goes a long waytoward leveling the playing field for New Mexico’s agricultural producers.
The data in this publication and more, including 2004 data, can be found on the internet athttp://www.nass.usda.gov/. The data from the 2002 Census of Agriculture and for many of thefollow-on studies are also available on the internet. Data from the 1992 and 1997 Census ofAgriculture can be found on our website as well. You may obtain free subscriptions to many reportsenabling them to be delivered to your e-mail box as soon as they are released. Just click on“Publications” and then on the Subscribe button.
The Internet has become a key source for information and statistics about United States agriculture,but finding the correct address can sometimes be frustrating. If you need assistance in finding factsconcerning agriculture phone the NMSO at 1-800-530-8810 or send an e-mail to [email protected]. We look forward to hearing from you.
Sincerely,
I. Miley Gonzalez, Ph. D. Dwaine C. NelsonSecretary of Agriculture DirectorNew Mexico Department of Agriculture New Mexico Agricultural Statistics

2003 New Mexico Agricultural Statistics
TABLE OF CONTENTS
INTRODUCTION/ACKNOWLEDGMENT
New Mexico Agricultural Statistics Service
National Association of State Departments of Agriculture
GENERAL FIELD CROPS
Release Dates for Statistical Publications . . . . . . . . . . . . . . . 3 Crop Summary . . . . . . . . . . . . . . . . . . . . . . . . . . . . . . . . . 42
Number of Farms and Land in Farms . . . . . . . . . . . . . . . . . . 4 Acreage and Value of Principal Field Crops . . . . . . . . . . 43
Usual Planting and Harvesting Dates . . . . . . . . . . . . . . . . . . 5 Wheat . . . . . . . . . . . . . . . . . . . . . . . . . . . . . . . . . . . . . . . . . 44
Climate . . . . . . . . . . . . . . . . . . . . . . . . . . . . . . . . . . . . . . . . . . 6 Wheat by County . . . . . . . . . . . . . . . . . . . . . . . . . . . . . . 45
Fertilizer Shipped Into New Mexico . . . . . . . . . . . . . . . . . . . 7 All Hay . . . . . . . . . . . . . . . . . . . . . . . . . . . . . . . . . . . . . . . . 46
Commercial Feed Sold in New Mexico . . . . . . . . . . . . . . . . 8 All Hay by County . . . . . . . . . . . . . . . . . . . . . . . . . . . . 46
PRICES AND INCOME Alfalfa and Other Hay . . . . . . . . . . . . . . . . . . . . . . . . . . . . 47
Farm Sector Economic Analysis . . . . . . . . . . . . . . . . . . . . . . 9 Alfalfa Hay by County . . . . . . . . . . . . . . . . . . . . . . . . . 47
Balance Sheet of Farm Sector . . . . . . . . . . . . . . . . . . . . . . . 11 Sorghum . . . . . . . . . . . . . . . . . . . . . . . . . . . . . . . . . . . . . . . 48
Income From Farming . . . . . . . . . . . . . . . . . . . . . . . . . . . . . 12 Sorghum by County . . . . . . . . . . . . . . . . . . . . . . . . . . . 49
Cash Receipts by Commodity . . . . . . . . . . . . . . . . . . . . . . . 13 Corn . . . . . . . . . . . . . . . . . . . . . . . . . . . . . . . . . . . . . . . . . . 50
Cash Receipts by Commodity and by County . . . . . . . . . . 15 Corn Silage by County . . . . . . . . . . . . . . . . . . . . . . . . . 50
Government Payments . . . . . . . . . . . . . . . . . . . . . . . . . . . . 24 Corn by County . . . . . . . . . . . . . . . . . . . . . . . . . . . . . . . 51
Prices Received for Hay . . . . . . . . . . . . . . . . . . . . . . . . . . . 26 Upland Cotton . . . . . . . . . . . . . . . . . . . . . . . . . . . . . . . . . . 52
Prices Received for Cattle . . . . . . . . . . . . . . . . . . . . . . . . . . 27 Upland Cotton by County . . . . . . . . . . . . . . . . . . . . . . . 52
LIVESTOCK Cottonseed . . . . . . . . . . . . . . . . . . . . . . . . . . . . . . . . . . . 53
Livestock Summary . . . . . . . . . . . . . . . . . . . . . . . . . . . . . . . . 28 American-Pima Cotton . . . . . . . . . . . . . . . . . . . . . . . . . . . 54
Cattle and Calves . . . . . . . . . . . . . . . . . . . . . . . . . . . . . . . . . . 29 American-Pima Cotton by County . . . . . . . . . . . . . . . . 54
Number and Value . . . . . . . . . . . . . . . . . . . . . . . . . . . . . . 29 Potatoes . . . . . . . . . . . . . . . . . . . . . . . . . . . . . . . . . . . . . . . 55
Number by Class . . . . . . . . . . . . . . . . . . . . . . . . . . . . . . . 30 Dry Beans . . . . . . . . . . . . . . . . . . . . . . . . . . . . . . . . . . . . . 55
Commercial Slaughter . . . . . . . . . . . . . . . . . . . . . . . . . . . 30 Peanuts . . . . . . . . . . . . . . . . . . . . . . . . . . . . . . . . . . . . . . . . 56
Inventory, Supply, and Disposition . . . . . . . . . . . . . . . . 31 Peanuts by County . . . . . . . . . . . . . . . . . . . . . . . . . . . . . 56
Production, Price, and Income . . . . . . . . . . . . . . . . . . . . 31
Number by County . . . . . . . . . . . . . . . . . . . . . . . . . . . . . 32 FRUITS, NUTS, AND VEGETABLES
Number on Feed by County . . . . . . . . . . . . . . . . . . . . . . 33 Apples . . . . . . . . . . . . . . . . . . . . . . . . . . . . . . . . . . . . . . . . 57
Range and Pasture Feed Condition . . . . . . . . . . . . . . . . . 33 Chile
Milk Production Acreage and Production by County . . . . . . . . . . . . . . . 58
Milk Production and Income . . . . . . . . . . . . . . . . . . . . . . 34 Acreage, Yield, and Production by County . . . . . . . . . 59
Prices Received for Milk . . . . . . . . . . . . . . . . . . . . . . . . . 34 Onions
Milk Production by County . . . . . . . . . . . . . . . . . . . . . . . 35 Monthly Prices Received . . . . . . . . . . . . . . . . . . . . . . . 60
Monthly Milk Production . . . . . . . . . . . . . . . . . . . . . . . . 35 Acreage, Yield, Production, and Value . . . . . . . . . . . . . 61
Sheep and Lambs Onions by County . . . . . . . . . . . . . . . . . . . . . . . . . . . . . 61
Number and Value . . . . . . . . . . . . . . . . . . . . . . . . . . . . . . 36 Pecans . . . . . . . . . . . . . . . . . . . . . . . . . . . . . . . . . . . . . . . . 62
Commercial Slaughter . . . . . . . . . . . . . . . . . . . . . . . . . . . 36 Pecans by County . . . . . . . . . . . . . . . . . . . . . . . . . . . . . 62
Number by County . . . . . . . . . . . . . . . . . . . . . . . . . . . . . 37 Miscellaneous Crops and Livestock . . . . . . . . . . . . . . . . . 63
Inventory, Supply, and Disposition . . . . . . . . . . . . . . . . 38
Production, Price, and Income . . . . . . . . . . . . . . . . . . . . 38 COUNTY PROFILES . . . . . . . . . . . . . . . . . . . . . . . . . . . . 64
Number by Class . . . . . . . . . . . . . . . . . . . . . . . . . . . . . . 39
Wool Production and Value . . . . . . . . . . . . . . . . . . . . . . 39 NMDA DIRECTORY . . . . . . . . . . . . . . . . . . . . (back cover)
Prices Received for Wool . . . . . . . . . . . . . . . . . . . . . . . . 39
Hogs and Pigs
Inventory, Supply, and Disposition . . . . . . . . . . . . . . . . 40
Production, Price, and Income . . . . . . . . . . . . . . . . . . . . 40
Angora Goats
Inventory . . . . . . . . . . . . . . . . . . . . . . . . . . . . . . . . . . . . . 41
Mohair Production, Price, and Value . . . . . . . . . . . . . . . 41

2 2003 New Mexico Agricultural Statistics
NEW MEXICO STATISTICAL OFFICE2003
Issued Cooperatively By United States Department of Agriculture New Mexico National Agricultural Statistics Service Department of Agriculture Ron Bosecker I. Miley Gonzalez, Ph.D. Administrator Director/Secretary
FRONT COVER
New Mexico Value-Added Industries
United States Department of Agriculture New Mexico Statistical Office
P.O. Box 1809Las Cruces, New Mexico 88004
(505) 522-6023
(800) 530-8810
www.nass.usda.gov/[email protected]
Dwaine C. Nelson, DirectorJames G. Hand, Deputy Director
Agricultural Statisticians: Longino Bustillos Janet Shea Rita Alirez
Data Processing: Judy Lawrence
Support: Cissi Dzera Jose Franco Lisa Gillis Steven Kowalik Dolores Sanchez
Special thanks to the National Association of State Departments of Agriculture (NASDA) telephone and field enumerators who collect
‘timely, accurate, and useful statistics’ through personal interviews and telephone calls. (Supervisors in bold)
TELEPHONE ENUMERATORS
Las Cruces, NM
Patsy Herrera Grace Dobson Lauri Martinez Stella Rodriguez Debbie Vasquez Lupe Vasquez
FIELD ENUMERATORS
Wesley Shafer, Grady, NM Mildred Moyers, Clovis, NM
Senith Block, House, NM David Kyea, Clayton, NM
Finley Corkern, Albuquerque, NM
Lois Jurney, Artesia, NM
Lori Lansford, Las Cruces, NM Randall Ahlstrom, Silver City, NM Alice McNiel, Tularosa, NM

New MexicoAgriculturalStatisticsService
NEW MEXICO AGRICULTURAL STATISTICS SERVICE Reports Issued During the Year
GENERAL REPORTS FREQUENCY APPROXIMATE DATE OF PUBLICATION1/
Crop Weather Weekly March - November (Mondays)
AgUpdate Weekly Mondays
Includes: Weekly Crop Weather, Monthly: Milk Production, Cattle on Feed, and Agricultural Prices Received
New Mexico Agricultural Statistics Annual December
2002 Census of Agriculture Every 5 Years June 2004 www.nass.usda.gov/census
REPORT DATES FOR CROPS2/
Crop Production Semi-Annual January and August (mid)
Grain Stocks Quarterly January (mid) March - June - September (late)
Prospective Plantings Annual March (late)
Cotton Ginnings Annual May (mid)
Chile Annual June (early)
Pecans - Production and Disposition Annual July (early)
Crop Yields Monthly August - December (mid)
Pecans - Forecast Bi-Annual October - December (early)
REPORT DATES FOR LIVESTOCK, DAIRY, AND LIVESTOCK PRODUCTS2/
Cattle Semi-Annual January (late) July (mid)
Sheep and Goats Semi-Annual January (late) July (mid)
Wool and Mohair Production Annual January (late)
Honey Annual February (late)
Meat Animal Production, Disposition, and Income Annual April (late)
Milk Production, Disposition, and Income Annual April (late)
ECONOMIC AND MISCELLANEOUS 2/
Farm Labor Quarterly February - May - August - November (mid)
Number of Farms and Land in Farms Annual February (late)
Farm Production Expenditures Annual July (mid)
Agricultural Land Values/Cash Rents Annual August (early)
COUNTY ESTIMATES (available at www.usda.gov/nass LINK - QUICK STATS)
Cattle and Calves May (late)
Milk Production May (late)
Sheep and Lambs May (late)
Alfalfa June (late)
Chile June (early)
Corn May (late)
Cotton June (mid)
Onions June (mid)
Peanuts May (mid)
Pecans June (mid)
Sorghum June (mid)
Wheat June (mid)
Reports are available on the USDA website 1/ www.usda.gov/nass on the approximate date of publication.
Summaries of these reports are also printed in the Weekly AgUpdate.2/
3 2003 New Mexico Agricultural Statistics

4 2003 New Mexico Agricultural Statistics
Farm Numbers and Land in Farms1/
Year
Number ofFarms in
Operation 4/
Land in all Farms
Number ofCattle
Operations
Number ofMilk Cow
Operations2/
Number ofSheep
Operations
Number of Hog
Operations
1,000 Farms Million Acres ---------------------------Number ---------------------------3/
1975 12.0 47.0 8,500 1,800 1,200 1,700
1980 13.5 46.8 8,500 1,800 1,500 2,100
1985 14.0 45.0 9,000 1,400 1,500 1,200
1990 13.5 44.5 9,000 1,200 1,200 900
1995 15.0 45.0 9,000 900 1,000 500
1999 18.0 45.1 8,700 500 900 400
2000 18.0 44.9 8,400 500 900 400
2001 17.8 44.8 8,200 500 850 400
2002 17.7 44.8 8,200 500 800 350
2003 17.5 44.7 8,100 450 800 350
Includes farms and ranches, excludes BLM and Forest Service land leased to farmers and ranchers on a per head basis.1/
Included in number of cattle operations.2/
Includes farms and ranches having one or more head of species on hand at any time during the year.3/
Beginning in 1999 individual Native American farms on reservations/pueblos are included. 4/
Census Number of Farms by County1/
Number of Farms Number of Farms
District/County 1992 1997 2002 District/County 1992 1997 2002
District 10 District 30 (cont)
Bernalillo 504 468 618 Roosevelt 734 738 804
Cibola 184 166 155 San Miguel 661 643 565
Los Alamos 4 4 6 Torrance 485 473 461
McKinley 213 224 150 Union 460 448 419
Rio Arriba 964 940 988 District 70
Sandoval 345 353 347 Catron 236 217 206
San Juan 641 666 808 Grant 297 286 272
Santa Fe 313 336 460 Hidalgo 147 146 144
Taos 440 422 453 Luna 185 192 171
Valencia 575 639 718 Sierra 207 180 223
District 30 Socorro 413 395 388
Colfax 303 322 284 District 90
Curry 610 655 677 Chaves 592 562 604
De Baca 191 191 188 Doña Ana 1,271 1,290 1691
Guadalupe 271 236 208 Eddy 495 467 510
Harding 181 172 129 Lea 544 528 554
Mora 398 398 410 Lincoln 338 337 343
Quay 586 583 594 Otero 477 417 622
STATE 14,279 14,094 15,170
County level data does not include individual Native American farms on reservations/pueblos.1/

5 2003 New Mexico Agricultural Statistics
Planting and Harvesting Dates
Usual Planting Dates Usual Harvesting Dates Begin Most Active End
Crop Jan Feb Mar Apr May Jun Jul Aug Sep Oct Nov Dec
Field Crops
Corn, Grain
Cotton, All
Hay, Alfalfa
Peanuts for Nuts
Sorghum, Grain
Wheat, Winter
Vegetables
Chile Peppers
Green
Red
Onions
Grano
Sweet Spanish
Potatoes
Summer
Fall
Fruits
Apples
North
South
Nuts
Pecans

6 2003 New Mexico Agricultural Statistics
Climate, 2002Temperature Freeze Date Annual Precipitation
County Station
Elevation
(Feet)
Years
of
Record
Last
Spring
Freeze
First
Fall
Freeze
Years
of
Record
Normal 2002
(Inches)
Bernalillo Albuquerque 5,310 101 3/17 11/16 132 9.47 6.391/
Catron Luna Ranger Station 7,050 69 5/29 9/20 79 17.57 15.63
Chaves Roswell FAA AP 3,649 32 3/26 11/16 32 13.34 12.84
Cibola Grants Airport 6,520 50 5/6 10/30 50 10.80 *9.69
Colfax Raton Filter Plant 6,932 50 4/22 10/30 50 16.80 *12.45
Curry Clovis 4,290 86 4/3 11/6 90 18.50 16.49
De Baca Ft. Sumner 4,025 79 3/26 4/ 88 14.41 5/
Doña Ana Las Cruces 3,881 106 3/6 11/17 140 9.40 7.622/
Eddy Carlsbad 3,120 99 3/23 11/28 104 13.32 *11.80
Grant Ft. Bayard 6,142 116 3/18 11/16 125 16.25 16.12
Guadalupe Santa Rosa 4,600 85 4/22 11/6 96 15.69 13.06
Harding Roy 5,878 57 4/4 10/31 89 15.74 5/
Hidalgo Animas 3 ESE 4,437 59 3/20 11/17 75 4/ 8.15
Lea Hobbs 3,615 80 3/26 11/27 81 16.78 5/
Lincoln Carrizozo 1 SW 5,405 86 4/21 11/4 92 12.83 *14.79
Los Alamos Los Alamos 7,424 77 4/21 10/4 81 16.86 11.71
Luna Deming 4,300 83 3/18 11/16 110 10.58 8.29
McKinley Gallup FAA AP 6,466 31 3/ 3/ 31 12.87 3/
Mora Ocate 2 NW 7,655 41 5/25 10/5 43 16.44 5/
Otero Alamogordo 4,350 76 4/ 11/28 88 12.74 5/
Quay Tucumcari 4 NE 4,086 94 4/3 11/6 98 15.37 *15.39
Rio Arriba Chama 7,850 89 5/26 10/1 96 21.61 *15.98
Roosevelt Portales 4,010 78 4/3 11/6 84 17.17 16.49
San Juan Aztec Ruins Nat’l Mon 5,643 84 4/21 10/28 95 10.78 7.67
San Miguel Las Vegas FAA AP 6,866 63 3/ 3/ 63 16.96 3/
Sandoval Jemez Springs 6,263 90 4/21 10/31 90 16.96 *12.61
Santa Fe Santa Fe 2 6,718 32 4/ 10/14 32 14.22 10.27
Sierra Elephant Butte Dam 4,576 95 3/5 12/11 95 10.65 5.93
Socorro Socorro 4,585 100 3/26 10/30 104 10.22 10.64
Taos Taos 6,965 89 4/ 10/14 100 12.44 5/
Torrance Estancia 7 NE 6,120 79 5/6 10/5 79 14.86 8.87
Union Grenville 6,002 57 4/21 10/17 59 16.34 11.00
Valencia Los Lunas 3 SSW 4,840 46 4/22 10/30 46 9.93 7.84
Insufficient or partial data if 1-9 daily values are missing. *
National Weather Service Forecast Office - International Airport.1/
Station is officially known as “State University.”2/
Data not available.3/
Data insufficient to determine date.4/
Values are missing when ten or more daily values are missing.5/
SOURCE: Climatological Data Annual Summary, New Mexico, 2002, Volume 106-Number 13, National Oceanic and Atmospheric Administration.

7 2003 New Mexico Agricultural Statistics
Fertilizer Shipped into New Mexico, 2003
Single-Nutrient Materials
First
Quarter
Second
Quarter
Third
Quarter
Fourth
Quarter
Total
2003
-------------------------------Tons--------------------------------
NITROGEN MATERIALS
Anhydrous Ammonia 1,858 2,730 1,873 643 7,104
Ammonium Nitrate 262 234 42 134 672
Ammonium Polysulfide 58 73 --- 59 190
Ammonium Sulfate 1,812 2,300 1,720 388 6,220
Ammonium Thiosulfate 247 600 151 11 1,009
Calcium Ammonium Nitrate 40 600 847 52 1,539
Calcium Nitrate 20 --- 12 29 91
Nitric Acid --- 26 75 --- 101
Nitrogen Solution 8,545 22,779 13,824 1,137 46,285
Urea 4,013 4,460 1,606 603 10,682
TOTAL NITROGEN MATERIALS 16,855 33,832 20,150 3,056 73,893
PHOSPHATE MATERIALS
Superphosphate, Triple 75 116 54 2 247
TOTAL PHOSPHATE MATERIALS 75 116 54 2 247
POTASH MATERIALS
Potassium Chloride 2,445 3,449 1,528 2,990 10,412
Potassium Magnesium Sulfate 238 2,191 479 2,592 5,500
Potassium Sulfate 64 47 8 458 577
TOTAL POTASH MATERIALS 2,747 5,687 2,015 6,040 16,489
TOTAL SINGLE-NUTRIENT TONS 19,677 39,635 22,219 9,098 90,629
TOTAL M ULTI-NUTRIENT TONS AND OTHER 39,355 42,368 19,489 8,838 110,0501/
GRAND TOTAL 59,032 82,003 41,708 17,936 200,679
Other includes secondary, organics, and miscellaneous materials; excludes lime.1/
SOURCE: Feed, Seed, and Fertilizer Bureau, New Mexico Department of Agriculture.

8 2003 New Mexico Agricultural Statistics
Commercial Feed 2003 Sales
Kind of FeedFirst
QuarterSecond
QuarterThird
QuarterFourth
Quarter Grand
Total
-----------------------------------------------Tonnage-----------------------------------------------
Alfalfa Products 874 2,584 2,842 2,028 8,328
Animal By-Products 5,033 3,470 4,654 4,305 17,462
Barley Products 730 1,394 672 1,511 4,307
Beet Pulp Pellets 11,138 15,479 5,949 8,067 40,633
Canola Products 15,830 14,108 12,577 11,514 54,029
Cattle Feeds 53,380 40,113 36,025 47,764 177,282
Corn Products 128,765 120,442 116,337 118,838 484,382
Cottonseed Products 16,519 12,103 13,194 19,522 61,338
Custom Mixed Feeds 6,040 12,890 6,144 6,020 31,094
Dairy Feeds 84,150 84,583 87,297 100,282 356,312
Distillers By-Products 33,050 36,811 39,414 46,544 155,819
Fish Feeds 177 57 61 142 437
Grain Sorghum Products 19,024 23,223 22,270 21,133 85,650
Horse Feeds 5,972 5,769 4,843 4,940 21,524
Mineral Feeds 16,017 13,661 13,226 14,242 57,146
Miscellaneous 10,470 13,634 7,646 5,448 37,1981/
Molasses 13,247 9,176 10,766 17,111 50,300
Molasses-Urea Feed 6,921 4,713 5,586 6,816 24,036
Oat Products 430 501 403 366 1,700
Other Mixed Feeds 996 997 1,871 1,141 5,005
Other Products 5,158 10,594 5,053 4,088 24,893
Oyster Shell Products 3 3 1 1 8
Peanut Meal/Ground Hulls 625 5,369 1,787 2,366 10,147
Pet Foods 9,118 7,978 8,181 9,578 34,8552/
Poultry Feeds 3,039 3,105 4,875 3,015 14,034
Rabbit Feeds 118 185 173 211 687
Rice Mill By-Products 692 932 549 616 2,789
Sheep Feeds 1,007 979 901 784 3,671
Soft Rock Phosphate 0 0 0 668 668
Soybean Products 54,396 50,490 52,880 51,212 208,978
Swine Feeds 544 828 750 528 2,650
Turkey Feeds 17 29 27 10 83
Urea Feed Products 77 170 126 101 474
Wheat Products 6,089 5,427 6,967 7,246 25,729
TOTAL TONNAGE 509,646 501,797 474,047 518,158 2,003,648
Miscellaneous tonnage includes products unidentified on quarterly reports submitted by manufacturers.1/
Tonnage of pet food does not include total amount merchandised in packages of ten pounds or less.2/
SOURCE: Feed, Seed, and Fertilizer Bureau, New Mexico Department of Agriculture.

9 2003 New Mexico Agricultural Statistics
FARM SECTOR ECONOMIC ANALYSIS
FARM INCOME CONCEPTS
Cash receipts from farm marketings representgross income from the sales of crops, livestock,and poultry during the calendar year. The valueof home consumption of farm products, inter-farmsales of livestock, and crops fed on farms wheregrown are not included in cash receipts. Cashreceipts from marketings of crops are the finalproduct of several estimates: acreage, yields,percentage of total production sold, average price,and changes in inventories. Marketings oflivestock and poultry include the sale value of ananimal only once, usually at the time when theanimal is sold for slaughter or at final disposition.
Final agricultural sector output includes cashreceipts as well as the value of homeconsumption, crop and livestock inventoryadjustments, and other farm-related income. Netvalue added is the sector’s contribution to thenational economy and is the sum of the incomeearned by all factors of production, includingdirect government payments, minus all productionexpenses and capital consumption. Governmentpayments to farmers are those payments madedirectly to farm producers in connection withfarm programs. Examples of intermediateconsumption outlays include purchase and repairof farm equipment and vehicles; purchases offuel, seed, feed, and livestock; as well as utilities,marketing, transportation, and storage expenses.
Net farm income is the operator’s share of incomefrom the agricultural sector’s production activitiesafter deductions for wages paid to hired workers,rent received by non-operator landlords, and realestate and non-real estate interest.
ASSETS & DEBTS
New Mexico’s farm and ranch assets have beenincreasing steadily over the past few years, with$12 billion in assets in 2002, up almost 2.0percent from 2001. Real estate, which remains thelargest farm and ranch asset, was valued at $9.4billion, up 2.2 percent from 2001. Livestock andpoultry values increased to $1.3 billion, andmachinery and motor vehicles increased to $502.9million. Both the value of crops and financialassets decreased in 2002. Crop assets dropped to$81.3 million and financial assets were down to$608.4 million. Farm and ranch debt continues torise, with $1.57 billion in 2002, compared to$1.49 billion in 2001. Real estate debt accountsfor 55 percent of the total 2002 debt, up from2001s 54 percent. Both the debt-to-equity anddebt-to-assets ratios increased during 2002 to 15.1and 13.1 respectively.
INCOME
The total value of the agriculture sector outputfrom New Mexico farmers and ranchers increasedin 2003 to $2.3 billion, up 7.1 percent from 2002but 2.7 percent less than in 2001. The rise in valuein 2003 can be attributed to the livestock industry,whose value of production increased to $1.6billion, up 14 percent. Total crop output dropped6.3 percent to $536.2 million. Revenues fromforestry and services totaled $174.2 million in2003, down 1.5 percent. Direct governmentpayments were up 27 percent to $92.5 million.After deductions for production expenses, hiredlabor, and other economic factors, the state’s netfarm income totaled $715.6 million, up 33 percentfrom 2002 but 8.6 percent less than 2001.

10 2003 New Mexico Agricultural Statistics
PRODUCTION EXPENSES
New Mexico farmers and ranchers purchased $1.2billion of inputs in 2003 to produce their cropsand livestock. This was only 0.3 percent less thanin 2002 and 0.8 percent less than in 2001.Livestock feed was the largest purchase at $353.4million, followed by livestock purchases of$309.2 million. The repair and maintenance ofcapital items cost farmers and ranchers $76.3million, and petroleum fuel and oil cost them$54.7 million. Property taxes were down 4.3percent to $24.2 million
CASH RECEIPTS
New Mexico crop and livestock product sales in2003 totaled $2.14 billion, up 8.6 percent from$1.97 billion in 2002. Total Livestock cashreceipts increased, while crop cash receipts saw adecline. Milk cash receipts recovered some fromthe drop experienced in 2002. Milk receipts wereup 6.2 percent to $790.1 million in 2003, makingit our number one cash commodity. Cattle andcalves are a close second with $757.9 in receipts,up 24 percent. Hay holds on to the third placerank, despite a 23 percent decline in receipts to$144.6 million. Pecans moved into fourth placeafter having a high-bearing year and receiving adecent price, with cash receipts totaling $70.4million. Onions moved up to fifth place, withcash receipts increasing 12 percent to $61.4million. Greenhouse and nursery receiptsincreased slightly to $60.8 million, making it oursixth ranked cash commodity. Ranked seventhwas other field crops (including silage) with $52.1million in receipts, down 9.4 percent. Chiledropped to eighth in the state with $37.8 millionin receipts. Miscellaneous vegetables was rankedninth with $25.0 million, and poultry and eggsfinished out our top ten cash commodities with$24.8 million.
GOVERNMENT PAYMENTS
Direct government payments to New Mexicoproducers totaled $92.5 million in 2003, up 27percent from 2002s $73.0 million. If ranked withcash receipts, government payments would be ourfourth largest cash commodity. Ad hoc andemergency programs totaled $27.2 million in2003, up 35 percent from 2002. Conservationprogram payments increased by 15 percent to$26.1 million. The implementation of newprograms authorized by the Farm Security andRural Investment Act of 2002 (the ‘Farm Bill’)caused a shift in payments from the 1996 FarmBill’s Production Flexibility program to thecurrent Fixed Direct and Counter CyclicalContract programs. Production Flexibilitypayments were -$860,000 in 2003; negativebecause some producers repaid unanticipated overpayments from previous years. Fixed directpayments increased by $19.4 million to $20.9million in 2003. Counter-cyclical paymentsincreased by $11.4 million to $12.1 million. MilkIncome Loss Payments were down 64 percent to$2.9 million and the Peanut Quota Buyoutprogram payments dropped 80 percent to $1.1million.
PRICES
Ranchers received higher prices for their cattle in2003 compared to 2002. Prices for beef cattleincreased to an average of $69.50 perhundredweight (cwt.), up $6.80 from the previousyear. Calf prices were up to $101.00 per cwt,compared to $93.60 per cwt in 2002. Steers andheifers received $88.20 per cwt compared to$78.30 in 2002. Milk was up $0.10 from $11.90per cwt in 2002 to $12.00 per cwt in 2003. Hayprices were also up in 2003. Alfalfa averaged$148.00 per ton, up $5.00 from 2002. Other Hayaveraged $122.00 per ton, also up $5.00. All haysold for an average of $144.00 a ton, $4.00 higherthan in 2002. Prices for Upland and Pima cotton,corn for grain, dry beans, and sorghum increasedin 2003. Prices for wheat, potatoes, and chile alldecreased. Peanut prices remained unchanged at$0.19 per pound.

11 2003 New Mexico Agricultural Statistics
Balance Sheet of the Farming Sector 1/
Item 1998 1999 2000 2001 2002
Million Dollars
ASSETS 11,160.7 11,329.3 11,440.9 11,730.8 11,963.1
Real Estate 9,050.8 8,909.1 9,032.3 9,237.5 9,442.8
Livestock and Poultry 1,099.3 1,239.9 1,239.5 1,282.6 1,309.62/
Machinery and Motor Vehicles 505.1 489.6 486.1 497.8 502.93/
Crops 73.4 90.4 93.0 85.1 81.34/
Purchased Inputs 16.2 12.9 15.7 13.5 18.1
Financial 415.7 587.4 575.2 614.2 608.4
FARM DEBT 1,282.6 1,329.0 1,418.8 1,494.0 1,569.25/
Real Estate 676.6 725.0 753.1 799.3 868.9
Nonreal Estate 606.0 604.0 665.7 694.8 700.3
EQUITY 9,878.1 10,000.3 10,022.0 10,236.8 10,393.9
RATIOS
Debt/Equity 13.0 13.3 14.2 14.6 15.1
Debt/Assets 11.5 11.7 12.4 12.7 13.1
Data as of December 31. Data are for farms with annual sales of $1,000 or more. 1998-01 data have been revised. Operator's1/
household assets and debt no longer included in farm balance sheet estimates. May not sum due to rounding.
Excludes horses, mules, and broilers.2/
Includes only farm share value for trucks and autos.3/
All non CCC crops held on farms plus the value above loan rates for crops held under CCC.4/
Excludes debt for nonfarm purposes.5/
SOURCE: USDA, Economic Research Service.

12 2003 New Mexico Agricultural Statistics
Net Income from Farming1/
1999 2000 2001 2002 2003
---------------------------------------1,000 Dollars----------------------------------
Value of crop production 561,776 502,845 540,250 572,125 536,2492/
Value of livestock production 1,450,565 1,565,282 1,668,325 1,375,504 1,564,3272/
Revenues from services and forestry 135,167 125,166 128,932 176,914 174,174
Machine hire and customwork 16,153 15,084 19,309 20,575 18,310
Forest products sold 2,000 2,000 3,000 4,500 4,500
Other farm income 60,018 42,881 45,032 93,550 90,500
Gross imputed rental value of farm dwellings 56,996 65,201 61,591 58,289 60,864
Value of Agricultural Sector Production 2,147,508 2,193,293 2,337,506 2,124,542 2,274,749
less: Purchased inputs 1,140,162 1,307,471 1,187,727 1,181,734 1,178,653
Farm origin 642,367 761,603 684,205 678,018 685,460
Feed purchased 264,833 294,945 273,932 384,455 353,423
Livestock and poultry purchased 354,292 445,340 391,095 268,354 309,206
Seed purchased 23,242 21,318 19,178 25,209 22,831
Manufactured inputs 132,018 150,110 145,589 147,014 141,688
Fertilizers and lime 33,781 33,933 33,534 34,550 31,757
Pesticides 20,641 21,579 20,758 22,474 21,963
Petroleum fuel and oils 46,644 65,350 59,531 53,667 54,696
Electricity 30,952 29,248 31,766 36,323 33,272
Other purchased inputs 365,777 395,758 357,933 356,702 351,505
Repair and maintenance of capital items 75,803 78,295 74,339 79,985 76,268
Machine hire and customwork 22,290 23,390 22,908 18,917 17,712
Marketing, storage, and transportation expenses 62,220 71,243 56,554 52,583 51,386
Contract labor 22,787 27,355 20,439 19,934 19,921
Miscellaneous expenses 182,677 195,475 183,693 185,283 186,218
plus: Net government transactions 63,686 48,895 64,220 43,208 63,610
+ Direct government payments 92,378 79,495 93,729 72,966 92,478
- Motor vehicle registration and licensing fees 4,660 6,064 5,571 4,525 4,703
- Property taxes 24,032 24,536 23,938 25,263 24,165
Gross Value Added 1,071,032 934,717 1,213,999 986,017 1,159,706
less: Capital consumption 109,485 110,570 112,861 114,517 113,940
Net Value Added 961,547 824,147 1,101,138 871,500 1,045,766
less: Payments to stakeholders 304,775 323,386 318,174 334,927 330,129
Employment compensation (total hired labor) 169,627 182,996 181,879 196,924 187,570
Net rent received by nonoperator landlords 38,383 35,105 40,077 34,452 37,341
Real estate and nonreal estate interest 96,765 105,285 96,218 103,551 105,218
Net Farm Income 656,772 500,761 782,964 536,573 715,637
Final sector output is the gross value of the commodities and services produced within a year. Net value-added is the sector’s 1/
contribution to the national economy and is the sum of the income from production earned by all factors-of-production. Net farm income is the farm operators’ share of income from the sector’s production activities. The concept presented is consistent with that employed by the Organization for Economic Cooperation and Development. 1999-2002 revised.
Includes home consumption and value of inventory adjustment.2/
SOURCE: USDA, Economic Research Service.

13 2003 New Mexico Agricultural Statistics
Cash Receipts: All Commodities1/
Commodity
2003
Rank 2001 2002 2003
-------------------------------1,000 Dollars-------------------------
All Commodities 2,210,430 1,970,255 2,139,590
Livestock Products 1,667,970 1,397,561 1,596,800
Meat Animals 813,438 616,814 766,585
Cattle and Calves 2 807,053 611,394 757,918
Sheep and Lambs 17 5,962 5,151 6,902
Hogs and Pigs 24 423 269 373
Milk 1 814,592 743,869 790,080
Wholesale 814,592 743,869 790,080
Poultry and Eggs 10 22,953 20,592 24,803
Eggs/ Farm Chickens/ Other Poultry 22,953 20,592 24,803
Miscellaneous Livestock 16,987 16,286 16,724
Wool and Mohair 22 1,525 1,254 1,439
Other Livestock 13 15,462 15,032 15,285
Crops 542,460 572,694 542,790
Food Grains 19,795 15,058 12,541
Wheat 15 19,795 15,058 12,541
Feed Crops 188,463 211,007 165,865
Hay 3 163,791 186,650 144,611
Sorghum Grain 18 8,641 7,844 4,318
Corn for Grain 12 16,031 16,513 16,936
Cotton 24,864 21,988 26,989
Cotton Lint 11 20,932 19,110 23,695
Cottonseed 19 3,932 2,877 3,293
Peanuts 16 17,431 10,260 8,721
Vegetables 146,807 147,763 141,552
Dry Beans 21 5,280 3,099 2,579
Onions 5 54,331 55,000 61,408
Potatoes 14 14,146 14,867 14,765
Chile 8 48,050 49,796 37,800
Miscellaneous Vegetables 9 25,000 25,000 25,000
Fruits and Nuts 41,758 48,387 73,753
Pecans 4 38,400 45,000 70,400
Apples 23 1,908 587 553
Other Fruits and Nuts 20 1,450 2,800 2,800
All Other Crops 103,163 118,073 113,369
Greenhouse Nursery 6 57,763 60,273 60,804
Other Seeds 25 400 300 300
Other Field Crops 7 45,000 57,500 52,265
Does not include cash receipts for livestock grazing. 1/

14 2003 New Mexico Agricultural Statistics
New Mexico Cash Receipts, 2003
All Commodities
15 2003 New Mexico Agricultural Statistics
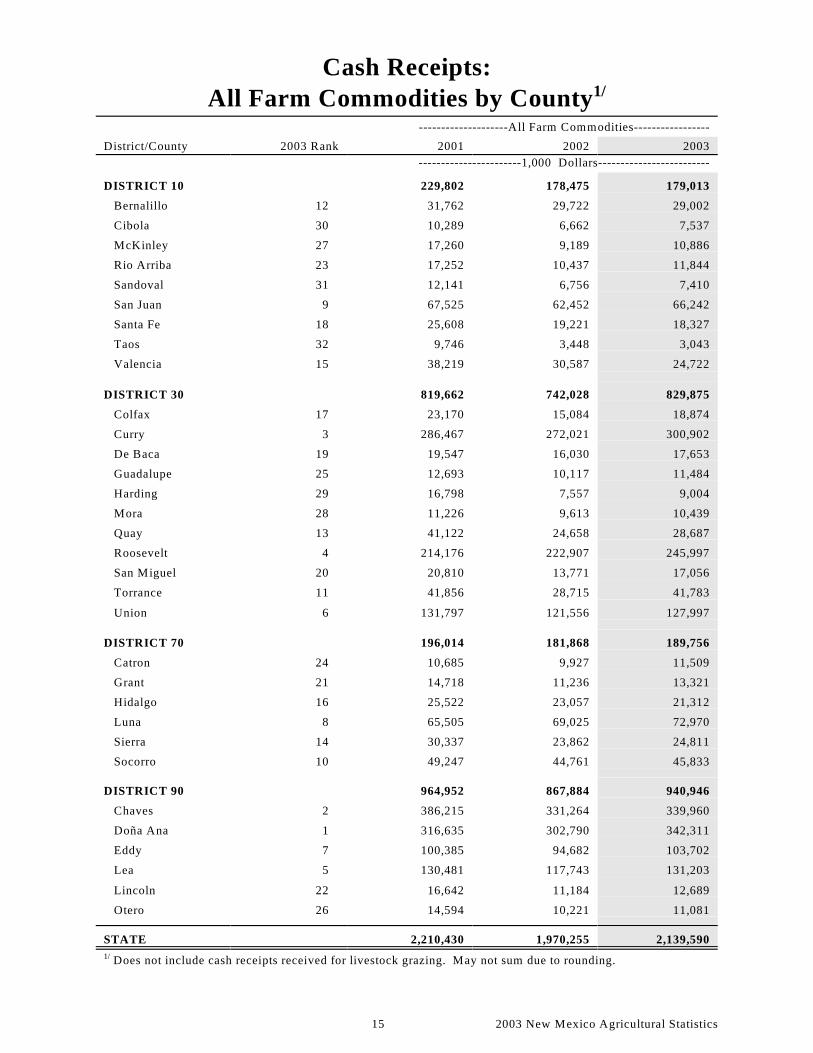
Cash Receipts:All Farm Commodities by County1/
District/County
--------------------All Farm Commodities-----------------
2003 Rank 2001 2002 2003
-----------------------1,000 Dollars-------------------------
DISTRICT 10 229,802 178,475 179,013
Bernalillo 12 31,762 29,722 29,002
Cibola 30 10,289 6,662 7,537
McKinley 27 17,260 9,189 10,886
Rio Arriba 23 17,252 10,437 11,844
Sandoval 31 12,141 6,756 7,410
San Juan 9 67,525 62,452 66,242
Santa Fe 18 25,608 19,221 18,327
Taos 32 9,746 3,448 3,043
Valencia 15 38,219 30,587 24,722
DISTRICT 30 819,662 742,028 829,875
Colfax 17 23,170 15,084 18,874
Curry 3 286,467 272,021 300,902
De Baca 19 19,547 16,030 17,653
Guadalupe 25 12,693 10,117 11,484
Harding 29 16,798 7,557 9,004
Mora 28 11,226 9,613 10,439
Quay 13 41,122 24,658 28,687
Roosevelt 4 214,176 222,907 245,997
San Miguel 20 20,810 13,771 17,056
Torrance 11 41,856 28,715 41,783
Union 6 131,797 121,556 127,997
DISTRICT 70 196,014 181,868 189,756
Catron 24 10,685 9,927 11,509
Grant 21 14,718 11,236 13,321
Hidalgo 16 25,522 23,057 21,312
Luna 8 65,505 69,025 72,970
Sierra 14 30,337 23,862 24,811
Socorro 10 49,247 44,761 45,833
DISTRICT 90 964,952 867,884 940,946
Chaves 2 386,215 331,264 339,960
Doña Ana 1 316,635 302,790 342,311
Eddy 7 100,385 94,682 103,702
Lea 5 130,481 117,743 131,203
Lincoln 22 16,642 11,184 12,689
Otero 26 14,594 10,221 11,081
STATE 2,210,430 1,970,255 2,139,590
Does not include cash receipts received for livestock grazing. May not sum due to rounding.1/

1 6 2003 New Mexico Agricultural Statistics
Cash Receipts:All Livestock, All Crops1/
-----------------All Livestock------------------- -------------------All Crops--------------------
County 2001 2002 2003 2001 2002 2003
-------------------------------------------------1,000 Dollars-------------------------------------------------
DISTRICT 10 150,611 98,422 107,011 79,191 80,053 72,003
Bernalillo 24,129 19,118 20,470 7,633 10,604 8,532
Cibola 9,598 5,941 7,245 692 721 292
McKinley 16,503 8,859 10,685 756 331 201
Rio Arriba 11,111 7,586 9,238 6,140 2,850 2,606
Sandoval 8,679 3,549 4,995 3,462 3,207 2,415
San Juan 32,098 20,222 24,678 35,427 42,230 41,564
Santa Fe 15,326 9,422 9,450 10,282 9,798 8,877
Taos 3,365 1,537 1,932 6,381 1,911 1,111
Valencia 29,802 22,187 18,317 8,417 8,400 6,405
DISTRICT 30 672,856 607,392 717,745 138,310 134,637 112,130
Colfax 19,723 12,713 16,545 3,446 2,371 2,329
Curry 244,455 226,942 261,971 42,012 45,079 38,931
De Baca 14,120 10,225 11,956 5,427 5,805 5,696
Guadalupe 11,543 9,606 11,182 1,150 511 302
Harding 16,526 7,358 8,711 272 199 294
Mora 7,790 8,471 9,711 3,436 1,142 728
Quay 26,986 19,463 24,459 14,135 5,194 4,228
Roosevelt 175,549 178,015 211,512 38,627 44,892 34,485
San Miguel 18,692 13,019 16,003 2,117 752 1,053
Torrance 19,326 16,484 30,321 14,034 12,231 11,463
Union 118,145 105,095 115,374 13,652 16,461 12,623
DISTRICT 70 120,921 97,648 112,709 83,589 84,220 77,047
Catron 9,961 8,750 10,940 725 1,178 569
Grant 14,015 10,780 13,149 703 456 172
Hidalgo 11,235 8,687 10,449 14,287 14,370 10,863
Luna 14,814 18,631 20,542 47,761 50,394 52,428
Sierra 29,188 13,978 16,736 12,574 9,884 8,076
Socorro 41,708 36,822 40,894 7,540 7,939 4,939
DISTRICT 90 723,582 594,099 659,336 241,370 273,784 281,610
Chaves 338,012 274,182 297,830 48,204 57,082 42,130
Doña Ana 185,539 153,941 169,384 131,095 148,849 172,927
Eddy 71,834 58,866 69,093 28,551 35,816 34,609
Lea 101,401 89,805 103,680 29,079 27,938 27,523
Lincoln 16,298 10,961 12,546 344 224 143
Otero 10,497 6,345 6,803 4,097 3,876 4,277
STATE 1,667,970 1,397,561 1,596,800 542,460 572,694 542,790
Does not include cash receipts received for livestock grazing. May not sum due to rounding.1/

17 2003 New Mexico Agricultural Statistics
Cash Receipts:Cattle and Calves, Milk1/
-----------------Cattle and Calves------------- -----------------------Milk -----------------------2/
District/County 2001 2002 2003 2001 2002 2003
---------------------------------------------------1,000 Dollars-------------------------------------------------
DISTRICT 10 104,266 59,293 72,233 28,418 23,084 16,593
Bernalillo 4,646 2,955 3,861 10,986 8,598 7,704
Cibola 8,408 4,925 6,006 --- --- ---
McKinley 13,718 6,238 7,722 --- --- ---
Rio Arriba 10,178 6,566 8,151 --- --- ---
Sandoval 8,408 3,283 4,719 --- --- ---
San Juan 29,791 18,080 22,422 --- --- ---
Santa Fe 14,957 9,038 9,057 --- --- ---
Taos 2,655 1,313 1,716 --- --- ---
Valencia 11,505 6,895 8,580 17,431 14,486 8,889
DISTRICT 30 415,526 339,669 418,365 261,179 262,875 294,176
Colfax 19,470 12,476 16,302 --- --- ---
Curry 120,296 100,877 123,112 123,485 125,431 138,199
De Baca 13,718 9,849 11,583 --- --- ---
Guadalupe 11,063 9,193 10,725 --- --- ---
Harding 16,373 7,223 8,580 --- --- ---
Mora 7,523 8,208 9,438 --- --- ---
Quay 26,551 19,042 24,024 --- --- ---
Roosevelt 46,021 48,591 63,491 129,198 128,611 147,088
San Miguel 18,143 12,476 15,444 --- --- ---
Torrance 18,585 15,759 20,592 --- --- ---
Union 117,784 95,975 115,076 --- --- ---
Other Counties --- --- 8,496 8,833 8,889
DISTRICT 70 79,723 64,690 78,563 31,347 31,682 32,831
Catron 9,735 8,536 10,725 --- --- ---
Grant 13,718 10,506 12,870 --- --- ---
Hidalgo 11,063 8,536 10,296 --- --- ---
Luna 14,674 15,442 17,217 --- --- ---
Sierra 11,063 6,895 9,009 --- --- ---
Socorro 19,470 14,774 18,447 21,972 21,788 3/
Other Counties --- --- 9,375 9,893 32,831
DISTRICT 90 207,537 147,742 188,756 493,648 426,229 446,479
Chaves 82,307 58,440 76,790 253,123 213,409 218,084
Doña Ana 38,056 25,937 33,890 131,835 114,007 118,761
Eddy 26,993 18,714 24,024 44,238 39,573 44,446
Lea 36,286 29,877 37,751 64,453 59,241 65,188
Lincoln 14,603 9,521 10,725 --- --- ---
Otero 9,293 5,253 5,577 --- --- ---
STATE 807,053 611,394 757,918 814,592 743,869 790,080
Does not include cash receipts received for livestock grazing. May not sum due to rounding.1/
Milk cow estimates are not made for counties with fewer than 200 head.2/
Included with other counties.3/
18 2003 New Mexico Agricultural Statistics
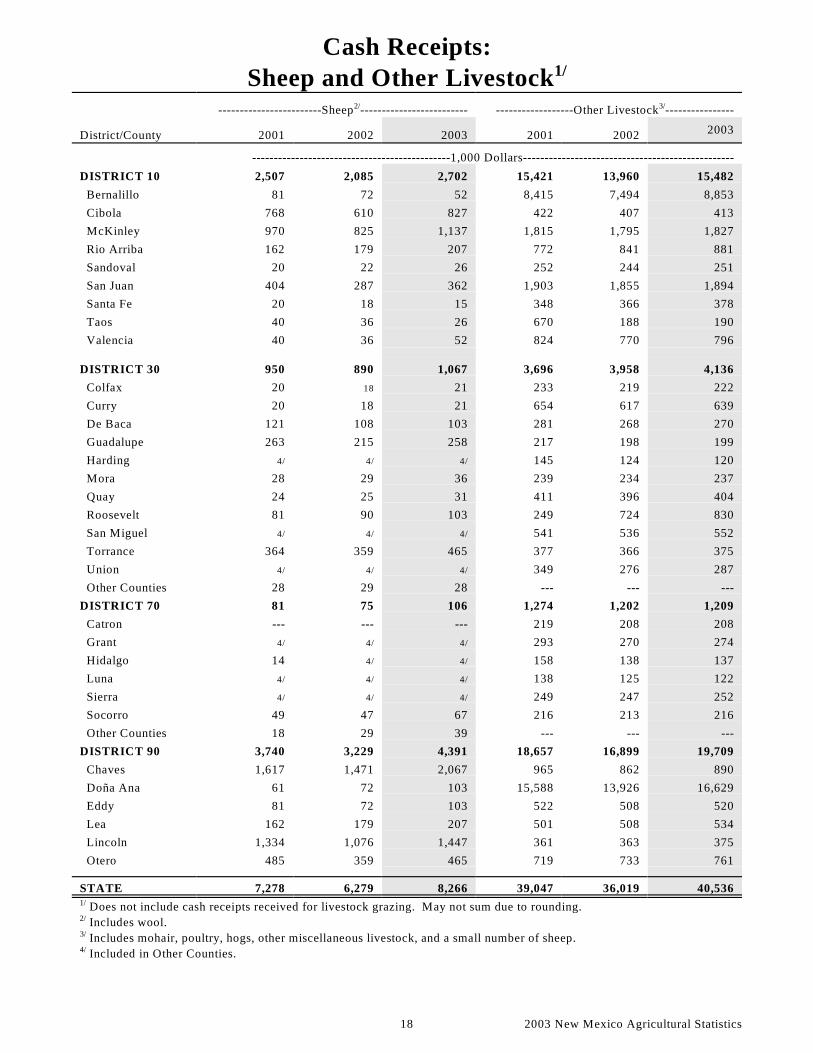
Cash Receipts:Sheep and Other Livestock1/
------------------------Sheep ------------------------- ------------------Other Livestock ----------------2/ 3/
District/County 2001 2002 2003 2001 2002 2003
----------------------------------------------1,000 Dollars-------------------------------------------------
DISTRICT 10 2,507 2,085 2,702 15,421 13,960 15,482
Bernalillo 81 72 52 8,415 7,494 8,853
Cibola 768 610 827 422 407 413
McKinley 970 825 1,137 1,815 1,795 1,827
Rio Arriba 162 179 207 772 841 881
Sandoval 20 22 26 252 244 251
San Juan 404 287 362 1,903 1,855 1,894
Santa Fe 20 18 15 348 366 378
Taos 40 36 26 670 188 190
Valencia 40 36 52 824 770 796
DISTRICT 30 950 890 1,067 3,696 3,958 4,136
Colfax 20 18 21 233 219 222
Curry 20 18 21 654 617 639
De Baca 121 108 103 281 268 270
Guadalupe 263 215 258 217 198 199
Harding 4/ 4/ 4/ 145 124 120
Mora 28 29 36 239 234 237
Quay 24 25 31 411 396 404
Roosevelt 81 90 103 249 724 830
San Miguel 4/ 4/ 4/ 541 536 552
Torrance 364 359 465 377 366 375
Union 4/ 4/ 4/ 349 276 287
Other Counties 28 29 28 --- --- ---
DISTRICT 70 81 75 106 1,274 1,202 1,209
Catron --- --- --- 219 208 208
Grant 4/ 4/ 4/ 293 270 274
Hidalgo 14 4/ 4/ 158 138 137
Luna 4/ 4/ 4/ 138 125 122
Sierra 4/ 4/ 4/ 249 247 252
Socorro 49 47 67 216 213 216
Other Counties 18 29 39 --- --- ---
DISTRICT 90 3,740 3,229 4,391 18,657 16,899 19,709
Chaves 1,617 1,471 2,067 965 862 890
Doña Ana 61 72 103 15,588 13,926 16,629
Eddy 81 72 103 522 508 520
Lea 162 179 207 501 508 534
Lincoln 1,334 1,076 1,447 361 363 375
Otero 485 359 465 719 733 761
STATE 7,278 6,279 8,266 39,047 36,019 40,536
Does not include cash receipts received for livestock grazing. May not sum due to rounding.1/
Includes wool.2/
Includes mohair, poultry, hogs, other miscellaneous livestock, and a small number of sheep.3/
Included in Other Counties.4/

19 2003 New Mexico Agricultural Statistics
Cash Receipts:Wheat and Hay1/
-----------------------Wheat------------------------ --------------------------Hay-------------------------
District/County 2001 2002 2003 2001 2002 2003
----------------------------------------------------1,000 Dollars-----------------------------------------------
DISTRICT 10 2,243 1,733 2,221 32,689 36,165 26,974
Bernalillo 2/ 2/ 2/ 2,868 4,704 2,745
Cibola --- --- --- 531 664 248
McKinley --- --- --- 366 286 164
Rio Arriba 16 2/ 2/ 3,187 1,742 1,569
Sandoval 2/ 2/ 2/ 797 1,605 957
San Juan 2,110 1,486 2,138 11,844 14,534 12,057
Santa Fe 51 2/ 2/ 3,027 4,032 3,320
Taos 2/ 2/ 2/ 3,569 1,804 1,039
Valencia 2/ 2/ 2/ 6,501 6,794 4,875
Other Counties 64 247 82 --- --- ---
DISTRICT 30 15,514 11,866 9,572 44,502 43,228 35,717
Colfax 63 2/ 2/ 3,378 2,322 2,258
Curry 8,500 5,811 3,434 4,875 7,715 6,796
De Baca 53 25 2/ 4,684 4,368 4,386
Guadalupe 36 2/ 2/ 926 373 237
Harding --- --- --- 174 199 294
Mora --- --- --- 1,593 1,083 677
Quay 3,299 625 421 9,071 3,064 2,931
Roosevelt 2,676 2,789 2,902 10,271 13,874 9,178
San Miguel 2/ 2/ 2/ 1,646 610 969
Torrance 30 58 2/ 3,994 5,425 4,696
Union 799 2,493 2,710 3,888 4,196 3,296
Other Counties 57 64 105
DISTRICT 70 679 618 523 14,033 14,172 10,734
Catron 2/ 2/ 2/ 510 1,039 519
Grant --- --- --- 351 355 113
Hidalgo --- --- --- 744 666 695
Luna 412 564 508 2,140 2,090 2,630
Sierra 2/ 2/ 2/ 3,852 3,098 2,350
Socorro 2/ 2/ 2/ 6,437 6,923 4,425
Other Counties 267 54 15 --- --- ---
DISTRICT 90 1,359 841 226 72,567 93,085 71,187
Chaves 182 178 2/ 32,822 39,464 22,637
Doña Ana 346 227 2/ 13,094 19,227 17,940
Eddy 2/ 2/ 2/ 19,736 25,036 22,572
Lea 819 395 163 5,014 8,275 7,135
Lincoln --- --- --- 105 100 43
Otero --- --- --- 1,797 983 860
Other Counties 13 40 63 --- --- ---
STATE 19,795 15,058 12,541 163,791 186,650 144,611
May not sum due to rounding.1/
Included in Other Counties.2/

20 2003 New Mexico Agricultural Statistics
Cash Receipts:Sorghum and Corn1/
------------------Grain Sorghum-------------------- --------------------Grain Corn-------------------
District/County 2001 2002 2003 2001 2002 2003
---------------------------------------------------- 1,000 Dollars-------------------------------------------------
DISTRICT 10 22 25 --- 1,652 3,504 3,950
Sandoval 2/ --- --- --- 53 ---
San Juan --- --- --- 1,592 3,451 2/
Santa Fe 2/ --- --- 60 2/ 2/
Other Counties 22 25 --- --- --- 3,950
DISTRICT 30 7,908 6,848 3,505 12,993 12,128 10,886
Curry 4,407 3,266 2,097 5,222 2,366 4,076
Quay 600 450 119 2/ 2/ 2/
Roosevelt 2,846 2,992 1,077 1,917 501 912
Torrance --- --- --- 96 110 2/
Union 53 23 212 5,663 8,960 5,551
Other Counties 2 118 --- 96 191 347
DISTRICT 70 520 789 679 920 881 696
Hidalgo 117 2/ 2/ 774 867 2/
Luna 403 672 606 145 2/ 2/
Other Counties --- 117 73 --- 15 696
DISTRICT 90 191 183 134 466 --- 1,405
Chaves 55 17 --- 290 --- 752
Doña Ana --- 2/ --- 175 --- 387
Eddy 38 13 --- --- --- 2/
Lea 98 128 2/ --- --- 2/
Other Counties --- 24 134 --- --- 266
STATE 8,641 7,844 4,318 16,031 16,513 16,936
May not sum due to rounding.1/
Included in Other Counties.2/

21 2003 New Mexico Agricultural Statistics
Cash Receipts:Cotton and Chile1/
----------------------Cotton-------------------- ----------------------Chile-----------------------
District/County 2001 2002 2003 2001 2002 2003
---------------------------------------------------1,000 Dollars-------------------------------------------------
DISTRICT 10 --- --- --- 540 584 191
DISTRICT 30 5,916 4,928 3,179 380 571 187
Curry 2,588 2,081 1,006 --- --- ---
Quay 924 263 2/ --- --- ---
Roosevelt 2,403 2,584 2,109 --- --- ---
Other Counties --- --- 65 380 571 187
DISTRICT 70 1,386 1,240 1,891 29,749 31,097 24,708
Hidalgo 277 241 324 7,830 7,077 3,822
Luna 1,109 986 1,557 19,517 21,721 19,343
Sierra --- 2/ 2/ 1,661 1,694 1,373
Socorro --- --- --- 712 604 2/
Other Counties --- 13 10 30 --- 171
DISTRICT 90 17,562 15,821 21,919 17,381 17,544 12,714
Chaves 1,109 701 1,330 2,907 1,488 642
Doña Ana 8,042 7,709 11,191 12,457 14,035 10,810
Eddy 3,050 2,484 3,883 1,068 987 270
Lea 5,361 4,928 5,515 949 1,033 992
Other Counties --- --- --- --- 2 1
STATE 24,864 21,989 26,989 48,050 49,796 37,800
May not sum due to rounding.1/
Included in Other Counties.2/

22 2003 New Mexico Agricultural Statistics
Cash Receipts:Vegetables, Fruits, and Nuts1/
-------------------Vegetables -------------- --------------Fruits & Nuts----------------2/
District/County 2001 2002 2003 2001 2002 2003
------------------------------------------1,000 Dollars----------------------------------------------------
DISTRICT 10 21,467 16,118 17,617 1,324 928 907
Bernalillo 672 118 118 231 161 155
Cibola 54 --- --- 2 4 4
McKinley 282 37 37 --- --- ---
Rio Arriba 1,478 287 287 445 315 306
Sandoval 1,344 360 360 126 110 108
San Juan 14,948 15,200 16,699 366 81 78
Santa Fe 1,075 77 77 92 103 101
Taos 1,613 7 7 10 13 12
Valencia --- 33 33 53 142 143
DISTRICT 30 10,969 14,787 14,046 212 175 207
Colfax --- --- --- 1 5 6
Curry 7,392 10,811 9,866 39 36 49
De Baca 40 17 17 5 6 13
Guadalupe 13 31 33 28 2 2
Harding 40 --- --- --- --- ---
Mora 148 2 2 6 7 7
Quay 47 4 4 5 11 22
Roosevelt 2,623 3,246 3,308 75 78 80
San Miguel 215 20 20 16 13 12
Torrance 423 654 654 36 17 17
Union 27 3 142 1 --- ---
DISTRICT 70 27,730 25,777 27,011 2,221 2,976 4,428
Catron 40 2 2 11 --- ---
Grant 81 11 11 101 40 34
Hidalgo 591 508 508 9 217 230
Luna 21,069 21,093 23,414 1,300 2,224 3,275
Sierra 5,814 4,136 3,048 751 472 865
Socorro 134 29 29 49 24 24
DISTRICT 90 33,311 38,185 42,500 38,001 44,307 68,210
Chaves 323 17 4,751 5,021 7,444
Doña Ana 30,991 34,638 40,111 27,931 32,628 51,968
Eddy 621 1,094 327 3,010 3,875 5,376
Lea 1,216 2,400 1,992 322 413 512
Lincoln 27 --- --- 177 50 48
Otero 134 53 53 1,809 2,321 2,862
STATE 93,477 94,867 101,174 41,758 48,387 73,752
May not sum due to rounding.1/
Excludes chile and dry beans.2/

23 2003 New Mexico Agricultural Statistics
Cash Receipts: Other Crops1/2/
District/County 2001 2002 2003
-------------------------------------------------1,000 Dollars-------------------------------------------------
DISTRICT 10 19,254 20,995 20,143 Bernalillo 3,800 5,300 5,365
Cibola 104 52 39
McKinley 108 8 0
Rio Arriba 931 507 444
Sandoval 962 951 948
San Juan 4,520 7,452 6,956
Santa Fe 5,924 5,374 5,106
Taos 1,131 76 53
Valencia 1,774 1,274 1,233
DISTRICT 30 39,917 40,106 34,831
Colfax 5 44 37
Curry 8,988 12,958 11,595
De Baca 644 1,270 1,269
Guadalupe 102 26 26
Harding 14 --- 0
Mora 1,689 50 42
Quay 48 646 599
Roosevelt 15,525 18,303 14,748
San Miguel 225 57 40
Torrance 9,455 5,966 5,763
Union 3,223 785 712
DISTRICT 70 6,350 6,670 6,378
Catron 163 137 48
Grant 141 50 15
Hidalgo 3,726 4,690 4,717
Luna 1,664 1,029 924
Sierra 496 440 400
Socorro 159 324 275
DISTRICT 90 60,532 63,819 63,316
Chaves 5,765 10,213 9,267
Doña Ana 38,060 40,360 40,458
Eddy 1,014 2,288 2,105
Lea 15,301 10,366 10,932
Lincoln 35 74 53
Otero 356 517 502
STATE 126,053 131,590 124,669
Includes dry beans, peanuts, corn silage, and all other crops.1/
May not sum due to rounding.2/
24 2003 New Mexico Agricultural Statistics
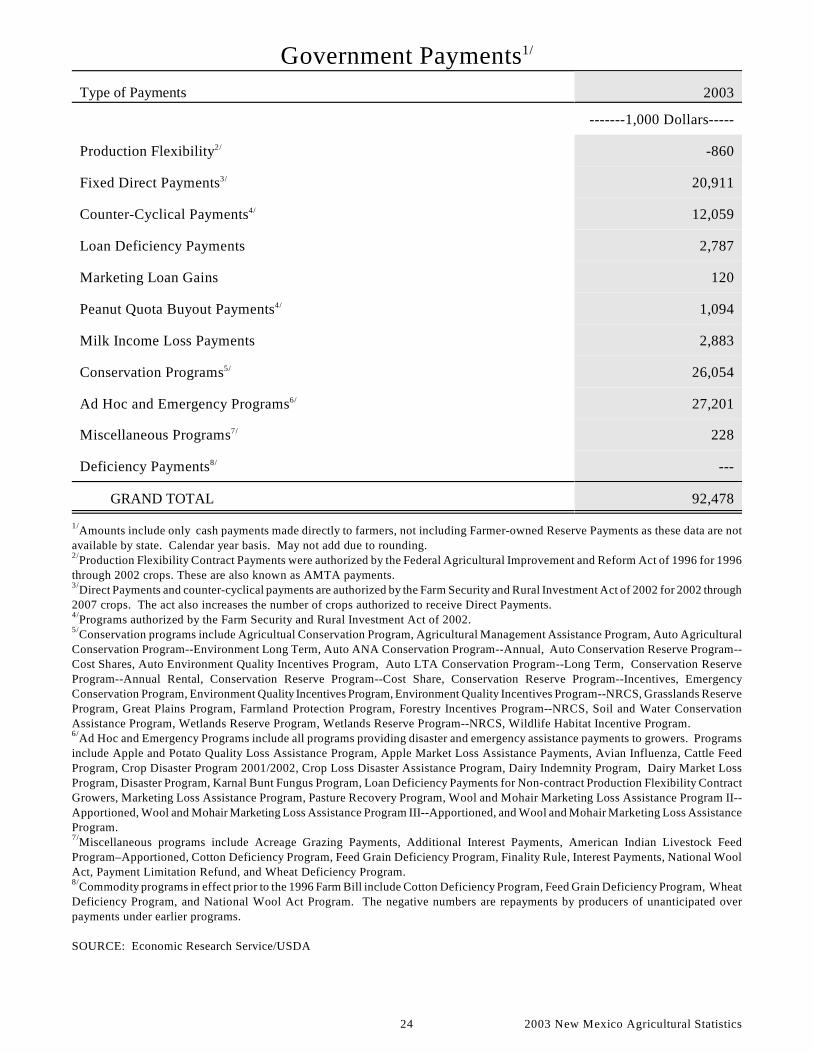
Government Payments1/
Type of Payments 2003
-------1,000 Dollars-----
Production Flexibility -8602/
Fixed Direct Payments 20,9113/
Counter-Cyclical Payments 12,0594/
Loan Deficiency Payments 2,787
Marketing Loan Gains 120
Peanut Quota Buyout Payments 1,0944/
Milk Income Loss Payments 2,883
Conservation Programs 26,0545/
Ad Hoc and Emergency Programs 27,2016/
Miscellaneous Programs 2287/
Deficiency Payments ---8/
GRAND TOTAL 92,478
Amounts include only cash payments made directly to farmers, not including Farmer-owned Reserve Payments as these data are not1/
available by state. Calendar year basis. May not add due to rounding.Production Flexibility Contract Payments were authorized by the Federal Agricultural Improvement and Reform Act of 1996 for 1996
2/
through 2002 crops. These are also known as AMTA payments.Direct Payments and counter-cyclical payments are authorized by the Farm Security and Rural Investment Act of 2002 for 2002 through
3/
2007 crops. The act also increases the number of crops authorized to receive Direct Payments.Programs authorized by the Farm Security and Rural Investment Act of 2002.
4/
Conservation programs include Agricultual Conservation Program, Agricultural Management Assistance Program, Auto Agricultural5/
Conservation Program--Environment Long Term, Auto ANA Conservation Program--Annual, Auto Conservation Reserve Program--Cost Shares, Auto Environment Quality Incentives Program, Auto LTA Conservation Program--Long Term, Conservation ReserveProgram--Annual Rental, Conservation Reserve Program--Cost Share, Conservation Reserve Program--Incentives, EmergencyConservation Program, Environment Quality Incentives Program, Environment Quality Incentives Program--NRCS, Grasslands ReserveProgram, Great Plains Program, Farmland Protection Program, Forestry Incentives Program--NRCS, Soil and Water ConservationAssistance Program, Wetlands Reserve Program, Wetlands Reserve Program--NRCS, Wildlife Habitat Incentive Program.
Ad Hoc and Emergency Programs include all programs providing disaster and emergency assistance payments to growers. Programs6/
include Apple and Potato Quality Loss Assistance Program, Apple Market Loss Assistance Payments, Avian Influenza, Cattle FeedProgram, Crop Disaster Program 2001/2002, Crop Loss Disaster Assistance Program, Dairy Indemnity Program, Dairy Market LossProgram, Disaster Program, Karnal Bunt Fungus Program, Loan Deficiency Payments for Non-contract Production Flexibility ContractGrowers, Marketing Loss Assistance Program, Pasture Recovery Program, Wool and Mohair Marketing Loss Assistance Program II--Apportioned, Wool and Mohair Marketing Loss Assistance Program III--Apportioned, and Wool and Mohair Marketing Loss AssistanceProgram.
Miscellaneous programs include Acreage Grazing Payments, Additional Interest Payments, American Indian Livestock Feed7/
Program–Apportioned, Cotton Deficiency Program, Feed Grain Deficiency Program, Finality Rule, Interest Payments, National WoolAct, Payment Limitation Refund, and Wheat Deficiency Program.
Commodity programs in effect prior to the 1996 Farm Bill include Cotton Deficiency Program, Feed Grain Deficiency Program, Wheat8/
Deficiency Program, and National Wool Act Program. The negative numbers are repayments by producers of unanticipated overpayments under earlier programs.
SOURCE: Economic Research Service/USDA
25 2003 New Mexico Agricultural Statistics
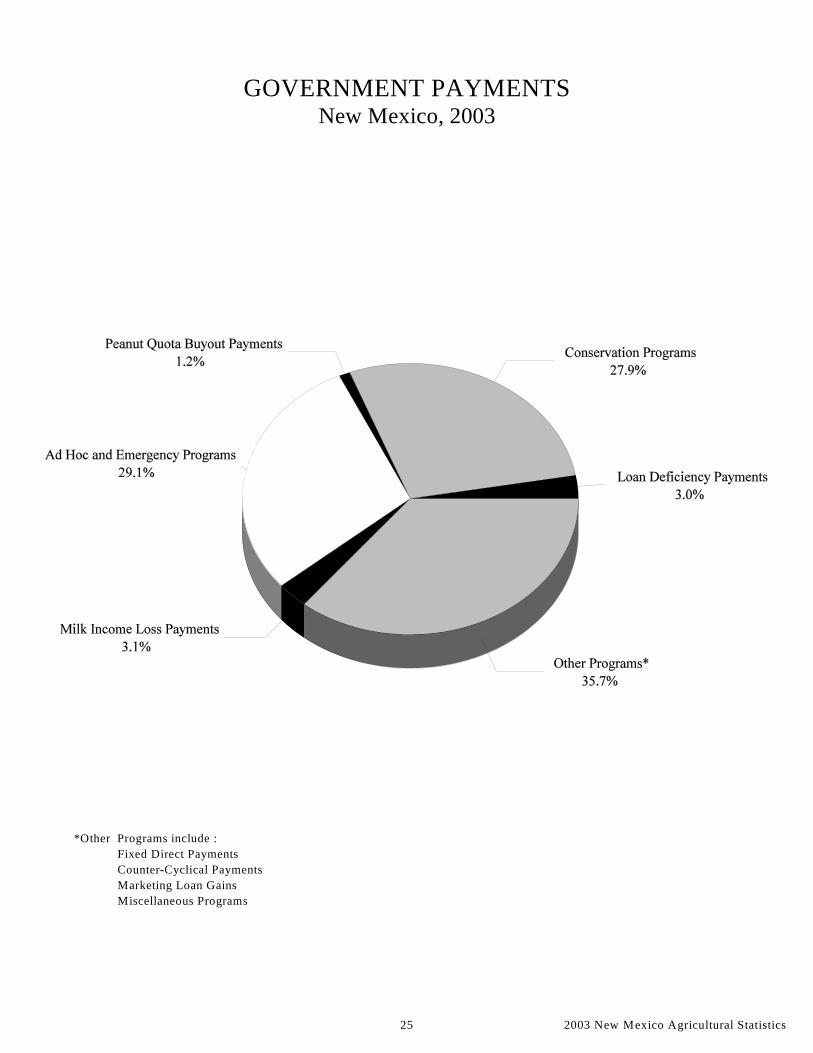
GOVERNMENT PAYMENTSNew Mexico, 2003
*Other Programs include :
Fixed Direct Payments
Counter-Cyclical Payments
Marketing Loan Gains
Miscellaneous Programs

26 2003 New Mexico Agricultural Statistics
Prices Received for Hay
Year and Month1/All Hay$/Ton
Alfalfa $/Ton
Other Hay$/Ton
1999 113.00 116.00 94.00
2000 122.00 124.00 102.00
2001 124.00 126.00 107.00
2002 140.00 143.00 117.00
2003 144.00 148.00 122.00
2003 January 139.00 143.00 117.00
February 142.00 146.00 120.00
March 143.00 147.00 121.00
April 142.00 146.00 120.00
May 144.00 148.00 121.00
June 149.00 153.00 126.00
July 140.00 144.00 118.00
August 138.00 141.00 116.00
September 137.00 140.00 116.00
October 130.00 133.00 109.00
November 136.00 139.00 114.00
December 135.00 138.00 113.00
Yearly prices based on marketing year average price (Market year is May through following April).1/

27 2003 New Mexico Agricultural Statistics
Prices Received for Cattle
Year and Month 1/Beef Cattle
$/Cwt.Calves $/Cwt.
Cows $/Cwt.
Steers & Heifers $/Cwt.
1999 60.00 86.60 38.10 72.80
2000 67.80 101.00 40.70 85.00
2001 69.20 102.00 44.00 86.10
2002 62.70 93.60 38.60 78.30
2003 69.50 101.00 43.30 88.20
2003 January 62.20 92.70 37.40 80.90
February 64.00 94.20 39.80 80.10
March 63.20 92.90 40.30 76.10
April 65.10 95.90 39.70 78.20
May 66.80 92.60 41.00 80.10
June 68.80 94.50 42.00 83.20
July 72.20 101.00 46.00 88.30
August 72.60 103.00 45.50 90.70
September 74.60 107.00 46.20 92.80
October 76.40 109.00 45.00 95.60
November 75.80 111.00 48.50 96.40
December 75.80 112.00 50.70 96.40
Yearly prices based on calendar year average price.1/

28 2003 New M exico Agricultural Statistics
LIVESTOCK
CATTLE AND CALVES
New Mexico’s inventory of all cattle and calves asof January 1, 2004, was 1,510,000 head, a 2.6percent decrease from 2003. The growing dairyindustry continues to impact total inventory. TheJanuary 1, 2004, milk cow inventory increased 3.5percent from the previous year to a total of 325,000head. Dairy producers kept 75,000 dairy heifers forreplacement, 7.1 percent above the 2003 total. Beefcow inventory fell to 455,000 head. Ranchersmaintained 85,000 heifers for beef cowreplacement, 6 percent lower than the previousyear’s total of 90,000. The inventory of steersweighing 500 pounds and over dropped to 190,000head, from 210,000 head the previous year. Bullson hand remained steady at 45,000 head. The 2003calf crop, including both beef and dairy calves, wasestimated at 590,000 head, a 10,000 head decreasefrom the previous year. Calves on hand totaled230,000 head. Cattle and calves on full feed for theslaughter market on January 1, 2004, dropped to115,000 head, 4,000 less than a year earlier. The2003 gross income increased 24 percent to $761million.
RANGE AND PASTURE FEED
Measurements of pasture and range conditionsbegan in mid-March with ratings of 24 percent atvery poor; 27 percent poor; 38 percent fair; and 11percent good. April reports indicate ranchers werefeeding and watering and late calving was reportedin some areas due to the drought. Many ranchersreduced herd size as the drought situation worsened.Pasture conditions in June were still on the declinewith 38 percent being reported as very poor, 37percent poor condition, 23 percent fair condition,and 2 percent in good condition. Temperatureshitting 100 in early June were cooled by activestorms in the eastern plains. Little change occurredduring July as ranchers reported an increasingreduction of herd numbers due to high temperaturesand lack of sufficient water to help rangelandgrasses. No relief was felt in August and September
as ranchers began thinning cattle and sheep numbersas well as beginning to think about winter grazing.The movement of cattle continued into October withranchers either selling or moving cattle into winterpastures. Conditions at year’s end, again, ended ona down note, as everyone looked ahead hopeful forgood winter snows to alleviate conditions in spring2004.
DAIRY
The state dairy industry continued its growth patternwith milk cow numbers increasing as well as milkproduction reaching higher levels. The number ofmilk cows during the year averaged 317,000 head,up 5.3 percent from 2002. Milk production setanother record high at 6.7 billion pounds, up 5.5percent from a year earlier when 6.3 billion poundswere produced. Milk production per cow, at 21,028pounds, was up 45 pounds from last year. Amongthe 20 major milk producing states, New Mexicoranked fifth in milk production per cow and seventhin total milk production. For the second straightyear, milk has been ranked New Mexico’s numberone cash commodity.
SHEEP AND LAMBS
Sheep and lambs inventory as of January 1, 2004,totaled 160,000 head, down 9 percent from a yearearlier. The number of breeding sheep for 2003decreased by 35,000 head to 140,000 head. Marketsheep and lambs remained constant at 35,000. The2003 lamb crop, at 100,000 head, was 8.6 percentbelow the previous year. Producer gross incomeincreased 32 percent to $7.7 million. Wool wassheared from 160,000 sheep and lambs, producing1.24 million pounds. Value of wool producedincreased 24 percent to $1.3 million as the averageprice of wool increased 38 percent to $1.10 perpound.

29 2003 New Mexico Agricultural Statistics
Cattle and Calves:Number and Value1/
Year NumberValue
Per HeadTotal
Value
1,000 Head Dollars
1,000Dollars
1975 1,720 135.00 232,200
1980 1,600 415.00 664,000
1985 1,410 350.00 493,500
1990 1,360 590.00 802,400
1995 1,500 650.00 975,000
1999 1,630 660.00 1,075,800
2000 1,640 740.00 1,213,600
2001 1,580 770.00 1,216,600
2002 1,580 800.00 1,264,000
2003 1,550 780.00 1,209,000
2004 1,510 860.00 1,298,600
As of January 1.1/

30 2003 New Mexico Agricultural Statistics
Cattle and Calves: Number by Class1/
Cows and Heifers That Have Calved Heifers 500 Lbs. and Over
Year
All Cattleand
CalvesAll
CowsBeefCows
MilkCows
Bulls500 Lbs.& Over
BeefReplace-
ment
MilkReplace-
ment Other Total
Steers500 Lbs.& Over
CalvesUnder
500 Lbs.
-----------------------------------------------------------1,000 Head--------------------------------------------------------------------
1975 1,720 745 714 31 46 126 9 84 219 251 459
1980 1,600 665 626 39 46 114 8 105 227 224 438
1985 1,410 620 555 65 41 87 28 78 193 210 346
1990 1,360 660 589 71 40 101 19 60 180 220 260
1995 1,500 730 560 170 45 105 40 110 255 210 260
1999 1,630 790 572 218 50 100 55 145 300 210 280
2000 1,640 800 564 236 50 100 55 135 290 200 300
2001 1,580 800 539 261 50 95 55 130 280 180 270
2002 1,580 790 500 290 50 100 60 110 270 200 270
2003 1,550 780 466 314 45 90 70 110 270 210 245
2004 1,510 780 455 325 45 85 75 105 265 190 230
As of January 1.1/
Cattle and Calves: Commercial Slaughter1999 2000 2001 2002 2003
Number (1,000 Head) 24.6 16.9 17.6 20.4 25.1
Average Live Weight (Pounds) 936 970 959 907 919
Total Live Weight (1,000 Pounds) 22,997 16,439 16,865 18,475 23,107

31 2003 New Mexico Agricultural Statistics
Cattle and Calves: Inventory, Supply, and Disposition
Year
All Cattle
and Calves1/
Calf
Crop Inshipments
Marketings 2/
Farm Slaughter3/
Cattle & Calves
Deaths
Cattle Calves Cattle Calves
------------------------------------------------------------1,000 Head------------------------------------------------------------
1975 1,720 590 938 1,397 114 10 32 45
1980 1,600 600 700 1,313 117 5 30 35
1985 1,410 535 720 1,073 137 5 25 35
1990 1,360 520 860 1,079 260 3 19 39
1995 1,500 590 800 1,045 212 3 23 37
1999 1,630 630 910 1,240 218 3 27 42
2000 1,640 630 1,010 1,333 300 3 26 38
2001 1,580 610 864 1,155 250 3 25 41
2002 1,580 600 672 837 357 3 27 38
2003 1,550 590 840 994 410 2 26 38
Includes cattle on feed in feedlots. Inventory as of January 1.1/
Includes custom slaughter for use on farms where produced, but excludes interfarm sales within the state.2/
Excludes custom slaughter for farmers at commercial establishments.3/
Cattle and Calves: Production, Price, and Income
Year Production Marketings1/ 2/
Price Per 100 PoundsValue of
ProductionCash
Receipts3/Value of
Home UseGross
Cattle Calves Income
----------1,000 Pounds--------- ---------Dollars------ -------------------------1,000 Dollars------------------------
1975 562,460 1,200,900 39.30 27.40 213,274 466,691 4,796 471,487
1980 673,370 1,199,520 64.30 77.60 435,917 777,401 4,325 781,726
1985 667,030 1,044,120 49.40 68.10 339,136 525,787 5,628 531,415
1990 587,530 1,068,800 68.00 96.80 429,827 756,736 5,924 762,660
1995 684,500 1,062,200 52.40 68.80 338,784 568,762 3,359 572,121
1999 701,590 1,195,790 60.00 86.60 389,759 736,610 3,873 740,483
2000 722,280 1,307,480 67.80 101.00 450,935 919,339 4,388 923,727
2001 658,825 1,127,750 69.20 102.00 421,838 807,053 4,449 811,502
2002 538,580 909,155 62.70 93.60 336,873 611,395 4,063 615,458
2003 541,240 1,025,490 69.50 101.00 432,983 757,918 2,717 760,635
Adjustments made for changes in inventory and for inshipments.1/
Excludes custom slaughter for use on farms where produced and interfarm sales within the state.2/
Receipts from marketings and sale of farm slaughter.3/

32 2003 New Mexico Agricultural Statistics
Cattle and Calves: Number on Farms by County1/
District/County All Cattle Beef Cows Milk Cows Other Cattle2/ 3/
--------------------------------------------------------Head------------------------------------------------------------
2003 2004 2003 2004 2003 2004 2003 2004
DISTRICT 10 132,000 126,000 65,000 66,000 7,000 8,000 60,000 52,000
Bernalillo 9,000 9,000 3,000 3,000 3,000 4,000 3,000 2,000
Cibola 15,000 14,000 9,000 9,000 --- --- 6,000 5,000
McKinley 19,000 18,000 10,000 10,000 --- --- 9,000 8,000
Rio Arriba 20,000 19,000 14,000 14,000 --- --- 6,000 5,000
Sandoval 10,000 11,000 7,000 8,000 --- --- 3,000 3,000
San Juan 22,000 20,000 6,000 6,000 --- --- 16,000 14,000
Santa Fe 10,000 11,000 7,000 8,000 --- --- 3,000 3,000
Taos 4,000 4,000 3,000 3,000 --- --- 1,000 1,000
Valencia 23,000 20,000 6,000 5,000 4,000 4,000 13,000 11,000
DISTRICT 30 787,000 773,000 205,000 201,000 115,000 120,000 463,000 448,000
Colfax 38,000 38,000 20,000 20,000 --- --- 18,000 18,000
Curry 197,000 198,000 13,000 13,000 57,000 60,000 127,000 125,000
De Baca 30,000 27,000 16,000 15,000 --- --- 14,000 12,000
Guadalupe 28,000 25,000 15,000 14,000 --- --- 13,000 11,000
Harding 22,000 20,000 12,000 11,000 --- --- 10,000 9,000
Mora 25,000 22,000 10,000 9,000 --- --- 15,000 13,000
Quay 58,000 56,000 26,000 26,000 --- --- 32,000 30,000
Roosevelt 148,000 148,000 18,000 18,000 58,000 60,000 72,000 70,000
San Miguel 38,000 36,000 20,000 20,000 --- --- 18,000 16,000
Torrance 44,000 44,000 21,000 21,000 --- --- 23,000 23,000
Union 155,000 155,000 34,000 34,000 --- --- 121,000 121,000
Other Counties 4,000 4,000 --- --- 4/ 4/ --- ---
DISTRICT 70 181,000 171,000 89,000 85,000 4/ 4/ 77,000 71,000
Catron 26,000 25,000 16,000 16,000 --- --- 10,000 9,000
Grant 32,000 30,000 19,000 18,000 --- --- 13,000 12,000
Hidalgo 26,000 24,000 15,000 14,000 --- --- 11,000 10,000
Luna 31,000 28,000 12,000 11,000 --- --- 19,000 17,000
Sierra 16,000 16,000 8,000 7,000 --- --- 8,000 9,000
Socorro 35,000 33,000 19,000 19,000 --- --- 16,000 14,000
Other Counties 15,000 15,000 --- --- 4/ 4/ --- ---
DISTRICT 90 450,000 440,000 107,000 103,000 173,000 178,000 170,000 159,000
Chaves 178,000 179,000 26,000 26,000 85,000 87,000 67,000 66,000
Doña Ana 79,000 79,000 7,000 7,000 45,000 47,000 27,000 25,000
Eddy 57,000 56,000 15,000 15,000 18,000 19,000 24,000 22,000
Lea 91,000 88,000 31,000 30,000 25,000 25,000 35,000 33,000
Lincoln 29,000 25,000 18,000 16,000 --- --- 11,000 9,000
Otero 16,000 13,000 10,000 9,000 --- --- 6,000 4,000
OTHERCOUNTIES --- --- --- --- 19,000 19,000 --- ---4/
STATE 1,550,000 1,510,000 466,000 455,000 314,000 325,000 770,000 730,000
As of January 1.1/
Milk cow estimates are not made for counties with fewer than 200 head.2/
Includes cattle on feed.3/
Includes Sierra, Socorro, and Torrance counties.4/

33 2003 New Mexico Agricultural Statistics
Cattle and Calves: Number on Feed by County1/
District/County 1999 2000 2001 2002 2003 2004
DISTRICT 30 102,000 100,000 100,000 97,000 103,000 100,000
Curry 51,000 43,000 44,000 41,000 44,000 44,000
Union 51,000 57,000 56,000 56,000 59,000 56,000
OTHER DISTRICTS 16,000 16,000 15,000 11,000 16,000 15,000
STATE 118,000 116,000 115,000 108,000 119,000 115,000
Includes only those animals on full feed for the slaughter market as of January 1.1/
Range and Pasture Feed Condition1/
Year May June July August September October November
--------------------------------------------------------Percent--------------------------------------------------------------
1990 56 47 33 46 74 77 77
1995 37 49 49 56 52 62 602/
1999 60 73 84 94 95 91 83
2000 47 53 54 49 41 28 33
2001 71 62 53 56 50 48 43
2002 16 13 19 26 30 32 35
2003 31 34 32 23 24 21 19
Range and pasture feed condition is expressed as a percentage. 100 percent represents the normal growth and vitality 1/
one would expect if there had been no damage from unfavorable weather, insects, pests, etc. Good to excellent, 80
and over; poor to fair, 65-79; very poor, 50-64; severe drought, 35-49; extreme drought, under 35.
Beginning in 1995, represents the percentage of range and pasture feed rated fair or better.2/

34 2003 New Mexico Agricultural Statistics
2003 MilkPrices Received
Month $/Cwt.
January 11.70
February 11.00
March 10.70
April 10.70
May 10.50
June 10.40
July 11.20
August 12.20
September 14.00
October 14.40
November 14.00
December 13.40
Milk: Production, Disposition, Price, and Income
YearMilk Cows
on Farms1/
Milk Production
Per Cow
Total Milk
Production
Used on
Farms
Whole
Milk
Price Per 100
Pounds
Cash Receipts
from Marketings
Producer Gross
Income
1,000 Head Pounds -------Million Pounds-------- Dollars ----1,000 Dollars----
1975 32 11,438 366 11 355 9.75 37,128 37,860
1980 45 13,378 602 14 588 14.10 84,280 85,570
1985 67 16,090 1,078 12 1,066 13.10 142,904 143,708
1990 81 18,815 1,524 13 1,511 13.40 202,474 203,412
1995 191 18,969 3,623 17 3,606 11.70 430,803 431,759
1999 232 20,362 4,724 28 4,696 14.00 657,440 658,840
2000 250 20,944 5,236 44 5,192 12.40 643,808 645,544
2001 268 20,750 5,561 57 5,504 14.80 814,592 816,812
2002 301 20,983 6,316 65 6,251 11.90 743,869 745,773
2003 317 21,028 6,666 82 6,584 12.00 790,080 792,480
Average number during year.1/

35 2003 New Mexico Agricultural Statistics
2003 Monthly Milk ProductionJan Feb Mar Apr May June July Aug Sept Oct Nov Dec
Cows (1,000) (Average) 314 314 315 315 315 315 316 317 318 318 320 324
Milk Per Cow (Lbs.) 1,720 1,605 1,835 1,810 1,890 1,795 1,795 1,750 1,705 1,745 1,670 1,730
Production (Million Lbs.) 540 504 578 570 595 565 567 555 542 555 534 561
2003 Milk Production by CountyDistrict/County Milk Cows Milk Production Per Cow Total Milk Production1/
----------------Pounds-------------- ----------1,000 Lbs----------
2002 2003 2002 2003 2002 2003
DISTRICT 10 10,000 10,000 19,600 19,900 196,000 199,000
Bernalillo 4,000 4,000 19,000 19,300 76,000 77,000
Valencia 6,000 6,000 20,000 20,300 120,000 122,000
DISTRICT 30 105,000 116,000 20,600 21,000 2,161,000 2,435,000
Curry 52,000 57,000 20,500 21,100 1,067,000 1,200,000
Roosevelt 53,000 59,000 20,600 20,900 1,094,000 1,235,000
DISTRICT 90 171,000 176,000 21,300 21,300 3,639,000 3,740,000
Chaves 86,000 87,000 21,100 21,000 1,813,000 1,830,000
Doña Ana 44,000 46,000 21,900 21,800 965,000 1,001,000
Eddy 17,000 18,000 20,300 20,600 345,000 370,000
Lea 24,000 25,000 21,500 21,600 516,000 539,000
OTHER DISTRICTS 15,000 15,000 21,300 19,500 320,000 292,0002/
STATE 301,000 317,000 20,983 21,028 6,316,000 6,666,000
Average number of cows on farms during year, excluding heifers not yet fresh.1/
Includes Sierra, Socorro, and Torrance counties.2/

36 2003 New Mexico Agricultural Statistics
Sheep and Lambs: Number and Value1/
Year Number
Value
Per Head
Total
Value
1,000 Head Dollars 1,000 Dollars
1975 578 25.50 14,739
1980 660 77.00 50,820
1985 538 55.00 29,590
1990 495 78.00 38,610
1995 365 70.00 25,550
1999 265 76.00 20,140
2000 250 89.00 22,250
2001 200 85.00 17,000
2002 180 80.00 14,400
2003 175 100.00 17,500
2004 160 113.00 18,080
As of January 1.1/
Sheep and Lambs: Commercial Slaughter1999 2000 2001 2002 2003
Number (1,000 Head) 34.9 30.4 29.9 32.1 24.7
Average Live Weight (Pounds) 119.0 115.0 112.0 112.0 104.0
Total Live Weight (1,000 Pounds) 4,163.0 3,490.0 3,355.0 3,577.0 2,567.0

37 2003 New Mexico Agricultural Statistics
Sheep and Lambs: Number on Farms by County1/
District/County 2002 2003 2004
DISTRICT 10 62,000 58,100 52,300
Bernalillo 2,000 2,000 1,000
Cibola 19,000 17,000 16,000
McKinley 24,000 23,000 22,000
Rio Arriba 4,000 5,000 4,000
Sandoval 500 600 2/
San Juan 10,000 8,000 7,000
Santa Fe 500 500 2/
Taos 1,000 1,000 500
Valencia 1,000 1,000 1,000
Other Counties --- --- 800
DISTRICT 30 23,500 24,800 20,650
Colfax 500 500 400
Curry 500 500 400
De Baca 3,000 3,000 2,000
Guadalupe 6,500 6,000 5,000
Mora 700 800 700
Quay 600 700 600
Roosevelt 2,000 2,500 2,000
Torrance 9,000 10,000 9,000
Other Counties 700 800 550
DISTRICT 70 2,000 2,100 2,050
Socorro 1,200 1,300 1,300
Other Counties 800 800 750
DISTRICT 90 92,500 90,000 85,000
Chaves 40,000 41,000 40,000
Doña Ana 1,500 2,000 2,000
Eddy 2,000 2,000 2,000
Lea 4,000 5,000 4,000
Lincoln 33,000 30,000 28,000
Otero 12,000 10,000 9,000
STATE 180,000 175,000 160,000
As of January 11/
Included in Other Counties2/

38 2003 New Mexico Agricultural Statistics
Sheep and Lambs: Inventory, Supply, and Disposition
Lamb Crop Inshipments Marketings2/Farm
Slaughter Deaths 3/
YearTotal Sheep& Lambs Number1/
As % of Ewes1 Yr. & Older
Sheep &Lambs Sheep Lambs
Sheep &Lambs Sheep Lambs
-----1,000 Head----- Percent --------------------------------1,000 Head---------------------------------
1975 578 400 91 119 71 250 33 78 75
1980 660 356 76 132 106 220 30 74 68
1985 538 325 83 44 99 172 23 38 50
1990 495 260 70 37 97 138 25 35 35
1995 365 200 80 7 83 143 9 10 12
1999 265 160 89 13 19 110 8 10 11
2000 250 156 82 8 47 120 8 11 12
2001 200 140 85 9 33 114 7 10 10
2002 180 110 83 8 15 73 7 9 9
2003 175 100 86 9 19 81 7 8 8
Includes sheep on feed. Inventory as of January 1. Beginning in 1995, new crop lambs included in Total Sheep & Lambs.1/
Includes custom slaughter for use on farms where produced, but excludes interfarm sales within the state.2/
Excludes custom slaughter for farmers at commercial establishments.3/
Sheep and Lambs: Production, Price, and Income
Year Production Marketings1/ 2/
Price Per Cwt.Value of
Production
Cash
Receipts3/
Value of
Home Use
Gross
IncomeSheep Lambs
----------1,000 Pounds--------- ---------Dollars-------- ----------------------1,000 Dollars----------------------
1975 20,014 28,005 11.20 40.90 7,978 9,044 745 9,789
1980 17,886 29,506 22.60 61.90 9,984 13,514 1,166 14,680
1985 21,577 25,090 28.00 68.80 13,406 13,341 1,396 14,737
1990 17,495 21,170 26.40 50.20 7,781 8,545 1,454 9,999
1995 16,479 21,270 28.00 77.20 10,739 12,288 779 13,067
1999 13,111 10,980 35.00 75.00 8,721 7,803 765 8,568
2000 12,086 15,240 41.00 79.70 8,966 10,428 871 11,299
2001 11,029 13,020 35.10 67.30 6,926 7,874 707 8,581
2002 7,469 7,170 31.80 75.50 5,250 5,151 685 5,836
2003 7,579 8,370 37.00 89.20 6,230 6,902 801 7,703
Adjustments made for changes in inventory and for inshipments.1/
Excludes custom slaughter for use on farms where produced and interfarm sales within the state.2/
Receipts from marketings and sale of farm slaughter.3/

39 2003 New Mexico Agricultural Statistics
Wool: Production and Value
YearSheepShorn
AverageWeight
ofFleece
Produc-tion
PricePer
Pound Value
1,000Head Pounds
1,000Pound Cents
1,000Dollars
1975 520 9.8 5,120 52 2,662
1980 555 9.2 5,080 90 4,572
1985 522 9.2 4,819 72 3,470
1990 453 9.8 4,422 107 4,732
1995 340 8.8 3,000 117 3,510
1999 245 8.6 2,100 56 1,176
2000 195 9.2 1,800 65 1,170
2001 175 8.6 1,500 70 1,050
2002 170 8.1 1,380 80 1,104
2003 160 7.8 1,240 110 1,364
Sheep and Lambs: Number on Farms by Class1/
Year
Total Sheep
& Lambs
Breeding Sheep & Lambs Market Sheep & Lambs
Ewes Rams Lambs Lambs Sheep
---------------------------------------------------1,000 Head------------------------------------------------------------
1975 578 440 22 88 --- 28
1980 660 468 23 104 --- 65
1985 538 391 19 76 --- 52
1990 495 373 21 79 --- 22
1995 365 250 15 50 47 3
1999 265 175 10 30 47 3
2000 250 170 10 25 43 2
2001 200 130 9 21 38 2
2002 180 150 7 18 33 2
2003 175 115 7 18 33 2
As of January 1. 1/

40 2003 New Mexico Agricultural Statistics
Hogs and Pigs: Inventory, Supply, and DispositionPig Crop
December - November1/
Year Total Hogs Sows Farrowed Pigs Per Litter Pigs Saved Inshipments Marketings Farm Slaughter Deaths2/ 3/
-----------1,000 Head----------- Number -------------------------------------1,000 Head------------------------------------
1975 53 13.2 6.52 86.0 4.0 89.0 4.0 7
1980 74 15.0 7.33 110.0 4.0 81.0 4.0 7
1985 38 8.4 7.50 63.0 2.0 56.0 2.0 4
1990 27 5.6 7.64 42.8 2.2 39.0 1.0 3
1995 25 4.0 6.75 27.0 4.0 49.0 1.0 1
1999 6 1.1 7.45 8.2 6.0 13.0 1.0 .2
2000 6 0.8 7.25 5.8 3.0 10.7 1.0 .1
2001 3 0.5 7.00 3.5 3.4 5.8 1.0 .1
2002 3 .4 7.25 2.9 3.4 5.2 1.0 .1
2003 2.5 .4 7.50 3.0 3.4 5.8 1.0 .1
December previous year.1/
Inventory as of December 1, previous year.2/
Includes custom slaughter for use on farms where produced, but excludes interfarm sales within the state.3/
Hogs and Pigs: Production, Price, and Income
Year Production Marketings1/Price
Per Cwt.Value of
ProductionCash
Receipts 2/Value of
Home Use Gross Income
---1,000 Pounds Live Weight--- Dollars --------------------------1,000 Dollars-----------------------------
1975 19,357 19,891 47.80 9,244 9,525 658 10,183
1980 20,334 17,367 39.10 7,951 6,864 437 7,301
1985 12,994 11,858 45.50 5,959 5,482 501 5,983
1990 8,441 7,831 50.70 4,298 4,059 190 4,249
1995 7,595 9,925 40.90 3,074 4,165 172 4,337
1999 1,859 2,000 30.30 492 675 127 802
2000 1,211 1,658 37.60 408 687 158 845
2001 1,167 1,080 39.20 333 423 165 588
2002 964 945 28.50 231 269 120 389
2003 1,102 1,080 34.50 294 373 145 518
Excludes custom slaughter for use on farms where produced and interfarm sales within the state. 1/
Receipts from marketings and sale of farm slaughter. 2/

41 2003 New Mexico Agricultural Statistics
Angora Goats: Inventory
1997 1998 1999 2000 2001 2002 2003 2004
Number (1,000 Head) 68 45 38 30 25 20 15 10
Mohair: Production, Price, and Value
Year Goats ClippedAverage Clip
Per Goat Production Price Per PoundValue of
Production
1,000 Head Pounds 1,000 Pounds Dollars 1,000 Dollars
1995 85 4.0 340 1.66 564
1999 35 5.5 193 1.85 357
2000 25 5.5 138 1.90 262
2001 20 5.5 110 1.90 209
2002 15 6.0 90 1.40 126
2003 10 6.0 60 1.25 75

42 2003 New M exico Agricultural Statistics
FIELD CROPS
HAY
Harvested acreage for alfalfa declined in 2003to 230,000 acres. Due to drought conditions,the average yield for alfalfa decreased to 4.9tons per acre, producing 1.13 million tons. Thevalue of production for all hay was $185.6million, a 21 percent drop from 2002 as theaverage price increased to $144 per ton.
SORGHUM
New Mexico’s sorghum acreage harvested forgrain decreased to 62,000 acres compared to80,000 harvested in 2002. Yields averaged 27bushels per acre for a total production of 1.7million bushels compared to the 2.8 millionbushels produced a year earlier. The averageprice increased to $2.49 per bushel. Totalvalue of production was $4.2 million, adecrease from the $6.9 million in 2002. Anestimated 10,000 acres were harvested forsilage with an average yield of 15 tons per acreproducing 150,000 tons overall.
CORN
Corn for grain production in New Mexicodropped slightly to 8.6 million bushels.Harvested acreage decreased to 48,000 acres,1,000 acres less than 2002. Average yieldsmatched the previous year’s record at 180bushels per acre. The average price increasedto $2.90 per bushel bringing the value ofproduction to $25 million, just above 2002. Atotal of 80,000 acres of corn were harvested forsilage with an average yield of 23 tons per acre.Total production of silage in the state came to1.8 million tons.
WHEAT
New Mexico’s winter wheat production shiftedupward to 4.2 million bushels in 2003.Harvested acreage decreased to 140,000 acresfrom 150,000 acres a year earlier. The averageyield was 30 bushels per acre, an increase of 4bushels per acre from 2002. The value of thewheat crop was $13.4 million with the averageannual price dropping to $3.20 per bushel.
PEANUTS
Peanut acreage decreased to 17,000 acresharvested in 2003. Yields dropped slightlyfrom 2002 to 2,700 pounds per acre.Production was 54 million pounds, 13 millionpounds below the harvest in 2001. Crop valuetook a big drop from $10.3 million in 2002 to$8.7 million in 2003 with the average priceholding steady at $.19 per pound.
COTTON
Upland cotton producers harvested 38,000 acresin 2003, 24 percent less than 2002. Yieldsaveraged 884 pounds per acre, the secondhighest yield on record. Total production wasestimated at 70,000 bales, 18 percent less thana year earlier. The average price increased,averaging $.63 per pound. Total value alsoincreased to $23 million. American-Pimaharvested acreage, at 6,000 acres, wassignificantly less than the 7,100 acres harvestedin 2002. Yields, at a record-high 1,056 poundsper acre, resulted in total production of 13,200bales. The value of the crop was placed at $5.6million with prices averaging $1.06 per pound.
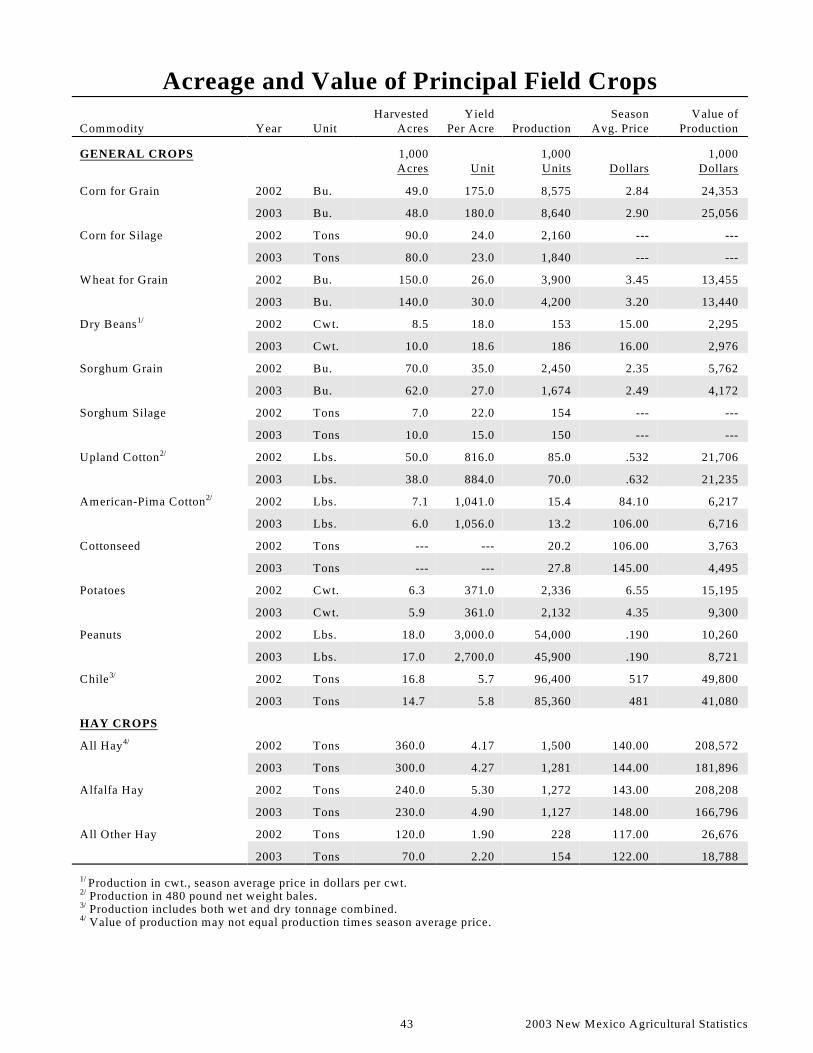
43 2003 New Mexico Agricultural Statistics
Acreage and Value of Principal Field Crops
Commodity Year UnitHarvested
AcresYield
Per Acre ProductionSeason
Avg. PriceValue of
Production
GENERAL CROPS 1,000Acres Unit
1,000Units Dollars
1,000 Dollars
Corn for Grain 2002 Bu. 49.0 175.0 8,575 2.84 24,353
2003 Bu. 48.0 180.0 8,640 2.90 25,056
Corn for Silage 2002 Tons 90.0 24.0 2,160 --- ---
2003 Tons 80.0 23.0 1,840 --- ---
Wheat for Grain 2002 Bu. 150.0 26.0 3,900 3.45 13,455
2003 Bu. 140.0 30.0 4,200 3.20 13,440
Dry Beans 2002 Cwt. 8.5 18.0 153 15.00 2,2951/
2003 Cwt. 10.0 18.6 186 16.00 2,976
Sorghum Grain 2002 Bu. 70.0 35.0 2,450 2.35 5,762
2003 Bu. 62.0 27.0 1,674 2.49 4,172
Sorghum Silage 2002 Tons 7.0 22.0 154 --- ---
2003 Tons 10.0 15.0 150 --- ---
Upland Cotton 2002 Lbs. 50.0 816.0 85.0 .532 21,7062/
2003 Lbs. 38.0 884.0 70.0 .632 21,235
American-Pima Cotton 2002 Lbs. 7.1 1,041.0 15.4 84.10 6,2172/
2003 Lbs. 6.0 1,056.0 13.2 106.00 6,716
Cottonseed 2002 Tons --- --- 20.2 106.00 3,763
2003 Tons --- --- 27.8 145.00 4,495
Potatoes 2002 Cwt. 6.3 371.0 2,336 6.55 15,195
2003 Cwt. 5.9 361.0 2,132 4.35 9,300
Peanuts 2002 Lbs. 18.0 3,000.0 54,000 .190 10,260
2003 Lbs. 17.0 2,700.0 45,900 .190 8,721
Chile 2002 Tons 16.8 5.7 96,400 517 49,8003/
2003 Tons 14.7 5.8 85,360 481 41,080
HAY CROPS
All Hay 2002 Tons 360.0 4.17 1,500 140.00 208,5724/
2003 Tons 300.0 4.27 1,281 144.00 181,896
Alfalfa Hay 2002 Tons 240.0 5.30 1,272 143.00 208,208
2003 Tons 230.0 4.90 1,127 148.00 166,796
All Other Hay 2002 Tons 120.0 1.90 228 117.00 26,676
2003 Tons 70.0 2.20 154 122.00 18,788
Production in cwt., season average price in dollars per cwt. 1/
Production in 480 pound net weight bales.2/
Production includes both wet and dry tonnage combined.3/
Value of production may not equal production times season average price.4/

44 2003 New Mexico Agricultural Statistics
Wheat: Acreage, Production, Price, and Value
Year
AcreageYield
Per Acre Production
Price
Per Bushel
Value of
Planted Harvested1/ Production
1,000
Acres
1,000
Acres Bushels
1,000
Bushels Dollars
1,000
Dollars
1975 505 440 26.0 11,440 3.52 40,269
1980 650 500 21.0 10,500 3.76 39,480
1985 730 570 36.0 20,520 2.90 59,508
1990 520 300 27.0 8,100 2.79 22,599
1995 460 150 22.0 3,300 4.50 14,850
1999 445 280 38.0 10,640 2.40 25,536
2000 470 175 24.0 4,200 2.70 11,340
2001 500 240 34.0 8,160 2.75 22,440
2002 480 150 26.0 3,900 3.45 13,455
2003 500 140 30.0 4,200 3.20 13,440
Includes acres planted in preceding fall.1/

Wheat: Acreage, Yield, and Production by County2002
District/County
Planted All Purposes Harvested for Grain
-------------Acres------------- -------------Acres------------- --Yield Per Acre (Bu.)-- ----Production (1,000 Bu.) ----1/
IrrigNon-Irrig Total Irrig
Non-Irrig Total Irrig
Non-Irrig Total Irrig
Non-Irrig Total
DISTRICT 10 11,200 1,600 12,800 6,700 --- 6,700 67.0 --- 67.0 448.9 --- 448.9
Rio Arriba 100 500 600 --- --- --- --- --- --- --- --- ---
San Juan 9,000 200 9,200 5,500 --- 5,500 70.0 --- 70.0 385.0 --- 385.0
Other Counties 2,100 900 3,000 1,200 900 1,800 53.3 --- 53.3 63.9 --- 63.9
DISTRICT 30 152,300 285,200 437,500 42,900 91,900 134,800 40.7 14.4 22.8 1,747.7 1,325.6 3,073.3
Curry 65,000 130,000 195,000 20,000 45,000 65,000 37.0 17.0 23.2 740.0 765.0 1,505.0
De Baca 1,300 200 1,500 100 --- 100 65.0 --- 65.0 6.5 --- 6.5
Quay 10,000 75,000 85,000 800 15,000 15,800 15.0 10.0 10.3 12.0 150.0 162.0
Roosevelt 47,000 76,000 123,000 10,800 30,500 41,300 33.0 12.0 17.5 356.0 366.0 722.4
Torrance 2,500 200 2,700 200 100 300 60.0 30.0 50.0 12.0 3.0 15.0
Union 25,000 3,000 28,000 10,600 1,300 11,900 57.0 32.0 54.3 604.0 41.6 645.8
Other Counties 1,500 800 2,300 400 --- 400 41.5 --- 41.5 16.6 --- 16.6
DISTRICT 70 4,900 200 5,100 2,300 --- 2,300 69.6 --- 69.6 160.0 --- 160.0
Luna 3,000 --- 3,000 2,000 --- 2,000 73.0 --- 73.0 146.0 --- 146.0
Other Counties 1,900 200 2,100 300 --- 300 46.7 --- 46.8 14.0 --- 14.0
DISTRICT 90 19,600 5,000 24,600 5,700 500 6,200 36.5 20.0 35.1 207.8 10.0 217.8
Chaves 2,200 200 2,400 2,100 --- 2,100 22.0 --- 22.0 46.2 --- 46.2
Doña Ana 1,200 --- 1,200 600 --- 600 98.0 --- 98.0 58.8 --- 58.8
Lea 15,000 4,700 19,700 2,800 500 3,300 33.0 20.0 31.0 92.4 10.0 102.4
Other Counties 1,200 100 1,300 200 --- 200 52.0 --- 52.0 10.4 --- 10.4
STATE 188,000 292,000 480,000 57,600 92,400 150,000 44.5 14.5 26.0 2,564.4 1,335.6 3,900.0
2003
District/County
Planted All Purposes Harvested for Grain
-------------Acres------------- -------------Acres------------- --Yield Per Acre (Bu.)-- ----Production (1,000 Bu.)----
IrrigNon-Irrig Total Irrig
Non-Irrig Total Irrig
Non-Irrig Total Irrig
Non-Irrig Total
DISTRICT 10 13,700 1,400 15,100 8,200 --- 8,200 90.7 --- 90.7 743.7 --- 743.7
Rio Arriba 100 1,000 1,100 --- --- --- --- --- --- --- --- ---
San Juan 11,900 100 12,000 7,700 100 7,700 93.0 --- 93.0 716.1 --- 716.1
Other Counties 1,700 300 2,000 500 --- 500 55.2 --- 55.2 27.6 --- 27.6
DISTRICT 30 156,600 302,400 459,000 50,000 78,500 128,500 43.5 13.1 24.9 2,174.2 1,031.5 3,205.7
Curry 65,000 137,000 202,000 18,000 28,000 46,000 39.0 16.0 25.0 702.0 448.0 1,150.0
De Baca 1,800 200 2,000 --- --- --- --- --- --- --- --- ---
Harding 800 300 1,100 --- --- --- --- --- --- --- --- ---
Quay 6,200 71,000 77,200 1,500 7,000 8,500 38.0 12.0 16.6 57.0 84.0 141.0
Roosevelt 51,000 88,000 139,000 51,000 42,000 57,000 34.0 11.0 17.1 510.0 462.0 972.0
Union 29,000 4,000 33,000 15,000 1,500 16,500 58.0 25.0 55.0 870.0 37.5 907.5
Other Counties 2,800 1,900 4,700 500 --- 500 70.4 --- 70.4 35.2 --- 35.2
DISTRICT 70 4,000 200 4,200 1,800 --- 1,800 97.2 --- 97.2 175.0 --- 175.0
Luna 2,500 --- 2,500 1,700 --- 1,700 100.0 --- 100.0 170.0 --- 170.0
Other Counties 1,500 200 1,700 100 --- 100 50.0 --- 50.0 5.0 --- 5.0
DISTRICT 90 18,600 3,100 21,700 1,200 300 1,500 60.0 12.0 50.4 72.0 3.6 75.6
Lea 15,100 2,800 17,900 1,000 300 1,300 51.0 12.0 42.0 51.0 3.6 54.6
Other Counties 3,500 300 3,800 200 --- 200 105.0 --- 105.0 21.0 --- 21.0
STATE 192,900 307,100 500,000 61,200 78,800 140,000 51.7 13.1 30.0 3,164.9 1,035.1 4,200.0
45 2003 New Mexico Agricultural Statistics

46 2003 New Mexico Agricultural Statistics
All Hay: Acreage, Production, Price, Value, and Stocks1/
CropYear
AcreageHarvested
Yield Per Acre Production
Price Per Ton
Value ofProduction2/
On Farm Stocks
Dec 1 May 1
1,000 Acres Tons 1,000 Tons Dollars 1,000 Dollars 1,000 Tons
1975 290 3.59 1,041 54.00 56,214 370 80
1980 310 3.69 1,144 86.50 98,956 456 108
1985 340 4.38 1,488 80.00 119,040 432 119
1990 320 4.30 1,376 111.00 153,840 482 138
1995 345 4.17 1,440 113.00 162, 575 576 50
1999 380 4.49 1,706 113.00 193,540 595 170
2000 380 4.39 1,670 122.00 205,352 600 185
2001 380 4.19 1,592 124.00 189,694 600 75
2002 360 4.17 1,500 140.00 208,572 550 65
2003 300 4.27 1,281 144.00 185,584 525 98 Dry hay only. Excludes silage and green chop.1/
Sum of Alfalfa and All Other Hay; value may not equal production times price.2/
All Hay: Acreage, Yield, and Production by County 1/
----------------------------2002------------------------- --------------------------------2003----------------------------
District/County Acreage Harvested
Yield Per Acre
Production
Acreage Harvested
Yield Per Acre Production
Acres Tons Tons Acres Tons Tons
DISTRICT 10 81,600 3.56 290,640 74,900 3.19 238,940 Bernalillo 7,500 5.04 37,800 4,800 5.07 24,320 Cibola 1,700 3.14 5,340 800 2.75 2,200 McKinley 1,300 1.77 2,300 1,700 0.85 1,450 Rio Arriba 12,000 1.17 14,000 11,500 1.21 13,900 Sandoval 4,100 3.15 12,900 3,400 2.49 8,480 San Juan 24,000 4.87 116,800 26,800 3.99 106,800 Santa Fe 8,000 4.05 32,400 8,500 3.46 29,410 Taos 11,000 1.32 14,500 7,000 1.31 9,200 Valencia 12,000 4.55 54,600 10,400 4.15 43,180
DISTRICT 30 135,000 2.57 347,400 102,700 3.08 316,390
Colfax 10,200 1.83 18,660 10,000 2.00 20,000 Curry 24,000 2.58 62,000 17,000 3.54 60,200 De Baca 7,500 4.68 35,100 7,700 5.05 38,850 Guadalupe 1,500 2.00 3,000 1,000 2.10 2,100 Harding 1,100 1.45 1,600 1,300 2.00 2,600 Mora 6,000 1.45 8,700 6,000 1.00 6,000 Quay 18,900 1.30 24,620 13,400 1.94 25,960 Roosevelt 40,000 2.79 111,500 26,000 3.13 81,300 San Miguel 5,000 0.98 4,900 4,700 1.83 8,580 Torrance 11,000 3.96 43,600 9,200 4.52 41,600 Union 9,800 3.44 33,720 6,400 4.56 29,200
DISTRICT 70 23,000 4.95 113,890 17,100 5.56 95,080
Catron 2,200 3.80 8,350 1,100 4.18 4,600 Grant 1,000 2.85 2,850 600 1.67 1,000 Hidalgo 1,500 3.57 5,350 1,400 4.40 6,160 Luna 3,000 5.60 16,800 3,200 7.28 23,300 Sierra 4,100 6.07 24,900 3,100 6.72 20,820 Socorro 11,200 4.97 55,640 7,700 5.09 39,200
DISTRICT 90 120,400 6.21 748,070 105,300 5.99 630,590
Chaves 51,500 6.16 317,150 34,700 5.78 200,520 Doña Ana 20,200 7.65 154,520 22,100 7.19 158,920 Eddy 32,000 6.29 201,200 35,600 5.62 199,950 Lea 14,000 4.75 66,500 11,000 5.75 63,200 Lincoln 300 2.67 800 200 1.90 380 Otero 2,400 3.29 7,900 1,700 4.48 7,620STATE 360,000 4.17 1,500,000 300,000 4.27 1,281,000
Dry hay only. Excludes silage and green chop.1/

47 2003 New Mexico Agricultural Statistics
Alfalfa and Other Hay: Acreage, Yield, and Production1/
-------------------------Alfalfa Hay------------------------ -------------------------All Other Hay------------------------
YearAcreage
HarvestedYield
Per Acre Production Acreage Harvested
Yield Per Acre Production
1,000Acres Tons
1,000 Tons
1,000Acres Tons
1,000Tons
1975 219 4.30 942 71 1.40 99
1980 240 4.30 1,032 70 1.60 112
1985 260 5.20 1,352 80 1.70 136
1990 250 5.00 1,250 70 1.80 126
1995 245 5.10 1,250 100 1.90 190
1999 290 5.20 1,508 90 2.20 198
2000 290 5.20 1,508 100 1.80 180
2001 260 5.00 1,300 110 2.20 242
2002 240 5.30 1,272 120 1.90 228
2003 230 4.90 1,127 70 2.20 154
Dry hay only. Excludes silage and green chop.1/
Alfalfa Hay: Acreage, Yield, and Production by County1/
----------------------------2002----------------------------- ----------------------------2003--------------------------------
District/CountyAcreage
HarvestedYield
Per Acre ProductionAcreage
HarvestedYield
Per Acre Production
Acres Tons Tons Acres Tons Tons
DISTRICT 10 66,000 4.02 265,000 62,500 3.35 209,330
Bernalillo 6,000 5.50 33,000 4,000 5.30 21,200 Cibola 900 3.00 2,700 700 3.00 2,100 McKinley 1,000 2.00 2,000 1,500 0.90 1,350 Rio Arriba 8,000 1.50 12,000 7,500 1.00 7,500 Sandoval 3,100 4.00 12,400 3,000 2.60 7,800 San Juan 22,000 5.00 110,000 24,000 4.10 98,400 Santa Fe 6,000 4.90 29,400 6,800 3.60 24,480 Taos 9,000 1.50 13,500 6,000 1.30 7,800 Valencia 10,000 5.00 50,000 9,000 4.30 38,700
DISTRICT 30 53,200 3.95 210,300 56,500 4.13 233,380 Colfax 7,000 2.30 16,100 7,000 2.30 16,100 Curry 4,000 7.00 28,000 6,000 6.00 36,000 De Baca 6,000 5.10 30,600 7,000 5.20 36,400 Guadalupe 1,000 2.00 2,000 900 2.00 1,800 Harding 700 2.00 1,400 1,000 2.00 2,000 Mora 3,000 2.30 6,900 3,000 1.00 3,000 Quay 9,500 1.80 17,100 9,000 2.20 19,800 Roosevelt 7,000 6.50 45,500 9,000 6.20 55,800 San Miguel 3,000 1.30 3,900 3,200 2.40 7,680 Torrance 9,000 4.60 41,400 8,000 4.90 39,200 Union 3,000 5.80 17,400 2,400 6.50 15,600DISTRICT 70 18,200 5.51 100,200 15,100 5.97 90,200 Catron 1,700 4.50 7,650 1,000 4.30 4,300 Grant 500 2.90 1,450 400 2.00 800 Hidalgo 1,000 4.90 4,900 1,000 5.00 5,000 Luna 2,000 6.40 12,800 2,700 8.00 21,600 Sierra 4,000 6.20 24,800 3,000 6.90 20,700 Socorro 9,000 5.40 48,600 7,000 5.40 37,800DISTRICT 90 102,600 6.79 696,500 95,900 6.19 594,090 Chaves 45,000 6.60 297,000 31,000 5.80 179,800 Doña Ana 19,000 8.00 152,000 21,000 7.40 155,400 Eddy 30,000 6.50 195,000 34,500 5.70 196,650 Lea 7,000 6.50 45,500 8,000 7.00 56,000 Lincoln 200 3.50 700 100 2.60 260 Otero 1,400 4.50 6,300 1,300 4.60 5,980
STATE 240,000 5.30 1,272,000 230,000 4.90 1,127,000
Dry hay only. Excludes silage and green chop.1/

48 2003 New Mexico Agricultural Statistics
Sorghum: Acreage, Production, Price, and ValueHarvested for Grain Harvested for Silage
Crop
Year
Planted
for All
Purposes Acreage Yield Production
Price
Per
Bushel
Value of
Production Acreage Yield Production
1,000
Acres
1,000
Acres Bushels
1,000
Bushels Dollars
1,000
Dollars
1,000
Acres Tons
1,000
Tons
1975 353 310 50.0 15,500 2.46 38,130 3 13.0 39
1980 340 257 40.0 10,280 3.42 35,158 11 12.5 138
1985 305 290 48.0 13,920 2.34 32,573 1 12.0 12
1990 140 50 65.0 3,250 2.38 7,735 3 12.0 36
1995 235 130 26.0 3,380 3.23 10,917 8 12.0 96
1999 150 135 55.0 7,425 1.83 13,597 10 16.0 160
2000 165 65 25.0 1,625 2.20 3,576 5 18.0 90
2001 170 140 45.0 6,300 2.10 13,230 8 22.0 176
2002 170 80 35.0 2,800 2.35 5,762 7 22.0 154
2003 140 62 27.0 1,674 2.49 4,172 10 15.0 150

49 2003 New Mexico Agricultural Statistics
Sorghum: Acreage, Yield, and Production by County
2002 Planted All Purposes Harvested for Grain
--------------Acres-------------- --------------Acres-------------- -Yield Per Acre (Bu.)- ---Production (1,000 Bu.)---
District/County Irrig
Non-
Irrig Total Irrig
Non-
Irrig Total Irrig
Non-
Irrig Total Irrig
Non-
Irrig Total
DISTRICT 10 600 --- 600 100 --- 100 79.0 --- 79.0 7.9 --- 7.9
DISTRICT 30 25,300 134,900 160,200 16,600 49,000 65,600 55.6 24.8 32.6 922.5 1,216.5 2,139.0
Curry 14,000 74,000 88,000 10,000 20,000 30,000 56.0 23.0 34.0 560.0 460.0 1,020.0
Quay 1,300 14,800 16,100 400 5,500 5,900 35.0 23.0 23.8 14.0 126.5 140.5
Roosevelt 7,000 45,000 52,000 7,000 23,200 28,800 55.0 27.0 32.4 308.0 626.4 934.4
Union 1,700 1,000 2,700 1,700 1,000 7,100 35.0 12.0 17.8 3.5 3.6 7.1
Other Counties 1,300 100 1,400 500 --- 500 74.0 --- 74.0 37.0 --- 37.0
DISTRICT 70 2,800 --- 2,800 2,500 --- 2,500 98.6 --- 98.6 246.5 --- 246.5
Luna 2,200 --- 2,200 2,100 --- 2,100 100.0 --- 100.0 210.0 --- 210.0
Other Counties 600 --- 600 400 --- 400 91.3 --- 91.3 36.5 --- 36.5
DISTRICT 90 4,700 1,700 6,400 1,100 700 1,800 35.6 25.0 31.4 39.1 17.5 56.6
Chaves 2,100 --- 2,100 200 --- 200 26.0 --- 26.0 5.2 --- 5.2
Eddy 1,600 1,000 2,600 100 --- 100 40.0 --- 40.0 4.0 --- 4.0
Lea 700 700 1,000 700 700 1,400 32.0 25.0 28.5 22.4 17.5 39.9
Other Counties 300 --- 300 100 --- 100 75.0 --- 75.0 7.5 --- 7.5
STATE 33,400 136,600 170,000 20,300 49,700 70,000 59.9 24.8 35.0 1,216.0 1,234.0 2,450.0
2003 Planted All Purposes Harvested for Grain
--------------Acres-------------- --------------Acres-------------- -Yield Per Acre (Bu.)- ---Production (1,000 Bu.)---
District/County Irrig
Non-
Irrig Total Irrig
Non-
Irrig Total Irrig
Non-
Irrig Total Irrig
Non-
Irrig Total
DISTRICT 10 2,800 --- 2,800 --- --- --- --- --- --- --- --- ---
DISTRICT 30 23,400 102,300 125,700 12,800 45,600 58,400 58.6 13.3 23.3 750.4 608.4 1,358.8
Curry 12,000 55,000 67,000 7,800 15,200 23,000 75.0 15.0 35.3 585.0 228.0 813.0
Quay 1,000 8,200 9,200 600 2,000 2,600 37.0 12.0 17.8 22.2 24.0 46.2
Roosevelt 5,500 38,000 43,500 2,600 28,000 30,600 26.0 12.5 13.6 67.6 350.0 417.6
San Miguel 1,000 --- 1,000 --- --- --- --- --- --- --- --- ---
Union 3,000 1,000 4,300 1,800 400 2,200 42.0 16.0 37.3 75.6 6.4 82.0
Other Counties 600 100 700 --- --- --- --- --- --- --- --- ---
DISTRICT 70 3,400 --- 3,400 2,800 --- 2,800 94.0 --- 94.0 263.2 --- 263.2
Luna 2,700 --- 2,700 2,500 --- 2,500 94.0 --- 94.0 235.0 --- 235.0
Other Counties 700 --- 700 300 --- 300 94.0 --- 94.0 28.2 --- 28.2
DISTRICT 90 7,200 900 8,100 800 --- 800 65.0 --- 65.0 52.0 --- 52.0
Doña Ana 1,400 --- 1,400 --- --- --- --- --- --- --- --- ---
Other Counties 5,800 900 6,700 800 --- 800 65.0 --- 65.0 52.0 --- 52.0
STATE 36,800 103,200 140,000 16,400 45,600 62,000 65.0 13.3 27.0 1,065.6 608.4 1,674.0

Corn: Acreage, Production, Price, and ValueHarvested for Grain Harvested for Silage
CropYear
Plantedfor All
Purposes AcreageYield
Per Acre Production
PricePer
BushelValue of
Production AcreageYield
Per Acre Production
1,000Acres
1,000Acres Bushels
1,000Bushels Dollars
1,000Dollars
1,000Acres Tons
1,000 Tons
1975 100 75 100.0 7,500 2.62 19,650 22 16.5 363
1980 105 75 90.0 6,750 3.60 24,300 26 14.0 364
1985 92 65 155.0 10,075 2.67 26,900 25 23.0 575
1990 85 55 145.0 7,975 2.67 21,293 27 19.0 513
1995 123 73 160.0 11,680 2.95 34,456 49 18.0 882
1999 150 83 180.0 14,940 2.41 36,005 65 24.0 1,560
2000 150 66 160.0 10,560 2.52 26,611 82 23.0 1,886
2001 130 46 180.0 8,280 2.40 19,872 82 23.0 1,886
2002 140 49 175.0 8,575 2.84 24,353 90 24.0 2,160
2003 130 48 180.0 8,640 2.90 25,056 80 23.0 1,840
Corn Silage: Acreage, Yield, and Production by County-------------------------2002------------------------- --------------------------2003-------------------------
District/County
Acreage
Harvested
Yield
Per Acre Production
Acreage
Harvested
Yield
Per Acre Production
--------------Tons--------------- ---------------Tons-------------
DISTRICT 10 7,000 18.4 129,000 7,700 20.4 156,800
Santa Fe 6,000 19.0 114,000 1/ 1/ 1/
Other Counties 1,000 15.0 15,000 7,700 20.4 156,800
DISTRICT 30 40,200 25.3 1,017,580 30,750 23.8 732,655
Curry 17,500 26.0 455,000 9,800 24.5 240,100
Roosevelt 15,500 25.0 387,500 14,100 21.3 300,330
Torrance 5,200 25.4 132,080 1/ 1/ 1/
Union 2,000 21.5 43,000 1,700 30.0 51,000
Other Counties --- --- --- 5,150 27.4 141,225
DISTRICT 70 4,400 23.7 104,420 4,250 23.9 101,685
Sierra 1,000 24.0 24,700 900 20.3 18,270
Socorro 300 19.8 5,940 1/ 1/ 1/
Other Counties 3,100 23.8 73,780 3,350 24.9 83,415
DISTRICT 90 38,400 23.7 909,000 37,300 22.8 848,860
Chaves 17,400 24.0 417,600 19,800 23.5 465,300
Doña Ana 12,600 23.0 289,800 10,400 23.0 239,200
Eddy 1,600 24.0 38,400 1/ 1/ 1/
Lea 6,800 24.0 163,200 1/ 1/ 1/
Other Counties --- --- --- 7,100 20.3 144,360
STATE 90,000 24.0 2,160,000 80,000 23.0 1,840,000
Included in Other Counties.1/
50 2003 New Mexico Agricultural Statistics

51 2003 New Mexico Agricultural Statistics
Corn: Acreage, Yield, and Production by County-------------------------2002------------------------ -------------------------2003---------------------------
District/County
Planted for all
Purposes
Harvestedfor Grain
Yield Per
Acre Production
Plantedfor all
Purposes
Harvested for Grain
Yield Per
Acre Production
----------Acres---------- ---------Bushels---------- ----------Acres---------- ---------- Bushels---------
DISTRICT 10 20,400 13,200 137.8 1,819,600 20,700 12,300 185.9 2,287,180
Sandoval 400 400 69.0 27,600 1/ 1/ 1/ 1/
San Juan 12,800 12,800 140.0 1,792,000 1/ 1/ 1/ 1/
Santa Fe 6,000 --- --- --- 1/ --- --- ---
Other Counties 1,200 --- --- --- 20,700 12,300 185.9 2,287,180
DISTRICT 30 73,900 33,200 189.7 6,297,700 65,200 33,200 180.8 6,003,735
Curry 24,000 6,500 189.0 1,228,500 24,000 14,200 160.7 2,281,940
Roosevelt 17,500 2,000 130.0 260,000 16,500 2,400 110.0 264,000
Torrance 5,900 500 114.0 57,000 1/ 1/ 1/ 1/
Union 25,500 23,500 198.0 4,653,000 19,000 16,100 210.2 3,384,220
Other Counties 1,000 700 141.7 99,200 5,700 500 147.2 73,575
DISTRICT 70 7,000 2,600 176.0 457,700 6,600 2,350 139.9 328,835
Hidalgo 2,500 2,500 180.0 450,000 1/ 1/ 1/ 1/
Sierra 1,000 --- --- --- 900 --- --- ---
Socorro 300 --- --- --- 1/ --- --- ---
Other Counties 3,200 100 77.0 7,700 5,700 2,350 139.9 328,835
DISTRICT 90 38,700 --- --- --- 37,500 150 135.0 20,250
Chaves 17,400 --- --- --- 19,800 --- --- ---
Doña Ana 12,600 --- --- --- 10,400 --- --- ---
Eddy 1,700 --- --- --- 1/ --- --- ---
Lea 7,000 --- --- --- 1/ --- --- ---
Other Counties --- --- --- --- 7,300 150 135.0 20,250
STATE 140,000 49,000 175.0 8,575,000 130,000 48,000 180.0 8,640,000
Included in Other Counties.1/

52 2003 New Mexico Agricultural Statistics
Upland Cotton: Acreage, Production, Price, and Value
Crop
Year
AcreageYield
Per Acre
Production
(480-Pound Net
Weight Bales)
Price Per
Pound
Value of
Planted Harvested Production
1,000 Acres 1,000 Acres Net Pounds 1,000 Bales Cents 1,000 Dollars
1975 95.0 85.0 382 68.0 54.60 17,821
1980 151.0 120.0 428 107.0 81.00 41,602
1985 70.0 54.0 631 71.0 57.60 19,630
1990 69.0 62.0 735 95.0 70.90 32,330
1995 61.0 56.0 609 71.0 81.70 27,843
1999 84.0 79.0 662 109.0 47.10 24,643
2000 72.0 67.0 724 101.0 53.10 25,743
2001 68.0 65.0 916 124.0 34.10 20,296
2002 54.0 50.0 816 85.0 53.20 21,706
2003 53.0 38.0 884 70.0 63.20 21,235
Upland Cotton: Acreage, Yield, and Production by CountyAcreage
Yield
Per Acre
Production
(480-Pound Net
Weight Bales)District/County Planted Harvested
Acres Acres Pounds Bales
2002 2003 2002 2003 2002 2003 2002 2003
DISTRICT 30 18,500 17,000 16,600 7,400 651 636 22,500 9,800
Curry 7,000 6,000 6,600 2,300 691 689 9,500 3,300
Quay 2,500 --- 2,000 --- 288 --- 1,200 ---
Roosevelt 9,000 11,000 8,000 5,100 708 612 11,800 6,500
DISTRICT 70 2,500 2,600 2,500 2,600 1,075 1,071 5,600 5,800
Hidalgo 500 500 500 500 1,056 960 1,100 1,000
Luna 2,000 2,100 2,000 2,100 1,080 1,097 4,500 4,800
DISTRICT 90 33,000 33,400 30,900 28,000 884 933 56,900 54,400
Chaves 1,700 2,000 1,700 1,900 904 985 3,200 3,900
Doña Ana 8,200 9,800 8,200 9,800 1,229 1,176 21,000 24,0001/
Eddy 5,100 4,900 5,000 4,800 979 950 10,200 9,500
Lea 18,000 16,700 16,000 11,500 675 710 22,500 1,700
STATE 54,000 53,000 50,000 38,000 816 884 85,000 70,000
Sierra County is included in Doña Ana County.1/

53 2003 New Mexico Agricultural Statistics
Cottonseed: Production, Farm Disposition, Price, and Value
Crop
Year Production
Farm DispositionSeason Average
Price Per Ton
Value of
Sold to Oil Mills Other1/ Production
-----------------------1,000 Tons------------------- Dollars 1,000 Dollars
1975 28.0 24.0 4.0 99.90 2,797
1980 45.0 40.0 5.0 124.00 5,580
1985 31.3 20.0 11.3 61.00 1,909
1990 48.0 13.0 35.0 143.00 6,864
1995 33.4 3.1 30.3 137.00 4,576
1999 50.5 2.2 48.3 97.50 4,924
2000 39.7 6.3 33.4 120.00 4,764
2001 47.8 15.6 32.2 112.00 5,354
2002 35.5 15.3 20.2 106.00 3,763
2003 31.6 3.8 27.8 145.00 4,495
Includes planting seed, exports, interfarm sales, shrinkage, losses, and other uses.1/

American-Pima Cotton: Acreage, Production, Price, and Value
Crop
Year
Acreage Yield
Per Acre
Production
(480-Pound Net
Weight Bales)
Price Per
Pound
Value of
Planted Harvested Production
1,000 Acres 1,000 Acres Net Pounds 1,000 Bales Cents 1,000 Dollars
1975 13.3 12.5 195 5.1 80.50 1,971
1980 7.1 7.0 464 6.8 105.00 3,427
1985 8.0 7.9 687 11.3 98.80 5,359
1990 19.3 19.3 609 24.5 117.00 3,759
1995 15.0 15.0 605 18.9 118.00 10,705
1999 7.5 7.0 734 10.7 88.70 4,556
2000 4.2 4.1 539 4.6 93.80 2,071
2001 5.2 5.2 969 10.5 87.70 4,420
2002 7.1 7.1 1,041 15.4 84.10 6,217
2003 6.1 6.0 1,056 13.2 106.00 6,716
American-Pima Cotton:Acreage, Yield, and Production by County
Acreage
Yield
Per Acre
Production
(480-Pound Net
Weight Bales)District/County Planted Harvested
Acres Acres Pounds Bales
2002 2003 2002 2003 2002 2003 2002 2003
DISTRICT 90 7,100 6,100 7,100 6,000 1,041 1,056 15,400 13,200
Doña Ana 6,600 5,100 6,600 5,000 1,033 1008 14,200 10,500
Other Counties 500 1,000 500 1,000 1,152 1,296 1,200 2,700
STATE 7,100 6,100 7,100 6,000 1,041 1,056 15,400 13,200
54 2003 New Mexico Agricultural Statistics

Potatoes: Acreage, Yield, Production, Price, and Value
Crop
Year
AcreageYield
Per Acre Production
Price
Per Cwt.
Value of
Planted Harvested Production1/
1,000 Acres 1,000 Acres Cwt. 1,000 Cwt. Dollars 1,000 Dollars
1975 3.7 3.5 200 700 2.70 1,890
1980 3.5 3.0 180 540 6.85 3,699
1985 10.5 10.4 275 2,860 4.70 13,442
1990 12.0 10.0 340 3,400 8.30 28,220
1995 10.5 10.5 356 3,738 7.00 25,996
1999 10.9 10.9 344 3,755 4.90 18,127
2000 10.1 9.8 385 3,770 3.70 13,826
2001 6.4 6.4 343 2,198 7.10 15,477
2002 6.5 6.3 371 2,336 6.55 15,195
2003 5.9 5.9 361 2,132 4.35 9,300
May not sum due to rounding.1/
Dry Beans: Acreage, Yield, Production, Price, and Value
Crop
Year
AcreageYield
Per Acre Production
Price
Per Cwt.
Value of
Planted Harvested Production
1,000 Acres 1,000 Acres Lbs. 1,000 Cwt. Dollars 1,000 Dollars
1999 2.0 2.0 1,800 36 21.00 756
2000 6.0 6.0 1,800 108 19.00 2,052
2001 15.0 15.0 2,000 300 19.00 5,700
2002 8.5 8.5 1,800 153 15.00 2,295
2003 10.0 10.0 1,860 186 16.00 2,976
55 2003 New Mexico Agricultural Statistics

56 2003 New Mexico Agricultural Statistics
Peanuts: Acreage, Yield, Production, Price, and Value1/
Crop
Year
AcreageYield
Per Acre Production
Price
Per Pound
Value of
Planted Harvested Production
Acres Pounds 1,000 Pounds Cents 1,000 Dollars
1975 8,900 8,800 2,290 20,152 22.0 4,433
1980 8,900 8,800 2,540 22,352 28.0 6,259
1985 12,400 12,400 2,580 31,992 29.3 9,374
1990 20,000 20,000 2,500 50,000 31.7 15,850
1995 20,000 20,000 2,150 43,000 33.6 14,448
1999 22,000 22,000 2,800 61,600 27.4 16,878
2000 27,300 26,000 2,115 54,990 32.0 17,597
2001 22,200 22,200 3,020 67,044 26.0 17,431
2002 18,000 18,000 3,000 54,000 19.0 10,260
2003 18,000 17,000 2,700 45,900 19.0 8,721
Estimates comprised of quota and nonquota peanuts.1/
Peanuts:Acreage, Yield, and Production by County
AcreageYield
District/County Planted Harvested Per Acre Production
----------------------Acres---------------------- ----------Pounds--------- -----1,000 Pounds------
2002 2003 2002 2003 2002 2003 2002 2003
DISTRICT 30 11,800 9,800 11,800 9,200 2,830 2,150 33,416 19,800
Curry 800 800 800 800 3,270 2,000 2,616 1,600
Roosevelt 11,000 9,000 11,000 8,400 2,800 2,165 30,800 18,200
DISTRICT 90 6,200 8,200 6,200 7,800 3,320 3,345 20,584 26,100
Lea 6,200 8,200 6,200 7,800 3,320 3,345 20,584 26,100
STATE 18,000 18,000 18,000 17,000 3,000 2,700 54,000 45,900

57 2003 New Mexico Agricultural Statistics
Fruits, Nuts, and Vegetables
Apples: Production, Price, and Value
Crop
Year
Utilized
Production
Price Per
Pound
Value of
Production
1,000Pounds Cents
1,000Dollars
1975 11,000 12.5 1,375
1980 12,000 12.4 1,488
1985 10,000 13.4 1,340
1990 6,800 17.9 1,217
1995 3,000 29.8 894
1999 2,000 25.0 500
2000 8,000 25.4 2,032
2001 6,000 31.8 1,908
2002 1,800 32.6 587
2003 1,800 30.7 553
APPLES: The state's apple
producers harvested 1.8 million
pounds in 2003, the same as the
previous year’s crop. Producers
received an average of 30.7 cents
per pound, 1.9 cents below the
2002 price. The total value of
production was $553,000
compared to 2002s $587,000.

58 2003 New Mexico Agricultural Statistics
CHILE: New Mexico’s chile production dropped to 85,360 tons in 2003, 9.1 percent below 2002.Planted acreage was estimated at 15,800 acres, well below the previous year plantings of 18,000 acres,primarily due to the continuing drought conditions. Harvested acreage was 14,700 acres with a largeamount of acreage lost to hail damage.
Despite the decrease in harvested acreage, growers maintained the high yields similar to the previousyear. The average state yield for green long mild was 12.7 tons per acre while paprika averaged 1.7tons per acre.
The value of New Mexico chile was estimated at $41.08 million, 20 percent less than 2002.
CHILE
2003 Acreage and Production by CountyPlanted Acreage Harvested Acreage Production (Tons)1/
District/County 2001 2002 2003 2001 2002 2003 2001 2002 2003
DISTRICT 70 --- 9,100 8,600 9,100 8,400 8,400 48,900 59,030 55,410
Hidalgo --- 2,600 2,900 2,200 2,400 2,800 13,200 13,700 8,630
Luna --- 5,600 5,100 6,200 5,300 5,000 32,900 42,050 43,680
Sierra --- 900 600 700 700 600 2,800 3,280 3,100
DISTRICT 90 --- 8,000 6,700 7,500 7,700 5,900 29,300 33,960 28,710
Chaves --- 1,100 1,000 1,400 1,100 500 4,900 2,880 1,450
Doña Ana --- 4,500 3,500 4,200 4,400 3,400 21,000 27,170 24,410
Eddy --- 1,200 600 1,100 1,100 500 1,800 1,910 610
Lea --- 1,200 1,600 800 1,100 1,500 1,600 2,000 2,240
OTHER DISTRICTS --- 900 500 1,100 700 400 2,800 3,410 1,2402/
STATE --- 18,000 15,800 17,700 16,800 14,700 81,000 96,400 85,360
Planted acreage not available for 2001.1/
Includes Otero County.2/

59 2003 New Mexico Agricultural Statistics
Chile: 2003 Acreage, Yield, Production, & Value by Variety
Variety
Acreage1/
Harvested
Yield Per
Acre Production
Average Price
Per Ton
Value of
Production
--------------------Tons------------------ ------Dollars------ ------$1,000------
Green
Jalapeño 700 12.6 8,800 301 2,650
Long Mild 3,900 12.7 49,650 289 14,360 2/
Long Hot 900 7.8 7,000 386 2,700
Red
Paprika 4,800 1.7 8,100 1,365 11,060
Cayenne 700 8.3 5,800 400 2,3203/
Long Mild 4,000 1.3 5,000 1,310 6,550
Long Hot 1,100 0.9 1,010 1,426 1,440
Total 14,700 5.8 85,360 481 41,080
1,400 acres were harvested for both green and red, but only counted once in the total.1/
Includes a small amount of other peppers; not published separately to avoid disclosure of individual operations.2/
Production and yield are wet tonnage (a ratio of 8:1 can be used to convert to a dry weight).3/
Chile: 2003 Yields by County & Variety----Green---- ----Red----
County Jalapeño Long Mild Long Hot Paprika Cayenne Long Mild Long Hot1/
Chaves 2/ 2/ 2/ 1.5 5.0 2/ 2/
Doña Ana 13.2 2.4 6.9 1.9 9.0 1.4 0.9
Eddy --- --- --- 1.2 --- --- ---
Hidalgo 13.0 9.0 7.0 1.8 --- 1.4 2/
Lea --- --- --- 1.6 --- 1.2 ---
Luna 12.0 13.8 11.2 1.7 8.0 1.1 1.0
Sierra --- 12.0 2/ 1.8 --- 1.0 1.0
Other Counties 5.0 4.5 9.5 1.6 --- 1.0 0.93/
State 12.6 12.7 7.8 1.7 8.3 1.3 0.9
Dry tonnage except cayenne, which is a wet tonnage (a ratio of 8:1 can be used to convert to a dry weight).1/
Included in Other Counties.2/
Other counties include Bernalillo, Cibola, Curry, Guadalupe, Otero, Roosevelt, Sandoval, Santa Fe, Socorro, and Valencia.3/
An 8:1 drying ratio can be used to convert cayenne production to a dry weight.1/

60 2003 New Mexico Agricultural Statistics
ONIONS: New Mexico onion growers produced 4.3 million hundredweight in 2003, down 2percent from 2002. Harvested acres decreased by 300 acres, while the average yield remainedconstant at 550 hundredweight per acre. The value of the 2003 crop increased almost 12 percentto $61.4 million with the prices averaging $14.50 per hundredweight.
The major varieties of commercially grown New Mexico onions include Grano, Granex, SweetSpanish, and mid-summer hybrids such as the popular Nu-Mex variety. Most of the state’s onionsare non-storage types; and during our peak summer harvest period, New Mexico is a major supplierfor the nation. Harvest usually begins in late May and continues through September.
Onions: Monthly Prices ReceivedYear June July August September
-------------------------------------------Dollars Per 100 Lbs.----------------------------------------
1975 15.00 18.40 15.00 13.80
1980 9.00 9.00 9.80 ---
1985 9.60 21.50 9.80 7.50
1990 10.40 9.55 9.00 8.50
1995 11.70 14.80 11.40 ---
1999 16.60 16.60 12.60 ---
2000 11.30 7.80 11.90 ---
2001 15.60 14.30 12.60 ---
2002 12.40 13.00 11.60 ---
2003 17.20 13.70 12.00 ---

61 2003 New Mexico Agricultural Statistics
Onions: Acreage, Yield, Production, and Value
Crop
Year
AcreageYield
Per Acre Production
Price
Per Cwt.
Value of
Planted Harvested Production
Acres Acres Cwt. 1,000 Cwt. Dollars 1,000 Dollars
1975 3,000 3,000 335 1,005 15.70 15,779
1980 4,000 3,900 290 1,131 9.20 10,405
1985 4,700 4,500 325 1,463 12.90 18,873
1990 8,800 8,400 350 2,940 9.71 28,547
1995 9,100 9,100 450 4,095 12.90 52,826
1999 8,300 7,300 450 3,285 16.00 52,560
2000 8,000 7,700 460 3,542 9.25 32,764
2001 8,100 7,700 490 3,773 14.40 54,331
2002 8,100 8,000 550 4,400 12.50 55,000
2003 7,700 7,700 550 4,312 14.50 61,408
Onions: Acreage, Yield, and Production by County
District/County
AcreageYield
Planted Harvested Per Acre Production
---------------------Acres-------------------- --------Cwt.-------- ----1,000 Cwt.----
2002 2003 2002 2003 2002 2003 2002 2003
DISTRICT 70 3,200 3,000 3,100 3,000 532 511 1,649 1,534
Luna 2,600 2,600 2,500 2,600 530 510 1,325 1,326
Sierra 600 400 600 400 540 520 324 208
DISTRICT 90 4,900 4,700 4,900 4,700 561 591 2,751 2,778
Doña Ana 4,500 4,400 4,500 4,400 570 600 2,565 2,640
Other Counties /1 400 300 400 300 465 460 186 138
STATE 8,100 7,700 8,000 7,700 550 550 4,400 4,312
Includes Curry and Guadalupe counties.1/

62 2003 New Mexico Agricultural Statistics
Pecans: Production, Price, and Value
Crop
Year
Production
(in shell)
Price
Per Pound
Value of
Production
1,000Pounds Dollars
1,000
Dollars
1975 13,100 .57 7,467
1980 14,500 .85 12,325
1985 29,000 .88 25,520
1990 34,000 1.53 52,020
1995 45,000 1.24 55,800
1999 52,000 1.20 62,400
2000 35,000 1.37 47,950
2001 60,000 .64 38,400
2002 36,000 1.25 45,000
2003 55,000 1.28 70,400
PECANS: Pecan production in New Mexico totaled 55 million pounds in 2003, a high bearing year in the alternatingcycle of the trees. This was a 53 percent increase over 2002s 36 million pounds, but 8.3 percent less than 2001sproduction, the previous high-bearing year in the cycle. Price per pound increased $0.03 from the previous year to $1.28.Production in 2003 was valued at $70.4 million, compared to $45 million the year before, and $38.4 million in 2001.
Pecans: Orchards, Acres, and Production by County
District/County
2002 Census Production1/
Bearing
Acres # Of Farms 2002 2003
------------------Number----------------- -----------------1,000 Pounds ----------------
DISTRICT 70 2/ 65 1,250 2,350
Luna 2/ 22 900 1,700
Sierra 514 43 350 650
DISTRICT 90 2/ 1,425 34,630 52,500
Chaves 3,414 81 4,000 5,800
Doña Ana 23,745 1,056 26,000 40,500
Eddy 2,415 119 3,100 4,200
Lea 2/ 35 330 400
Otero 2/ 134 1,200 1,600
OTHER DISTRICTS 2/ 46 120 1503/
STATE 33,123 1,536 36,000 55,000
Orchards of 20 or more trees.1/
Withheld to avoid disclosing data for individual farms.2/
Includes Grant, Hidalgo, and Lincoln counties.3/

63 2003 New Mexico Agricultural Statistics
Miscellaneous Crops and LivestockProduced in New Mexico
1/
Crop
Farms
Acres
Harvested Principal Counties
Apricots 155 82 Otero, Santa Fe, Taos
Barley 9 357 Counties Not Available
Cabbage 15 251 Doña Ana
Cantaloupe 93 301 Eddy, Sandoval, San Juan
Cherries (Sweet) 139 121 Otero, Rio Arriba
Grapes 247 1,030 Bernalillo, Rio Arriba, Valencia
Grass Seeds 41 1,094 Eddy, Lea, Mora, Valencia
Lettuce 33 622 Doña Ana
Mushrooms 3 740 Counties Not Available
Oats (Grain) 39 985 Chaves, Eddy, Luna, San Miguel, Valencia
Peaches 350 221 Otero, Rio Arriba, Santa Fe
Pears 238 109 Otero, Rio Arriba, Santa Fe
Pistachios 126 1,350 Otero
Pumpkins 43 3,225 Doña Ana, Luna
Rye (Grain) 12 2,679 Counties Not Available
Snap Beans 31 902 Curry
Sod 5 1,186 Counties Not Available
Spinach 13 254 Counties Not Available
Squash 46 80 Luna
Sweet Corn 69 379 Rio Arriba, San Juan
Tomatoes 136 61 Bernalillo, Sandoval, San Juan
Triticale 8 351 Chaves
Watermelons 98 1,992 Curry, Doña Ana, Lea, Luna
Livestock Farms Head Principal Counties
Bison 40 5,830 Santa Fe, Taos
Ducks 266 5,546 McKinley, Otero, San Juan, Santa Fe
Geese 184 3,334 Bernalillo, Otero
Goats 937 19,128 McKinley, San Juan
Horses 7,204 46,686 Bernalillo, Rio Arriba, San Juan, Valencia
Llamas and Alpacas 161 2,125 Bernalillo, Mora, Santa Fe
2002 Census of Agriculture 1/

County Profiles
Bernalillo County Crops 2003 Acres Yield Production Unit Rank
Hay, All 4,800 5.07 24,320 Tons 15
Hay, Alfalfa 4,000 5.30 21,200 Tons 14
Livestock No. of Head Rank
Cattle & Calves 9,000 31
Milk Cows 4,000 8
Sheep & Lambs 1,000 12
Census 2002 Cash Receipts 2003 1,000 Dollars Rank
Number of Farms 618 Crops 8,532 13
Land in Farms (Acres) Not Published Livestock 20,470 13
Catron County Crops 2003 Acres Yield Production Unit Rank
Hay, All 1,100 4.18 4,600 Tons 26
Hay, Alfalfa 1,000 4.30 4,300 Tons 25
Livestock No. of Head Rank
Cattle & Calves 25,000 16
Cash Receipts 2003 1,000 Dollars Rank
Crops 569 26
Census 2002 Livestock 10,940 22
Number of Farms 206
Land in Farms (Acres) 1,644,937
Chaves County Crops 2003 Acres Yield Production Unit Rank
Chile 500 — 1,450 Tons 6
Corn, Silage 19,800 23.5 465,300 Tons 1
Cotton, Upland 1,900 985 3,900 Bale 6
Hay, All 34,700 5.78 200,520 Tons 1
Hay, Alfalfa 31,000 5.80 179,800 Tons 2
Pecans — — 5,800,000 Lbs. 2
Census 2002 Livestock No. of Head Rank
Number of Farms 604 Cattle & Calves 179,000 2
Land in Farms 2,515,660 Milk Cows 87,000 1
Census 2002 U.S. Rank Sheep & Lambs 40,000 1
Chile 8 Cash Receipts 2003 1,000 Dollars Rank
Milk Cows 12 Crops 42,130 3
Pecans 27 Livestock 297,830 1
Cattle & Calves 40
64 2003 New Mexico Agricultural Statistics

County Profiles
Cibola County Crops 2003 Acres Yield Production Unit Rank
Hay, All 800 2.75 2,200 Tons 28
Hay, Alfalfa 700 3.00 2,100 Tons 27
Livestock No. of Head Rank
Cattle & Calves 14,000 27
Sheep & Lambs 16,000 4
Census 2002 Cash Receipts 2003 1,000 Dollars Rank
Number of Farms 155 Crops 292 29
Land in Farm 1,690,832 Livestock 7,245 29
Colfax County Crops 2003 Acres Yield Production Unit Rank
Hay, All 10,000 2.00 20,000 Tons 18
Hay, Alfalfa 7,000 2.30 16,100 Tons 17
Livestock No. of Head Rank
Cattle & Calves 38,000 10
Sheep & Lambs 400 21
Census 2002 Cash Receipts 2003 1,000 Dollars Rank
Number of Farms 284 Crops 2,329 22
Land in Farms 2,216,306 Livestock 16,545 16
Curry County Crops 2003 Acres Yield Production Unit Rank
Corn, Grain 14,200 160.7 2,281,940 Bu. 2
Corn, Silage 9,800 24.5 240,100 Tons 3
Cotton, Upland 2,300 689 3,300 Bales 7
Hay, All 17,000 3.54 60,200 Tons 7
Hay, Alfalfa 6,000 6.0 36,000 Tons 11
Peanuts 800 2,000 1,600,000 Lbs. 3
Census 2002 Sorghum 23,000 35.3 813,000 Bu. 1
Number of Farms 677 Wheat 46,000 25.0 1,150,000 Bu. 1
Land in Farms 916,320 Livestock No. of Head Rank
Avg Size of Farm 1,354 Cattle & Calves 198,000 1
Avg Net Farm Income 66,587 Milk Cows 60,000 2
Sheep & Lambs 400 21
Census 2002 U.S. Rank Cash Receipts 2003 1,000 Dollars Rank
Milk Cows 22 Crops 38,931 5
Cattle & Calves 36 Livestock 261,971 2
65 2003 New Mexico Agricultural Statistics

County Profiles
De Baca County Crops 2003 Acres Yield Production Unit Rank
Hay, All 7,700 5.05 38,850 Tons 11
Hay, Alfalfa 7,000 5.20 36,400 Tons 10
Livestock No. of Head Rank
Cattle & Calves 27,000 15
Sheep & Lambs 2,000 11
Census 2002 Cash Receipts 2003 1,000 Dollars Rank
Number of Farms 188 Crops 5,696 16
Land in Farms 1,409,434 Livestock 11,956 20
Doña Ana County Crops 2003 Acres Yield Production Unit Rank
Chile 3,400 — 24,410 Tons 2
Hay, All 22,100 7.19 158,920 Tons 3
Hay, Alfalfa 21,000 7.40 155,400 Tons 3
Corn Silage 10,400 23.00 239,200 Tons 4
Cotton, Upland 9,800 1,176 24,000 Bales 1
Cotton, Pima 5,000 1,008 10,500 Bales 1
Census 2002 Onion 4,400 600 2,640,000 Cwt. 1
Number of Farms 1,691 Pecans — — 40,500,000 Lbs. 1
Land in Farms 580,769 Livestock No. of Head Rank
Avg Size of Farm 343 Cattle & Calves 79,000 6
Avg Net Farm Income 33,016 Milk Cows 47,000 4
Census 2002 U.S. Rank Sheep & Lambs 2,000 11
Pecans 1 Cash Receipts 2003 1,000 Dollars Rank
Chile 2 Crops 172,927 1
Cotton, Pima 5 Livestock 169,384 4
Onions 11
Milk Cows 30
66 2003 New Mexico Agricultural Statistics

County ProfilesEddy County Crops 2003 Acres Yield Production Unit Rank
Chile 500 — 610 Tons 7
Cotton, Upland 4,800 950 9,500 Bales 3
Hay, All 35,600 5.62 199,950 Tons 2
Hay, Alfalfa 34,500 5.70 196,650 Tons 1
Pecans — — 4,200,000 Lbs. 3
Census 2002 Livestock No. of Head Rank
Number of Farms 510 Cattle & Calves 56,000 7
Land in Farms 1,183,073 Milk Cows 19,000 6
Avg Size of Farm 2,320 Sheep & Lambs 2,000 11
Avg Net Farm Income 14,083 Cash Receipts 2003 1,000 Dollars Rank
Census 2002 U.S. Rank Crops 34,609 6
Chile 11 Livestock 69,093 7
Pecans 36
Grant County Crops 2003 Acres Yield Production Unit Rank
Hay, All 600 1.67 1,000 Tons 31
Hay, Alfalfa 400 2.00 800 Tons 31
Livestock No. of Head Rank
Cattle & Calves 30,000 13
Census 2002 Cash Receipts 2003 1,000 Dollars Rank
Number of Farms 272 Crops 172 31
Land in Farms 1,218,119 Livestock 13,149 18
Guadalupe County Crops 2003 Acres Yield Production Unit Rank
Hay, All 1,000 2.10 2,100 Tons 29
Hay, Alfalfa 900 2.00 1,800 Tons 29
Livestock No. of Head Rank
Cattle & Calves 25,000 16
Sheep & Lambs 5,000 8
Census 2002 Cash Receipts 2003 1,000 Dollars Rank
Number of Farms 208 Crops 302 27
Land in Farms 1,461,766 Livestock 11,182 21
67 2003 New Mexico Agricultural Statistics

County Profiles
Harding County Crops 2003 Acres Yield Production Unit Rank
Hay, All 1,300 2.00 2,600 Tons 27
Hay, Alfalfa 1,000 2.00 2,000 Tons 28
Livestock No. of Head Rank
Cattle & Calves 20,000 21
Census 2002 Cash Receipts 2003 1,000 Dollars Rank
Number of Farms 129 Crops 294 28
Land in Farms 991,940 Livestock 8,711 28
Hidalgo County Crops 2003 Acres Yield Production Unit Rank
Chile 2,800 — 8,630 Tons 3
Cotton, Upland 500 960 1,000 Bales 8
Hay, All 1,400 4.40 6,160 Tons 24
Hay, Alfalfa 1,000 5.00 5,000 Tons 24
Census 2002 Livestock No. of Head Rank
Number of Farms 144 Cattle & Calves 24,000 19
Land in Farms 1,127,578 Cash Receipts 2003 1,000 Dollars Rank
Census 2002 U.S. Rank Crops 10,863 11
Chile 4 Livestock 10,449 24
68 2003 New Mexico Agricultural Statistics

County Profiles
Lea County Crops 2003 Acres Yield Production Unit Rank
Chile 1,500 — 2,240 Tons 5
Cotton, Upland 11,500 710 17,000 Bales 2
Hay, All 11,000 5.75 63,200 Tons 6
Hay, Alfalfa 8,000 7.00 56,000 Tons 5
Peanuts 7,800 3,345 26,100,000 Lbs. 1
Pecans — — 400,000 Lbs. 7
Census 2002 Wheat 1,300 42 54,600 Bu. 7
Number of Farms 554 Livestock No. of Head Rank
Land in Farms 2,258,353 Cattle & Calves 88,000 5
Avg Size of Farm 4,076 Milk Cows 25,000 6
Avg Net Farm Income 12,130 Sheep & Lambs 4,000 9
Census 2002 U.S. Rank Cash Receipts 2003 1,000 Dollars Rank
Chile 7 Crops 27,523 8
Livestock 103,680 6
Lincoln County Crops 2003 Acres Yield Production Unit Rank
Hay, All 200 1.90 380 Tons 32
Hay, Alfalfa 100 2.60 260 Tons 32
Livestock No. of Head Rank
Cattle & Calves 25,000 31
Sheep & Lambs 28,000 2
Census 2002 Cash Receipts 2003 1,000 Dollars Rank
Number of Farms 343 Crops 143 32
Land in Farms 1,605,566 Livestock 12,546 19
69 2003 New Mexico Agricultural Statistics

County Profiles
Luna County Crops 2003 Acres Yield Production Unit Rank
Chile 5,000 — 43,680 Tons 1
Cotton, Upland 2,100 1097 4,800 Bales 5
Hay, All 3,200 7.28 23,300 Tons 16
Hay, Alfalfa 2,700 8.00 21,600 Tons 13
Onion 2,600 510 1,326,000 Cwt. 2
Pecans — — 1,700,000 Lbs. 4
Census 2002 Sorghum 2,500 94 235,000 Bu. 3
Number of Farms 171 Wheat 1,700 100 170,000 Bu. 5
Land in Farms 709,518 Livestock No. of Head Rank
Avg Size of Farm 4,149 Cattle & Calves 28,000 14
Avg Net Farm Income 54,417 Cash Receipts 2003 1,000 Dollars Rank
Census 2002 U.S. Rank Crops 52,428 2
Chile 1 Livestock 20,542 12
Onions 15
McKinley County Crops 2003 Acres Yield Production Unit Rank
Hay, All 1,700 .85 1,450 Tons 30
Hay, Alfalfa 1,500 .90 1,350 Tons 30
Livestock No. of Head Rank
Cattle & Calves 18,000 25
Sheep & Lambs 22,000 3
Census 2002 Cash Receipts 2003 1,000 Dollars Rank
Number of Farms 150 Crops 201 30
Land in Farms 3,169,857 Livestock 10,685 23
Mora County Crops 2003 Acres Yield Production Unit Rank
Hay, All 6,000 1.00 6,000 Tons 25
Hay, Alfalfa 3,000 1.00 3,000 Tons 26
Livestock No. of Head Rank
Cattle & Calves 22,000 20
Sheep & Lambs 700 18
Census 2002 Cash Receipts 2003 1,000 Dollars Rank
Number of Farms 410 Crops 728 25
Land in Farms 954,572 Livestock 9,711 25
70 2003 New Mexico Agricultural Statistics

County ProfilesOtero County Crops 2003 Acres Yield Production Unit Rank
Apples — — 250,000 Lbs. 4
Hay, All 1,700 4.48 7,620 Tons 23
Hay, Alfalfa 1,300 4.60 5,980 Tons 23
Pecans — — 1,600,000 Lbs. 5
Livestock No. of Head Rank
Cattle & Calves 13,000 28
Census 2002 Sheep & Lambs 9,000 5
Number of Farms 622 Cash Receipts 2003 1,000 Dollars Rank
Land in Farms 1,207,598 Crops 4,277 18
Livestock 6,803 30
Quay County Crops 2003 Acres Yield Production Unit Rank
Hay, All 13,400 1.94 25,960 Tons 14
Hay, Alfalfa 9,000 2.20 19,800 Tons 16
Sorghum 2,600 17.8 46,200 Bu. 5
Wheat 8,500 16.6 141,000 Bu. 6
Livestock No. of Head Rank
Cattle & Calves 56,000 7
Census 2002 Sheep & Lambs 600 19
Number of Farms 594 Cash Receipts 2003 1,000 Dollars Rank
Land in Farms 1,651,616 Crops 4,228 19
Livestock 24,459 11
Rio Arriba County Crops 2003 Acres Yield Production Unit Rank
Apples — — 500,000 Lbs. 1
Hay, All 11,500 1.21 13,900 Tons 19
Hay, Alfalfa 7,500 1.00 7,500 Tons 12
Livestock No. of Head Rank
Cattle & Calves 19,000 24
Sheep & Lambs 4,000 9
Census 2002 Cash Receipts 2003 1,000 Dollars Rank
Number of Farms 988 Crops 2,606 20
Land in Farms 1,431,119 Livestock 9,238 27
71 2003 New Mexico Agricultural Statistics

County Profiles
Roosevelt County Crops 2003 Acres Yield Production Unit Rank
Corn, Grain 2,400 110 264,000 Bu. 3
Corn, Silage 14,100 21.3 300,330 Tons 2
Cotton, Upland 5,100 612 6,500 Bales 4
Hay, All 26,000 3.13 81,300 Tons 5
Hay, Alfalfa 9,000 6.20 55,800 Tons 6
Peanuts 8,400 2,165 18,200,000 Lbs. 2
Census 2002 Sorghum 30,600 13.6 417,600 Bu. 2
Number of Farms 804 Wheat 57,000 17.1 972,000 Bu. 2
Land in Farms 1,500,821 Livestock No. of Head Rank
Avg Size of Farm 1,867 Cattle & Calves 148,000 4
Avg Net Farm Income 51,731 Milk Cows 60,000 2
Census 2002 U.S. Rank Sheep & Lambs 2,000 11
Milk Cows 21 Cash Receipts 2003 1,000 Dollars Rank
Cattle & Calves 58 Crops 34,485 7
Livestock 211,512 3
Sandoval County Crops 2003 Acres Yield Production Unit Rank
Apples –– — 500,000 Lbs. 1
Hay, All 3,400 2.49 8,480 Tons 22
Hay, Alfalfa 3,000 2.60 7,800 Tons 19
Livestock No. of Head Rank
Cattle & Calves 11,000 29
Census 2002 Cash Receipts 2003 1,000 Dollars Rank
Number of Farms 347 Crops 2,415 21
Land in Farms 763,197 Livestock 4,995 31
72 2003 New Mexico Agricultural Statistics

County Profiles
San Juan County Crops 2003 Acres Yield Production Unit Rank
Apples — — 300,000 Lbs. 3
Hay, All 26,800 3.99 106,800 Tons 4
Hay, Alfalfa 24,000 4.10 98,400 Tons 4
Wheat 7,700 93 716,100 Bu. 4
Livestock No. of Head Rank
Cattle & Calves 20,000 21
Census 2002 Sheep & Lambs 7,000 7
Number of Farms 808
Land in Farms 1,756,624 Cash Receipts 2003 1,000 Dollars Rank
Avg Size of Farm 2,174 Crops 41,564 4
Avg Net Farm Income 415 Livestock 24,678 10
San Miguel County Crops 2003 Acres Yield Production Unit Rank
Hay, All 4,700 1.83 8,580 Tons 21
Hay, Alfalfa 3,200 2.40 7,680 Tons 21
Livestock No. of Head Rank
Cattle & Calves 36,000 11
Census 2002 Cash Receipts 2003 1,000 Dollars Rank
Number of Farms 565 Crops 1,053 24
Land in Farms 2,091,643 Livestock 16,003 17
Santa Fe County Crops 2003 Acres Yield Production Unit Rank
Hay, All 8,500 3.46 29,410 Tons 12
Hay, Alfalfa 6,800 3.60 24,480 Tons 12
Livestock No. of Head Rank
Cattle & Calves 11,000 29
Census 2002 Cash Receipts 2003 1,000 Dollars Rank
Number of Farms 460 Crops 8,877 12
Land in Farms 683,508 Livestock 9,450 26
73 2003 New Mexico Agricultural Statistics

County Profiles
Sierra County Crops 2003 Acres Yield Production Unit Rank
Chile 600 — 3,100 Tons 4
Corn, Silage 900 20.3 18,270 Tons 6
Hay, All 3,100 6.72 20,820 Tons 17
Hay, Alfalfa 3,000 6.90 20,700 Tons 15
Onions 400 520 208,000 Cwt 3
Pecans — — 650,000 Lbs. 6
Census 2002 Livestock No. of Head Rank
Number of Farms 223 Cattle & Calves 16,000 26
Land in Farms 1,362,866 Cash Receipts 2003 1,000 Dollars Rank
Census 2002 U.S. Rank Crops 8,079 14
Chile 10 Livestock 16,736 15
Socorro County Crops 2003 Acres Yield Production Unit Rank
Hay, All 7,700 5.09 39,200 Tons 10
Hay, Alfalfa 7,000 5.40 37,800 Tons 9
Livestock No. of Head Rank
Cattle & Calves 33,000 12
Sheep & Lambs 1,300 15
Census 2002 Cash Receipts 2003 1,000 Dollars Rank
Number of Farms 388 Crops 4,939 17
Land in Farms 1,523,280 Livestock 40,894 8
Taos County Crops 2003 Acres Yield Production Unit Rank
Hay, All 7,000 1.31 9,200 Tons 20
Hay, Alfalfa 6,000 1.30 7,800 Tons 19
Livestock No. of Head Rank
Cattle & Calves 4,000 32
Sheep & Lambs 500 20
Census 2002 Cash Receipts 2003 1,000 Dollars Rank
Number of Farms 453 Crops 1,111 23
Land in Farms 466,254 Livestock 1,932 32
74 2003 New Mexico Agricultural Statistics

County Profiles
Torrance County Crops 2003 Acres Yield Production Unit Rank
Hay, All 9,200 4.52 41,600 Tons 9
Hay, Alfalfa 8,000 4.90 39,200 Tons 7
Livestock No. of Head Rank
Cattle & Calves 44,000 9
Sheep & Lambs 9,000 5
Census 2002 Cash Receipts 2003 1,000 Dollars Rank
Number of Farms 461 Crops 11,463 10
Land in Farms 1,696,831 Livestock 30,321 9
Union County Crops 2003 Acres Yield Production Unit Rank
Corn, Grain 16,100 210.2 3,384,220 Bu. 1
Corn, Silage 1,700 30.0 51,000 Tons 5
Hay, All 6,400 4.56 29,200 Tons 13
Hay, Alfalfa 2,400 6.50 15,600 Tons 18
Sorghum 2,200 37.3 82,000 Bu. 4
Wheat 16,500 55.0 907,500 Bu. 3
Census 2002 Livestock No. of Head Rank
Number of Farms 419 Cattle & Calves 155,000 3
Land in Farms 2,243,404 Cash Receipts 2003 1,000 Dollars Rank
Census 2002 U.S. Rank Crops 12,623 9
Cattle & Calves 53 Livestock 115,374 5
Valencia County Crops 2003 Acres Yield Production Unit Rank
Hay, All 10,400 4.15 43,180 Tons 8
Hay, Alfalfa 9,000 4.30 38,700 Tons 8
Livestock No. of Head Rank
Cattle & Calves 20,000 21
Milk Cows 4,000 8
Sheep & Lambs 1,000 16
Census 2002 Cash Receipts 2003 1,000 Dollars Rank
Number of Farms 718 Crops 6,405 15
Land in Farms 368,864 Livestock 18,317 14
75 2003 New Mexico Agricultural Statistics

2003 New Mexico Agricultural Statistics
Introducing New Mexico Department of Agriculturehttp://www.nmda.nmsu.edu --Ag’s Partner
OFFICE OF THE DIRECTOR/SECRETARY (I. Miley Gonzalez, Ricardo Rel and Tom J. Bagwell, 505-646-3702)
establishes policy for the daily operation of the department; provides liaison between agricultural
producers and state and federal government; and serves on national committees on behalf of agriculture.
AGRICULTURAL AND ENVIRONMENTAL SERVICES (Larry Dominguez) 505-646-3208
oversees the Bureau of Pesticide Management, which administers pesticide-use laws, certification, and
licensing of all pesticide applicators; the Bureau of Entomology and Nursery Industries, which is designed
to handle agricultural and biological work, in-store inspection of nursery plants, and entomology
programs; the Bureau of Feed, Seed, and Fertilizer, which administers the commercial feed, seed, and
fertilizer laws; the Dairy Bureau, which ensures milk quality; and supervises the chemistry, seed, and
entomology laboratories.
State Chemist Laboratory 505-646-3318
provides analyses of official samples of feed, fertilizer, and pesticide products; and on a fee basis for
the public and other agencies.
Seed Laboratory 505-646-3407
provides official seed testing to determine germination, quality, and weed content; and seed testing
for the public and other agencies on a fee basis.
AGRICULTURAL PROGRAMS AND RESOURCES (Julie Maitland) 505-646-2642
provides agricultural liaison for the director/secretary plus legislative and agricultural issue analyses; the
cooperative predatory wild animal and rodent pest program; supervises farm and range improvement fund
activities; coordinates a soil and water conservation program; and coordinates a noxious weed control program.
MARKETING AND DEVELOPMENT (Edward Avalos) 505-646-4929
responsible for state, national, and international market expansion and development for New Mexico products;
livestock and processed foods; commodity promotions; specialty crop development; produce quality inspection;
market news; agricultural statistics; and licensing of produce brokers and packers.
STANDARDS AND CONSUMER SERVICES (Joe Gomez) 505-646-1616
oversees the Consumer Services Bureau, which provides inspection of weighing and measuring devices,
packaged commodities, eggs, dairy products, and weighmaster licensing; the Petroleum Standard Bureau,
which provides inspection of petroleum measuring devices and quality of petroleum products; and
supervises the metrology and petroleum standards laboratories.
Metrology Laboratory 505-646-1616
maintains custody of official state standards for mass, volume, and length; provides calibration of
weights and measures used in department regulatory activities; and calibration services on a fee basis
for industry.
Petroleum Standards Laboratory 505-646-1616
provides analyses of official samples in the enforcement of petroleum product quality standards and
specifications and sample analyses on a fee basis for industry and other agencies.
VETERINARY DIAGNOSTIC SERVICES (Rodney Flint Taylor) 505-841-2576
provides diagnostic analyses of animal specimens on a referral basis for the public and other agencies.

New Mexico Department of Agriculture
Office of the Director/Secretary, MSC 3189
Box 30005
Las Cruces, New Mexico 88003-8005
STATISTICAL OFFICE
NATIONAL AGRICULTURAL
STATISTICS SERVICE
U.S. DEPARTMENT OF AGRICULTURE
PO Box 1809, Las Cruces, NM, 88004 1-800-530-8810
www.nass.usda.gov/nm [email protected]
IN COOPERATION WITH NEW MEXICO DEPARTMENT OF AGRICULTURE
NEW MEXICO