new ncreif value index and operations measures · ncreif director of real estate performance ......
TRANSCRIPT

New NCREIF Value Index andOperations Measures
by
Michael S. YoungNCREIF Consultant
1928 Eucalyptus Road, Nipomo, California 93444phone: 623-523-3855 / e-mail: [email protected]
Jeffrey D. FisherNCREIF Academic Consultant
200 E. Randolph Street, Suite 5135, Chicago, Illinois 60601phone: 312-819-5890 / email: [email protected]
Joseph D’AlessandroNCREIF Director of Real Estate Performance Measurement200 E. Randolph Street, Suite 5135, Chicago, Illinois 60601
phone: 312-819-5890 / email: [email protected]
Revised 8/28/2016

New NCREIF Value Index andOperations Measures
Abstract. Since its inception, the NCREIF Property Index (NPI) has achieved
preeminence as an indicator of the investment performance of institutionally-held
commercial property in the United States. This paper introduces three new and
refined series derived from NCREIF property data: the Market Value Index (MVI),
Free Cash Flow Yield (FCFY), and Capital Expense Ratio (CXR). While the NPI
was designed to measure the risk and returns of the real estate asset class, these
series optimize the property-level data in the NCREIF database to provide better
indications of real estate value changes and operating performance.
Since its inception over thirty-five years ago, the NCREIF Property Index (NPI) has achieved
preeminence as an indicator of the investment performance of institutionally-held commercial
property in the United States. The NPI formula is:
MVt – MVt-1 + PSt + NOI t – CI t
Rt = ––––––––––––––––––––––––––––––––MVt-1 – (PSt / 2) – (NOIt / 3) + (CIt / 2)
Where:
Rt is the Total Return for period t,
MVt is the Market Value at the end of period t,
MVt-1 is the Market Value at the beginning of period t,
PSt is any Partial Sales in period t,
NOIt is the Net Operating Income in period t, and
CIt is the Capital Expenditures (Improvements) in period t.

New NCREIF Value Index and Operations Measures 2
This NPI formula is designed as an approximation of a quarterly Internal Rate of Return
(IRR) when NOI is assumed to be received monthly during the quarter and any Capital
Expenditures (CapEx) or Partial Sales occur mid-quarter. Brueggeman and Giliberto (1987)
presented a derivation of this formula using a Taylor Series Expansion of the formula for an IRR
under these assumptions. The formula can also be derived from the Modified Dietz formula
developed by Dietz (1966) and commonly used for performance measurement in the institutional
arena. The assumption that NOI occurs at the end of each month is what results in the 1/3
adjustment in the denominator and the assumption that CapEx and Partial Sales occur mid-
quarter is the reason for the ½ adjustment. For the purpose of this article, the main point is that
this formula was designed for returns, i.e., to provide an approximation of an IRR.
The practice in the real estate industry has been to also compute two components of the total
return –– a so-called Income Return and an Appreciation Return (also called a Capital Return).
The Income Return just uses the NOI in the numerator of the formula and the Appreciation
Return uses the remaining terms, which include the CapEx and Partial Sales terms.
I. Rationale for the New Series
The NPI is widely-reported and used by real estate investment owners, investors, managers, and
consultants as well as by academics. It has become the de facto yardstick that the industry uses
for a variety of performance and analytical purposes including portfolio construction,
monitoring, and attribution analysis. But, the NPI was designed as a measure of returns for
institutional real estate. Although Total Return has historically been broken down into Income
Return and Appreciation Return components, this can be problematic for several reasons:
1. The Income Return is based on NOI and not net cash flow and thus is not
comparable with a “dividend yield” for common stocks.
2. The Appreciation Return is net of capital expenditures and thus is not comparable
with other price indices such as the Moody’s/RCA CPPI.1

New NCREIF Value Index and Operations Measures 3
It should be noted that separating Total Return into components is common for real estate as
investors typically associate less risk with income and more risk with appreciation. However, the
Income Return is not a cash return. The Income Return is analogous to a Capitalization (Cap)
Rate, commonly defined as NOI divided by Market Value. For the Appreciation Return, CapEx
is subtracted from the end-of-quarter Market Value because you cannot have a “return” by
simply adding capital. That is, the value change would at least, in part, be due to making
additional investment. But, the Appreciation Return is not a price change. As noted above, what
is also desirable for real estate is both a measure of the cash flow yield, analogous to stock and
bond yields, and a measure of a true price index that captures how values change over time.
Young, Geltner, McIntosh, and Poutasse (1995 and 1996) and Young (2005) proposed
changes to the NPI formula that address some of the above issues. But, after considerable
research, NCREIF decided that there was a need for several different types of indices, each
optimized for their intended purpose. As noted above, the NPI was designed for returns. While
there may be ways to improve the NPI formula (currently under consideration at NCREIF), there
is also a need for better measures of price changes (a price index) as well as better measures of
cash yield from ongoing property operations.
To address these objectives, a new Free Cash Flow Yield measure has been developed that
reflects the net cash flow from a property available for distribution to investors. Also, the current
NPI Appreciation Return is enhanced by the new Market Value Index that measures property
value change irrespective of capital expenditures, which is a more strict and unambiguous
measure of market value change. We will see that these new measures differ from the NPI in
several ways:
1. Because the new measures are not intended as estimates of a quarterly IRR, no
adjustment has to be made to the denominator of the NPI’s formula. The denominator is
simply the Beginning Market Value.
2. Unlike the NPI Income Return component that is based on NOI, the Free Cash Flow
Yield is calculated by subtracting the CapEx from the NOI to get a measure of cash flow.

New NCREIF Value Index and Operations Measures 4
3. Unlike the NPI Appreciation Return component that has CapEx deducted from the
Ending Market Value, there is no deduction for CapEx so that the measure is simply the
price change.
4. While some CapEx is necessary to maintain a constant utility for the property, a price
index should not reflect an increase in the value of the property due to a major expansion
or renovation of the property that involves new capital investment. Similarly, the Free
Cash Flow Yield measure should not have major CapEx deducted. Thus, for both of
these measures, a property is excluded from the calculation during any quarter where
expansion or major renovations are taking place.
The details of the calculations for these new measures are covered in the following sections.
II. Market Value Index (MVI)
The Market Value Index (MVI), like the other two new measures, has a denominator that is
simply the Beginning Market Value at the beginning of the quarter: MVt-1. This treatment is
more consistent with the way price indices are calculated for other asset classes.
Thus, the MVI is simply an equal-weighted average of quarterly changes in reported market
value for those properties that are not undergoing a major capital expansion. However, if a
property is undergoing expansion or contraction into some new physical, functional, or economic
condition, then the property is excluded from the computation and reporting during these
quarters. The property re-enters the index once the expansion or major renovation is complete,
i.e., during periods when the property retains its utility.
The Market Value Index (MVI) is computed for each property as the sum of Ending Market
Value and Partial Sales2 divided by Beginning Market Value minus 1 for each quarter. For
properties having a Full Sale in a quarter, the MVI is based on the difference between the Sale
Price and the beginning-of-quarter Market Value.

New NCREIF Value Index and Operations Measures 5
To deal with the constant utility issue discussed above, in any quarter where the absolute
value3 of specified capital expenditures exceeds a fraction of Beginning Market Value the
property’s MVI computation shall be excluded from the data series. We call this process of
identifying quarterly data for exclusion a “filter rule” and provide its definition and application
below.
The MVI formula is:
(MVt – MVt-1 + PSt) / MVt-1
or alternatively:
[ (MVt + PSt) / MVt-1 ] – 1
where MV is Market Value and PS is Partial Sales reported to NCREIF in quarter t and MVt-
1 is the Market Value at the end of the prior quarter, in other words, at the beginning of the
current quarter.
III. Operating Measures
The Free Cash Flow Yield (FCFY) is a measure of the amount of a property’s quarterly operating
net cash flow available for distribution to investors/owners expressed as a fraction of market
value. The FCFY, like the MVI, excludes properties with major capital expenditures for
expansion or renovation when such expenditures exceed the filter rule described below, and that
more accurately reflects the cash that could be distributed to investors in a quarter. This measure
is similar to the concept of “free cash flow” used in the finance literature and in corporate
financial reporting.
The FCFY is a periodic measure that is not indexed. In some sense, the FCFY is a measure
of cash that investors can expect after all operating and everyday capital expenses have been
paid. To many investors, the cash available for distribution is one of the principal reasons for
investing in commercial real estate, an asset that has a relatively stable net cash flow stream
owing to the terms of leases that underpin a property’s economic performance. Stability and

New NCREIF Value Index and Operations Measures 6
reliability of this net cash flow stream is important to a wide range of institutional investors who
must have cash available for distribution to plan beneficiaries. With the introduction of the
FCFY, those investors have, for the first time, a way of assessing the history of net cash flow
available for distribution from the real estate asset class.
Lastly, the Capital Expense Ratio (CXR) is a measure of the quarterly expenditures for on-
going costs of business not accounted for in the Net Operating Income (NOI) including leasing
commissions, tenant improvements, and other expenditures for replacement of long-lived
equipment or physical structures, mostly tenant spaces, expressed as a fraction of market value.
Also, the CXR is a periodic measure and is not indexed.
The Free Cash Flow Yield (FCFY) is computed for each property as the quantity Net
Operating Income minus Capital Improvements divided by Beginning Market Value for each
quarter. Notice that major capital expenditures for expansions or renovations are not included in
the formula, only ordinary capital expenses related to leasing commissions and tenant
improvements. Accordingly, in quarters where the absolute value of capital improvements
defined in the filter rule exceed a fraction of Beginning Market Value, the property’s FCFY
computation shall be excluded from the data series.
Thus, the FCFY formula is:
(NOIt – CIt) / MVt-1
Notice that Market Value Index and Free Cash Flow Yield are components of total return for
a quarter when substantial capital expenditures have not occurred and that the denominator for
both is simply the Beginning Market Value as proposed in Young, et al. (1995 and 1996). Thus,
expressed in algebraic form, the total return for a property in a quarter would be simply the sum
of the components:
TRt = MVIt + FCFYt
The Capital Expense Ratio (CXR) is computed for each property as Capital Improvements
(excluding major capital investments as described above) divided by Beginning Market Value for

New NCREIF Value Index and Operations Measures 7
each quarter. In quarters where the absolute value of Capital Improvements defined in the filter
rule exceed a fraction of Beginning Market Value, the property’s computation CXR
computation shall be excluded from the data series.
The CXR formula is:
CIt / MVt-1
IV. A Closer Look at CapEx
To ensure that, within reasonable bounds, a particular property retains its physical continuity
throughout a quarter, there must be a way to identify properties that have not had substantial,
material changes to the physical asset within the quarter. If the changes are substantial, the
property should be excluded for that quarter or for subsequent quarters until such time as the
property becomes stable physically, functionally, or economically, i.e., when the property returns
to a state of constant utility.
Prior to 2000, only total Capital Improvements were reported to NCREIF. Subsequently,
additional subcategories of capital improvements gave us more information on the composition
of total Capital Improvements. In particular, the subcategories included Additional Acquisitions
Costs, Leasing Commissions, Tenant Improvements, Building Improvements, Building
Expansion, and Other Capital Improvements.4
We divide these subcategories into two groups: those that are typical recurring capital
expenses related to changing tenancy and ordinary repairs, and those that are occasional, high-
dollar-value capital expenditures that alter the physical, functional, or economic condition of a
property. Leasing Commissions, Tenant Improvements, and Building Improvements fall into the
former group and are included in Capital Expenses in the FCFY and CXR series. Additional
Acquisitions Costs, Building Expansion, and Other Capital Improvements fall into the latter
group and are all candidates for filtering properties for exclusion within all three series.

New NCREIF Value Index and Operations Measures 8
We can use the detailed data on capital expenditures from the post-2000 era to create filter
rules for excluding properties undergoing substantial capital expenditures prior to 2000. We are
not able to say with certainty that properties filtered will be 100% accurately identified. We must
strike a reasonable balance based on indicators we find in the existing data and judgments about
the reasonableness of the filter ratio.
Thus, we have chosen to filter only those subcategories of capital expenditures in the
subcategories of Additional Acquisitions Costs, Building Expansion, and Other Capital
Improvements that show an absolute value greater than 5% of Beginning Market Value of a
property in any quarter. First, we compute for each property type the fraction of post-2000
observations that are filtered and then use that fraction to establish a filter rule for the pre-2000
era where we have only one statistic for total Capital Improvements.
We tried several filter rules for pre-2000 data and found that an absolute value of total
Capital Improvements greater than 10% of Beginning Market Value provided the most similar
fraction of excluded quarters for most property types and for the aggregate of all properties in the
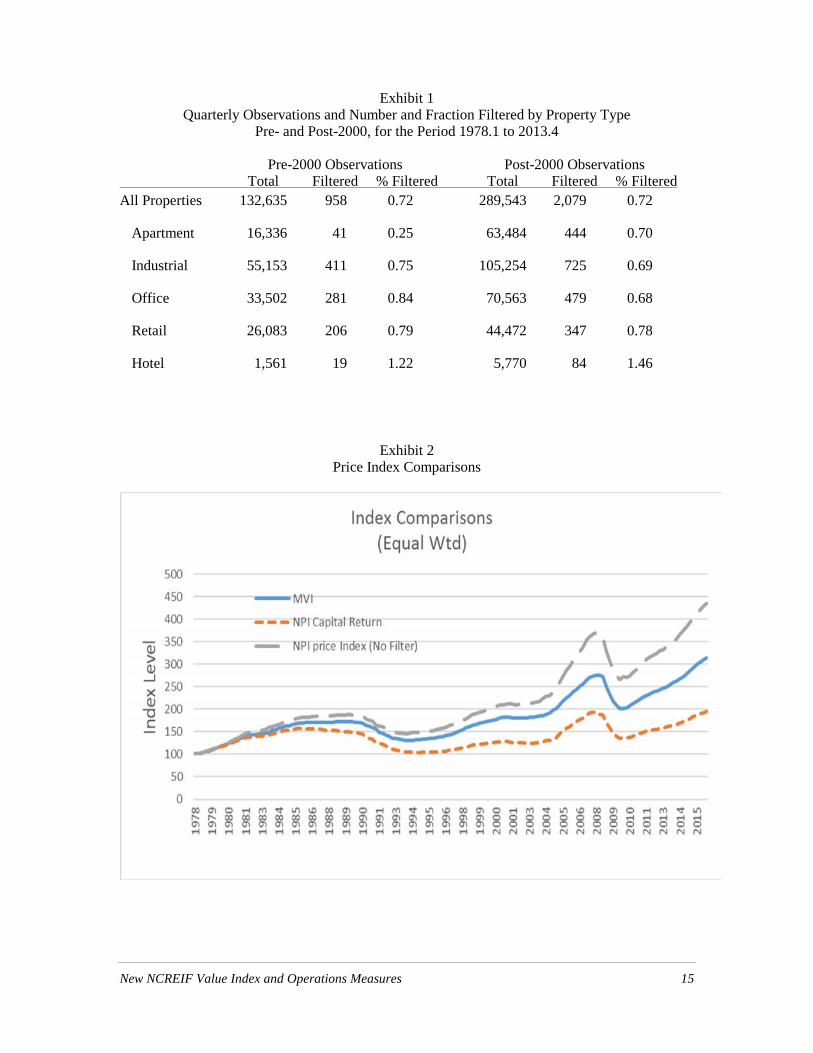
NPI. Exhibit 1 shows the observations and fractions of properties excluded in both the pre-2000
and post-2000 eras. In the post-2000 era, 2,079 of the 289,543 quarterly observations for all
properties in the NPI were filtered (satisfied the rule for exclusion from the data set), a total of
0.72% of all observations. Interestingly, in the pre-2000 era, 958 of the 132,635 quarterly
observations for all properties in the NPI were filtered, also a total of 0.72% of all observations
despite some differences in percentages pre- and post-2000 when disaggregated by individual
property type.
The largest absolute and relative difference in the percent filtered pre-2000 versus post-2000
is found in the Apartment category. We note that the number of observations pre-2000 is only
about one-quarter as many as post-2000, a fraction far smaller than in all other property types
other than Hotel. Had we filtered pre-2000 Apartment observations with a 5% filter rule, the
percent of filtered Apartment observations pre-2000 would have been 0.64%. The number of
excluded Apartment observations would have increased from 41 to 104 out of a full sample of

New NCREIF Value Index and Operations Measures 9
16,336 quarters of Apartment data, an average of about 1.2 observations per calendar quarter
over the 88 quarter span from 1978 to 2000.
V. Equal-Weighted versus Value-Weighted
The NPI returns have always been value-weighted as they represent the universe of properties
reported to NCREIF. There is not, nor has there ever been the suggestion that the value-weighted
NPI series are representative of the larger population of domestic commercial real estate.
Value-weighted series have merit in particular analytical situations. For example, in
attribution analysis, the goal is to identify deviations plus or minus of a particular portfolio of
real estate assets from a benchmark portfolio representative of the theoretically investable
universe. In other words, attribution analysis attempts to show how a portfolio has performed on
say selection of property types versus a benchmark that includes all investable property types.
Also, analyses that employ Modern Portfolio Theory or its variants invariably involve value-
weighted statistics because that represents the investment choices available to participants in the
market. This is arguably even more true among investments in real estate assets where purchase
of fractional interests is difficult, if not impossible, owing to the ownership structures available
to investors.
However, when dealing with sample statistics from a universe of, in this case, domestic
commercial real estate, equal-weighted statistics are preferable.5 By averaging all the sample
changes in market value in a quarter, for example, the resulting MVI will give equal weight to
each property’s change. The lowest valued properties will be given equal weight to the hightest
valued properties.
Thus, for statistical reasons and for qualitative reasons such as the fact that some properties
are excluded in some quarters by the filter rule, the “headline” published versions of the three
series will be equal-weighted.6 These are statistics from a sample of domestic commercial real
estate. That the data are derived from properties owned by tax-exempt institutions is interesting

New NCREIF Value Index and Operations Measures 10
but, unless proved otherwise, the data are considered representative of the universe of domestic
commercial real estate regardless of ownership.
VI. Price Index Comparisons
As discussed above, the purpose of the MVI is to have a better measure of how property values
are changing over time that is more comparable with other price indices. The NPI data has been
misused by many researchers when creating a price index. One approach that has been used in
the past is to use the published NPI capital appreciation return. As noted previously, the
NCREIF capital return is net of all capex. Thus it understates the price changes for properties.
Another approach that has been used is to simply add back ALL capital expenditures to
the capital return. But this includes capital expenditures for property expansion that is new
investment and not recurring capital expenditures. This overstates the price change for
properties.
The new MVI adds back capital expenditures but is also excludes properties in quarters
where there are major capital expenditure events that are not recurring capital expenditures based
on the filter rules discussed previously. This results in a price index that is just right. As shown
in Exhibit 2, it falls between the other two indices discussed above. All the indices ini Exhibit 2
are equal weighted to have an apples-to-apples comparison.
VII. Some Summary Statistics
The MVI, FCFY, and CXR series are reported in various NCREIF publications on the public
web site, in printed quarterly reports and so-called flash reports, in spreadsheet form to NCREIF
members and subscribers, and in an ad hoc query facility on the organization’s web site available
to members. Additionally, the series are available in customizable form often used by researchers
when special disaggregations or computations from proprietary data are required.

New NCREIF Value Index and Operations Measures 11
In a departure from the format of NPI detailed statistics, NCREIF now includes percentile
statistics (5th, 25th, 50th or median, 75th, and 95th) for each series each quarter. This may be helpful
to researchers because the distributions of the series, especially the FCFY and CXR, are certainly
non-normal and skewed with boundaries more likely on the downside than on the upside.
Exhibit 3 shows quarterly and four-quarter annual statistics for MVI, FCFY, and CXR over
the 1978.1 to 2014.4 period for all qualifying properties and for individual subsets by five
property types: Apartment, Industrial, Office, Retail, and Hotel. In the columns headed
“Quarterly,” the mean of the 148 quarters of statistics (136 quarters in the case of Hotels) are
shown along with standard deviation of the quarterly means and the median of the quarterly
means. In other words, each quarterly set of results is a sample and the means, standard
deviations, and medians are not the statistics for all the thousands of individual quarterly
property data over the 37-year period.
Also, in Exhibit 3, the Market Value Index four-quarter annual results are derived from
chain-linked quarterly statistics, while the Free Cash Flow Yield and Capital Expense Ratio four-
quarter annual results are the sum of four quarterly statistics. These computations produce sets of
145 samples (or 133 in the case of Hotels) and the means, standard deviations, and medians are
derived as described above.
For all quarterly results for all properties, the average quarterly MVI was 0.71% for the
1978.1 to 2014.4 period or approximately 2.87% annualized [100 * (1.00714 – 1) = 2.87%, other
annualized figures that follow are computed in this manner]. With a quarterly median MVI of
0.93% the sample data indicate some positive skewness.
One of the principal reasons investors chose to own commercial real estate is the likelihood
of a stable stream of net cash flow (income after deductions for ordinary operating expenses and
routine capital expenses) available to investors for which the FCFY statistic is a good measure.
From Exhibit 3, the average quarterly FCFY for all qualified properties was 1.49% for the 1978.1
to 2014.4 period or approximately 6.09% annualized, which bears comparison to similar
statistics for other asset classes like common stocks or bonds, a subject for further research. Real

New NCREIF Value Index and Operations Measures 12
estate investors desirous of a relatively stable stream of net cash flow may be pleased to see that
the standard deviation of the quarterly samples is a low 0.34%.
Capital expenditures are both an ordinary cost of doing business for commercial property and
an occasionally substantial sum to remodel, to renovate, to expand, or to repurpose a property.
The CXR accounts for the ordinary capital expenses like tenant improvements and leasing
commissions. These capital expenses as a fraction of market value vary considerably across
property types owing in large measure to the expectations of tenants and the length and
characteristics of the leases. Hotel and Office properties have the highest reported CXR figures
at 0.78% and 0.59% per quarter on average, respectively. In annualized terms, the CXR results
are approximately 3.16% for Hotel properties and 2.38% for Office properties.
Property-type differences among the series and across time are more easily depicted in graph
form. Exhibits 4 and 5 show the MVI by property type for the period 2000.1 to 2014.4. In
particular, Exhibit 4 shows the MVI in terms of rolling four-quarter computations where a high
degree of correlation is evident across market cycles. From time to time, one property type or
another will lead the pack, but it is a little difficult to see the differences in this exhibit.
Another way to depict the changing pattern of MVI is to index all the property type statistics
to 100.0 at some point and graph the changes over subsequent periods. This is what is shown in
Exhibit 5 where all properties are indexed to 100.0 in 2000.1. Over the next 15 years, the
Apartment sector shows the highest growth rate of market value followed by the Retail sector. It
may be interesting to note that these two property types showed nearly identical capital value
change from 2000.1 up until the industry-wide value bottoming in 2010. Afterwards, Apartment
market value change accelerated at a pace that far outstripped the other property types in this
sample.
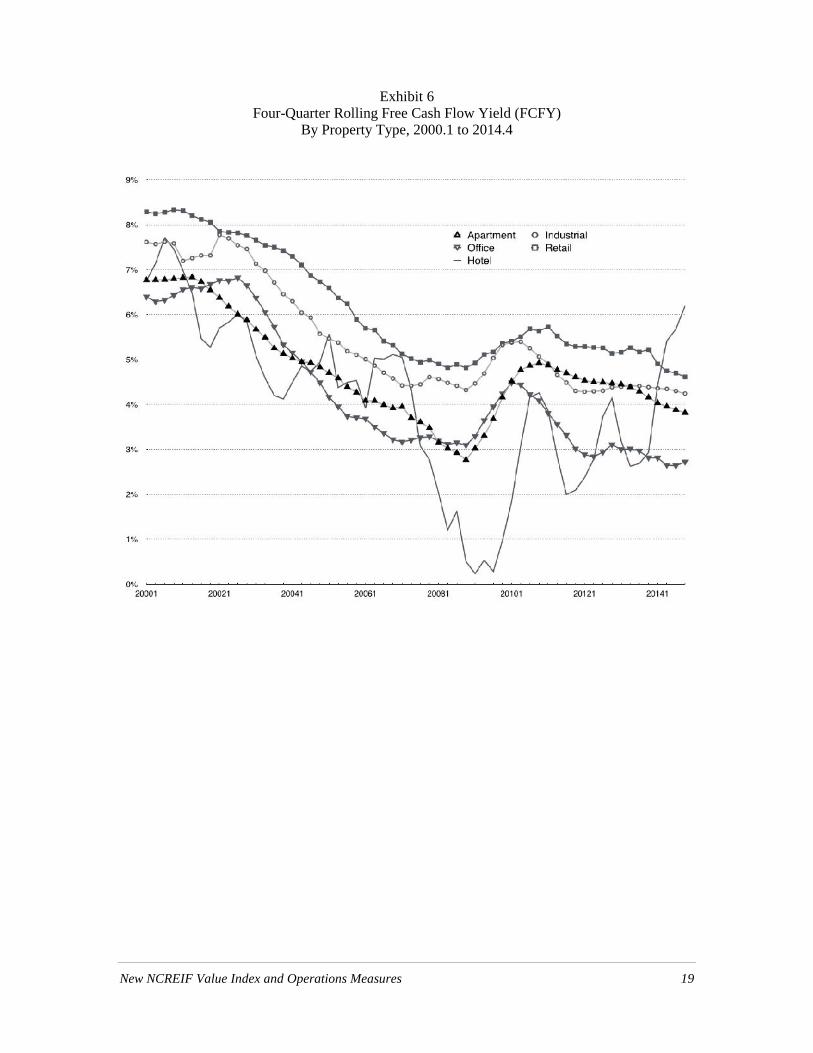
Exhibit 6 shows the generally downward trend in rolling four-quarter FCFY across all
property types since 2000. How these patterns compare to free cash flow performance in
common stocks over the same period, is another promising topic for research.

New NCREIF Value Index and Operations Measures 13
VIII. Conclusion
Since its inception over thirty-five years ago, the NCREIF Property Index (NPI) has achieved
preeminence as an indicator of the investment performance of institutionally-held commercial
property in the United States.
The data underlying the NPI have been repurposed to shed light on market value change and
operating performance in a set of three new data series called the Market Value Index (MVI), the
Free Cash Flow Yield (FCFY), and the Capital Expense Ratio (CXR). All three are available to
NCREIF members and subscribers in formats well-suited to research.
These new series provide a nice complement to the NPI, expand our understanding of the
behavior of equity real estate as an investable asset class, highlight fundamental operating
characteristics, create greater conformity with performance statistics used in the stock equity
asset class, focus on “same store” or “constant utility” property information for greater
consistency across time, and display results in equal-weighted form rather than the NPI value-
weighted form to serve as sample statistics from the universe of domestic, commercial real
estate.
Commercial property capital expenditures has been the subject of research inquiry in recent
literature as well as in papers presented at annual meetings of the Real Estate Research Institute
(RERI). NCREIF has been the principal source of data used in these research efforts. With the
refinements of NPI property data that resulted in the CXR series, research into capital expenses
by property type in response to changing macro or microeconomic conditions can be pursued
with better data than previously available. Exhibit 7 shows that patterns of CXR are generally
distinguishable by property type. Further, these patterns have relatively low correlations across
property types suggesting perhaps that variabilities within property types may or may not be tied
to changing market conditions affecting the property type nationally. Again, this may be a
productive field for research.

New NCREIF Value Index and Operations Measures 14
References
Brueggeman, W.B. and S.M. Giliberto, Measuring Real Estate Investment Performance: A
Revised Approach, NCREIF, May 1987, working paper, 1-18.
Dietz, P.O., Pension Funds: Measuring Investment Performance, The Free Press, 1966.
Fisher, J.D. and M.S. Young, New NCREIF Indices –– New Insights, NCREIF Research Corner,
January 2015.
Fisher, J.D. and M.S. Young, New NCREIF Indices –– New Insights: Part 2, NCREIF Research
Corner, June 2015.
Geltner, D.M. and H. Pollakowski, A Set of Indexes for Trading Commercial Real Estate based
on the Real Capital Analytics Transaction Prices Database, MIT Center for Real Estate,
Commercial Real Estate Data Laboratory, September 26, 2007.
Giliberto, S.M., The Inside Story on Rates of Return, Real Estate Finance, 1994, 11:1, 51-54.
NCREIF publication, NCREIF Return Formulas Explained!
Young, M.S., D.M. Geltner, W. McIntosh, and D.M. Poutasse, Defining Commercial Property
Income and Appreciation Returns for Comparability to Stock Market-Based Measures,
Real Estate Finance, 1995, 12:2, 19-30.
Young, M.S., D.M. Geltner, W. McIntosh, and D.M. Poutasse, Understanding Equity Real Estate
Performance: Insights from the NCREIF Property Index, Real Estate Review, 1996, 25:4,
4-16.
Young, M.S., Making Sense of the NCREIF Property Index: A New Formulation Revisited,
Journal of Real Estate Portfolio Management, 2005, 11:3, 211-223.
New NCREIF Value Index and Operations Measures 15
Exhibit 1Quarterly Observations and Number and Fraction Filtered by Property Type
Pre- and Post-2000, for the Period 1978.1 to 2013.4
Pre-2000 Observations Post-2000 ObservationsTotal Filtered % Filtered Total Filtered % Filtered
All Properties 132,635 958 0.72 289,543 2,079 0.72
Apartment 16,336 41 0.25 63,484 444 0.70
Industrial 55,153 411 0.75 105,254 725 0.69
Office 33,502 281 0.84 70,563 479 0.68
Retail 26,083 206 0.79 44,472 347 0.78
Hotel 1,561 19 1.22 5,770 84 1.46
Exhibit 2Price Index Comparisons

New NCREIF Value Index and Operations Measures 16
Exhibit 3Quarterly and Four-Quarter Annual Data Series Statistics in Percent
All Properties and By Property Type, 1978.1 to 2014.4
Market Value Index Free Cash Flow Yield CapEx RatioQuarterly Annual* Quarterly Annual Quarterly Annual
All Properties:
Mean 0.71 3.04 1.49 5.97 0.40 1.60
SD of Means 1.89 6.63 0.34 1.31 0.12 0.40
Median 0.93 4.52 1.52 6.04 0.41 1.71
Apartment:
Mean 1.15 4.83 1.48 5.90 0.29 1.15
SD of Means 2.01 6.64 0.36 1.39 0.11 0.29
Median 1.15 4.77 1.50 6.04 0.29 1.14
Industrial:
Mean 0.75 3.20 1.57 6.30 0.36 1.43
SD of Means 1.94 6.79 0.33 1.27 0.12 0.41
Median 0.98 4.65 1.57 6.32 0.37 1.55
Office:
Mean 0.54 2.44 1.26 5.05 0.59 2.36
SD of Means 2.45 8.52 0.39 1.49 0.21 0.75
Median 0.94 4.95 1.31 5.32 0.59 2.42
Retail:
Mean 0.68 2.87 1.67 6.67 0.32 1.29
SD of Means 1.71 5.66 0.33 1.25 0.11 0.33
Median 0.85 4.47 1.67 6.73 0.31 1.23
Hotel**:
Mean 0.44 1.99 1.25 4.99 0.78 3.12
SD of Means 2.86 8.96 0.81 2.37 0.38 1.09
Median 0.47 2.92 1.23 5.19 0.72 2.97
Notes: * Market Value Index four-quarter annual results are derived from chain-linked quarterlystatistics, while the Free Cash Flow Yield and Capital Expense Ratio four-quarter annualresults are the sum of four quarterly statistics
** Hotel data from 1981.1 to 2014.4

New NCREIF Value Index and Operations Measures 17
Exhibit 4Four-Quarter Rolling Market Value Index (MVI)
By Property Type, 2000.1 to 2014.4

New NCREIF Value Index and Operations Measures 18
Exhibit 5Indexed Market Value Index (MVI) with Index = 100.0 in 2000.1
By Property Type, 2000.1 to 2014.4
New NCREIF Value Index and Operations Measures 19
Exhibit 6Four-Quarter Rolling Free Cash Flow Yield (FCFY)
By Property Type, 2000.1 to 2014.4

New NCREIF Value Index and Operations Measures 20
Exhibit 7Four-Quarter Rolling Capital Expense Ratio (CXR)
By Property Type, 2000.1 to 2014.4

New NCREIF Value Index and Operations Measures 21
Footnotes
1 See Geltner and Pollakowski (2007).
2 Examples of Partial Sales (PS) include the net sales price of one building from say a multi-building
industrial park or the net sales price of an outparcel on the periphery of a shopping center.
3 Capital expenditures are generally reported as positive numbers, but occasionally there will be
accounting “reversals” resulting in negative numbers for reported capital expenditures.
4 Additionally, NCREIF began collecting detailed information on four revenue items and eight
operating expense items at the same time.
5 It should be noted that various data series from firms such as Wilshire Associates Incorporated and
Standard & Poor’s are equal-weighted when the statistics are intended to represent a ratio for a short period
of time, a P/E ratio, for example. However, the total returns for equities reported by these firms are value-
weighted.
6 Value-weighted versions of each series are available from NCREIF as custom reports.