new nsidc product aids in closing the gap on credible ... · new nsidc product aids in closing the...
TRANSCRIPT

U.S. DEPARTMENTOF COMMERCE
National Oceanicand AtmosphericAdministration
– continued on page 2
New NSIDC product aids in closing the gap on credible climate projections
Vol. 9, No. 2 ● December 1998
EARTH SYSTEM MONITOR
A guide toNOAA's data and
informationservices
INSIDE
3News briefs
5Monitoring global
surface temperature
8Exploring with the
NOAA Central Library
11Data productsand services
Polar Pathfinder Data
Annette Varani and Rachel HauserNational Snow and Ice Data CenterNOAA
As governments and indus-tries continue to debate the costsof implementing emissions-limit-ing measures, such as those calledfor in the Kyoto Protocol, theimportance of accurate climatemodeling is cast into severe relief.Decision makers, initiating con-servative legislation designed tomodify entrenched yet poten-tially climate-altering consumerbehaviors, rely on credible scien-tific projections to leverage votersupport and, ultimately, to edu-cate societies toward makingwhat are sometimes painfulchanges.
Global warming predictionsrun the gamut from melting polarcaps, rising sea levels, increases intropical diseases, damage to for-ests and coral reefs, to speciesextinction and regional famine—the outlook appears grim. Yet aconcurrent reality is that it’s hardto convert believers, and harderstill to inspire spending, when asat present the ability of climate models to por-tray surface processes remains somewhat crude.
“For instance, it’s uncertain how well theArctic system is reflected in climate models,”says Greg Flato, a research scientist at the Cana-dian Centre for Climate Modeling and Analysis.“If you look at results of general circulationmodels that project future temperature changes,the Arctic is anticipated to experience the largestwarming.” Given this potential sensitivity toclimate change, he says, “it’s important tounderstand how accurate those projections areand what they mean.”
Yet research is typically impeded by gaps inobservations of remote areas and by technicaldifficulties inherent in manipulating data fromdifferent sources, such as grappling with dataprovided on a variety of grids or data locked intowildly diverging formats. Before numerical pro-cess descriptions can be reached, available datamust be reduced to common terms.
With the needs of the climate modelingcommunity in mind, an elite group of cold re-gion researchers—NOAA/NASA Pathfinder inves-tigators working with polar data—have teamedwith the National Snow and Ice Data Center(NSIDC) to produce a suite of complementaryproducts designed to improve current representa-tions of what is happening in the cryosphere.
In January 1999, NSIDC will release an ad-vance CD-ROM containing samples of PolarPathfinders created from the output of four sen-sors, the Advanced Very High Resolution Radi-ometer (AVHRR), the Special Sensor Microwave
▲ Figure 1. A 25-km image (reduced resolution from 5-km satelliteimages) of the Arctic is provided for September 8, 1997 showingsurface albedo brightness temperatures and surface temperatures.Future versions of the P-Cube data set will use averages of the 5-kmAVHRR product.
NOAA/National Snow and Ice Data CenterCIRES, Campus Box 449University of ColoradoBoulder, Colorado 80309Phone: 303-492-6199Fax: 303-492-2468E-mail: [email protected]: http://www-nsidc.colorado.edu
DEP
ARTMENT OF COMMERC
E
★ ★
UN
ITEDSTATES OF AMER
ICA

2 December 1998EARTH SYSTEM MONITOR
EARTH SYSTEM MONITOR
The Earth System Monitor (ISSN 1068-2678) is published quarterly by the NOAAEnvironmental Information Services office.Questions, comments, or suggestions forarticles, as well as requests for subscrip-tions and changes of address, should bedirected to the Editor, Sheri A. Phillips.
The mailing address for the Earth SystemMonitor is:National Oceanographic Data CenterNOAA/NESDIS E/OC1SSMC3, 4th Floor1315 East-West HighwaySilver Spring, MD 20910-3282
MANAGING EDITORDr. Anthony R. Picciolo
Telephone: 301-713-3281 ext.140Fax: 301-713-3302
E-mail: [email protected]
EDITORSheri Phillips
Telephone: 301-713-3280 ext.127Fax: 301-713-3302
E-mail: [email protected]
ASSOCIATE EDITORRoger Torstenson
Telephone: 301-713-3281 ext.107Fax: 301-713-3302
E-mail: [email protected]
DISCLAIMERMention in the Earth System Monitor ofcommercial companies or commercialproducts does not constitute an endorse-ment or recommendation by the NationalOceanic and Atmospheric Administrationor the U.S. Department of Commerce.Use for publicity or advertising purposes ofinformation published in the Earth SystemMonitor concerning proprietary productsor the tests of such products is notauthorized.
U.S. DEPARTMENT OF COMMERCEWilliam M. Daley, Secretary
National Oceanic andAtmospheric Administration
D. James Baker,Under Secretary and Administrator
Polar data, from page 1Imager (SSM/I), and two instruments(high-resolution infrared radiationsounder (HIRS) and the microwavesounding unit (MSU)) on the TIROSOperational Vertical Sounder (TOVS), ina unique data package called the P-Cubethat allows the different data sets to beintegrated.
The NOAA/NASA Pathfinder pro-gram was begun in 1991 to producelong time-series from existing satellitedata sets that could be used forglobal change research prior to theavailability of EOS data. Because thepolar regions hold special significancein the climate system, Pathfinder teamsworking with cryospheric data setsformed a consortium to develop dataproducts that could address technicaldifficulties and the science needs ofboth the polar research and the broaderclimate change modeling communities.
In addition to providing a standard-ized 15-plus year record for climate re-search, the Polar Pathfinder principalinvestigators worked together to de-velop consistent approaches to dataformatting, and gridding. All Polar Path-finder data have been projected to theNSIDC Equal-Area Scalable Earth-Grid(EASE-Grid, see “The NSIDC EASE-Grid”ESM 7(4):6-7,14). The data have syn-chronized file formats and namingconventions. In addition, the three in-struments selected for demonstration onthe new CD-ROM provide different andcomplementary information, Flatopoints out.
“AVHRR provides high resolutionthermal and visible surface imagery andgives quantitative information on icetypes, but suffers because it can’t seethrough clouds,” says Flato. “SSM/I iscoarse, low-resolution data that doesn’thave as many channels as AVHRR, so itgives less surface information. However,SSM/I sees through clouds, giving us iceconcentrations, large-scale surface tem-peratures and ice motion informationeverywhere. TOVS main purpose is totake measurements of the atmosphericcolumn above the ice.”
The NSIDC data sampler carriesAVHRR visualizations and time series attwo resolutions, 1.25 and 5 km (Figure1). At a resolution that rivals the scale ofin situ data, 1.25 km AVHRR data offerinsights into detailed surface conditionsand processes such as sea ice formation,
sea ice motion and ice sheet mass bal-ance. For the January release, three siteswere selected from 1997 NorthernHemisphere AVHRR composites to cor-respond to areas of active field pro-grams.
These areas, the Surface Heat Budgetof the Arctic Ocean (SHEBA) study re-gion in the Beaufort Sea, the ETH/CUCamp in western Greenland, and PointBarrow, Alaska, cover the main polarsurface types: sea ice cover, ice sheets,and polar lands. Products include dailysea-ice motion vector fields and twice-daily composited images of albedo, sur-face temperature, and the calibrated andgeolocated AVHRR channel data used togenerate them.
Compared to visible-spectrum sen-sors, passive microwave remote sensingpenetrates non-precipitating clouds andseasonal polar darkness, distinguishingbetween different kinds of sea ice,ocean, and snow cover. With thecompletion of processing in early 1999,the Polar Pathfinder passive microwaverecord will include the ScanningMultichannel Microwave Radiometer(SMMR), thereby extending the datahistory to more than 20 years.
For now, samples of NSIDC’s EASE-Grid Brightness Temperature seriesbased on SSM/I passive microwave dataare included on the new release (Figure2). The brightness temperatures provideinformation on polar oceans that hasbecome essential to tracking ice edges,for estimating sea ice concentrations,and for classifying sea ice types.
Interest in the potential of passivemicrowave data for polar researchershas engendered creation of a number ofvaluable spin-offs, such as the NorthernHemisphere EASE-Grid Weekly SnowCover and Sea Ice Extent, and the NearReal-Time Ice and Snow Extent (NISE)Product, designed to provide NASA EOSinstrument calibration teams (CERES,MISR and TRMM) with near real-time,daily, global snow cover and sea iceconcentration data. Imagery for each ofthese product sets are included on thenew CD; sample Northern Hemispheremonthly snow depth climatologies de-rived from SSM/I EASE-Grid BrightnessTemperatures demonstrate productapplications.
TOVS atmospheric soundings, vitalfor weather forecasting, capture detailed
—continued on page 4
NA
TIO
NA
LO
CEA
NICAND ATMOSPHERIC
ADMIN
IST
RA
TIO
N
U.S. DEPARTMENT OF COMMER
CE

3December 1998 EARTH SYSTEM MONITOR
News briefsProposal funded to investigateNorth Atlantic climate variability
NGDC Paleoclimatologist DavidAnderson was awarded funding from theNational Science Foundation for a cruiseto the North Atlantic (together with Uni-versity of Colorado scientists J. Andrews,A. Jennings, J. Syvitski, and J. Hardar-dottir). Six nations will participate in thecruise scheduled for August 1999, aboardthe French research ship the MarionneDufrenne, the only ship in the worldequipped to collect long (50m) cores fromthe seafloor. The sediments will be used tostudy the climate variability of the NorthAtlantic over the past centuries to thou-sands of years using paleoclimate proxies,and will yield insights into past variationsin the North Atlantic thermohaline circula-tion, North Atlantic Oscillation, and thefrequency of events such as the great sa-linity anomaly.
Drier conditions expected insouthern United States
If La Niña conditions strengthen inthe tropical Pacific Ocean, they will impactprecipitation and temperature patterns inthe next three to six months, according toa scientist with the National Oceanic andAtmospheric Administration. Speaking atspecial La Niña briefings, Dr. Gerry Bell,research meteorologist at the NationalWeather Service Climate Prediction Cen-ter, said strengthening La Niña conditionswould mean, “The southern United Statescan expect a drier, warmer and lessstormy winter due to the effects of LaNiña through the spring.” This drynessmight intensify already existing droughtconditions in the deep South.
According to Bell, “Texas, NewMexico and Oklahoma will likely be drierand warmer.”“Georgia and Florida willalso likely be drier and warmer. Louisiana,Mississippi and Alabama will likely bewarmer, but near normal precipitation isexpected during the months of January,February and March 1999 and Tennesseewill likely be wetter and warmer,” Bellsaid.
La Niña reflects cooler than normalsea surface temperatures across the east-ern half of the tropical Pacific, whereasduring El Niño, the ocean waters in thatregion are warmer than normal. The laststrong La Niña occurred in the winter of1988-89. Armed with graphic reviews ofconditions in the tropical Pacific Ocean,Bell explained how the National Weather
Service Climate Prediction Center con-ducts its state-of-the-art research.
According to Bell, the center monitorsLa Niña and El Niño with a network ofbuoys and satellites operated by the Na-tional Oceanic and Atmospheric Adminis-tration. He also explained how La Niñaimpacts the weather throughout theworld. “These temperature changes affectglobal wind and air pressure patterns andour world’s climate, as well as the locationof marine life,” Bell said. “El Niño and LaNiña have always been a naturally occur-ring part of our global climate system.Thanks to widespread research effortsthroughout the world and recent ad-vances in technology, our observing andforecasting capabilities have significantlyimproved in the past few years.”
The current La Niña began develop-ing in the eastern half of the tropical Pa-cific in late May and June 1998, withocean temperatures dropping up to 10degrees Fahrenheit in that period, signal-ing the end of the 1997-98 El Niño cycle.According to an advisory issued by theClimate Prediction Center on September10, 1998, moderate La Niña conditionsare expected to develop and persist forthe remainder of 1998 and continue intothe spring. This outlook is consistent withforecast models being run by other re-search institutions around the world.
NGDC hosts international spaceagencies for CEOS group meeting
On behalf of NOAA, NGDC hostedthe subgroups and task teams of the Com-mittee on Earth Observation Satellites(CEOS) Working Group on InformationSystems and Services, September 21-25 inBoulder. About 60 scientists, primarilyfrom North America, Europe and Japan,reviewed progress in data, networks, andaccess. David Clark led the local organiz-ing committee, David Hastings reportedon the final review and assembly of theGlobal Land One-km Base Elevation eleva-tion model and on the Web-based VirtualWorkshop on Environmental Data Issues,Ian Sprod presented the Web ImageSpreadsheet, and other NOAA personnelwere active in the meeting. Other high-lights included increased collaborationwith the International Geosphere-Bio-sphere Programme and the International
Society of Photogrammetry and RemoteSensing.
U.S.-Russia agree to participate incollaborative projects
At the Environmental Working GroupVIII Data Exchange Coordinators Meeting,Dr. R.G. Barry, National Snow and IceData Center (NSIDC) Director, partici-pated in the joint U.S.-Russia discussionsheld at the National Center for Atmo-spheric Research, Boulder, September 14-18. He reported on collaborative projectsrelated to data on snow water equivalentwith the Institute of Geography, RussianAcademy of Sciences (RAS), Moscow, soiltemperature with the Soils Institute, RAS,Pushchino, and fresh water ice with theState Hydrological Institute, St. Peterburg.The projects are supported by ESDIM, theNational Science Foundation, and theCooperative Institute for Research in theEnvironmental Sciences/NSIDC. Planswere developed for activities in 1999,subject to funding availability.
Joint Coordination Panel for Dataand Information Cooperation
The Sixth Meeting of the Joint Coor-dination Panel for Data and InformationCooperation took place in Tianjin, China,September 14-18, 1998. U.S. participantswere Dr. Henry Frey, Director NODC; Dr.Michael Loughridge , Director NGDC, Dr.Bruce Parker (co-rapporteur), Chief, CoastSurvey Development Lab, NOS; Dr.Wayne Wilmot, NODC; and Joe Elms,NCDC. Discussions were held on progressachieved during the past intercessionalperiod and a cooperation plan was estab-lished for the next period. Further discus-sions were held between NODC staff andJoe Elms to establish details of the keyingformat and schedule of the project.
Two new items were added to the listfor cooperative research and data ex-change: Coral Reefs and Harmful AlgalBlooms. A Workshop on Coastal OceanManagement was also held. Joe Elms pre-sented an update on the status of globalsurface marine collections and the currentUS-PRC Implementation plan. A summaryreport signed by the head of the two del-egations, Dr. Frey and Professor HouWenfeng, Director, National Marine Dataand Information Service of China, is avail-able for more detailed information.

4 December 1998EARTH SYSTEM MONITOR
—continued on page 12
information about the atmosphericprofile from the Earth’s surface to thestratosphere. The TOVS-derived yieldincludes temperatures of each layer,percent precipitable water, effectivecloud fraction, cloud top temperatureand pressure, turning angle betweengeostrophic wind and surface stressover ice, microwave emissivity, bound-ary layer stratification and geostrophicdrag coefficient (Figure 3).
In polar research communities, theTOVS high quality atmospheric data isespecially valued because it providesmeasurements for regions where insitu data are difficult to acquire. Thenew CD features animations showingwarm air and other features beingtransported over the Arctic.
In addition to demonstrating therichness and utility of the surface andatmospheric Polar Pathfinder data col-lections now available or soon to bereleased as extended time-series, Path-
▲ Figure 3. Atmospheric temperaturesfrom the P-Cube data set show tempera-ture variation in the Arctic at 850 mb onFebruary 18, 1998. Warmer temperaturescan be seen in the Chuckchi Sea nearAlaska, while much cooler air tempera-tures are observed closer to the northpole. Missing data are indicated by theblack pixels.
▲ Figure 2. SMMR and SSM/I EASE-Grid brightness temperatures provide users with information on the polar oceans and have be-come essential to the tracking of ice edges, for estimating sea ice concentrations, and for classifying sea ice types. Shown here are glo-bal brightness temperatures from September 8, 1997.
finder investigators have developed aunique analysis package called the P-Cube that combines products. The goal,according to Flato, is to allow unprec-edented understanding of interactionsbetween arctic ice, ocean, and atmo-sphere.
“These data are attractive becausethey’re all mapped to the same grid.They’re all in the same convenient for-mat,” he says. “Usually, data are scat-tered. To use them you have to scout
Polar data, from page 2
5December 1998 EARTH SYSTEM MONITOR
NOAA climatic researchers assist in U.S. policy decisions related to global warming
Monitoring global surface temperature
1Robert Quayle, Thomas Peterson,Alan Basist, Thomas Karl, andClaude WilliamsNational Climatic Data CenterNOAA/NESDIS
2Norman GrodyOffice of Research and ApplicationsNOAA/NESDIS
IntroductionBeginning in mid-1997, the surface
temperature of the globe, both landand sea, began to exhibit unprec-edented warmth. To assist with U.S.policy decisions relating to globalwarming, NESDIS developed a series ofglobal metrics that could place ongoinganomalies in century-scale perspective.To do this in a timely way, a blend ofsatellite data (AVHRR and SSM/I), and
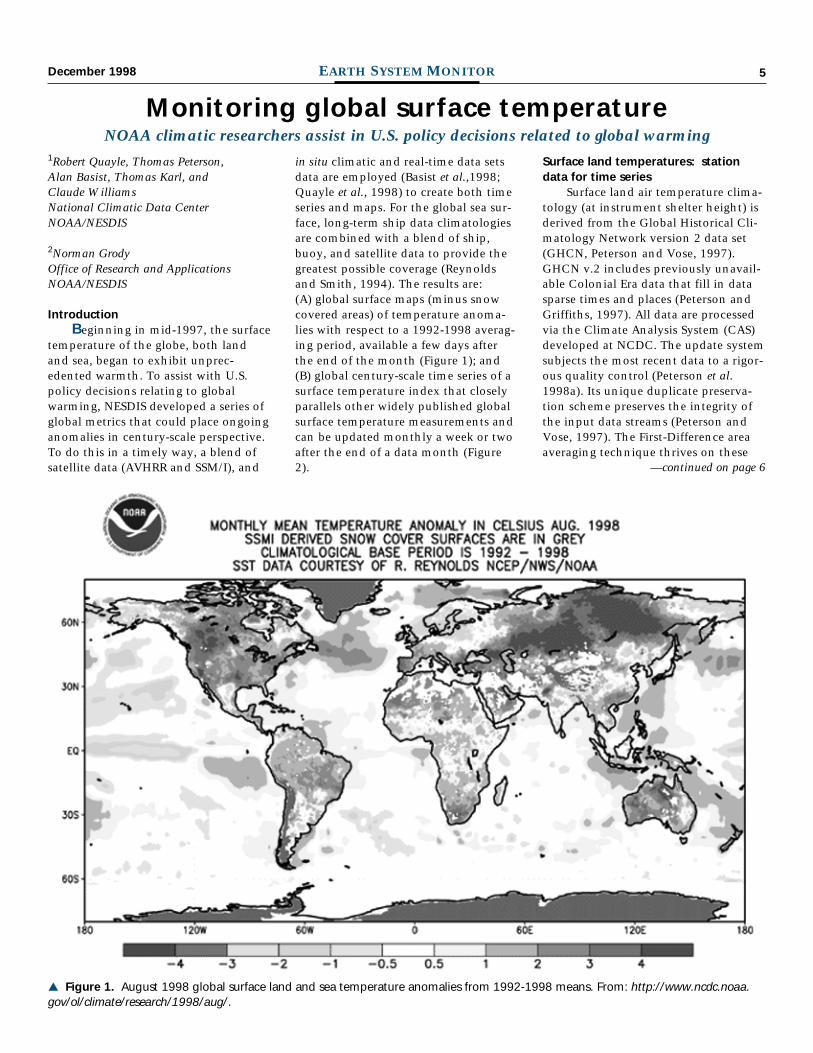
in situ climatic and real-time data setsdata are employed (Basist et al.,1998;Quayle et al., 1998) to create both timeseries and maps. For the global sea sur-face, long-term ship data climatologiesare combined with a blend of ship,buoy, and satellite data to provide thegreatest possible coverage (Reynoldsand Smith, 1994). The results are:(A) global surface maps (minus snowcovered areas) of temperature anoma-lies with respect to a 1992-1998 averag-ing period, available a few days afterthe end of the month (Figure 1); and(B) global century-scale time series of asurface temperature index that closelyparallels other widely published globalsurface temperature measurements andcan be updated monthly a week or twoafter the end of a data month (Figure2).
Surface land temperatures: stationdata for time series
Surface land air temperature clima-tology (at instrument shelter height) isderived from the Global Historical Cli-matology Network version 2 data set(GHCN, Peterson and Vose, 1997).GHCN v.2 includes previously unavail-able Colonial Era data that fill in datasparse times and places (Peterson andGriffiths, 1997). All data are processedvia the Climate Analysis System (CAS)developed at NCDC. The update systemsubjects the most recent data to a rigor-ous quality control (Peterson et al.1998a). Its unique duplicate preserva-tion scheme preserves the integrity ofthe input data streams (Peterson andVose, 1997). The First-Difference areaaveraging technique thrives on these
—continued on page 6
▲ Figure 1. August 1998 global surface land and sea temperature anomalies from 1992-1998 means. From: http://www.ncdc.noaa.gov/ol/climate/research/1998/aug/.

6 December 1998EARTH SYSTEM MONITOR
Surface temperature, from page 6duplicates and maximizes the globaldata available for analysis (Peterson etal., 1998b). Homogeneity adjustmentprocedures developed over several yearsassures objective, reproducible homoge-neous time series (Peterson and Easter-ling, 1994, Easterling and Peterson,1995, Peterson et al., 1998c).
Data volume varies from severalhundred stations per year to severalthousand (Peterson and Vose, 1997).For 1997, over 14,000 individual sta-tion monthly records are used in theanalysis to produce 5x5 degree grid boxdata that are summarized into hemi-spheric and global averages.
Surface land temperatures: satellitedata for maps
The global land surface map prod-uct (still experimental, Basist et al.,1998) is derived from the Special SensorMicrowave Imager (SSMI), a polar orbit-ing satellite with global coverage, andstation data derived from the GTS. Thedata are available in near real-time bythe fifth day of the following month.Anomalies are derived from the 1992-1997 or 1998 base period. The spatialresolution is 10, and it is not availablewhen snow cover is observed over agrid box during a portion of themonth, or if the climatology placessnow cover in a grid during 3 monthsof the base period.
To measure temperature, numeroussurface types were identified and ad-justments made for variations in emis-sivity. Training data sets were used todefine the relationship between theseven SSM/I channels and the nearsurface temperature. Surface types (e.g.,water, snow, ice, and deserts) as well asprecipitation were identified, and nu-merous adjustments and/or filters weredeveloped. The global and U.S. net-works of first order and cooperative
stations, quality controlled by NCDC,serve as validation.
Sea surface temperatures: satellite insitu blend for maps and time series
The Global Ocean Surface Tem-perature Atlas (GOSTA, Bottomley et al.,1990), provides a century+ globalrecord of 5x5 degree grid box in situ SeaSurface Temperature (SST) means byyear through 1996. For this study, weuse the UKMO HSST in the form ofanomalies with respect to a 1961-90averaging period (Folland et al., 1993).For near real-time updates, the mosttimely and geographically completedata available are the National Centersfor Environmental Prediction–Opti-mum Interpolation (NCEP OI) blendedsatellite, ship and buoy SST data set(Reynolds and Smith, 1994), also inmonthly 5x5 degree grid box format,available for all years since 1982. Globalaverages and the accompanyinganomaly series were produced fromboth data sets.
To fuse the two time series, asimple linear regression is performed
for global monthly (and annual) meananomalies for the years 1982-1997,using NCEP OI SST with respect to1982-1997 as the dependent variableand UKMO HSST with respect to 1961-90 as the independent variable. The fitwas very good (r = 0.93) considering theareas covered are somewhat different,with ship data available primarily alongshipping lanes, and blended NCEP OIdata being virtually global.
Using the monthly equations,UKMO HSST data are converted tomodeled NCEP OI SST anomalies (from1961-90 means) for each month from1880 thru 1981. The NCEP OI SST dataare appended to this record, and areupdated shortly after the end of eachdata month. For plotting purposes, thedata are then adjusted to anomaliesfrom an 1880-1997 averaging period.
On a globally averaged basis, theNCEP OI data are somewhat coolerthan the UKMO HSST data, but thereasons are not yet fully known. Possi-bly, (1) the use of modeled SST data inthe vicinity of the ice edge by UKMOHSST creates a warmer strip of water in
▲ Figure 2. Global century-scale time series of a surface temperature index that closelyparallels other widely published global surface temperature measurements and can beupdated monthly within two weeks after the end of a data month.
1National Climatic Data CenterNOAA/NESDIS151 Patton AvenueAsheville, NC 28801-5001E-mail: [email protected]
2Office of Research and ApplicationsNOAA/NESDIS E/RA25200 Auth RoadCamp Springs, MD 20746-4304E-mail: [email protected]

7December 1998 EARTH SYSTEM MONITOR
polar areas; and (2) the use of satelliteAVHRR Multi-Channel SSTs, uncor-rected by ship and buoy data in someextremely data-sparse areas, creates amodest cooling (because of skin tem-perature effects).
The global blendNCDC now has readily updatable
global surface land-air temperature andglobal SST anomalies (time series andmaps) through the latest month, two to10 days after the end of a data month.The land data set is essentially indepen-dent from the ocean data, and are sum-marized independently of each other.To combine these data into a simpleblend, the land temperature is weightedwith a coefficient of 0.3 (since about30% of the surface of the Earth is land)and the sea temperature with 0.7 (asthe globe is about 70% ocean).
When the time series blend is com-pared to similar data developed at theNASA Goddard Institute for Space Stud-ies (www.giss.nasa.gov, documented inHansen and Lebedeff, 1987; Reynoldsand Smith, 1994; Smith et al., 1996),the match is very good (r=0.95) for theperiod for which Hansen has a land-ocean product (1950 to the present,also using NCEP OI SST). The match (r=0.87) with the current global bench-
mark surface data set for the period1880-1996 is also relatively good, par-ticularly for a near-real time prod-uct.
In summary, we believe we havecombined several of the best data setsin the world for their respective special-ties: For time series: UKMO HSST forlong-term SST; NCEP OI SST (viaMCSST and in situ) for recent decades;and the GHCN and for global land sur-face temperatures. For maps: SSM/I,and NCEP OI SST. The techniques arerobust and the results compare favor-ably with other widely used analyses.
ReferencesBasist, A., N. Grody, T. Peterson and C. Will-
iams, 1998: Using the Special SensorMicrowave Imager to Monitor Land Sur-face Temperature, Wetness, and SnowCover, J. Applied Meteor., (in press).
Bottomley, M., C.K. Folland, J. Hsiung, R. E.Newell, D. E. Parker, 1990: Global OceanSurface Temperature Atlas “GOSTA”,Bracknell [England] U.K.: MeteorologicalOffice; [Cambridge]: Massachusetts Insti-tute of Technology. 337pp. Also see:http: //www.meto.govt.uk/sec5/CR_div/climate_index/hadley_mohsst.html
Easterling, David R. and Thomas C. Peterson,1995: A new method for detecting andadjusting for undocumented discontinui-ties in climatological time series. Int. J.Climatol.,15, 369-377.
Folland, C. K., R. W. Reynolds, M. Gordon, andD. E. Parker, 1993: A study of six opera-tional sea surface temperature analyses. J.Climate, 6, 96-113,.
Hansen, J., and S. Lebedeff, 1987: Globaltrends of measured surface air tempera-ture. J. Geophys. Res., 92, 13,345-13,372.Updated at: www.giss.nasa.gov.
Hansen, J., R. Ruedy, M. Sato, and R. Reynolds,1996: Global surface air temperature in1995: Return to pre-Pinatubo level.Geophys. Res. Lett., 23, 1665-1668.
Jones, P.D., 1994: Hemispheric surface airtemperature variations: A reanalysis andupdate to 1993. J. Climate, 7, 1794-1802.
Peterson, Thomas C. and David R. Easterling,1994: Creation of homogeneous com-posite climatological reference series. Int.J. Climatol., 14, 671-679.
Peterson, Thomas C. and Russell S. Vose, 1997:An overview of the Global Historical Cli-matology Network temperature database. Bull. Amer. Meteor. Soc., 78, 2837-2849.
Peterson, Thomas C. and John F. Griffiths,1997: Historical African data. Bull. Amer.Meteor. Soc., 78, 2869-2871.
Peterson, Thomas C., Russell S. Vose, RichardSchmoyer, and Vyachevslav Razuvav,1998a: Quality control of monthly tem-perature data: The GHCN experience.Int. J. Climatol., in press.
Peterson, Thomas C., Thomas R. Karl, Paul F.Jamason, Richard Knight, and David R.Easterling, 1998b: The First Difference
—continued on page 12
The 1998 hurricane season broughtan above-average number of hurricanesand tropical storms—including thedevastating Hurricane Mitch—makingit the deadliest Atlantic region seasonin more than 200 years in terms ofstorm-related fatalities, reported scien-tists at the Commerce Department’sNational Oceanic and AtmosphericAdministration. A contributing factorto the increased activity—50 percentmore hurricanes and 30 percent moretropical storms than normal—was aclimate phenomenon called La Niña,cooler-than-average sea-surface tem-peratures in the central tropical Pacific.
In a joint August 4 outlook, fore-casters at NOAA’s Climate PredictionCenter, National Hurricane Center andHurricane Research Division correctlypredicted above normal tropical stormsand hurricanes in the Atlantic betweenAugust and October. The Atlantic sea-
son, which runs June 1 to November30, spawned 14 tropical cyclones (aver-age is 10) with ten becoming hurricanes(the average is six). Almost all of thesestorms and hurricanes occurred subse-quent to the forecasts. There were $3.2billion in insured damages and 21deaths in the United States.
“The season started a little latewith Tropical Storm Alex on July 27,but made up for lost time,” said JerryJarrell, director of the National WeatherService's National Hurricane Center.“In a remarkable span of 35 days be-tween August 19 and September 23, tennamed tropical storms formed. That’snearly a whole year’s worth of activitycrammed into little more than amonth.”
The year tallied seven landfallingstorms in the continental United States,including Hurricanes Bonnie, Earl,Georges, Frances and Mitch (the last
two were downgraded to a tropicalstorm on landfall) and Tropical StormsCharley and Hermine.
The 1998 Atlantic season was thedeadliest in more than 200 years. Notsince the hurricane of 1780 that struckMartinique, St. Eustatius and Barbados(October 10-16, 1780), killing between20,000 and 22,000, has the Atlantichurricane basin seen storm-related fa-talities like those of Hurricane Mitch(October 21-November 5). Wire servicesattribute some 11,000 deaths to Mitch,with thousands more missing.
In this “mean” season, Mitch, aCategory 5 monster, registered averagesustained winds near 180 mph (October25) with gusts well over 200 mph.Mitch was the fourth most intense hur-ricane ever observed in the Atlanticbasin this century based on barometricpressure, and the strongest ever ob-
1998: A “mean” season for Atlantic hurricanes
—continued on page 12

8 December 1998EARTH SYSTEM MONITOR
Albert E. ThebergeNOAA Central LibraryNOAA/NESDIS
One of my pleasant memories ofchildhood was the Saturday trip to thelocal library. Besides the usual storiesand poems, the children’s section hadbooks on far-away lands, maps andatlases, many history books, and booksfor exploring nature. There was also abox of old stereo photos that could beplaced in a viewer for scenes of adven-ture to pop out in 3-D. Unfortunately, Iwas never quite able to see in 3-D; yet itwas fun to spend hours perusing theold photos in a flat 2-D world. Because of the computer revolutionand today’s Internet, there have beenvoices decrying the loss of contact withthe treasures and the homey safe atmo-sphere of the venerable town library.But have the computer and the Internetreally caused a loss of the old-style li-brary? Or has it instead made librarytreasures, both old and new, accessibleto hundreds if not thousands morepatrons than ever before?
In the case of the NOAA CentralLibrary and the affiliated NOAA librar-ies, the answer to the first question is aresounding “No!” In the case of thesecond question, the answer is anequally resounding “Yes!” Suddenly,because of computer technology, andin particular the Internet, the resourcesand treasures of the NOAA Central Li-brary and the other NOAA libraries arebecoming increasingly accessible to alarger segment of the citizens of theUnited States and of other lands.
The NOAA Central Library Home Page By accessing the NOAA Central Li-brary Home Page at http://www.lib.noaa.gov/, the Internet user can enter theadventure and wonder of the NationalOceanic and Atmospheric Administra-tion. As with the traditional library of
old, there is a catalog that providesaccess to over 150,000 titles dealingwith the oceans, the atmosphere, fish-eries science, marine biology, and all ofthe peripheral subject matter that bearson NOAA’s mission.
Through the NOAA History Page,stories of the adventures and accom-plishments of NOAA’s ancestors can befound. Under collections, the photocollection contains thousands of digi-tized photographs detailing the work ofNOAA and its ancestor agencies, whilea special treat awaits those who wish toperuse the old maps and charts of theNOAA historical map and chart collec-tion. But, because of the Internet, manynew functions and services have beenadded for those who access the NOAACentral Library. WINDandSEA, the Library Internetguide, opens the power of the Internetfor those wishing to explore our fisher-ies, our oceans, and our atmosphere.Time spent in the NOAA Browser willhelp the user find his/her way into themany nooks and crannies of NOAA.And a look at the NOAA Library andInformation Network will help guide auser to the specialized or regionalNOAA Library that will meet his/herneeds. Although the NOAA CentralLibrary Home Page has many addi-
tional sources of information, the fol-lowing discussion only touches on theaforementioned sub-sites and func-tions. The discussion follows the orga-nization of the Library Home Page.
The NOAA Library Catalog The NOAA Library Catalog is basi-cally a digital card catalog that allowsaccess to over 150,000 titles in theNOAA Library system. It is a joint effortof the NOAA Central Library and otherNOAA libraries throughout the country.The digital catalog includes most titlesacquired after 1975 and a small per-centage of the pre-1975 NOAA Libraryholdings. The primary means of search-ing the catalog includes words andphrases, title, and author. The catalogprovides the user with the documentcall number, the NOAA library or librar-ies at which the document resides, andthe document status (in stacks, refer-ence only, rare-book, etc.) among otherparameters. The catalog also allowsaccess to over 300 full-text digital docu-ments. The pre-1975 holdings in the NOAALibrary system approach 1 milliondocuments and include many rareworks available only within the NOAALibrary system. In fact, because of wide-spread destruction during World War
Utilizing the power of the Internet to aid users researching the oceans and atmosphere
Exploring with the NOAA Central Library
NOAA Central LibraryNOAA/NESDISSSMC3, 2nd Floor E/OC41315 East-West HighwaySilver Spring, MD 20910E-mail: [email protected]
▲ Figure 1. NOAA ship Surveyor in pack ice, Bering Sea, Alaska, 1977. Photo courtesyof the NOAA Office of NOAA Corps Operations.

9December 1998 EARTH SYSTEM MONITOR
II, the NOAA Central Library has one ofthe largest pre-World War II collectionsof European meteorological and geo-detic works in existence. The pre-1975documents are found through manualcard catalogs and are being added tothe digital catalog as time and resourcepermit.
WINDandSEA WINDandSEA is the NOAA CentralLibrary Internet Locator for the oceanicand atmospheric sciences. It was de-signed initially to help the Library ref-erence staff respond to questionscoming from NOAA personnel, otherGovernment entities, academia, com-mercial organizations, and the generalpublic. Today this resource is availableto all. The site contains four majorparts: 1) a current interest page; 2) a“Teachers’ and Students’ Corner; 3) themain index; and 4) the annotated linksthat lead to both NOAA and outsidesites.
Today, WINDandSEA provideslinks to over 1,000 sites organized into42 major headings and approximately150 sub-headings. For best results withWINDandSEA it is advisable to studythe index prior to using. For educatorsand students, the “Teachers’ and Stu-dents’ Corner” provides access to over100 NOAA education pages as well asaccess to many other Government sci-ence agency education sites, academiceducation sites including full courses inoceanography and meteorology, andover 100 NOAA photo sites (Figures 1-3).
The NOAA Browser The NOAA Browser is basically aWINDandSEA type of vehicle that onlylinks to NOAA Internet sites. TheBrowser was devised to help navigatewithin NOAA. This is not a trivial exer-cise, as NOAA is an agency with hun-dreds of functions, field installations invirtually all states and territories, andoperations all over the Earth.
Presently there are over 500 linksin the Browser. In general, the site isorganized hierarchically with links fol-lowing NOAA’s structure. Within theBrowser, one can find: NOAA ship,aircraft, diving, and satellite operations;environmental science studies extend-ing from the center of the Earth to thesurface of the Sun; information on
charting our seaways and airways; in-formation related to managing theAmerican fisheries including statistics,habitat management, protected species,and marine mammals; links to WeatherService sites including the NationalCenters for Environmental Prediction,local weather forecast and river forecastoffices, and many headquarters func-tions; links to the NOAA data centersincluding oceanographic, geophysical,and meteorological data; and NOAAmanagement information.
If one wishes to explore NOAA orcomprehend the structure and scope ofits operations, the Browser is a goodplace to start.
NOAA history NOAA is descended from the oldestphysical science and conservation agen-cies in the United States. These agencieswere instrumental in forming theAmerican science community and inhelping establish the American Associa-tion for the Advancement of Science,the National Academy of Sciences, theAmerican Geophysical Union, and theAmerican Meteorological Society. As anaside, the NOAA Library is descendedfrom the Coast Survey Library, theWeather Bureau Library, and the FishCommission Library.
The Coast Survey Library was theoldest physical science library in theUnited States and probably the WesternHemisphere. The initial collection of
3,000 books was brought to America byFerdinand Hassler, the first Superinten-dent of the Coast Survey in 1805. Thispersonal collection served as thenucleus of the Coast Survey Libraryafter the formation of that organiza-tion. Because of these early library col-lections, the NOAA Library is in aunique position to help record NOAA’srich heritage and the history of sciencein the Nineteenth Century UnitedStates.
The NOAA History site was built tohelp celebrate that heritage and in-cludes stories of adventure and pioneer-ing science work with the Coast andGeodetic Survey, the Weather Bureaudating back to its Signal Service days,and the Bureau of Commercial Fisher-ies. NOAA History includes: 1) “Profilesin Time,” over 300 biographicalsketches of those who served in NOAA’sancestor agencies; 2) “Stories and Tales”recounting the rough and tumble workof the Coast and Geodetic Survey, theearly weathermen, and the early fisher-ies scientists; 3) “Art and Poetry”painted, sketched, and written by someof those who served; 4) the NOAA His-torical Photo Collection which is a sub-set of the larger NOAA Photo Library;and 5) the NOAA Historical Map andChart Collection.
NOAA History provides a glimpseat the way it was in NOAA’s ancestoragencies and may perhaps provide
—continued on page 10
▲ Figure 2. Surf pounds the beach in spite of clearing weather after a storm at PegottyBeach, Scituate, MA, February 9, 1978. Photo courtesy of AP Laserphoto.
10 December 1998EARTH SYSTEM MONITOR
some inspiration and guidance for thefuture.
NOAA Library and Information Network The NOAA Library and InformationNetwork provides descriptions, con-tacts, mail addresses, E-mail addressesand phone numbers for more than 30libraries in the NOAA system. Theselibraries include the regional libraries,numerous fisheries libraries, weatherservice libraries, and many specialtylibraries.
These specialty libraries include theNational Hurricane Center Library, theNational Marine Mammal LaboratoryLibrary, the Great Lakes EnvironmentalResearch Laboratory Library, theCoastal Services Center Library, theGeophysical Fluid Dynamics LaboratoryLibrary, and the National Severe StormsLaboratory Library. The combined col-lections and services of these librariesare a wonderful resource for NOAA andthe Nation.
The NOAA Photo Library The NOAA Photo Library is thecounterpart of the collection of stereophotos found in many of the old-stylelibraries. But instead of one or two indi-viduals sharing the wonder of theseimages at one time, thousands of view-ers all over the world can access theseimages daily. Presently there are ap-proximately 6,000 images online.
The Photo Library today is madeup of: the National Severe StormsLaboratory collection; the NationalUndersea Research Program collection;historical collections of the Coast andGeodetic Survey, the National WeatherService, and the National Marine Fish-eries Service; and a general collectionthat encompasses much of NOAA’srealm. With the exception of the gen-eral collection, most images have cap-tions including date, location, names ofpersonnel where known, and access toa high-resolution .jpeg image for down-loading if desired.
Future planned modules for theNOAA Photo Library include amongothers: Coastlines, a pictorial tour ofAmerica’s coast and other coasts thatNOAA personnel visit and work upon;“NOAA at the Ends of the Earth”, aphoto collection of NOAA and its an-cestor agencies working from the Arctic
Surface temperature, from page 9 to the Antarctic with many out of theway stops in between; a site that willdetail NOAA ship, aircraft, and divingoperations; NOAA Space Operationsfeaturing meteorological satellites andoceanographic satellites; a disaster sitedetailing the ravages of all manner ofnatural disasters; and a number of fish-eries and living marine resource sites.These sites will become available overthe next two years.
The challenge for the future The NOAA Central Library Systemhas been confronted with many chal-lenges as a result of the Internet revolu-tion. No longer can a responsive librarysystem be content with merely catalog-ing its products and waiting for thosewho are in geographic proximity towalk in at their leisure. Today’s userneeds and expects desk-top access toinformation. The Internet helps pro-vide that access. But with the Internetcomes a plethora of new opportunitiesand new problems.
Foremost among these is develop-ing a means to discover and then makeaccessible via the Library catalog theblizzard of digital publications that anagency such as NOAA producesthrough its many offices and programs.Without cataloging these works anddevising a means to assure their long-term storage and accessibility, both theproducing organization and the Ameri-can public are shortchanged. The digiti-zation of the existing agency works isanother major issue as many of theolder works such as the NineteenthCentury Reports of the Superintendentof the Coast Survey, the Chief of theWeather Bureau, and the Commis-sioner of Fisheries are deteriorating.These documents are important histori-cal records but more importantly con-tain much information that is stillscientifically useful. Digitization of pre-digital Twentieth Century reports anddocuments is also an issue as speed ofaccess for needed information is be-coming increasingly critical.
Another issue is the capture of ex-isting photographic imagery as theNOAA Library contains thousands ofphotographs in its photographic collec-tion as well as additional thousands ingovernment documents that should beaccessible to the American public.These photographs are of natural phe-
nomena, disasters, living resources,engineering works, and scientificprojects. Many of these images don’texist anywhere else.
As we move towards the new mil-lennium, the NOAA Library System ismoving towards new services, newproducts, and expansion of the tradi-tional role of the Library. Look for anincreasingly larger catalog, expansionof the digital photo library, an increas-ing number of online documents, andcontinuation and improvement of thelinking sites such as WINDandSEA andthe NOAA Browser.
For NOAA personnel, universalaccess to indexing and bibliographicservices and online professional peri-odicals is a major goal. Already, this isbecoming reality at numerous NOAAsites around the country. The new mil-lennium will be an exciting time. TheNOAA Library System will be there tohelp NOAA and other Governmentorganizations, academia, commercialorganizations, and the general publicmove forward and have the necessaryinformation to make informed deci-sions regarding our environment andits living resources. ■
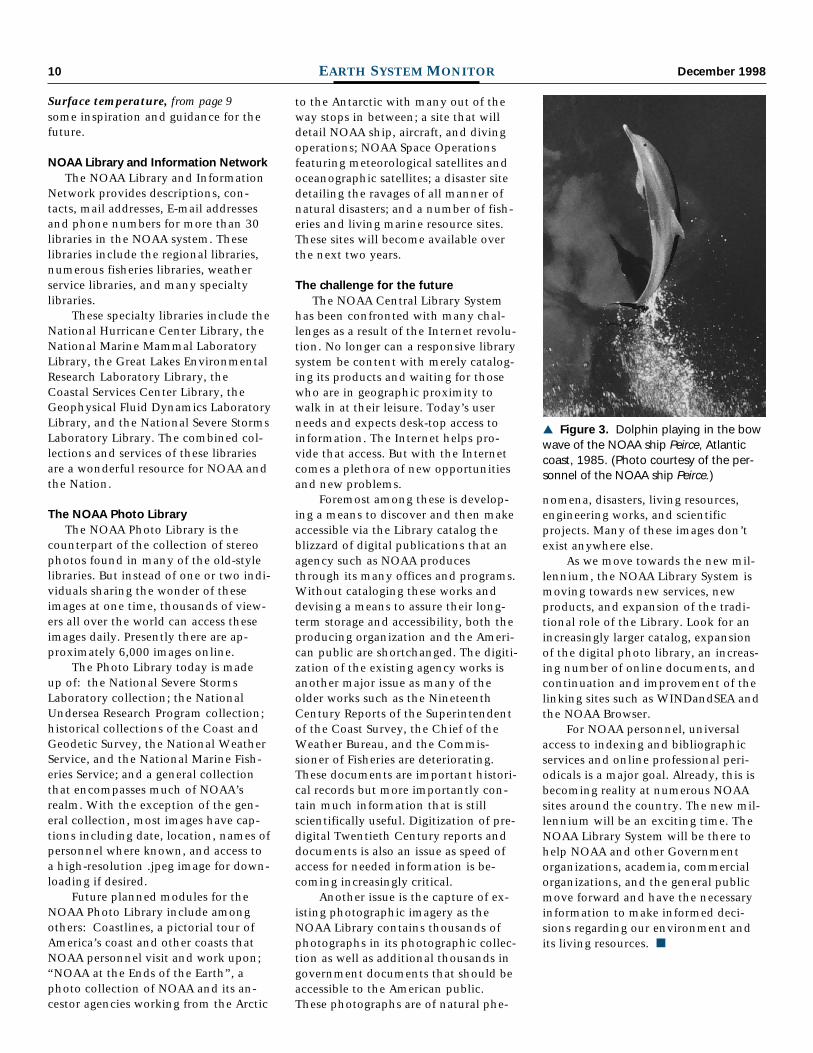
▲ Figure 3. Dolphin playing in the bowwave of the NOAA ship Peirce, Atlanticcoast, 1985. (Photo courtesy of the per-sonnel of the NOAA ship Peirce.)
11December 1998 EARTH SYSTEM MONITOR
Data productsand services
CONTACT POINTS
National Climatic Data Center (NCDC)704-271-4800
Fax: 704-271-4876E-mail: Climate Services - [email protected] Satellite Services -
[email protected]: http://www.ncdc.noaa.gov/
National Geophysical Data Center (NGDC)303-497-6419
Fax: 303-497-6513E-mail: [email protected]
WWW: http://www.ngdc.noaa.gov/
National Oceanographic Data Center(NODC)
301-713-3277Fax: 301-713-3302
E-mail: [email protected]: http://www.nodc.noaa.gov
NOAA Environmental Services Data Directory
301-713-0572(Gerry Barton)
Fax: 301-713-1249E-mail: [email protected]
WWW: http://www.esdim.noaa.gov/#data-products
NOAA Central LibraryReference Services:
301-713-2600Fax: 301-713-4599
E-mail: [email protected]: http://www.lib.noaa.gov/
National Geographic publishes“Nighttime Lights of the World”
The National Geophysical DataCenter‘s (NGDC) image “NighttimeLights of the World” was published aspart of a map supplement in the Octoberissue of National Geographic. The night-time lights of the world image was pro-duced by compositing the lights detectedin cloud-free portions of Defense Meteo-rological Satellite Program OperationalLinescan System data acquired during thedark half of the lunar cycle between Octo-ber 1, 1994 and March 31, 1995. It tookthe NGDC team almost four years to de-velop the algorithms and generate theproduct.Contact: NGDC
NGDC web pages for the GeneralBathymetric Chart of the Oceans
NGDC has just made public the offi-cial Web pages for the IntergovernmentalOceanographic Commission (IOC) andthe International Hydrographic Office(IHO) sponsored General BathymetricChart of the Oceans (GEBCO) project.NGDC has been working with Sir An-thony Laughton, Chairman of GEBCO,and Mr. Brian Harper, permanent Secre-tary of GEBCO, on page design and con-tents of the GEBCO website since June.The site http://www.ngdc.noaa.gov/mgg/gebco/, hosted by NGDC, will provide afocal point for dissemination of informa-tion about GEBCO and contain theGEBCO list servers.Contact: NGDC
China flooding summaryThe National Climatic Data Center
(NCDC) placed a web page on line de-scribing China‘s severe summer flooding,with a brief narrative, satellite images ofthe river flooding, and daily/monthlyclimatic data. During the June-July 1998period, nine stations reported more than40 inches of rainfall, with a maximum of68.28 at Qinzhou in southeastern China.The daily and monthly data were pro-duced from a sophisticated system ofprograms which decode and quality con-trol the synoptic data into a globalhourly/synoptic data set, and then intodaily and monthly summaries. China hasofficially reported over 3000 deaths andover $20 billion (U.S. dollars) in damages.The web page is accessible via http: www.ncdc.noaa.gov/ol/reports/weather-events.html.Contact: NCDC
Urban heat-island publicationA paper titled “Satellite-based adjust-
ments for the urban heat-island tempera-ture bias” by K. Gallo (ORA) and T. Owen(NCDC) has been accepted for publica-tion by the Journal of Applied Meteorology.The paper includes the development ofmonthly and seasonal relationships be-tween urban-rural differences in tempera-tures measured at surface-based observa-tion stations, and satellite-derived(AVHRR) estimates of a normalized differ-ence vegetation index (NDVI) and surfaceradiant temperature (Tsfc). A comparisonof the satellite-based estimates of theurban heat-island (UHI) bias with popula-tion-based estimates of the UHI bias indi-cated similar levels of error. The use ofsatellite-derived data may contribute to aglobally consistent method for analysis ofthe urban heat-island bias.Contact: NCDC
GEBCO grids for coastal regionsThe National Geophysical Data Cen-
ter (NGDC) provided the U.S. NavalOceanographic Office with a preliminaryversion of the U.S. West Coast CoastalRelief Model. The data will be used in thebeginning versions of the General Bathy-metric Chart of the Oceans (GEBCO)grids for coastal regions of the world.GEBCO has long produced bathymetriccontours of the world’s oceans, but gen-erally has not provided details for thecontinental shelves. Due to the increasedimportance of these regions, in terms ofclimate, commerce, and resources,GEBCO is undertaking the generation ofgridded relief models.
Initial grid size will be two arc-min-utes of latitude and longitude. NGDC isgenerating a much more detailed threearc-second Coastal Relief Model for thecoastal United States. Therefore, the pre-liminary grids of the West Coast were theideal starting point for GEBCO gridding inthat region.Contact: NGDC
Storm Database onlineThe National Climatic Data Center
has developed a Storm Events Databaseand placed it online. The NationalWeather Service (NWS) paradox databaseis used. Users can select by state, begintime, type of storm, then further refinethe search to Fugita scale tornadoes, hailsize, wind speed, dollar amount of dam-age, etc. Query results give city or county,date, time, type, magnitude, deaths, inju-ries, amount of property damage, andamount of crop damage. The events database was in response to requests receivedat a NEXRAD users workshop and cur-rently resides in the NCDC Spotlight andthe NCDC Radar Resources page.Contact: NCDC
Ohio earthquake coverageNGDC was contacted by more than
20 media representatives regarding themagnitude 5.4 earthquake in Ohio onSeptember 25. Several interviews wereconducted with television and radio sta-tions in the Cleveland and Detroit areas.Many people were interested in the ef-fects of the earthquake and the possibilityof aftershocks. This was the largest earth-quake ever recorded in the United Statesbetween the Great Plains and the Appala-chian Mountains north of Tennessee.Contact: NGDC

12 December 1998EARTH SYSTEM MONITOR
Address C
orrection Requested
OFFIC
IAL BU
SINESS
Penalty for Private Use $300
40
U.S. D
EPA
RT
MEN
T O
F CO
MM
ERC
EN
ation
al Ocean
ic and
Atm
osp
heric A
dm
inistratio
nPublication D
istribution Facility1315 East-W
est Highw
aySilver Sp
ring, MD
20910-3282A
TTN: Earth System
Monitor
Polar data, from page 4around and do a lot of pre-processing toget them all in a useful form. The ben-efit of these Polar Pathfinder data andthe P-Cube is that that step has beenaccomplished.”
“Also, Polar Pathfinder data addressareas not so intensely observed asother parts of the globe,” Flato contin-ues. “The Arctic has been largely over-looked. There are very little data on thethree-dimensional state of the Arctic—by that I mean the ice cover and theatmosphere above it. So it’s hard to as-sess the way clouds behave, or the wayclouds and radiation interact in the Arc-tic, which may be quite different fromthe way they do in the tropics. Theseare rich data sets that are going to see alot of use.”
It’s clear that investigators dealingwith large-scale atmospheric changes,surface heat and mass balance studies,and sea ice modeling, will welcome the
Polar Pathfinder data. The Polar Path-finder Sampler will be distributed (free)at the January 1998 meeting of theAmerican Meteorological Society. Toorder a copy, please contact:
NSIDC User [email protected] Box 449University of ColoradoBoulder, CO 80309-0449 USATelephone: +1 303-492-6199Fax: +1 303-492-2468 ■
Surface temperature, from page 9Method: Maximizing Station Density forthe Calculation of Long-term Global Tem-perature Change. J. Geophys. Res. (Atm.),in press.
Peterson, T. C., D. R. Easterling, T. R. Karl, P. Ya.Groisman, N. Nicholls, N. Plummer, S.Torok, I. Auer, R. Boehm, D. Gullett, L.Vincent, R. Heino, H. Tuomenvirta, O.Mestre, T. Szentimre, J. Salinger, E. F rland,I. Hanssen-Bauer, H. Alexandersson, P.Jones, D. Parker, 1998c: Homogeneityadjustments of in situ atmospheric climatedata: A review. Int. J. Climatol., in press.
Quayle, Robert G., Thomas C. Peterson, Alan N.Basist, and Catherine S. Godfrey, 1998: AnOperational Near Real Time Global Tem-perature Index. Geophys. Res. Lett. 4 pp.Submitted.
Reynolds, R. W. and T. M. Smith, 1994: Im-proved global sea surface temperatureanalyses using optimum interpolation. J.Climate, 7, 929-948.
Smith, T.M., R.W. Reynolds, R.E. Livezey, andD.C. Stokes, 1996: Reconstruction ofhistorical sea surface temperature usingempirical orthogonal functions. J. Climate,9, 1403-1420. ■
served in the month of October.During the 1998 season, NOAA
scientists, working with NASA and Uni-versity collaborators, conducted themost complete and sophisticated cam-paign of observations in hurricanesever, noted Hugh Willoughby, directorof NOAA’s Hurricane Research Division.“In Bonnie, Danielle and Georges, wehad six or seven aircraft observing thesame hurricane simultaneously,”Willoughby said. “Advanced observa-tional instrumentation and remote sens-ing technology aboard NOAA’sGulfstream-IV high altitude jet and WP-3D airplanes make each of these plat-forms an airborne laboratory, vastly morecapable than those flying just a couple ofdecades ago. We can study and under-
stand hurricanes on all scales, from asingle raindrop to hemisphere-widewinds that control the storm’s motion.”
For more information on hurricanesand the season summary, consult theNHC home page at http://www.nhc.noaa.gov. For current “El Niño/La NiñaForecasts and Outlooks” and “SpecialClimate Summaries” that include thisyear’s hurricane activity, check http://nic.fb4.noaa.gov.
For background on HurricaneMitch, consult NOAA’s National Cli-matic Data Center Web site (Mitch: TheDeadliest Atlantic Hurricane Since 1780)at http://www.ncdc.noaa.gov/ol/reports/mitch/mitch.html. For more informationabout hurricane research, visit the fol-lowing Web page: http://www.aoml.noaa.gov/hrd/HFP98/index.html. ■
1998 hurricanes, from page 9