new policies and strategies required to close education …€¦ · close education achievement...
TRANSCRIPT
Confidential and Proprietary. Copyright © 2013 by Educational Testing Service. All rights reserved.
New Policies and Strategies Required to Close Education Achievement Gaps
Achievement Gap Summit:
Acknowledging the Opportunity Gap with a Focus on African American Males
Michigan Department of Education
Eagle Eye Conference Center East Lansing, MI
June 5, 2013
Michael T. Nettles
Senior Vice President Policy Evaluation and Research Center
Confidential and Proprietary. Copyright © 2013 by Educational Testing Service. All rights reserved. Confidential and Proprietary. Copyright © 2013 by Educational Testing Service. All rights reserved.
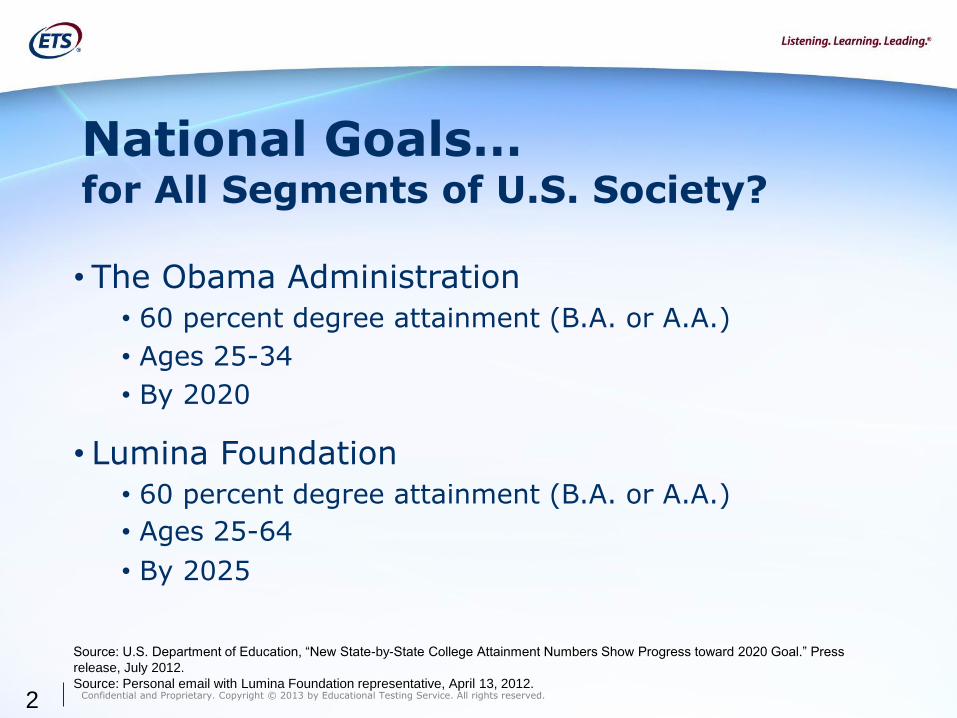
National Goals… for All Segments of U.S. Society?
• The Obama Administration
• 60 percent degree attainment (B.A. or A.A.)
• Ages 25-34
• By 2020
• Lumina Foundation
• 60 percent degree attainment (B.A. or A.A.)
• Ages 25-64
• By 2025
2
Source: U.S. Department of Education, “New State-by-State College Attainment Numbers Show Progress toward 2020 Goal.” Press
release, July 2012.
Source: Personal email with Lumina Foundation representative, April 13, 2012.
Confidential and Proprietary. Copyright © 2013 by Educational Testing Service. All rights reserved. Confidential and Proprietary. Copyright © 2013 by Educational Testing Service. All rights reserved.
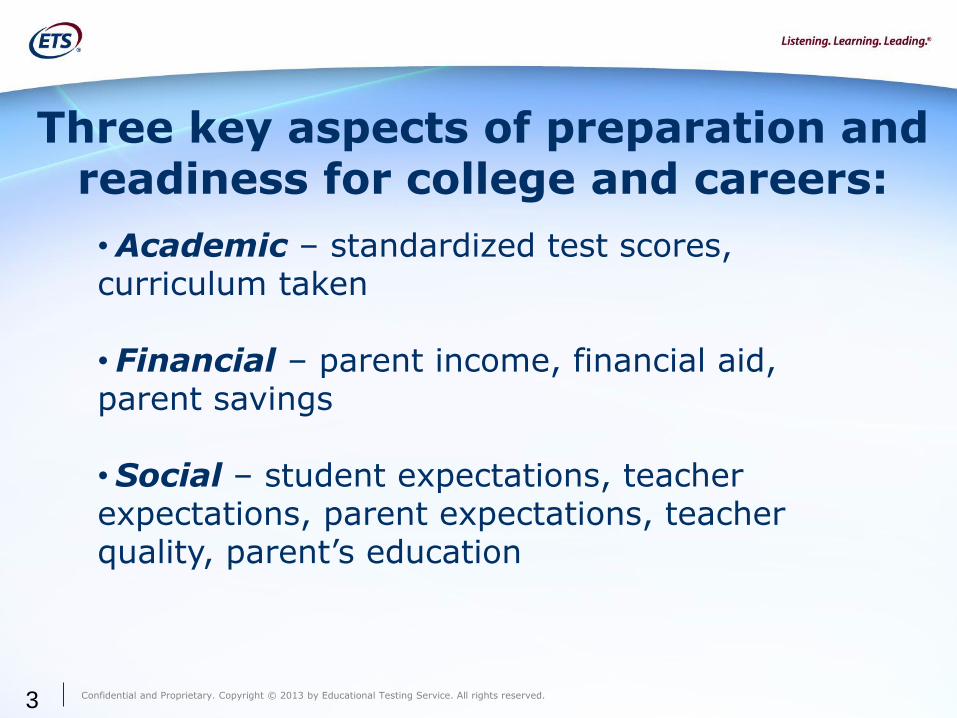
Three key aspects of preparation and readiness for college and careers:
• Academic – standardized test scores, curriculum taken
• Financial – parent income, financial aid, parent savings
• Social – student expectations, teacher expectations, parent expectations, teacher quality, parent’s education
3
Confidential and Proprietary. Copyright © 2013 by Educational Testing Service. All rights reserved. Confidential and Proprietary. Copyright © 2013 by Educational Testing Service. All rights reserved.
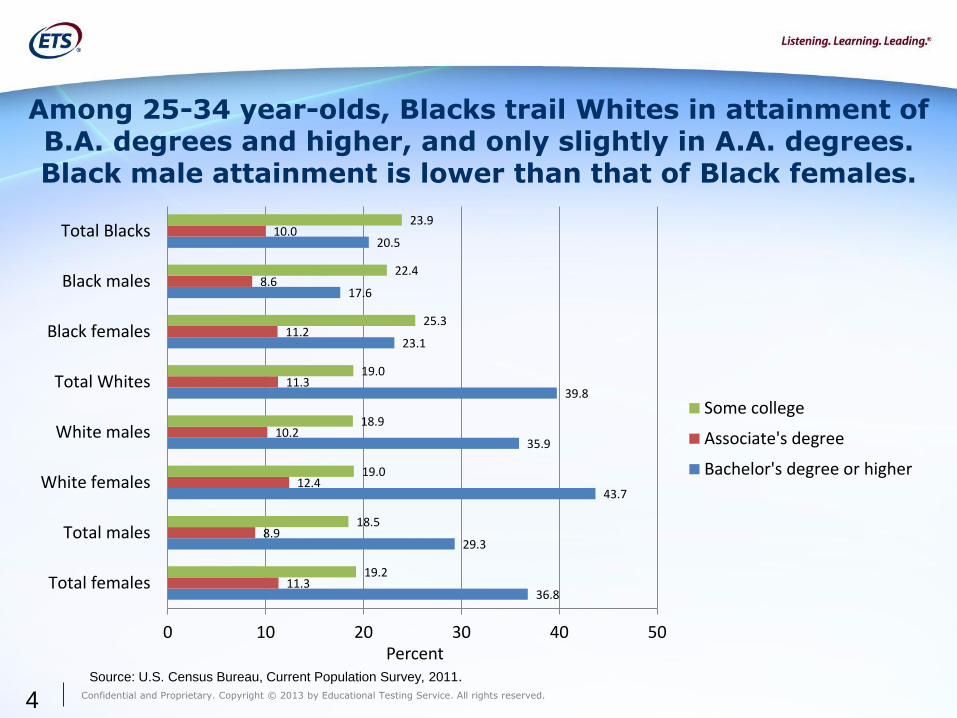
Among 25-34 year-olds, Blacks trail Whites in attainment of B.A. degrees and higher, and only slightly in A.A. degrees. Black male attainment is lower than that of Black females.
4 Source: U.S. Census Bureau, Current Population Survey, 2011.
36.8
29.3
43.7
35.9
39.8
23.1
17.6
20.5
11.3
8.9
12.4
10.2
11.3
11.2
8.6
10.0
19.2
18.5
19.0
18.9
19.0
25.3
22.4
23.9
0 10 20 30 40 50
Total females
Total males
White females
White males
Total Whites
Black females
Black males
Total Blacks
Percent
Some college
Associate's degree
Bachelor's degree or higher
Confidential and Proprietary. Copyright © 2013 by Educational Testing Service. All rights reserved. Confidential and Proprietary. Copyright © 2013 by Educational Testing Service. All rights reserved. 5
5%
6%
17%
13%
7%
5%
3%
4%
14%
13%
6%
5%
6%
15%
25%
23%
20%
14%
11%
11%
9%
12%
16%
16%
57%
62%
61%
67%
74%
64%
53%
52%
0% 100%
Population age 18-25
Total first-time fulltime freshmen
Most Competitive
Highly Competitive
Very Competitive
Competitive
Less Competitive
Non-competitive
Amer. Indian/ Alaskan Native Asian African American Hispanic Pacific Islanders White Two or more races
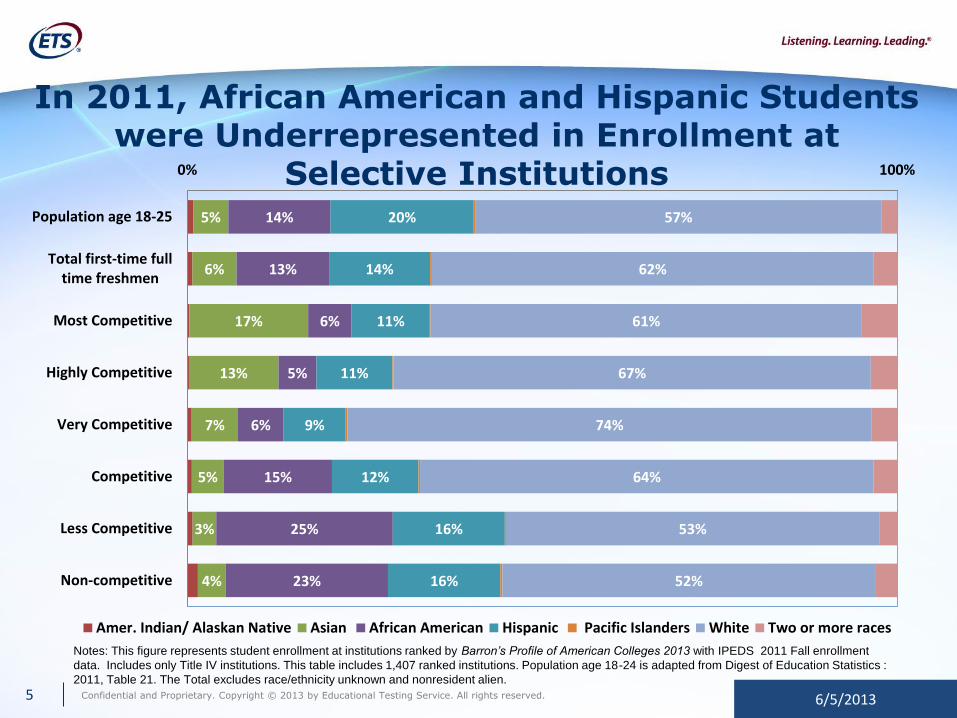
In 2011, African American and Hispanic Students were Underrepresented in Enrollment at
Selective Institutions
Notes: This figure represents student enrollment at institutions ranked by Barron’s Profile of American Colleges 2013 with IPEDS 2011 Fall enrollment
data. Includes only Title IV institutions. This table includes 1,407 ranked institutions. Population age 18-24 is adapted from Digest of Education Statistics :
2011, Table 21. The Total excludes race/ethnicity unknown and nonresident alien.
6/5/2013
Confidential and Proprietary. Copyright © 2013 by Educational Testing Service. All rights reserved. Confidential and Proprietary. Copyright © 2013 by Educational Testing Service. All rights reserved. 6
5%
6%
15%
11%
6%
5%
4%
3%
14%
9%
5%
5%
6%
11%
17%
15%
20%
9%
8%
7%
7%
9%
12%
12%
57%
64%
56%
66%
71%
66%
57%
60%
0% 100%
Population age 18-25
Total
Most Competitive
Highly Competitive
Very Competitive
Competitive
Less Competitive
Non-competitive
Amer. Indian/ Alaskan Native Asian African American Hispanic Pacific Islanders White Two or more races
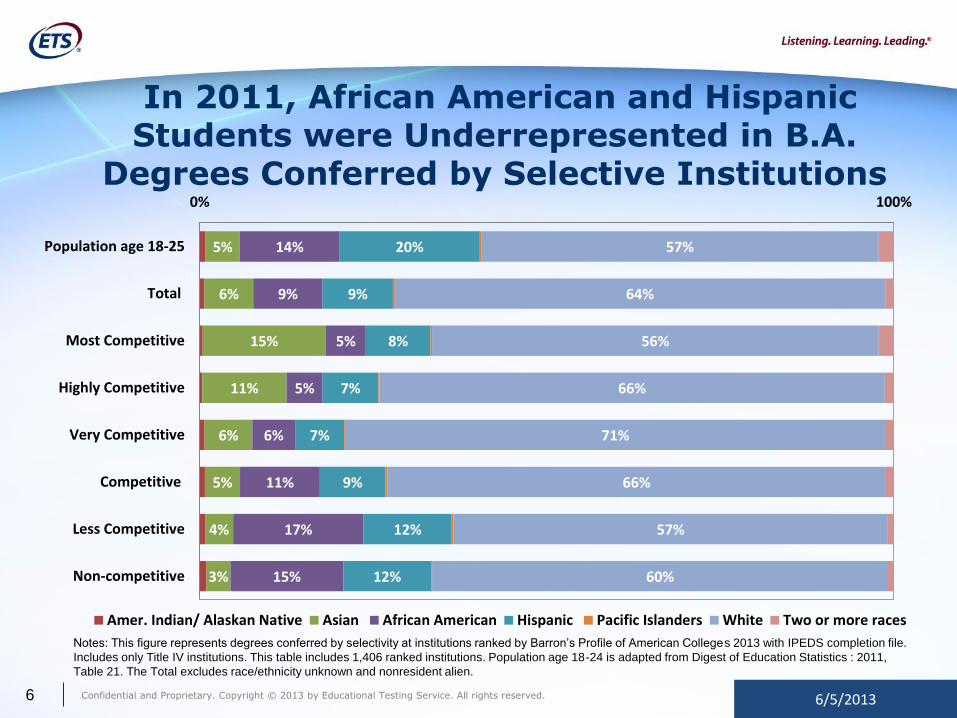
Notes: This figure represents degrees conferred by selectivity at institutions ranked by Barron’s Profile of American Colleges 2013 with IPEDS completion file.
Includes only Title IV institutions. This table includes 1,406 ranked institutions. Population age 18-24 is adapted from Digest of Education Statistics : 2011,
Table 21. The Total excludes race/ethnicity unknown and nonresident alien.
In 2011, African American and Hispanic Students were Underrepresented in B.A.
Degrees Conferred by Selective Institutions
6/5/2013
Confidential and Proprietary. Copyright © 2013 by Educational Testing Service. All rights reserved. Confidential and Proprietary. Copyright © 2013 by Educational Testing Service. All rights reserved.
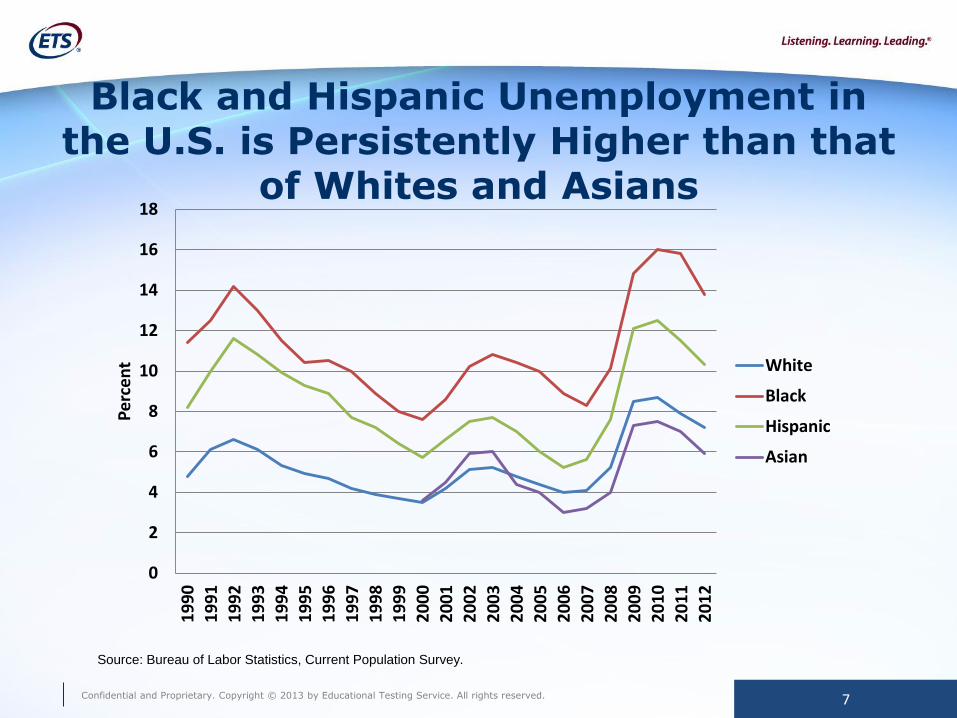
Black and Hispanic Unemployment in the U.S. is Persistently Higher than that
of Whites and Asians
0
2
4
6
8
10
12
14
16
181
99
0
19
91
19
92
19
93
19
94
19
95
19
96
19
97
19
98
19
99
20
00
20
01
20
02
20
03
20
04
20
05
20
06
20
07
20
08
20
09
20
10
20
11
20
12
Pe
rce
nt White
Black
Hispanic
Asian
Source: Bureau of Labor Statistics, Current Population Survey.
7
Confidential and Proprietary. Copyright © 2013 by Educational Testing Service. All rights reserved. Confidential and Proprietary. Copyright © 2013 by Educational Testing Service. All rights reserved.
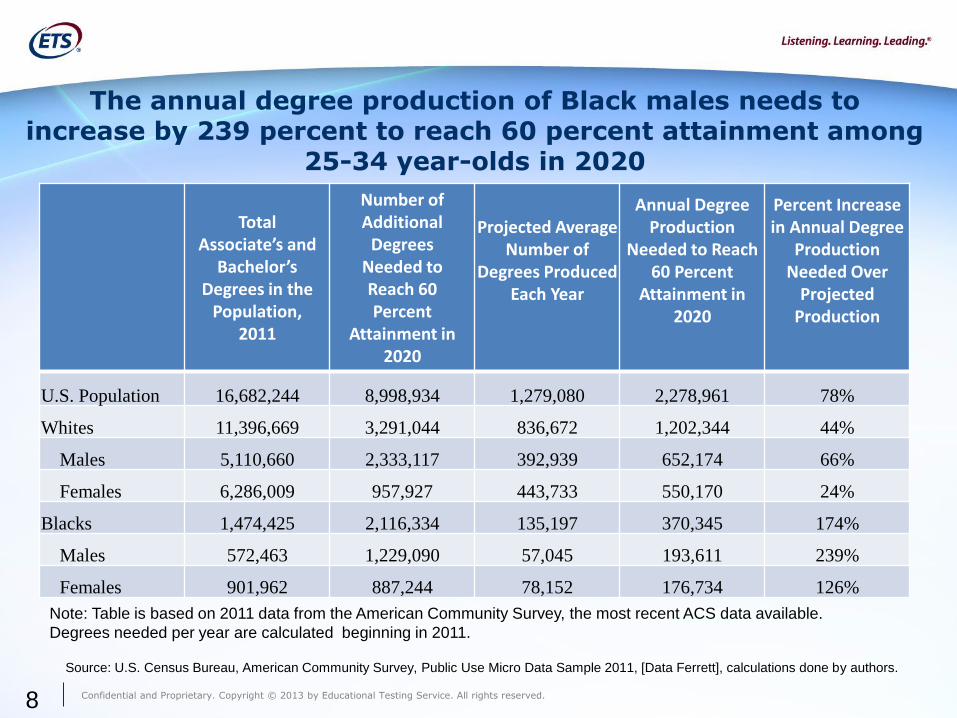
The annual degree production of Black males needs to increase by 239 percent to reach 60 percent attainment among
25-34 year-olds in 2020
8
Total
Associate’s and Bachelor’s
Degrees in the Population,
2011
Number of Additional
Degrees Needed to Reach 60 Percent
Attainment in 2020
Projected Average Number of
Degrees Produced Each Year
Annual Degree Production
Needed to Reach 60 Percent
Attainment in 2020
Percent Increase in Annual Degree
Production Needed Over
Projected Production
U.S. Population 16,682,244 8,998,934 1,279,080 2,278,961 78%
Whites 11,396,669 3,291,044 836,672 1,202,344 44%
Males 5,110,660 2,333,117 392,939 652,174 66%
Females 6,286,009 957,927 443,733 550,170 24%
Blacks 1,474,425 2,116,334 135,197 370,345 174%
Males 572,463 1,229,090 57,045 193,611 239%
Females 901,962 887,244 78,152 176,734 126%
Note: Table is based on 2011 data from the American Community Survey, the most recent ACS data available.
Degrees needed per year are calculated beginning in 2011.
Source: U.S. Census Bureau, American Community Survey, Public Use Micro Data Sample 2011, [Data Ferrett], calculations done by authors.
Confidential and Proprietary. Copyright © 2013 by Educational Testing Service. All rights reserved. Confidential and Proprietary. Copyright © 2013 by Educational Testing Service. All rights reserved.
ACADEMIC INDICATORS OF PREPARATION
9
Confidential and Proprietary. Copyright © 2013 by Educational Testing Service. All rights reserved. Confidential and Proprietary. Copyright © 2013 by Educational Testing Service. All rights reserved.
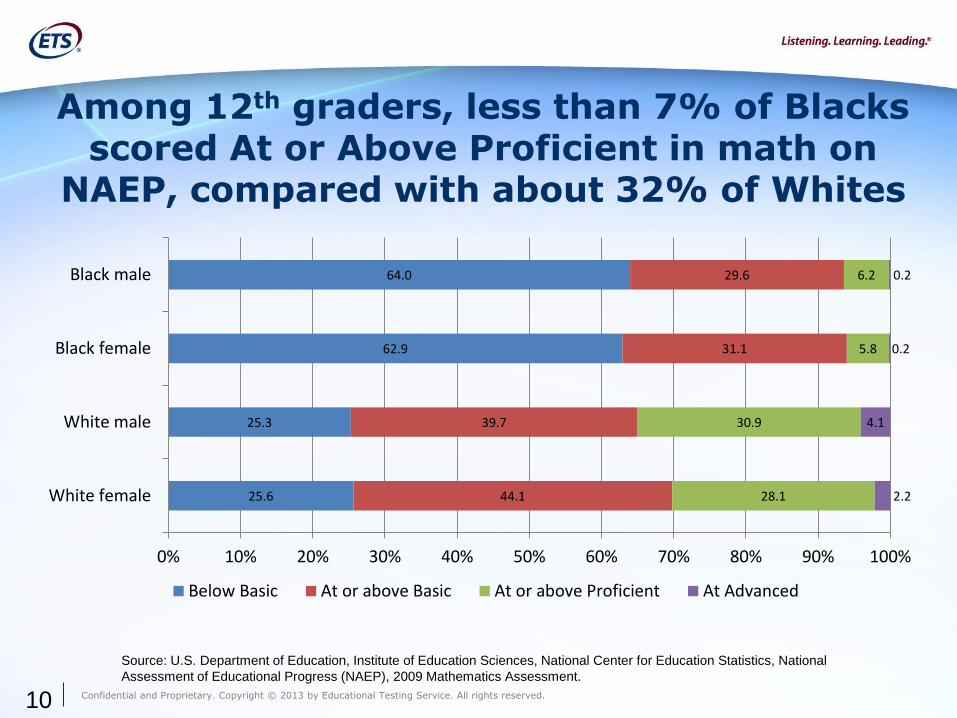
Among 12th graders, less than 7% of Blacks scored At or Above Proficient in math on
NAEP, compared with about 32% of Whites
10
25.6
25.3
62.9
64.0
44.1
39.7
31.1
29.6
28.1
30.9
5.8
6.2
2.2
4.1
0.2
0.2
0% 10% 20% 30% 40% 50% 60% 70% 80% 90% 100%
White female
White male
Black female
Black male
Below Basic At or above Basic At or above Proficient At Advanced
Source: U.S. Department of Education, Institute of Education Sciences, National Center for Education Statistics, National
Assessment of Educational Progress (NAEP), 2009 Mathematics Assessment.
Confidential and Proprietary. Copyright © 2013 by Educational Testing Service. All rights reserved. Confidential and Proprietary. Copyright © 2013 by Educational Testing Service. All rights reserved. 11
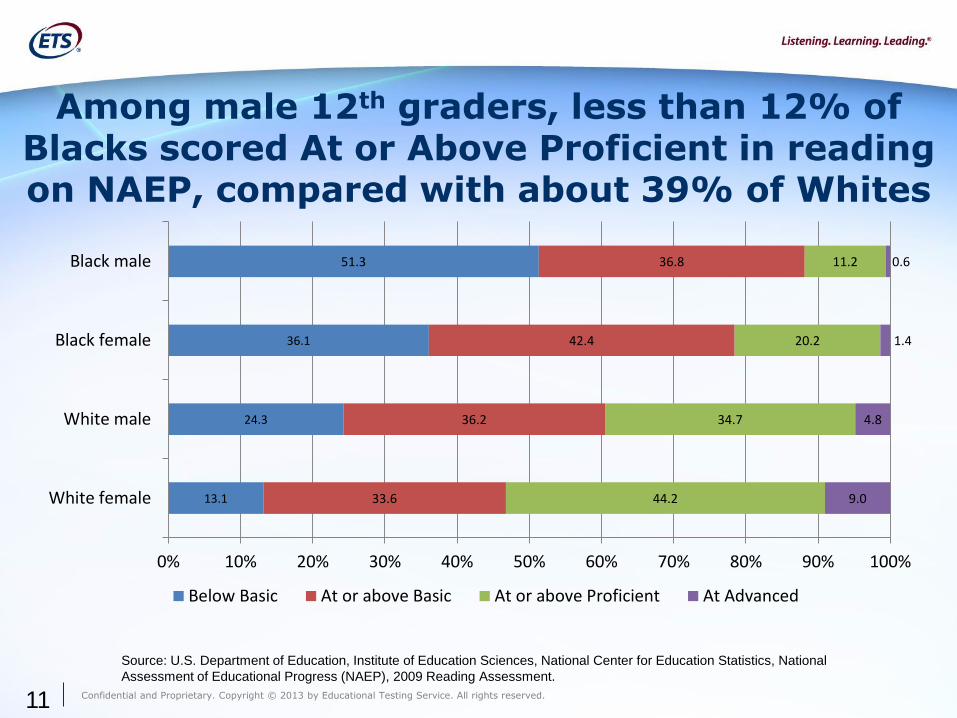
13.1
24.3
36.1
51.3
33.6
36.2
42.4
36.8
44.2
34.7
20.2
11.2
9.0
4.8
1.4
0.6
0% 10% 20% 30% 40% 50% 60% 70% 80% 90% 100%
White female
White male
Black female
Black male
Below Basic At or above Basic At or above Proficient At Advanced
Source: U.S. Department of Education, Institute of Education Sciences, National Center for Education Statistics, National
Assessment of Educational Progress (NAEP), 2009 Reading Assessment.
Among male 12th graders, less than 12% of Blacks scored At or Above Proficient in reading on NAEP, compared with about 39% of Whites
Confidential and Proprietary. Copyright © 2013 by Educational Testing Service. All rights reserved. Confidential and Proprietary. Copyright © 2013 by Educational Testing Service. All rights reserved. 12
160
170
180
190
200
210
220
230
240
250
260
270
280
290
300
310
320
0% 10% 20% 30% 40% 50% 60% 70% 80% 90% 100%
Sch
oo
l Me
ans
Percent Black in School
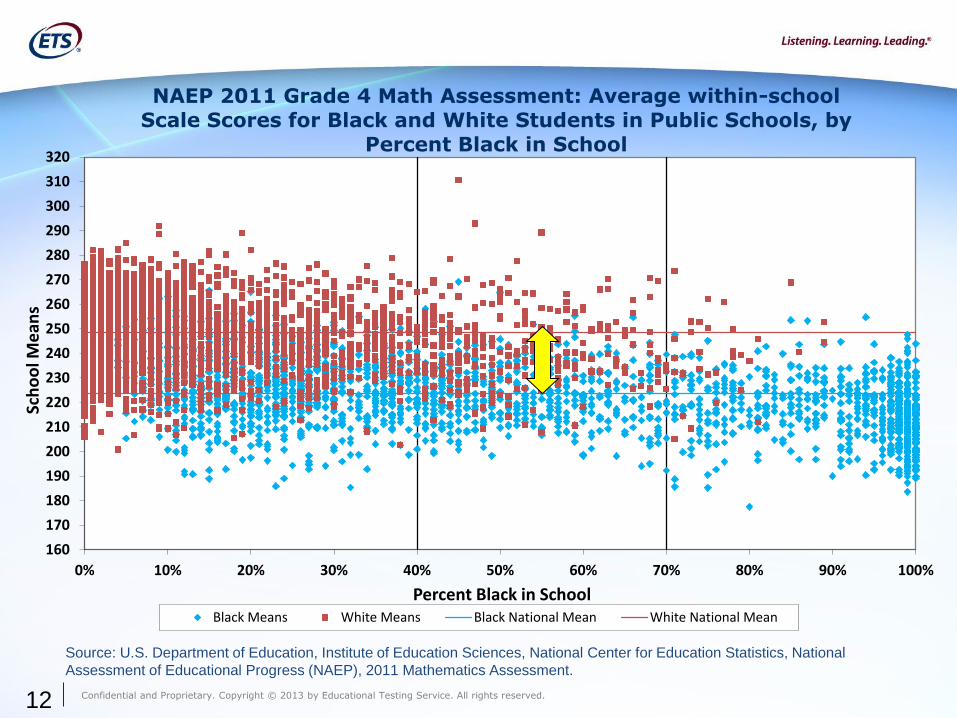
NAEP 2011 Grade 4 Math Assessment: Average within-school
Scale Scores for Black and White Students in Public Schools, by
Percent Black in School
Black Means White Means Black National Mean White National Mean
Source: U.S. Department of Education, Institute of Education Sciences, National Center for Education Statistics, National
Assessment of Educational Progress (NAEP), 2011 Mathematics Assessment.
Confidential and Proprietary. Copyright © 2013 by Educational Testing Service. All rights reserved. Confidential and Proprietary. Copyright © 2013 by Educational Testing Service. All rights reserved. 13
Source: U.S. Department of Education, Institute of Education Sciences, National Center for Education Statistics, National
Assessment of Educational Progress (NAEP), 2011 Mathematics Assessment.
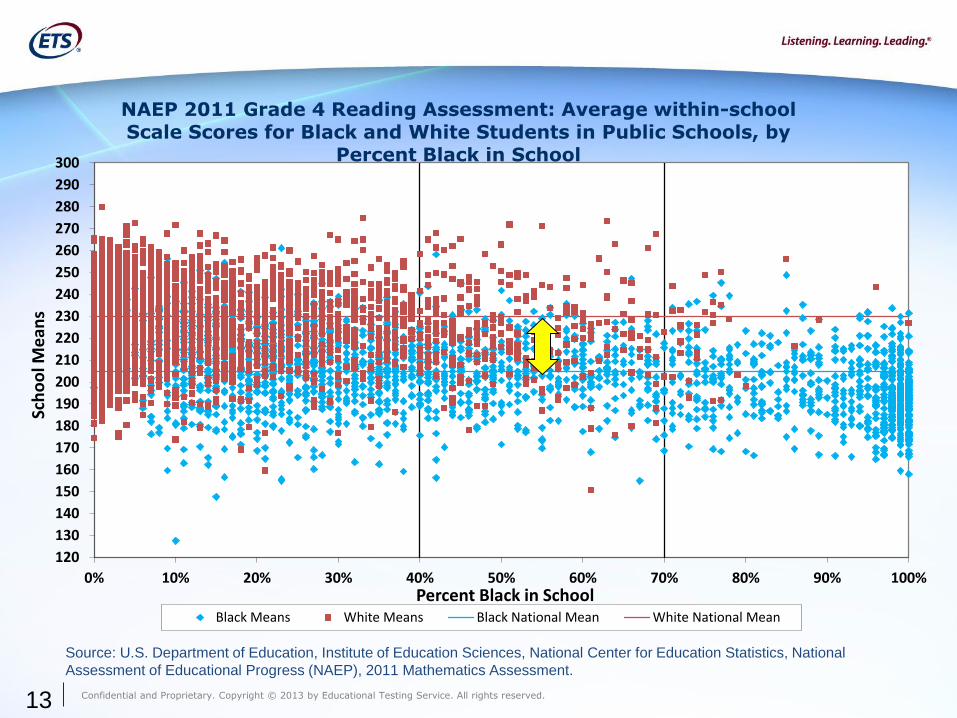
120
130
140
150
160
170
180
190
200
210
220
230
240
250
260
270
280
290
300
0% 10% 20% 30% 40% 50% 60% 70% 80% 90% 100%
Sch
oo
l Me
ans
Percent Black in School
NAEP 2011 Grade 4 Reading Assessment: Average within-school Scale Scores for Black and White Students in Public Schools, by
Percent Black in School
Black Means White Means Black National Mean White National Mean
Confidential and Proprietary. Copyright © 2013 by Educational Testing Service. All rights reserved. Confidential and Proprietary. Copyright © 2013 by Educational Testing Service. All rights reserved.
Source: U.S. Department of Education, Institute of Education Sciences, National Center for Education Statistics, National
Assessment of Educational Progress (NAEP), 2011 Mathematics Assessment.
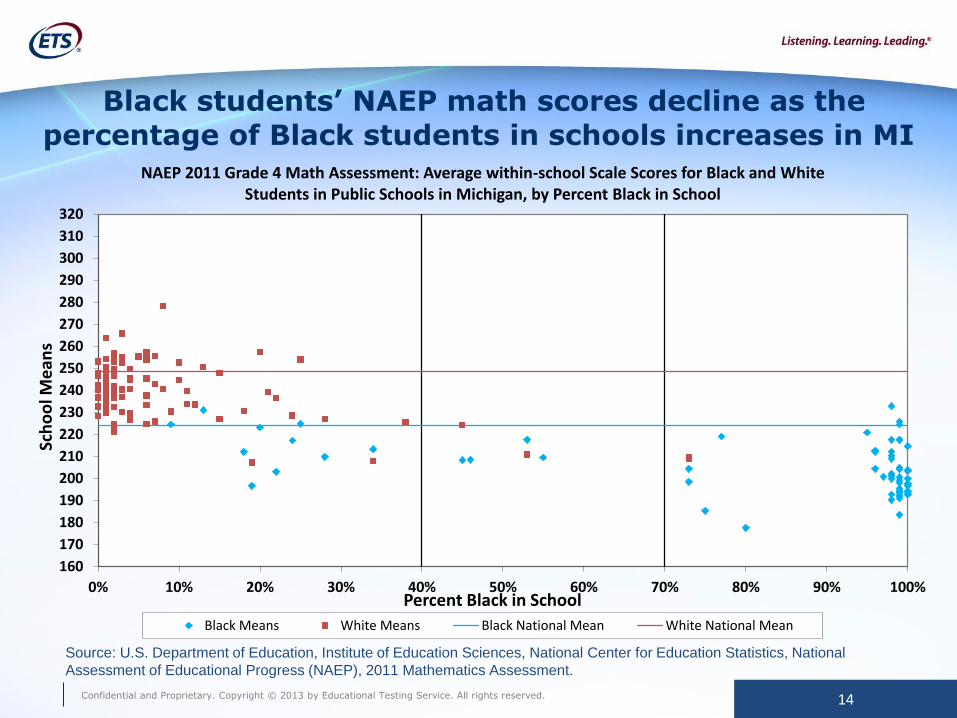
Black students’ NAEP math scores decline as the
percentage of Black students in schools increases in MI
14
160
170
180
190
200
210
220
230
240
250
260
270
280
290
300
310
320
0% 10% 20% 30% 40% 50% 60% 70% 80% 90% 100%
Sch
oo
l Me
ans
Percent Black in School
NAEP 2011 Grade 4 Math Assessment: Average within-school Scale Scores for Black and White Students in Public Schools in Michigan, by Percent Black in School
Black Means White Means Black National Mean White National Mean
Confidential and Proprietary. Copyright © 2013 by Educational Testing Service. All rights reserved. Confidential and Proprietary. Copyright © 2013 by Educational Testing Service. All rights reserved.
Source: U.S. Department of Education, Institute of Education Sciences, National Center for Education Statistics, National
Assessment of Educational Progress (NAEP), 2011 Mathematics Assessment.
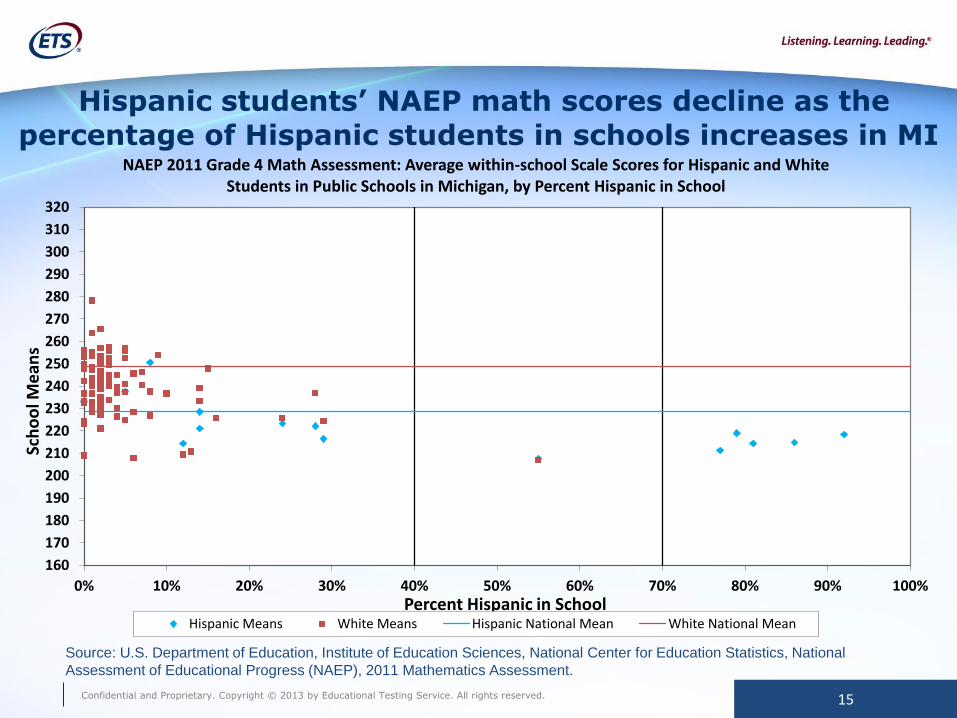
Hispanic students’ NAEP math scores decline as the
percentage of Hispanic students in schools increases in MI
15
160
170
180
190
200
210
220
230
240
250
260
270
280
290
300
310
320
0% 10% 20% 30% 40% 50% 60% 70% 80% 90% 100%
Sch
oo
l Me
ans
Percent Hispanic in School
NAEP 2011 Grade 4 Math Assessment: Average within-school Scale Scores for Hispanic and White Students in Public Schools in Michigan, by Percent Hispanic in School
Hispanic Means White Means Hispanic National Mean White National Mean

Confidential and Proprietary. Copyright © 2013 by Educational Testing Service. All rights reserved. Confidential and Proprietary. Copyright © 2013 by Educational Testing Service. All rights reserved.
Source: U.S. Department of Education, Institute of Education Sciences, National Center for Education Statistics, National
Assessment of Educational Progress (NAEP), 2011 Mathematics Assessment.
Black students’ NAEP reading scores decline as the
percentage of Black students in schools increases in MI
16
120130140150160170180190200210220230240250260270280290300
0% 10% 20% 30% 40% 50% 60% 70% 80% 90% 100%
Sch
oo
l Me
ans
Percent Black in School
NAEP 2011 Grade 4 Reading Assessment: Average within-school Scale Scores for Black and White Students in Public Schools in Michigan, by Percent Black in School
Black Means White Means Black National Mean White National Mean
Confidential and Proprietary. Copyright © 2013 by Educational Testing Service. All rights reserved. Confidential and Proprietary. Copyright © 2013 by Educational Testing Service. All rights reserved.
Source: U.S. Department of Education, Institute of Education Sciences, National Center for Education Statistics, National
Assessment of Educational Progress (NAEP), 2011 Mathematics Assessment.
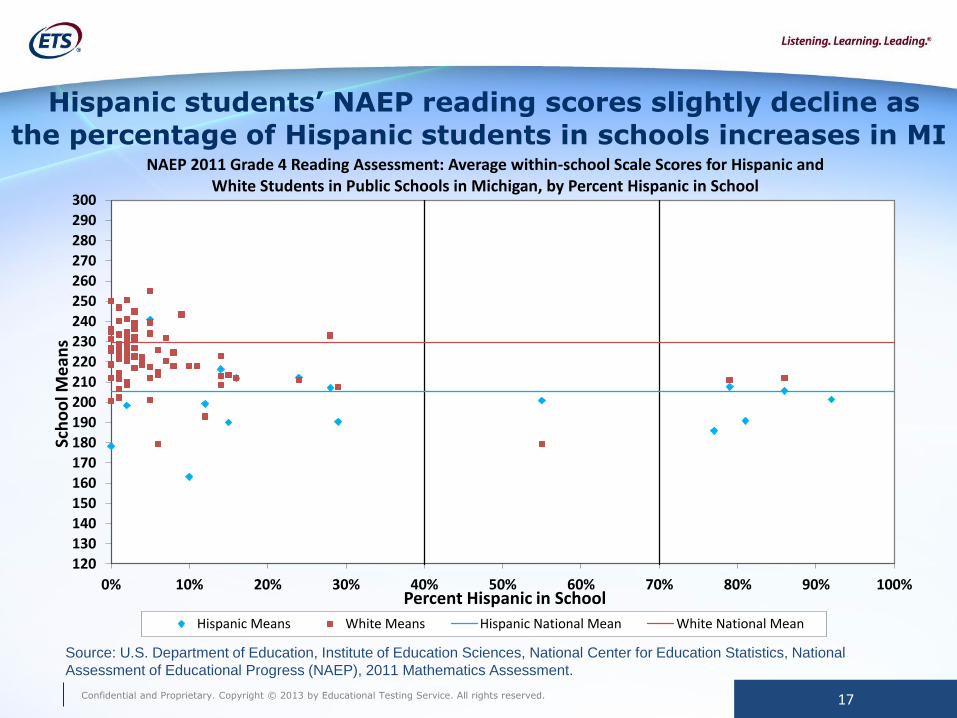
Hispanic students’ NAEP reading scores slightly decline as
the percentage of Hispanic students in schools increases in MI
17
120
130
140
150
160
170
180
190
200
210
220
230
240
250
260
270
280
290
300
0% 10% 20% 30% 40% 50% 60% 70% 80% 90% 100%
Sch
oo
l Me
ans
Percent Hispanic in School
NAEP 2011 Grade 4 Reading Assessment: Average within-school Scale Scores for Hispanic and White Students in Public Schools in Michigan, by Percent Hispanic in School
Hispanic Means White Means Hispanic National Mean White National Mean
Confidential and Proprietary. Copyright © 2013 by Educational Testing Service. All rights reserved. Confidential and Proprietary. Copyright © 2013 by Educational Testing Service. All rights reserved.
.
18
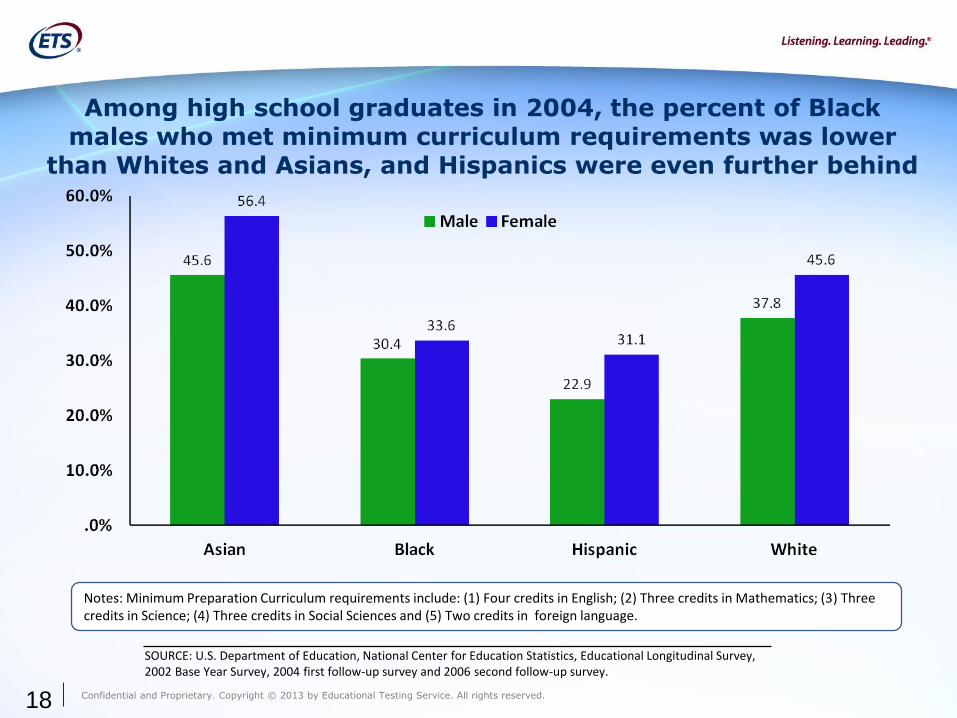
Notes: Minimum Preparation Curriculum requirements include: (1) Four credits in English; (2) Three credits in Mathematics; (3) Three credits in Science; (4) Three credits in Social Sciences and (5) Two credits in foreign language.
SOURCE: U.S. Department of Education, National Center for Education Statistics, Educational Longitudinal Survey, 2002 Base Year Survey, 2004 first follow-up survey and 2006 second follow-up survey.
Among high school graduates in 2004, the percent of Black males who met minimum curriculum requirements was lower
than Whites and Asians, and Hispanics were even further behind
Confidential and Proprietary. Copyright © 2013 by Educational Testing Service. All rights reserved. Confidential and Proprietary. Copyright © 2013 by Educational Testing Service. All rights reserved.
.
19
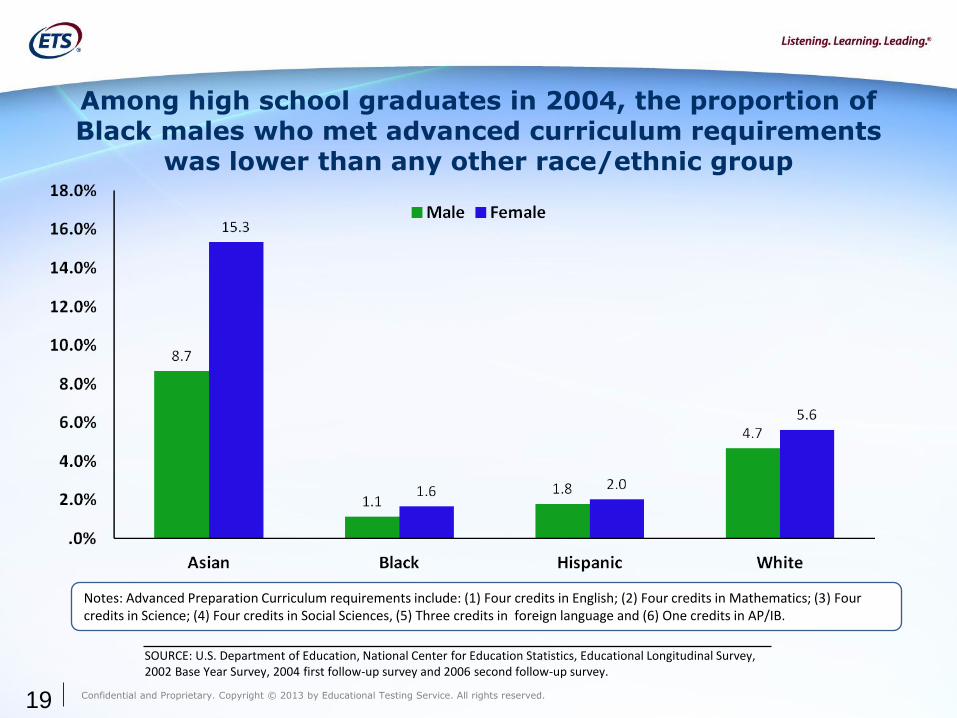
Notes: Advanced Preparation Curriculum requirements include: (1) Four credits in English; (2) Four credits in Mathematics; (3) Four credits in Science; (4) Four credits in Social Sciences, (5) Three credits in foreign language and (6) One credits in AP/IB.
SOURCE: U.S. Department of Education, National Center for Education Statistics, Educational Longitudinal Survey, 2002 Base Year Survey, 2004 first follow-up survey and 2006 second follow-up survey.
Among high school graduates in 2004, the proportion of Black males who met advanced curriculum requirements
was lower than any other race/ethnic group
Confidential and Proprietary. Copyright © 2013 by Educational Testing Service. All rights reserved. Confidential and Proprietary. Copyright © 2013 by Educational Testing Service. All rights reserved.
FINANCIAL INDICATORS OF PREPARATION
20
Confidential and Proprietary. Copyright © 2013 by Educational Testing Service. All rights reserved. Confidential and Proprietary. Copyright © 2013 by Educational Testing Service. All rights reserved. 22
30.4
38.1
20.7
26.2
0
5
10
15
20
25
30
35
40
45
Male Female Male Female
Black White
Perc
ent
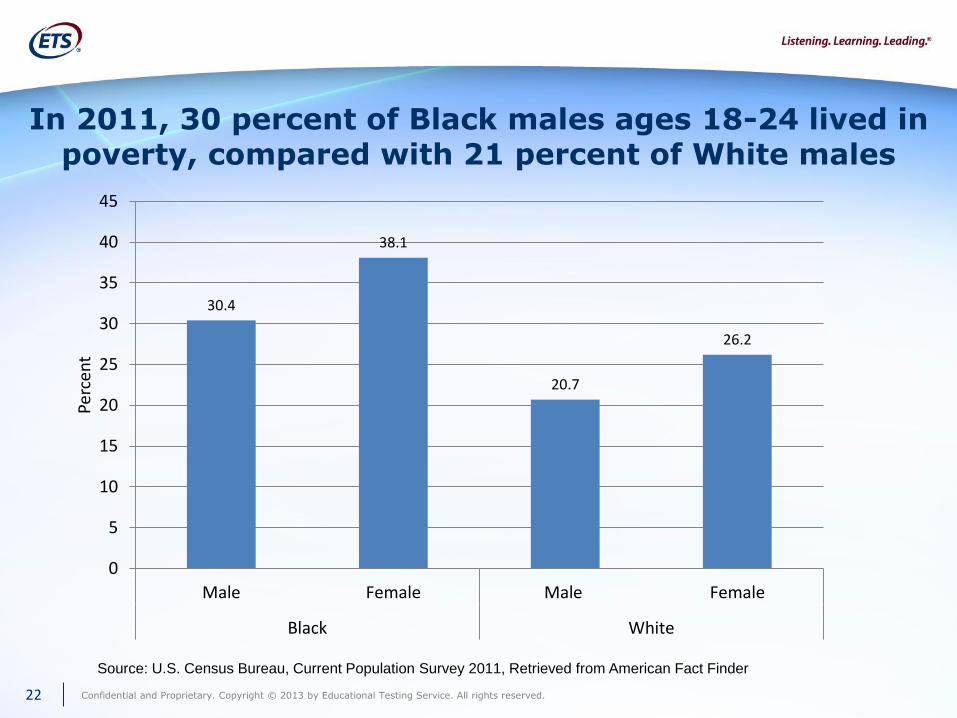
Source: U.S. Census Bureau, Current Population Survey 2011, Retrieved from American Fact Finder
In 2011, 30 percent of Black males ages 18-24 lived in poverty, compared with 21 percent of White males
Confidential and Proprietary. Copyright © 2013 by Educational Testing Service. All rights reserved. Confidential and Proprietary. Copyright © 2013 by Educational Testing Service. All rights reserved.
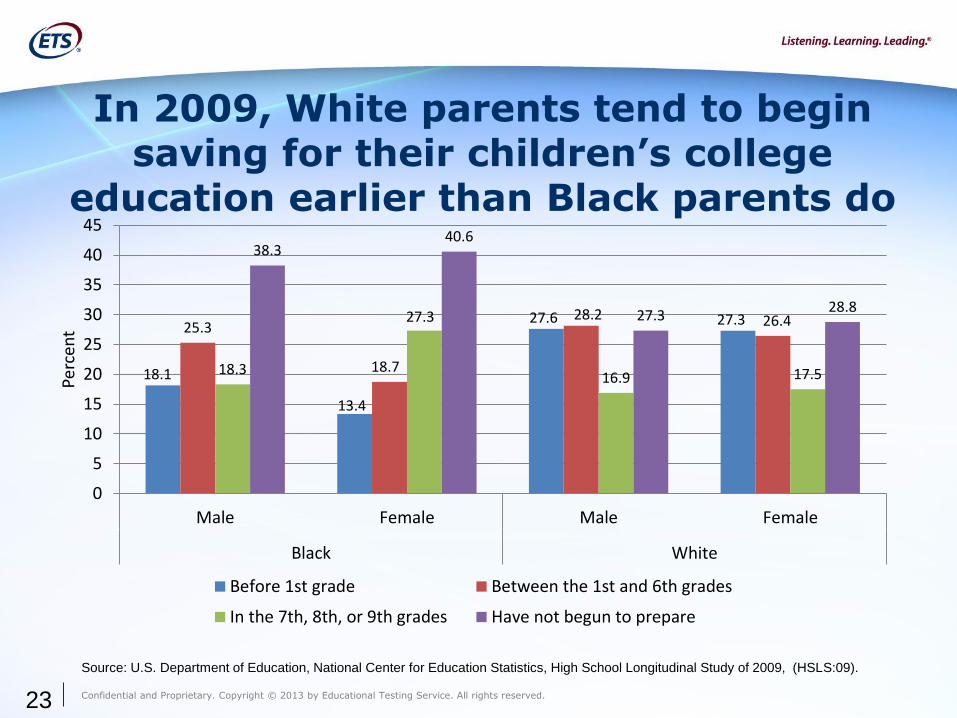
In 2009, White parents tend to begin saving for their children’s college
education earlier than Black parents do
23
18.1
13.4
27.6 27.3 25.3
18.7
28.2 26.4
18.3
27.3
16.9 17.5
38.3 40.6
27.3 28.8
0
5
10
15
20
25
30
35
40
45
Male Female Male Female
Black White
Perc
ent
Before 1st grade Between the 1st and 6th grades
In the 7th, 8th, or 9th grades Have not begun to prepare
Source: U.S. Department of Education, National Center for Education Statistics, High School Longitudinal Study of 2009, (HSLS:09).
Confidential and Proprietary. Copyright © 2013 by Educational Testing Service. All rights reserved. Confidential and Proprietary. Copyright © 2013 by Educational Testing Service. All rights reserved.
SOCIAL INDICATORS OF PREPARATION
24
Confidential and Proprietary. Copyright © 2013 by Educational Testing Service. All rights reserved. Confidential and Proprietary. Copyright © 2013 by Educational Testing Service. All rights reserved. 6/5/2013 25
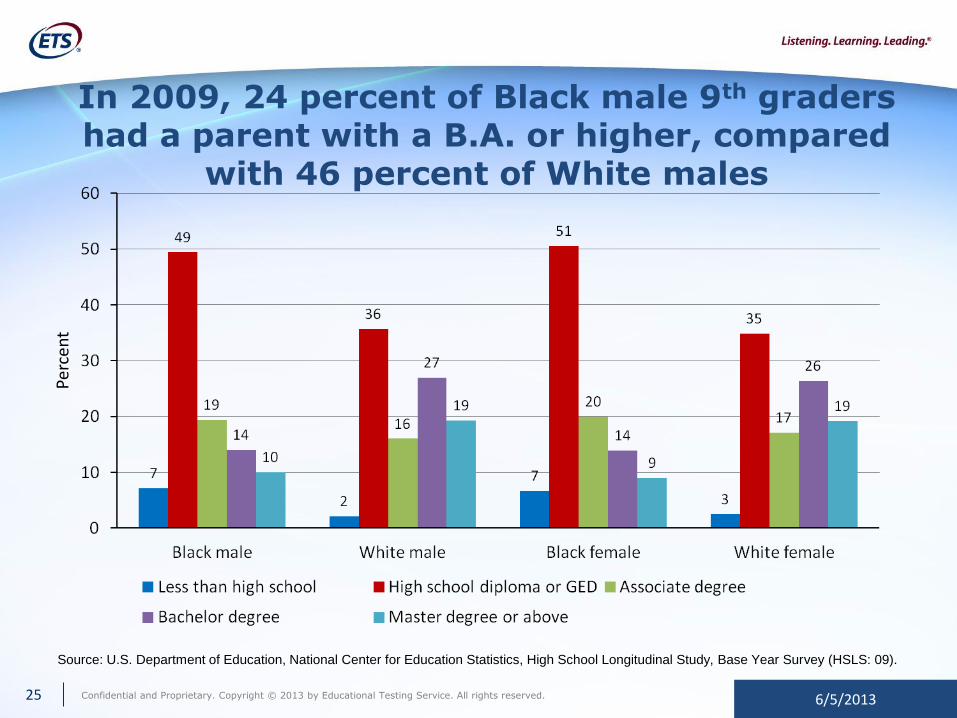
Source: U.S. Department of Education, National Center for Education Statistics, High School Longitudinal Study, Base Year Survey (HSLS: 09).
In 2009, 24 percent of Black male 9th graders had a parent with a B.A. or higher, compared
with 46 percent of White males
Perc
ent
Confidential and Proprietary. Copyright © 2013 by Educational Testing Service. All rights reserved. Confidential and Proprietary. Copyright © 2013 by Educational Testing Service. All rights reserved.
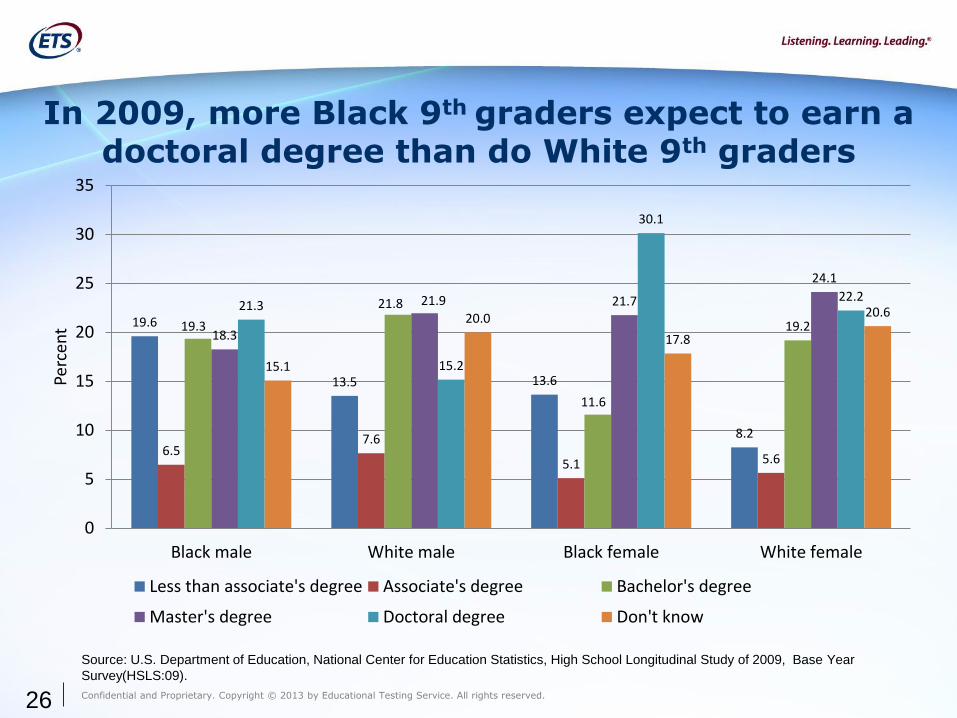
In 2009, more Black 9th graders expect to earn a doctoral degree than do White 9th graders
26
19.6
13.5 13.6
8.2 6.5
7.6
5.1 5.6
19.3
21.8
11.6
19.2 18.3
21.9 21.7
24.1
21.3
15.2
30.1
22.2
15.1
20.0
17.8
20.6
0
5
10
15
20
25
30
35
Black male White male Black female White female
Perc
ent
Less than associate's degree Associate's degree Bachelor's degree
Master's degree Doctoral degree Don't know
Source: U.S. Department of Education, National Center for Education Statistics, High School Longitudinal Study of 2009, Base Year
Survey(HSLS:09).
Confidential and Proprietary. Copyright © 2013 by Educational Testing Service. All rights reserved. Confidential and Proprietary. Copyright © 2013 by Educational Testing Service. All rights reserved.
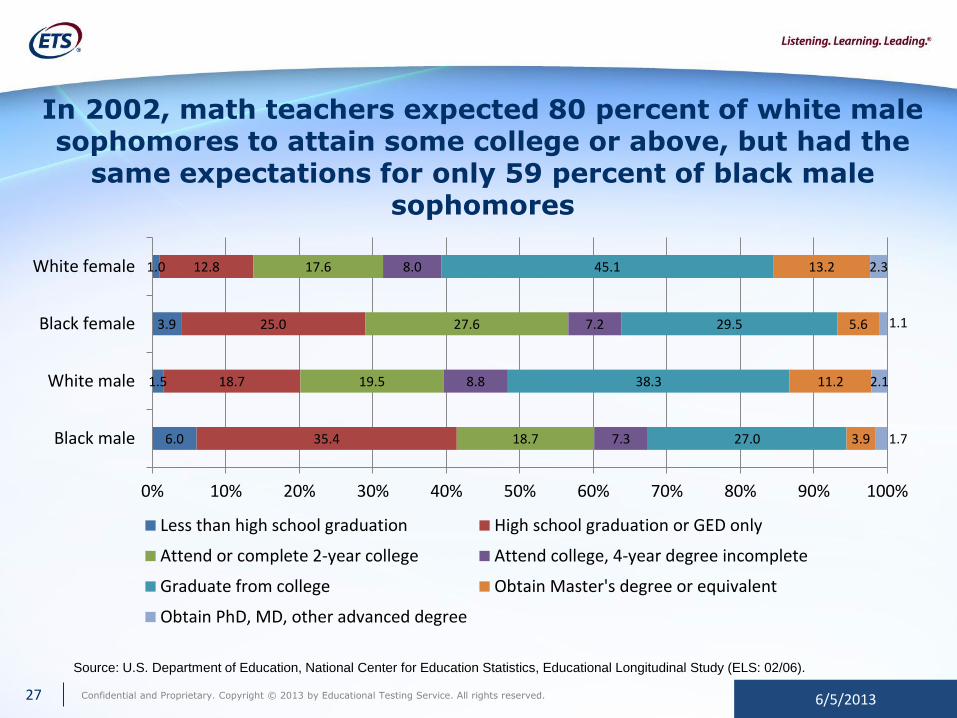
In 2002, math teachers expected 80 percent of white male sophomores to attain some college or above, but had the
same expectations for only 59 percent of black male sophomores
6/5/2013 27
6.0
1.5
3.9
1.0
35.4
18.7
25.0
12.8
18.7
19.5
27.6
17.6
7.3
8.8
7.2
8.0
27.0
38.3
29.5
45.1
3.9
11.2
5.6
13.2
1.7
2.1
1.1
2.3
0% 10% 20% 30% 40% 50% 60% 70% 80% 90% 100%
Black male
White male
Black female
White female
Less than high school graduation High school graduation or GED only
Attend or complete 2-year college Attend college, 4-year degree incomplete
Graduate from college Obtain Master's degree or equivalent
Obtain PhD, MD, other advanced degree
Source: U.S. Department of Education, National Center for Education Statistics, Educational Longitudinal Study (ELS: 02/06).
Confidential and Proprietary. Copyright © 2013 by Educational Testing Service. All rights reserved. Confidential and Proprietary. Copyright © 2013 by Educational Testing Service. All rights reserved.
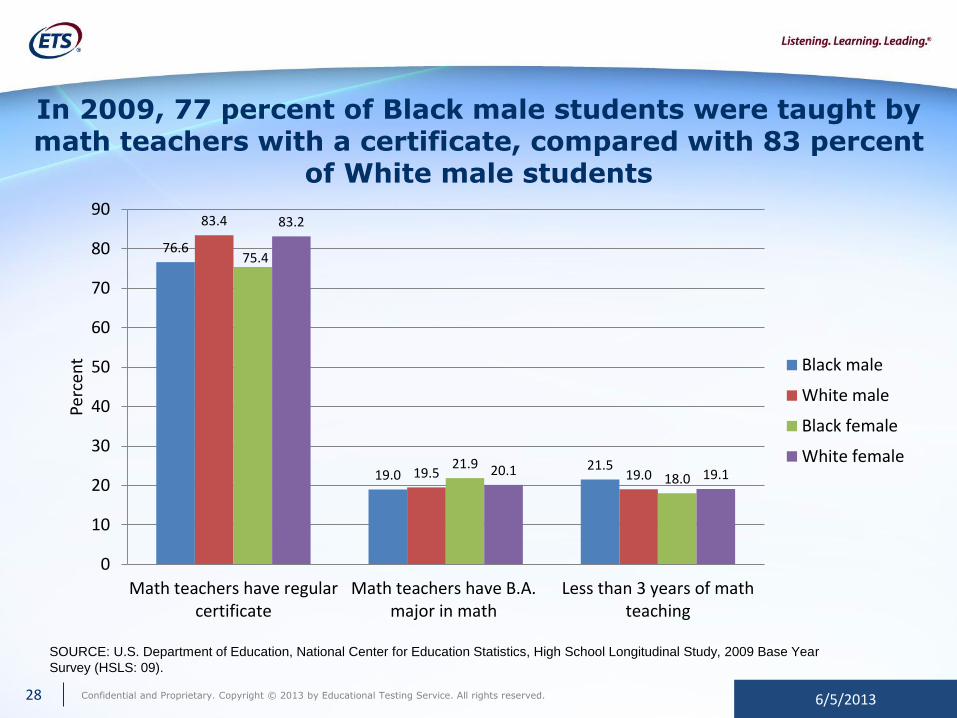
In 2009, 77 percent of Black male students were taught by math teachers with a certificate, compared with 83 percent
of White male students
6/5/2013 28
76.6
19.0 21.5
83.4
19.5 19.0
75.4
21.9 18.0
83.2
20.1 19.1
0
10
20
30
40
50
60
70
80
90
Math teachers have regularcertificate
Math teachers have B.A.major in math
Less than 3 years of mathteaching
Perc
ent Black male
White male
Black female
White female
SOURCE: U.S. Department of Education, National Center for Education Statistics, High School Longitudinal Study, 2009 Base Year
Survey (HSLS: 09).

Confidential and Proprietary. Copyright © 2013 by Educational Testing Service. All rights reserved. Confidential and Proprietary. Copyright © 2013 by Educational Testing Service. All rights reserved.
POLICY RECOMMENDATIONS
6/5/2013 29
Confidential and Proprietary. Copyright © 2013 by Educational Testing Service. All rights reserved. Confidential and Proprietary. Copyright © 2013 by Educational Testing Service. All rights reserved.
1. Provide African Americans with higher-quality education at all levels, starting with early ages of life and sustaining the focus on developing human capital through college completion. Actions should include the following:
•The development of high-quality K–12 schools that are on par with the best schools in the nation, where teaching, learning and socialization are the prime indicators of quality.
•The development and delivery of high-quality curricula for the early years of life (ages birth to 8) that emphasize literacy, numeracy/mathematics, social and emotional development, and executive functioning.
6/5/2013 30
Recommendations to address both the short-term and long-term underachievement and low college-degree
attainment of African-American males:
Confidential and Proprietary. Copyright © 2013 by Educational Testing Service. All rights reserved. Confidential and Proprietary. Copyright © 2013 by Educational Testing Service. All rights reserved.
2. Assist African Americans in raising their school performance and preparing to take standardized tests in elementary, middle and high school by introducing the following actions in schools:
•Identify the best available standardized tests and assessments and deliver education programs to African-American communities about the tests, their structures, contents and uses.
•Expose students to high-quality standardized tests regularly, as part of their school curriculum.
•Launch campaigns designed to raise the expectations of students and teachers that African-American males will prepare academically, financially and socially for college, and attend and graduate from college with at least an associate’s or baccalaureate degree.
6/5/2013 31
Confidential and Proprietary. Copyright © 2013 by Educational Testing Service. All rights reserved. Confidential and Proprietary. Copyright © 2013 by Educational Testing Service. All rights reserved.
3. Recognize that African-American males are the least-represented group among new entering college cohorts, enrolled students and graduates. College admissions, persistence and completion can be substantially improved through the following actions:
•The establishment of “promise” community initiatives in cities throughout the United States (Kalamazoo, Pittsburgh, Eldorado, Syracuse, New Haven etc.)
•Local communities should encourage African-American students to aim to attend the nation’s selective colleges and universities and vigorously pursue alternative routes to earning higher education credentials.
•Cities should follow the model established by Louisville, Kentucky’s “55,000 Degrees” initiative.
•Public colleges and universities should be offered incentives for successfully recruiting, enrolling and succeeding in graduating adult African-American students.
6/5/2013 32
Confidential and Proprietary. Copyright © 2013 by Educational Testing Service. All rights reserved. Confidential and Proprietary. Copyright © 2013 by Educational Testing Service. All rights reserved.
4. Conduct new high-quality research for improving the quality and effectiveness of education for African-American males. Included among the issues that require the attention of researchers, but for which data and evidence are lacking, are the following:
•How to remove or compensate for the impediments to educational attainment and achievement that result from the poverty and low socioeconomic conditions of African Americans.
•The incentives and resources required to attract adult African-American males back into schools, colleges and universities to put them on track toward earning degrees.
•Replicating and adapting programs and initiatives that are found to be successful with other populations in the United States and abroad.
•The quality of the home and family lives of African-American boys, their communities’ encouragement and support for their education and careers, the quality of the education they experience prior to entering school, and the quality of teaching and encouragement they receive throughout their school-age years.
6/5/2013 33
Confidential and Proprietary. Copyright © 2013 by Educational Testing Service. All rights reserved. Confidential and Proprietary. Copyright © 2013 by Educational Testing Service. All rights reserved.
Policy Evaluation & Research Center
http://www.ets.org/research/perc/
www.ets.org/s/achievement_gap/index.html
34