new pre-main sequence candidates in the taurus...
TRANSCRIPT

Astronomy & Astrophysics manuscript no. corr˙vers˙AA c© ESO 200621st August 2006
New pre-main sequence candidatesin the Taurus-Auriga star forming region
L. Scelsi1, A. Maggio2, G. Micela2, I. Pillitteri2 , B. Stelzer2, K. Briggs3, M. Gudel3, N. Grosso4, M. Audard5, and F.Palla6.
1 Dipartimento di Scienze Fisiche ed Astronomiche, Sezione di Astronomia, Universita di Palermo, Piazza del Parlamento 1, I-90134 Palermo,Italy
2 INAF - Osservatorio Astronomico di Palermo, Piazza del Parlamento 1, I-90134 Palermo, Italy3 Paul Scherrer Institut, Wurenlingen and Villigen, CH-5232 Villigen PSI, Switzerland4 Laboratoire d’Astrophysique de Grenoble, Universite Joseph-Fourier, 414, rue de la Piscine, F-38041 Grenoble Cedex, France5 Columbia Astrophysics Laboratory, Mail Code 5247, 550 West 120th Street, New York, NY 10027, USA6 INAF - Osservatorio Astrofisico di Arcetri, Largo E. Fermi 5, I-50125 Firenze, Italy
Received, accepted
Abstract
Aims. We have studied the X-ray source population of the Taurus Molecular Cloud (TMC) to search for new members of the Taurus-Aurigastar forming region.Methods. Candidate members have been selected among the X-ray sources detected in 24 fields of the XMM-Newton Extended Survey ofthe Taurus Molecular Cloud, having an IR counterpart in the 2MASS catalog, based on color-magnitude and color-color diagrams. TheirX-ray spectral properties have been compared with those of known members and other X-ray sources in the same fields but without a NIRcounterpart. A search for flare-like variability in the time series of all new candidates and the analysis of the X-ray spectra of the brightestcandidates have been used to identify sources with a high probability of membership.Results. We have found that 347 of 1909 detected X-ray sources have an infrared counterpart in the 2MASS catalogue. Among them, we haveselected 57 sources that are consistent with being new pre-main sequence star candidates at the distance of the Taurus-Auriga star formingregion; the X-ray spectral properties of this sample are, on the whole, similar to the properties of known TMC members and different fromthose of X-ray sources without an IR counterpart, most of which are likely to be of extragalactic origin. For 12 such candidates, the likelihoodof membership is very high, based on the relatively high plasma temperatures derived from their X-ray spectra and/or the observation ofpowerful flares in their light curves.
Key words. X-rays: stars – Galaxy: Open Clusters and Associations: Individual: Name: Taurus Molecular Cloud – stars: activity – stars:coronae – stars: pre-main-sequence – stars:luminosity function, mass function
1. Introduction
Stellar population studies in star forming regions (SFR) are offundamental importance to address issues related to the forma-tion of stars and planets and the evolution of stellar propertiesduring the early stages of their life. These issues include thedetermination of the stellar Initial Mass Function (IMF), whichis an important test for theories of fragmentation and gravita-tional collapse of molecular clouds that lead to star formation,as well as the study of the strong magnetic activity (and its earlyevolution) responsible for the high levels of X-ray emission inyoung low-mass stars.
Send offprint requests to: L. Scelsi, e-mail:[email protected]
In this context, X-ray observations have proven to be animportant method to discover new pre-main sequence stars.Owing to their intense X-ray emission, from 10 to 104 timesthe solar level (e.g. Feigelson & Montmerle 1999; Stelzer &Neuhauser 2001; Ozawa et al. 2005), and to the relatively lowinterstellar absorption at these wavelengths, X-ray observationsare particularly efficient in detecting the population of youngobjects, namely classical T Tauri stars (CTTs), i.e. stars still ac-creting material from a circumstellar disk, and ”weak-lined” TTauri stars (WTTs), where accretion has ended and whose disksare thin or even absent (Walter et al. 1988). Optical and infraredsurveys have so far identified many classical and ”weak-lined”T Tauri stars, although they may favour the detection of CTTs,because of their strong Hα emission and IR excess. X-ray ob-servations can serve as a complement to optical/IR searches
2 L. Scelsi et al.: New pre-main sequence candidates in Taurus
for new young stars, especially those of very low mass becausethey are more easily detected at X-ray wavelengths. Moreover,since the WTTs are generally less absorbed than CTTs, the for-mer are expected to be more efficiently selected in X-ray sur-veys, thus helping to reduce the bias mentioned above.
The detection of WTTs is also particularly important to es-timate the fraction of stars at a certain age and in a certain en-vironment having a circumstellar disk, and hence to estimatethe disk life times. This information is fundamental to under-standing the evolution of the angular momentum during theearlier phases of the stellar life, as well as for studies on theformation of planetary systems. In the nineties, several ROSATstudies (e.g., Neuhauser et al. 1995; Sterzik et al. 1995; Alcalaet al. 1995) detected a widely dispersed stellar population inTaurus, but also around other star-forming regions. These starsmay have drifted away from their location of formation, orhave been formed at their present location while the molecu-lar clouds have dispersed. However, their status as weak-linedT Tauri stars has been debated, based on arguments that favorages beyond the ZAMS age (e.g., Briceno et al. 1997).
The Taurus Molecular Cloud (TMC) is one of the neareststar forming regions (d ∼ 140 pc) and covers a large portion ofthe sky (∼ 100 square degrees); the currently known members(∼ 350) of this cloud complex are spatially distributed with rel-atively low density (1 − 10 pc−3) and their ages range typicallyfrom 1 to 10 Myr. The stellar mass function of this star formingregion has been investigated by Briceno et al. (2002), Luhmanet al. (2003a) and Luhman (2004), and recently updated byGuieu et al. (2006) with the identification of 5 new very low-mass stars and 12 brown dwarfs; it appears different from theIMF of denser regions, such as Orion and IC 348 (Muench et al.2002; Luhman et al. 2003b, respectively), suggesting a possi-ble dependence of the shape of the IMF on the environment.The Taurus IMF shows a peak at higher masses (∼ 0.8M� vs∼ 0.2M� in Orion and IC 348), very few stars more massivethan ∼ 1M� and a rather flat low-mass tail. A possible inter-pretation of this unusual IMF has recently been given in termsof core collapse and fragmentation, jointly with the ejection ofvery low- and substellar-mass embryos (Goodwin et al. 2004).However, more complete studies of the Taurus population areneeded to assess the shape of the IMF with greater confidence,especially at the low-mass end.
The densest regions of Taurus have been surveyed byXMM-Newton, thus allowing a detailed study of the X-rayemission from young objects of this SFR. In particular, XMM-Newton has recently observed 19 regions, with a circular fieldof view with a diameter of ∼ 30 arcmin and an exposure timeof ∼ 30 ks each; together with 8 more fields in the archive,these observations are the basis for the XMM-Newton ExtendedSurvey of the Taurus Molecular Cloud (XEST), presented indetail in Gudel et al. (2006). The total surveyed area coversabout 5 square degrees of the TMC and contains about 150known members, mainly classical and ”weak-lined” T Tauristars, but also protostars, brown dwarfs and a few Herbig Ae/Bestars and other members with uncertain classification.
This work focuses on the search for new pre-main sequencecandidates among the X-ray detected sources in the fields ofthis XMM-Newton survey, also employing the near infrared
data from the 2MASS point source catalogue (Skrutskie et al.2006). The paper is organized as follows: Sect. 2 summarizesthe main information about the observations analyzed here, thedata reduction and the source detection procedure; in Sect. 3we describe the method used to identify potential new TMCmembers and present the list of such candidates, while we dis-cuss the global X-ray properties of different samples of XESTsources in Sect. 4. We discuss the temporal variability of allnewly identified candidates and the analysis of the EPIC PNspectra of the brightest candidates in Sect. 5. In Sect. 6 we dis-cuss the possible implications of our findings on the TaurusIMF. Our results are summarized in Sect. 7.
2. Observations and source detectionThe present work is based on X-ray data taken with theEuropean Photon Image Camera (EPIC MOS and EPIC PN,Turner et al. 2001; Struder et al. 2001) located in the fo-cal plane of the X-ray telescopes on board XMM-Newton.These non-dispersive CCD detectors, with spectral resolutionR = E/∆E ∼ 5 − 50 in the range 0.1 − 10 keV, and the mir-rors provide a spatial resolution of ∼ 4 − 5′′ and effective areasof ∼ 1200 cm2 (PN) and ∼ 400 cm2 (MOS1 and MOS2) at1.5 keV.
Among the observations analyzed in this study, the newones (fields XEST-02 to XEST-20) were obtained in two sep-arate periods (August-September 2004 and February-March2005) and have PN exposure times ranging from 27 to 35 ks,while the five fields1 in the archive were observed for longertimes (35−63 ks, see below the case of XEST-26). For all fieldsof the XMM-Newton survey of Taurus we have data from allthree EPIC instruments, except for the field XEST-26 (aroundSU Aur) which lacks the PN data (the MOS exposures for thisobservation are ∼ 127 ks). All PN and MOS cameras wereoperated in full window mode, except for the field XEST-20(around V773 Tau) where MOS2 was operated in small win-dow mode, and the medium filter was applied in all observa-tions, with the exception of the fields XEST-26 and XEST-27(around ζ Per) where the thick filter was used. All observa-tions were processed using SAS v6.1. We refer to the paper byGudel et al. (2006) for more details about the observations andthe data reduction. The same paper gives also details relevantto the procedure used to detect X-ray sources in the EPIC im-ages. In brief, source detection was performed on the sum ofPN, MOS1 and MOS2 images, in three different bands, i.e.full(0.5− 7.3 keV), soft (0.5− 2 keV) and hard (2− 7.3 keV) band;the choice of these bands was mainly based on considerationson the expected spectra of the sources of interest and on the en-ergies of strong features in typical EPIC background spectra.Time filtering of the images, yielding the Good Time Intervals(GTI), was applied to remove time ranges affected by high level
1 The field L1495 around V410 Tau was observed twice; the twoobservations are labelled XEST-23 and XEST-24. The fields around TTau, AA Tau and BP Tau (XEST-01, XEST-25 and XEST-28, respec-tively) were not used; these are outlying fields, containing only oneknown TMC member each in the cases of XEST-25 and XEST-28,and three known members, but far away from the rest of TMC, in thecase of XEST-01.

L. Scelsi et al.: New pre-main sequence candidates in Taurus 3
of background emission and to maximize the signal-to-noiseratio of weak sources. Two source detection algorithms wereused in sequence: the PWXDETECT method by Damiani et al.(1997), based on the wavelet transform of the X-ray image, wasemployed to locate source candidates which were confirmedor rejected afterwards by a maximum likelihood fitting of thespatially-dependent PSF using the SAS task EMLDETECT.The whole procedure was calibrated through extensive simu-lations so as to give one expected spurious detection per fielddue to fluctuations of the background. Moreover, clearly spu-rious sources were removed, such as detections in the diffrac-tion features of bright sources. Typically, the number of X-raysources in each field is between 50 and 100; in total, the num-ber of detected sources from this survey is about 2000. Thedetection limit in each field depends on the off-axis angle andon the exposure time obtained after excluding the time intervalsof high background radiation; for a typical observation with anaverage background contamination level, the X-ray luminos-ity detection threshold (at the distance of the Taurus MolecularCloud) is ≈ 9 × 1027 erg s−1 on-axis and ≈ 1.3 × 1028 erg s−1 at10′ off-axis for an X-ray source with a characteristic thermalspectrum having average temperature of the order of ∼ 10 MKand hydrogen column density NH = 3× 1021 cm−2. Most of thedetected sources have no infrared counterpart in the 2MASScatalogue and are likely of extragalactic origin (see Sect. 4),while many of the X-ray sources with IR counterpart lack anyidentification in the SIMBAD database. We detected 121 of153 known TMC members in the analyzed fields; their X-rayproperties are discussed in companion papers by Gudel & etal. (2006); Briggs & et al. (2006a,b); Grosso & et al. (2006);Stelzer et al. (2006); Telleschi et al. (2006); Telleschi & et al.(2006); Franciosini & et al. (2006); Audard et al. (2006); Silva& et al. (2006), while in the present work they have been usedfor comparison purposes with the other sources.
3. Selection of new TMC candidate membersIn order to find possible new members of the Taurus-Aurigastar forming region among the XEST sources, we identifiedthese X-ray sources with NIR counterparts in the 2MASSpoint source catalogue, and plotted their position in IR color-magnitude and color-color diagrams.
After correcting the X-ray source coordinates for system-atic offsets in the boresight positions (Gudel et al. 2006), wesearched for possible IR counterparts to each X-ray sourcewithin a radius of 3′′ from its centre. This choice ensures . 1false association per field and leads to 347 X-ray sources asso-ciated with a point-like source listed in the 2MASS catalogue.
We used the tables reported in Gudel et al. (2006) and theSIMBAD database to identify respectively known members ofthe TMC and other sources already known to be non-membersof the TMC. At this stage, we considered all the sources withaccurately measured IR photometry in the J, H and Ks bands,i.e. we excluded a few 2MASS sources with upper limits ofat least one magnitude, or whose measurements are flagged asinaccurate in the catalogue because of contamination from ex-tended sources or image artifacts. We report the positions ofthe selected sources in the J vs J − Ks and H vs H − Ks di-
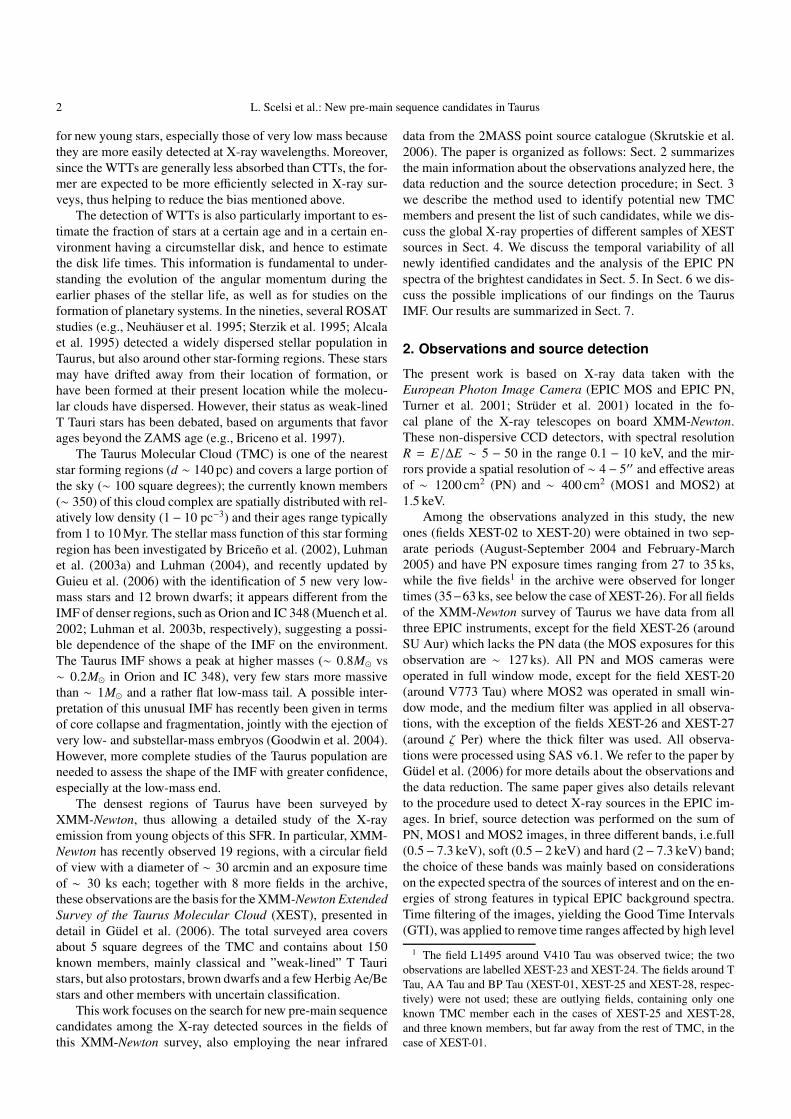
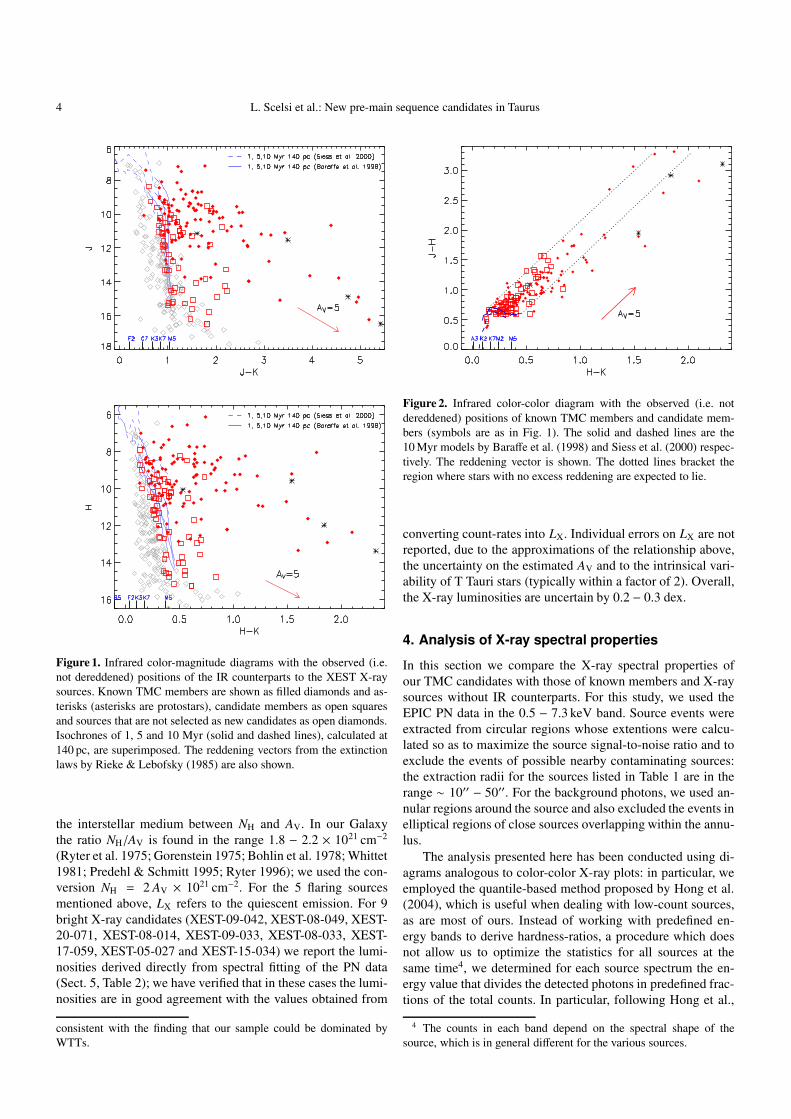
agrams (Fig. 1) together with the isochrones at 1, 5 and 10Myr of Siess et al. (2000) and Baraffe et al. (1998), calculatedfor a distance of 140 pc. Assuming a geometrical extension ofthe molecular cloud of ∼ 15 pc leads to a spread of the trackswithin ∼ 0.25 magnitudes. The J, H and Ks magnitudes are notcorrected for reddening. Fig. 2 shows the J − H vs H − Ks dia-gram. We selected sources satisfying the following criteria: (i)position in the color-magnitude diagrams above or compatiblewith the evolutionary models at 10 Myr within the error bars;(ii) J and H magnitudes lower than 16.5 and 15.5 respectively,which allows us to also include possible moderately absorbedbrown dwarfs (the evolutionary models of Baraffe et al. extenddown to 0.02 M�) and, at the same time, to avoid significantcontamination of the sample with background objects; (iii) forsources lying on (or close to) the evolutionary models in thecolor-magnitude diagrams, that would indicate low absorptionif they are members of this SFR, the same indication of lowabsorption must also be present in the color-color diagram.
The sample of photometric candidate members selected inthis way contains 57 XEST sources reported in Table 1. Figures1 and 2 show that most of the candidates tend to occupy theportions of the diagrams indicating lower absorption (or opti-cally thinner disks) with respect to the known members, as wecould expect from a WTTs-dominated population. From Fig.2 we also note that only two candidates (XEST-02-005 andXEST-06-045) show a clear IR excess, since they lie outsidethe region of the color-color diagram where stars with no ex-cess reddening are expected to be. However, several classical TTauri stars2 of the TMC are located within this region (Gudelet al. 2006), hence we can not rule out that new CTTs may befound among our candidates.
Table 1 contains information about the main X-ray and IRproperties of our candidates. Note that four candidates (XEST-23-065, XEST-03-033, XEST-08-033 and XEST-08-049) arereported twice in the table with different XEST names, sincethey were detected by XMM-Newton in two overlapping fields.X-ray count-rates (CR) are on-axis equivalent rates for the PNin the 0.5 − 7.3 keV band, averaged over the entire observa-tion; for the sources XEST-03-028, XEST-07-005, XEST-17-043, XEST-27-084 and XEST-08-003, that show a quiescentphase preceeded or followed by a strong flare (see Sect. 5), wereport also the values representing the quiescent level. The X-ray luminosities, in the 0.3−10 keV band, were estimated fromcount-rates as follows. Using data relevant to the known TMCmembers surveyed by XMM-Newton (Gudel et al. 2006), LXwas found to be proportional to the PN on-axis count-rate withthe conversion law:LX,30 = (a NH,22 + b) CR , a = 19.8 ± 1.6 , b = 4.2 ± 0.7where LX,30 is in units of 1030 erg s−1 and NH,22 in units of1022 cm−2.
The same law was assumed for our sample of candidates,for which the NH was estimated using approximate visual ab-sorptions from the color-color diagram3 and the relation for
2 About half of the 121 detected known TMC members are proto-stars and CTTs.
3 Note that reasonable estimates of AV are obtained from the color-color diagram if our sources show no significant IR excess; this is
4 L. Scelsi et al.: New pre-main sequence candidates in Taurus
Figure 1. Infrared color-magnitude diagrams with the observed (i.e.not dereddened) positions of the IR counterparts to the XEST X-raysources. Known TMC members are shown as filled diamonds and as-terisks (asterisks are protostars), candidate members as open squaresand sources that are not selected as new candidates as open diamonds.Isochrones of 1, 5 and 10 Myr (solid and dashed lines), calculated at140 pc, are superimposed. The reddening vectors from the extinctionlaws by Rieke & Lebofsky (1985) are also shown.
the interstellar medium between NH and AV. In our Galaxythe ratio NH/AV is found in the range 1.8 − 2.2 × 1021 cm−2
(Ryter et al. 1975; Gorenstein 1975; Bohlin et al. 1978; Whittet1981; Predehl & Schmitt 1995; Ryter 1996); we used the con-version NH = 2 AV × 1021 cm−2. For the 5 flaring sourcesmentioned above, LX refers to the quiescent emission. For 9bright X-ray candidates (XEST-09-042, XEST-08-049, XEST-20-071, XEST-08-014, XEST-09-033, XEST-08-033, XEST-17-059, XEST-05-027 and XEST-15-034) we report the lumi-nosities derived directly from spectral fitting of the PN data(Sect. 5, Table 2); we have verified that in these cases the lumi-nosities are in good agreement with the values obtained from
consistent with the finding that our sample could be dominated byWTTs.
Figure 2. Infrared color-color diagram with the observed (i.e. notdereddened) positions of known TMC members and candidate mem-bers (symbols are as in Fig. 1). The solid and dashed lines are the10 Myr models by Baraffe et al. (1998) and Siess et al. (2000) respec-tively. The reddening vector is shown. The dotted lines bracket theregion where stars with no excess reddening are expected to lie.
converting count-rates into LX. Individual errors on LX are notreported, due to the approximations of the relationship above,the uncertainty on the estimated AV and to the intrinsical vari-ability of T Tauri stars (typically within a factor of 2). Overall,the X-ray luminosities are uncertain by 0.2 − 0.3 dex.
4. Analysis of X-ray spectral propertiesIn this section we compare the X-ray spectral properties ofour TMC candidates with those of known members and X-raysources without IR counterparts. For this study, we used theEPIC PN data in the 0.5 − 7.3 keV band. Source events wereextracted from circular regions whose extentions were calcu-lated so as to maximize the source signal-to-noise ratio and toexclude the events of possible nearby contaminating sources:the extraction radii for the sources listed in Table 1 are in therange ∼ 10′′ − 50′′. For the background photons, we used an-nular regions around the source and also excluded the events inelliptical regions of close sources overlapping within the annu-lus.
The analysis presented here has been conducted using di-agrams analogous to color-color X-ray plots: in particular, weemployed the quantile-based method proposed by Hong et al.(2004), which is useful when dealing with low-count sources,as are most of ours. Instead of working with predefined en-ergy bands to derive hardness-ratios, a procedure which doesnot allow us to optimize the statistics for all sources at thesame time4, we determined for each source spectrum the en-ergy value that divides the detected photons in predefined frac-tions of the total counts. In particular, following Hong et al.,
4 The counts in each band depend on the spectral shape of thesource, which is in general different for the various sources.

L. Scelsi et al.: New pre-main sequence candidates in Taurus 5
Table 1. List of all candidate members. ”XEST id” refers to the name of the X-ray source in the XEST catalogue (Gudel et al. 2006, the first2 digits mark the field of the survey). RA X and DEC X are the coordinates of the X-ray source (corrected for boresight shift). CR is theequivalent on-axis count-rate for the PN in the 0.5 − 7.3 keV band, averaged over the entire observation (see notes for the quiescent level ofthe sources with strong flares). LX is estimated in the 0.3 − 10 keV band from CR (see text), except where noted. A ”y” in the column ”var”means that the X-ray source was found to be variable according to the maximum likelihood algorithm described in Sect. 5. The 7th column isthe designation of the infrared counterpart in the 2MASS catalogue; ”offset” is the distance between the positions of the X-ray source and its IRcounterpart; J, H and Ks are the infrared magnitudes reported in the 2MASS catalogue. Sources in bold face are the most probable candidateson the basis of light curve and/or spectral analysis (Sect. 5).
XEST id RA X DEC X CR (CRquiesc) LX var desig. 2MASS offset J H Ksh m s deg ′ ′′ cts ks−1 1028 erg s−1 arcsec mag mag mag
27-021 3 53 36.36 +31 52 4.1 1.1 ± 0.3 0.72 y 03533637+3152044 0.39 15.24 14.58 14.2127-022 3 53 37.41 +32 4 59.2 7.9 ± 0.8 5.6 03533730+3204582 1.56 8.38 7.91 7.7827-084 3 54 10.70 +31 48 57.6 18.0 ± 0.7 a 8.4 y 03541064+3148573 0.73 12.39 11.64 11.3627-130 3 54 40.39 +31 53 11.0 8.4 ± 0.6 3.6 y 03544037+3153107 0.28 13.32 12.70 12.3406-006 4 03 49.93 +26 20 38.2 2.4 ± 0.6 1.0 04034997+2620382 0.63 13.28 12.66 12.3406-041 4 04 24.49 +26 11 12.9 17.1 ± 1.1 7.3 04042449+2611119 0.90 12.10 11.45 11.1906-045 4 04 27.62 +26 8 33.7 1.5 ± 0.5 0.63 04042766+2608349 1.42 14.63 14.03 13.5020-045 4 14 15.84 +28 18 18.8 1.0 ± 0.2 1.9 04141588+2818181 0.89 14.05 12.98 12.4720-063 4 14 42.90 +28 21 9.3 1.3 ± 0.4 4.3 04144294+2821105 1.40 14.26 12.77 12.0720-066 4 14 47.22 +28 3 5.5 7.1 ± 0.8 3.0 04144739+2803055 2.30 10.80 10.17 9.9220-071 4 14 52.35 +28 6 0.5 159 ± 3 171 b 04145234+2805598 0.68 9.53 8.21 7.7123-062 4 19 1.15 +28 37 10.8 1.4 ± 0.4 0.61 04190125+2837101 1.48 11.81 11.14 10.8823-065 4 19 6.96 +28 26 10.3 1.8 ± 0.3 5.3 04190689+2826090 1.50 14.90 13.57 12.8824-057 4 19 6.85 +28 26 8.8 2.7 ± 0.5 8.1 = XEST-23-06516-045 4 20 39.12 +27 17 31.6 30.4 ± 2.4 13 04203918+2717317 0.86 10.50 9.86 9.5621-026 4 21 40.18 +28 14 21.6 2.1 ± 0.4 0.9 04214013+2814224 1.05 11.93 11.34 11.0311-035 4 21 43.59 +26 47 20.7 2.1 ± 0.5 0.9 04214372+2647225 2.59 9.61 8.98 8.8311-078 4 22 15.65 +26 57 6.5 9.4 ± 0.5 23 y 04221568+2657060 0.60 13.81 12.62 12.0311-087 4 22 24.04 +26 46 25.6 13.4 ± 1.1 16 04222404+2646258 0.19 11.09 10.19 9.7721-059 4 22 25.63 +28 12 33.4 8.9 ± 0.8 6.1 04222559+2812332 0.40 9.26 8.75 8.6211-088 4 22 27.18 +26 59 51.1 2.1 ± 0.3 1.6 04222718+2659512 0.19 15.28 14.59 14.1921-073 4 22 48.77 +28 22 59.9 3.6 ± 0.3 2.7 04224865+2823005 1.58 14.51 13.81 13.4502-005 4 26 34.97 +26 8 16.2 2.9 ± 0.6 5.7 04263497+2608161 0.07 15.79 14.77 13.9302-069 4 27 58.65 +26 11 6.3 1.7 ± 0.4 0.71 04275871+2611062 0.82 10.67 10.00 9.8513-002 4 28 58.45 +24 36 49.3 5.2 ± 1.2 17 04285844+2436492 0.03 13.27 11.70 11.0713-010 4 29 36.07 +24 35 54.7 22.1 ± 1.1 68 04293606+2435556 1.00 10.78 9.39 8.6615-034 4 29 36.17 +26 34 23.4 24.4 ± 1.0 10 b y 04293623+2634238 0.90 11.56 10.94 10.6515-075 4 30 17.10 +26 22 28.3 24.6 ± 2.5 10 04301702+2622264 2.09 11.80 11.16 10.9114-034 4 30 25.21 +26 2 57.2 0.8 ± 0.3 0.35 04302526+2602566 0.89 11.06 10.46 10.2413-036 4 30 41.61 +24 30 43.0 3.6 ± 0.9 1.5 04304153+2430416 1.68 10.22 9.60 9.3819-002 4 31 46.26 +25 58 39.3 3.1 ± 0.9 2.0 04314634+2558404 1.65 13.33 12.62 12.3122-071 4 31 58.57 +18 18 42.1 2.2 ± 0.3 1.3 04315860+1818408 1.30 10.27 9.48 9.2222-111 4 32 26.80 +18 18 23.0 9.9 ± 1.3 7.5 y 04322689+1818230 1.30 12.80 12.00 11.6922-114 4 32 29.40 +18 13 58.5 31.4 ± 1.5 34 04322946+1814002 1.93 14.46 13.69 13.1719-041 4 32 35.85 +25 52 22.6 1.1 ± 0.2 0.94 04323605+2552225 2.75 15.20 14.45 14.1003-028 4 32 39.45 +24 27 4.6 16.6 ± 1.0 a 4.1 y 04323949+2427043 0.62 14.53 12.96 12.3003-033 4 32 59.20 +24 30 40.2 2.5 ± 0.6 5.7 04325921+2430403 0.25 16.48 15.27 14.6604-005 4 32 59.12 +24 30 40.8 4.9 ± 0.7 11.3 = XEST-03-03319-083 4 33 24.99 +25 59 25.7 6.3 ± 0.7 5.9 y 04332491+2559262 1.13 14.38 13.61 13.2417-036 4 33 26.28 +22 45 29.2 24.2 ± 1.1 61 04332621+2245293 0.98 11.80 10.50 9.9217-043 4 33 33.03 +22 52 52.7 20.4 ± 0.9 a 1.2 y 04333301+2252521 0.57 15.40 14.80 14.4017-059 4 33 52.50 +22 56 27.0 57.4 ± 1.9 40 b 04335252+2256269 0.33 10.24 9.47 9.1104-060 4 33 55.57 +24 25 1.1 1.3 ± 0.3 0.74 04335562+2425016 0.94 10.06 9.29 9.0018-059 4 34 33.11 +26 2 42.0 6.7 ± 1.1 2.9 04343322+2602403 2.25 11.18 10.54 10.2812-012 4 34 51.50 +24 4 43.9 3.3 ± 0.8 3.7 04345164+2404426 2.41 13.19 12.37 11.9708-003 4 34 56.86 +22 58 35.8 331 ± 6 a 162 y 04345693+2258358 1.03 10.47 9.59 9.2708-014 4 35 13.23 +22 59 19.5 62.9 ± 1.9 30 b y 04351316+2259205 1.36 11.13 10.53 10.2508-027 4 35 36.53 +23 5 0.8 5.3 ± 0.7 8.3 04353651+2304590 1.69 16.19 15.17 14.7208-033 4 35 42.05 +22 52 22.6 27.2 ± 0.9 38 b 04354203+2252226 0.14 11.25 10.39 9.9909-023 4 35 42.00 +22 52 22.1 28.7 ± 1.9 29 = XEST-08-03308-047 4 35 52.07 +22 55 3.5 5.8 ± 0.6 9.5 04355209+2255039 0.58 11.31 10.23 9.81

6 L. Scelsi et al.: New pre-main sequence candidates in Taurus
Table 1. Continued.
XEST id RA X DEC X CR (CRquiesc) LX var desig. 2MASS offset J H Ksh m s deg ′ ′′ cts ks−1 1028 erg s−1 arcsec mag mag mag
08-049 4 35 52.91 +22 50 58.9 118 ± 2 115 b y 04355286+2250585 0.63 10.99 10.11 9.7509-033 4 35 52.85 +22 50 57.6 81 ± 3 68 b = XEST-08-04909-042 4 35 58.98 +22 38 35.3 269 ± 3 172 b y 04355892+2238353 0.67 9.32 8.60 8.3705-027 4 40 3.49 +25 53 55.4 109 ± 5 202 b 04400363+2553547 2.10 9.81 8.48 7.9107-005 4 40 39.12 +25 40 3.9 8.3 ± 0.7 a 4.4 y 04403912+2540024 1.46 15.61 14.66 14.1110-016 4 42 3.85 +25 19 56.0 0.9 ± 0.3 1.5 04420376+2519533 2.86 15.07 14.04 13.5526-031 4 55 38.46 +30 31 45.4 0.8 ± 0.2 0.66 04553844+3031465 1.16 11.35 10.56 10.2526-052 4 55 48.21 +30 30 14.9 4.7 ± 0.3 2.0 y 04554820+3030160 1.15 11.89 11.22 10.9526-062 4 55 55.99 +30 36 20.6 9.5 ± 0.4 8.6 y 04555605+3036209 0.94 10.47 9.66 9.2726-135 4 56 29.47 +30 36 11.5 0.8 ± 0.2 1.0 04562935+3036115 1.51 15.28 14.48 13.93a Quiescent count-rates (cts ks−1) for sources with strong flares: 15.0 ± 4.3 (XEST-27-084), 1.2 ± 0.7 (XEST-03-028), 2.9 ± 2.3 (XEST-17-043),
180 ± 40 (XEST-08-003), 2.7 ± 2.0 (XEST-07-005).b Obtained from spectral fitting of PN data (see Sect. 5).
we used the median (50%) and the quartiles (25% and 75%) todefine the quantile Q50 = (E50% − Emin)/(Emax − Emin) (withEmax = 7.3 keV and Emin = 0.5 keV), and analogous expres-sions for Q25 and Q75.
We report in the phase space Q25/Q75 vs Q50/(1 − Q50) ofFig. 3 the positions of known TMC members and candidates(left panel) and of the X-ray sources without an IR counterpart(right panel). A theoretical grid predicted by an absorbed one-component coronal model, with fixed abundances (0.3 timesthe solar values of Anders & Grevesse (1989)) and differenttemperatures (going from log T = 6.5 up to log T = 7.75)and hydrogen column densities (from NH = 1020 cm−2 to1023 cm−2), is superimposed. The degeneracy around (X, Y) =(−1.2, 0.4) expresses the similarity between moderately hotspectra with little absorption and cooler absorbed ones (for de-tails about these topics, see also the appendix in Grosso & etal. 2006). At high temperatures, the degeneracy is removed andthe effect of absorption is to shift the model points towards theupper right part of the plot. Note, however, that in this discus-sion the theoretical grid served only as a reference to under-stand where sources with thermal spectra should be expectedto lie, due to the simplicity of the model and the uncertaintyon the computed quantities. In particular, care must be taken inderiving temperature and hydrogen columns from the positionsof the sources with respect to the grid in such diagrams, espe-cially for high-statistics sources, since active stars usually havemore complex spectra that cannot be described by a single-component model.
The large spread of the points, above all for the X-raysources without IR counterpart, is dominated by the large er-ror bars for the faintest sources. Typical errors for faint sourceswith ∼ 30 and ∼ 50 counts are, respectively, ±0.25 and ±0.15on both the quantities on the X and Y axes in Fig. 3. However,we clearly observe that the sources without IR counterpartshave in general spectra harder than those of TMC membersand candidates; this trend is more evident in Fig. 4, where onlysources with more than 80 counts, and hence smaller errors,are plotted. The former sample (i.e. X-ray sources without IRcounterpart) is very likely dominated by extragalactic objects,
as suggested by the fact that power laws that describe the spec-tra of AGNs lie exactly in the portion of the phase space occu-pied by these sources.
We also note that the distributions of candidates and TMCmembers in this quantile space are indistinguishable at bothstatistics we have shown, while they are different from the dis-tribution of the X-ray sources without IR counterpart. It is alsointeresting to note that the sub-sample of known TMC mem-bers lying in the portion of the grid with high temperaturesand hydrogen columns (essentially defined by log10[Q50/(1 −Q50)] > −0.8) is composed of stars with high AV and/or IR ex-cess, as shown in the color-magnitude diagram of Fig. 5, clas-sified as classical T Tauri stars. The candidates found in thiswork mainly lie at log10[Q50/(1−Q50)] < −0.8, where the TMCmembers are both classical and weak-lined T Tauri stars, witha slight predominance of WTTs. This result, together with thecolor-magnitude diagram of Fig. 1, suggests that our sample ofcandidates may be dominated by WTTs.
5. Candidates with high probability of membershipSince young stellar objects frequently show variability of theirX-ray emission on short (∼ ksec) time scales and also exhibitpowerful explosive events (Stelzer et al. 2000; Imanishi et al.2001), we analysed the photon time-series of all candidates inTable 1 to search for variability, and in particular the presenceof flare-like features, supporting the coronal origin and youthof these sources. We used a maximum likelihood algorithm(MLB) that searches for variability in unbinned series of pho-ton arrival times. Details of the method and its application toXEST data are described by Stelzer et al. (2006); it is similarto the Scargle method (Scargle 1998), but is based on a maxi-mum likelihood procedure instead of the Bayesian approach. Inbrief, the algorithm identifies time intervals of constant signalin photon time series under the assumption of Poisson noise.Background subtraction is done on the photon events list indi-vidually for each source before the algorithm is applied. The re-sulting ‘source-only’ light curve consists of segments with dif-ferent intensity levels. The technique has two free parameters,the confidence level for the intensity changes and the minimum

L. Scelsi et al.: New pre-main sequence candidates in Taurus 7
Figure 3. Quantile space for X-ray sources with more than 10 net counts in the PN: known members (filled diamonds) and candidates (opensquares) are shown in the left panel, X-ray sources without an IR counterpart are shown as crosses in the right panel. A theoretical grid relevantto an absorbed, isothermal and optically thin plasma is superimposed, with abundances fixed to 0.3 times the solar values of Anders & Grevesse(1989), calculated for temperatures going from log T = 6.5 up to log T = 7.75 at a logarithmic step of 0.25 and seven values for the hydrogencolumn density (NH = 0.01, 0.1, 0.5, 1, 2, 5 and 10 in units of 1022 cm−2).
Figure 4. Same as the previous figure, but for sources with more than 80 net counts in the PN. The error bars are generally smaller than thoseshown in the lower right part of the plots, typical of sources with about 80 counts.
number of counts (Nmin) that define a segment. Small numbersfor Nmin facilitate the detection of variability in faint sources,but have also a tendency to find variations that are likely spu-rious. Stelzer et al. (2006) find in their variability analysis ofknown TMC members that Nmin = 20 is an adequate compro-mise.
This method indicates that 16 of the 57 XEST sources iden-tified as candidate TMC members are variable in the broadband (0.3 − 7.8 keV) at the 99% level; they are flagged inTable 1. Among them, the sources XEST-03-028, XEST-07-005, XEST-08-014, XEST-17-043, XEST-27-084 and XEST-08-003 show intense flares in their light curves (Fig.6). We con-clude that these 6 sources have higher probability of resultingtrue members of the Taurus Molecular Cloud.
Eleven XEST sources among the candidates listed in Table1 have enough (& 1000) net counts in the PN camera to al-
low global fits of their spectra. Three of them are the flar-ing sources XEST-08-003, XEST-08-014 and XEST-27-084mentioned above, while XEST-08-049 and XEST-09-033 areidentified with the same 2MASS object. After the responsefunctions were built with the SAS tasks arfgen and rmfgen,we tried to fit in XSPEC the spectra of these sources us-ing both an absorbed power law and an absorbed, opticallythin plasma based on the APEC code (Smith et al. 2001),with one (or two) isothermal component(s). The abundancesof the coronal models were fixed at values typical for pre-main sequence or extremely active stars, based on results fromArgiroffi et al. (2004); Garcıa-Alvarez et al. (2005); Scelsi et al.(2005); Telleschi et al. (2005)5. We found that all these spec-
5 With respect to the solar photospheric values by Anders &Grevesse (1989), the adopted abundances are: C=0.45, N=0.788,O=0.426, Ne=0.832, Mg=0.263, Al=0.5, Si=0.309, S=0.417,

8 L. Scelsi et al.: New pre-main sequence candidates in Taurus
Figure 5. IR color-magnitude diagram for the TMC members shownin the left panel of Fig. 3: filled and open diamonds refer to stars lying,in the quantile space, at log10[Q50/(1 − Q50)] greater and lower than−0.8, respectively.
tra are well described by coronal models (Fig. 7) but not bypower laws (except the source XEST-05-027 discussed below),thus excluding an extragalactic nature. The parameters of thebest-fit models are listed in Table 2. The model temperaturesare relatively (or very) high and characteristic of young activestars (e.g. Preibisch et al. 2005); the X-ray luminosities derivedfrom the measured unabsorbed flux and assuming a distanceof 140 pc are in the range 1029 − 3 × 1030 erg s−1, also typi-cal of active stars (Stelzer & Neuhauser 2001; Preibisch et al.2005). Therefore, based on these considerations, we concludethat all these sources have a higher probability of being trueTMC members.
The photon spectrum of XEST-05-027 can also be de-scribed by an absorbed power law which provides χ2
ν = 0.80(17 d.o.f.) and thus formally a better fit than the coronal model.The derived hydrogen column density (∼ 1.3 × 1022 cm−2) andpower law index (∼ −2.2) are values typically found for AGNs(e.g. Hasinger et al. 2001), yet the infrared magnitudes of theIR counterpart would be particularly bright for an extragalac-tic source, and this makes us confident that the nature of thissource is more likely a stellar one. The average temperature ofthe coronal model is very high (∼ 48 MK), but the light curveis consistent with a constant emission, as confirmed by boththe MLB and the Kolmogorov-Smirnov tests. So, although wecannot completely rule out an extragalactic origin, this heavilyabsorbed source deserves attention in the future. An alterna-tive possibility is that a chance association between a stellar IRsource and an X-ray extragalactic source occurred in this case6.
Ar=0.55, Ca=0.195, Fe=0.195, Ni=0.195. The same set of abun-dances was used by Gudel et al. (2006) to fit the spectra of knownTMC members.
6 We expect at most about 20 false associations among the 226 (i.e.347 minus 121 TMC members) X-ray sources with an IR counterpartwithin 3′′.
Most of the candidates with a higher probability of mem-bership (8 of 12) are located in three adjacent fields: XEST-08,XEST-09 and XEST-17 (for a map of the TMC and the XESTfileds, see Fig. 1 in Gudel et al. 2006); these fields do notseem to be special with respect to the others, and the densityof known members is not particularly high in them. Hence, ourfinding may deserve further investigation.
6. DiscussionIn this section we explore the possible implications of our can-didate members on the Taurus IMF. To estimate the masses ofthe selected sources, we evaluated visual extintions AV fromthe color-color diagram (Fig. 2), then we used these extintionsto place the stars in Fig. 1 on the evolutionary tracks by Baraffeet al. (1998), and finally we searched for compatible values ofmass and age in both color-magnitude diagrams (Fig. 1) Note,however, that these estimates may be affected by large uncer-tainties, due to the estimated values of AV, to the assumptionof no IR excess and also to the uncertainties in the evolutionarymodels.
Consider first the sub-sample of candidates with availablePN spectra. We noted that the visual extinctions obtained fromthe IR color-color diagram are consistent with those calcu-lated from the hydrogen column densities using the conver-sion NH = 2 AV × 1021 cm−2 for all sources listed in Table2, with the exception of XEST-20-071; we exclude this starfrom the following discussion together with the source XEST-05-027 because the two pairs of mass and age indicated by thetwo color-magnitude diagrams were largely incompatible. Thegeneral agreement between AV and NH implies no significantIR excess due to a circumstellar disk for these sources. Afterdereddening, their positions in the color-magnitude diagramsyield estimated masses in the range 0.2 – 0.6 M� and ages rang-ing from ∼ 1 to & 10 Myr, in agreement with those of knownTMC members; this result implies that our bright, most proba-ble members are not very low-mass stars, and hence the knowndifference between the shape of the Taurus IMF and those ofOrion and IC 348 at very low masses (see, for example, Fig. 1in Goodwin et al. 2004) will not be reduced.
Since the above sample includes only the X-ray brightestsources, it may not come as a surprise that they are relativelymassive pre-main sequence candidates, because a correlationbetween mass and LX has been found in Taurus (Gudel et al.2006) and also in other star forming regions (e.g. Preibisch &Zinnecker 2002; Preibisch et al. 2005, for the cases of IC 348and Orion, respectively). Therefore, the major implications forthe Taurus IMF could come from the faintest candidates. Sincewe have no estimates of NH for these sources to be comparedwith the AV, we assumed that approximate AV values can be de-rived from the color-color diagram and we used these estimatesto deredden their positions in the color-magnitude diagrams.This procedure was applied to all the X-ray faint sources, ex-cept for XEST-02-005 which clearly shows IR excess and istherefore excluded. For 6 sources we could not obtain com-patible mass and age values from both color-magnitude dia-grams, and hence they are also excluded from the following

L. Scelsi et al.: New pre-main sequence candidates in Taurus 9
Figure 6. Background-subtracted light curves (points with error bars) of six sources showing flares, obtained adding the PN, MOS1 and MOS2counts. The points without errors represent the background emission.
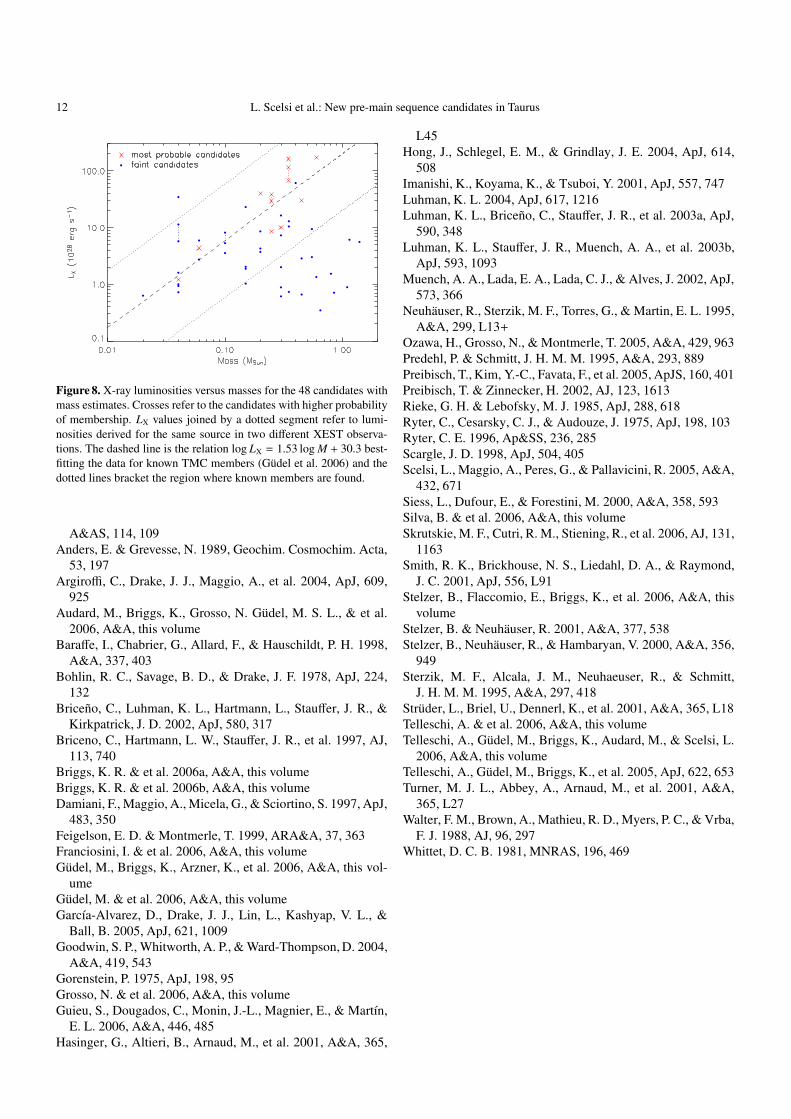
discussion7. In total, we have 48 candidates (including the X-ray bright ones) with self-consistent extintions, mass and ageestimates, which are plotted in Fig. 8: we observe that faintcandidates span a relatively large mass range (0.02 − 1.2 M�)8
but they are not clustered at very low masses. We also note thatmost of the candidates follow the LX-mass correlation derivedfor the other TMC members (Gudel et al. 2006). That is inde-pendent support for these candidates being TMC members, andis especially true for the most probable candidates. Only thosein the lower-right corner (all of them being ”faint candidates”)are suspiciously off.
In conclusion, our analysis suggest that the shape of theTaurus stellar IMF could not be affected significantly at thevery low-mass end, even with the addition of all these candi-dates. However we recall that the masses derived in this sectionmay be affected by large uncertainties; moreover it is quite pos-
7 The candidate XEST-03-028 with high probability of membershipis among the faint sources without mass estimate; its position in theIR diagrams might indicate very high absorption and/or IR excess.
8 The positions in the IR diagrams of the candidates XEST-07-005and XEST-17-043 with high probability of membership could suggestfor them a substellar mass.
sible that several candidates are not true TMC members (pos-sibly the low-luminosity sources with apparently high mass,from Fig. 8), hence more detailed studies of these sources arerequired before any reliable assertion on the very low-mass endof the Taurus IMF can be stated.
7. ConclusionsAs X-ray emission is particularly intense during the earlystages of the stellar evolution, in this work we have employedX-ray data from the XEST survey and the 2MASS infrared datato identify possible new pre-main sequence stars belonging tothe Taurus-Auriga star forming region. More precisely, in the24 regions of the TMC observed by XMM-Newton and ana-lyzed here, covering an area of ∼ 5 square degrees, we iden-tified 57 X-ray and IR sources compatible with being youngstellar objects of this molecular cloud, and we found 12 sourcesamong them with high probability of being TMC membersbased on the analysis of PN spectra and/or the presence offlares in the light curves. From the infrared color-magnitudeand color-color diagrams, we note that most of these candi-dates could be weak-lined T Tauri stars that are less efficientlyselected from population studies in the optical and infrared

10 L. Scelsi et al.: New pre-main sequence candidates in Taurus
Table 2. Parameters of the best-fit coronal models (with 1 σ errors) for the brightest candidate members. Tav is the EM-weighted logarithmicaverage temperature, defined as log Tav = (EM1 log T1 + EM2 log T2)/(EM1 + EM2) (see also Gudel et al. 2006). The model flux (in the0.3 − 10 keV band ) is unabsorbed and the luminosity is calculated from it assuming d = 140 pc.
Source NH T1 T2 EM2/EM1 Tav FX LX χ2ν (d.o. f .) flare
(1022 cm−2) (MK) (MK) (MK) (10−13 cgs) (1028 cgs)XEST-09-042 0.12± 0.01 7.9± 0.3 20± 2 0.71± 0.07 11 7.3 172 0.95 (147)XEST-08-049 a 0.30± 0.02 9.2± 0.6 23± 2 1.4± 0.3 16 4.9 115 1.29 (86)XEST-08-003 0.24± 0.02 8.9± 0.7 50± 6 2.8± 0.6 31 13 290 0.81 (79) yesXEST-20-071 0.41± 0.04 7.8± 0.6 18+3
−2 0.50± 0.15 10 7.3 171 0.74 (49)XEST-08-014 < 0.02 4.7± 0.4 17+3
−2 0.88± 0.16 8.6 1.3 30 1.50 (30) yesXEST-09-033 a 0.25± 0.05 14.5± 0.8 - - 14.5 2.9 68 1.38 (26)XEST-08-033 0.40± 0.10 4.8+1.8
−0.7 16.1+1.3−1.7 0.8± 0.4 8.3 1.6 38 1.47 (22)
XEST-17-059 0.18± 0.03 13.0± 0.6 - - 13 1.7 40 1.09 (27)XEST-05-027 1.10± 0.15 48+20
−11 - - 48 8.6 202 0.89 (17)XEST-15-034 < 0.02 6.0± 0.7 - - 6.0 0.42 10 0.78 (19)XEST-27-084 0.07± 0.04 9.1± 0.8 33+17
−9 0.8± 0.3 17 0.57 13 0.67 (21) yesa These two sources have the same 2MASS counterpart.
Figure 7. EPIC PN spectra of the brightest candidate members (points) with the best-fit coronal models (see Tab. 2 for the parameters of themodels). The lower panel in each plot shows the residuals in unit of χ.

L. Scelsi et al.: New pre-main sequence candidates in Taurus 11
Figure 7. Continued
bands. If not TMC members, these sources might be fore-ground young main sequence stars or background active stars(M-type stars older than the Taurus population, binary RS CVnsystems, bright single giants); the candidate sample might alsoinclude some extragalactic object among the faintest IR andX-ray sources; there is also a relatively small probability ofchance associations between an IR stellar source and an extra-galactic X-ray source. Optical follow-up observations aimed atcollecting spectra for measurements of the Li 6708 Å and Hαlines and radial velocities, and for spectral classification andeffective temperatures determination, will be performed to de-termine the nature of the optical/IR counterparts for the X-raysources identified in this work, and hence to confirm or rejecttheir membership of the TMC; although we do not expect thatall these sources will be confirmed as new members, these ob-servations could lead to a significant increase of the number ofWTTs in these surveyed fields, whose present number is 49.
Acknowledgements. We acknowledge financial support by theInternational Space Science Institute (ISSI) in Bern to the XMM-Newton XEST team. The Palermo group acknowledges financial con-tribution from contract ASI-INAF I/023/05/0. X-ray astronomy re-search at PSI has been supported by the Swiss National ScienceFoundation (grants 20-66875.01 and 20-109255/1). M.A. acknowl-edges support from NASA grant NNGO5GF92G. This research isbased on observations obtained with XMM-Newton, an ESA sciencemission with instruments and contributions directly funded by ESAmember states and the USA (NASA). This publication makes use ofdata products from the Two Micron All Sky Survey (2MASS), whichis a joint project of the University of Massachusetts and the InfraredProcessing and Analysis Center/California Institute of Technology,funded by the National Aeronautics and Space Administration and theNational Science Foundation. Further, our research has made use ofthe SIMBAD database, operated at CDS, Strasbourg, France.
ReferencesAlcala, J. M., Krautter, J., Schmitt, J. H. M. M., et al. 1995,
12 L. Scelsi et al.: New pre-main sequence candidates in Taurus
Figure 8. X-ray luminosities versus masses for the 48 candidates withmass estimates. Crosses refer to the candidates with higher probabilityof membership. LX values joined by a dotted segment refer to lumi-nosities derived for the same source in two different XEST observa-tions. The dashed line is the relation log LX = 1.53 log M + 30.3 best-fitting the data for known TMC members (Gudel et al. 2006) and thedotted lines bracket the region where known members are found.
A&AS, 114, 109Anders, E. & Grevesse, N. 1989, Geochim. Cosmochim. Acta,
53, 197Argiroffi, C., Drake, J. J., Maggio, A., et al. 2004, ApJ, 609,
925Audard, M., Briggs, K., Grosso, N. Gudel, M. S. L., & et al.
2006, A&A, this volumeBaraffe, I., Chabrier, G., Allard, F., & Hauschildt, P. H. 1998,
A&A, 337, 403Bohlin, R. C., Savage, B. D., & Drake, J. F. 1978, ApJ, 224,
132Briceno, C., Luhman, K. L., Hartmann, L., Stauffer, J. R., &
Kirkpatrick, J. D. 2002, ApJ, 580, 317Briceno, C., Hartmann, L. W., Stauffer, J. R., et al. 1997, AJ,
113, 740Briggs, K. R. & et al. 2006a, A&A, this volumeBriggs, K. R. & et al. 2006b, A&A, this volumeDamiani, F., Maggio, A., Micela, G., & Sciortino, S. 1997, ApJ,
483, 350Feigelson, E. D. & Montmerle, T. 1999, ARA&A, 37, 363Franciosini, I. & et al. 2006, A&A, this volumeGudel, M., Briggs, K., Arzner, K., et al. 2006, A&A, this vol-
umeGudel, M. & et al. 2006, A&A, this volumeGarcıa-Alvarez, D., Drake, J. J., Lin, L., Kashyap, V. L., &
Ball, B. 2005, ApJ, 621, 1009Goodwin, S. P., Whitworth, A. P., & Ward-Thompson, D. 2004,
A&A, 419, 543Gorenstein, P. 1975, ApJ, 198, 95Grosso, N. & et al. 2006, A&A, this volumeGuieu, S., Dougados, C., Monin, J.-L., Magnier, E., & Martın,
E. L. 2006, A&A, 446, 485Hasinger, G., Altieri, B., Arnaud, M., et al. 2001, A&A, 365,
L45Hong, J., Schlegel, E. M., & Grindlay, J. E. 2004, ApJ, 614,
508Imanishi, K., Koyama, K., & Tsuboi, Y. 2001, ApJ, 557, 747Luhman, K. L. 2004, ApJ, 617, 1216Luhman, K. L., Briceno, C., Stauffer, J. R., et al. 2003a, ApJ,
590, 348Luhman, K. L., Stauffer, J. R., Muench, A. A., et al. 2003b,
ApJ, 593, 1093Muench, A. A., Lada, E. A., Lada, C. J., & Alves, J. 2002, ApJ,
573, 366Neuhauser, R., Sterzik, M. F., Torres, G., & Martin, E. L. 1995,
A&A, 299, L13+Ozawa, H., Grosso, N., & Montmerle, T. 2005, A&A, 429, 963Predehl, P. & Schmitt, J. H. M. M. 1995, A&A, 293, 889Preibisch, T., Kim, Y.-C., Favata, F., et al. 2005, ApJS, 160, 401Preibisch, T. & Zinnecker, H. 2002, AJ, 123, 1613Rieke, G. H. & Lebofsky, M. J. 1985, ApJ, 288, 618Ryter, C., Cesarsky, C. J., & Audouze, J. 1975, ApJ, 198, 103Ryter, C. E. 1996, Ap&SS, 236, 285Scargle, J. D. 1998, ApJ, 504, 405Scelsi, L., Maggio, A., Peres, G., & Pallavicini, R. 2005, A&A,
432, 671Siess, L., Dufour, E., & Forestini, M. 2000, A&A, 358, 593Silva, B. & et al. 2006, A&A, this volumeSkrutskie, M. F., Cutri, R. M., Stiening, R., et al. 2006, AJ, 131,
1163Smith, R. K., Brickhouse, N. S., Liedahl, D. A., & Raymond,
J. C. 2001, ApJ, 556, L91Stelzer, B., Flaccomio, E., Briggs, K., et al. 2006, A&A, this
volumeStelzer, B. & Neuhauser, R. 2001, A&A, 377, 538Stelzer, B., Neuhauser, R., & Hambaryan, V. 2000, A&A, 356,
949Sterzik, M. F., Alcala, J. M., Neuhaeuser, R., & Schmitt,
J. H. M. M. 1995, A&A, 297, 418Struder, L., Briel, U., Dennerl, K., et al. 2001, A&A, 365, L18Telleschi, A. & et al. 2006, A&A, this volumeTelleschi, A., Gudel, M., Briggs, K., Audard, M., & Scelsi, L.
2006, A&A, this volumeTelleschi, A., Gudel, M., Briggs, K., et al. 2005, ApJ, 622, 653Turner, M. J. L., Abbey, A., Arnaud, M., et al. 2001, A&A,
365, L27Walter, F. M., Brown, A., Mathieu, R. D., Myers, P. C., & Vrba,
F. J. 1988, AJ, 96, 297Whittet, D. C. B. 1981, MNRAS, 196, 469