new record keeper, same great low-cost investments · the better for you. new record keeper, ......
TRANSCRIPT

As you have heard by now, Fidelity Investments will become the new record keeper for the Halliburton retirement plan in January. You’ll have new ways to access your account and make transactions, plus a host of new investment
resources, including online tools, available through Fidelity.
But the main retirement plan benefits and features, including the investment options, are not changing. And that’s a great thing for you, because you’ll still have access to 12 investment options that are custom-built especially for the benefit of Halliburton employees — see page 2 for a chart of what’s offered.
Most of the investment options are set up as institutionally-managed separate accounts, which means they’re not mutual funds that just anyone can buy. The investment
TrustTalk Current news concerning your retirement plan
Fall 2010
options are assembled a lot like mutual funds, but designed for Halliburton employees specifically. For example, the Large Cap Growth Equity Fund is made up of a number of different large cap stocks, just like a mutual fund. Investments and earnings are similar to those in many other large cap stock mutual funds.
Lower expense ratios help you keep more of any money your investments make, so your account can grow faster.
Remember to compare apples to apples. Different types of funds (asset classes) will normally tend to have higher or lower expense ratios. For example, expense ratios for non-U.S. equity funds tend to be higher than for bond funds. It’s important to compare expense ratios for the same type of fund (U.S. Bond vs. U.S. Bond). The lower the expense ratio, the better for you.
New Record Keeper, Same Great Low-Cost Investments
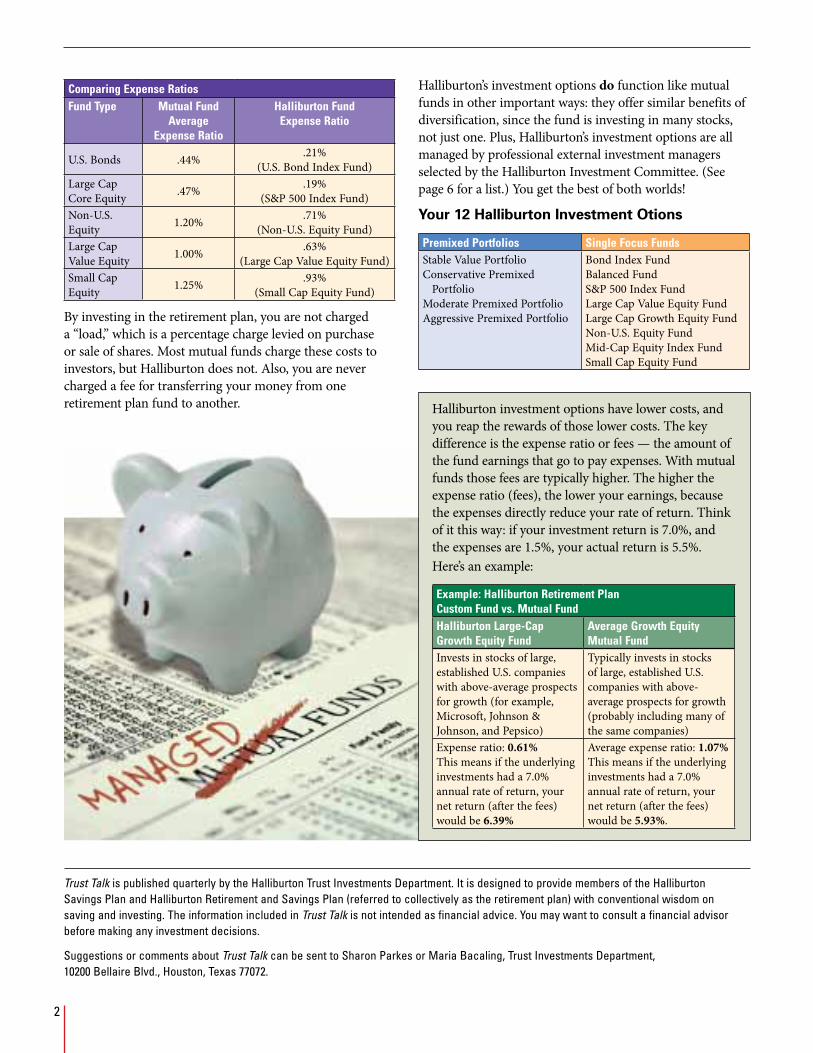
Comparing Expense RatiosFund Type Mutual Fund
Average Expense Ratio
Halliburton Fund Expense Ratio
U.S. Bonds .44% .21% (U.S. Bond Index Fund)
Large Cap Core Equity .47% .19%
(S&P 500 Index Fund)Non-U.S. Equity 1.20% .71%
(Non-U.S. Equity Fund)Large Cap Value Equity 1.00% .63%
(Large Cap Value Equity Fund)Small Cap Equity 1.25% .93%
(Small Cap Equity Fund)
By investing in the retirement plan, you are not charged a “load,” which is a percentage charge levied on purchase or sale of shares. Most mutual funds charge these costs to investors, but Halliburton does not. Also, you are never charged a fee for transferring your money from one retirement plan fund to another.
Trust Talk is published quarterly by the Halliburton Trust Investments Department. It is designed to provide members of the Halliburton Savings Plan and Halliburton Retirement and Savings Plan (referred to collectively as the retirement plan) with conventional wisdom on saving and investing. The information included in Trust Talk is not intended as financial advice. You may want to consult a financial advisor before making any investment decisions.
Suggestions or comments about Trust Talk can be sent to Sharon Parkes or Maria Bacaling, Trust Investments Department, 10200 Bellaire Blvd., Houston, Texas 77072.
Halliburton’s investment options do function like mutual funds in other important ways: they offer similar benefits of diversification, since the fund is investing in many stocks, not just one. Plus, Halliburton’s investment options are all managed by professional external investment managers selected by the Halliburton Investment Committee. (See page 6 for a list.) You get the best of both worlds!
Your 12 Halliburton Investment Otions
Premixed Portfolios Single Focus FundsStable Value PortfolioConservative Premixed
PortfolioModerate Premixed PortfolioAggressive Premixed Portfolio
Bond Index FundBalanced FundS&P 500 Index FundLarge Cap Value Equity FundLarge Cap Growth Equity FundNon-U.S. Equity FundMid-Cap Equity Index FundSmall Cap Equity Fund
Halliburton investment options have lower costs, and you reap the rewards of those lower costs. The key difference is the expense ratio or fees — the amount of the fund earnings that go to pay expenses. With mutual funds those fees are typically higher. The higher the expense ratio (fees), the lower your earnings, because the expenses directly reduce your rate of return. Think of it this way: if your investment return is 7.0%, and the expenses are 1.5%, your actual return is 5.5%. Here’s an example:
Example: Halliburton Retirement Plan Custom Fund vs. Mutual FundHalliburton Large-Cap Growth Equity Fund
Average Growth Equity Mutual Fund
Invests in stocks of large, established U.S. companies with above-average prospects for growth (for example, Microsoft, Johnson & Johnson, and Pepsico)
Typically invests in stocks of large, established U.S. companies with above-average prospects for growth (probably including many of the same companies)
Expense ratio: 0.61%This means if the underlying investments had a 7.0% annual rate of return, your net return (after the fees) would be 6.39%
Average expense ratio: 1.07%This means if the underlying investments had a 7.0% annual rate of return, your net return (after the fees) would be 5.93%.
2
This is one of the busiest times of the year for most of us. Shopping, family gatherings, holiday parties and winter maintenance on your home are just some of the activities keeping you busy. While you are reviewing your list of gifts to buy, home fixes
to complete before the days get shorter and holiday recipes to cook, you should review your finances, to make sure they are in shape for the new year.
Review Your Strategy
Your life can change significantly over the course of a year. You may have gotten married or divorced, had a child or grandchild, or bought a house. For every major change in your life, you might need to change your investment strategies. Consider what’s changed — your short-term goals or your long-term goals — and then adjust your investment strategy accordingly.
Review Your Contributions
Make sure you are contributing at least enough to receive the maximum Halliburton Company match. If you contribute up to 4% of your eligible pay each pay period, Halliburton matches 100% of your tax-deferred contributions. Additionally, Halliburton matches 50% of your tax-deferred contributions per pay period when you contribute between 4% and 6% of your eligible pay. This means if you contribute 6% or more of your pay per pay period, you’ll receive a total of 5% match from Halliburton. If you aren’t taking full advantage of the match, do what you can to make that happen in 2011. Don’t leave money on the table.
Review Your Investments
Review your investment portfolio at least once a year. As you look over your year-end statements, look at your investments. Has your portfolio become unbalanced? You may have begun the year with a strategy to invest 70% in stocks and 30% in bonds, but maybe your portfolio has shifted to 78% stocks and 22% bonds. Take this time to rebalance your portfolio.
While you’re reviewing your portfolio and deciding on what changes to make, consider moving your contribution allocations or rebalancing before the blackout period as Halliburton makes the move to Fidelity. Or, wait until after the blackout period and then make changes.
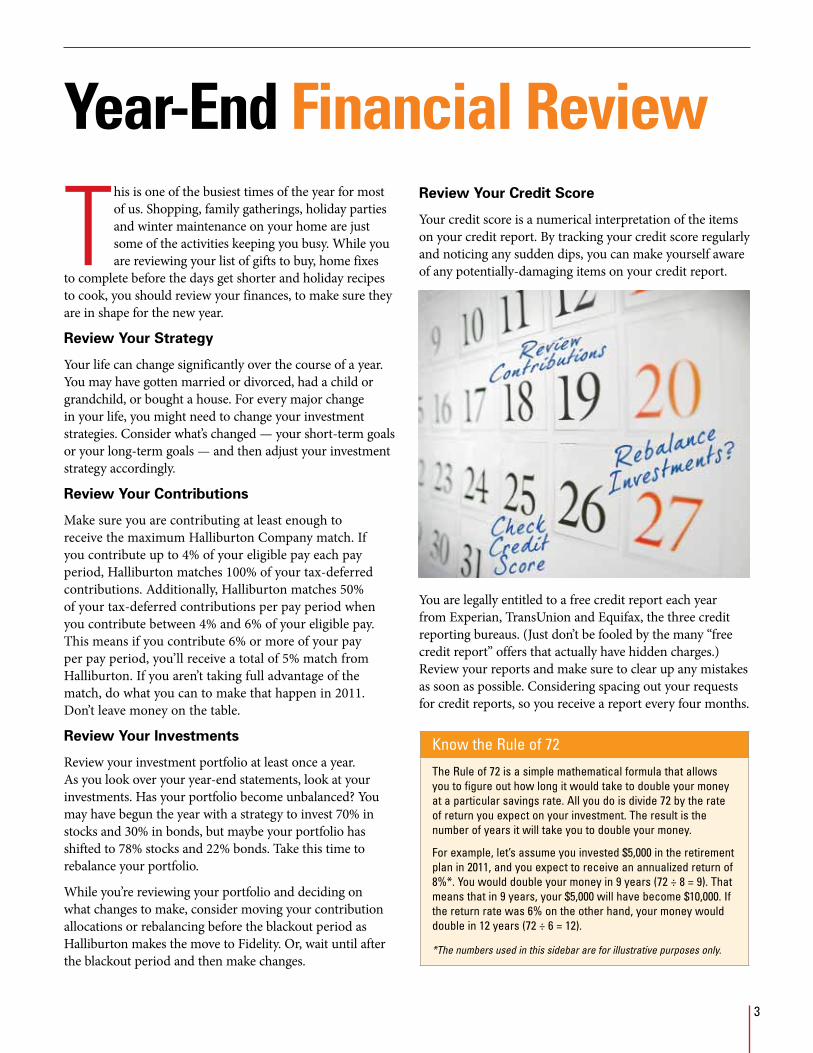
Year-End Financial ReviewReview Your Credit Score
Your credit score is a numerical interpretation of the items on your credit report. By tracking your credit score regularly and noticing any sudden dips, you can make yourself aware of any potentially-damaging items on your credit report.
You are legally entitled to a free credit report each year from Experian, TransUnion and Equifax, the three credit reporting bureaus. (Just don’t be fooled by the many “free credit report” offers that actually have hidden charges.) Review your reports and make sure to clear up any mistakes as soon as possible. Considering spacing out your requests for credit reports, so you receive a report every four months.
Know the Rule of 72
The Rule of 72 is a simple mathematical formula that allows you to figure out how long it would take to double your money at a particular savings rate. All you do is divide 72 by the rate of return you expect on your investment. The result is the number of years it will take you to double your money.
For example, let’s assume you invested $5,000 in the retirement plan in 2011, and you expect to receive an annualized return of 8%*. You would double your money in 9 years (72 ÷ 8 = 9). That means that in 9 years, your $5,000 will have become $10,000. If the return rate was 6% on the other hand, your money would double in 12 years (72 ÷ 6 = 12).
*The numbers used in this sidebar are for illustrative purposes only.
3

When the Halliburton retirement plan moves from the current record keeper to Fidelity, there will be a “blackout” period when you won’t be able to do certain things with your retirement plan. The blackout period
starts on December 23, 2010 and is expected to last until sometime during the week of January 2, 2011. To learn more about this transition please refer to the Fidelity Transition Guide you received in the mail or go to www.halliburton.com/benefits.
However, there’s no blackout period when it comes to learning more about your investments. In fact, the blackout period is a great time to review your investment options and goals and to think about what you need to do to make the most of the retirement plan in 2011.
Time to Take a Fresh Look at Your Investments
Start by asking yourself these key questions:
• How confident am I about my investments?
• Have my goals changed since I last looked at my investments? Do I need to change my mix of investments?
• What topic or area do I want to know more about?
• Will I have enough money to retire? How long will my money last?
Then, when the blackout is lifted, make a note to find the answers to your questions: you can start by exploring Fidelity’s many online tools and resources or talk with a representative. Trust Talk will continue to help, too, by continuing to bring you articles focused on how you can make the most of your investments in the retirement plan.
4
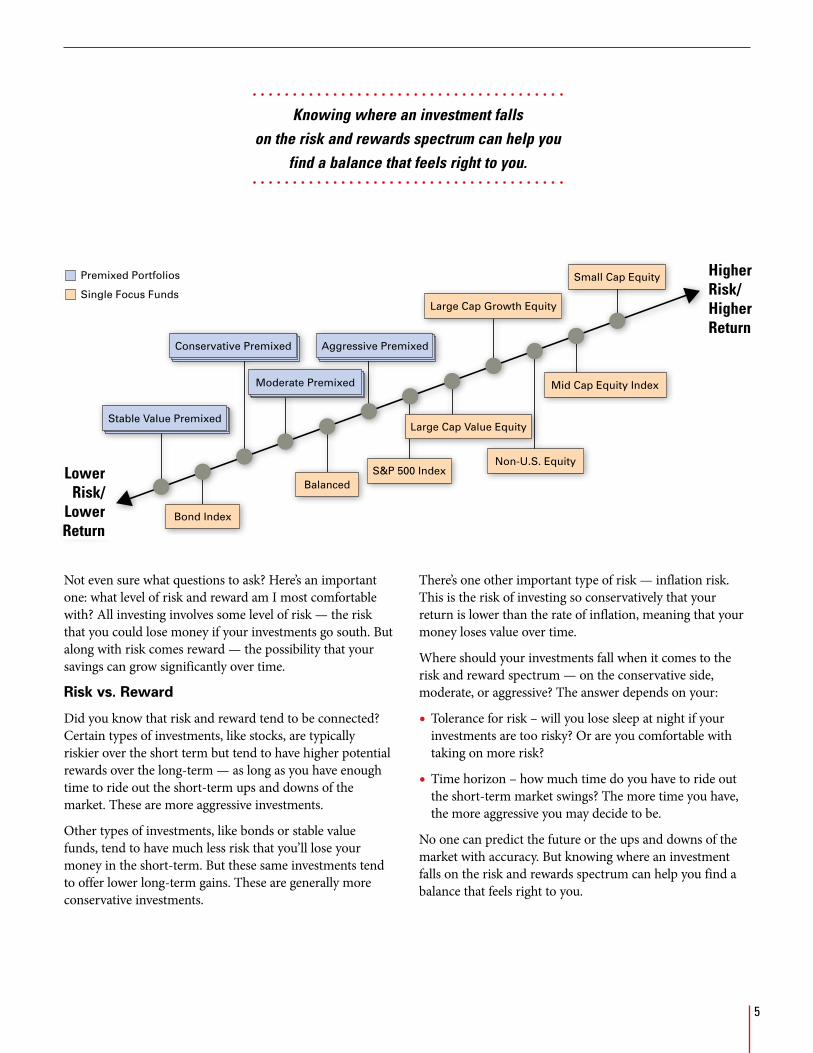
Not even sure what questions to ask? Here’s an important one: what level of risk and reward am I most comfortable with? All investing involves some level of risk — the risk that you could lose money if your investments go south. But along with risk comes reward — the possibility that your savings can grow significantly over time.
Risk vs. Reward
Did you know that risk and reward tend to be connected? Certain types of investments, like stocks, are typically riskier over the short term but tend to have higher potential rewards over the long-term — as long as you have enough time to ride out the short-term ups and downs of the market. These are more aggressive investments.
Other types of investments, like bonds or stable value funds, tend to have much less risk that you’ll lose your money in the short-term. But these same investments tend to offer lower long-term gains. These are generally more conservative investments.
Small Cap Equity
Mid Cap Equity Index
Large Cap Value Equity
Large Cap Growth Equity
Non-U.S. EquityS&P 500 Index
Aggressive PremixedConservative Premixed
Balanced
Moderate Premixed
Bond Index
Stable Value Premixed
HigherRisk/HigherReturn
LowerRisk/
LowerReturn
Premixed Portfolios
Single Focus Funds
There’s one other important type of risk — inflation risk. This is the risk of investing so conservatively that your return is lower than the rate of inflation, meaning that your money loses value over time.
Where should your investments fall when it comes to the risk and reward spectrum — on the conservative side, moderate, or aggressive? The answer depends on your:
• Tolerance for risk – will you lose sleep at night if your investments are too risky? Or are you comfortable with taking on more risk?
• Time horizon – how much time do you have to ride out the short-term market swings? The more time you have, the more aggressive you may decide to be.
No one can predict the future or the ups and downs of the market with accuracy. But knowing where an investment falls on the risk and rewards spectrum can help you find a balance that feels right to you.
Knowing where an investment falls
on the risk and rewards spectrum can help you
find a balance that feels right to you.
Small Cap Equity
Mid Cap Equity Index
Large Cap Value Equity
Large Cap Growth Equity
Non-U.S. EquityS&P 500 Index
Aggressive PremixedConservative Premixed
Balanced
Moderate Premixed
Bond Index
Stable Value Premixed
HigherRisk/HigherReturn
LowerRisk/
LowerReturn
Premixed Portfolios
Single Focus Funds
5
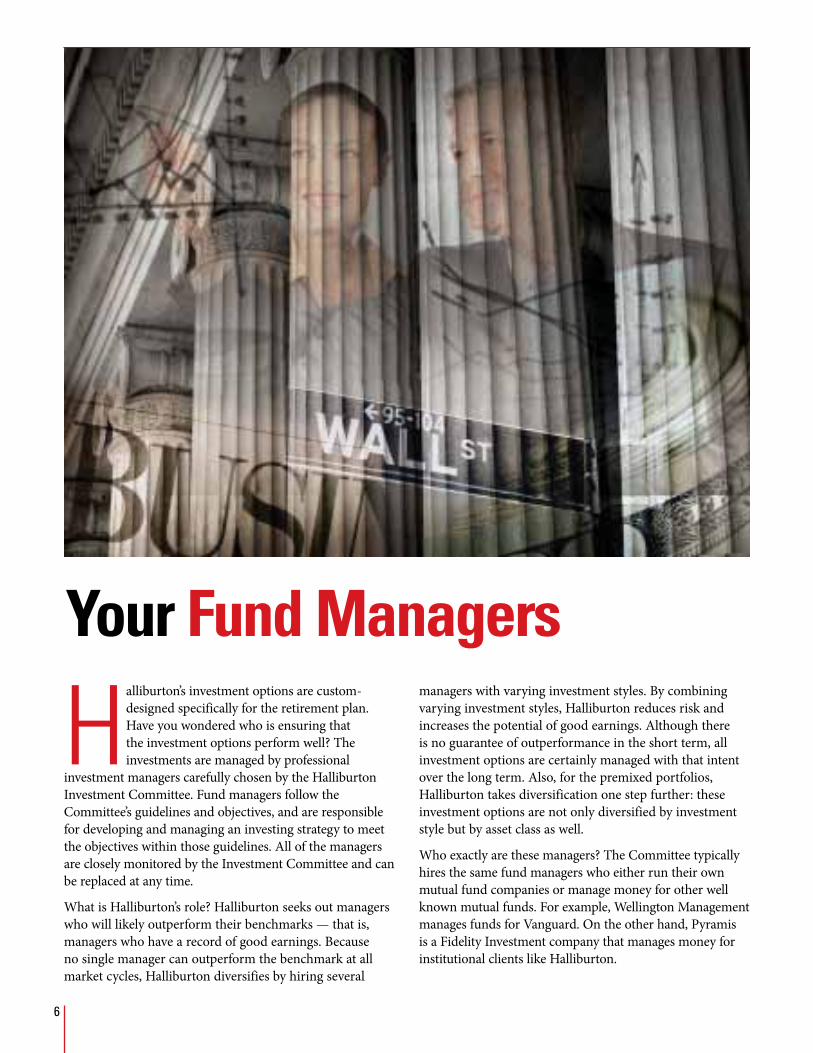
Halliburton’s investment options are custom-designed specifically for the retirement plan. Have you wondered who is ensuring that the investment options perform well? The investments are managed by professional
investment managers carefully chosen by the Halliburton Investment Committee. Fund managers follow the Committee’s guidelines and objectives, and are responsible for developing and managing an investing strategy to meet the objectives within those guidelines. All of the managers are closely monitored by the Investment Committee and can be replaced at any time.
What is Halliburton’s role? Halliburton seeks out managers who will likely outperform their benchmarks — that is, managers who have a record of good earnings. Because no single manager can outperform the benchmark at all market cycles, Halliburton diversifies by hiring several
managers with varying investment styles. By combining varying investment styles, Halliburton reduces risk and increases the potential of good earnings. Although there is no guarantee of outperformance in the short term, all investment options are certainly managed with that intent over the long term. Also, for the premixed portfolios, Halliburton takes diversification one step further: these investment options are not only diversified by investment style but by asset class as well.
Who exactly are these managers? The Committee typically hires the same fund managers who either run their own mutual fund companies or manage money for other well known mutual funds. For example, Wellington Management manages funds for Vanguard. On the other hand, Pyramis is a Fidelity Investment company that manages money for institutional clients like Halliburton.
Your Fund Managers
6
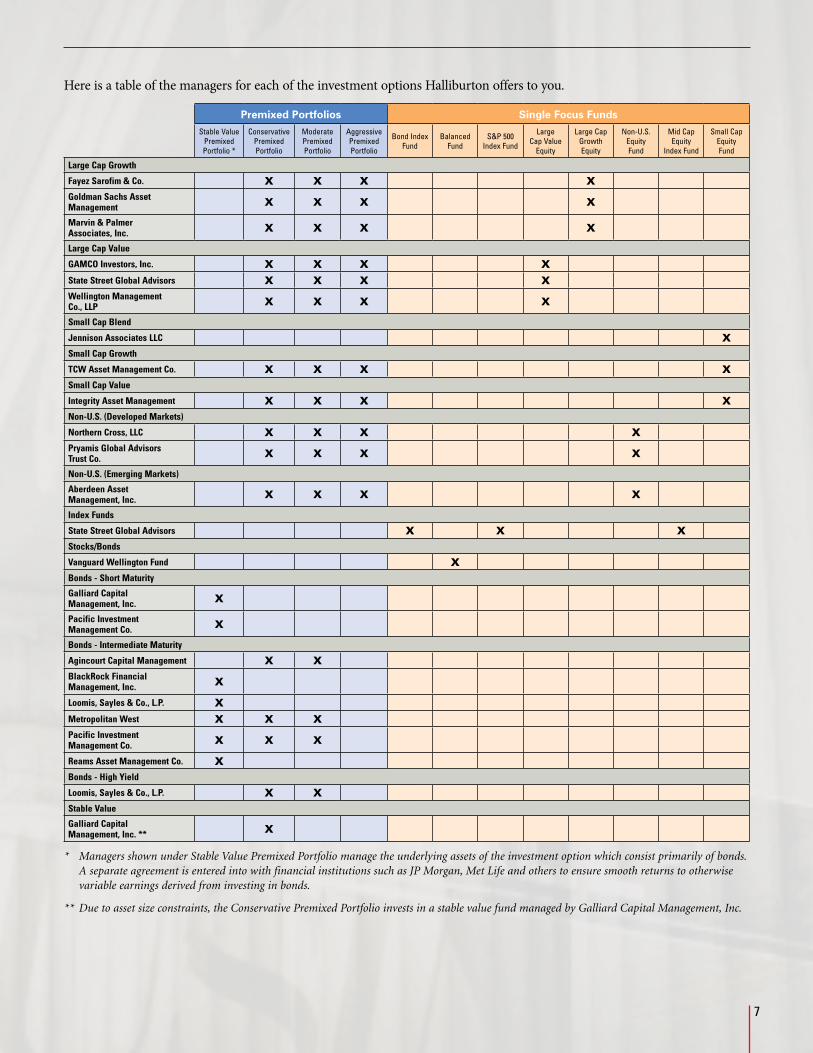
Here is a table of the managers for each of the investment options Halliburton offers to you.
Premixed Portfolios Single Focus FundsStable Value
Premixed Portfolio *
Conservative Premixed Portfolio
Moderate Premixed Portfolio
Aggressive Premixed Portfolio
Bond Index Fund
Balanced Fund
S&P 500 Index Fund
Large Cap Value
Equity
Large Cap Growth Equity
Non-U.S. Equity Fund
Mid Cap Equity
Index Fund
Small Cap Equity Fund
Large Cap Growth
Fayez Sarofim & Co. X X X XGoldman Sachs Asset Management X X X X
Marvin & Palmer Associates, Inc. X X X X
Large Cap Value
GAMCO Investors, Inc. X X X XState Street Global Advisors X X X XWellington Management Co., LLP X X X X
Small Cap Blend
Jennison Associates LLC XSmall Cap Growth
TCW Asset Management Co. X X X XSmall Cap Value
Integrity Asset Management X X X XNon-U.S. (Developed Markets)
Northern Cross, LLC X X X XPryamis Global Advisors Trust Co. X X X X
Non-U.S. (Emerging Markets)
Aberdeen Asset Management, Inc. X X X X
Index Funds
State Street Global Advisors X X XStocks/Bonds
Vanguard Wellington Fund XBonds - Short Maturity
Galliard Capital Management, Inc. X
Pacific Investment Management Co. X
Bonds - Intermediate Maturity
Agincourt Capital Management X XBlackRock Financial Management, Inc. X
Loomis, Sayles & Co., L.P. XMetropolitan West X X XPacific Investment Management Co. X X X
Reams Asset Management Co. XBonds - High Yield
Loomis, Sayles & Co., L.P. X XStable Value
Galliard Capital Management, Inc. ** X
* ManagersshownunderStableValuePremixedPortfoliomanagetheunderlyingassetsoftheinvestmentoptionwhichconsistprimarilyofbonds.AseparateagreementisenteredintowithfinancialinstitutionssuchasJPMorgan,MetLifeandotherstoensuresmoothreturnstootherwisevariableearningsderivedfrominvestinginbonds.
** Duetoassetsizeconstraints,theConservativePremixedPortfolioinvestsinastablevaluefundmanagedbyGalliardCapitalManagement,Inc.
7
Market Continues to Expand, but Fears of Double-Dip Recession RemainThe US economy continued to expand in the third quarter of 2010, but the pace of expansion continued to slow compared to the rebound of 2009. Estimated economic growth for the third quarter is 1.9%, compared to 5.6% in 4Q 2009, 2.7% in 1Q 2010 and 1.6% in 2Q 2010.
The quarter began with the arrival of robust second quarter earnings reports which bolstered the returns of the financial markets in July. However, weak employment reports in August in conjunction with disappointing housing news cracked investor confidence and fear of a double-dip recession crept back into the picture. The US Federal Reserve kept interest rates at near zero levels and the US 10 Year Treasury bond was driven up in price as investors sought safety, resulting in its yield falling to record lows.
The US stock market rose during the quarter. Despite up and down results in July and August, a robust rebound in September fueled by strong corporate earnings drove markets higher. The S&P 500 gained 11% during the quarter and was up almost 4% year to date. Large cap stocks faired slightly better than small caps for the quarter however, mid cap stock performed the best. In a reversal from the second quarter, growth oriented stocks outpaced their value counterparts across all market caps. All sectors within the market experienced positive growth led by
Market Update
Newsstand
telecommunication services and materials, while the financials sector did not perform as well.
In non-US equity markets, many of the trends in the US economy were also seen in foreign countries such as higher than expected corporate earnings and low interest rates. The currency impact for US investors continued to be a strong contributor to returns as the dollar declined versus most other currencies and contributed over 9% to international equity returns. Energy, telecommunication services and materials stocks led the way while technology stocks lagged
during the quarter.
As default rates continued to decline and spreads narrowed, the fixed income market saw risk tolerance come back as high yield outperformed many other sectors of the market. Federal Reserve chairman
Ben Bernanke’s claim that a second round of quantitative easing might be necessary to kick start the economy lead to continued demand for Treasuries. This combined with continued slow economic growth and no immediate inflationary threat has resulted in continued high demand for fixed income. Rates across the US Treasury yield curve continued to drop during the quarter. Other contributing factors to this fall in interest rates were a tame inflation report in September, weak housing market numbers and the Fed’s continued stance to keep rates low for an extended period.
The Barclays Capital Aggregate Bond Index returned 2.5% for the quarter which resulted in a 7.9% year to date return for the broad fixed income index.
8

To Rent or To Own in Retirement?Housing plays a featured role in financial planning for retirement these days, whether you’re looking at downsizing, thinking about moving, or realizing you’re going to have mortgage payments longer than expected. You may have thought the housing situation was going to be simpler when you reached retirement, but the ups and downs in the housing market could have changed all that. Let’s take a look at the pros, cons and realities of owning vs. renting in retirement.
The Upside of Renting
Renting can offer freedom, because it relieves you of the headaches of owning your own home. You have lower maintenance costs. Furnace on the fritz? Make a call to your building handy man and it’s fixed. You also can relocate on short notice. Overall, the costs and hassles of renting instead of owning tend be lower.
The Downside of Renting
When you rent, you don’t earn equity, meaning you don’t have an asset you can tap, if you need income later. Rent tends to increase over time, making it tough to afford over time if you’re on a fixed income. Finally, many renters overlook that rent isn’t your only cost. You also have renters insurance, security deposits and extra fees for parking and pets. And don’t forget about neighbors and potentially less privacy.
The Positives of Home Ownership
One of the benefits of owning a home is equity. Depending on how long you’ve owned your home, you will probably see the value of your home rise over the years. Owning a home also provides security and control. You make the decision on what improvements to make, and when. Also, if you’ve paid off your mortgage, you have greater security when it comes to having a place to live for the rest of your life.
The Negatives of Home Ownership
While your home is an asset, it’s not a liquid asset. During tough economic times like we’ve experienced recently, the housing market is slow. You may not be able to sell quickly — or at the price your want (or even at what your house is worth). Also, you are responsible for the maintenance on your home from top to bottom. Even after you pay off your mortgage, you’ll still have the expenses of property taxes and the costs of maintenance. These costs will likely increase throughout your retirement.
Draw Your Own Conclusions
Take a look at the table below. It highlights the pros and cons of owning vs. renting. Owning a home offers you more financial security, but renting offers you more freedom. When you own you maintain control of your property, but you also have more responsibility.
Newsstand
Retiree Corner
Owning Renting
Building equity Yes; the amount depends on years left in mortgage No
Tax deduction Yes, for mortgage interest No
Property taxes Yes Included in rent
Stable payment Yes, with a fixed mortgage; property tax, insurance and condo/co-op fees can increase
No; rent and insurance may increase yearly or even more frequently
Maintenance Yes No
Renovations Yes No
Appliances Yes, must buy and repair No
Other potential expenses Mortgage origination and refinancing costs Security and pet deposits, and agent commission
Source:MSNMoneyandBankrate.com
Ultimately, no one can answer for you if you should rent or own during retirement. It’s a decision you have to make based on your individual situation, needs and lifestyle.
9
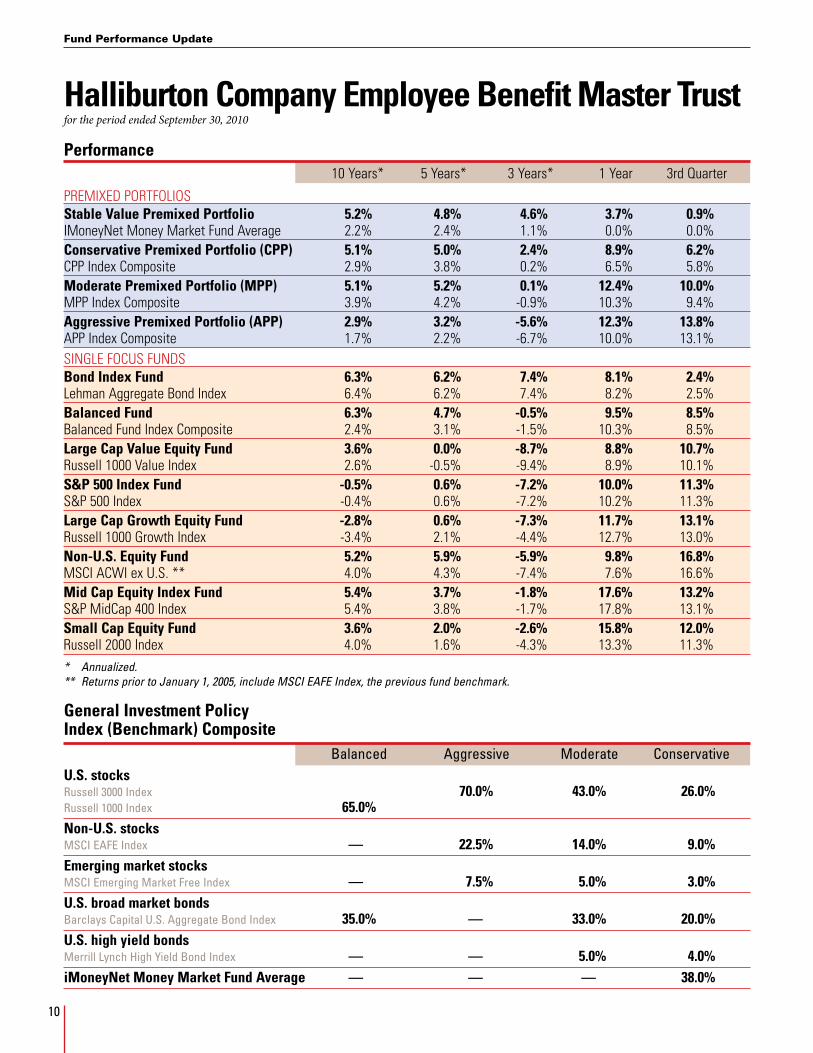
Halliburton Company Employee Benefit Master Trust for the period ended September 30, 2010
Performance 10 Years* 5 Years* 3 Years* 1 Year 3rd Quarter
PReMixed PoRTfolios Stable Value Premixed Portfolio 5.2% 4.8% 4.6% 3.7% 0.9%iMoneyNet Money Market fund Average 2.2% 2.4% 1.1% 0.0% 0.0%Conservative Premixed Portfolio (CPP) 5.1% 5.0% 2.4% 8.9% 6.2%CPP index Composite 2.9% 3.8% 0.2% 6.5% 5.8%Moderate Premixed Portfolio (MPP) 5.1% 5.2% 0.1% 12.4% 10.0%MPP index Composite 3.9% 4.2% -0.9% 10.3% 9.4%Aggressive Premixed Portfolio (APP) 2.9% 3.2% -5.6% 12.3% 13.8%APP index Composite 1.7% 2.2% -6.7% 10.0% 13.1%siNgle foCUs fUNds Bond Index Fund 6.3% 6.2% 7.4% 8.1% 2.4%lehman Aggregate Bond index 6.4% 6.2% 7.4% 8.2% 2.5%Balanced Fund 6.3% 4.7% -0.5% 9.5% 8.5%Balanced fund index Composite 2.4% 3.1% -1.5% 10.3% 8.5%Large Cap Value Equity Fund 3.6% 0.0% -8.7% 8.8% 10.7%Russell 1000 Value index 2.6% -0.5% -9.4% 8.9% 10.1%S&P 500 Index Fund -0.5% 0.6% -7.2% 10.0% 11.3%s&P 500 index -0.4% 0.6% -7.2% 10.2% 11.3%Large Cap Growth Equity Fund -2.8% 0.6% -7.3% 11.7% 13.1%Russell 1000 growth index -3.4% 2.1% -4.4% 12.7% 13.0%Non-U.S. Equity Fund 5.2% 5.9% -5.9% 9.8% 16.8%MsCi ACWi ex U.s. ** 4.0% 4.3% -7.4% 7.6% 16.6%Mid Cap Equity Index Fund 5.4% 3.7% -1.8% 17.6% 13.2%s&P MidCap 400 index 5.4% 3.8% -1.7% 17.8% 13.1%Small Cap Equity Fund 3.6% 2.0% -2.6% 15.8% 12.0%Russell 2000 index 4.0% 1.6% -4.3% 13.3% 11.3%* Annualized.** Returns prior to January 1, 2005, include MSCI EAFE Index, the previous fund benchmark.
General Investment Policy Index (Benchmark) Composite Balanced Aggressive Moderate ConservativeU.S. stocks Russell 3000 Index 70.0% 43.0% 26.0%Russell 1000 Index 65.0%
Non-U.S. stocks MSCI EAFE Index — 22.5% 14.0% 9.0%Emerging market stocks MSCI Emerging Market Free Index — 7.5% 5.0% 3.0%U.S. broad market bonds Barclays Capital U.S. Aggregate Bond Index 35.0% — 33.0% 20.0%U.S. high yield bonds Merrill Lynch High Yield Bond Index — — 5.0% 4.0%iMoneyNet Money Market Fund Average — — — 38.0%
Fund Performance Update
10

Performance NotesThe Mid Cap Equity Index Fund was not in existence until January 1, 2005. The Conservative Premixed Portfolio was introduced January 1, 2006.
In order to provide comparative historical returns, the managers’ return of their Halliburton Trust account is shown. If the Halliburton Trust had not employed a manager for the periods presented, the firm’s composite account return was added. All rates of return are net of expenses. Your rate of return may vary depending on your account activity (e.g., contributions, withdrawals, transfers, loans, etc.) and your plan’s administration expenses.
To help you better understand how your funds are performing, the funds are compared with composite returns or with appropriate indexes. The composites are created by blending together index returns in proportion to the investment policy of each fund (see chart). Because there are no indices comparable to the Stable Value Premixed Portfolio’s investments, we compare its return with money market funds tracked by iMoneyNet.
Performance data represents past performance; no assurance can be made regarding future results.
Index Definitions*
iMoneyNet Money Market Fund Average is an index of over 700 money market funds.
Barclays Capital U.S. Aggregate Bond Index is an index of U.S. bonds, including government, corporate, mortgage-backed and asset-backed securities.
Merrill Lynch High Yield Bond Index is an index of U.S. corporate bonds that are rated less than investment grade but are not in default.
MSCI (Morgan Stanley Capital International) All Country World Index (ACWI) ex. U.S. is an index of non-U.S. stock securities listed on the stock exchanges of developed and emerging markets.
MSCI EAFE Index is an index of non-U.S. equity securities listed on the stock exchanges of Europe, Australasia and the Far East.
MSCI Emerging Market Free Index is an index of non-U.S. stocks traded in emerging markets.
Russell 1000 Growth Index focuses on the 1,000 largest companies in the Russell 3000 Index that have lower dividend yields and above-average growth rates.
Russell 1000 Value Index focuses on the 1,000 largest companies in the Russell 3000 Index that have higher dividend yields and below-average growth rates.
Russell 2000 Index measures the performance of the 2,000 smallest companies in the Russell 3000 Index.
Russell 3000 Index measures the performance of the 3,000 largest U.S. companies based on total market capitalization. It is used as a general measure of U.S. stock market performance.
Standard & Poor’s 500 Index is a popular standard for measuring large-cap U.S. stock market performance. The index includes a representative sample of 500 leading companies in prominent industries.
Standard & Poor’s MidCap 400 Index is a popular standard for measuring mid-cap U.S. stock market performance. The index includes a representative sample of 400 leading companies in prominent industries with a market capitalization of approximately $1 – $4 billion.
* You cannot invest in any of these indices. Fund holdings will differ from index holdings.
For account information, go to Your Benefits Resources™ at http://resources.hewitt.com/halliburtonbenefits or call the Benefits Center automated telephone system at (800) 535-8130.
11
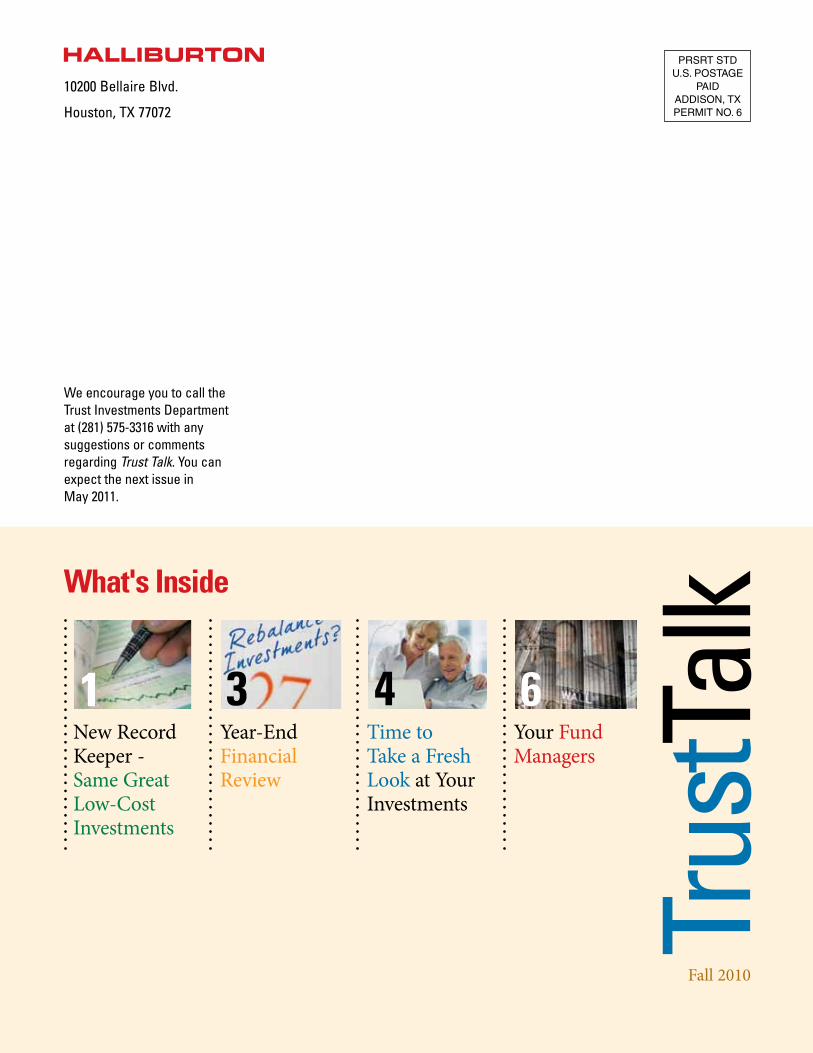
10200 Bellaire Blvd.
Houston, TX 77072
We encourage you to call the Trust Investments Department at (281) 575-3316 with any suggestions or comments regarding Trust Talk. You can expect the next issue in May 2011.
What's Inside
Trus
tTalk
Fall 2010
PRSRT STDU.S. POSTAGE
PAIDADDISON, TXPERMIT NO. 6
NON PROFITORGANIZATIONU.S. POSTAGE
PAIDADDISON, TXPERMIT NO. 6
PRESORTEDFIRST-CLASS MAIL
U.S. POSTAGE PAID
ADDISON, TXPERMIT NO. 6
New Record Keeper - Same Great Low-Cost Investments
Year-End Financial Review
Time to Take a Fresh Look at Your Investments
Your Fund Managers
1 3 4 6