new standards of weight and body composition by frame size and heigth for assessment of nutritional...
TRANSCRIPT
The American Journal of Clinical Nutrition 40: OCTOBER 1984, pp. 808-8 19. Printed in USA© 1984 American Society for Clinical Nutrition
New standards of weight and body compositionby frame size and height for assessment ofnutritional status of adults and the elderly13A Roberto Frisancho, PhD
ABSTRACT The study includes measurements of height, weight, triceps skinfold, sub-scapular skinfold, upper arm circumference, and elbow breadth of a cross-sectional multiracial
sample of 21,752 subjects aged 25 to 74 yr derived from the data sets of the first and secondNational Health and Nutrition Examination Surveys (NHANES I and NHANES II). Based on
these data, percentiles of weight, skinfolds, and bone-free upper arm muscle area by height, sex,
and frame size were established for all races combined in two groups: adults aged 25 to 54 yrand the elderly aged 55 to 74 yr. These new standards can be used to differentiate those who areat risk of being obese and undernourished. It is recommended that assessment of anthropometricnutritional status and health status of contemporary adult and elderly populations be made with
reference to the present standards in conjunction with age correction factors. Am J C/in Nuir
1984;40:808-8 19.
KEY WORDS Anthropometry, nutritionalstatus,weight, body composition, skinfold, mus-
cle, frame size, adults, elderly
Introduction
Anthropometric measurements have be-come an indispensable approach for theevaluation of nutritional status of childrenand adults. Several sets of anthropometricreference values have been published (1-3).These standards usually give the percentiledistribution of either weight or measure-ments of body composition such as skinfoldthickness and upper arm muscle area by age,sex, and height (1-3). However, since weightand body composition vary not only withage, sex, and height but are also influencedby factors such as frame size, an appropriateevaluation of individual variability in an-thropometric nutritional status should in-clude measurements of frame size. In a pre-vious publication we have shown that elbowbreadth is less affected by degree of adipositythan other anthropometric dimensions, andbecause it measures skeletal breadth, it canbe used as an indicator of frame size (4).Therefore, based on sex- and race-specificpercentiles of elbow breadth, three categoriesof frame size can be established: small, me-dium, and large. Hence, the purpose of the
present publication is to present the percen-tile distribution of weight, triceps skinfold,subscapular skinfold, and bone-free upperarm muscle area associated with each cate-gory of frame size and height for adultsranging in age from 25 to 74 yr. These valueswere developed from data collected by thefirst National Health and Nutrition Exami-nation Survey (NHANES I) of 1971 to 1974and the second National Health and Nutri-tion Examination Survey (NHANES II) of1976 to 1980.
Materials and methods
Sample
This study is based on a cross-sectional sample of21,752 subjects aged 25 to 74 yr, of whom 9,382 were
From the Center for Human Growth and Devel-opment and Department of Anthropology, Universityof Michigan, Ann Arbor, MI.
2Supported in part by grants from the WeightWatchers Foundation and from Ross Laboratories.
3Address reprint requests to: Dr A Roberto Frisan-cho, Center for Human Growth and Development, 300North Ingalls, University of Michigan, Ann Arbor, MI48109.
Received April 10, 1984.Accepted for publication May 24, 1984.
808
by guest on October 20, 2012
ajcn.nutrition.orgD
ownloaded from

BODY WEIGHT AND BODY COMPOSITION STANDARDS 809
males and 12,370 were females, derived from NHANESI and the NHANES II. NHANES I was conducted bythe National Center for Health Statistics (NCHS) ac-cording to a multistage, stratified sampling approachwhich included the selection of 28,043 persons whorepresented the 194 million noninstitutionalized civil-ians, aged 1 to 74 yr, ofthe United States. Ofthe 28,043individuals who comprised the sampling universe ofNHANES I, 20,749 (74.0%) were examined. From thissample, we selected for the present analysis a total of1 1,348 who were aged 25 to 74 yr and had completeanthropometric measurements, hereafter referred to asthe NHANES I subsample. The NHANES II was con-ducted by the NCHS following the same sampling anddata collection methods as NHANES I. The stratifiedprobability sample included the selection of 27,801persons aged 6 months to 74 yr who represented thepopulation of 196 million noninstitutionalized civiliansin the United States. Of the 27,801 individuals whocomprised the sampling universe of NHANES II,20,322 (73.1 %) were interviewed and examined. Fromthis sample, we selected for the present analysis a totalof 10,404 who were aged 25 to 74 yr and had completeanthropometric measurements, hereafter referred to asthe NHANES II subsample.
The distribution of the anthropometric measure-ments of the NHANES I subsample, when appropri-ately weighted for sampling variability, was indistin-guishable from that of the NHANES II subsample.Similar results were found by Abraham (personal com-munication) of the NCHS. For this reason and in viewof the critical need for a large sample size, we decidedto merge the data of NHANES I with NHANES II,treating the result as one sample. To merge these twodata sets into one, we calculated a new sampling weightby dividing each subject’s sampling weight by two, aswas recommended by the NCHS (Abrahams, personalcommunication). (The mathematical derivation for thisapproach is given in the Appendix.) This new samplingweight was used in constructing the percentile distri-bution of all anthropometric variables used herein.
Measurements
Height. Height was measured with the examineewearing disposable foam rubber slippers, feet together,back and heels against the upright bar of the heightscale, head approximately in the Frankfort horizontalplane (“look straight ahead”), and standing erect (“standup tall” or “stand up real straight”) with some assistanceand demonstration when necessary. The height-meas-uring equipment consisted of a vertical bar with a steeltape attached to a level platform. Attached perpendic-ularly to the vertical bar was a horizontal bar which wasbrought down snugly on the examinee’s head (2).
Weight. A Toledo self-balancing scale that mechan-ically prints the weight to #{188}lb directly onto the per-manent record was used. The scale was calibrated witha set of known weights; any necessary fine adjustmentswere made at the beginning of each new trailer location,ie, approximately every month. The total weights of allclothing worn ranged from 0.20 to 0.62 Ib; this was notdeducted from weights presented herein. The exami-nation clothing used was the same throughout the year
so there is no seasonal variation in the weight of theclothing (2).
Elbow breadth. The examinee stood with feet to-gether in the standard erect position, and the right armwas extended forward perpendicular to the body. Withthe arm bent so the angle at the elbow forms 90#{176}withthe fingers pointing up and the dorsal part of the wristtoward the examiner, the greatest breadth across theelbow joint was measured with a sliding caliper alongthe axis ofthe upper arm (2).
Skinfolds. Triceps and subscapular skinfolds weremeasured to the nearest mm with a Lange skinfoldcaliper having a pressure of 10 g/mm2 ofcontact surfacearea. The measurement was taken over the tricepsmuscle halfway between the elbow and the acromialprocess of the scapula, with the skinfold parallel to thelongitudinal axis ofthe upperarm. Subscapularskinfold(mm) was measured 1 cm below the inferior angle ofthe scapula in line with the natural cleavage ofthe skin(2).
Upper arm circumfrrence. Upper arm circumferencewas measured to the nearest cm with a steel tape withthe right arm hanging relaxed. The measurement wastaken midway between the tip ofthe acromion and theolecranon process.
Bone-free upper arm musde area (AMA). Using theupperarm circumference and triceps skinfold, followingthe approach used by Frisancho (3) and Heymsfleld etal (5), bone-free upper arm muscle area was obtainedusing the following formulae:
males, bone-free AMA (cm2)= [(arm circumference (cm) -
x triceps (cm)J2/4T) - 10
females, bone-free AMA (cm2)= [(arm circumference (cm) -
x triceps (cm)J2/4T) - 6.5
The use of these formulae to calculate bone-freeupper AMA can be illustrated by an example. Tocalculate the bone-free upper AMA of a male with anupper arm circumference of 3 1 .9 cm and triceps skin-fold of 12 mm, the skinfold is converted from mm tocm by dividing by 10 and the following calculation ismade: ((31.9 cm - 3.1416 x 1.2 cm)�/(4 x 3.1416)) -
10 = 62.9696 - 10 = 53.0 cm2.Frame size. Three categories of frame size were
established, “small,” “medium,” and “large,” corre-sponding respectively to below the 15th, between the15th and 85th, and above the 85th sex- and age-specificpercentile of elbow breadth (4) (Table 1).
Percentiles. The 5th, 10th, 15th, 50th, 85th, 90th,and 95th percentiles were selected for inclusion herein.Where the number of examinees of a given height, age,sex, and frame size was too small to provide reliablepercentiles (less than 10 for the 50th percentile, lessthan 35 for the 15th and 85th percentiles, less than 50for the 10th and 90th percentiles, and less than 100 forthe 5th and 95th percentiles), weight standards werederived from frame- and sex-specific linear regressionequations of weight on height. A normal distributionwas assumed, and then the 5th, 10th, 15th, 85th, 90th,and 95th percentiles were obtained using the SE of theregression equations. The 5th and 95th percentiles equalthe predicted mean, respectively, ±1.645 times the SE.
by guest on October 20, 2012
ajcn.nutrition.orgD
ownloaded from

810 FRISANCHO
TABLE IFrame size by elbow breadth (cm) of US male andfemale adults derived from the combined NHANES Iand II data sets
AgeFrame Size
Small Medium Large
yr
Males18-24 �6.6 >6.6 and <7.7 �7.725-34 �6.7 >6.7 and <7.9 �7.935-44 �6.7 >6.7 and <8.0 �8.045-54 �6.7 >6.7 and <8.1 �8. I55-64 �6.7 >6.7 and <8.1 �8. 165-74 �6.7 >6.7 and <8.1 �8. I
Females18-24 �5.6 >5.6 and <6.5 �6.525-34 �5.7 >5.7 and <6.8 �6.835-44 �5.7 >5.7 and <7.1 �7.145-54 �5.7 >5.7 and <7.2 �7.255-64 �5.8 >5.8 and <7.2 �7.265-74 �5.8 >5.8 and <7.2 �7.2
The 10th and 90th percentiles, respectively, representthe predicted mean ±1.282 times the SE. Similarly, the15th and 85th percentiles are the predicted mean minusand plus, respectively, 1.036 times the SE ofthe regres-sion equation. There were significant Black-whitepopulation differences in weight and body compositionwhen age and height were considered. However, whenthe comparisons were made with reference to age,height, and frame size, there were only minor inter-population differences. For this reason, all races (white,Black, and other) included in the NHANES I and IIsurveys were merged together for the purpose of calcu-lating percentiles of anthropometric measurements.
Results and discussion
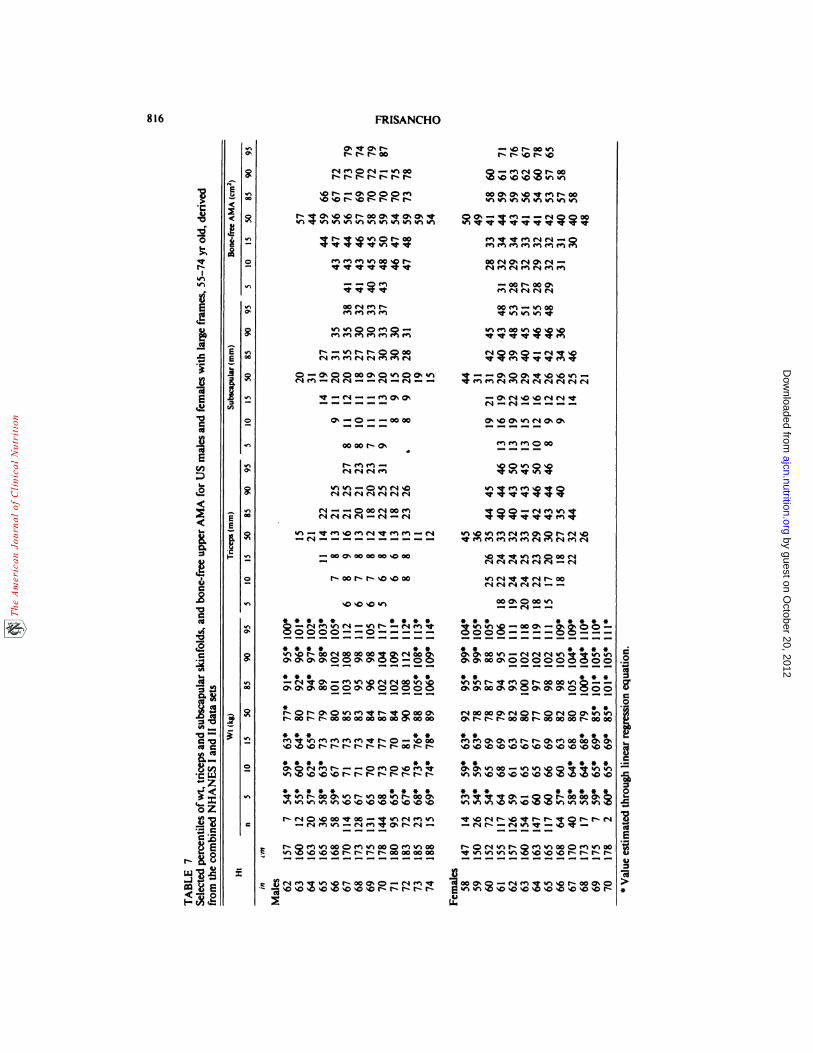
Tables 2 to 4 give the percentiles of weight,triceps skinfold, subscapular skinfold, andbone-free upper AMA for all races combinedfor adults ranging in age from 25 to 54 yr.The corresponding data for older adults(aged 55 to 74 yr) are given in Tables 5 to7. The use of the present new standards liesin the fact that along with weight, they in-corporate indicators of body fat tissue (skin-fold thickness) and lean body tissue (bone-free upper AMA) specific for each sex,height, and frame size category. Hence, theinvestigator or clinician can assess whethera person is actually obese (indicated by anexcessive body weight and excessive fat tis-sue) or simply heavy (if the excess bodyweight is not associated with excessive fattissue). Conversely, one can assess whethera person is at risk of undernutrition (mdi-
cated by a low weight and severely low fatand lean tissue). Now that skinfold thick-nesses, upper arm circumference, and elbowbreadth can be measured with inexpensivecalipers, evaluating obesity and undernutri-tion can be based on direct measurementsof body composition.
It must be emphasized that any definitionof either obesity or undernutrition shouldtake into account at least two variables andthat such a definition should be made withreference to actual percentiles. Uniform ap-plication of this rule minimizes the chanceof individual misclassification that occurswhen one either uses only one variable (eg,weight) or some percentage above or belowthe norm. Thus, classifying individuals whoare above either the 85th or 95th percentilein both weight and skinfold thickness asobese (6-8) is more accurate than classifyingthem simply on the basis of weight or anybody mass index. Conversely, measure-ments of weight, skinfolds, and bone-freeupper AMA between the 5th and 15th per-centile could be considered evidence of mar-ginal depletion (5, 7, 9- 10). Therefore, thepresent standards that incorporate measure-ments of height, frame size, weight, andbody composition provide a valuable refer-ence of use to all concerned with the evalu-ation ofhealth and nutritional status of con-temporary adult populations.
The percentiles for weight of the presentstudy are significantly greater than thosegiven in the 1983 Metropolitan Height andWeight Tables by Frame Size (1 1). The causeof these differences can be attributed to sev-eral major factors. First, the MetropolitanTables are based on data derived from in-surance policies issued between 1950 and1977. This population, since it includes onlypeople who can afford life insurance, repre-sents a selected group in comparison to theUnited States population overall (7). See-ond, the frame size categories given in theMetropolitan Tables of 1959 were not basedon any anthropometric measurements of thepolicy holders but rather represent an arbi-trary division of the population into thelowest (small frame), middle two (mediumframe), and highest (large frame) quartiles(12). It was found that the area bounded bythe lower and upper limits in the Metropol-
by guest on October 20, 2012
ajcn.nutrition.orgD
ownloaded from

en � (�4 N 00 (�4 N� en en
0’. 00’. ‘(� ‘1� 000’.
� en en en en en en
‘.0 00 ‘.0 00 en en � N ‘1��en en en en en en en en en
0’. 000000 N N 0000 N ‘.0 ‘(‘ie�i r�i r’i r�i r�i r�i r’.i
� r’� r�i en - r�i en en ene� e�i
r�io----enr’.ir’.i r’.i r’i e’4 r� r�i r�i
NO’. 000 r’.i -
a’. ‘.0 e� - � enen en en en en en en
00 (N (N NO’. N 0en en en en r� r’.a � en
0’. N 00 (N N � ‘.0 ‘(�en r�i r�i r�i r�i r�i r�i r�i
en N 00 ‘.0 � �‘en ‘� r’.i en ii�(N
r’.i 0000’. 00 N 00000’.
00’. N 00 N N N 00
‘.0 ‘.0 N ‘.0 ‘.0 ‘.0 N
N en � � ‘.0 �en en en en en en en
en’oo’.--oo-en en e’.i en en en en en
00’. 000000 N 000’. 0en r’.� ri r� (N en
000 (N 0’. 00 0(N�1(Nr4--(N
en � ri � en en � ri
ri--r’.ir.i-enen
0000-�000 (N
--rio’.N N ‘.0 ‘.0
en en ri 0 ri en‘.0 ‘.0 ‘.0 ‘.0 ‘.0 ‘.0
� 0000000’. - N (NI(� I1’I ‘.0 ‘.0 ‘r f’� ‘.0 ‘F�
(N 000’. NO’. 0’. 0’. 0000 N l1��%1�� � � � � � � � �. �.
(N 00 N 00-00 � 0’.en en en en � � en en
N � ‘.00’. N ‘.0en en en en en en
en en en en
� (N 0en en en
0’. 00 ‘.0 t(� 0 ‘.0(N (N (N (N en (N
0 � .e ‘.0 en � � en (N(N (N (N (N (N (N (N (N (N
‘.0 (N “� � � en en � en �
00 NO’. 000’. 0’. NO’. 00
N 0000 N 00 N
N N ‘.0 N
-0 (N 0(N (N (N (N
000’. 000 ‘.0 0
N ‘.0 N 0000 � N N ‘.0
-00---0-000
‘.0 � ‘.0 ‘.0 ‘.0 ‘.0 ‘.0 N N
NO’. 0 � � 00 � 000- en � ‘.0N N 0000000000000’. 0’. 0’. 0’. 0’.
**� i1� ‘.0 - en en (N N ‘.0000’.- (NN N N 00000000000000000’. 0’.
*-0 ‘.0 N 00 (NO’. � NO’. NO’. 0N N N N N 00 N 0000 N 00000’.
E
C
EE
C,
I
EE
.�
a’
0
0
0’
0
0
0’
0
0
0’
4?
0
(N
E
E
I
E
I-
.<
II0
(N
<�0
0
I**
(N en en � ‘#{128}�N 0000’. (N en‘/� 1�’C I(� C(� C1� ‘1’� ‘.0 ‘1� $F� “0 ‘.0
en � *(� N 000’.-. en � (N en �� �. �. �. �. *,� ,r�
en en � ‘.0 N 000 (NO’. 0- (N en�. �. �. � �. �. � v� .r� ‘e�
*N (N (N � � ‘.00’. 0 ‘.0 N 000’. 0en � �
en 00 (N 00 ‘F� 0’. ‘.0 en N 0000 sF� -� 0 - en - - -
--(N(N(N--
N 0 (N � N 0 en ,� 000 en ‘#{128}�00� I1� (� ‘.0 ‘.0 ‘.0 ‘.0 N N N N
C,,
4?
000’. 0 (N en � ‘r� ‘.0 N 000’. 0‘.0 ‘.0 ‘O’0 ‘.0 ‘.0 ‘.0 ‘.0 ‘.0 ‘ON
(N en � ‘.0 N 000’. 0 - (N en �.� ‘.0 ‘0 ‘.0 ‘.0 ‘.0 ‘0 ‘0 ‘.0 N N N N N
BODY WEIGHT AND BODY COMPOSITION STANDARDS 811
**- � �o r-� - - ‘,� � � o� o�o ‘.o ‘.o �o �or- r- r� r� r� � r-� 00
*� en (� 00 O� r�i r.i i,� N 0‘r “� “� ‘i� ‘i� �o �o �O N �O �O N
** *****- en en N 0 0. r�i r�4 � ‘F� N 00%1�� I#{128}�� � � sr� � �o �o �o �o �o
******�O 00 O� r�i �O ‘.0 ‘.0 N 0� 0 r�i en ��. �. �. ‘,� ,,� ‘r’ � � ‘.0 ‘.0 ‘.0 ‘.0
en en en r�i 0’. r�i N N ‘.00’. -0’. ‘.0r’1�N -oo’.��r�i
N 0 en � 000 en sr� 000 en ‘(� 000 ‘.0 ‘.0 ‘.0 N N NN 00 0000 00
*‘.0 �‘1 0 r’4 00’. � 0 � ‘.0 N 000’.‘.0 N N N t� N N 00 N N N N N
r� a’. � ‘.0 0000 r’.i - r�i en �‘.0 ‘.0 ‘.0 ‘0 ‘.0 ‘.0 ‘.0 N N N N N N
00 en en � en ‘� N 0 r� 0- r�i en‘.0 ‘.0 ‘.0 ‘.0 ‘.0 ‘.0 N ‘.0 N N N N
by guest on October 20, 2012
ajcn.nutrition.orgD
ownloaded from

E
C
EE
I
EE
0’
0
0
0’
00
0
0
0’
0
0’
0
0
0 00 en ‘.0 en (N en � enN N N N N N N N N
a’. �‘. - 00 o 00 a’. � oo a’.� � CrC � CrC � � � � en
- 0’. (N 0’. - 0’. 00 00 N 0’. enN ‘.0 N ‘.0 N ‘.0 ‘.0 ‘.0 ‘.0 ‘.0 ‘0
‘rC CrC *rC en en en en - en oc 0’.‘�J� ‘�‘ ‘� ‘�‘ ‘�‘ ‘I. � “1� � en en
N N 0’. ‘.0 N ‘.0 CrC N ir, N (N‘.0 ‘.0 ‘.0 ‘.0 ‘0 ‘0 ‘.0 ‘0 ‘.0 ‘.0 ‘.0
(N en (N (N 0 - 0 0 0’. 0 N’0� � � � ‘� � “4. ,�. en � en en
00 ‘rC ‘.0 ‘.0 CrC en CrC ‘�‘‘r, � ‘.0 CrC CrCCrC CrC CrC CrC CrC CrC ‘rC CrC CrC ‘rC ‘rC CrC CrC
CrC en (N - - (N - - 0 0 0 0 (Nen en en en en en en en � en en en en
(N(N(N(N(N(N(N(N(N(N(N(N
en en (N (N ‘�i� - (N - (N (N en� CrC � en en en en en � � en(N(N(N(N(N(N(N(N(N(N(N
0 00 0’. 00 0’. N 0 0’.‘�. en en � en en en ‘�t en
en (N - - (N - - - (N (N(N (N (N (N (N (N (N (N (N (N
(N en en - - 0 0 (N (Nen en en en en en en en en
en - (N 0 00 00 00 CrC N CrC
� � � � en en en en en en
(N 0’. N 0 00 N N N 0 0’. 0en (N (N en (N (N (N (N en (N en
0’. N ‘.0 N � CrC en 0 (N en 0’.en en en en en en en en en en (N
0 ‘.0 CrC ‘.0 CrC � � � ‘.0 CrC CrCen (N (N (N (N (N (N ri (N (N (N
00 00 CrC (N en 0’. 00 00 0’. �en en en en en en en (N (N (N (N (N
en 00 N ‘.0 ‘.0 00 ‘.0 ‘.0 ‘r. � CrC CrC ‘�. en 0’. (N 0’. 00 00 ‘.0 CrC ‘�‘ ‘rC ‘rC (N 0(N(N(N (N
0’. � 0’. � 0’. 0’. 0’. 0’. 0’. 0’. 0’. 00 00 0’. 00 0’. 00
N 0’. N 0’. 00 00 00 00 00 0’. N (N 0 0’. 0’. 00 N 0000000000
00 N 00 N N N N N 0000 N N N N N N N 00
(N 00 � ‘�I� en ‘rC ‘.0 N(N (N (N (N (N (N (N (N (N
0 (N 0 00 0 00 N CrC’O,* ‘�. “1W 1. en � en en en en
0 (N 00 en 0 0 0 - (N � en(N (N - (N (N (N (N (N (N (N (N
0 N ‘.0 ‘.0 CrC ‘.0 � en 0 (N -,�. en en en en en en en en en en
000’.0-�0000000’.00- (N - (N - - - - (N (N (N
0N��enen--0’.-0’.,�. en en en en en en en en (N en (N
CrC (N (N - en - (N (N (N (N (N en CrC 0 ‘.0 ‘rC � ‘�‘ en (N (N (N 0’. 0’.(Nen(N(N(N(N(N(N(N(N(N--
‘.0 00 N N N N N N N 00 0’. 0 N � ‘.0 � CrC CrC � CrC CrC (N(N(N
�en�enen�-
CrC � (N (N - (N - (N 0
* **0’. CrC CrC ‘.0 en 00 N 0’. en 00 N N NN 000000000000000000000000
* *CrC 0’. 0’. 00 N 0 (N 0 00 (N CrC (N enN N N N N 00 00 00 N 00000000
*!N ‘.0 N en en N ‘.0 CrC CrC 0’. N 0’. 0N N N N N N N N N N N N 00
00 ‘�I� CrC N 00 00 - - ‘!i� CrC 00‘.0 N N N N N N N 00 00 00 00 00
en ‘.0 0 (N (N en en .i� N 000‘.0 ‘.0 ‘.0 ‘.0 ‘.0 ‘.0 ‘.0 ‘.0 ‘.0 ‘.0 ‘.0 ‘.0 N
**00 0’. CrC � 00 ‘.0 00 0 0 � CrC N�rC CrC ‘.0 ‘.0 ‘.0 ‘.0 ‘0 ‘.0 N N N N N
*0 (N (N - (N en � ‘,� ‘rC N 0 0 N.r. .i� .r. CrC CrC CrC v� CrC CrC CrC ‘.0 ‘.0 ‘r�
**Cr. ‘.0 0 (N - ‘.0 � ‘.0 ‘.0 00 - (N ‘.0� CrC ‘.0 ‘.0 ‘.0 ‘.0 ‘.0 ‘.0 ‘.0 ‘.0 N N N
* *‘.0 0 0 0’. 0 - (N ‘�‘ � ‘.0 0’. 00‘� CrC CrC ‘�1� � ‘rC CrC *rC CrC CrC CrC CrC CrC
*** *- (N “1W Q’. 00 (N 0 en � (N 00 0 00CrC � CrC CrC CrC ‘.0 ‘.0 ‘0 ‘.0 ‘.0 ‘.0 N ‘.0
* **- N N N 0’. 0’. 0 (N (N ‘� 00 0’. 0� ‘� � � ‘�‘ � ,� ‘,� ‘,� ,,� � �
0 0 - “iV (N 0’. 00 � 0’. (N - ‘.0 0- en N CrC - 0 N ‘0 - 00 en C ‘f�-(N��(N(N_
0 � 00 CrC �‘ CrC (N 00 00 N 0’. 0’. rC� 0 0 ‘.0 “1W 00 (N (N (N CrC - � -
-.(N�’0’.0N’.0�(N’
N 0 en irC 000 en CrC 000 en rC 00��‘-N0000�00
�‘�(N en � CfO’O N 000’. 0- (N en �‘0 ‘.0’.0 ‘.0’.0 N N N N N
N 0 (N CrC N 0 en CrC 000 en CrC 00t�NN
.�E 000’. 0’-. (N en � CrC’O N 000’. 0V� �‘0 ‘.0’0 ‘.0 ‘.0’0 ‘.0’.0 ‘0 ‘0 N
0
8’
IC
812 FRISANCHO
‘8
4?
‘0
0
“1W.rC
(N
E
E
‘8E
.0I
E
‘0
E00
I-
0.
0
en
�<�0
‘.0 N ‘.0 N CrC ‘0 ‘0 CrC N N’O
CrC CrC CrC “1. CrC CrC ‘!1� CrC’O
*** *N 0’. 0 “2� en � N N N 8 � �00 00 0’. 0’. 0’. �‘. 0’. 0’. _ _ _
**en .‘� � 0 N en (N en en ‘.0 000 00 00 0’. 00 0’. 0’. 0’. 0’. 0’. � �
**- (N en N .r� 0’. 0’. 0 0 (N N00 00 00 00 00 00 00 0’. 0’. 0’. 0’.
by guest on October 20, 2012
ajcn.nutrition.orgD
ownloaded from

en ‘.oen ‘.0’.00000000000
00 ‘.000 N -0 enN 00 N N 000000
‘.oen 00 en CrC CrC NO’ 00N N N N N N N N N
(N00-�--(N-’.0’O‘.0 CrC ‘0 ‘.0 ‘.0 ‘0 ‘0 ‘.0 ‘.0’0
00 (N en 0’. 000- en�. CrC CrC ‘�‘ CrC CrC CrC CrC CrC
0-00 N 00000’.CrC CrC �‘ ‘�‘ �‘
‘.oen N CrC N
0000 ‘.0 ‘.00en en � en en
0 CrC (N CrC 0000�‘ en en en �‘ en (N
‘.0’.0�-CrC00N(Nen en en en en en (N (N en
- (N 0000 N 00’. 0000(N(N(N(N--(N---
en-�---o’.o’.o’.
00 (N 00-0’ 0’.
0’. NO’. 00 N
0CrC�en en en � en
N en 0’. CrC N ri (N(N (N (N (N (N (N (N
0 en (N CrC en CrC 00’. 0’.en (N (N � (N (N (N - -
- � C� ‘�‘ CrC (N en (N
0’. N 000 N 0 N N 00
NO’. N N 00 ‘0’.0
‘.0N ‘.OCrC CrC
EE
.�0
I
EE
0’
00
0
0’
00
0
0’
00
0
0’
00
0
(N N en NO’. CrCN N ‘.0’.0 ‘.0 CrC
� en CrC CrC 0’. en en �N ‘.0’.0 CrC CrC CrC CrC CrC
(N ‘.000 ‘00’. 0-0’%OCrC’.0 CrC CrC � CrC CrC �
CrC � - � en 0’. 0’ CrC N 00 CrC N� ‘� � � � en en en en en en en
en - (NO’. 0’. N 00 Nen en en (N (N (N en en (N
0’. 0000000 � 0000(N (N en (N (N (N (N (N
‘.ON ‘.ON en CrC(N (N (N (N (N (N
CrC 00 (N CrC CrCCrC CrC C1� CrC �‘ CrC
en -00 ‘.0000’0 00CrC CrC � � � � �
0000 � (N (N’.0-� Cr. en
CrC (N CrC (N (N 000’. CrC CrC -0’.0en � en en en (N (N (N (N (N (N -
N00’.0Cri�’-.-�(N-
N ‘.0’�’ (N (NO’. 00
en -0000 N
0-0’ 00 CrC 0’.CrC CrC � ‘�‘ �
00000 �‘.o en en
CrC � ‘�‘ � ‘� �
0000 ‘.�en en 0’-� N (N
‘.000’0 � � (N - N 00’. 00en en en en en en en � en (N en ri
‘0(N(N-.-00N0-rl(N(N(N(N--e.iri
CrC 0’. 000 N’0’0(N - (N ri (N - -
‘.000’0 N en en
N ‘0’.0 CrC en 0’ (N �‘ �‘
**
*CrC CrC �‘ CrC en CrC (N en CrC 0 � CrC 0’.
000000000’ 0000’
*‘.000 N - - en 0’.- CrC 0 ‘.0O’.’000 N 00000000 N 00 N 00 N N N
.c4?
‘0‘00
CrC
CrC
(N
E
�<�0
C
x
0.�
8’0
C �(Nen�t’CrC’.oNooo’.0-(Nen’�1’‘0’0 ‘.0’0 ‘O’0 ‘0 N N N N N
000’. 0 (N en � �‘.0 N 000’. 0CrC �rC’0 ‘.0’0 ‘0’.0’0 ‘.0’0 ‘.0’.0 N
BODY WEIGHT AND BODY COMPOSITION STANDARDS 813
*000’. 0 (N en � �. en -‘0000 (N(N’-.(N
*en �‘ �rC ‘O’.0’-’ �‘ CrC (N ‘.0(N N CrC
00000-00---.0-
a’.0-rlenri-en’0en0’.’.0.r.0’. 0 0000000-000
(N en ‘�‘ 0’. ‘�‘ ‘� ‘00’. N - - en (N000000 N 00000000000’. 0’. 0’. 0’.
‘.ON 000’. CrC -.‘.0 �‘ �‘ (N 000’. (N‘0’Q ‘0 “0 N N N N N 00 N N 00
*(N en ‘�‘ CrC Cf� 0 ‘�‘ - (N 00 “0 N ‘�‘‘0’.0 ‘0 ‘0 ‘.0 N N N N N N N N
*N 000’ 00 ri en 0000 en en (NO’.CrC CrC CrC ‘.0 ‘.0 ‘.0 ‘0 ‘.0 ‘.0 N N N’.0
--�CrCN�’.o0en�o’.N- en CrC 00 (N CrC (N -0 en
N 0 en CrC 000 en CrC 000 en CrC 00CrC’.’0’.’0�,0�.0NNNN00000000
*N N ‘0.0 CrC N en en (N CrC ‘.0 00 -‘0’0 ‘.0 ‘.0’.0 ‘0’.0 ‘.0’.0 ‘.0 ‘.0 ‘0’.0
**en (N (N � - en (N -000 ‘.0 N’0‘.0’.0 ‘0 ‘.0 ‘.0’.0 ‘.0 ‘.0 CrC’0 ‘.0 �rC CrC
‘.0’.0 CrC � 0’. 000’. 0’. CrC 00-00CrC CrC CrC CrC CrC CrC CrC CrC CrC CrC CrC CrC CrC
‘.00’. (N (N CrC (N ‘.0(N ‘.0 � -0’. N- en 0’. en ‘.00’. � ‘.0 � 00 en -
---(N--
N 0 (N CrC N 0 en C� 000 en CrC 00‘�t CrC CrC CrC CrC ‘.0’.0 ‘.0’.0 N N N N
by guest on October 20, 2012
ajcn.nutrition.orgD
ownloaded from

‘on ‘Ct 0’.C�’0’0 �
‘Ct (N en‘Ct �‘ ‘Ct �
Cr.�000CrCQCrC.r.’.0CrCCrC’0
(N0-00’O(N��en’Ct
(N ‘Ct en N ‘Ct en Cr. (NCr. Cr. Cr. Cr. Cr. Cr. Cr.’0
00’. N ‘.ON CrC N� en en en en en en
‘.oen � 00Cr. Cr. en N 00 en�
0’ 00000 N 0000 en(Nene�.rienr4rl(Nen
00 CrC - �‘ Cr. N � 00en en en en en en en enen � en en �‘(N (N (N (N (N (N (N
�‘ 00- ‘.0 Cr.en en en en en en
ri en (N - en 0’. -(N (N (N (N (N - (N
‘.O�OCr.0(N(N(N�
(N0000(N(N-(N
O’.O’.0-�rienen
en’.O�enenenen
(N Cr. 00’.0 � (N(N(N(N(N(N(N
en 0 (N -“0 N Cr.enenenenr’.lrl(N
en - 00 � (N - N(N (N (N (N (N (N (N (N
(NO’. NO’. Cr. Cr. �en (N (N (N (N (N (N
‘.0(N � ‘.0 CF-Cen en ‘.oen 0 000’. Cr. N N � oo en en
‘0 N 00000’. N 0 0’. 0’. 00000’. N N
‘.ON 00 N 00 N 00 N N N 00 ‘0’.O
‘O’.O N N ‘.OCr.’.O N
(N�0Cr.(N(N(N(N
�Cr.(N(Nenenenen
N -0’. 0 N N- (N - (N - -
0’. 000’.en en en (N en en (N
(N’.0000’.0CrCCr�rC- - (N
‘-.OO’.O’.O’.O’.Nen en (N (N (N (N (N
O’0O’.’-�-000-.O’ --0(N-0-ooen(N(N(N(N(N(N(N-(N
‘.O.r�NN’.0CrC00 �nienen
CF�’.O’.0’.OCr. �en-ni-r’.ini
�.rCCr.CrC 00
E
(C
C
EE
C,0
I
EE
a
00
0’
00
0
0
0’
0
0’
0
0’
0
‘8>
4?
‘0
‘0
0
r
E
EC,,.0
E(2‘00
E00
I..
CF
�EE<�01-c�
00
8’0
xC �(Nen’C1’CrC’.ON00O’0-(Nen’Ct
‘0 ‘0.0 ‘O’0 ‘0 ‘0 ‘0 N N N N N000’. 0- (N en � CrC ‘.0 N 000’. 0
E CrC CrC ‘.0 ‘0 ‘.0 ‘0 ‘0 ‘0 ‘.0 ‘.O’0 ‘0 N
814 FRISANCHO
**NO’. 00 � 00 ‘0000’.-. (N � CrCN N 000’. 00000000000’. 0’. 0’. 0’.
*en - � 00-’ � ‘.0N 0’. 0 (NN N NO’. 000000000000000’. 0’.
00-j (N 0 NO’. 0’. - en CrC ‘0000’.‘ON N 00 N N N 000000000000
- (N en 0000’. 0 �‘.0 0’. ‘.000 N‘0’0 ‘.0 N ‘.0’0 N N N ‘.0N N N
‘0- � 0’. 0’. -00 en en C� ‘.Q�Q�’.CrC CrC � CrC �‘.0 �‘0 ‘.0 ‘0 ‘.0 ‘.0 ‘0
*0’. 0’. 0 �‘ C� 0 � 0’.- (N ‘�‘ CrC N
� Cr. CrC ‘.0 CrC CrC’.0 ‘.0
**Cr. N N 00 �‘ ‘.0N 0’. 0 (N en
‘�‘ CrC � � Cr. C� �‘0
N 00 N (N (N 00 CrC NO’. � ‘0- -‘�t N 0 en - (NO’. �‘ (N -
N 0 en � 000 en CrC 000 en V� 00CrC’0’.’0’.’0’.ONNNN00000000
*- ‘�‘ en - en ‘CJ’Cr. CrC ‘.0 N N 000’.N N N N N N N N N N N N N
� 00000’. 000 (N (N en � ‘Ct CrC‘.0’.O N N ‘.0’0 N N N N N N N
en’.o N Cr. N N 000’. 0-- (N en‘0’.0 ‘0’0 ‘0’0’0 ‘ON N N N N
‘Ct � � ‘.000000000-- (N enCrC CrC Cr. CrC Cr. �‘0 ‘.0 ‘0’.O ‘O’.0’O
0000 N CrC (NO’. 0’. 0’. 0-- (N (N�‘ � � CrC � � � CrC C� � C1� Cf�
‘.0CrC Cr. en 0’. CrC N N 00000’. 0’. 0�. �. ,� �. � �. �. �. � �. � � C�
*0’.’-’ en en N (N en en ‘Ct Cr. CrC ‘.0 Nen � Ct � Ct Ct � ‘Ct � � ‘Ct
CrC (N N CrC 000’. 0 ‘0(N --0000 (N Cr. � Cr. 00Cr. (N -
N 0 (N Cr. N 0 en r. 000 en Cr. 00� CrC Cr. ‘.0 ‘O’0 ‘ON N N N
by guest on October 20, 2012
ajcn.nutrition.orgD
ownloaded from

E
‘4
C
EE
I
E
a
00.�
0’
00
0
a’
0
a’
0
0’
0
0
- (N N 0 0 (N 00N N ‘.0 N N N ‘.0 N
- 00 N (N ‘Ct 0’. 00’.Cr. � Cr. CF� CF� Cr. � CF �
en ‘0 Cr. (N N N CrC Cr. N 0’.‘o’0’0’O’O’0’O’O’.OCr.
N 00 0’. 0’. N CrC ‘.0 CrC en en�
- 0 ‘Ct en 0 Cr. CF (N en Cr. 00 N‘o’0’0’O’.0’O’.O’O’.O’.O’r.’O
‘0 ‘Ct Cr. ‘Ct Cr. � � ‘Ct - -�
00 0 (N - (N (N - en ‘.0 0 ‘.0 ‘.0‘Ct Cr. Cr. Cr. Cr. Cr. Cr. Cr. Cr. CF-CCr. Cr. Cr.
(N Cr. Cr. ‘Ct Cr. Cr. en � en (N’oen en en en en en en en en en en
0’. 00 0 - (N (N (N 0 ‘Ct � 0’. enen en � ‘Ct � � ‘Ct ‘Ct ‘Ct � en �
Cr. N ‘0 ‘0 ‘0 N ‘o N N 00(N (N (N ri (N (N (N (N (N (N
‘0 0’. 00 0’. 0’. 0 ‘0 - (N Nen en en en en ‘Ct en �‘ ‘Ct (N
en ‘o ‘Ct ‘Ct Cr. ‘0 � Cr. ‘0 N(N (N (N (N (N (N (N (N (N (N
�CF�CFN-.’.O’oen en en en en en en en (N (N (N (N (N (N (N (N (N
Cr. ‘Ct (N 0 0 -en en en en en en en en
00 en o (N 00 - 00 N ‘Ct‘�- ‘� Ct ‘i en � en en en
00 N 0’. 00 0’. 0’. 00 N ‘0 0(N (N (N (N (N (N (N (N (N en
en ‘.0 ‘.0 ‘0 ‘0 N en Cr. Cr.‘Ct en en en en en en en en en
N ‘.0 CrC Cr. CrC ‘.0 ‘0 Cr. Cr. Cr. 00 ‘0(N (N (N (N (N (N (N (N (N (N (N (N
N (N ‘Ct en en ri 0 0 0 CrCen en en en en en en r’ en en
0’. CrC Cr. N ‘0 N N ‘.0 ‘0 Cr. ‘0 Cr. 00 CrC en (N 0 0 00 N N ‘0 0’.’O
(N(N(N(N(N
-00’.0’.0000’.0000 0-(N00000’.000
00 N 00 0’. 0’. 0’. 00 0’. 0’. 00 N 0’. 0 0 00 00 0’. 00 NO’.
‘0 N N N N ‘0 N N en 00 00 00 N 00 N N’0
‘0 � (N en en Cr. 0(N (N (N (N (N (N (N (N
- - 00 (N 0’. 00 N 0’.’o‘Ct ‘Ct en � en en en en en
en 0 0’. 0’. 0 - (N 0’. N 0(N (N - - (N (N (N - - (N
0 00 � N ‘.0 Cr. ‘Ct Cr. en CrC‘Ct en en en en en en en en en
Cr. 0 N N 00 00 00 0’. 00 ‘.0 0’. ‘0
(N (N0 � en Cr. en (N en en en Cr.‘Ct en en en en en en en en en
(N - 0 - (N (N (N (N - - - en - 00 ‘.0 CrC CrC � � Cr. � ‘Ct N Cr.(N(N(N(N(N(N(N(N(N(N(N
Cr. N ‘0 N N N 00 N N ‘.0 00 00 N 00 00 00 N ‘.0 ‘.0 N ‘C N
N ‘.0 ‘.0 ‘0 ‘.0 N ‘0 N ‘0 ‘0 en Cr. N ‘0 Cr. � � ‘0 en N
‘0CF’O.rC’OCFC
**�N-O’O’�-O’---en�00000’.00000’.0O’.00000
00 � �
0000000000�O’.O’.
* **- (N en ‘0 � 0’. Cr. en CF N N 0’. -00 00 00 00 00 00 0’. 0’. 0’. 0’. 0’. 0’. 0
00 0’. (N en Cr. Cr. ‘.0 �
00 N N 00000000000000000000
*N 0 (N en en N 0’. 0 0 ‘Ct ‘0 en 00N 00 00 00 00 00 00 0’. 0’. 0’. 0’. 0’. 0’.
***(N ‘Ct ‘0 00 00 0’. 00 00 0’. (N en ‘� Cr.N N N N N N N N N 00000000
00 0 (N ‘Ct 00 00 N 0 ‘4� - 00 CrC‘0 N N N N N N N 00 00 00 00 0’.
N (N Cr. ‘Ct � CrC ‘0 N ‘0 (N 0 �i en,, ‘o ‘0 ‘0 ‘0 ‘0 ‘0 ‘0 ‘0 N N N N
*0’. 0 (N ‘Ct ‘0 ‘0 00 00 - (N 0’. 0’. ‘0Cr. ‘0 ‘0 ‘0 ‘0 ‘0 ‘0 ‘0 N N ‘0 N N
***0’. (N (N � � CrC N 0’. N - 0’. 0 -� CrC Cr. Cr. Cr. CF Cr. CF CF ‘0 Cr. ‘.0’O
* **‘Ct N 0’. 0 (N ‘Ct ‘0 ‘.0 00 0 CrC (N enCr. Cr. Cr. ‘0 ‘0 ‘0 ‘.0 ‘0 ‘.0 N ‘0 N N
***�t 0’. 0 - en ‘Ct ‘Ct ‘0 N 0’. ‘.0 N 00� � Cr. CF Cr. CrC CF Cr. Cr. Cr. Cr. Cr. Cr.
** ***0 - CF-C ‘.0 N 0’. (N (N (N 00 ‘.0 00 0’.Cr. Cr. Cr. Cr. Cr. Cr. ‘.0 ‘0 ‘0 ‘0 ‘0 ‘0 ‘0
****0 N N 0’. 0’. (N - ‘Ct ‘Ct - (N en �‘Ct � � � � Cr. Cr. Cr. Cr. CrC Cr. Cr. Cr.
0’. 0’. 0 Cr. Cr. 0’. en ‘0 00 ‘.0 - Cr.�00-enoo-’O�ooen-
(N en � Cr. � en (N -
Cr. 00 00 en ‘0 - ‘0 N 0’. en 00 Cr.0O’CF�NCr.00-.’O(N- - en Cr. .r. Cr. ‘Ct en -
N 0 en Cr.00 0 en CrC 00 0 en Cr. 00Cr. ‘.0 ‘.0 ‘.0 ‘0 N N N N 00 00 00 00
N 0 (N Cr. N 0 en Cr. 00 0 en Cr. 00� Cr. CrC Cr. CrC ‘0 ‘0 ‘0 ‘0 N N N N
C.-
�(Nen’CtCr.’oN00O’0�(Nen’�.� ‘.0 ‘0 ‘.0 ‘0 ‘0 ‘0 ‘0 ‘0 N N N N N�
(C,4?
‘�00O’0-.(Nen’CtCr.’0N00O’0E C� Cf� ‘0 ‘0 ‘.0 ‘0 ‘0 ‘0 ‘.0 ‘0 ‘0 ‘0 N�
00
8’0�1
2.0
‘8
4)
0
*
BODY WEIGHT AND BODY COMPOSITION STANDARDS 815
‘8.�4?
‘0
‘00
‘CtFl.Cr.
Cr.
E
E
‘8E
.0I
‘00
E00
0‘0
‘4:-a
by guest on October 20, 2012
ajcn.nutrition.orgD
ownloaded from
00’.Ci �
‘4
‘4
E
E
a
I,
E
E
I
a’
0
0’
00
0
a’
0
a’
00
0
C
.e
0
N
Cr.Cr.
E
I
E(2‘0
.�
E00
(2.4:
‘4:
N
<�0
0’. � 0’. NN N N 00
n-i en 0 n-i - Ci 00N N N N N N N
‘.ON -0’ 000 en%0’O N ‘ON N N N
N �‘ 0’. ‘0 ‘0 N 000’. � 0’. 0’.Cr. �‘ Cr. Ci Cr. Ci Ci CF’s Ci Ci Ci
�‘ N � ‘OCi 0 N 00‘Ct Ci ‘Ct ‘Ct
en en en Cr. 00 ‘0 N‘Ct Ct ‘Ct ‘Ct
--oen
00 (N en Nen en en en
CF’s CF’s 00 en 0-en en en en en en en
N - CF’s N N 0000(N en en n-i n-i en en n-i
0-’O’.00000’.OCiOO’.Ci(Nen-n-ln-i--(N-(N--
�-(N--eno’.o’.
OO00NO’.
N en en -n-i n-i n-i en
Ci CF’s ‘-‘0 Ci (N’O(N (N (N (N (N (N (N
(N--000n-i00en(N(N(N(N-(N-(N
Cr. - � en ‘O en n-i � en en - n-i- (N
000’. 000000 ‘.000
N 00 N N ‘0’O 00
‘o’.0’O Cr.
0-e’ienCrC(N-CF’sN�n-ien�00000--0
**CrC’O N 00 (N 000000 �‘ 0’. (N 000’. 0’. 0’. 0’. 000’. 0’. 00-0
**- (N � 0’.- en CF’s ‘on-i (N 00 Cr.0’. 0’. 0’. 00000’. 0’ 0000
*N 0 NO’. 0 Cr. en � N �‘ 0000’.N 00 N N 0000000000000’ 0000
**en �- ‘r. en en en en �‘ NO- ‘000‘.0’.C ‘0 N N N N N N N 00 N N
**0’. 0 (N en N --0 en 0 ‘0 en �CF’s ‘0 ‘.0 ‘0 ‘ON N N N N N N N
‘4’ Cr. N 000’. CF’s N Cr. 00 Ci N 000’.CF’s CF’s C� CF’s CrC ‘0 ‘.O’O ‘0 ‘O’0 ‘.0’O
N (N 0 ‘000’4’ 00- ‘4� Ci (N en Ci- n-i en CF-C - (N en ‘4’ 0’. N (N -
N 0 en CrC 000 en ‘r. 000 en Cr. 00CrC’O’0’O’ONF’-NN00000000
C �(Nen’CtCrs’ONoo0’0-(Nen’Ct‘.0’0 ‘0 ‘0 ‘0 ‘0 ‘0 N N N N N
00
8’0
000’. 0- (N en ‘Ct CrC’O N 000’. 0Cr. CrC’O’o ‘0 ‘0 ‘0 ‘0 ‘0’C’O ‘0 N
816 FRISANCHO
-“.0 N 00 CFN N ‘ON’O
0- en (N 0 N 00‘.0’.O ‘0 ‘0’0 CF�
000’ O”O Ct en N 00CF Ci Ci Ci Cr. Ci Ci Ci
-�en--(Noooo
en � ‘Ct en (N ri -en en en en en en en
00 (NO’. (NO’. (N -ri en ri en n-i en en
-P00 N 000’.en n-i n-i (N (N
00 en - Ci 00‘4 Ci C� CF�
Cr. en 00 Cr.’O’.’0’O
�- �‘ �‘ �‘ � � en
(N 00’. 0-(N’Ct� �‘ en � ‘� �- en
C�.-o� en en n-i en (N n-i n-i (N (N (N
-‘0’. (N ‘O’O (N (N �(N - (N
0’. ‘.00’. CF’s (NO’. 0’.
en en en 000
‘OOCrCO�Ci ‘Ct Ci
.ro�enen
� 00-n-i en Cr.�‘Ct’Ct’Cten
CF’s ‘0 CrC en n-i en 0’. 0 N n-i’O‘ten en en en en n-i en n-i en n-i
‘OCt � Ci en 000 n-i(N(N(N(N(N(N-(N
Ci(N�n-iN00(N(N(N(N(N--
00 0’. 000 CrC--(N--
** **�CiCi’Q’-’00O’.-’O’.0’�0-0000----00---
**0’. 0’. 00 CF’s - (N (N (N CF’s � �‘ Ci CF-CO’.O’.000’.000000000
**Cr. CF’s N Ct en o N 0000 Cr. 0--0’. 0’. 000’. 0’. 00’. 0’. 0’. 0000
**(N 00000% (N 0 N 0 (N 00’. CF-CCF-C0’. N N N 0000 N 000000 N 0000
**en en 0’. 0’. en N NO’. en 00000’. 0’.
‘.0’0 ‘.O’.O’,0 ‘O’0’.O %0’O’O
**0’. 0’. CF’s 00 CF’s CF-C ‘00 � � CF’s Cr.Cr. CF’s %O’.0 ‘0 ‘0 ‘O’.0 ‘0’.0’O ‘.0’.0
en � �‘ 0’.- 00 N 00000’.CF’s Ci CrC ‘.0 CF’s ‘0 ‘0’o CF-C CF’s CF-C CF’s
‘on-i N ‘O’�J’ N N �. 0 N N n-�- (N N - (N Ci �‘ ‘0 � -
N 0 (N Cr. N 0 en � 000 en CF’s 00� CF-I CF’s Cr. CrC ‘.0 ‘.00 ‘0 N N N N
by guest on October 20, 2012
ajcn.nutrition.orgD
ownloaded from

BODY WEIGHT AND BODY COMPOSITION STANDARDS 817
itan Tables fell within limits indicted by linesrepresenting one probable error above andbelow the line of mean weights, based oneither chest breadth or bi-iliac diameter, of25-yr-old army men (13). This proceduresimply shows that the weights of the Met-ropolitan sample are normally distributedbut obviously does not validate the classifi-cation of frame size. Similarly, the framesize categories given in the 1983 Metropoli-tan weight tables are also arbitrary. This isbecause the frame size categories were basedon elbow breadth derived from theNHANES I data sets (4), while the weightsassociated with these frame size categorieswere derived from the Metropolitan Insur-ance population. It must be noted that theMetropolitan Tables indicate the weights atwhich people should have the greatest lon-gevity; they do not refer to weights thatminimize illness or the incidence of disease.It is evident that these tables, despite theirwide use, cannot be considered a valid ref-erence for assessing health and nutritionalstatus.
Since the 1983 Metropolitan referenceweights were derived from people betweenthe ages of 20 and 59 yr, their applicabilityto an older population is questionable. Thisis because among older populations there isnot only a decrease in body weight but also
TABLE 8
a change in body composition (7, 14, 15).As inferred from studies of potassium dilu-tion (16-18) and creatinine excretion (19,20), from middle age (35 to 39 yr) onwardthere is a decline ofabout 6 to 8% per decadein lean body mass, while body fat eithertends to increase or remain stable. Giventhese changes in body weight and body com-position, adequate assessment of the nutri-tional status of the elderly cannot be donewith reference to standards derived fromadult populations.
For these reasons, the present new stand-ards which are based on a large sample rep-resentative of contemporary United Statespopulations can be used in conjunction withother measurements such as dietary intakeand biochemical and clinical evaluationswhen the objective is to determine healthand nutritional status of adults and the el-derly.
Finally, it must be noted that the stand-ards established in this study cover wideranges ofages (25 to 54 and 55 to 74). Thisbeing the case, one might expect there to beage-related changes in anthropometricmeasures within each group. Consequently,it was felt that age correction factors wereneeded for the anthropometric standards ofeach age, sex, and frame-specific group.These factors were established through
Age correction for estimates of weight, triceps and subscapular skinfold thicknesses, and bone-freeupper AMA
Age group:
Frame SizeMedian
Age eTriceps
SkinfoldSubscapular
SkinfoldArm Muscle
Area
Males25-54
Small 39 0.074 0.016 0.080 0.030Medium 39 0.080 0.005 0.083 0.055Large 40 0.000 -0.024 0.049 0.026
55-74Small 66 -0.329 -0.036 -0.115 -0.407Medium 67 -0.435 -0.040 -0.125 -0.521Large 67 -0.562 -0.054 -0.185 -0.644
Females25-54
Small 37 0.165 0.166 0.142 0.087Medium 37 0.234 0.189 0.214 0.191Large 37 0.284 0.191 0.233 0.270
55-74Small 67 -0.027 -0.072 -0.013 0.036Medium 66 -0.196 -0.210 -0.221 -0.033Large 67 -0.466 -0.370 -0.5 15 -0.378
by guest on October 20, 2012
ajcn.nutrition.orgD
ownloaded from
818 FRISANCHO
1. Abraham 5, Johnson CL, Najjar MF. Weight byheight and age for adults 18-74 years: United
regression analyses in which weight, tricepsand subscapular skinfold thicknesses, andbone-free upper AMA were regressed againstage for each group. The regression coeffi-cients obtained from these analyses repre-sent the age-correction factors.
Listed in Table 8 are the age-correctioncoefficients and the median ages for eachgroup. The use of these age-correction fac-tors may be illustrated in the following ex-ample:
Given a 57-yr-old, large-framed male whois 170 cm (67 in) tall, we wish to determinewhether he is above or below the UnitedStates median, if he weights 90 kg. Thegeneral equation used to determine theage-adjusted median weight for such anindividual would be:
Where:
Adjusted weight standard= unadjusted weight standard
+ (age correlation)x (deviation from median age)
Unadjusted weight standard = 85 kg(See Table 7).
Age-correction factor = -0.562(See Table 8).
Median age = 67 yr
Actual age = 57 yr
From this information:
Adjusted weight standard
= 85 + (-0.562)(57-67)
= 85 + (-0.562X-10)
(See Table 8).
= 90.62 kg (or approximately 91 kg).
Therefore, the age-adjusted weight stand-ard indicates that this individual is actuallybelow the United States median (90 vs 91kg), whereas without the age correction, hewould have appeared to be about 5 kg abovethe median weight for his height and framesize.
The author acknowledges the expert assistance ofLaura A Bollettino and William R Leonard with statis-tics and the computer data analysis. El
References
States, 1971-1974. Vital and Health Statistics, se-ries 1 1, no 208. Hyattsville, MD: National Centerfor Health Statistics, 1979. DHEW Publication no(PHS) 79-1656.
2. Johnson CL, Fulwood R, Abraham 5, Bryner JD.
Basic data on anthropometric measurements andangular measurements of hip and knee joints forselected agegroups 1-74 years ofage: United States,1971-1975. Vital and Health Statistics, series 11,no 219. Hyattsville, MD: National Center forHealth Statistics, 1981. DHHS Publication no(PHS) 8 1-1669.
3. Frisancho AR. New norms of upper limb fat andmuscle areas for assessment of nutritional status.Am J Clin Nutr 198 1;34:2540-5.
4. Frisancho AR, Fkgel PN. Elbow breadth as a meas-ure of frame size for US males and females. Am JClin Nutr 1983;37:3l 1-14.
5. Heymsfield SB, McManus C, Smith J, Stevens V.Nixon DW. Anthropometric measurement of mus-dc mass: Revised equations for calculating bone-free arm muscle area. Am J Clin Nutr 1982;36:680-90.
6. Abraham 5, Carroll MD, Najjar MF, Fulwood R.Obese and overweight adults in the United States.Vital and Health Statistics, series 1 1, no 230.Hyattsville, MD: National Center for Health Statis-tics, 1983. DHHS Publication no (PHS) 83-1680.
7. Russell RM. Evaluating the nutritional status ofthe elderly. Clin Nutr l983;2:4-8.
8. Garn SM, Bailey SM, Cole PE. Continuities andchanges in fatness and obesity. In: Schemmel R,ed. Nutrition, physiology, and obesity. Palm Beach,FL: CRC Press, 1980:51-78.
9. Gray GE, Gray LK. Validity of anthropometricnorms used in the assessment of hospitalized pa-tients. JPEN 1979;3:366-8.
10. Bowman BB, Rosenberg IH. Assessment of thenutritional status of the elderly. Am J Clin Nutrl982;35:l 142-51.
1 1. Metropolitan height and weight tables. Stat Bull1983;64: 1-9.
12. Simopoulos AP, van Italic TB. Body weight,health, and longevity. Ann Intern Med1984; 100:285-95.
13. White RM. Body build and body weight in 25-year-old army men. Hum Biol 1956;28:141-5.
14. Borkan GA, Hults DE, Mayer PJ. Physical anthro-pological approaches to aging. Yearbook Phys An-thropol 1982;25: 181-202.
15. Munro HN. Nutrition and aging. Br Med1981 ;37:83.
16. Burmeister W, Bingert A. Die quantitativen Ver-anderungen der menschlichen Zeilmasse zwischendem 8 und 90 lebensjahr. Kim Wochemschrl967;45:409-16.
17. Forbes GB, Reina JC. Adult lean body mass de-clines with age: some longitudinal observations.Metabolism 1970; 19:653-63.
18. Moore FD, Oleson KH, McMurrey JD, Parke HV,Bell MR, Boyden CR. The body cell mass and itssupporting environment. Philadelphia, PA: WBSaunders, 1963.
19. Norris AH, Lundy T, Shock NW. Trends in se-
by guest on October 20, 2012
ajcn.nutrition.orgD
ownloaded from

BODY WEIGHT AND BODY COMPOSITION STANDARDS 819
lected indices of body composition in men betweenthe ages of 30 and 80 years. Ann NY Acad Scil963;1 10:623-39.
20. Tzankoff SP, Norris AH. The constancy of thebasal metabolic rate with age. Program of the 29thAnnual Meeting of the Gerontological Society 1976(abstr).
Appendix
Cakulating the new sampling weighis
New sampling weights were calculated by giving eachindividual one-half the original sampling weight.
Note that an estimated mean level for any popula-tion subgroup using the merged data set is approxi-mately the average of the estimated mean levels for thetwo NHANES samples, provided the size of thesubgroup does not change substantially from the firstsurvey to the second. The following example illustratesthispoint.Let A be a population subgroup, X a characteristic ofinterest,and
N,’ = LEA W,1 = estimate of size of A at time ofNHANES I
N2’ = LEA W� = estimate of size of A at time ofNHANES II
= �iEA W,X,JN,’ = estimate of mean level of Xin A for NHANES I
= LEA W21X21/N2’ = estimate of mean level of Xin A for NHANES II
For the combined data set the estimate of the mean
level of X in A is:
= F� (W,1/2)X,1 + � (W�/2)X2�LiEA iEA
� (W,1/2) + � (W�/2)LIEA sEA
= W,1X,1 + � W�X) /N,’ + N2’)VGA SEA / /
/ N,’ \ / N2’ \= �N,’ + N2’)� + �N1’ + N2�)�2
But ifN,’ � N2’ then N,’/(N,’ + N2’) � 1/2 and N2’/(�,‘ + N2’) � �/2 so that �‘ � �/2��’ + ‘/2X�’ = (�‘ +
X2’)/2.
by guest on October 20, 2012
ajcn.nutrition.orgD
ownloaded from