new stationary phases for high‐ performance liquid ... · acknowledged for their endless support,...
TRANSCRIPT

New Stationary Phases for High‐
Performance Liquid Chromatography of
Biomolecules
By
Mohammad Talebi
A thesis submitted in fulfilment of the requirements for
the degree of
Doctor of Philosophy
School of Chemistry
Hobart campus
Submitted May 2013

i
Declarations
I hereby declare that this thesis contains no material which has
been accepted for the award of any other degree or diploma in any
tertiary institution, and to the best of my knowledge contains no copy or
paraphrase of material previously published or written by any other
person, except where due reference is made in the text of the thesis.
Mohammad Talebi
This thesis may be made available for loan and limited copying in
accordance with the Copyright Act 1968.
Mohammad Talebi
University of Tasmania
Hobart

ii
Acknowledgements
This project was supported by a PhD scholarship from the Pfizer
Analytical Research Centre (PARC), Australian Centre for Research on
Separation Science (ACROSS) and University of Tasmania. The tuition fee
was covered by a grant from the State Government of Tasmania,
Department of Economic Development and Tourism.
This work would have not been possible without the kind support
of the following people:
First of all, I would like to express my sincere gratitude and
appreciation to my supervisors who kindly provided me this
opportunity, Prof Emily Hilder and Prof Paul Haddad, for their patience,
time and their continuous support throughout my PhD and thereafter.
My co‐supervisors at Pfizer Inc., USA, Dr Nathan Lacher and Dr
Qian Wang are acknowledged for their time, support and invaluable
comments during this project.
I thank all my friends, labmates and members of ACROSS for their
friendship, collaboration and advice, including Jason Hon, Lea Mauko,
Tom Kazarian, Cameron Johns, Joe Hutchinson, Éadaoin Tyrrell, Esme
Candish, Tim Causon, Oscar Potter, Jeremy Deverell, and A/Prof Joselito
Quirino. I specially thank Dr Anna Nordborg and Dr Dario Arrua for
contributing many valuable ideas and useful discussions to this work.

iii
Prof Pavel Nesterenko is thanked for his useful advice and
comments, and A/Prof Greg Dicinoski for providing me the teaching
opportunity as a demonstrator for KRA336.
All past and present staff of the School of Chemistry are
acknowledged for their endless support, including Anthony Malone,
Murray Frith, Andrew Grose, Brendon Schollum and Clodagh Moy.
The staff of Central Science Laboratory (CSL) are thanked for their
excellent technical support, including Dr Karsten Gömann, for his kind
assistance and expertise in using the scanning electron microscope
facilities, Dr Thomas Rodemann for providing the access to the FT‐IR
instrument, and Peter Dove in Central Mechanical Workshops for his
expertise and efforts.
I wish to acknowledge all my friends in Hobart for their true
friendship and company and for all the great times and memories that
I’ve had with them, including Manish Khandagale, András and Kriszta
Gáspár, and Joan Isherwood.
And finally, I would like to dedicate this work, first and foremost,
to my wife, Mitra, who not only accepted all difficulties in my passion for
the academic life, but also encourages me to pursue my dreams with
continuous love and support; and second, to our families in Iran, for their
patience and emotions. I appreciate the sacrifices they all made en route
to completion of this undertaking.

Abbreviations
iv
Abbreviations
ACN Acetonitrile
AIBN 2,2’‐Azobisisobutyronitrile
AMH Ammonium hydroxide
BACM 4‐[(4‐aminocyclohexyl)methyl] cyclohexylamine
BSA Bovine serum albumin
CE Capillary electrophoresis
CEX Cation‐exchange
CF Chromatofocusing
cIEF Capillary isoelectric focusing
2D Two dimensional
DBC Dynamic binding capacity
DEA Diethylamine
EDA Ethylenediamine
EDMA Ethylene dimethacrylate
ESI Electrospray ionisation
GLT Glass‐lined tubing
GMA Glycidyl methacrylate
HIC Hydrophobic interaction chromatography
HILIC Hydrophilic interaction liquid chromatography
IEC Ion‐exchange chromatography
IEX Ion‐exchange
Lys‐C C‐terminal lysine
mAb Monoclonal antibody

Abbreviations
v
MD Multi‐dimensional
MPD Median pore diameter
MW Molecular weight
PEA O‐Phosphorylethanolamine
PEG Polyethylene glycol
PETA Pentaerythritol triacrylate
pI Actual isoelectric point
pIapp Apparent isoelectric point
RPLC Reversed‐phase liquid chromatography
SCX Strong cation‐exchange
SEA 2‐Aminoethyl hydrogen sulfate
SEC Size exclusion chromatography
SEM Scanning electron microscopy
TEA Triethylamine
TOF‐MS Time of flight‐mass spectrometer
UHPLC Ultra high pressure liquid chromatography
WAX Weak anion‐exchange
WCX Weak cation‐exchange

Publications
vi
Publications
Papers in peer‐reviewed journals:
1) M. Talebi, A. Nordborg, A. Gaspar, N.A. Lacher, Q. Wang, X.Z. He,
E. F. Hilder, P.R. Haddad; Charge heterogeneity profiling of
monoclonal antibodies using low ionic strength ion‐exchange
chromatography and well‐controlled pH gradients on
monolithic columns. Submitted to Journal of Chromatography A
(chapter 3).
2) M. Talebi, R. D. Arrua, A. Gaspar, N.A. Lacher, Q. Wang, P.R.
Haddad, E.F. Hilder; Epoxy‐based monoliths for capillary liquid
chromatography of small and large molecules. Analytical and
Bioanalytical Chemistry, 405 (2013) 2233‐2244 (chapter 5).
3) R. D. Arrua, M. Talebi, T. Causon, E.F. Hilder; Review of recent
advances in the preparation of organic polymer monoliths for
liquid chromatography of large molecules. Analytica Chimica
Acta, 738 (2012) 1‐12 (chapter 1).
Conferences:
1) M. Talebi, N. A. Lacher, E. F. Hilder, P. R. Haddad; Well‐
controlled pH gradient cation‐exchange chromatography‐mass
spectrometry for charge heterogeneity profiling of monoclonal
antibodies. 24th Australia and New Zealand Society for Mass
Spectrometry Conference (ANZSMS24), 2‐6 Feb 2013, Melbourne,
Australia, (oral communication).

Publications
vii
2) M. Talebi, E.F. Hilder, P.R. Haddad, N.A. Lacher, Q. Wang; Epoxy‐
based monolithic columns for capillary liquid chromatography
of small and large molecules. 38th International Symposium on
High Performance Liquid Phase Separations and Related Techniques
(HPLC 2012), 16‐21 Jun 2012, Anaheim, CA USA (poster
presentation).
3) M. Talebi, E.F. Hilder, P.R. Haddad, N.A. Lacher, Q. Wang;
Polymeric cation‐exchange monolithic columns for capillary
liquid chromatography of proteins. 11th Asia‐Pacific International
Symposium on Microscale Separations and Analysis (APCE2011),
27‐30 Nov 2011, Hobart, Australia (poster presentation).
4) M. Talebi, A. Nordborg, E.F. Hilder, P.R. Haddad, N.A. Lacher, Q.
Wang, J. Wang; Polymeric monolithic ion‐exchange stationary
phases in combination with pH gradient for the separation and
purity profiling of monoclonal antibodies.
‐ International Symposium on Drug Analysis (Drug Analysis
2010), 21‐24 Sep 2010, Antwerp, Belgium (Invited lecture).
‐ 18th Annual RACI Research & Development Topics
Conference, 5‐8 Dec 2010, Hobart, Australia (oral
communication).
5) Nordborg, M. Talebi, E.F. Hilder, P.R. Haddad, B. Zhang, J. Wang,
Polymeric monolithic ion‐exchange stationary phases for the
separation and purity profiling of biopharmaceuticals, 29th
International Symposium on the Separation of Proteins, Peptides &

Publications
viii
Polynucleotides. 25‐28 Oct 2009, Delray Beach, Florida, USA
(oral communication).
6) E.F. Hilder, A. Nordborg, M. Talebi, P.R. Haddad, B. Zhang, J.
Wang; High performance ion‐exchange phases for the
separation of therapeutic proteins. 24th International Symposium
on Microscale Bioseparations, 19‐22 Oct 2009, Dalian, China
(invited lecture).
7) E.F. Hilder, A. Nordborg, M. Talebi, P.R. Haddad, B. Zhang, J.
Wang, High performance ion‐exchange stationary phases for
the separation of therapeutic proteins and oligonucleotides,
International Ion Chromatography Symposium‐IICS. 21‐24 Sep
2009, Dublin, Ireland (invited lecture).

Last updated April 2012 Page 1
Statement of Co‐Authorship
The following people and institutions contributed to the publication of work undertaken as part of this thesis:
Candidate: Mohammad Talebi, Pfizer Analytical Research Centre (PARC), ACROSS, School of Chemistry, UTAS
Author 1: R. D. Arrua, ACROSS, School of Chemistry, UTAS
Author 2: T. Causon, ACROSS, School of Chemistry, UTAS
Author 3: A. Gaspar, ACROSS, School of Chemistry, UTAS
Author 4: A. Nordborg, ACROSS, School of Chemistry, UTAS
Author 5: E.F. Hilder, ACROSS, School of Chemistry, UTAS
Author 6: P.R. Haddad, ACROSS, School of Chemistry, UTAS
Author 7: N.A. Lacher, Analytical R&D, Pfizer BioTherapeutics Pharmaceutical Sciences, Chesterfield, MO, USA
Author 8: Q, Wang, Analytical R&D, Pfizer BioTherapeutics Pharmaceutical Sciences, Chesterfield, MO, USA
Author 9: X.Z. He, Analytical R&D, Pfizer BioTherapeutics Pharmaceutical Sciences, Chesterfield, MO, USA
Author details and their roles: Paper 1: Review of recent advances in the preparation of organic polymer monoliths for liquid chromatography of large molecules. Located in chapter 1 (Note: Only a section of this paper is included in this thesis) Candidate was the second author (25%) and with author 1 (40%), author 2 (15%) and author 5 (20%) wrote sections of the review article. Author 5 contributed to the refinement and final corrections, and author 1 contributed to the submission.
Paper 2: Epoxy‐based monoliths for capillary liquid chromatography of small and large molecules Located in chapter 5 Candidate was the first author (50%) and contributed to designing and performing experiments, and writing. Author 1 (8%) contributed to designing and performing an experiment. Author 3 (7%) assisted with an experiment. Author 5 (15%) contributed to concepts, proof reading, refinement and submission. Author 6 (10%) with author 7 (5%) and 8 (5%) contributed to the proof reading and corrections. Paper 3: Charge heterogeneity profiling of monoclonal antibodies using low ionic strength ion‐exchange chromatography and well‐controlled pH gradients on monolithic columns Located in chapter 3 Candidate was the first author (45%) and contributed to designing and performing experiments, and writing. Author 3 (10%) contributed to designing and assisted with an experiment. Author 9 (10%) contributed to designing and performing an experiment. Author 5 (10%) and author 6


Abstract
ix
Abstract
This work presents a study on the preparation and application of
polymer monoliths for the liquid chromatography of biomolecules with a
focus on the ion‐exchange (IEX) mode.
As one important application of polymer monoliths in bioanalysis,
charge heterogeneity profiling of monoclonal antibodies (mAbs) in
different biopharmaceuticals was performed by developing an elution
approach based on shallow pH gradient, generated using single
component buffer systems as eluents through cation‐exchange (CEX)
monoliths as stationary phases. A useful selection of small molecule
buffer species is described that can be used within very narrow pH
ranges (typically 1 pH unit) defined by their buffering capacity for
producing controlled and smooth pH profiles when used together with
porous polymer monoliths. The results obtained appeared to be
consistent with those obtained by imaged capillary isoelectric focusing
(iCE) in terms of both resolution and separation profile. The retention
mechanism based on the trends observed for proteins at pH values
higher than the electrophoretic pI, as well as the high resolution gains,
were discussed using applicable theories. Very low ionic strength eluents
also enabled direct coupling of the ion‐exchange chromatography (IEC)
to mass spectrometer for further characterisations of mAbs. Although
there are few reports of IEC‐MS technique for small proteins in which the
IEX column is directly interfaced to the mass spectrometer, the
employment of a linear pH gradient elution scheme directly interfaced to

Abstract
x
mass spectrometer for the analysis of large proteins such as mAbs is also
unique in the present work.
New polymer monoliths were prepared in 100 µm i.d. capillaries
by thermally‐initiated co‐polymerisation of glycidyl methacrylate as
reacting monomer and pentaerythritol triacrylate as a hydrophilic cross‐
linker. The monolith recipe and polymerisation conditions were
optimised to obtain a homogeneous monolith with good mechanical
stability and characteristics suitable for separation of biomacromolecules.
Nevertheless, shrinkage of the material prevented making monoliths in a
column with conventional dimensions. Post‐polymerisation modification
of the monolith was performed via optimised reaction conditions in order
to incorporate weak cation‐exchange (WCX) or strong cation‐exchange
(SCX) functionalities using amine reagents respectively containing
phosphoric acid or sulforic acid groups. Dynamic binding capacities up
to 15.1 mg/mL were measured using lysozyme as a standard probe,
which is comparable or greater from some of the commercially available
columns. Compared to monoliths reported previously for the same
purpose, the developed monoliths also demonstrated negligible
hydrophobicity with separation efficiency of approximately 55,000
plates/m in isocratic separation of sample proteins.
A versatile epoxy‐based monolith was synthesised in 100 µm i.d.
capillaries by polycondensation polymerisation of glycidyl ether 100 with
ethylenediamine using a porogenic system consisting of polyethylene
glycol, MW = 1000, and 1‐decanol. Polymerisation was performed at 80 °C
for 22 h. The resultant monolith possessed hydrophilic properties

Abstract
xi
originating from the incorporation of hetero‐atoms in the monolith
skeleton which was further strengthened by simple acid hydrolysis of
residual epoxides, resulting in a mixed diol‐amino chemistry. The
modified column was used successfully for hydrophilic interaction liquid
chromatography (HILIC) of small molecule probes, such as nucleic acid
bases and nucleosides, benzoic acid derivatives, as well as for peptides
released from a tryptic digest of cytochrome c. The mixed mode
chemistry allowed both hydrophilic partitioning and IEX interactions to
contribute to the separation, providing flexibility in selectivity control.
Residual epoxide groups were also exploited for incorporating a mixed
IEX chemistry. Alternatively, the surface chemistry of the monolith pore
surface rendered hydrophobic via grafting of a co‐polymerised
hydrophobic hydrogel. The inherent hydrophilicity of the monolith
scaffold also enabled high performance separation of proteins under IEX
and hydrophobic interaction (HIC) modes and in the absence of
nonspecific interactions.

xii
Table of Contents ...................................................................... Page
Declarations ......................................................................................................... i
Acknowledgements .......................................................................................... ii
Abbreviations ................................................................................................... iv
Publications ....................................................................................................... vi
Abstract .............................................................................................................. ix
Chapter 1: Literature review ........................................................... 1
1.1 Overview ........................................................................................................ 1
1.2 IEC of biomolecules ..................................................................................... 3
1.2.1 pH gradient elution ................................................................................ 5
1.3 Monolithic columns: preparation and applications ............................ 14
1.3.1 Biocompatibility in monoliths for bioseparation ............................. 18
1.3.1.1 Polyacrylamide‐based monoliths ...................................................... 19
1.3.1.2 Polymethacrylate‐based monoliths ................................................... 20
1.3.1.2.1 Post‐polymerisation modification ................................................. 23
1.3.1.2.2 Surface functionalisation with nanoparticles ............................... 25
1.3.1.3 Epoxy‐based monoliths .................................................................... 28
1.3.2 Polymeric monolithic columns in proteomics research .................. 32
1.4 Project aims ................................................................................................. 40
Chapter 2: Experimental ................................................................ 42
2.1 Chemicals and reagents ............................................................................ 42
2.2 Instruments.................................................................................................. 45
2.2.1 Other instruments ................................................................................ 47
2.3 General procedures .................................................................................... 47
2.3.1. Surface modification of fused‐silica capillaries .............................. 47

xiii
2.3.2 Surface modification of glass‐lined tubing (GLTs) ......................... 48
2.3.3 Column permeability measurement .................................................. 49
2.3.4 Dynamic binding capacity (DBC) measurements ........................... 49
2.3.5 Enzymatic digestion of proteins ........................................................ 50
Chapter 3: Charge Heterogeneity Profiling of Monoclonal
Antibodies Using Low Ionic Strength Ion‐exchange
Chromatography and Well‐controlled pH Gradients on
Monolithic Columns ...................................................................... 51
3.1 Introduction ................................................................................................. 51
3.2 Experimental ............................................................................................... 56
3.2.1 Chemicals and reagents ....................................................................... 56
3.2.2 Chromatography .................................................................................. 56
3.2.3 Liquid chromatography‐mass spectrometry (LC‐MS) ................... 58
3.2.4 iCE .......................................................................................................... 58
3.3 Results and Discussion ............................................................................. 59
3.3.1. Triethylamine‐diethylamine (TEA‐DEA) buffer system ............... 59
3.3.2 DEA buffer system ............................................................................... 61
3.3.3 Ammonium hydroxide (AMH) buffer system ................................. 62
3.3.4 Retention Mechanism .......................................................................... 68
3.3.5 Effects of eluent concentration and pH on resolution .................... 69
3.3.6 Loading capacity .................................................................................. 71
3.3.7 Profiling charge heterogeneity of mAbs by iCE .............................. 72
3.3.8 LC‐MS analysis ..................................................................................... 76
3.4 Conclusion ................................................................................................... 79

xiv
Chapter 4: Methacrylate‐based Polymeric Monoliths for
Cation‐Exchange Chromatography of Proteins ........................ 82
4.1 Introduction ................................................................................................. 82
4.2 Experimental ............................................................................................... 86
4.2.2 Polymer monolith preparation ........................................................... 86
4.2.3 Post‐polymerisation modifications .................................................... 88
4.3 Results and discussion .............................................................................. 90
4.3.1 Polymer monolith preparation ........................................................... 90
4.3.1.1 Monolith preparation in conventional dimension ........................... 93
4.3.2 Stability of poly(GMA‐co‐PETA) monoliths ..................................... 97
4.3.3 Post‐polymerisation modifications .................................................... 99
4.3.3.1 Effect of pH on modification reaction............................................. 100
4.3.4 IEC of proteins: effect of eluent pH on selectivity ......................... 101
4.3.5 Hydrophobic interactions ................................................................. 105
4.4 Conclusions ............................................................................................... 106
Chapter 5: Epoxy‐based Monoliths for Capillary Liquid
Chromatography of Small and Large Molecules ................... 109
5.1 Introduction ............................................................................................... 109
5.2 Experimental ............................................................................................. 112
5.2.1 Sample preparation ............................................................................ 112
5.2.2 Mass spectrometry ............................................................................. 113
5.2.3 Polymer monolith preparation ......................................................... 113
5.2.4 Post‐polymerisation modifications .................................................. 116
5.3. Results and discussion ........................................................................... 119
5.3.1 Monolith preparation ........................................................................ 119

xv
5.3.2 Separation of small molecules .......................................................... 124
5.3.2.1 Nucleobases and nucleosides .......................................................... 124
5.3.2.2 Benzoic acids .................................................................................. 126
5.3.3 Separation of peptides ....................................................................... 134
5.3.4 Separation of proteins ........................................................................ 138
5.3.5 Reproducibility ................................................................................... 142
5.4 Conclusion ................................................................................................. 143
Chapter 6: General Conclusions and Future Directions ...... 145
References ....................................................................................154

Chapter 1
1
Chapter 1
Literature review
1.1 Overview
The developments in molecular and cell biology in the last quarter
of the 20th century led to new technologies for the production of complex
biomolecules being divided into two main categories: proteins and
nucleic acids [1]. Biopharmaceuticals have the potential to assist in
human health care in the areas of diagnostics, prevention and treatment
of diseases. In 1982 the Food and Drug Administration (FDA) approved
human insulin synthesized in Escherichia coli as the first recombinant
therapeutic product in the United States. Advances in biotechnology have
broadly expanded the variety of therapeutics, including hormones,
cytokines, vaccines, and monoclonal antibodies (mAbs). Among these
developing therapeutics, mAbs are particularly attractive as they can be
designed to selectively target tumour cells and elicit a variety of
responses once bound. Until 2005, more than 206 unique therapeutic
mAbs have been studied in clinical trials for a variety of cancer
indications worldwide [2, 3]. These advances of recombinant proteins
were made possible by the development of efficient and reproducible
production and purification systems that permit manufacture of these
Chapter 1
2
complex molecules in large amounts with consistent quality suitable for
human use [4]. Simultaneous with this growth has been the proliferation
of biotechnology companies. There are about 1300 companies competing
for this market [3]. In 2000, annual sales of biopharmaceuticals in the
United States alone comprised approximately 10% ($8 billion) of all
therapeutic sales in the country [3].
Control of the quality of biopharmaceuticals is crucial not only
during large scale manufacturing but also during the research and
development phases, as impurities and contaminants have to be
characterized and reduced to acceptable levels. Hence, the increased
attention toward biotechnology products in the last three decades has
challenged both the regulatory authorities responsible for approving new
drugs and the biotechnology industries, which must consistently produce
a definable and safe product.
There is an overwhelming interest in the separation of biological
molecules by chromatographic techniques, for example, in
pharmaceuticals or for medical diagnostics. In particular, the application
of high‐performance liquid chromatography (HPLC) to the separation of
both biomacromolecules and their related small molecules has increased
considerably over the last two decades. Whereas reversed‐phase
chromatography (RPLC) is the most commonly used mode of separation
for peptides and small molecules, the three‐dimensional structure of
proteins can be sensitive to the often harsh conditions employed in RPLC.
Preferably, IEC, size‐exclusion chromatography (SEC) and hydrophobic

Chapter 1
3
interaction chromatography (HIC) are the most commonly used modes
for the separation of bio(macro)molecules when preserving the native
structure of the biomolecule is also of interest [5, 6].
1.2 IEC of biomolecules
IEC is a method of separating proteins based on differences in
their net charge. IEC can be a highly selective chromatographic
technique, being able to resolve, for example, proteins which differ by
only a single charge [7]. Due to the orthogonality of separation
mechanism to RPLC, IEC is often used as the first dimension in two
dimensional (2D) separations. For example, on‐line IEC‐RPLC was
developed for automated shotgun proteome analysis [8]. IEC is
advantageous in providing fast separation of biomolecules with high
recoveries and resolving power. Also, buffer components are non‐
denaturing and IEC can be used as a preconcentration step to recover
proteins from a dilute solution [9]. Compared with HIC, lower salt
concentration is used in IEC, thus precipitation of biomolecules due to
the high salt concentration can be avoided [9].
The disadvantages of IEC are few, but include 1) the sample must
be applied to the IEC column under conditions of low ionic strength and
controlled pH, which sometimes requires an extra step of buffer exchange
to be conducted, 2) chromatographic instrumentation should be resistant
to salt‐induced corrosion, and 3) post‐chromatographic preconcentration
of dilute solutions of recovered proteins can result in high salt

Chapter 1
4
concentrations (typically more than 1 M), which is unsuitable, for
example, in biological assays unless buffer exchange is carried out [10].
Based on the classical net charge theory the separation process in
IEC relies upon the formation of electrostatic interactions between the
charged groups on biomolecules (typically, amines, carboxylic acids,
sulfonic acids and phosphoric acids), and an ion‐exchange sorbent
carrying the opposite charge. Non‐bound biomolecules (i.e., neutral
molecules which do not carry any electrical charge or molecules carrying
the same charge as the ion‐exchanger) are not retained in the column, and
bound biomolecules are recovered by elution with a buffer of either
higher ionic strength, or altered pH. The basic concepts involved in this
theory imply that 1) at their isoelectric point (pI) proteins will not be
retained because the net charge is zero, 2) proteins will be retained on
positively (negatively) charged anion (cation) exchangers when the pH of
the eluent is greater (lower) than their pI because they have a net negative
(positive) charge, and 3) there is a functional relationship between the net
charge and retention time of proteins [11].
Lesins and Ruckenstein [12] indicated, along with others [13, 14],
that the net charge theory is an over‐simplification of protein adsorption
on charged sorbents. This is because of two reasons: significant retention
in IEC may occur at the pI, where correlation between net charge and
retention is poor [11]. These authors suggested that charge localization on
the protein surface that is quite different from the net charge of the
molecule may occur. Regnier emphasized the importance of

Chapter 1
5
heterogeneity on the protein surface and its relation to protein adsorption
[15]. Lesins and Ruckenstein [12] indicated that if there is a non‐uniform
charge distribution on the protein surface, it is not necessary for the net
charge of the protein to be opposite to that of the ion‐exchanger for
adsorption due to electrostatic interactions to occur; instead the
occurrence of oppositely charged patches is all that is necessary. These
charged patches and the subsequent heterogeneity in the protein‐ion
exchanger contact region would significantly affect the conformational
changes encountered by proteins during the separation process.
1.2.1 pH gradient elution
In the classic mode of IEC, proteins are eluted using a salt gradient
(most often NaCl) with the eluent pH being nearly constant. While the
resolving power of IEC by this approach is high, the same can be said
regarding the amount of effort required to fully optimise a method. The
design of an optimal IEC process is not straightforward due to the
involvement of numerous interrelated parameters such as, type of
stationary phase, dimension of the column, amount of sample loaded,
loading and eluting buffer (type, concentration and pH), mode of elution
(isocratic, gradient or stepwise), and slope of the gradient elution profile
[16]. Besides, once the method development is completed, a method is
usually product‐specific with very limited robustness; eg., eluent pH has
shown a robustness tolerance as low as ±0.05 pH units around the
optimised value [17]. It has also been shown that complex pH transitions
occur in response to salt gradient [18‐20]. Consequently, the retention and

Chapter 1
6
separation efficiency are affected by the characteristics of both salt
gradient and eluent pH [21].
Yamamoto and Ishihara observed that the resolution of β‐
lactoglobulin A and B in IEC is highest when the eluent pH is near the pI
of proteins (5.1 and 5.2) [22]. This behaviour was related to the
enhancement of adsorption affinity of these proteins near their isoelectric
points. However, salt gradient IEC is generally operated at a fixed eluent
pH, which cannot be generalised as the optimum pH when several
proteins are being separated [23]. Finally, the chief deficit of salt gradient
IEC is that proteins with the same number of effective charges will be
eluted from the ion exchanger close to each other. This limits significantly
the selectivity of IEC when complex protein mixtures are separated [24].
The situation will be even worse when protein charge variants are to be
resolved. These variants arise from modifications of the amino‐ and
carboxylic‐termini and amino acid side chains [25]. While with small
proteins, such as recombinant human growth hormone, separation of all
charge species is possible, the number of possible charge variants
increases when the size of proteins is increased [26]. As changes in charge
from different modifications may be additive or subtractive, IEC becomes
even more complex and the overall resolution of individual variants is
likely to be lost. This is particularly a matter of concern for important
large proteins, such as mAbs, for which their characterisation poses many
challenges for therapeutic use in humans. For example, Rozhkova
showed that even a 3% change in the pH of eluents or the

Chapter 1
7
Figure 1.1: The sensitivity of CEX chromatography into the eluent pH (A) and
the eluent concentration (B) in analysis of an mAb sample treated with
Carboxypeptidase B prior to analysis (reprinted with permission from Ref. [21]).
concentration of strong eluent during cation‐exchange (CEX)
chromatography of a recombinant humanised mAb resulted in a
significant shift in retention times (> 5 min) and also loss in resolution, as
a result of co‐elution of some species (see Figure 1.1) [21].
Internal pH‐gradient or chromatofocusing (CF) is an IEC
technique developed by Sluyterman and co‐workers in the late 1970s for
pH‐based separation of proteins [27‐31]. The technique most commonly
utilises the buffering capacity of a weak‐anion exchange (WAX) column
to generate a (preferably) linear pH gradient inside the column. The
column is equilibrated with a high pH buffer (equilibrating buffer),
followed by loading of a protein sample. Retained proteins are then
eluted in the order of their apparent isoelectric points (pIapp), which are in
general close to their actual isoelectric points (pI), upon a step change to a

Chapter 1
8
second buffer (focusing buffer) of lower pH. To obtain a linear pH
gradient over a wide pH range (and hence larger peak capacity), the
buffers traditionally contain mixtures of polyampholytes with a wide
range of pKa values to produce an even buffering capacity over the
chosen pH range.
As the focusing buffer descends through the column, various
ampholyte components bind differentially to the stationary phase
developing an internally retained pH gradient. Consequently, the protein
is sequentially eluted from the stationary phase when the pH of the
focusing buffer is slightly higher than the protein pI and is retained again
when the buffer pH falls slightly below the pI [30]. This progressive
titration of the stationary phase causes focusing of the protein band and
generally results in high resolution separation of proteins when
compared to salt gradient IEC [32, 33]. This approach, however, suffers
from some limitations. Polyampholyte buffers tend to be expensive and
due to the way they are manufactured, tend to exhibit batch‐to‐batch
irreproducibility in composition [34, 35]. They are difficult to remove
from isolated proteins due to the formation of association complexes, and
also exhibit high UV absorption [32]. These limitations were addressed by
a number of workers who investigated the use of a simple mixture of
buffer species in the focusing buffer. Frey and his co‐workers [23, 34, 36,
37] developed a model to accurately predict the separation in CF using
buffers composed of only simple mixtures of amine buffering species for
covering the desired pH range. Using this model, an optimised buffer
composition was predicted to produce a linear pH gradient over a wide

Chapter 1
9
pH range of 9.5 to 5.5 inside a diethylaminoethyl (DEAE)‐WAX column.
This buffer was composed of 2.4 mM Tris, 1.5 mM imidazole and 11.6
mM piperazine and demonstrated very good agreement between
predicted and experimentally measured pH profiles. The performance of
this buffer system was also demonstrated by CF separation of human
hemoglobins A° and S1 variants, and equine myoglobin [36].
An alternative to CF is the external pH‐gradient approach
proposed by Anderson et al. [33, 35, 38, 39] which utilises pump
proportioning to generate a pH gradient prior to the column with
minimal buffering capacity. Buffers are composed of simple amine
species that have their pKa values evenly distributed over the desired pH
range. Under such conditions, the contribution from the column itself to
the delay of the pH‐gradient is minimal, which allows for easier method
development and optimisation, since the slope and profile of the pH
gradient can be controlled by the pump with less dependence on column
chemistry [17, 32].
pH‐based IEC was employed by some workers for isolation of
antibodies from biological samples. Waldrep and Schulte [40] employed a
step pH gradient and a DEAE column for fractionation of four
immunoglobulin G (IgG) subclasses (IgG1‐4). A descending pH gradient
was established from 9 to 6 using 20 mM Tris‐acetate buffer. Buffers
covering a wider pH range (3.8‐10) were developed by Ahmed et al. [16]
for selective isolation of a mAb from hybridoma cell culture supernatant.

Chapter 1
10
Buffers were composed of 20 mM each of citric acid, sodium phosphate,
Bicine, and N‐Cyclohexyl‐2‐aminoethanesulfonic acid (CHES).
Profiling the charge‐related heterogeneity of proteins, including
mAbs, is one of the important applications of IEC. MAbs have gained
significant attention as potential therapeutics due to their qualities, such
as high degree of specificity in binding to target antigens, ability to
initiate immune response to the target antigen and long serum
persistence, which reduces the need for frequent dosing [41, 42]. For
biopharmaceutical development, product consistency and long shelf life
are important factors that provide flexibility in manufacturing. During
manufacture, various forms of microheterogeneity in an antibody’s size
or charge can occur due to enzymatic processes or spontaneous
degradation and modifications, including for example, deamidation,
oxidation, isomerisation and fragmentation [43]. Almost all of these
changes can alter the surface charge properties of the antibody either
directly by changing the number of charged groups or indirectly by
introducing structural alterations [42]. These variants need to be
characterised, for example, for quality control purposes or improving
formulations in order to minimise further degradation during storage of
the purified antibody. While conventional salt gradient IEC is generally
product‐specific, i.e., requires several method parameters to be optimised
for each individual antibody [44], recent reports on pH‐based separation
of mAbs have demonstrated the required multi‐productivity, high‐
resolution and robustness against variations in sample matrix salt
concentration and pH [17, 21, 44].

Chapter 1
11
Figure 1.2: pH gradient CEX chromatography of a mAb sample using Dionex®
particulate packed columns containing WCX or SCX chemistry (reprinted from
Ref. [17]).
Farnan and Moreno [17] demonstrated a high‐resolution
separation of charge heterogeneity in a series of intact mAbs having pI
values from 7.3 to 9.1 using a buffer system that originally was optimised
by Kang and Frey [34] for CF of proteins (see Figure 1.2). Interestingly,
while the buffer composition had been optimised for WAX chemistry
under CF mode, an ascending gradient of buffers mixed externally and
delivered into a ProPac WCX column also demonstrated a pH profile
with the same linearity over a pH range of 6 to 9.5. The method was also
validated following industry standard validation practices and
demonstrated good robustness and precision being independent of
sample matrix and composition [44].

Chapter 1
12
Due to the large size of antibodies, suitable chromatographic
resolution is usually hard to achieve. Generation of Fab and Fc fragments
by papain digestion has been used to simplify the separation [42].
Regnier and co‐workers used a strong CEX column for purification of Fab
fragments (pI values 5.4, 5.5 and 5.8) generated from the papain digestion
of an anti‐cortisol IgG2B antibody [45]. Protein isoforms were separated
by running a pH gradient from pH 4.5 to 6.4 generated using 10 mM N‐
Cyclohexyl‐2‐aminoethanesulfonic acid (MES). Despite incomplete
resolution of the isoforms, up to 90% purity was determined for the
collected fractions analysed by capillary electrophoresis (CE).
Analysis of individual fragments also allows determination of the
location where heterogeneity has happened in the antibody. Typically,
enzymatic digestion of the antibody followed by analysis of the resulting
peptide fragments by liquid chromatography‐mass spectrometry (LC‐
MS), referred to as peptide mapping, is performed to identify the
modification. MS/MS study can also be performed to identify the precise
position of the modification within the peptide [25, 42, 46]. As an
example, a new form of mAb cysteine‐related heterogeneity in the hinge
region of an IgG2 was discovered by fractionation of an antibody sample
using AEX chromatography followed by enzymatic digestion of fractions
resulting in C‐terminal lysine (Lys‐C) variants [47]. MS/MS experiments
uncovered the replacement of up to two disulfide bridges with a similar
number of trisulfides in the antibody hinge region. AEX chromatography
was performed on a ProPac WAX‐10 column by running a pH gradient
elution with a buffer system consisting of 2.4 mM 3‐(N‐

Chapter 1
13
morpholino)propanesulfonic acid (MOPS), 1.4 mM imidazole and 11.6
mM piperazine at pH 7 and 5.5 as eluents A and B, respectively.
The external pH gradient approach also benefits from the
flexibility in using a wide spectrum of buffer species. While mostly
amine‐based species are usually used as buffer components, the
feasibility of common inorganic buffer species such as phosphate for pH‐
based separations of proteins has been also demonstrated by some
workers. Different Lys‐C variants generated via various enzymatic
digestion methods in a recombinant mAb (human anti‐tumour necrosis
factor mAb D2E7) were successfully resolved using a ProPac WCX‐10
column and a typical eluent composition used in CEX chromatography of
proteins at different pH [48]. Accordingly, 10 mM phosphate buffer pH
7.5 was used as eluent A and 500 mM NaCl in 10 mM phosphate buffer
pH 5.5 as eluent B. This system actually took advantage of combining
both salt and pH gradient approaches. Capillary isoelectric focusing
(cIEF) and LC‐MS analysis were also performed for further
characterisation of deglycosylated and reduced antibody fractions
collected from CEX chromatography. More recently, Rozhkova
demonstrated that resolving Lys‐C variants with the same column
chemistry is also feasible in the absence of a NaCl gradient [21]. Instead,
the ionic strength of buffers was kept constant by adding 60 mM NaCl to
both eluents (10 mM phosphate) and the pH gradient was established in
a very narrow pH range of 6.7 to 7.5. For comparison, separation was also
carried out under the salt gradient approach. Unlike the pH gradient,
minor changes in phosphate buffer pH (± 0.2 pH unit) or NaCl

Chapter 1
14
concentration in eluent B (± 5 mM) caused catastrophic effects on
separation efficiency and resolution.
1.3 Monolithic columns: preparation and applications
To a great extent, the remarkable success of HPLC in
bioseparations has been achieved as a result of advances in column
technology centred mostly on increasing the separation capacity,
enhancing the detection sensitivity and increasing the analysis
throughput [49]. While particle packed‐columns traditionally represent
the most commonly used media in HPLC, their application for separation
of macromolecules is particularly limited due to the slow diffusional
mass transfer into the mobile phase presented in the pores of beads and
also into the void between the packed particles [50]. Another limitation of
packed‐beads can be seen in high‐throughput macro‐ and nano‐scale
separations [49]. According to Gidding’s theory [51], resolution,
efficiency and throughput of a separation in such scales benefit from sub‐
micrometre sized particles (< 2 μm). However, both preparation and
application of these columns demand extraordinarily high back‐pressures
and necessitate employing costly equipment such as ultra‐high pressure
liquid chromatography (UHPLC) systems. These challenges have been
well‐addressed through recent advances in column technology, such as
core‐shell technology and also the development of a new generation of
HPLC columns, namely monolithic columns (for which their preparation
for bioanalysis is the main focus of the present study).

Chapter 1
15
Separation using conventional packed columns is inherently slow
due to the diffusional constraints, as they exhibit a rapid reduction in
resolution and separation capacity with increasing eluent velocity [50].
On the other hand, the efficient isolation of labile biomolecules requires a
fast and reliable separation process working under mild conditions in
order to decrease losses due to biomolecule degradation.
Monolithic materials are characterised by their numerous
interconnected cavities (pores) of different sizes and their structural
rigidity which is secured through extensive crosslinking. Although the
contribution of mobile phase in mass transfer (Cm term in the Van
Deemter equation) of small molecules in monoliths is generally larger
than that of packed columns, in the case of large molecules such as
proteins, the Cm would be predominantly convective, rather than
diffusive like particulate sorbents, and therefore prevents loss in
separation efficiency at higher flow‐rates [50, 52‐54]. However, while for
packed columns an increase in efficiency can be achieved by using
particles of smaller size, the efficiency of monolithic stationary phases‐
particularly in separation of small molecules‐can be maximised by
optimising the domain size, i.e., the combined average size of the
macropores and microglobules. The smaller domain size is favourable as
it improves the efficiency by minimising both the C‐term and the Eddy
dispersion (the A term in the Van Deemter equation) [55].
Such a porous structure can be created from inorganic precursors,
resulting in bimodal silica‐based materials. Typical features

Chapter 1
16
characterising this kind of monolith are a bicontinuous skeleton
comprising flow‐through pores or macropores (typically ~ 2 μm in size),
along with skeletal pores or mesopores (typically 2‐50 nm). Such a pore
distribution provides a typical surface area around 300 m2/g, depending
on the preparation conditions [53]. Silica‐based monoliths have proved to
be well‐suited for the separation of small molecules where their high
surface area provides adequate retention for desired efficiency and
selectivity. While quite successful for small molecule separations, the
application of silica‐based monoliths for efficient separation of large
molecules is limited owing to the restricted diffusion of solutes into the
monolith mesopores [56]. Other issues associated with silica‐based
monoliths include the radial inhomogeneity (comparable to the level seen
in polymer monoliths), their limited pH tolerance, complicated and
sensitive production procedures, and the limited number of monomers
and solvents available for their preparation [53, 57].
Polymeric monoliths are the other main category of monolith
materials developed in the late 1980s and early 1990s [58, 59]. From the
very beginning this type of monoliths has proven to be well suited for the
(fast) separation of proteins [59‐61]. Simple and single step preparation
from a wide variety of monomers also enables application of polymeric
monoliths to be far beyond chromatographic demands in areas, such as
microfluidics, preconcentration and solid‐phase extraction units as well
as catalytic supports [62‐68].

Chapter 1
17
Polymeric monoliths are usually prepared via a free radical
polymerisation reaction from a mixture of initiator, monomers (including
crosslinking monomer) and pore‐forming solvents (porogens) that are
polymerised in situ in a mould, for example a tube, capillary or the
channels of a microfluidic device. A binary mixture of solvents is
typically used as porogen to allow tuning of porous properties and
morphology of the monolith. The type of initiator is also chosen in
accordance with the fashion that the polymerisation reaction is triggered,
which is usually thermal or photo‐initiation [69].
Since their emergence about two decades ago, monolithic columns
have been extensively investigated by many researchers leading to a
significant impact of this concept on separation science [66]. The vast
variety of methods enabling the preparation of monoliths as well as the
wide spectrum of their applications has been well documented in
numerous reviews, eg. see [53, 57, 66, 69‐72]. Very recently, we also
summarised in a review the recent developments in the preparation of
polymeric monoliths for liquid chromatography of large molecules [73].
Therefore here, one important aspect of polymeric monoliths in
bioseparations that has captured less attention, i.e., biocompatibility, is
discussed with the focus on IEC as one of the most commonly used
HPLC modes for bioseparation.

Chapter 1
18
1.3.1 Biocompatibility in monoliths for bioseparation
The concept of biocompatibility has been transferred to
chromatographic stationary phases, such as monoliths, by Li and Lee in
2009 [74]. According to their definition “a biocompatible stationary phase
is a material that resists against non‐specific adsorption of biomolecules
(including peptides and proteins) and does not interact with them in a
way that would alter or destroy their structures or biomedical functions.”
The type of non‐specific interactions actually depends on the mode
of chromatography employed. For example, while protein denaturation is
a common issue in RPLC of proteins due to the strong hydrophobic
interactions involved [74], HIC of proteins is based on the same kind of
interactions but with such a low strength that proteins are preserved in
their native conformations. This is achieved by utilising mild eluents
containing a high concentration of salts (in the absence of organic
solvents) and a lower density of bonded ligands (typically 50‐1000 mM)
[75]. On the other hand, hydrophobic interaction is recognised as a non‐
specific interaction in IEC where denaturation is likely to occur once
secondary interactions between hydrophobic patches of the protein and
the stationary phase are stronger than electrostatic interactions involved
in IEC [7]. Nevertheless, the existence of mixed‐mode effects may provide
a wider range of selectivity than that which can be achieved with a single
chemistry [76].

Chapter 1
19
The removal of non‐specific hydrophobic interactions may be
necessary in order to 1) obtain good mass recovery with preserved
bioactivity, 2) gain predictable elution behaviour for solutes (which
facilitates method optimisation), and 3) avoid slow adsorption‐desorption
kinetics that lead to significant band broadening [74]. Hydrophilicity of
IEC stationary phases is also important from the viewpoint of
multidimensional LC setup. IEC followed by RPLC is the most widely
used 2D LC. For this combination, negligible mixed‐mode interactions
(i.e., IEC and HIC) are desired. Otherwise, the resultant 2D LC is not
strictly orthogonal and the final overall peak capacity will be
compromised [77].
1.3.1.1 Polyacrylamide‐based monoliths
Soft gel materials such as crosslinked dextran, cellulose,
polyacrylamide, agarose and polysaccharides have been historically
known for low non‐specific interactions with peptides and proteins, and
are employed widely in gel electrophoresis and gel permeation
chromatography [74]. However, these inert polymers are too soft to be
used for HPLC.
Acrylamide (AAm) is a moderately hydrophilic monomer which is
typically polymerised with a cross‐linker to reinforce the required
rigidity into the structure of polymer. In fact, co‐polymerization of
hydrophilic functional monomers and cross‐linkers is a seemingly
straightforward approach to obtain biocompatible materials. The most

Chapter 1
20
common cross‐linker is N,N’‐methylenebisacrylamide (MBAA). This type
of monoliths serves generally as a platform for sample preparation or
affinity chromatography [72, 74]. For instance, poly(AAm‐co‐MBAA)
monolith was prepared by co‐polymerisation for potential use in the
separation of biopolymers, immobilisation of proteins and solid‐phase
extraction [78]. Palm and Novotny prepared a porous polymeric
monolith as a trypsin microreactor for fast peptide mapping by
copolymerisation of AAm, MBAA and N‐acryloxysuccinimide in an
electrolyte buffer containing polyethylene glycol (PEG) as a molecular
template [79]. The monolith featured high permeability and
biocompatibility.
1.3.1.2 Polymethacrylate‐based monoliths
Polyacrylate and polymethacrylate‐based monoliths represent the
largest and the most examined class of polymeric monoliths, due mainly
their suitability for separation of biopolymers, such as proteins and
polynucleotides as well as large particles, such as viruses [74, 80]. While
there are instances of polymethacrylate‐based monoliths for HIC [75, 81]
and SEC [82, 83] of proteins, this type of monoliths have been mostly
developed for RPLC and IEC applications. Recent advances in
polymethacrylate‐based monoliths for IEC of biomolecules are reviewed
below with the emphasis on biocompatibility (hydrophilicity) of
materials.

Chapter 1
21
Co‐polymerisation of hydrophilic functional monomers and cross‐
linkers is a seemingly straightforward approach to obtain biocompatible
materials. Compared to silica‐based monoliths, polymeric monoliths offer
the advantage that by choosing the right functional monomer, monoliths
for a variety of chromatographic purposes can be designed, such as for
improved biocompatibility. Following their efforts to prepare polymeric
monoliths with negligible non‐specific interactions, Lee’s group recently
prepared CEX monolithic columns containing phosphoric acid
functionality by co‐polymerisation of phosphoric acid 2‐hydroxyethyl
methacrylate (PAHEMA) and bis[2‐(methacryloyloxy)ethyl] phosphate
(BMEP), as functional monomers, with polyethylene glycol diacrylate
(PEGDA) and polyethylene glycol acrylate (PEGA) via photo‐initiated
polymerisation [84]. Monoliths with different extents of hydrophobicity
were obtained. While poly(BMEP‐co‐PEGA) showed the lowest
hydrophobicity in the series of columns prepared, the addition of 20%
(v/v) acetonitrile to the eluents was still required in order to lessen
hydrophobic interactions between natural peptides and the
poly(PAHEMA‐co‐PEGDA) monolith. However, these materials showed
less swelling and better permeability than the sulfonic acid‐containing
monoliths prepared previously by the same group [77, 85].
More promising results were obtained with homopolymerisation
of MAEP where retention times of peptides and peak capacity varied
only slightly with the addition of up to 20% (v/v) acetonitrile to the
eluents, suggesting negligible hydrophobic interaction between peptides
and the monolith [86]. Although using a single monomer makes the

Chapter 1
22
optimisation of polymerisation conditions easier and improves the
reproducibility of the synthesised monolith, careful selection of the
parameters involved in polymerisation is still required in order to ensure
acceptable rigidity and flow‐through properties of the prepared
materials. For example, it was shown that BMEP percentages lower than
26.8% (w/w) in the polymerisation mixture resulted in non‐rigid
materials, whereas non‐porous materials were obtained for amounts
higher than 31.8%. Also, an increase in UV exposure time from 2 to 5 min
revealed no marked influence on the conversion of BMEP, while a further
increase to 10 min increased the conversion, as indicated by a 33%
increment in dynamic binding capacity (DBC) value to 72.7 mg lysozyme
per mL of column volume [86].
In another study, poly(2‐carboxyethyl acrylate‐co‐poly(ethylene
glycol) diacrylate) was prepared by photo‐initiated polymerisation for
WCX chromatography of peptides and proteins [9]. While eluent pH has
a negligible effect on the ionisation of strong ion‐exchangers, it affects the
extent of ionisation of weak ion‐exchange functionalities, thus providing
more opportunities to control selectivity and separation efficiency. Using
the prepared column, baseline separation of a mixture of protein
standards was obtained without the addition of organic solvents to the
eluent. However, a further increase in the content of ethylether as a
macropore‐forming porogen caused an increase in the hydrophobicity of
the monolith obtained. The authors also aimed to introduce more
carboxylic acid groups on the surface of the monolith by increasing the
ratio of functional monomer to cross‐linker, while keeping the porogen

Chapter 1
23
composition constant in the optimised recipe. Although a 50% increase in
DBC was measured by this change, substantial hydrophobic interactions
were again demonstrated by co‐elution of proteins and significant tailing
of the lysozyme peak. Interestingly, the opposite trends were observed in
their earlier report [84] where an approximately tenfold decrease in DBC
was measured by increasing the percentage of the functional monomer,
BMEP, in the monomer mixture from 30 to 70%. This confirms again that
the functionality obtained at the surface of monoliths synthesised by co‐
polymerisation is difficult to predict and careful characterisation of the
materials is necessary [87].
1.3.1.2.1 Post‐polymerisation modification
Post‐polymerisation modification is another approach to obtaining
functional monoliths for IEC. In contrast to the co‐polymerisation
method, the porous properties of a generic monolith can be optimised
independently from the modification of surface chemistry, thereby
enabling the preparation of numerous chemistries from the same support
monolith [88]. Among others, glycidyl methacrylate (GMA)‐based
monoliths have been widely used for incorporating different
functionalities through the epoxy group, which reacts readily with
various reagents containing, for example, amine [89, 90] or thiol groups
[91]. While there are several reports (see, eg. [60]) on the synthesis of
WAX columns via reaction of surface epoxy groups with amines like
diethylamide (DEA), less effort has been made to prepare the SAX ones.
In one report, quaternary amine functionalities were incorporated into a

Chapter 1
24
poly(GMA‐co‐DVB) monolith in a two‐step reaction involving the ring‐
opening of the epoxy group with DEA followed by the alkylation of the
resultant tertiary amine with diethyl sulfate [92]. Recently, a systematic
study on the parameters affecting the modification reaction of
poly(GMA‐co‐EDMA) monolith with DEA and triethylamine (TEA) was
conducted by Bruchet et al. [93]. Their results indicated that while 96% of
the epoxy groups were converted to tertiary amine functionality after an
8 h reaction in pure DEA at 65 °C, conversion efficiency did not exceed
more than 68%, even at 85 °C for the reaction with pure TEA.
Subsequently, a significant improvement in reaction efficiency was
obtained by the addition of a protic solvent to the reaction. Over 90%
transformation to quaternary amine was finally achieved using TEA
dissolved in 50% (v/v) aqueous ethanol after 4 h reaction at 85°C.
Increasing the reaction time from 4 to 8 h and the amine concentration in
aqueous ethanol from 10 to 50% (v/v) showed no further enhancement in
the reaction yield. The loading capacity of 10.9 ng/cm was also measured
for the SAX capillary column obtained using the breakthrough curves of
DNA in a salmon sperm solution (100 ng/μL).
Post‐polymerisation modification also enables tailoring the
hydrophilicity of the materials. For example, a fairly good transformation
of surface chemistry from highly hydrophobic into hydrophilic in
styrenic‐based materials, such as poly(chloromethylstyrene)‐co‐
divinylbenzene was successfully performed through a two‐step
modification process comprising of a reaction with ethylenediamine
followed by γ‐gluconolactone [61]. The modified column exhibited

Chapter 1
25
comparable hydrophilicity to a poly(GMA‐co‐EDMA) bead after
complete hydrolysis of its epoxy groups to diols. To achieve an increase
in hydrophilicity, Ott et al. [63] modified the surface of their epoxy‐based
monolith with a hydrophilic poly(ethyleneglycol) diamine (2k Da) via a
multi‐step approach. The remaining epoxy groups of the generic
monolith were first acid‐hydrolysed to hydroxyl groups prior to the
reaction with 3‐glycidyloxypropyltrimethoxysilane. The silanisation
reaction was conducted for 1 h at room temperature. The column was
then filled with the polymer and incubated at 55 °C overnight in order to
afford a hydrophilic coating.
Svec’s group developed a UV‐initiated photografting approach for
the surface hydrophilisation of their classic poly(GMA‐co‐EDMA)
monolith, which exhibits significant non‐specific interactions with
proteins even after a complete hydrolysis of residual epoxide groups to
2,3‐dihydroxypropyl functionalities [94]. This undesired adsorption was
largely avoided by photografting of a hydrophilic monomer,
poly(ethylene glycol) methacrylate (PEGMA, 6 ethylene glycol units),
onto the pore surface of poly(2,3‐dihydroxypropyl methacrylate‐co‐
ethylene dimethacrylate).
1.3.1.2.2 Surface functionalisation with nanoparticles
Introduced by Hilder et al. in 2004 [95], functionalisation of the
pore surface with nanoparticles is the latest technique for tailoring the
surface characteristics of monoliths. Nanoparticles can offer numerous

Chapter 1
26
advantages; for example, their large surface‐to‐volume ratio can
potentially enhance separation efficiency [96]. Very efficient separations
were also reported with agglomerated latex ion‐exchangers, owing to the
existence of short diffusional paths, which leads to enhanced mass
transfer [97]. This was the rationale behind Thayer et al. work who used a
ProSwiftTM SCX‐1S (4.6 mm × 50 mm) monolith column for surface
modification [98]. A dilute aqueous solution of pellicular AEX nanobeads
(DNAPac PA200) was pumped through the column until break through
was observed. The nanobead‐coated monolith exhibited a further
increase in monolith capacity and mass transfer, along with
chromatographic behaviour typical of pellicular phases. The nanobead
coating improved separation selectivity and helped control tailing and
band broadening associated with hydrophobic interactions when
compared to porous bead phases. In addition, the monolith showed
separation of derivatized oligonucleotides from their unlabeled parents,
and the ability to resolve several isobaric RNA linkage isomers, as well as
phosphorothioate diastereoisomers in DNA and RNA.
By taking advantage of the well‐known affinity of gold toward the
amino and thiol functionalities, Svec’s group has recently utilised gold
nanoparticles (GNPs) for the modification of poly(GMA‐co‐EDMA)
monoliths. In one study they modified the surface of a monolithic
capillary column with cystamine followed by immobilisation of GNPs to
incorporate a new chemistry for the selective isolation of peptides
containing cysteine [99]. The GNPs were held firmly onto the surface of
the monolith by stable multivalent linkages that prevented them from

Chapter 1
27
being washed out from the column, even when the eluent contains
competing thiol‐containing compounds.
In an extension of this surface modification the dynamic nature of
the bond between gold and thiol groups has been exploited to tailor the
surface chemistry through the binding of a variety of “exchangeable” thiol‐
containing moieties, introducing the concept of monoliths with
exchangeable chemistries [90]. Surface modification of the monolith was
conducted by pumping a 2.5 mol/L cysteamine solution through the
capillary column at a flow‐rate of 1 μL/min for 30 min at room
temperature, affording a monolith with 1.05 mmol/g thiol groups. Two
approaches were examined for incorporation of GNPs: 1) in situ
preparation via reduction of chloroauric acid using sodium citrate, which
resulted in 15.37 atom % of gold with 40‐50 nm in size, 2) modification via
pumping a solution (1.4 × 10¹² particles/mL) of commercially available
preformed nanoparticles (15 nm) on to the thiol rich pore surface of the
modified monolith. Although slower than the in situ formation of GNPs,
this approach was simpler and provided a much higher content of GNPs.
Capillary columns with reversed‐phase and ion‐exchange functionalities
were then obtained by flushing the GNP‐containing monoliths with 1‐
octadecanethiol and sodium‐2‐mercaptoethanesulfonate, respectively,
and examined for the rapid separation of a standard protein mixture.

Chapter 1
28
1.3.1.3 Epoxy‐based monoliths
It is well accepted that free‐radical cross‐linking
(co)polymerisations inherently lead to heterogeneous polymers [53, 100,
101], given that the cross‐linker has at least two vinyl groups. By
assuming equal vinyl group reactivity, it is reasonable to expect the rate
of consumption of the cross‐linker is twice than that of the monovinyl
monomer [53, 102]. Consequently, the cross‐linker molecules are
incorporated into the growing copolymer chains much more rapidly than
the monomer molecules forming highly cross‐linked nuclei in the early
stages of the polymerisation reactions [103]. The high degree of cross‐
linking in the nuclei leads to a rapid phase separation of the polymer
formed in poor porogenic solvents and a gradual coarsening of the
monolith structure which results in some degree of structural
heterogeneity [53, 104].
While free radical polymerisation utilising vinyl or (meth)acrylate
monomers is the most commonly used method for the preparation of
monoliths, some attempts have also been made to investigate other
polymerisation systems, such as polycondensation. Unlike chain growth
polymerisation methods, such as free radical polymerisation,
polycondensation is a step growth polymerisation and features repeated
activation of the chain end, thus allowing for homogenous growth of all
polymer chains in the system no matter how long they are [66]. Typically
in this approach, highly ordered 3D structures are created homogenously
via phase separation polymerisation of epoxy monomers and amine

Chapter 1
29
Figure 1.3: HIC separation of protein standards using a polyNIPAAm‐grafted E‐
51 epoxy‐based monolith (4.6 mm ×100 mm i.d.; reprinted from Ref. [105]).
curing agents in PEG as pore‐forming solvent [104, 106]. Also, oxygen is
not detrimental to these reactions, so careful de‐aeration of the
polymerisation solution is not necessary. The morphology of monoliths
can be tailored by the mole ratio of epoxy to curing agent, the percentage
and molecular weight (MW) of (polymeric) porogen and the
polymerisation temperature. Of special interest is that monoliths
derivedfrom this approach possess inherent hydrophilicity arising from
the incorporation of heteroatoms into the main polymer chains [107, 108].
These materials also afford the possibility of modifications through
surface hydroxyl and amino groups generated after curing, as well as
residual epoxy groups. The applicability of surface modification of
epoxy‐based monoliths through hydroxyl groups was demonstrated by

Chapter 1
30
Xin et al. [105]. The support monolith was prepared in a 100 mm × 4.6 mm
i.d. stainless steel column by polycondensation of E‐51 epoxy resin with
4,4ʹ‐methylene‐bis‐cyclohexylamine (NIPAAm) dissolved in a porogen
system comprising DMF/PEG‐200 (1/9 w/w). Polymerisation was
performed at 80 °C for 12 h. The resultant monolith possessed
hydrophobic properties stemming from aromatic moieties of epoxy resin
as well as the hydrocarbon skeleton of the amine. Intended to be used for
HIC of proteins (see Figure 1.3), a “grafting from” approach was then
carried out in order to reinforce even further hydrophobicity into the
monolith via surface‐initiated atom transfer radical polymerisation
(ATRP) of N‐isopropylacrylamide.
The synthesis of epoxy‐based monolithic capillary columns having
weak ion‐exchange functionality from polycondensation of tris(2,3‐
epoxypropyl)isocyanurate (TEPIC, 18%) and tris(2‐aminoethyl)amine
(2%) dissolved in PEG‐200 (80%) has been reported recently and used for
profiling of intact glycoprotein isoforms [109]. The polymerisation
reaction was conducted at 80 °C for 12 h. The monolith exhibited
relatively large through‐pores of about 3‐6 μm and a specific surface area
of 4.1 m2/g, which like other epoxy‐based monoliths indicated the
nonporous skeleton of materials in the dry state [66]. The ion‐exchange
functionality of the synthesised monolith originated from the residual
primary amine groups present and the amine functionality introduced by
the ring opening reaction of the residual epoxy groups. The post‐
modification reaction was conducted by pumping an aqueous solution of
ammonia (50% v/v) through the capillary column at 60 °C for 48 h. The

Chapter 1
31
ion‐exchange capacity measured by frontal analysis of bovine serum
albumin was only 1.3 mg/mL. The authors ascribed such a limited
capacity to the low specific surface area of the material as well as the
short spacer arm between the amine functionalities and the support
monolith. The performance of the monolithic column prepared for
resolving glycoprotein isoforms was also compared with a CE method.
While CE exhibited superior resolution, more isoforms were detected in
IEC.
While hydrophilicity of epoxy‐based monoliths has made them
suitable for separation of biomolecules with minimal non‐specific
interactions, the homogeneity of their structure, which has a root in their
method of polymerisation, can be exploited for addressing the limitations
associated with polymeric monoliths for the separation of small
molecules. Such a limitation is raised from the structural heterogeneity of
polymer monoliths prepared with conventional free‐radical cross‐linking
polymerisations and is associated with the less cross‐linked layer
generated on the top of the first layer (highly cross‐linked layer)
possessing pore sizes of 2‐4 nm in the swollen state [53]. While these
pores are inaccessible for proteins with nanometres in size, small
molecules permeate the gel porosity region and, depending on their size,
have different penetration depths in the polymer gel structure,
suggesting the mass transport to be diffusive rather than convective [53].
One immediate consequence of such phenomena is chromatographic
dispersion of solutes in the gel structure, thereby reducing separation
efficiency of small molecules [53, 110].
Chapter 1
32
The suitability of epoxy‐based monoliths for the separation of
small molecules was demonstrated by Hosoya et al. utilising capillary
columns prepared from the polycondensation of tris‐(2,3‐epoxypropyl)
isocyanurate [104], or alternatively, 1,3‐bis(N, N’‐diglycidylaminomethyl)
cyclohexane [111] as the epoxide‐containing monomer with 4‐[(4‐
aminocyclohexyl)methyl] cyclohexylamine (BACM) as the amine curing
agent. Depending on the content of acetonitrile (ACN) in the aqueous
mobile phase, columns were operated in both HILIC and RPLC modes,
respectively for the separation of nucleic acid bases and nucleosides, and
alkylbenzenes. These columns exhibited high permeability and up to
133,000 theoretical plates per metre (N/m) for alkylbenzenes.
1.3.2 Polymeric monolithic columns in proteomics research
Proteomics research aiming to investigate proteins released from
gene expression in a cell, tissue or body fluids is of great importance, yet
extraordinarily challenging due to the great dynamic range in the
abundance of proteins [49].
Top‐down and bottom‐up are two common strategies applied in
proteomics study. In the top‐down strategy, proteins are separated by
two‐dimensional electrophoresis (2DE), followed by identification with
tandem mass spectrometry (MS/MS). Although 2DE has great capacity
for protein separation and is known as the most frequently used
technique for protein quantification in clinical samples [112], it suffers
from inherent limitations in the separation and detection of low

Chapter 1
33
abundance proteins, membrane proteins, and proteins with extreme pI
values and MW [49, 112]. Alternatively in recent years, more attention
has been focused on the bottom‐up proteomic strategy in which proteins
are generally digested into peptides. Separation of peptides by one or 2D
macro‐ or nano‐LC is then followed by on‐line MS/MS analysis and data
processing [112]. This combination, when performed by employing
capillary columns packed with sub‐micrometre sized particles (< 2 μm),
offers advantages to the analysis, such as high resolution and sensitivity
as well as high peak capacity and throughput, but also with
commensurate increase in the column back‐pressure necessitating the
employment of UHPLC technologies.
As an example, theoretical peak capacities (Cp) of up to 1,000 were
reported by Shen et al. [113] using a 87 cm long capillary column (14.9–
74.5 μm i.d.) packed with 3 μm C18‐bonded porous silica particles under a
pressure of 18,000 psi. The column was successfully coupled to a hybrid
quadrupole time‐of‐flight (Q‐TOF) MS via a nano‐electrospray ionisation
(nano‐ESI) interface for the analysis of proteolytic polypeptide mixtures.
In order to further increase the peak capacity, Tao et al. [114] connected
several short micro‐columns in series by using zero dead‐volume unions,
and identified 1,692 proteins in a protein digest extracted from a rat
brain, but through a long analysis time of 6.8 h.
Although typical bottom‐up LC techniques with particulate
columns appear to be well‐suited for the current demands on separation
efficiency, further improvements in the resolving power in a reasonable

Chapter 1
34
analysis time with the current technology might appear as a real
challenge in the near future. According to Giddings’ theory [115], to
achieve Cps over 1,500 with a 200 cm column packed with 3 μm particles,
the predicted separation time should be about 2,000 min, which is
practically unreasonable to achieve. The packing of capillary columns is
also not easy and requires a highly skilled worker because of the small
particle sizes and small internal diameter of capillaries. Additional
drawbacks include the need for retaining frits and specially designed
pumps and accessories for delivering ultra‐high pressures.
In the meantime, many efforts in column technology in recent
years have also been devoted to developing monolith materials and this
continues as an active area of research. By offering features, such as faster
mass transfer (for large molecules, such as proteins), lower back‐pressure,
and easy preparation, employing monolith materials for routine
applications has already come to play. Miniaturisation has also appeared
as one area in which technologies based on particulate materials have
started to fall behind their monolithic counterparts [72]. Along with the
distinct advantages of the capillary column format, including the low
consumption of both sample and solvents and a reduction in the peak
broadening resulting from radial diffusion, an additional reduction in the
size of capillary columns is particularly attractive for further
improvement in the sensitivity of MS detection as sensitivity increases
with the inverse square of the column diameter [116]. Such sensitivity
improvements become more and more important for the separation and
identification of complex samples, particularly in areas, such as

Chapter 1
35
proteomics. While the current generation of commercial packed capillary
columns generally has inner diameters in the range of 75 to 100 μm,
packing smaller capillaries appears as a significant challenge [117].
In situ preparation of polymer‐based monolithic stationary phases
from liquid precursors provides a viable alternative to address this
challenge as well. As a very good example, Karger and co‐workers
prepared a 20 μm i.d. poly(styrene‐co‐divinylbenzene) (PS‐co‐DVB)
monolithic capillary columns to improve the detection sensitivity in LC‐
MS/MS analysis of peptides in a tryptic digest mixture [118]. Efficiencies
(N/m) over 100,000 were achieved with optimised polymerisation and
separation conditions. High mass sensitivity (~ 10 amol of peptides) in the
MS and MS/MS modes using an ion trap MS was found with a factor of
up to 20‐fold improvement over a 75 μm column. As an extension of this
work, large digested peptide fragments up to 10 kDa (e.g., from lysyl
endopeptidase digestion) with or without modifications were well
separated using 20 and 50 μm i.d. columns [119]. Importantly, the
macroporous structure of the monolithic columns facilitated mass
transport of large peptides with improved recovery relative to small pore
size RP packings. High sequence coverage (>95%), including
identification of phosphorylated and glycosylated particles, was achieved
for β‐casein using the 20 μm i.d. monolithic column. For peptides with
greater ionization efficiency, detection limits as low as 400 zmol was
obtained. Also their system demonstrated a typical peak capacity of ~ 200
for a 10 cm column.

Chapter 1
36
Among all polymer monoliths, styrenic and methacrylate‐based
monoliths are more frequently used for proteomics applications. In one
recent review Rozenbrand and van Bennekom summarised some recent
applications of polymer monoliths, together with silica‐based monoliths,
in proteomics [52]. Along with PS‐co‐DVB monoliths which represent the
most commonly used polymer monoliths for RP applications,
methacrylate‐based monoliths with RP chemistry can also be prepared,
for example, by alkylation of the well‐established poly(GMA‐co‐EDMA)
monoliths [120], or alternatively by co‐polymerisation of hydrophobic
monomers , such as lauryl methacrylate (LMA) with a cross‐linker. In one
study, Moravcova et al. [121] prepared a very short (3 cm × 320 μm i.d.)
poly(LMA‐co‐EDMA) capillary column for desalination,
preconcentration, and separation of peptides from a bovine serum
albumin (BSA) digest and an in‐gel digest of Hordeum vulgare. Fractions
were collected on MALDI target spots and analysed using TOF‐MS. The
sequence coverage for BSA increased from 17%, when no separation was
performed, to 63%; and for H. vulgare, the 14 kDa spot revealed 16
proteins, approximately four times higher in comparison to the analysis
without separation.
Polymer monoliths with chemistries other than RP have also been
developed for proteomics applications, particularly in multidimensional
(MD) separations. Given that the peak capacity of a MD system is
theoretically the product of the peak capacity of each orthogonal
dimension [115], combining two or even more orthogonal (multimodal)
separation procedures will dramatically improve the overall separation

Chapter 1
37
power and result in a much larger number of identified peptides [122]. In
one report, a 150 μm i.d. capillary monolithic column with a SCX
chemistry was prepared by co‐polymerization of ethylene glycol
methacrylate phosphate and bisacrylamide in a ternary porogenic solvent
consisting of dimethylsulfoxide, dodecanol, and N,Nʹ‐
dimethylformamide [123]. The column exhibited higher DBC, faster
kinetic adsorption of peptides, and more than 10 times higher
permeability than the column packed with commercially available SCX
particles. The column then served as a trap column prior to an RP column
in a nano‐flow LC‐MS/MS system for automated sample injection and on‐
line MD separation. Analysis of 19 μg of the tryptic digest of yeast
proteins enabled identification of 1522 distinct proteins from 5608 unique
peptides (total of 54,780 peptides) at a false positive rate of only 0.46%.
Zou and co‐workers [112] developed a fully automated 2D system
with integration of a RP‐SCX biphasic trap column inserted prior to a
packed C18 column (12 cm × 75 μm i.d.). Their work was an extension of
so called multidimensional protein identification technology, originally
proposed by Yates and co‐workers [124], based on packing particles with
different chemistries in tandem in a single capillary, and is used widely
in proteome analysis. A polymeric monolith with SCX chemistry was
primarily prepared in a 7 cm long segment of the biphasic trap (14 cm ×
200 μm i.d.) column by in situ co‐polymerisation of ethylene glycol
methacrylate phosphate and methylene bis‐acrylamid, followed by
packing the other 7 cm long segment with C18 particles. Next, tryptic
digests of the protein samples extracted from hepatocellular carcinoma

Chapter 1
38
and normal liver tissues were loaded onto the RP segment of the biphasic
trap column and labelled with different types of isotope dimethyl
reagents in sequence. All the enriched peptides were then transferred to
the SCX segment of the biphasic column, followed by on‐line MD
separation via stepwise salt eluting of the peptides to a 15 cm‐long RP
separation column using a binary gradient for the μLC‐MS/MS analysis.
Comparing to conventional manual isotope labelling and off‐line
fractionation technologies, this system was fully automated and time‐
saving. Integration of a phosphate SCX monolith into the biphasic trap
column also allowed employing higher flow‐rates for more throughputs.
This system enabled quantification of over 1000 proteins through a 29 h
proteome analysis, with the possibility of increasing to 1700 proteins once
analysis time was extended to 63 h. After three replicate runs, 94
significantly up‐regulated and 249 significantly down‐regulated proteins
were successfully observed.
Introduced by Alpert in 1990 [125], HILIC is recognised as a
variant of normal‐phase LC (NPLC) in which a column with hydrophilic
chemistry is eluted with a mobile phase which is only 10 to 40% (v/v)
aqueous [126]. HILIC has been successfully applied for the separation of
a wide variety of polar solutes, including pharmaceuticals [127, 128],
carbohydrates [129], peptides and proteins [122, 125, 126, 130, 131] as well
as for the selective enrichment of glycopeptides and phosphopeptides in
proteomics applications [132, 133]. In HILIC, an increase in retention is
observed with increasing polarity or hydrophilicity of solutes, which is
opposite to the trend observed in RPLC. As a result, HILIC has good

Chapter 1
39
separation orthogonality to RPLC, enabling their integration into the MD
separation of complex mixtures.
In one study, Gilar et al. [134] analysed a mixture of approximately
200 peptides using different stationary phases, including SEC, HILIC,
SCX and RP at pH 2.6 and pH 10. HILIC was shown to have a separation
power superior to both SCX and SEC. The orthogonality of the stationary
phases was also determined by plotting the peptide retention times in
two dimensions against each other. Although this study was not
performed 2‐dimensionally, it was still able to exhibit more orthogonality
to RP for HILIC compared to SCX. This conclusion was further supported
by another study where an off‐line 2D HILIC‐RP system was designed
for separation of peptide mixtures [135]. A column with zwitterionic
chemistry was chosen for the first dimension. Analysis of data revealed a
dual‐mode separation mechanism based on both hydrophilic partitioning
of solutes within the aqueous sub‐layer and electrostatic interactions with
the stationary phase. These electrostatic interactions ensure that HILIC
separation is more than merely the reverse of RP, while the presence of
hydrophilic interactions caused similarly charged peptides to be eluted
over a wider retention window. It was further noted that the
orthogonality of HILIC with RP is dependent on the buffer pH, where a
higher orthogonality was seen at pH 3, providing more flexibility in
selectivity control.
HILIC is proving to be an attractive choice among the range of
separation methods available for the proteomics researcher. Although the

Chapter 1
40
combinations chosen so far for 2D LC–MS have been limited to HILIC–
RP, the versatility of the polymeric monoliths is predicted to enable other
combinations, such as SCX–HILIC and even MD approaches. On the
other hand, the higher content of organic solvent utilised in HILIC
compared to RP offers additional benefits, such as more compatibility of
the mobile phase with ESI‐MS and increased detection sensitivity, which
may suggest HILIC to be an interesting candidate for the second
dimension [131, 134].
1.4 Project aims
Developing monolithic columns, particularly based on polymeric
monoliths, continue to be an active area of research in column technology
due to the large potential of these materials, especially in bioseparations.
However, in comparison to their silica‐based counterparts, favourable
features of polymeric monoliths, such as ease of preparation and more
available monomers, reagents and methods enabling their preparation,
also make them attractive to be explored for separation of small
molecules.
Therefore, the general aim of this project has been to develop new
polymeric monolithic columns for bioseparations with more emphasis on
hydrophilicity of the materials, as one generally ignored criterion in
previous studies. The suitability of some of the developed monoliths for
separation of small molecules has also been considered. The specific aims
of the project were:

Chapter 1
41
To explore the feasibility of resolving charge heterogeneity
in mAbs using a pH gradient IEC approach and
commercially available polymeric monolithic columns.
To prepare new methacrylate‐based polymer monoliths for
IEC of proteins by focusing on hydrophilicity of the
materials.
To explore suitability of other polymerisation methods than
free‐radical polymerisation for preparing new polymeric
monoliths to be used for separation of both small and large
biomolecules.
To evaluate the performance of the prepared columns for
separation and characterisation of peptides under capillary
HILIC mode and to investigate their applicability for
proteomics studies.

Chapter 2
42
Chapter 2
Experimental
Unless otherwise specified in particular chapters, this section
summarises chemicals, instrumentation and procedures used throughout
this research.
2.1 Chemicals and reagents
Unless specified otherwise, the chemicals used were of analytical
reagent (AR) grade as follows.
Table 2.1: Chemicals used for buffer preparation
Chemical Formula Supplier
Acetic acid CH3COOH Sigma‐Aldrich
Formic acid HCOOH Sigma‐Aldrich
Trifluroacetic acid CF3COOH Sigma‐Aldrich
Hydrochloric acid HCl Sigma‐Aldrich
Phosphoric acid H3PO4 Merck
Disodium hydrogen phosphate Na2HPO4.2H2O Sigma‐Aldrich
Sodium dihydrogen phosphate NaH2PO4.H2O Sigma‐Aldrich
Ammonium Acetate CH3CO2NH4 Sigma‐Aldrich
Sodium bicarbonate NaHCO3 Sigma‐Aldrich
Disodium carbonate Na2CO3 AnalaR
Ammonium formate HCOONH4 Sigma‐Aldrich
Tris(hydroxymethyl)aminomethane
hydrochloride (Tris)
NH2C(CH2OH)3.HCl Sigma‐Aldrich
Sodium hydroxide (99%) NaOH Sigma‐Aldrich
Ethanolamine NH2(CH2)2OH Sigma‐Aldrich
Diethanolamine NH(CH2CH2OH)2 Sigma‐Aldrich
Triethanolamine N(CH2CH2OH)3 BDH Chemicals
Ammonium hydroxide (28%
aqueous NH3)
NH4OH Fluka
Ammonium sulfate (NH4)2SO4 Sigma‐Aldrich

Chapter 2
43
Table 2.2: Chemicals used for monolith preparation and modifications
Chemical Formula Supplier
(3‐
Glycidyloxypropyl)trimeth
oxysilane
C9H20O5Si Sigma‐Aldrich
1‐Decanol CH3(CH2)9OH Sigma‐Aldrich
1‐Dodecanol CH3(CH2)11OH Sigma‐Aldrich
2,2’‐Azobisisobutyronitrile
(AIBN)
(CH3)2C(CN)N=NC(CH3)2CN MP
Biomedicals
2‐Aminoethyl hydrogen
sulfate (SEA)
NH2(CH2)2OSO3H Sigma‐Aldrich
2‐Methoxyethanol CH3O(CH2)2OH Sigma‐Aldrich
3‐(Trimethoxysilyl)propyl
methacrylate (γ‐MAPS)
H2C=C(CH3)CO2(CH2)3Si(OCH3
)3
Sigma‐Aldrich
Acetone CH3COCH3 Merck
Allylamine CH2=CHCH2NH2 Sigma‐Aldrich
Diethylamine NH(CH2CH3)2 Sigma‐Aldrich
Ethanol CH3CH2OH Sigma‐Aldrich
Ethylenediamine (EDA) NH2(CH2)2NH2 Sigma‐Aldrich
Glycerol glycidyl ether
(GE‐100)
Mixture of C12H20O6 and
C9H16O4
Raschig GmbH
Glycidyl methacrylate
(GMA)
C7H10O3 Sigma‐Aldrich
Iminodiacetic acid (IDA) HN(CH2COOH)2 BDH Chemicals
Isopropanol (CH3)2CHOH Sigma‐Aldrich
Methanol CH3OH Sigma‐Aldrich
N,N′‐
Methylenebisacrylamide
(BIS)
(CH2=CHCONH)2CH2
Sigma‐Aldrich
N‐Isopropylacrylamide
(NIPAm)
H2C=CHCONHCH(CH3)2 Sigma‐Aldrich
O‐
Phosphorylethanolamine
(PEA)
NH2(CH2)2OPO3H2 Sigma‐Aldrich
Pentaerythritol triacrylate
(PETA)
(H2C=CHCO2CH2)3CCH2OH Sigma‐Aldrich
Poly(ethylene glycol) (PEG) H(OCH2CH2)nOH Sigma‐Aldrich
Tetrahydrofuran C4H8O Sigma‐Aldrich
Toluene C6H5CH3 Sigma‐Aldrich

Chapter 2
44
Table 2.3: Protein standards1
Protein MW (kDa) Source Experimental pI2
Trypsin inhibitor 20.1 Glycine max
(soybean) 4.6
Ovalbumin 42.8 Chicken egg
white 4.9
β‐Lactoglobulin a & b ~18.4 Bovine milk ~ 5.1
Serum albumin 66.0 Bovine 5.5
Transferrin 77.1 Human ~ 5.5
Myoglobin 17.0 Equine heart 7.2
α‐Chymotrypsinogen A 25.6 Bovine pancreas 9.0
Trypsinogen 23.9 Bovine pancreas 9.3
Ribonuclease A 13.7 Bovine pancreas 9.4
Cytochrome c 11.7 Equine heart 10.0
Trypsin 23.8 Bovine pancreas 10.3
Lysozyme 14.3 Chicken egg
white 11.2
1 Supplied from Sigma‐Aldrich. 2 from Ahmed et al. [136].
Table 2.4: Nucleobases and nucleosides1
Chemical Formula CAS Number
Adenine C5H5N5 73‐24‐5
Adenosine C10H13N5O4 58‐61‐7
Cytidine C9H13N3O5 65‐46‐3
Cytosine C4H5N3O 71‐30‐7
Deoxyguanosine C10H13N5O4 3608‐58‐0
Guanosine C10H13N5O5 118‐00‐3
Thymine C5H6N2O2 65‐71‐4
Uracil C4H4N2O2 66‐22‐8
Uridine C9H12N2O6 58‐96‐8 1 Supplied from Fluka.

Chapter 2
45
Table 2.5: Benzoic acid derivatives1
Chemical Formula pKa12
Benzoic acid (BA) C6H5COOH 4.2
4‐Propylbenzoic acid (4PBA) CH3(CH2)2C6H4CO2H 4.4
4‐Hydroxybenzoic acid (4HBA) HOC6H4CO2H 4.6
4‐Aminobenzoic acid (PABA) H2NC6H4CO2H 4.9
2,3‐Dihydroxybenzoic acid (2,3DHBA) (HO)2C6H4CO2H 3.0
2,4‐Dihydroxybenzoic acid (2,3DHBA) (HO)2C6H4CO2H 3.3
2,5‐Dihydroxybenzoic acid (2,3DHBA) (HO)2C6H4CO2H 3.0 1 Supplied from Sigma‐Aldrich. 2 Obtained from [137].
2.2 Instruments
Conventional LC was performed using a Dionex DX‐500 Liquid
Chromatograph (Thermo Fisher Scientific, Lane Cove, Australia)
consisting of a GP50 Gradient Pump, AD25 UV/Vis Absorbance Detector,
AS50 Thermal Compartment and AS50 Autosampler. Detection was
performed at 214 and 280 nm. Flow‐rate was 1 mL/min, the injection
volume was 10 μL and the column compartment temperature was set at
30 °C. Instrument control and data acquisition were performed using
Dionex Chromeleon software, version 6.80 SR5.
Capillary LC separations were performed on a Dionex UltiMate™
3000 HPLC System equipped with a DGP‐3600M gradient pump,
including a membrane degasser unit, a FLM‐3300 column compartment
including a capillary flow‐splitter (split ratio 100:1), a VWD‐3400 UV
detector equipped with a 45 nL flow cell and a WPS‐3000 autosampler

Chapter 2
46
fitted with a 100 nL sample loop. Chromeleon® software (Ver. 6.80) was
used for system control and data processing (data collection rate 2.5 Hz).
Electrospray ionization time of flight (ESI‐TOF) mass spectrometry
was performed on a micrOTOF‐Q mass spectrometer (Bruker Daltonics,
Melbourne, Australia) equipped with an Agilent G1385A microflow
nebuliser (Agilent technologies, Melbourne, Australia). Argon was used
as a nebulising gas and nitrogen as a dry gas. The instrument was tuned
and calibrated using an Agilent ES Tuning Mix (catalogue no. G2431A) in
enhanced quadratic mode. All system control and data acquisitions were
conducted with Bruker Daltonics software. The deconvolution of ESI
mass spectra was performed using a maximum entropy algorithm
(Bruker Daltonics).
iCE was performed using an iCE280 analyser (Toronto, ON,
Canada) with operational software from Convergent Bioscience,
equipped with an Alcott 719 AL autosampler.
Pore size distribution profiles of the dried monoliths were
determined using a Micromeritics Autopore IV 9500 mercury intrusion
porosimeter (Norcross, GA, USA). BET specific surface area
measurements were performed on a Micromeritics TriStar II 3020 based
on nitrogen adsorption‐desorption isotherms.
Scanning electron microscopy (SEM) images of the capillary
monolithic columns were captured using a Hitachi SU‐70 field emission
scanning electron microscope (Tokyo, Japan), after coating the samples (~

Chapter 2
47
5mm length capillary columns) with a conducting platinum layer (~ 4 nm
thickness). SEM experiments for normal bore columns were performed
using a FEI Quanta 600 MLA environmental scanning electron
microscope (Hillsboro, OR, USA).
2.2.1 Other instruments
pH was measured using a pH meter model labCHEM‐CP from
TPS (Springwood, QLD, Australia). Water was purified via a Milli‐Q
water purification system (Millipore, Bedford, MA) and filtered through
a 0.2 μm nylon filter prior to use. A vacuum oven (max. ‐100 kPa) model
V30D from SEM (Magill, SA, Australia) was used. Syringe pump model
PHD 2000 was from Harvard Apparatus (Holliston, MA, USA). Vortex
mixer was model VM1 from Ratek Instruments (Boronia, VIC, Australia).
The thermostated water bath used was model 8102 from PolyScience (PA,
USA) and the GC oven was Hewlett Packard model 5890 (Agilent
Technologies, CA, USA).
2.3 General procedures
2.3.1. Surface modification of fused‐silica capillaries
The inner surface of the polyamide‐coated fused‐silica capillaries
(purchased from Polymicro Technologies, Phoenix, AZ, USA) was first
activated following procedures described previously [94, 104] with some
modifications. Briefly, a length of capillary (3 m) was rinsed sequentially
with acetone and water, then flushed with 0.2 M sodium hydroxide
solution until the outlet flow exhibited an alkaline pH and flow was

Chapter 2
48
continued at 30 μL/h for 60 min using a syringe pump, followed by
flushing with water until a neutral pH of the outlet flow was detected.
The capillary was then rinsed with 0.2 M hydrochloric acid solution in
the same manner, followed by acetone and then the capillary was dried
with compressed nitrogen for 1 h. Depending on the type of monolith to
be prepared later in the capillary, different silanisation reagents were
employed on the next step. For epoxy‐based monolith, a 50% (v/v)
solution of 3‐glycidyloxypropyltrimethoxysilane in acetone was pumped
through the capillary at 30 μL/h for 60 min. The capillary was then sealed
at both ends with rubber septa and kept at 80 °C in a GC oven overnight.
For methacrylate‐based monoliths, a 20% (v/v) solution of 3‐
(trimethoxysilyl)propyl methacrylate (γ‐MAPS) in 95% ethanol with
apparent pH adjusted to 5 using acetic acid was pumped through the
capillary at a flow‐rate of 0.25 μL/min at room temperature for 90 min.
Finally, the capillaries were flushed with acetone and then dried again
with nitrogen. In order to allow the condensation reaction to complete,
the activated capillaries were then sealed at both ends and stored for at
least 24 h before use [138].
2.3.2 Surface modification of glass‐lined tubing (GLTs)
The surface of the glass‐lined tubing (GLT, 1/4” o.d. × 4 mm i.d. × 5
cm; SGE, Melbourne, Australia) was vinylised according to the procedure
reported elsewhere [139] with some modifications. To activate the
surface, the GLT was placed into a slightly bigger test tube, filled with 1
M sodium hydroxide solution and heated in a GC oven at 100 °C for 1 h.
The solution was then discarded and the GLT was washed extensively

Chapter 2
49
with water until neutral pH was attained. The procedure was repeated
with 1.2 M hydrochloric acid, followed by washing with acetone and
drying in a vacuum oven. The dried GLT was then immersed in the test
tube filled with a solution of γ‐MAPS in acetone (30 %wt.). The test tube
was sealed and left in the dark at room temperature overnight. After
vinylisation the GLT was rinsed with acetone and dried in a vacuum
oven.
2.3.3 Column permeability measurement
The flow resistance of a column is characterised by the column
permeability, K, which is calculated using Darcy’s equation:
2rP
FLK
where F is the volumetric flow‐rate, L is the column length, η is the eluent
viscosity, ΔP is the column back pressure , and r is the column inner
radius [140].
2.3.4 Dynamic binding capacity (DBC) measurements
The protein binding capacity of an IEX monolith was determined
using frontal analysis. The column was first equilibrated with a solution
of 10 mM phosphate buffer at pH 6 (eluent A), and then loaded with a
solution of lysozyme (1 mg/mL) in eluent A and UV absorbance at 214
nm was measured. DBC was calculated at 50% of the final absorbance
value of the breakthrough curve and expressed in mg/mL of column

Chapter 2
50
volume [94]. The volume of connecting tubing was corrected by replacing
the column with a zero dead‐volume union.
2.3.5 Enzymatic digestion of proteins
Cytochrome c was dissolved in 50 mM ammonium acetate
containing 20% (v/v) ACN to a concentration of 1 mg/mL. Trypsin was
then added at a substrate‐to‐enzyme ratio of 50:1 (w/w) and the solution
was incubated at 37 °C for 24 h. The proteolysis was terminated by the
addition of formic acid to a final concentration of 0.1% (v/v). The mixture
was further diluted to 0.5 mg/mL in 50% (v/v) methanol in water before
injection.

Chapter 3
51
Chapter 3
Charge Heterogeneity Profiling of Monoclonal
Antibodies Using Low Ionic Strength Ion‐exchange
Chromatography and Well‐controlled pH Gradients
on Monolithic Columns
3.1 Introduction
The advances in biotechnology in the last quarter of the 20th
century have led to the development of new technologies for the
production of complex biomolecules which could potentially be used in
human health care in the areas of diagnostics and prevention, and
treatment of diseases. Qualities, such as high (target) selectivity, the
ability to initiate immune recognition of the target, and long circulation
half‐lives, have made the development of humanized monoclonal
antibodies (mAbs) the fastest growing segment of therapeutic drugs [42,
141]. In the production of mAbs the final product often exhibits a number
of variations from the expected or desired structure. These alterations
may result from either known or novel types of post‐translational
modifications or from spontaneous, non‐enzymatic protein degradation
which bring about charge and size heterogeneity. Common modifications
of the primary sequence include N‐glycosylation, methionine oxidation,

Chapter 3
52
proteolytic fragmentation, and deamidation [142]. It has been shown that
charge variants of therapeutic proteins can have significantly different
bioactivity. For example, Harris et al. [143] showed that deamidated
variants of recombinant human mAbs had reduced potency in a
bioactivity assay. As protein charge heterogeneity is an important factor
in quality assessment of protein therapeutics, regulatory authorities, such
as the International Conference on Harmonisation (ICH) have set criteria
for monitoring and characterising the degree and profile of variations to
ensure lot‐to‐lot consistency and product stability [144].
Considering the large size of antibodies and the minor structural
diversity between the variants, the existence of these variants imposes a
significant challenge for their separation. Ion‐exchange chromatography
IEC is a non‐denaturing technique used widely to separate and isolate
protein charge variants for subsequent characterisation. However, when
operating under a salt gradient approach (classical mode), IEC has been
shown to exhibit limited selectivity when complex proteins with the same
number of effective charges are to be separated [145] and lack of
robustness when targeted mAbs are to be analysed [21].
cIEF is another separation technique used frequently to assess
charge heterogeneity of proteins in which a complex mixture of
ampholytes (polyionic organic electrolytes) is used to establish a pH
gradient in a capillary with the aid of an electric field. The electric field
causes protein isoforms to focus along the capillary according to their
isoelectric point where they have zero net charge and are then mobilised

Chapter 3
53
toward an on‐column detector located at one end of the capillary. Due to
the distortion of the pH gradient, which affects reproducibility in
migration time and peak area, the mobilisation step often requires
optimisation [146]. The introduction of imaged iCE has overcome this
issue by eliminating the need for the mobilisation step through single
point detection of the entire imaged capillary. While cIEF is perhaps the
most powerful of the known separation technologies for charge variants,
the difficulty of collecting fractions when compared to IEC has confined
the method to be suitable for monitoring of variants but not for their
preparative separation or isolation (peak identification) [42, 145]. Also,
some authors believe that while the separations are consistent between
the two methods, cIEF is not as precise as IEC and therefore cannot be
considered as a suitable replacement [17]. To the contrary however, some
have concluded that CE techniques could be superior to IEC in terms of
both separation speed and obtainable resolution and therefore could
constitute a routine tool for assessing charge heterogeneity of proteins
[146, 147].
Developed by Sluyterman et al. [27‐31] in the late 1970s, CF
(internal pH gradient) is recognised as the chromatographic analogy to
IEF [17] mitigating many of the shortcomings of classical IEC and
combining some unique features of both methods. CF has been
demonstrated to be useful for separating protein isoforms due to its high
resolving power and ability to retain the native state of protein [21, 23].
However, there are some limitations to this technique, such as the cost of
polyampholite buffers employed, the necessity of column regeneration

Chapter 3
54
after each separation, and the inflexibility in controlling the slope of the
generated pH gradient [21, 35, 38].
Alternatively, pH gradient approach can be conducted externally
by mixing prior to the column two eluting buffers of different pHs
consisting of common buffer species. As the slope and profile of the pH
gradient can be easily controlled by changing the elution parameters with
less dependence on the buffer composition and column chemistry, this
manner of introducing a pH gradient should allow for more convenient
method development and optimisation [35, 38]. The externally‐induced
pH gradient approach was applied for the separation of deamidated
variants of a mAb [142], resolving C‐terminal lysine isoforms after
treating with carboxypeptidase B [21] and also for the analysis of charge
variants of full‐length mAbs [17].
Currently, particle‐packed columns represent the most common
stationary phases for HPLC. Despite immense popularity, their
application for rapid and efficient separation of macromolecules is not as
convenient as for small molecules. This is mostly because of slow
diffusional mass transfer of large solutes and also the large void volume
existing between the packed particles [148]. In the meantime,
biocompatibility of stationary phase has become a new challenge when
analysing biomolecules (including peptide and proteins). As defined by
Li et al. [74], a biocompatible stationary phase material should be able to
resist nonspecific adsorption of biomolecules and preserve the bioactivity
of the target biomolecules. These challenges are well met by employing

Chapter 3
55
monolithic media. Mass transfer in monolithic sorbents is mostly
dominated by convection, rather than diffusion, and is therefore fast,
even for large biomolecules. On the other hand, the expected
biocompatibility of the most frequently used polymers in making porous
monoliths, i.e., poly(meth)acrylate and polyacrylamide, make these
stationary phases highly suit for use in protein separation applications.
Advances in polymer monoliths for IEC of biomolecules have been
reviewed recently and the importance of reducing non‐specific
interactions between analyte and stationary phase has been noted [69].
While IEC of proteins using monolithic columns is frequently seen in the
literature [77, 85, 95], very little effort has been directed toward
employing this technique for separation of large proteins, such as mAbs.
Based on recent efforts to resolve charge variants of mAbs with the
aid of ion‐exchange (IEX) monolithic columns [149], the maximum
achievable resolution for mAb isoforms was pursued in this work using
CEX columns in combination with simple, yet efficient, buffer systems.
Unlike previous reports [16, 17, 35, 145], IEC was performed employing
shallow pH profiles over a limited pH range (typically 1 pH unit)
generated by single component buffer systems at very low ionic strength.
The suitability of the proposed buffer system in direct coupling of IEC
and MS was also demonstrated. Due to their size and complexity, mAbs
are typically characterised by two or more orthogonal separation
methods [17]. Therefore, the performance of the developed method was
also assessed by comparing the results with those obtained by iCE. It was

Chapter 3
56
hoped that similar charge heterogeneity profiles could be achieved for
mAbs analysed under two different separation mechanisms.
3.2 Experimental
The general experimental details, including chemicals and
instrumentation, are presented in Chapter 2. Specific experimental
conditions are given in each of the figure captions.
3.2.1 Chemicals and reagents
Pharmalyte pH 3‐10, sucrose and urea (for iCE experiments) and
methanol (LC‐MS grade) were all obtained from Sigma‐Aldrich. Methyl
cellulose (1%) and the Chemical Test Kit were from Convergent
Bioscience (Toronto, ON, Canada). The pI markers, including pIs 5.13,
6.14, 7.2 and 9.5, were also obtained from Convergent Bioscience.
Samples of three different mAb formulations, which are referred to as
mAb1, mAb2 and mAb3, were prepared by recombinant DNA
technology at Pfizer Inc (St. Louis, MO, USA).
3.2.2 Chromatography
The monolithic IEX columns used were ProSwift™ SCX‐1S and
ProSwift™ WCX‐1S (4.6 × 50 mm) and the packed column was a ProPac
WCX‐10, 4 × 250 mm, all from Dionex (Thermo Fisher Scientific, Lane
Cove, Australia). The monolithic columns are methacrylate‐based with
sulfonic acid and carboxylic acid functionalities for SCX and WCX,

Chapter 3
57
respectively. The ProPac WCX is a tentacle type ion‐exchanger bearing
carboxylate groups.
All chromatograms were transferred to ASCII files and redrawn
using Origin 8.1 (Northampton, MA, USA).
Unless otherwise stated, mobile phases were generally prepared
by dissolving appropriate amounts of the buffer components in water
prior to splitting into two aliquots denoted as eluent A and B. The pH of
each portion was then adjusted with concentrated sodium hydroxide or
hydrochloric acid. The elution was performed by a linearly ascending pH
gradient from 0 to 100% eluent B followed by isocratic elution for 3 to 5
min before returning the eluent composition to the starting condition
(100% eluent A). The gradient volumes were 10 and 30 mL for monolithic
and packed columns, corresponding to about 14 and 10 column volumes,
respectively. For each elution, the column was pre‐equilibrated with at
least three column volumes of eluent A prior to sample introduction.
Prior to integration, each sample chromatogram was subtracted from the
relevant blank injection prepared from eluent A. Fractions of the column
effluent were collected every 1 min and the pH was measured offline.
MAb samples were analysed as received without buffer exchange
or any other sample pretreatment process. After dilution in eluent A to a
concentration of approximately 0.2 mg/mL, samples were stored at 5 °C
until analysed.

Chapter 3
58
3.2.3 Liquid chromatography‐mass spectrometry (LC‐MS)
CEX chromatography was carried out using a ProSwift™WCX‐1S
(4.6 × 50 mm) column under pH gradient mode. 5 mM ammonium
hydroxide (AMH) buffer containing 20% (v/v) methanol was used at pH
9.5 as eluent A and at pH 10.5 as eluent B. pH of eluents was adjusted
before mixing with methanol. Elution was performed by running a linear
gradient of eluent A to eluent B in 20 min at a flow‐rate of 0.4 mL/min,
which was split (1:100) before introducing into the MS.
Coupled with the CEX chromatography, ESI‐TOF‐MS was
performed in a positive ion mode with m/z range of 500‐10000 and a
capillary voltage of 4500V (‐500 V end plate offset). Drying gas flow of 5
L/min at 300 °C was used with a 20.3 psi nebuliser gas pressure.
3.2.4 iCE
For iCE experiments a transparent capillary column (50 mm, 100
μm i.d.) was used with its inner surface coated with fluorocarbon to
minimise electroosmotic flow. The test solutions were prepared using
various amounts of pI markers, pharmalyte, 1% methyl cellulose, 5 M
urea, 20% sucrose, and mAb samples. Throughout the analysis, the
capillary was kept at ambient temperature while the autosampler was set
at 8 or 15 °C, depending on the mAb sample analysed. The injection
volume was 35 μL and the analysis was performed by applying a sample
transfer time of 100 s, prefocusing at 1500 V for 1 min, followed by
focusing for 5 min at 3 kV. Detection was performed at 280 nm.

Chapter 3
59
3.3 Results and Discussion
With the aim of improving the resolution, a series of new buffer
systems based on both organic and inorganic buffer species was designed
and applied using monolithic columns. To obtain sufficient binding of the
proteins to the cation‐exchanger, the lowest pH of the gradient was
chosen to be at least 1 pH unit below the electrophoretic pI values of
mAbs, that is 8.8 for mAb1, 8.5 for mAb2 and 8.4 for mAb3.
3.3.1. Triethylamine‐diethylamine (TEA‐DEA) buffer system
The first buffer system that was successful in eluting two of the
mAbs of interest was prepared by mixing equimolar amounts of TEA
(pKa 7.76) and DEA (pKa 8.88) resulting in a system buffering the pH
range of approximately 7.6 to 10. Figure 3.1 shows the separation
achieved for mAb1 and mAb2 on a ProSwift SCX‐1S column using this
buffer system in the pH range of 7.6‐10 with each buffer component at a
concentration of 12.5 mM. A somewhat linear pH profile for this system
over the studied pH range was achieved (Figure 3.1). No elution was
observed for mAb3. Acidic isoforms (pI lower than the main component)
are observed for mAb1, while basic isoforms are more pronounced for
mAb2. Indications of additional isoforms are also present but as faint
shoulders of the main peaks. The effect of flattening the pH gradient
profile on chromatographic resolution was of special interest in this
study. As the pH gradient slope was reduced there was more time for
differential

Chapter 3
60
7.5
8.0
8.5
9.0
9.5
10.0
0 2 4 6 8 10 12 14
0
1
2
3
4
5
6
Time (min)
mAU
mAb1
mAb2
pH
Figure 3.1: pH gradient separation obtained for mAb1 and mAb2. The mobile
phase composition was 12.5 mM DEA and 12.5 mM TEA at pH 7.8 (eluent A)
and pH 10 (eluent B). Gradient: 0‐100 % B in 10 min, 100% B for 3 min. Column:
ProSwift SCX‐1S (4.6 × 50 mm); Detection: UV at 280 nm; Flow‐rate: 1 mL/min;
Column compartment temperature: 30 °C. Dashed line represents the pH profile
obtained.
movement of the isoforms through the column, which could lead to
better resolution [145].
In CF, it is possible to generate shallow gradient slopes by limiting
the pH range of the gradient or reducing the concentration of the mobile
phase buffer components [29, 31, 150]. Data presented later in this work
show that these two strategies for obtaining higher resolution are also
applicable to the external pH gradient approach.

Chapter 3
61
0 2 4 6 8 10 12 14
0
2
4
6
8
mA
U
Time (min)
A
B
C
Figure 3.2: The effect of eluent concentration (DEA) on the elution profile of
mAb2. (A) 20 mM, pH 9‐10; (B) 10 mM, pH 9‐10; (C) 5 mM, pH 9.2‐10.2. Other
conditions as in Figure 3.1.
3.3.2 DEA buffer system
As seen in Figure 3.1, elution of mAbs in the TEA‐DEA buffer
system occurred around the end of the pH range applied. The pH of
eluent A was therefore increased from 7.5 to 9. A simultaneous reduction
in gradient slope was achieved as the gradient time remained unchanged
at 10 min. In addition, because of its negligible buffering capacity in the
new pH range (pH 9‐10), TEA was removed from the buffer system.
The effect of buffer concentration within the range 20 to 5 mM on
separation efficiency of mAb2 isoforms is shown in Figure 3.2. A decrease
Chapter 3
62
in buffer concentration at the same gradient slope resulted in an increase
in resolution of variants from the main peak. For elution at 5 mM, a
further increase in working pH range from 9‐10 to 9.2‐10.2 was required.
These findings are in agreement with Farnan and Moreno [17], who they
achieved higher resolution for mAb isoforms by a 4‐fold decrease in the
concentration of the buffer.
The impact of column chemistry on separation efficiency was also
evaluated. A trivial impact of column chemistry on the selectivity is
recognisable for both mAb1 (Figure 3.3a) and mAb2 (Figure 3.3b). In
addition, there are more prominent fluctuations in the pH profile and a
longer titration time for the weak cation‐exchanger (see pH profiles). As
the working pH range is high enough to ensure full ionisation of the
carboxylic group of the weak cation‐exchanger (pKa ~ 5), the reason for
differences in the pH profile might be due to the different chemistries of
the stationary phases [149].
3.3.3 Ammonium hydroxide (AMH) buffer system
Although suitable for resolving the isoforms of given mAbs, the
low volatility of DEA could potentially limit its application for MS
detection. In order to address this issue, we explored the use of AMH,
which is a volatile buffer species with pKa 9.25. For this buffer, acceptable

Chapter 3
63
Figure 3.3: Comparison of separation of variants for mAb1 (a) and mAb2 (b) on
ProSwift WCX‐1S and ProSwift SCX‐1S columns. Eluent: 5 mM DEA, pH 9.2‐
10.2. Other conditions as in Figure 3.1.
9.2
9.4
9.6
9.8
10.0
10.2
0 2 4 6 8 10 12 14
0.0
0.5
1.0
1.5
2.0
2.5
3.0
3.5
4.0a
pH
mA
U
Time (min)
SCX
WCX
0 2 4 6 8 10 12 14
0.0
0.5
1.0
1.5
2.0
2.5
WCX
mA
U
Time (min)
SCX
b

Chapter 3
64
Figure 3.4: Interrelationship between eluent concentration and pH range on
separation efficiency of mAb1. The gradient slope was 0.1 pH units/min. Eluent:
5 mM AMH, pH 9.2‐10.2 (A); 2.5 mM AMH, pH 9.5‐10.5 (B). Other conditions as
in Figure 3.1.
chromatographic resolution of protein isoforms was obtained even at
buffer concentrations lower than 5 mM (Figure 3.4). This demonstrates
that focusing effect of the buffer system increases by decreasing its
concentration. Similar to the earlier results, obtained with the EDA‐TEA
buffer, the optimum pH range had to be adjusted when the eluent
concentration was decreased to promote maximum separation efficiency.
Figure 3.5 displays the effect of eluent pH range and gradient
slope on resolving mAb1 isoforms. By maintaining the gradient slope at
0.1 pH units/min, it was found that although the fine structure of the
0 2 4 6 8 10 12 14
0
1
2
3
4
5
mA
U
Time (min)
A
B
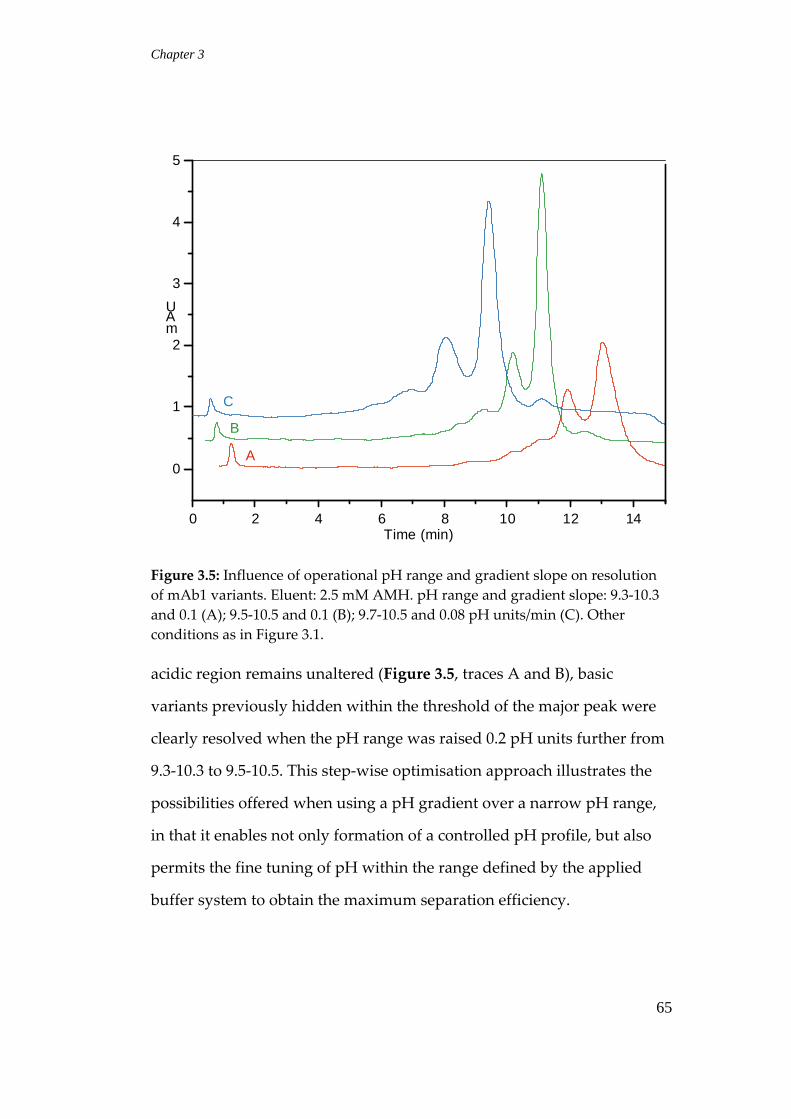
Chapter 3
65
0 2 4 6 8 10 12 14
0
1
2
3
4
5
mAU
Time (min)
A
B
C
Figure 3.5: Influence of operational pH range and gradient slope on resolution
of mAb1 variants. Eluent: 2.5 mM AMH. pH range and gradient slope: 9.3‐10.3
and 0.1 (A); 9.5‐10.5 and 0.1 (B); 9.7‐10.5 and 0.08 pH units/min (C). Other
conditions as in Figure 3.1.
acidic region remains unaltered (Figure 3.5, traces A and B), basic
variants previously hidden within the threshold of the major peak were
clearly resolved when the pH range was raised 0.2 pH units further from
9.3‐10.3 to 9.5‐10.5. This step‐wise optimisation approach illustrates the
possibilities offered when using a pH gradient over a narrow pH range,
in that it enables not only formation of a controlled pH profile, but also
permits the fine tuning of pH within the range defined by the applied
buffer system to obtain the maximum separation efficiency.

Chapter 3
66
Interestingly, it was found that low ionic strength eluents
generated a significantly high back‐pressure with the ProPac WCX‐10
column (pressure upper limit = 120 bar). When 5 mM AMH pH 9.5 at 0.5
mL/min was used, the initial back‐pressure of 94 bar was monitored and
found to be unstable and to increase gradually. This behaviour is most
likely due to the osmotic pressure generated from the difference between
the water content of the very dilute eluent and the IEX sorbent.
Unlike the packed column, the high permeability of the monolithic
ion‐exchangers resulting from their porous properties allowed fast
generation of pH gradients at moderate and stable back‐pressure (< 70
bar) even at very low buffer concentrations, as well as minimizing
column titration times (typically less than 5 min). These merits offer a
rapid analysis time that is applicable for high‐throughput process
development. While quite successful in resolving charge heterogeneity of
mAb1 and mAb2, the simplified buffer systems failed to elute mAb3
unless the eluent ionic strength was increased through addition of a salt.
Rozhkova [21] has previously reported the suitability of
conducting pH gradient separation of mAb variants by adding NaCl into
eluents. Accordingly, 2.5 mM AMH eluent, pH 9‐10 containing different
concentrations of NaCl ranging from 20 to 40 mM were used for eluting
mAb3. The results indicated partial resolution of the main component
from part of the acidic species (Figure 3.6). Basic variants, however,
remained hidden presumably under the wide shoulder of the major peak.

Chapter 3
67
0 2 4 6 8 10 12 14
0.0
1.5
3.0
4.5
6.0
7.5m
AU
Time (min)
20 mM NaCl
30 mM NaCl
40 mM NaCl
Figure 3.6: Effect of NaCl concentration on pH gradient elution of mAb3. Eluent:
2.5 mM AMH containing the indicated level of NaCl, pH 9‐10. Other conditions
as in Figure 3.1.
One possible explanation for this strong retention might be due to
the differences in modification site, kind of modification, and/or degree of
modification occurring in the protein [42], all of which influence the
strength of interactions between the protein molecule and the ion‐
exchanger. These modifications vary from those that change the number
of charge residues on the surface of the protein to those being less
connected to the charge, such as change in antibody conformation.
Deamidation, for example, is one possible modification which is likely to
have an effect on retention of a protein by affecting the number of
positively charged groups over the surface of a protein and hence the

Chapter 3
68
binding of the protein to a cation‐exchanger [142]. It is also just as likely
that the behavior of mAb3 is caused by a clustering of charge on a
particular surface of the mAb. Further investigation is required to
confidently determine the characteristics of the mAb variants.
3.3.4 Retention Mechanism
Figure 3.1 clearly indicates mAbs are retained at pH values above
their pI values, where the proteins carrying the same charge as the
stationary phase. While no retention is normally expected, a similar
phenomenon was noted for other buffer systems developed here when
the initial pH of the eluent was shifted even further toward a more basic
pH. This can be explained using the augmented electrostatic interaction
model developed by Tsonev and Hirsh [145], which suggests that
although a protein accumulates an increasing density of charges with the
same sign as the ion‐exchanger when titrated using a pH gradient, small
localised patches of the opposite charge will preferentially orient protein
molecules toward the stationary phase. This allows the protein to remain
adsorbed to the stationary phase even when the net charge on the protein
is the same as that of the stationary phase. Extending the repulsive
electrostatic forces through further increases in pH finally dominates the
electrostatic attractions, leading to elution of the protein at a specific pH,
termed the pIapp, that is the pH at which the protein is eluted from the
column. The relationship between pI and pIapp for a protein can be
interpreted using the equations derived by Sluyterman and Elgersma [30]
and has been verified experimentally [27‐31, 35]. Accordingly, the
difference between pI and pIapp is directly proportional to the

Chapter 3
69
dimensionless Donnan potential and to the rate of change of the protein
charge with pH (dZ/dpH). While the Donnan potential is affected
principally by the concentration of charged groups in the ion‐exchanger,
the ionic strength, and pH of an eluent, dZ/dpH is the protein‐dependent
contributor to the apparent pI shift.
3.3.5 Effects of eluent concentration and pH on resolution
The overriding consideration in this work was to maximise
achievable resolution for mAb isoforms. pH and ionic strength are two
major characteristics of the eluent that govern the elution and separation
of proteins in pH gradient IEC. Here, advantage was taken of the general
expressions proposed by Sluyterman and Elgersma [30] for the pH
gradient approach to explain the interplay between these two parameters
and their effects on separation efficiency.
Peak width and peak separation are the two determinants of
resolution. The width of a protein band in terms of pH unit can be
written as:
∆pH)2 D (dpH/dV)/φ (dZ/dpH) (1)
where D denotes the diffusion coefficient of a protein, dpH/dV the
pH gradient slope and φ the Donnan potential [30]. This equation implies
that an increase in peak focusing is consistent with the lower ionic
strength (buffer concentration) used, which increases the absolute value
of φ.

Chapter 3
70
Evidence of this inference can be seen in a comparison of trace A
and B in Figure 3.2, in which the resolution gained for the main isoforms
of mAb2 can be related to the focusing effect obtained by decreasing the
ionic strength. In fact, superior ability of pH gradient IEC over that of
conventional salt gradient IEC at fixed pH to focus eluent bands is well
known [35]. The absence of a focusing effect in fixed pH, salt gradient‐
based IEC can be partly related to the lack of the Donnan potential, as a
result of high salt concentration involved. Comparison of Trace C to
Traces A and B in Figure 3.2 indicates that while employing the same pH
range is likely to maintain the dZ/dpH (traces A and B), the positive effect
of this kinetic factor on peak width can be highlighted by shifting up the
pH range further (trace C), which along with more decrease in ionic
strength leads to an increase in resolution to an even a greater extent. The
dominating effect of dZ/dpH on peak focusing can also be seen by
comparing traces A and B in Figure 3.5, where there is likely no
significant difference between the Donnan potentials due to the constant
eluent concentration (2.5 mM). Counter to expectations the peaks became
broader when another determinant of peak width in Eq.1, i.e., the pH
gradient slope (dpH/dV), decreased further from 0.1 (trace B) to 0.08 pH
unit/mL (trace C), while keeping the other conditions unchanged. This
was probably due to the domination of the diffusion coefficient of protein
(D). This therefore suggests that the rate of titrating the ion‐exchanger
with pH has become lower than the rate at which proteins attain charge
equilibrium, which could compromise the peak focusing gains from
shallower gradients.

Chapter 3
71
The contribution of the other determinant of resolution, i.e. peak
separation, appears to be the main factor in the resolution gains observed
for isoforms in Figure 3.4, where even the peak focussing for the main
isoforms seems to be compromised, despite the expected focussing effects
as the eluent concentration decreased and the pH range shifted up
further. In fact, almost all of the post‐translational modifications and
degradations can change surface charge properties of an antibody either
directly by changing the number of charged groups or indirectly by
introducing conformational alterations [42]. According to the electrostatic
model developed by Tsonev and Hirsh [145], there is a relationship
between the magnitude of a shift in pI and the relative charge
distribution in a given protein. This in turn implies that isoforms can be
resolved based on their pIapp when titrated by a gradient of pH, relating
the resolution achieved in Figure 3.4 to a greater separation of the peaks.
Similar arguments based on the distribution of charges on the surface of a
protein have also been used to explain the trends observed in resolution
for CF of β‐lactoglobulin A and B [29], and haemoglobin variants [29, 34].
3.3.6 Loading capacity
The loading capacity of the proposed approach for the separation
of mAb charge variants was also assessed. While some minor loss of
purity occurred when a sample load of about 118 μg mAb1 was injected
onto the column, the overall separation pattern and the fine structure of
the acidic elution region remained unchanged (Figure 3.7). By
considering the low ionic strength of the buffer system employed, this

Chapter 3
72
0 2 4 6 8 10 12 14
0
20
40
60
80m
AU
Time (min)
1st
5th
Figure 3.7: Overlay of typical elution profiles for the first and the fifth injection
of mAb1 in evaluating the loading capacity of ProSwift SCX‐1S column. Eluent:
2.5 mM AMH, pH 9.5‐10.5. Sample load: 118 μg of stock solution of mAb1
directly injected without dilution. Other conditions as in Figure 3.1.
infers a significant advantage of this approach for scale‐up, enabling it to
be used along with classical IEC for preparative purposes.
3.3.7 Profiling charge heterogeneity of mAbs by iCE
To assess the resolving power offered by the developed procedure, analysis of
the given mAbs by iCE was also included in the study. The difference in
separation mechanism of each technique may offer the orthogonal and
complementary information required to obtain an unambiguous assignment of
protein variants. The obtained profiles (Figure 3.8) demonstrate clearly the
distribution of isoforms within

Chapter 3
73
Figure 3.8: iCE profiles for mAb1 (A), mAb2 (B) and mAb3 (C) (analysis
conditions are described in Experimental section).

Chapter 3
74
acidic, main and basic species of the mAbs. A comparison between iCE
profiles and IEX chromatograms reveals some interesting similarities in
separation efficiency. For example, there is a striking similarity between
the two methods in resolving mAb1 acidic isoforms, although iCE offers
more resolution in the basic region (compare Figure 3.5 (B) and Figure 3.8
(A). However, the resolution between the main isoform and variants
using IEC appears to be superior to that obtained using iCE when the
DEA buffer system was employed, (see Figure 3.3a). As demonstrated in
Figure 3.8 (B) and Figure 3.3b, some similarities in resolving isoforms
between pH gradient IEC and iCE can also be seen for mAb2. As an
indication of peak purity, the peak area percent for the sum of the acidic
species, the major peak and the sum of the basic species were also
compared in both separation methods (Table 3.1).
It was not possible to achieve equivalent separation efficiency for
all of the different antibodies analysed by IEC under identical separation
conditions. The DEA buffer system for mAb1 and the AMH buffer
system for mAb2 indicate closer overlap between iCE and IEC peak area
percent data. For mAb3, while increasing the ionic strength of the buffer
system through the addition of an inert salt provided better separation
efficiency than that obtained in previous work [149], this strategy still
appears inadequate in providing purities comparable to iCE.
Further comparison between the obtained profiles highlights
another interesting correlation between the two techniques. The
difference between the pIapp of the first isoform (~10) and the last one

Chapter 3
75
Table 3.1: Reproducibility comparison of CEX chromatography and iCE.
RSDs % of the measurements are given in parentheses (n = 5 for CEX and 3 for iCE). a 5 mM DEA, pH 9.2‐10.2. b 2.5 mM AMH, pH 9.5‐10.5.
Characteristic
CEXiCE
DEAa AMHb
mAb1 mAb2 mAb3 mAb1 mAb2 mAb3
mAb1 mAb2 mAb3
Acidic species % 31.3 (5.2) 13.3 (1.3) ‐ 38.5 (1.7) 16.6 (1.2) 15.9 (1.5) 29.4 (0.4) 19.5 (0.4) 16.6 (1.8)
Main component % 64.5 (5.1) 77.4 (2.7) ‐ 58.2 (1.5) 74.3 (1.4) 84.1 (2.3) 63.8 (0.3) 69.5 (0.2) 78.0 (0.5)
Basic species % 4.2 (0.8) 9.4 (2.8) ‐ 3.3 (0.9) 9.1 (2.2) ‐ 6.8 (1.6) 11.0 (0.5) 5.4 (1.5)
Retention of main
peak by CEX (min) 9.0 (2.2) 6.9 (2.5) ‐ 10.8 (1.8) 9.8 (3.1) 9.1 (1.7) ‐ ‐ ‐
pI of main peak by
iCE‐ ‐ ‐ ‐ ‐ ‐ 8.78 (0.02) 8.48 (0.03) 8.35 (0.01)

Chapter 3
76
(~10.4) in the IEC profile of mAb1, for example, is about 0.4 pH units (see
pH profile in Figure 3.3a), which correlates well to the pI range
(approximately 0.5 pI units) over which the separation was achieved in
the corresponding iCE profiles. This observation also lends more support
to the comparability of the separation efficiency of the two approaches,
despite the differences in separation mechanism.
3.3.8 LC‐MS analysis
Unlike RPLC, IEC is not easily hyphenated with MS due to the
high content of salt involved [151].Therefore, the integrated MS‐based
strategies are traditionally performed in multi‐dimensional approaches
relying on the separation efficiency of CEX chromatography for protein
fractionation in the first dimension and MS compatibility of RPLC in the
second dimension. The feasibility of the direct coupling of the developed
low ionic strength pH gradient with MS was probed employing the AMH
buffer system with a ProSwift WCX‐1S column and mAb1 as an example.
Methanol (20% v/v) was added to both eluents in order to enhance the
electrospray efficiency. Figure 3.9 shows the averaged mass spectrum of
the intact mAb1 after pH gradient elution. The averaged mass spectrum
was acquired in the range from 12 to 22 min from the corresponding base
peak chromatogram (Figure 3.10) and featured multiply charged ions
(ammonium adducts) from 24+ to 30+. Further magnification of the
spectrum (see insets) revealed more charge states which can be attributed
to the existence of different species (isoforms).

Chapter 3
77
Figure 3.9: ESI mass spectrum of intact mAb1 with insets showing the expanded view of charge states of the antibody.
0
50
100
150
200
250
Intens.
1000 2000 3000 4000 5000 6000 7000 8000 9000 m/z
0
100
200
300
Intens.
4500 5000 5500 6000 6500 m/z
50
100
150
200
250
Intens.
5200 5300 5400 m/z
24+30+
25+
26+
27+
28+
29+
isoform I
isoform II
isoform III
isoform IV
Dimers

Chapter 3
78
5 10 15 20 25 30Time [min]
0.0
0.5
1.0
1.5
2.0
4x10Intens.
Figure 3.10: (smoothed) base peak chromatogram of intact mAb1 eluted by
running a pH gradient (5 mM AMH, pH 9.5 to 10.5) over a ProSwift WCX‐1S
column. Gradient: 0‐100 % B in 20 min, 100% B for 5 min. Column: ProSwift
WCX‐1S (4.6 × 50 mm); Flow‐rate: 0.4 mL/min (splitted (1:100) before
introducing into MS).
To gain more insight into the possible modifications,
deconvolution of the intact mass spectrum was performed using a
maximum entropy algorithm (Figure 3.11). Based on the deconvoluted
results, four different isomers were proposed, however, the resolution
provided by the TOF instrument did not allow further unambiguous
identification of the previously described modifications. Nevertheless, the
results suggested that this approach was viable for the study of the
existence of different isoforms of mAbs, especially in combination with

Chapter 3
79
+MS, 14.2-18.7min, Deconvoluted (MaxEnt)
0
250
500
750
1000
1250
1500
Intens.
135000 140000 145000 150000 155000 m/z
Figure 3.11: Deconvoluted ESI mass spectrum of intact mAb1 (ammonium
adducts) obtained by performing the maximum entropy algorithm.
MS instrument with higher resolving power, which can be the focus of
future studies.
3.4 Conclusion
The application of a shallow pH gradient generated by simple
component buffer systems within a narrow pH range in combination
with (CEX) monolithic columns provided remarkable results for the
separation of mAbs. The separation of basic and acidic isoforms with
qualities comparable to iCE was achieved at very low ionic strength,
suggesting the prevailing effect of the eluent concentration on separation
efficiency. The expressions developed by Sluyterman and Elgersma were

Chapter 3
80
used for interpreting the obtained results, with the dominant factors
being the Donnan potential, which is directly proportional to the ionic
strength, and the rate of protein charge alteration with pH, principally
through their effects on both peak width and peak separation. Resolution
improvement through peak separation was hypothesised to occur via
increasing the electrophoretic pI of variants to a different extent
determined by the relative charge distribution on the protein surface.
This potentially confers more separation capability in pH gradient IEC
than for a conventional salt gradient IEC at a fixed pH. By keeping in
mind the observed trends of increasing pI, this concept might potentially
be used for other mAbs by choosing a suitable buffer component that has
a buffering capacity that can cover the protein pIapp.
While packed columns may not be used conveniently with the
developed dilute buffer systems due to the high back‐pressure involved,
the possibility of high‐throughput analysis and fast re‐equilibration time
can be considered as additional advantages of the proposed approach
when using monolithic columns.
Employing volatile buffer species at very low concentration also
enables direct interfacing of ion‐exchange separation to MS through
electrospray ionization interface. The possibility of rapid verification of
sequence composition of mAbs via accurate mass measurement and
identification of post‐translational modifications is expected when using
MS detection with high resolving power.

Chapter 3
81
As inferred from the results, despite the elution occurring at pH
values where both strong and weak CEX columns are expected to be fully
ionised, there are differences in the pH profiles, which most likely result
from the type of ion‐exchanger. Further studies of the pH gradient
elution of mAbs might therefore benefit from the inclusion of other IEX
chemistries. It is expected that more improvements in separation
efficiency should be achieved through designing monolithic sorbents
with lower buffering properties, higher biocompatibility, and
permeability (for employing higher flow‐rates), which can be the focus of
future investigations.

Chapter 4
82
Chapter 4
Methacrylate‐based Polymeric Monoliths for
Cation‐Exchange Chromatography of Proteins
4.1 Introduction
IEC is an important separation mode for analysing biomolecules
including peptides, proteins, oligonucleotides, and viruses due to its high
capacity and ability to perform separations under non‐denaturing
conditions [9, 86, 152]. Compared to other chromatographic modes, such
as RPLC and affinity chromatography, IEC is conducted at near
physiological conditions that are not prone to cause protein denaturation
and thus enable structural maintenance of proteins and preservation of
their bioactivity [69, 152]. Also, in comparison to hydrophobic interaction
chromatography, a lower salt concentration is used in IEC, thereby
avoiding precipitation of biomolecules due to a high salt content [9].
High capacity and high resolving power have enabled IEC to be
used successfully for many applications, such as purification of proteins
and removal of viruses [9]. One important application of IEC is in 2D LC
of extremely complex peptide mixtures, such as in “shotgun” proteomics
[153]. In fact, due to the orthogonality of the separation mechanisms of
IEC to RPLC, using IEC (particularly with a SCX column) as the first
dimension is the most widely used 2D LC combinations [77]. For such
combinations, however, one important criterion is the hydrophilicity of

Chapter 4
83
the IEX column, which prevents non‐specific (hydrophobic) interactions
of peptides. Otherwise, the resultant 2D LC setup is not fully orthogonal
and the final overall peak capacity is compromised [77]. In the worse
case, some very hydrophobic peptides will not be eluted from the IEX
column [77]. Currently, the Polysulfoethyl A stationary phase, which is a
silica‐based particle‐packed column developed by Alpert in the late 1980s
[154], is the most widely used column for SCX chromatography of
peptides and proteins [77]. However, this column has been found to
exhibit some hydrophobicity, and 15‐25% ACN is required to suppress
hydrophobic interactions to improve peak shapes and resolution [77,
154].
Since their emergence in the late 1980s, polymeric monoliths have
received considerable interest due to favourable features, such as ease of
preparation, enhanced mass transfer as a result of high permeability, and
chemical and mechanical stability. Polymeric monoliths are typically
used to separate biomolecules due to their pH stability, high loading
capacity and biocompatibility [86]. Considering the suitability of IEC
approach for the separation of biomolecules, monolithic IEX stationary
phases would therefore appear to be highly desirable for bioseparation.
There are several approaches to introduce IEX functionalities into
monolithic stationary phases. The most straightforward is
copolymerisation of an ionisable monomer with a cross‐linker [94].
Recently, attempts have been made by Lee’s group for preparing IEX
polymeric monoliths exhibiting minimal non‐specific interactions for
separation of peptides and proteins [9, 77, 85, 86, 152, 155]. Monoliths

Chapter 4
84
with improved biocompatibility were synthesised by co‐polymerisation
of PEG‐acrylate and PEG‐diacrylate cross‐linkers with a variety of IEX‐
containing monomers possessing different extents of hydrophobicity. For
example, while monoliths prepared by co‐polymerisation of 2‐
acrylamido‐2‐methyl‐1‐propanesulfonic acid (AMPS) and poly(ethylene
glycol) diacrylate required 40% ACN to suppress any hydrophobic
interactions, negligible hydrophobicity was observed when AMPS was
replaced by vinylsulfonic acid, containing a lower hydrocarbon content
[74, 77].
Although it is a simple and single‐step approach, co‐
polymerisation suffers from some limitations, such as difficulty in finding
a suitable porogen system that can dissolve ionisable monomers and that
also forms a good monolith with the desired mechanical stability and
pore structures, as well as distribution of some of the IEX functionalities
throughout the polymer matrix. Such functionalities buried within the
monolith scaffold are not accessible for large molecules, such as proteins
and therefore do not make any significant contribution in the DBC of the
stationary phase. Instead, as a result of the exchange of counter‐ions and
change in solvation, they can cause swelling and shrinking of the
polymer matrix, depending on the pH and the salt content of eluents [94,
156].
Alternatively, post‐polymerisation modification can be used to
generate IEX functionalities on the pore surface of monoliths. In contrast
to the single step co‐polymerisation, this approach allows independent
optimisation of porous properties of the monolith scaffold and surface

Chapter 4
85
chemistry. For example, epoxy groups of GMA‐based monoliths were
reacted with ionisable compounds, such as ethelenediamine (EDA) [157],
DEA [60, 92, 93], TEA [158], poly(ethylene imine) [159], iminodiacetic
acid [160], and sodium sulfate [160‐162] to afford IEX functionalities.
While EDMA is the most widely used cross‐linker for synthesising
methacrylate‐based monoliths, some studies have shown significant non‐
specific interactions with proteins in monoliths prepared with EDMA [74,
94, 163]. This undesirable adsorption can be addressed by replacing
EDMA with more hydrophilic cross‐linkers, such as poly(ethylene glycol)
diacrylate [163], or alternatively, by grafting hydrophilic monomers, such
as poly(ethylene glycol) methacrylate onto the pore surface of the generic
monolith in order to mask the hydrophobicity induced by the polymer
matrix [94, 164].
Here, the development of a new methacrylate‐based polymeric
monolith prepared by co‐polymerisation of GMA as a reactive monomer
with pentaerythritol triacrylate (PETA) as a cross‐linker is reported. CEX
functionalities were then incorporated onto the pore surface of the
monolith via aminolysis of GMA with amine reagents containing CEX
groups. It was hoped that by utilising PETA as a hydrophilic cross‐linker
efficient separation of proteins with minimal non‐specific interactions
would be achieved.

Chapter 4
86
4.2 Experimental
The general experimental details, including chemicals and
instrumentation, are presented in Chapter 2. Specific experimental
conditions are given in each of the figure captions.
4.2.1 Chemicals and reagents
All chemicals were used as received except the GMA that was
freed from inhibitors by passage through a Pasteur pipette packed
partially with basic alumina oxide, and 2,2’‐azobisisobutyronitrile (AIBN)
that was recrystallised from methanol.
4.2.2 Polymer monolith preparation
The polymer precursor was prepared in 4‐mL glass vials by
mixing monomer, cross‐linker, initiator (AIBN, 1% wt. with respect to
monomers), and porogens (see Table 4.1 for recipes). The mixture was
vortex‐mixed and de‐oxygenated with a nitrogen stream for ~ 5 min. A
surface‐modified capillary (100 µm i.d.) was then filled with the mixture
using a glass syringe and both ends were sealed with rubber septa. Some
recipes were also tried in an analytical column format by filling a
modified GLT (1/4” o.d. × 4 mm i.d. × 5 cm) with the mixture, followed by
sealing both ends with plugged end‐fittings. The polymerisation reaction
was conducted in a thermostated water bath at different temperatures
(55‐65 °C) for 24 h. For polymerisation under pressure, the end‐fitting on
the bottom‐end of the column was plugged, while the other end‐fitting
was connected to the nitrogen line through PEEK tubing. A PEEK spacer

Chapter 4
87
Table 4.1: Recipes and characteristics of monoliths synthesised in this study.
Monolith
Monomer Cross‐linker Porogen1 Co‐porogen Porosimetry data BET surface
area (m2/g) GMA, wt% PETA, wt% I, wt% II, wt% 1‐decanol 1‐dodecanol MPD2
(nm)
Dp3
(nm)
Vp4
(mL/g)
M1 30 10 50 ‐ 10 ‐ 1058 963 1.3 N.D.
M2 30 10 50 ‐ ‐ 10 1064 962 1.3 N.D.
M3 30 10 ‐ 54 6 ‐ 726 666 1.0 N.D.
M4 25 15 ‐ 54 6 ‐ 585 548 1.0 5.2
M5 30 15 ‐ 49.5 5.5 ‐ 612 551 0.9 3.9
M6 35 10 ‐ 49.5 5.5 ‐ 818 798 0.7 3.2
M7 35 15 ‐ 45 5 ‐ 746 798 1.0 3.9
M8 40 10 ‐ 45 5 ‐ 1004 961 0.8 2.6
M9 40 10 ‐ 45 5 ‐ 1076 965 0.8 2.6
M10 40 10 ‐ 35 15 ‐ 1035 960 0.8 3.2
Polymerisation temperature: M1‐M2 (65 °C), M3‐M8 (55 °C), M9‐M10 (60 °C) 1 Porogen: 20 wt% PEG‐10k in 2‐methoxyethanol (I) or in methanol (II). 2 Median pore diameter. 3 Pore size at the peak of the pore distribution curve. 4 Pore volume.

Chapter 4
88
(1/4” o.d. × 4 mm i.d. × 3 mm) was placed between the GLT and the end‐
fitting and carefully filled with the polymerisation mixture as well. The
set‐up was then connected to the nitrogen line and immersed into the
water bath in upright position. A pressure of ~ 5 bar was then applied to
the set‐up and maintained during polymerisation. Upon completion of
the reaction the set‐up was removed from the water bath and cooled
down to room temperature before disconnecting from the nitrogen line.
4.2.3 Post‐polymerisation modifications
1 M solutions of two amine reagents containing sulfonic acid and
phosphoric acid functionalities, namely 2‐aminoethyl hydrogen sulfate
(SEA) and o‐phosphorylethanolamine (PEA) were prepared in 1 M
carbonate buffer at different pH values by adding sodium hydroxide
solution (5 M). About 450 μL of each solution was pumped through each
column for 24 h at 75 °C. Acid hydrolysis of unreacted epoxides was then
accomplished by pumping a 0.5 M sulfuric acid solution through the
column at 30 μL/h for 4 h at 75 °C. The entire reaction scheme is shown in
Figure 4.1.
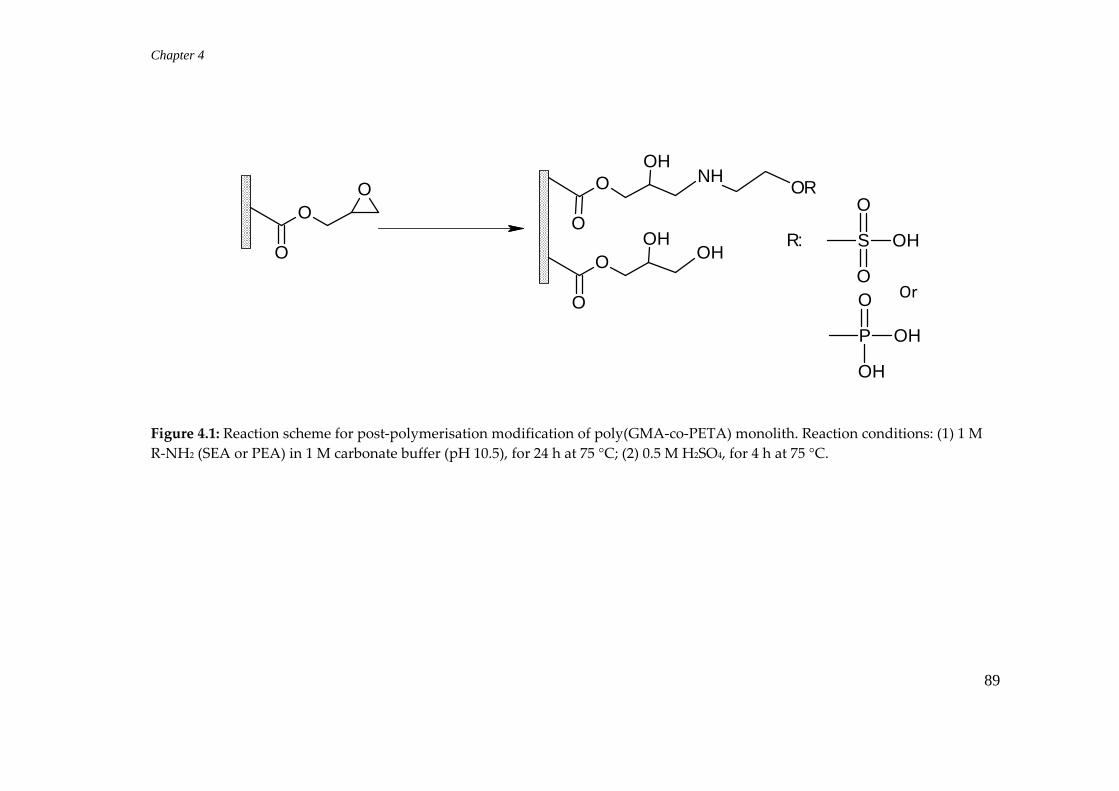
Chapter 4
89
Figure 4.1: Reaction scheme for post‐polymerisation modification of poly(GMA‐co‐PETA) monolith. Reaction conditions: (1) 1 M
R‐NH2 (SEA or PEA) in 1 M carbonate buffer (pH 10.5), for 24 h at 75 °C; (2) 0.5 M H2SO4, for 4 h at 75 °C.
OO
O
OHO
O
OH
OHO
O
NHOR
OH
O
O
S
OH
OH
O
P
R:
Or

Chapter 4
90
4.3 Results and discussion
4.3.1 Polymer monolith preparation
The preparation of a novel (meth)acrylate‐based monolith with
superior hydrophilicity than the classic poly(GMA‐co‐EDMA) was the
aim of this work. PETA is an acrylate‐based cross‐linker, which makes it
more hydrophilic than methacrylate‐based analogies like EDMA.
Together with three acrylate units, the hydrophilicity of this cross‐linker
is also strengthened with the presence of a hydroxyl group on the other
end of the molecule. Therefore, monoliths synthesised using PETA as
cross‐linker are believed to be highly hydrophilic/hydrated [165‐170],
which would minimise the hydrophobic interaction of proteins with the
monolith matrix.
The porosity and flow‐through characteristics of a polymeric
monolith can be controlled by tuning key variables, including the
composition of pore‐forming solvents (porogen and co‐porogen), the
content of cross‐linker and polymerisation temperature. Along with
temperature, the choice of pore‐forming solvents is another means for
controlling the porous properties of monoliths without changing the
chemical composition of the final polymer. The porogenic solvents
control the porosity of the monolith through solvation of the polymer
chains in the reaction medium during the early stages of polymerisation
[50]. The composition of pore‐forming solvents was initially adopted
from a recipe developed by Irgum’s group [171]. They used PEG with a

Chapter 4
91
wide range of MW as the porogen for preparing polymeric monoliths
suitable for protein separations. Because of its unique characteristics,
such as biocompatibility, PEG was hypothesised to establish wide pores
with a protein‐friendly surface, which is desirable for bioseparations. The
suitability of PEGs as a porogen has also been demonstrated by
polymeric monoliths prepared via a polymerisation mechanism other
than free‐radical initiation, such as epoxy‐based monoliths that are
prepared by polycondensation [104‐106]. Like the original recipe, PEG
with MW of 10,000 (PEG‐10k) dissolved in 2‐methoxyethanol (20 wt%)
was initially used as porogen together with either 1‐decanol or 1‐
dodecanol as co‐porogen.
As seen in Table 4.1, monoliths with very similar porous
properties were achieved (M1 and M2). Although monoliths with wider
pores (Median Pore Diameter (MPD) = 1.6 and 1.7 µm) were reported for
the original recipe in which a different monomer composition was used
and the polymerisation was performed via UV‐initiation, the porous
properties of those monoliths also showed negligible difference [171],
suggesting similar solvating properties for 1‐decanol and 1‐dodecanol as
co‐porogen. Both monoliths showed pore characteristics highly suitable
for the separation of large biomolecules, such as proteins (MPDs ~ 1 µm
and pore volumes > 1.0), but since 1‐dodecanol is solid at room
temperature, 1‐decanol was ultimately preferred over 1‐dodecanol for
further studies. The porogen system also became solid at room
temperature and required warming up (< 45 °C) before use. However,
due to the volatility of 2‐methoxyethanol, heating would cause a change

Chapter 4
92
in the composition of the porogen. Further, a mass reduction was
observed when purging the polymerisation mixture with nitrogen. 2‐
methoxyethanol was replaced with methanol in the porogen system.
However, this modification resulted in a significant reduction in the
porous properties of the monoliths, suggesting that methanol was a
better solvent than 2‐methoxyethanol for the monolith (see Table 4.1).
Systematic optimisation of the polymerisation mixture was therefore
conducted by manipulating other variables, including temperature and
monomer composition.
As expected, a further reduction in the average pore size was also
observed with increasing the percentage of cross‐linker in the monomer
composition (see M3 and M4 in Table 4.1), which is known as a result of
an earlier formation of highly cross‐linked globules with a reduced
propensity to join together [50]. Conversely, an increase in pore size was
observed by keeping all variables constant but increasing the percentage
of GMA in the monomer composition (see M5 and M6 in Table 4.1).
MPDs larger than 1.0 µm reappeared with further increase in the GMA
content up to 40%. A higher content of GMA was also beneficial
considering the higher ion‐exchange capacity that would be incorporated
on the pore surface of monoliths during post‐polymerisation
modifications. On the other hand, the surface area of the monoliths in the
dry state remained basically unaltered by these changes to less than 5
m2/g (see Table 4.1), which is not unusual for a polymeric monolith with
such a large pore size. The last three monoliths in Table 4.1 demonstrated
very similar porous properties, despite some differences in the ratio of

Chapter 4
93
porogen to co‐porogen and polymerisation temperature. While porous
characteristics of monoliths are generally sensitive to even minor changes
in the variables, this result may suggest more reproducibility for the
prepared monolith. Monolith M9 (Table 4.1), which showed slightly
larger MPD, was ultimately chosen for further studies.
Direct visual images of the poly(GMA‐co‐PETA) monoliths were
provided by SEM micrographs. Figure 4.2 shows SEM images for
monolith M9 as an example. A typical “cauliflower” morphology of
methacrylate‐based monoliths is seen with obvious flow‐through pores
across the structure. Also, the monolith is uniform and firmly attached to
the capillary wall. Very similar morphologies were observed for other
monoliths as well.
4.3.1.1 Monolith preparation in conventional dimension
The majority of contributions focused on developing monolithic
materials for chromatography have been devoted to micro‐bore
dimensions (mostly in fused‐silica capillaries), primarily because of the
difficulty in keeping the monolith in contact with the inner wall of a
mould with a conventional dimension during the chromatography as a
result of inherent shrinkage of polymers. Due to the larger surface‐to‐
volume ratio in capillaries than conventional dimensions (2‐5 mm i.d.),
such shrinkage does not normally cause detachment of monoliths in the
capillary format [139].

Chapter 4
94
Figure 4.2: SEM images of monolith M9.
Chapter 4
95
On the other hand, the application of capillary columns requires
equipment capable of precisely delivering very low flow‐rates, injecting
small volumes, having minimal extra‐column void and detector cell
volumes. While many laboratories are still equipped with conventional
analytical chromatographs that are unable to operate with micro‐bore
columns, it is desirable to develop monolithic columns with conventional
analytical dimensions.
Several attempts were made to prepare poly(GMA‐co‐PETA)
monoliths in stainless steel GLTs. Unlike fused‐silica capillaries,
vinylisation of the inner wall of the conventional bore tubes does not
seem necessary provided that the polymer can swell enough in the
mobile phase during operation to ensure good contact of the monolith
with the column wall. As an example, Svec and Fréchet in one of the early
reports on polymer monoliths prepared their classic poly(GMA‐co‐
EDMA) monolith directly within a stainless steel tube of 50 × 8 mm i.d.
dimension [172]. Nevertheless, in the present study, vinylisation on the
inner wall of GLTs was conducted prior to polymerisation to permit
covalent attachment of the monolith. Although washing of the column
post‐polymerisation was performed with tetrahydrofuran (THF), which
is less polar than ACN and methanol, to ensure swelling of the monolith,
a gradual decrease in the column back‐pressure was observed. Further
inspection by SEM showed partial detachment of the monolith from the
column wall.

Chapter 4
96
Allington et al. [173] suggested polymerisation under pressure in
order to compensate for shrinkage during polymerisation. Pressure can
be applied to the column using a piston or a gas filling the space above
the polymerisation mixture. The latter approach was adopted by Smirnov
et al. and successfully performed for making a poly(divinylbenzene‐co‐
ethylvinylbenzene‐co‐2‐hydroxyethyl methacrylate) monolith inside
vinylised glass columns (150 × 3 mm i.d.) [139].
Since the volume of the reaction mixture decreased during the
polymerisation, a pre‐column was also connected to the upper end of the
column and polymerisation was performed under constant pressure of
nitrogen (3 bar). Unfortunately, this approach also did not result in a firm
attachment of our monolith to the wall even under pressures as high as
10 bar (see Figure 4.3).
This approach was not pursued and further studies were limited
to the capillary format. However, other approaches might be considered
for future studies, such as using tubes with smaller internal diameter (2
mm) to limit the extent of shrinkage, or modification of the
polymerisation recipe by increasing the content of cross‐linker in order to
get more cross‐linked structure, which affords less swelling propensity
[86, 174, 175]. Further, post‐polymerisation compression of the monolith
inside the tube could be considered as another alternative [58]. However,
this is not a straightforward approach and requires experience, and
special fittings and accessories (see Chapter 6 for a suggestion). This
strategy has been successfully commercialised by Dionex

Chapter 4
97
Figure 4.3: SEM image of poly(GMA‐co‐PETA) monolith polymerised in a GLT.
(Thermo Fisher Scientific Inc.) for making polymeric monolithic columns
inside PEEK and stainless steel tubes (2.1 and 4.6 mm i.d.).
4.3.2 Stability of poly(GMA‐co‐PETA) monoliths
Relationships between column pressure and eluent flow‐rate were
measured using different solvents, including water and methanol to
evaluate the mechanical stability of the synthesised monolith. A linear
dependence of flow‐rate on column back‐pressure was observed (Figure

Chapter 4
98
Figure 4.4: Relationship between column back‐pressure and volumetric flow‐
rate for a poly(GMA‐co‐PETA) monolithic column (21 cm × 100 µm i.d.) using
water or methanol as eluent.
4.4), indicating the absence of monolith compression at least up to 1050
bar/m. Interestingly, the plots also appear to be parallel, which can
suggest the absence of swelling or shrinking of the monolith in solvents
with different polarities. It is worth mentioning that, due to the non‐
calibrated pressure transducer on the pump, a positive back‐pressure was
recorded at zero flow‐rate, which resulted in deviation of lines from the
origin.
Further study on the swelling or shrinking of a monolith can be
performed by measuring permeability in different solvents. Upon
swelling, the monolith through‐pores decrease in size, leading to lower

Chapter 4
99
permeability, and vice versa. The permeability values calculated using
Darcy’s law were 38.6 × 10‐15 m2 and 35.1 × 10‐15 m2 in water and methanol,
respectively. These results indicate again the non‐significant swelling or
shrinkage of the monolith in the studied eluents.
4.3.3 Post‐polymerisation modifications
Monoliths containing reactive functionalities, such as epoxide
groups, are benefited from a wide variety of chemistries that can be
incorporated into the monolith pores via post‐polymerisation
modification reactions, mostly with reagents containing amine or thiol
groups. These reactions can be easily performed with liquid reagents
simply by saturating the monolith with the neat reagent, followed by
reaction at elevated temperature.
Monoliths with anion‐exchange functionalities were prepared by
this approach using, for example, ethylenediamine (EDA) [157] and DEA
[60, 92, 93]. On the other hand, the incorporation of CEX functionalities
requires using sodium salts of reagents. Because of the SN2 mechanism
involved, the use of aprotic solvents, such as THF or ACN is preferred to
prevent the unwanted hydrolysis of epoxides. However, the use of such
solvents is hindered by the very limited solubility of the solid forms of
the reagents. Therefore, a reaction in aqueous medium appears to be the
only possibility.

Chapter 4
100
4.3.3.1 Effect of pH on modification reaction
The pH of the aqueous reaction medium is the most important
variable that needs to be optimised. While basic pH is required in order
to keep the amine functionality of the modification reagent active in its
neutral form, higher pH can cause domination of the competitive
hydrolysis reaction of epoxide and also increase the likelihood of
hydrolysis of siloxane bonds that covalently attach the monolith to the
capillary wall. Therefore, the optimum pH of the modification was
initially investigated with the aim of obtaining the highest possible IEX
capacity.
To evaluate the dependence of reaction yield on the pH of the
modification reaction, DBC was measured for columns treated with two
different reagents at three different pH values. DBC is an important
characteristic of IEX columns, which determines column resolution and
loadability [152]. Therefore, it is reasonable to conclude that the reaction
yield (and IEX capacity) would be higher for the column that exhibited
higher DBC. Since the columns were designed for IEC of large
biomolecules, and to be consistent with the literature, lysozyme was
chosen to measure the DBC [9, 86, 152]. modification reaction. The
highest DBC values, expressed in mg/mL of polymer volume, were
measured at pH 10.5. Accordingly, a DBC of 5.4 mg/mL was measured
for the SEA column, which is better than the DBC of the Dionex ProPac
SCX column.

Chapter 4
101
Figure 4.5 shows typical results obtained for the columns modified with SEA.
Sharp breakthrough curves represent excellent mass transfer kinetics of the
columns, which is an inherent characteristic of monolithic materials. As
expected, DBC was increased by increasing the pH of Figure 4.5: Breakthrough
curves for lysozyme on poly(GMA‐co‐PETA) monolith modified with SEA at
different pH values. Conditions: 7 cm × 100 µm i.d. column; Eluent A: 10 mM
phosphate at pH 6.0, Eluent B: 1 M NaCl in A; Flow‐rate: 2 µL/min; Injection: 1.0
mg/mL lysozyme (5 µL); UV detection at 214 nm.
The PEA column had a DBC of 15.1 mg/mL, which is lower than the
value of 19.3 mg/mL reported by Dionex for the ProSwift WCX‐1S
monolithic column [94].
4.3.4 IEC of proteins: effect of eluent pH on selectivity
Eluent pH has a prominent effect on the separation efficiency of
proteins as it determines the extent of ionisation of both ion‐exchanger
Chapter 4
102
and solutes [152]. While pH has a negligible effect on the ionisation of
strong ion‐exchange sorbents, weak ion‐exchangers possess charged
functional groups only over a narrower pH range. Since pH can affect the
ionisation of a weak ion‐exchanger significantly, these type of sorbents
provide more opportunity for controlling the selectivity during method
optimisation [9].
Figures 4.6 and 4.7 show the effect of eluent pH on the separation
efficiency and selectivity of a test mixture consisting of five basic proteins
using columns modified with SEA and PEA, respectively. While
separation efficiency in terms of resolution and peak shape changed
markedly in both cases as a result of pH changes, the retention times of
all solutes except trypsinogen showed only small changes. The best
separation efficiency for the SEA column was achieved at pH 6.0 as a
result of more protonation of the proteins, which leads to narrower peaks
(as a result of longer retentions in the gradient elution). This is in
agreement with previous reports on increasing the peak capacity of CEX
columns in the separation of proteins by decreasing the pH [9, 86, 152].
Trypsinogen showed somewhat unusual behaviour; a single peak at pH
6.0 was split into two peaks at higher pH values with a dramatic change
in selectivity at pH 8.0. This is probably caused by a partial change in
protein conformation at some pH values.
The PEA column demonstrated the highest separation efficiency at
pH 7.0. While peaks appeared to be sharper with this column, more
resolution between cytochrome c and lysozyme was achieved with the

Chapter 4
103
Figure 4.6: Effect of eluent pH on the separation of standard proteins using SEA
column. Column: 15 cm × 100 μm i.d.; Eluent A: 10 mM phosphate (with
indicated pH), B: 1 M NaCl in A; Elution: 1% A for 5 min then linear gradient to
99% B in 10 min, 99% B for 5 min; Flow‐rate 1 μL/min; Inj. vol. 100 nL; UV
detection at 214 nm. Peak identifications: (1) albumin (7.1 μg/mL), (2)
trypsinogen (36 μg/mL), (3) α‐chymotrypsinogen A (36 μg/mL), (4) cytochrome
c (14.2 μg/mL) and (5) lysozyme (36 μg/mL).
‐5
45
95
145
195
245
0 5 10 15 20 25 30
mAU (214nm)
Time (min)
SEA
pH 8
pH 7
pH 6
12 2
3
4
5
1
2
23
4
5
1
2
34
5

Chapter 4
104
Figure 4.7: Effect of eluent pH on the separation of standard proteins using PEA
column. Conditions and peak identifications as in Figure 4.6.
‐5
45
95
145
195
0 5 10 15 20 25 30
mAU (214nm)
Time (min)
pH 8
pH 7
pH 6
1 22
3
45
1
2 3
4
5
1
23
4
5
PEA

Chapter 4
105
SEA column. Interestingly, at pH 8.0 both columns showed comparable
efficiency in terms of peak shape and selectivity for the studied proteins.
4.3.5 Hydrophobic interactions
Hydrophobic interactions between biomolecules and stationary
the phase are undesirable in IEC and developing a monolith with
minimal hydrophobic interaction was a major goal in this study.
Hydrophobic interactions can contribute greatly to the mechanism of
separation when using a high concentration of salt in the eluent [9, 86,
152]. The possible contribution of hydrophobic interactions on retention
times of proteins was studied using the PEA column and upon an
approach suggested in the literature [9, 86, 94, 152]. Accordingly, the
retention factors of the proteins were recorded in eluents containing
various concentrations of sodium chloride under isocratic conditions.
As shown in Figure 4.8, a linear dependence between logarithm of
retention factor and logarithm of salt concentration in the eluent
suggested that the separation was mainly governed by an IEX
mechanism, with a non‐significant contribution of hydrophobic
interactions [9, 86, 94, 152].
Figure 4.9 demonstrates a typical isocratic separation of four
proteins when using 0.85 M sodium chloride in 10 mM phosphate buffer
at pH 7.0 as eluent. The column also exhibited separation efficiency of
approximately 55,000 plates/m for the separation of lysozyme, which is

Chapter 4
106
0.35
0.37
0.39
0.41
0.43
0.45
0.47
0.49
0.51
0.53
0.55
‐0.7 ‐0.6 ‐0.5 ‐0.4 ‐0.3 ‐0.2 ‐0.1 0 0.1
Log k
Log [NaCl]
Lysozyme
Cytochrome C
a‐chymotrypsinogen A
Figure 4.8: Relationship between retention factor (k) and salt concentration in
isocratic separation of selected proteins. Conditions: 14 cm × 100 μm i.d. PEA
column; Eluent: 10 mM phosphate buffer pH 7.0 containing various
concentrations of NaCl; Flow‐rate: 1.0 μL/min; other conditions as in Figure 4.6.
superior to the efficiency of a WCX column (75 µm i.d.) developed by
Lee’s group (40,000 plates/m) [9], but still lower than another WCX
column that developed by the same group via co‐polymerisation of a
single phosphate‐containing dimethacrylate monomer (71,000 plates/m)
[86]. However, it is worth mentioning that they took advantage of on‐
column detection, which provides a higher efficiency as a result of
narrower peaks.
4.4 Conclusions
New polymer monoliths were prepared by thermally‐initiated co‐
polymerisation of GMA as a reacting monomer and PETA as a
hydrophilic cross‐linker. The monolith recipe and polymerisation

Chapter 4
107
1
2
3
4
0 .0 5 .0 1 0 .0 1 5 .0 2 0 .0
0
5 0
1 0 0
1 5 0
2 0 0
min
mAU (214 nm)
Figure 4.9: Representative chromatogram for isocratic separation of proteins
using the PEA column. Conditions: Eluent, 0.85 M sodium chloride in 10 mM
phosphate buffer at pH 7.0. Peaks are: Albumin (1), α‐chymotrypsinogen A (2),
cytochrome c (3) and lysozyme (4). Other conditions as in Figure 4.6.
conditions were optimised to obtain a monolith with characteristics
suitable for separation of biomacromolecules. While shrinking of the
material prevented making monoliths with conventional dimensions, the
monoliths were prepared successfully in 100 µm i.d. capillaries,
demonstrating homogeneity and good mechanical stability. The post‐
polymerisation modification of the monolith was performed via
optimised reaction conditions in order to incorporate CEX functionalities
using amine reagents containing phosphoric acid (WCX) or sulfonic acid
(SCX) groups. DBC values of up to 15.1 mg/mL were measured using
lysozyme as a standard probe, which is better or comparable to some of
the commercially available columns. Compared to a previously
developed monolith intended for the same purpose, the resulting

Chapter 4
108
monoliths also demonstrated higher separation efficiency (approximately
55,000 plates/m) in an isocratic separation of sample proteins.

Chapter 5
109
Chapter 5
Epoxy‐based Monoliths for Capillary Liquid
Chromatography of Small and Large Molecules
5.1 Introduction
Favourable characteristics, such as the relatively high permeability
leading to enhanced mass transfer, the simplicity of fabrication and
general biocompatibility have made polymer monoliths well‐suited for
the separation of biomolecules, from small peptides and oligonucleotides
to large intact proteins and plasmid DNA. However, the application of
polymer monoliths for the efficient separation of small molecules has still
remained a challenge. It has been hypothesised that this may be due to
their monomodal pore size distribution and the absence of mesopores
[176, 177], or alternatively due to the significant gel porosity in the
monolith scaffold in the swollen state, which arise from the inherent
heterogeneity associated with the free‐radical cross‐linking
copolymerisation synthesis [53, 178]. Moreover, organic polymer
monoliths may suffer from high swelling propensity in organic solvents,
leading to poor mechanical stability and reduced separation performance
[54, 175, 177]. This deficiency might be more prominent in the HILIC
mode, which involves higher contents of organic solvents in the mobile
phase than the reversed‐phase mode.

Chapter 5
110
Attempts have been made to address these limitations by tailoring
the porous properties of polymer monoliths in order to make them more
suitable for the separation of small molecules through, for example, low‐
density monolith preparations [55], incomplete polymerisation [174],
increasing the degree of cross‐linking [175], post‐polymerisation hyper‐
cross‐linking [179] and high‐temperature separations [180]. Nevertheless,
there are still some limitations or difficulties associated with these
approaches. For example, incomplete polymerisation could lead to a
decrease in mechanical stability and affect swelling propensity of the
polymer in organic solvents [181]. Hyper‐cross‐linking is a multistep
process which also causes a decrease in the column permeability [140].
Similarly, incorporation of carbon nanotubes into the polymer monoliths,
in order to enhance the separation efficiency of small molecules, led to a
3.8 fold increase in column back‐pressure, which resulted in applicable
flow‐rates lower than 0.25 μL/min [182]. An excellent review was
published recently by Nischang et al. which summarises recent advances
in polymer monoliths for the separation of small molecules and describes
in detail the challenges involved [54]. At the same time, inorganic (silica)
monoliths have proven to be well‐suited for the separation of small
molecules, but they also suffer from some drawbacks. These include poor
phase stability under extreme pH ranges, and a relatively complicated
synthetic process which is sensitive to small changes in conditions, as
well as radial inhomogeneity [54, 175, 177, 181, 183].
A recent approach to the preparation of porous polymer monoliths
is polycondensation [66], with which 3D skeletal structures can typically

Chapter 5
111
be created via polymerisation‐induced phase separation of epoxy resin
monomers and amine curing agents in, for example, PEG as pore‐forming
solvent at constant temperature [106, 108, 176]. Unlike in free radical
polymerisation, oxygen does not interfere in these reactions, so careful
de‐aeration of the polymerisation solution is not necessary. The chief
advantage of these materials is their inherent hydrophilicity originating
from the incorporation of heteroatoms (N and O) in their polymeric
scaffolds. This characteristic can be exploited for designing biocompatible
monoliths which are suitable for separation of biomolecules [74]. A wide
range of chemistries can also be incorporated on the surface of the
monolith via post‐polymerisation modification through residual epoxide,
hydroxyl and amine groups generated after curing. Xin et al. used
surface‐initiated atom transfer radical polymerisation approach for
grafting a hydrophobic monomer, N‐isopropylacrylamide, onto the
surface of E‐51 epoxy‐based monolith via residual hydroxyl groups [105].
The chromatographic performance of this material was demonstrated
using HIC of human serum proteins. More recently, weak‐anion
exchange WAX chromatography of glycoprotein isoforms was reported
using epoxy‐based monoliths [109]. Residual epoxides were treated with
ammonia solution to maximise the content of amino groups on the
surface.
The suitability of epoxy‐based monoliths for the separation of
small molecules was demonstrated by Hosoya et al. utilising capillary
columns prepared from the polycondensation of tris‐(2,3‐epoxypropyl)
isocyanurate [176], or alternatively, 1,3‐bis(N, N’‐

Chapter 5
112
diglycidylaminomethyl)cyclohexane [111] as the epoxide‐containing
monomer with 4‐[(4‐aminocyclohexyl)methyl] cyclohexylamine (BACM)
as the amine curing agent. Depending on the content of ACN in the
aqueous mobile phase, columns were operated in both HILIC and RPLC
modes and were claimed to exhibit high permeability and up to 133,000
theoretical plates per metre (N/m) for alkylbenzenes.
In this chapter this approach is extended and the synthesis of a
new epoxy‐based monolith is outlined and its suitability for separation of
both small molecule probes (including nucleic acid bases and nucleotides
as well as some benzoic acid derivatives) and tryptic peptides, as
examples of medium‐molecular weight solutes, is demonstrated in the
HILIC mode. Post‐polymerisation modification of monoliths was also
performed, enabling separation of protein standards under both IEX and
HIC modes. With this the aim is to demonstrate the versatility that is
offered by this approach, resulting in monolithic materials suitable for the
separation of both small and large molecules.
5.2 Experimental
The general experimental details, including chemicals and
instrumentation are presented in Chapter 2. Specific experimental
conditions are given in each of the figure captions.
5.2.1 Sample preparation
For HILIC analyses, solutes were dissolved in ACN/water or
ACN/0.1 M HCl at a concentration of 0.5‐5 mg/mL. Further dilutions

Chapter 5
113
were made in mobile phases. Stock solutions of proteins were prepared in
water (10 mg/mL), followed by further dilution to about 0.2 mg/mL in
eluent A (in the IEX mode) or eluent B (in the HIC mode). In the IEX
mode, eluent (A) was 10 mM phosphate buffer pH 6 and eluent (B) was 1
M sodium chloride in (A). In the HIC mode, eluent (A) was 3 M
ammonium sulfate in (B), which was 100 mM phosphate buffer pH 7.
5.2.2 Mass spectrometry
ESI‐MS analysis was performed in the positive ion mode with a
m/z range of 100‐2000. For MS/MS experiments, the two most abundant
precursor ions were subjected to collision‐induced dissociation at low
energy. Active exclusion was enabled on the instrument for two tandem
mass spectra with an exclusion time interval of 1 min.
The peptide identifications were performed using the on‐line
version of Mascot MS/MS ions search (Matrix Science Ltd., London, UK)
and the public database SwissProt. In data analysis, only one missed
cleavage was allowed with the mass tolerances of ± 0.5 Da for both
precursor and fragment ions. The deamination (N‐term C), Gln →Pyro‐
Glu (N‐term Q) and methionine oxidation were chosen as variable
modifications.
5.2.3 Polymer monolith preparation
Each polymerisation mixture was prepared in a 4‐mL glass vial by
mixing epoxy monomer (GE‐100) and porogen(s). The mixture was
vortex‐mixed without de‐aeration. Depending on the porogen used, some

Chapter 5
114
mixtures solidified upon the addition of porogen, so pre‐heating (60 °C)
of the mixture was required, followed by mixing again until formation of
a homogenous, transparent liquid occurred. Amine curing agent was
added subsequently followed by vortex‐mixing. The vial was kept
stationary and warm (T < 60 °C) for 1‐2 min to remove air bubbles. The
modified capillary was then quickly filled with this mixture using a
warm glass syringe before haziness reappeared. The polycondensation
polymerisation was conducted at different temperatures (70‐120 °C) for at
least 20 h. The monolithic column chosen for LC applications in this work
(M4 in Table 5.1) was prepared by polymerising a mixture consisting of
0.7 g GE‐100, 0.5 g PEG‐1000 (melted at 60 °C), 1.3 g 1‐decanol and 80 μL
EDA at 80 °C in a thermostated water bath for 22 h. Figure 5.1 shows
schematically the polycondensation reaction performed. Both ends of the
capillary were then cut and the column was connected to the HPLC
system and put inside the column compartment with the temperature
pre‐set at 50 °C in order to melt the solidified porogen inside the monolith
pores. The column was then washed sequentially with water and
methanol (~ 100 column volumes each). The excess of the polymerisation
mixture remaining in the glass vial was also polymerised under the same
conditions (this is referred to as the bulk monolith). After completion of
the reaction, the vial containing the bulk monolith was crushed carefully,
the polymer cut into small pieces, Soxhlet extracted with methanol
overnight to remove any soluble compounds, and vacuum dried (for at
least 24 h) prior to characterisation experiments.

Chapter 5
115
Table 5.1: Chemical composition and physical properties of monoliths
Monolith
Recipe Physical properties
GE‐100
(g)
EDA
(μL)
PEG‐k
(g)
PEG‐10k1
(g)
1‐decanol
(g)
1‐dodecanol
(g)
MPD2
(nm)
Dp3
(nm)
Pore vol.
(mL/g)
Porosity
(%)
Surface
area
(m2/g)
M1 0.7 80 ‐ 1.8 ‐ ‐ 1191 1160 0.76 47 1.6
M2 0.7 80 ‐ 1.5 0.3 ‐ 1048 1058 0.73 49 0.9
M3 0.7 80 0.5 ‐ ‐ 1.3 1764 1672 1.6 65 2.2
M4 0.7 80 0.5 ‐ 1.3 ‐ 716 659 1.22 62 3.6
M5 0.7 80 ‐ 1.8 ‐ ‐ 590 657 0.67 45 1.8
M6 0.9 102 ‐ 1.2 ‐ 0.3 1008 964 0.56 42 1.5
The mole ratio of epoxide to amine groups was 2:1 in all experiments; the weight ratio of monomers to porogen(s) is 3:7, except in 6
which was 4:6; Polymerisation temperature is 80 °C, except in 6 which was 90 °C. 1 20 %wt. solution in isopropanol (M2), methanol (M5) or 2‐methoxyethanol (M1 and M6). 2 Median pore diameter. 3 Pore size at the peak of pore distribution curve.

Chapter 5
116
Figure 5.1: Schematic polycondensation procedure for preparing epoxy‐based
monolith (M4). See text for more details.
5.2.4 Post‐polymerisation modifications
Acid hydrolysis of the residual epoxide groups was performed by
passing a 0.5 M sulfuric acid solution through the column at 30 μL/h for 4
h at 75 °C. Alternatively, neat EDA was pumped into the column at room
temperature for 2 h then the column was sealed at both ends and
submerged into a thermostated water bath for 5 h at 65 °C. After
completion of the reactions, both columns were flushed with water until
the outflow was neutral. The resultant columns contained mixed diol‐
amino and amino chemistries, respectively (see Figure 5.2a).
An IEX column was prepared following the procedure described
in Chapter 4 for the poly(GMA‐co‐PETA) monolith. Briefly, a 1 M
solution of SEA in 1 M carbonate buffer was prepared and the pH was
adjusted to 10.5 by adding sodium hydroxide solution (5 M). About 450
μL of this solution was pumped through the column for 24 h at 75 °C.
Acid hydrolysis of unreacted epoxides was then accomplished, as
described above for the diol‐amino column (see Figure 5.2b).
OO
O
O
OO
O
O
O
O
NH2
NH2
PEG‐1000, 1‐decanol80 °C, 22 h
OHO NH
NHOH
O
OO
OHO NH
NH2

Chapter 5
117
The HIC column was prepared by grafting a co‐polymerised
hydrogel N‐isopropylacrylamide (NIPAm) and methylenebisacrylamide
(BIS) on the pore surface of the epoxy monolith, using a procedure
previously reported by Peters et al. [184] with some modifications. Figure
5.2c schematically demonstrates the modification reactions. In the first
step a vinylisation reaction between residual epoxides and allylamine
was carried out. The column was washed with water and a 50 wt%
aqueous solution of allylamine was pumped through the column for 2 h
at 60 μL/h. Then the column was sealed at both ends and kept at 60 °C in
a water bath for 16 h, followed by extensive flushing with water until the
outflow was neutral. In the next step, a polymerisation mixture consisting
of NIPAm (9.9 wt%), BIS (0.1 wt%) and AIBN (1 wt% with respect to
monomers) was prepared in toluene, then centrifuged for 10 min at 3000
rpm to remove solid particles and deoxygenated with nitrogen for 10
min. The column was flushed with THF and toluene and the grafting
solution was pumped through at 60 μL/h for 2 h. The capillary was sealed
at both ends and placed in a water bath at 60 °C for 15 h. Finally, the
column was sequentially flushed with THF and water (4 h each) at 30
μL/min.

Chapter 5
118
Figure 5.2: Post‐polymerisation modifications of the monolith M4 via residual
epoxide groups. (a) acid hydrolysis and aminolysis, (b) IEX functionalisation
and (c) HIC chemistry.
OHO NH
O
OH
O
O
S
OO
1 M SEA in 1 M carbonate, pH 10.5
75 °C, 24 h
(b)
HO HN
(NIPAM-BIS)n
(NIPAM-BIS)n
NIPAM; BIS; AIBN
O
H2N
HO HN
O
NHCH2
O
NHNHCH2
O
CH2
NIPAM
BIS(c)
OO
OHO NH
NH2
OHO NH
NH2
OH
O OH
OHO NH
NH2
OHO NH
NH2
0.5 M H2SO4
EDA, neat
70 °C, 4 h
2 h, room T5 h, 65 °C
(Diol‐amino)
(Amino)
(a)

Chapter 5
119
5.3. Results and discussion
5.3.1 Monolith preparation
The aim of this work was to design a monolith that could be
suitable for both the separation of small molecules as well as larger
biomolecules. Therefore, monomers (epoxy resin and amine) were chosen
such that the final monolith should exhibit good biocompatibility [74].
GE‐100 was chosen as the epoxide‐containing monomer, and is a mixture
of di‐ and trifunctional epoxides based on glycidyl glycerol (Figure 5.1),
possessing enough hydrophilicity for this purpose. Although there are
only a few reports of epoxy‐based monoliths used for separations in the
literature, BACM has been used most as the amine curing agent [105, 111,
176]. However, EDA was preferred here since the cyclohexyl moieties in
BACM are likely to induce some degree of unwanted hydrophobicity to
the monolith structure.
PEG is a unique polymer. While its hydrophilic head group
comprising hydroxyl groups provides good water solubility at low
temperature, its polyoxyethylene chain allows solubility in most organic
solvents [185]. PEGs with different MW have been used successfully as
the primary choice for designing epoxy‐based monoliths [106, 108, 109,
111, 176].

Chapter 5
120
Figure 5.3: Scanning electron micrographs of some of the monoliths (Table 5.1);
(a) M1 (magnification 5000x), (b) M5 (5000x), (c) M3, (d) M4, (e) M3 (5000x), (f)
M4 (5000x).

Chapter 5
121
The polymerisation conditions leading to monoliths with 3D
scaffolds were obtained by trial and error. Mass conversions better than
90% were obtained by comparing the weight of the dry polymer monolith
to that of the monomers in the recipe. Primarily, the mole ratio of epoxide
functionality in GE‐100 to the amine group in EDA was varied from 5:1 to
1:5, while PEGs with MW of 200, 400, 800, 1000, and 10,000 (10k) were
used as porogen. For PEG‐10k, a 20 wt% solution in 2‐methoxyethanol
[185], methanol or isopropanol was employed. Transparent soft gels were
achieved at mole ratios higher than 3:1, even at temperatures as high as
120 °C, whereas non‐homogenous, amber coloured solids were obtained
for the ratio of 1:3. Phase separations leading to white, solid monoliths
appeared at mole ratios of 2:1 and 1.5:1, with more homogeneity in the
colour for the former.
The morphology of the polymer was also significantly affected by
the MW of PEG. By keeping the weight ratio of porogen to monomers
constant at 7:3, transparent, glassy gels with PEG‐200 and 400 turned into
translucent, and then semi‐hard materials by further increasing the MW
to 10k. Despite the homogenous morphology and 3D structure (Figure
5.3); the monolith prepared using a PEG‐10k solution in methanol as the
porogen showed significant shrinkage during polymerisation.
Substituting methanol with isopropanol resulted in a structure with a
thicker skeleton, yet less shrinkage. Porosimetry data showed an almost
2‐fold increase in median pore diameter with this change (Table 5.1). A

Chapter 5
122
very similar morphology was also obtained with PEG‐10k in 2‐
methoxyethanol.
Further investigation revealed the necessity of using a macropore‐
forming solvent as co‐porogen to obtain sufficient permeability in
monoliths prepared with PEG‐1000 as the porogen. In fact, a uniform and
solid structure with adequate permeability was never obtained when
PEGs smaller than 1000 were used as porogens, even in the presence of
appreciable amounts of co‐porogens. As is common with methacrylate‐
based monoliths, long‐chain alcohols, 1‐decanol and 1‐dodecanol, was
used as co‐porogen with weight ratios up to 28% with respect to the
porogen (PEG‐1000). As seen in Figure 5.3, fused globules of about 1.8
μm thickness were obtained with 1‐dodecanol, whereas 1‐decanol
resulted in a homogenous, sponge‐like structure. These differences are
also reflected in porosimetry data (Table 5.1) where monoliths with 1‐
dodecanol as co‐porogen exhibited median pore diameters almost 2.5
times larger than the monolith formed with 1‐decanol, yet with only 33%
difference in pore volume.
It is worth noting that the measured porosities were lower than
expected from the content of porogen in the monolith recipe (70%), which
could be due to the shrinkage of monoliths in the dry state, with
seemingly more shrinkage for monoliths prepared using PEG‐10k
solutions as the porogen.

Chapter 5
123
Based on the characterisation results, monolith M4 in Table 5.1
was chosen for surface modification and chromatographic evaluation. As
seen in Figure 5.3, this monolith also demonstrates the smallest domain
size, i.e., the combined average size of the macropores and microglobules.
Previous studies showed that the efficiency of monolithic stationary
phases increases by decreasing the domain size [55, 186]. Pore size
distribution profiles indicated that the majority of the total pore volume
(1.2 mL/g) in this monolith, 58%, corresponded to the pores in the range
of 500‐2000 nm and 23% in the range of 2000‐4600 nm, thus resulting in a
column with high permeability. Pores smaller than 500 nm (150‐500 nm)
represented only 19% of the total pore volume, with an absence of
mesopores (2‐50 nm), which is expected from the nonporous skeleton of
epoxy‐based monoliths in the dry state [66]. This monolith also exhibited
slightly higher surface area (Table 5.1) than the other monoliths, possibly
due to its sponge‐like morphology.
Column pressure drops were measured for the diol‐amino
modified column using ACN and water to evaluate the permeability and
mechanical stability of the synthesised monolith. A linear dependence of
flow‐rate on column back‐pressure (Figure 5.4) indicated that the
monolith was not compressed, at least up to 260 bar (~ 3.9 mm/s of
water). The permeability of the column was then measured as reported
elsewhere using Darcy’s equation [140]. Permeability values of 6.6 × 10‐14
and 5 × 10‐14 m2 were obtained respectively, using either ACN or water as
eluent. These results suggest swelling of the monolith in aqueous media,
which also reflects the desired hydrophilicity of monolith structure.

Chapter 5
124
y = 106.98x + 0.7605
R² = 0.9999
y = 28.514x ‐ 1.1333
R² = 0.99980
50
100
150
200
0 2 4 6 8
Pressure (bar)
Flow‐rate (µL/min)
Water
ACN
Figure 5.4: Correlation between column back‐pressure and flow‐rate in the diol‐
amino column (18.5 cm × 100 μm i.d.) using ACN and water as eluent.
5.3.2 Separation of small molecules
5.3.2.1 Nucleobases and nucleosides
Acid hydrolysis of residual epoxide groups increased the
hydrophilicity of the monolith surface. Together with residual amino
groups, the mixed diol‐amino chemistry obtained can provide a suitable
environment for separation under the HILIC mode. A group of
nucleobases and nucleosides, including thymine, uracil, uridine, cytosine,
adenosine, adenine, cytidine, deoxyguanosine and guanosine was chosen
to evaluate the separation performance of the column for some polar and
closely related neutral compounds that are known to be difficult to retain
in RPLC [187, 188]. Figure 5.5 shows a typical separation obtained with
up to 12% water in ACN. Although not all solutes were baseline resolved,

Chapter 5
125
Figure 5.5: Separation of nucleobases and nucleosides on the diol‐amino column
(18.5 cm × 100 μm i.d.). Conditions: eluent A, ACN; B, water; elution, 7% B (0‐
4min), 12% B (4.1‐15min); flow‐rate, 4 μL/min; injection vol., 100 nL; UV
detection at 254 nm. Peaks are toluene (void volume marker, 1), thymine (2),
uracil (3), uridine (4), cytosine (5), adenosine (6), adenine (7), cytidine (8),
deoxyguanosine (9) and guanosine (10).
the separation was completed in 10 min with the high permeability of the
column enabling a flow‐rate of 4 μL/min to be used.
A separation efficiency of 11,600 plates/m was recorded for the last
eluting solute (guanosine) through an isocratic elution (10% ACN), which
is about 30% higher than the efficiency reported previously for an epoxy‐
based monolith using the same eluent [176]. As expected for separations
in the HILIC mode, the retention times for all solutes increased with
increasing ACN concentration, which led to slightly higher resolutions
1
2
3
4 5
67
8
9
10

Chapter 5
126
between some pairs, but also with commensurate increases in peak
widths.
5.3.2.2 Benzoic acids
Columns with mixed‐mode behaviour have become increasingly
popular in the separation of highly polar molecules, including ions that
are weakly or not retained in RPLC [126, 188‐190]. Unlike RPLC, where
the means of controlling the separation selectivity are rather limited,
mixed‐mode chemistries provide more flexibility in method development
using variations in the eluent pH, ionic strength, or organic solvent
concentration and thus permit application to a wider range of analytes
[188, 191]. Owing to the presence of primary and secondary amine
functionality on the surface, the monolith prepared here is also expected
to offer the possibility of weak electrostatic interaction with charged
analytes. Similar to previous reports [188, 192, 193], a range of benzoic
acid derivatives was utilised to get a full picture of the contribution of
such effects to the overall retention mechanism.
The effect of ionic strength on the retention of seven benzoic acids was
investigated by varying the concentration of ammonium acetate buffer
(pH 5) from 10 to 50 mM in a constant 90% ACN. pH was adjusted using
acetic acid. As shown in Figure 5.6, the retention of all acids decreased by
increasing the buffer concentration, which is characteristic of an ion‐
exchange retention mechanism.

Chapter 5
127
Figure 5.6: The influence of buffer concentration on the retention factor of
benzoic acids. Conditions: diol‐amino column (24 cm × 100 μm i.d.); eluent:
ACN/ammonium acetate (at various concentrations) pH 5 (90:10), flow‐rate, 5
μL/min; UV detection at 280 nm. Solutes: 4‐propylbenzoic acid (4PBA), p‐
aminobenzoic acid (PABA), benzoic acid (BA), 2,3‐dihydroxybenzoc acid
(2,3DHBA), 4‐hydroxybenzoic acid (4HBA), 2,5‐dihydroxybenzoic acid
(2,5DHBA), and 2,4‐dihydroxybenzoic acid (2,4DHBA).
This behaviour is actually opposite to that expected from
consideration of the hydrophilic partitioning mechanism [125] suggested
to describe retention in the HILIC mode. In this model, hydrophilic
partitioning of polar solutes between relatively less polar bulk eluent and
a water‐enriched layer immobilised on the hydrophilic stationary phase
contributes mostly to the retention of analytes and this partitioning
would be increased by increasing the electrolyte concentration, leading to
greater retention of solutes [125, 127, 183, 188, 194].

Chapter 5
128
The observed retention behaviour can be explained by considering
the contribution of electrostatic interactions in a mixed‐mode mechanism
[190]. The pKa1 values for 4‐propylbenzoic acid (4PBA), p‐aminobenzoic
acid (PABA), benzoic acid (BA), 2,3‐dihydroxybenzoc acid (2,3DHBA), 4‐
hydroxybenzoic acid (4HBA), 2,5‐dihydroxybenzoic acid (2,5DHBA), and
2,4‐dihydroxybenzoic acid (2,4DHBA) are 4.4, 4.9, 4.2, 3.0, 4.6, 3.0 and 3.3,
respectively [195].
At pH 5 they will be partially or fully deprotonated, thus
interacting electrostatically with the protonated primary and secondary
amine functionalities on the surface of the monolith in a mixed HILIC‐
WAX mode. Decreases in solute retention by increasing the buffer
concentration at such a high content of ACN therefore reflects that the
ion‐exchange retention is more significant than the HILIC mode.
The effect of buffer pH on the HILIC separation of benzoic acids
was also investigated. Buffer pH was adjusted from 5 to 3.5 by adding
acetic acid to the buffer solution before mixing with ACN. The content of
ACN in the eluent and the concentration of buffer were kept constant at
90% and 40 mM, respectively. As can be seen in Figure 5.7, the retention
of 2,3DHBA, 2,4DHBA and 2,5DHBA, having pKa1 < 3, increased
continuously by decreasing the pH. Since there were no significant
changes in their ionisation states within the studied pH range, the
observed trends might occur because with decreasing eluent pH, WAX
sites on the stationary phase (estimated pKa ~ 8 and 9) became even more

Chapter 5
129
Figure 5.7: The influence of buffer pH on retention factor of benzoic acids.
Eluent: ACN/40 mM ammonium acetate with various pH (90:10). Other
conditions as in Figure 5.6.
protonated. This in turn would lead to stronger electrostatic interaction
and therefore longer retention times.
On the other hand, the retention factors of the other four acids
remained virtually unchanged between pH 5 and 4.5. Also, in this pH
range the elution order of 2,3DHBA and 4HBA was reversed, with a
crossover point around pH 4.6. Retention factors then decreased
modestly when the pH was decreased further to 3.5. This can be
attributed to the fact that when the pH approached the pKa1 values of the
acids, they became more protonated and the retention was governed by
the hydrophilicity of their undissociated forms [128]. Since hydrophilic

Chapter 5
130
interaction is mainly independent of pH [190], retention remained
relatively unaltered, except for 4HBA which showed a considerable
decrease in retention, possibly because of more polarity difference
between its dissociated and undissociated forms. Similar observations
were reported by Bui et al. for HILIC of organic acids using a column
packed with modified silica particles bearing both hydroxyl and amine
functionalities [183].
The aforementioned experimental data substantiate the key role of
electrostatic interactions in the HILIC mode. However, the contribution
of this effect to the overall retention also varies with the content of ACN
in the eluent. Figure 5.8 demonstrates a typical “U”‐shaped retention
versus solvent content curve, being reported frequently for mixed‐mode
chromatography [179, 188, 190]. The percentage of 40 mM ammonium
acetate buffer at pH 5 was changed in the eluent within the 10‐50% range.
As can be seen, the retention time of all seven acids decreased by
decreasing the ACN concentration from 90 to 80%, which clearly
demonstrates the hydrophilic partitioning effect. Also, the elution order
of 2,3DHBA and 4HBA changed once again. Worth noting is the
similarity of retention behaviour of solutes with similar acidity (pKa1).
This retention versus solvent dependency might also be explained by an
ion‐exchange effect.

Chapter 5
131
Figure 5.8: The influence of ACN content on retention factor of benzoic acids.
Eluent: 40 mM ammonium acetate, pH 5 with various concentrations of ACN,
flow‐rate, 3 μL/min. Other conditions as in Figure 5.6.
Although the pH and concentration of the buffer were kept
constant, a decrease in the concentration of the organic solvent would
lead to an increase in the activity of eluent ions, ammonium and acetate,
due to solvation enhancement, or as suggested by Liu and Pohl [190] an
increase in the ionisation of eluent ions, which in turn causes a decrease
in the retention of solutes. In fact, the content of organic solvent in the
eluent also affects the extent of ionisation of both solutes and stationary
phase; and therefore, the electrostatic attraction between them. With a
further decrease in ACN content from 80 to 60%, the retention behaviour
of benzoic acids with pKa1 values around 4, i.e., 4PBA, PABA, BA and
4HBA suggests a compromise between the attraction forces and the

Chapter 5
132
aforementioned ion‐exchange effect, demonstrated by an almost constant
(PABA) or marginally increased retention over this range. A change in
selectivity is also apparent for PABA and 4PBA, with a crossover point at
70% ACN. By comparison, the retention of the remaining three acids
(pKa1 ~ 3) was increased markedly by this change, suggesting an ion‐
exchange effect superimposed by electrostatic attractions. This might be
because the extent of deprotonation of these relatively stronger acids is
greater than the first group. Further decreasing the concentration of ACN
to 50% showed almost similar upward trends in retention of all benzoic
acids, possibly due to even stronger electrostatic attractions.
Column temperature has been well known as an influential
parameter in HPLC separations, significantly affecting both mobile phase
viscosity as well as solute diffusivity, and its partial molar enthalpy of
transfer between mobile and stationary phases [196‐198]. Gradient
elution in combination with temperature programming also showed an
improvement in resolution and separation efficiency of phenolic acids in
the HILIC mode [193]. Very recently, Causon et al. demonstrated the
usefulness of temperature programming, and particularly temperature
pulsing, for separation optimisation in capillary LC [199]. The effect of
temperature on retention and selectivity of benzoic acids in HILIC
conditions was briefly investigated at column temperatures of 30, 45 and
60 °C.

Chapter 5
133
Figure 5.9: Effect of column temperature on separation of benzoic acids.
Conditions: eluent, ACN/40 mM ammonium acetate pH 5 (90:10); solutes, (1)
4PBA, (2) PABA, (3) BA, (4) 2,3DHBA, (5) 4HBA, (6) 2,5DHBA, and (7)
2,4DHBA; other conditions as in Figure 5.6.
As seen in Figure 5.9, the expected decrease in retention with
increasing temperature was observed only for PABA and 4HBA, with a
more significant decrease for the latter. In comparison, the behaviour of
other solutes appeared to be more complicated; the retention increased
when increasing the temperature to 45 °C, then remained unchanged or
decreased slightly when the temperature increased further to 60 °C.
This seemingly anomalous behaviour has been attributed to the
nature of solutes and differences in their interactions with the mobile and
stationary phases [197]. Generally speaking, when retention remains

Chapter 5
134
independent of temperature, the slope of the van’t Hoff plots (log k versus
1/T), which corresponds to the contribution of the solute transferring
enthalpy from mobile to stationary phases, would be close to zero,
suggesting that the retention is probably governed entropically [193].
This is also another indication of the involvement of ionic interactions in
the overall retention mechanism of the acids studied in this work.
Improvements in separation efficiency at elevated temperatures
were also observed, although this was at the cost of an increase in peak
tailing for some of the solutes. Theoretical plate numbers as high as
17,000 plates/m were obtained for the last eluted peak (2,4DHBA) at 60
°C, demonstrating about 17% enhancement in comparison to 30 °C.
Although the observed separation efficiency of the polymer‐based
columns for small molecules was relatively low, particularly in the HILIC
mode, these values are still superior to the best plate numbers previously
reported for HILIC of phenolic acids (N/m = 11,600 for 4‐hydroxyphenyl
acetic acid at 80 °C) utilizing zwitterionic monoliths [193].
5.3.3 Separation of peptides
The suitability of the prepared monolith for the separation of the
medium size molecules was examined via analysis of peptides released
from a tryptic digest of cytochrome c. The analysis of peptides in the
HILIC mode has become popular due to the intrinsic advantages of the
technique, such as the compatibility of the mobile phase with ESI‐MS
which results in enhanced detection sensitivity, and the equivalent or

Chapter 5
135
0
1
2
3
45x
10In
tens
.
500
1000
1500
m/z
5 10 15 20 25 30 35 Time [min]
Figure 5.10: Base peak chromatogram (upper panel) and the corresponding
density view of cytochrome c tryptic digest analysed by HILIC‐ESI‐qTOF‐MS.
Conditions: diol‐amino column (24 cm × 100 μm i.d.); eluent (A) 0.1 % (v/v)
formic acid in ACN, (B) 0.1 % formic acid in water; elution, 5‐70 % B in 25 min,
70 % B for 5 min. Sample concentration, 0.5 mg/mL; injection vol., 100 nL;
constant column pressure of 100 bar was employed.
better orthogonality of HILIC with RPLC (compared to SCX) in multi‐
dimensional approaches [130].
The performance of the diol‐amino column was therefore
evaluated for the peptide fragment fingerprinting. The separation was
carried out by running a linear gradient of 0.1% formic acid in ACN to
0.1% formic acid in water. Since most peptides are positively charged at
low pH due to the presence of basic amino acids, such as arginine and
lysine as well as the terminal amino groups, and because of the expected
positive charge on the monolith surface due to the protonation of amino
groups, electrostatic repulsion‐hydrophilic interaction is likely to govern
the separation mechanism here, as suggested by Alpert [126].

Chapter 5
136
The base peak chromatogram as well as the corresponding density
view is shown in Figure 5.10. The various peptides with diverse charge
states and m/z values, derived from the tryptic digested cytochorme c,
were detected over the mass range of 400 to 1800 Da with different
retention times varying from 7 to 25 min. Additionally, the presence of
the undigested protein was also observed with its typical charge state
ladder, being eluted between 24 and 29 min. The peptides and their
amino acid sequence were identified in a consecutive LC‐MS/MS run.
Despite a restricted number of selected precursor ions (2) per scan, the
obtained MS/MS results showed a high sequence coverage of 80%, when
the results were elaborated with MASCOT. The identified peptide
fragments are listed in Table 5.2.
Although not optimised for chromatographic resolution, this
separation demonstrated the potential of this column type for peptide
separations. Further investigation on analysis of the tryptic digest was
performed employing the amino column. The base peak chromatogram
(BPC) corresponding to the separation of tryptic peptides at neutral pH is
indicated in Figure 5.11. Nearly baseline separation of more than ten
peptides was obtained, with sharp and symmetrical peak shape. This
separation is clearly superior to that obtained with the diol‐amino
column under acidic pH. This result might be explained by considering
the fact that under the less acidic conditions when employing neutral
buffer, the positive charge density on the surface of the column decreases.
Together with using a higher ionic strength in the composition of the
eluent, this results in weaker ionic interactions between the positively

Chapter 5
137
Table 5.2: Identified tryptic peptides from the digestion of horse cytochrome c
by HILIC‐ESI‐MS/MS.
Observed mass
(Da)
Calculated
mass MH+ (Da)
Residue Sequence
634.3876 (+1) 633.3850 10‐14 IFVQK
584.8068 (+2) 1167.6149 29‐39 TGPNLHGLFGR
648.8550 (+2) 1295.7099 29‐40 TGPNLHGLFGRK
920.9538 (+2) 1839.9115 40‐56 KTGQAPGFTYTDANKNK
614.3055 (+3) 1839.9115 40‐56 KTGQAPGFTYTDANKNK
735.8397 (+2) 1469.6787 41‐54 TGQAPGFTYTDANK
856.9067 (+2) 1711.8166 41‐56 TGQAPGFTYTDANKNK
1041.0071 (+2) 2080.0186 57‐73 GITWKEETLMEYLENPK
694.3409 (+3) 2080.0186 57‐73 GITWKEETLMEYLENPK
737.0375 (+3) 2208.1136 57‐74 GITWKEETLMEYLENPKK
678.3731 (+1) 677.3748 75‐80 YIPGTK
779.4364 (+1) 778.4411 81‐87 MIFAGIK
454.2682 (+2) 906.5361 81‐88 MIFAGIKK
907.5301 (+1) 906.5361 81‐88 MIFAGIKK
493.6064 (+3) 1477.8140 89‐100 KTEREDLIAYLK
739.9063 (+2) 1477.8140 89‐100 KTEREDLIAYLK
803.9525 (+2) 1605.9090 89‐101 KTEREDLIAYLKK
536.3045 (+3) 1605.9090 89‐101 KTEREDLIAYLKK
675.8589 (+2) 1349.7190 90‐100 TEREDLIAYLK
charged stationary phase and peptides with net negative charges, leading
to peaks with less tailing and improved resolution. These observations
are also in accordance with the results reported previously by others, and
verify significant enhancement in the separation of complex peptide
mixtures resulting from an increase in the eluent pH [130].

Chapter 5
138
0.0
0.5
1.0
1.5
2.0
2.5
3.06x10
Intens.
5 10 15 20 25 30 35 40 Time [min]
Figure 5.11: BPC for HILIC‐ESI‐IT‐MS of cytochrome c tryptic digest.
Conditions: amino column (23 cm × 100 μm i.d.); eluent (A) ACN, (B) 20 mM
ammonium formate pH 6.2; elution, 5‐60 % B in 30 min, 60 % B for 5 min. Flow‐
rate, 1 μL/min; Sample concentration, 0.3 mg/mL; injection vol., 100 nL.
5.3.4 Separation of proteins
One particularly attractive feature of the epoxy‐based monoliths is
that once polymerisation conditions are optimised for the desired porous
properties, pendant reactive groups on the surface can be exploited for
incorporating different chemistries through a wide variety of reactions
(such as aminolysis or hydrolysis) without the need for re‐optimisation of
polymerisation conditions. While simple hydrolysis of residual epoxide
groups resulted in chemistries suitable for separation of small molecules,
the same residual epoxides were targeted for introducing chemistries
appropriate for the separation of proteins.
Unlike for peptides, protein denaturation is a common issue in
RPLC due to the addition of organic solvents and the strong hydrophobic

Chapter 5
139
interactions involved [74]. An appreciable level of organic solvents also
reduces the solubility of biomolecules by decreasing the dielectric
constant of the mobile phase [200]. Due to the mild separation conditions
involved, IEC, HIC and SEC are therefore methods of choice when
preserving proteins in their native conformations is important. While the
absence of any kind of interaction between the analytes and the
stationary phase is an ideal situation for SEC, hydrophilicity of the
separation matrix in HIC, and pore surface in IEC, are preferred in order
to prevent non‐specific interactions [74, 94].
The developed epoxy‐based monoliths were found to possess sufficient
hydrophilicity in the monolith scaffold to be suitable for the separation of
biomolecules. By taking into account the mole ratio of 2:1 for epoxide to
amine in the monomers, an epoxy value of 0.68 mol/100g for GE‐100 and
a reaction efficiency of 90%, and assuming that both amino groups of
EDA were incorporated into the condensation reaction, the content of the
residual epoxides in the obtained monolith would roughly be 3.6 mmol/g,
which is only 16% lower than the classic poly(GMA‐co‐EDMA) monolith
containing 24% GMA. SCX functionalities were then incorporated into
the pores through a ring‐opening modification of residual epoxides.
Because of the presence of amino functionalities in both the monolith
skeleton and on the pore surface, the resultant monolith would in fact
exhibit a mixed WAX‐SCX chemistry.
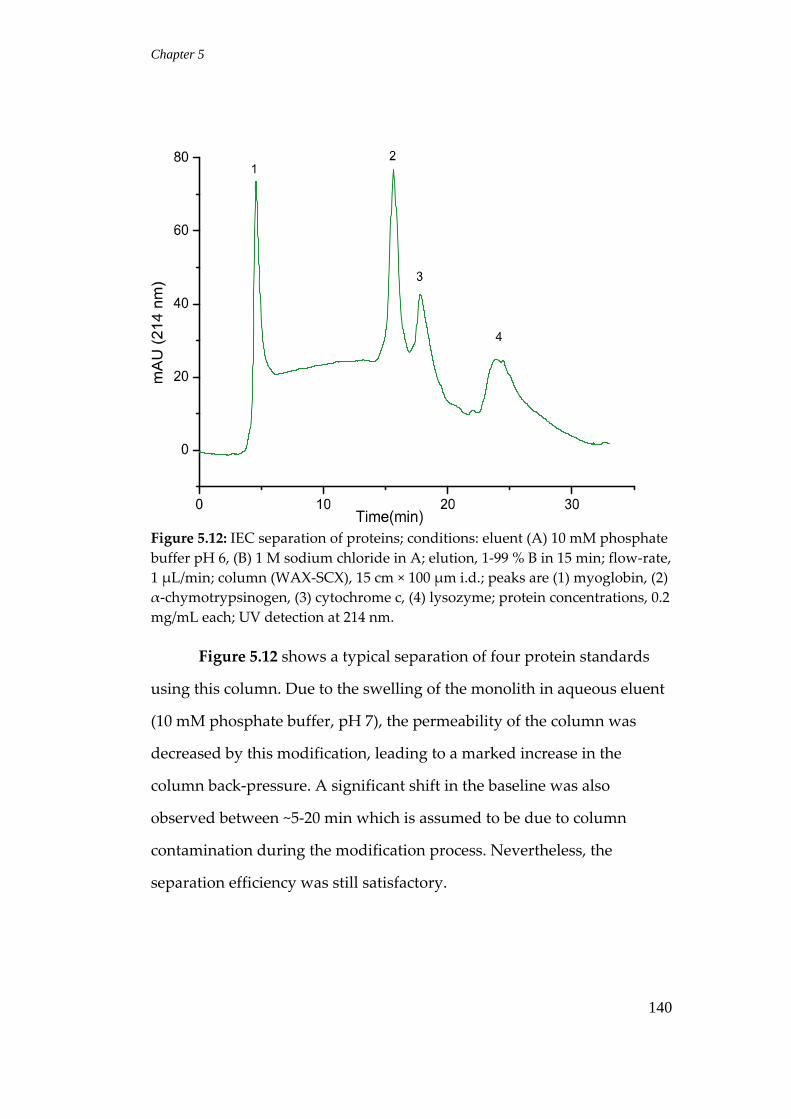
Chapter 5
140
Figure 5.12: IEC separation of proteins; conditions: eluent (A) 10 mM phosphate
buffer pH 6, (B) 1 M sodium chloride in A; elution, 1‐99 % B in 15 min; flow‐rate,
1 μL/min; column (WAX‐SCX), 15 cm × 100 μm i.d.; peaks are (1) myoglobin, (2)
α‐chymotrypsinogen, (3) cytochrome c, (4) lysozyme; protein concentrations, 0.2
mg/mL each; UV detection at 214 nm.
Figure 5.12 shows a typical separation of four protein standards
using this column. Due to the swelling of the monolith in aqueous eluent
(10 mM phosphate buffer, pH 7), the permeability of the column was
decreased by this modification, leading to a marked increase in the
column back‐pressure. A significant shift in the baseline was also
observed between ~5‐20 min which is assumed to be due to column
contamination during the modification process. Nevertheless, the
separation efficiency was still satisfactory.

Chapter 5
141
1
2
3
5+6
4
7
8
Figure 5.13: HIC separation of proteins; conditions: HIC column (18 cm × 100
μm i.d.); eluent (A) 3 M ammonium sulfate in B, (B) 100 mM phosphate buffer
pH 7; elution, 0‐100 % B in 15 min, 100 % B for 5 min; flow‐rate, 0.8 μL/min;
peaks: (1) cytochrome c, (2) myoglobin, (3) ribonuclease A, (4) β‐lactoglobulin
a&b, (5) transferrin, (6) ovalbumin, (7) trypsin, (8) α‐chymotrypsinogen; protein
concentrations, 0.2 mg/mL each; UV detection at 214 nm.
Usually in HIC stationary phases, mildly hydrophobic ligands are
incorporated in a hydrophilic matrix at a concentration of about 10‐100
times lower than RP sorbents [81]. The hydrophilicity of the scaffold in
the monoliths developed in this work was therefore exploited by
integrating hydrophobic chains on the pore surface through a grafting
approach. Separation of a test mixture consisting of eight protein
standards in the HIC mode is shown in Figure 5.13. This column
demonstrated superior separation efficiency than its IEX counterpart over
the same retention timeframe. Noteworthy is the high concentration of

Chapter 5
142
weak eluent (3 M ammonium sulfate) utilised in order to retain all
solutes.
Although cytochrome c was not retained and was eluted at the
void time, its peak was not broad or distorted, as seen before under the
same conditions [81]. These observations, along with the narrow peak
shapes found for other proteins, would suggest a mild hydrophobicity of
the modified monolith along with the absence of non‐specific
interactions, giving suitability for separations in the HIC mode.
5.3.5 Reproducibility
The batch‐to‐batch reproducibility and run‐to‐run repeatability
were evaluated utilising two independently prepared and modified
columns for HIC separation of proteins. Since a multi‐step process is
involved in preparing this type of chemistry and two different people
prepared the columns, this approach offered a good test of the column
reproducibility. Separation parameters, including retention factor (k),
peak area (A) and resolution (Rs) were determined for four well‐resolved
proteins, namely, myoglobin, ribonuclease A, trypsinogen and α‐
chymotrypsinogen A, from five runs (n = 5). Average relative standard
deviations (RSDs) of 0.7, 1.7 and 0.4% were obtained for k, A and Rs,
respectively, suggesting a high reproducibility of column preparation
and modification procedures.
One important qualification for HILIC stationary phases is their
water retaining property, which reflects the chemical stability of the

Chapter 5
143
material. Inter‐day reproducibility of the developed monolith for the
HILIC separation of small molecules was also tested by using a diol‐
amino column continuously for several days and then storing it in
aqueous mobile phase for a few weeks. Resuming chromatography of
nucleobases and nucleosides using this column showed only minor
changes in retention factors of solutes, indicating good chemical stability
of the prepared monolith.
5.4 Conclusion
Homogenous, highly hydrophilic epoxy‐based monoliths were
prepared using a polycondensation polymerisation approach. The
materials showed high mechanical and chemical stability. Although a
decrease in permeability was observed when the polarity of eluents was
increased, this did not affect the stability or reproducibility of the column.
Diol functionalities, incorporated with simple acid hydrolysis of residual
epoxide groups, together with residual amino groups, afforded a unique
chemistry for HILIC or mixed‐mode separations, depending on the type
of analyte and separation conditions. While hydrophilic partitioning
appeared to be the primary mechanism involved in retention of highly
polar neutral solutes, it was accompanied by electrostatic interactions for
charged solutes. The extent of contribution of each effect on the retention
and selectivity of acids was shown to be influenced by separation
conditions, such as the content of ACN in the eluent, buffer concentration
and pH, and the temperature, offering a wider application range with

Chapter 5
144
more flexibility for retention and selectivity tuning during method
development.
The HILIC separation of tryptic peptides using this chemistry was
also promising. In this case, due to the presence of positive charge on the
surface of both analytes and stationary phase, the separation mechanism
seemed to be a compromise between electrostatic repulsion and
hydrophilic interactions. Surface modification of the monolith also
enabled efficient separation of proteins under IEC and HIC modes, with
absence of non‐specific interactions stemming from the inherent
hydrophilicity of the monolith scaffold.
The aforementioned qualities, along with the possibility of
incorporating functionalities with a wide variety of properties, can
actually widen the applicability of epoxy‐based monoliths, especially for
bioseparations, which is the focus of future investigations.

Chapter 6
145
Chapter 6
General Conclusions and Future Directions
The suitability of polymer monolith for bioseparations has been
well accepted and demonstrated in a considerable number of
publications. In this regard, developing biocompatible monolithic
materials featuring minimal non‐specific interactions is desirable in order
to achieve higher separation efficiency, as a result of better peak shapes,
and to preserve the structure of the biomolecules. Two new polymer
monoliths were developed in this study possessing this particular feature
(hydrophilicity).
A poly(GMA‐co‐PETA) monolith was prepared in 100 µm i.d.
capillaries via thermally‐initiated radical co‐polymerisation. PETA as a
hydrophilic cross‐linker supplied the desired hydrophilicity to the
monolith, whereas GMA as a reactive monomer provided the epoxide
groups that were exploited for post‐polymerisation modification of the
monolith. The resulting WCX column containing phosphoric acid
functionality, and SCX column containing sulfonic acid functionality
demonstrated good separation performance for standard proteins with
acceptable dynamic binding capacities compared to the previously
reported monoliths used for the same purpose. Ion‐exchange capacity
and resulting separation performance enhancement for these columns
was predicted by further improvement in the quality of the post‐
polymerisation reactions. For example, the epoxide groups can be

Chapter 6
146
converted to more reactive aldehyde groups, which react readily with
amines even in aqueous media and at room temperature [201, 202].
Another possibility is conducting the modification reaction at a pH of 14.
In one report, published in 1977 [203], it was shown that at pH 14 (1 M
sodium hydroxide) 60% of the epoxide groups in a co‐polymer of GMA‐
EDMA remained preserved even after 9 h at 90 °C. Very recently, the
suitability of this approach was demonstrated by surface modification of
a poly(GMA‐co‐EDMA) capillary monolithic column with cystamine
[204]. The reaction was performed twice at 50 °C for only 1h each time,
probably in order to prevent hydrolysis of siloxane bonds.
Grafting of functionalised monomers is a widely used approach to
increase the density of functional groups on the surface of polymers
leading to an increase in loading capacity. In this regard, a “grafting from”
approach through which polymer chains are grown from a surface that
was functionalised previously with initiator moieties is particularly
suitable for controlling the density of the grafted layer and the prevention
of homopolymerisation of the grafting monomer in solution. In
monolithic materials, such homopolymerisation can cause a decrease in
the permeability of the monolith. Among all “grafting from” approaches,
attachment of an azo initiator to the pore surface of the monolith appears
to be the most convenient and straightforward approach. Commercially
available initiators, such as 4,4’‐azobis(4‐cyanovaleric acid) (ACVA), can
be attached directly to the monoliths containing, for example, benzyl
chloride functionalities via nucleophilic displacement of the chloride
groups [205]. Alternatively, ACVA can be first derivatised to 4,4’‐

Chapter 6
147
azobis(4‐cyanovaleric acid chloride) before attachment to a monolith
containing nucleophilic groups, such as amine or thiol functionalities
[206].
The application of polymer monoliths for the efficient separation
of small molecules has still remained a challenge, mostly due to their
monomodal pore size distribution and the absence of mesopores, or
alternatively, due to the significant gel porosity in the monolith scaffold
in the swollen state [54, 178]. Several attempts have been made to address
these limitations, but the more straightforward ones are probably the low
density polymerisation [55] and incomplete polymerisation [178]. Low
density polymerisation can be achieved by lower percentage of
monomers in the polymerisation mixture (typically 20% wt.), whereas
incomplete polymerisation is accomplished by termination of
polymerisation reaction shortly after starting the reaction (30 min in a
typical example [178]. Both approaches resulted in smaller domain size,
represented by the combined average size of the macropores and
microglobules, leading to significant improvement in the separation of
small molecules.
Polycondensation polymerisation is a relatively new approach in
making monolithic materials. Using this approach, homogeneous and
highly hydrophilic epoxy‐based monoliths were developed for the
separation of small molecule probes and peptides as well as proteins as
large biomolecules. Diol functionalities incorporated with simple acid
hydrolysis of residual epoxide groups, together with residual amino

Chapter 6
148
groups, afforded a unique chemistry for HILIC or mixed‐mode
separations, depending on the type of analyte and separation conditions.
Due to the presence of residual amino groups, their density can be
increased through the reaction of residual epoxide groups with amines,
such as ethylenediamine. Further investigation on modification of the
surface chemistry of these materials can be performed via a “grafting
from” approach, as described above. A wide range of monomers with a
variety of chemical properties can be incorporated into the pores. For
example, incorporation of zwitterionic monomers, which are highly
suitable for HILIC of small molecules and peptides [122, 131, 188, 192],
can be grafted to the pores of the developed epoxy‐based monolith.
Because of the hydrophilicity of the monolith scaffold, very hydrophilic
monoliths are expected after grafting, which together with the high
permeability of these materials can serve as a suitable platform for
proteomics studies.
There is an increasing interest on mixed‐mode stationary phases,
featuring multiple functionalities which enable, for example,
comprehensive analysis of complex samples by taking advantage of more
than one‐type of interactions between solutes and stationary phase [207].
While the developed epoxy‐based monolith is mixed‐mode by nature,
other mixed chemistries than HILIC‐IEX can also be feasible to introduce,
such as RP‐HILIC. RP chemistry can be added to the monolith backbone
via substituting EDA with a hydrophobic amine such as BACM, or
through reacting the residual epoxide groups with hydrophobic reagents.
While the former approach requires re‐optimisation of the monolith

Chapter 6
149
recipe, due to the difference in reactivity of amine curing agents, the latter
approach is a post‐polymerisation modification and seems to be more
straightforward.
As mentioned earlier, the efficiency of monolithic stationary
phases for the separation of small molecules can be increased by
decreasing the monolith domain size, i.e., the combined average size of
the macropores and microglobules. Further enhancement in the
morphology of the developed epoxy‐based monolith thus recommended
for this purpose. It was shown theoretically that domain geometry can
also have a significant contribution into the column efficiency, with more
efficiency was suggested for honeycomb‐like structure in comparison to
hexagonal or circular shapes [208]. This was attributed to the perfect
homogeneity of the flow‐through pore network leading to up to 10 times
smaller Eddy dispersion (the A term in the Van Deemter equation).
Unfortunately, attempts at making the developed polymer
monoliths in conventional bore format were unsuccessful due mostly to
the considerable post‐polymerisation shrinkage of the materials. Among
all approaches tried, mechanical compression of the monolith provided a
more promising column. As mentioned in Chapter 4, this approach has
been successfully used by Dionex for making its polymer monolithic
columns inside 4.6 mm i.d. PEEK and stainless steel tubes. Special
hardware is required, which is commercially available. Figure 6.1 shows
the model provided by Grace (www.discoverysciences.com). Standard
HPLC column end‐fittings can also be used but the insert (piston) has to

Chapter 6
150
Figure 6.1: The empty HPLC column hardware provided by Grace.
be made in‐house. To be successful with this approach, the monolith
needs to demonstrate enough swelling upon elution with some solvents
(chosen based on the polarity of the monolith) to fill the gaps between the
monolith body and the column wall. Optimisation of the polymerisation
recipe is needed to obtain monoliths with adequate swelling propensity
(for more information about swelling propensity of packing materials see,
for example, [209]).
Both polymer‐based monoliths, prepared by free radical
polymerisation approach, and silica‐based monoliths are suffer from
structural inhomogeneity [54], which can adversely affect their separation
efficiency by increasing the Eddy dispersion in the column. More
homogeneous structures can be obtained by employing other
polymerisation approaches, such as polycondensation, which was
performed in this study for the preparation of epoxy‐based monoliths.
Another approach can be unidirectional freezing. Kim et al. [210] reported

Chapter 6
151
on preparation of honeycomb‐structured porous monoliths of poly(L‐
lactic acid) by combining pseudo‐steady state unidirectional freezing and
freeze‐drying techniques. Unfortunately, they didn’t report any
chromatographic study on these materials, but as mentioned before
separation enhancement owing to significant reduction in Eddy
dispersion is expected from these monoliths.
It is known that a pH gradient IEC can provide superior
separation efficiency for biomolecules in terms of peak capacity and
resolution compared to its salt‐gradient counterpart. This technique has
been well accepted as an alternative to preparative gel electrophoresis for
isolation and purification of large proteins, such as antibodies from
biological matrices [45]. Recently, the suitability of the pH gradient
approach for quality control applications, such as resolving charge
heterogeneity of mAbs was also demonstrated [17, 21]. Similarly, the
same application was targeted, by developing single component buffer
systems based on a novel concept called shallow pH gradient over cation‐
exchange (CEX) monolithic columns. Unlike previous reports, a very low
concentration of eluents also enabled direct connection of the separation
system to MS for further characterisation.
Although very promising for the investigated purpose, the
developed pH gradient approach may suffer from some limitations, such
as gradual pH transition of eluents due to the very low concentrations
(typically < 5 mM). Combinations of buffer components that cover a
wider pH range and provide more stable buffer capacities are therefore

Chapter 6
152
recommended. Due to the ongoing increase of the importance of
miniaturisation, further investigations in this area can also be performed
by employing capillary IEX columns. The author is aware of only two
reports on pH gradient separations using microbore (0.32 mm i.d.)
columns [32, 211].
Unfortunately, one issue here is the difficulty of monitoring the
pH profile for capillary columns during the elution. Monitoring the pH
profile is usually performed to ensure its linearity. However, it has also
been shown that high resolution pH gradient separation can still be
achieved when the pH profile is not linear, provided the profile has an
appropriate slope [36]. Given that the slope of the pH profile can be
manipulated by changing the concentration (and pH) of eluents,
optimisation of the separation can still be achieved by trial and error
without knowing the shape of the pH profile.
An external pH gradient was proposed to address some of the
limitations associated with its traditional internal counterpart. As
discussed in Chapter 3, the main concerns with CF originate from the
polyampholyte elution buffers. Some studies have shown that
comparable separations can also be achieved by substituting
polyampholytes with simple buffer mixtures (see for example [36]). One
great advantage of CF is that it is performed isocraticaly and the
composition of both retaining (equilibrating) and eluting buffers can be
optimised separately. Also, similar buffer mixtures to those employed in
external pH gradients can be used with weak ion‐exchange stationary

Chapter 6
153
phases. Thus, employing capillary monolithic columns in the CF
approach appears to offer new opportunities for bioseparation, which can
be targeted for future investigations.

154
References
[1] OʹKeefe, D. O., in: Ahuja, S. (Ed.), Handbook of Bioseparations, Academic
Press 2000, pp. 23‐70.
[2] Reichert, J. M., Valge‐Archer, V. E., Nature Reviews 2007, 6, 349‐356.
[3] Dibner, M. D., BioPharm 1997, 10, 24‐30.
[4] Bischoff, R., Bouchon, B., in: Aboul‐Enein, H. Y. (Ed.), Analytical and
Preparative Separation Methods of Biomacromolecules, Marcel Dekker, New
York 1999, pp. 13‐37.
[5] Aguilar, M.‐I., in: Aguilar, M.‐I. (Ed.), HPLC of Peptides and Proteins,
Humana Press 2004, pp. 3‐8.
[6] Mant, C. T., Hodges, R. S., High‐Performance Liquid Chromatography of
Peptides and Proteins: Separation, Analysis, and Conformation, Taylor &
Francis 1991.
[7] Ion‐Exchange Chromatography: Principles and Methods, Amersham
Biosiences, Uppsala, Sweden 1999.
[8] Wang, F., Dong, J., Jiang, X., Ye, M., Zou, H., Anal. Chem. 2007, 79,
6599‐6606.
[9] Chen, X., Tolley, H. D., Lee, M. L., J. Sep. Sci. 2011, 34, 2063‐2071.
[10] Stanton, P., in: Aguilar, M.‐I. (Ed.), HPLC of Peptides and Proteins,
Humana Press 2004, pp. 23‐43.
[11] Ajit, S., in: Ahuja, S. (Ed.), Bioseparation of Proteins‐Unfolding/Folding
and Validations, Academic Press 1998, pp. 135‐176.
[12] Lesins, V., Ruckenstein, E., J. Colloid Interf. Sci. 1989, 132, 566.
[13] Kopaciewicz, W., Regnier, F. E., Anal. Biochem. 1983, 133, 251‐259.
[14] Rounds, M. A., Regnier, F. E., J. Chromatogr. 1984, 283, 37.
[15] Regnier, F. E., Science 1987, 238, 319‐323.
[16] Ahamed, T., Chilamkurthi, S., Nfor, B. K., Verhaert, P. D., van
Dedem, G. W., van der Wielen, L. A., Eppink, M. H., van de Sandt, E. J.,
Ottens, M., J. Chromatogr., A 2008, 1194, 22‐29.
[17] Farnan, D., Moreno, G. T., Anal. Chem. 2009, 81, 8846‐8857.

155
[18] Pabst, T. M., Antos, D., Carta, G., Ramasubramanyan, N., Hunter, A.
K., J Chromatogr A 2008, 1181, 83‐94.
[19] Pabst, T. M., Carta, G., J. Chromatogr., A 2007, 1142, 19‐31.
[20] Perez, J. S., Frey, D. D., Biotechnol. Prog. 2005, 21, 902.
[21] Rozhkova, A., J. Chromatogr., A 2009, 1216, 5989‐5994.
[22] Yamamoto, S., Ishihara, T., J. Chromatogr., A 1999, 852, 31.
[23] Kang, X., Frey, D., J. Chromatogr., A 2003, 991, 117‐128.
[24] Tsonev, L. I., Hirsh, A. G., Am. Biotechnol. Lab. 2009, 27, 10‐12.
[25] Moorhouse, K. G., Nashabeh, W., Deveney, J., Bjork, N. S., Mulkerrin,
M. G., Ryskamp, T., J. Pharm. Biomed. Anal. 1997, 16, 593‐603.
[26] Teshima, G., Stults, J. T., Ling, V., Canova‐Davis, E., J. Biol. Chem.
1991, 266, 13544‐13547.
[27] Sluyterman, L. A. Æ., Kooistra, C., J. Chromatogr., A 1989, 470, 317‐
326.
[28] Sluyterman, L. A. Æ., Wijdenes, J., J. Chromatogr., A 1981, 206, 441‐
447.
[29] Sluyterman, L. A. Æ., Wijdenes, J., J. Chromatogr., A 1981, 206, 429‐
440.
[30] Sluyterman, L. A. A. E., Elgersma, O., J. Chromatogr., A 1978, 150, 17‐
30.
[31] Sluyterman, L. A. A. E., Wijdenes, J., J. Chromatogr., A 1978, 150, 31‐
44.
[32] Andersen, T., Pepaj, M., Trones, R., Lundanes, E., Greibrokk, T., J.
Chromatogr., A 2004, 1025, 217‐226.
[33] Liu, Y., Anderson, D. J., J. Chromatogr., A 1997, 762, 207‐217.
[34] Kang, X., Frey, D. D., Anal. Chem. 2002, 74, 1038‐1045.
[35] Shan, L., Anderson, D. J., Anal. Chem. 2002, 74, 5641‐5649.
[36] Kang, X., Bates, R. C., Frey, D. D., J. Chromatogr., A 2000, 890, 37‐43.
[37] Kang, X., Frey, D. D., Biotechnol. Bioeng. 2004, 87, 376‐387.
[38] Shan, L., Anderson, D. J., J. Chromatogr., A 2001, 909, 191‐205.

156
[39] Shan, L., Hribar, J. A., Zhou, X., Anderson, D. J., J. Am. Soc. Mass.
Spec. 2008, 19, 1132‐1137.
[40] Waldrep, J. C., Schulte, J. R., Reg. Immunol. 1989, 2, 22‐32.
[41] Khawli, L. A., Goswami, S., Hutchinson, R., Kwong, Z. W., Yang, J.,
Wang, X., Yao, Z., Sreedhara, A., Cano, T., Tesar, D., Nijem, I., Allison, D.
E., Wong, P. Y., Kao, Y. H., Quan, C., Joshi, A., Harris, R. J., Motchnik, P.,
MAbs 2010, 2, 613‐624.
[42] Vlasak, J., Ionescu, R., Curr. Pharm. Biotechnol. 2008, 9, 468‐481.
[43] Liu, H., Gaza‐Bulseco, G., Faldu, D., Chumsae, C., Sun, J., J. Pharm.
Sci. 2008, 97, 2426‐2447.
[44] Rea, J. C., Moreno, G. T., Lou, Y., Farnan, D., J. Pharm. Biomed. Anal.
2011, 54, 317‐323.
[45] Mhatre, R., Nashabeh, W., Schmalzing, D., Yao, X., Fuchs, M.,
Whitney, D., Regnier, F., J. Chromatogr., A 1995, 707, 225‐231.
[46] Lyubarskaya, Y., Houde, D., Woodard, J., Murphy, D., Mhatre, R.,
Anal. Biochem. 2006, 348, 24‐39.
[47] Pristatsky, P., Cohen, S. L., Krantz, D., Acevedo, J., Ionescu, R.,
Vlasak, J., Anal. Chem. 2009, 81, 6148‐6155.
[48] Santora, L. C., Krull, I. S., Grant, K., Anal. Biochem. 1999, 275, 98‐108.
[49] Tao, D., Zhang, L., Shan, Y., Liang, Z., Zhang, Y., Anal. Bioanal. Chem.
2011, 399, 229‐241.
[50] Freitag, R., Allington, R. W., Brüggemann, O., Frechet, J. M. J.,
Imamoglu, S., Necina, R., Podgornik, A., Strancar, A., Svec, F., Modern
Advances in Chromatography, Springer 2002.
[51] Giddings, J. C., Anal. Chem. 1984, 56, 1258A‐1260A, 1262A, 1264A
passim.
[52] Rozenbrand, J., van, B. W. P., J. Sep. Sci. 2011, 34, 1934‐1944.
[53] Nischang, I., Teasdale, I., Brueggemann, O., Anal. Bioanal. Chem. 2011,
400, 2289‐2304.
[54] Nischang, I., Teasdale, I., Bruggemann, O., Anal. Bioanal. Chem. 2011,
400, 2289‐2304.

157
[55] Eeltink, S., Herrero‐Martinez, J. M., Rozing, G. P., Schoenmakers, P.
J., Kok, W. T., Anal. Chem. 2005, 77, 7342‐7347.
[56] Gritti, F., Guiochon, G., J. Chromatogr., A 2009, 1216, 4752‐4767.
[57] Aoki, H., Tanaka, N., Kubo, T., Hosoya, K., J. Sep. Sci. 2009, 32, 341‐
358.
[58] Hjertén, S., Liao, J.‐L., Zhang, R., J. Chromatogr., A 1989, 473, 273‐275.
[59] Svec, F., Frechet, J. M. J., Anal. Chem. 1992, 64, 820‐822.
[60] Svec, F., Frechet, J. M., J. Chromatogr., A 1995, 702, 89‐95.
[61] Wang, Q. C., Svec, F., Frechet, J. M., Anal. Chem. 1995, 67, 670‐674.
[62] Deverell, J. A., Rodemann, T., Smith, J. A., Canty, A. J., Guijt, R. M.,
Sensors and Actuators B: Chemical 2011, 155, 388‐396.
[63] Ott, S., Niessner, R., Seidel, M., J. Sep. Sci. 2011, 34, 2181‐2192.
[64] Peskoller, C., Niessner, R., Seidel, M., J. Chromatogr., A 2009, 1216,
3794‐3801.
[65] Pflegerl, K., Podgornik, A., Berger, E., Jungbauer, A., J. Comb. Chem.
2002, 4, 33‐37.
[66] Svec, F., J. Chromatogr., A 2010, 1217, 902‐924.
[67] Svec, F., Fréchet, J. M. J., Indust. Eng. Chem. Res. 1998, 38, 34‐48.
[68] Vazquez, M., Paull, B., Anal. Chim. Acta 2010, 668, 100‐113.
[69] Nordborg, A., Hilder, E. F., Anal. Bioanal. Chem. 2009, 394, 71‐84.
[70] Buchmeiser, M. R., Polymer 2007, 48, 2187‐2198.
[71] Urban, J., Jandera, P., J. Sep. Sci. 2008, 31, 2521‐2540.
[72] Bakry, R., Huck, C. W., Bonn, G. K., J. Chromatogr. Sci. 2009, 47, 418‐
431.
[73] Arrua, R. D., Talebi, M., Causon, T. J., Hilder, E. F., Anal. Chim. Acta
2012, 738, 1‐12.
[74] Li, Y., Lee, M. L., J. Sep. Sci. 2009, 32, 3369‐3378.
[75] Hemstroem, P., Nordborg, A., Irgum, K., Svec, F., Frechet, J. M. J., J.
Sep. Sci. 2006, 29, 25‐32.

158
[76] Kennedy, L. A., Kopaciewicz, W., Regnier, F. E., J. Chromatogr. 1986,
359, 73‐84.
[77] Gu, B., Li, Y., Lee, M. L., Anal. Chem. 2007, 79, 5848‐5855.
[78] Xie, S., Svec, F., Fréchet, J. M. J., J. Polym. Sci. A Polym. Chem. 1997, 35,
1013‐1021.
[79] Palm, A. K., Novotny, M. V., Rapid Commun Mass Spectrom 2004, 18,
1374‐1382.
[80] Peterka, M., Glover, D., Kramberger, P., Banjac, M., Podgornik, A.,
Barut, M., Strancar, A., Bioprocess. J. 2005, 4, 79.
[81] Li, Y., Tolley, H. D., Lee, M. L., J. Chromatogr., A 2010, 1217, 4934‐
4945.
[82] Gu, B., Armenta, J., Lee, M., J. Chromatogr., A 2005, 1079, 382‐391.
[83] Li, Y., Tolley, H. D., Lee, M. L., J. Chromatogr., A 2010, 1217, 8181‐
8185.
[84] Chen, X., Tolley, H. D., Lee, M. L., J. Chromatogr., A 2010, 1217, 3844‐
3854.
[85] Gu, B., Chen, Z., Thulin, C. D., Lee, M. L., Anal. Chem. 2006, 78, 3509‐
3518.
[86] Chen, X., Tolley, H. D., Lee, M. L., J. Chromatogr., A 2011, 1218, 4322‐
4331.
[87] Wang, X., Lin, X., Xie, Z., Electrophoresis 2009, 30, 2702‐2710.
[88] Nordborg, A., Hilder, E. F., Anal Bioanal Chem 2009, 394, 71‐84.
[89] Bruchet, A., Dugas, V., Mariet, C., Goutelard, F., Randon, J., J. Sep.
Sci. 2011, 34, 2079‐2087.
[90] Cao, Q., Xu, Y., Liu, F., Svec, F., Frechet, J. M., Anal. Chem. 2010, 82,
7416‐7421.
[91] Preinerstorfer, B., Lindner, W., Lammerhofer, M., Electrophoresis 2005,
26, 2005‐2018.
[92] Wieder, W., Bisjak, C. P., Huck, C. W., Bakry, R., Bonn, G. K., J. Sep.
Sci. 2006, 29, 2478‐2484.

159
[93] Bruchet, A., Dugas, V., Laszak, I., Mariet, C., Goutelard, F., Randon,
J., J. Biomed. Nanotechnol. 2011, 7, 415‐425.
[94] Krenkova, J., Gargano, A., Lacher, N. A., Schneiderheinze, J. M.,
Svec, F., J. Chromatogr., A 2009, 1216, 6824‐6830.
[95] Hilder, E., Svec, F., Frechet, J., J. Chromatogr., A 2004, 1053, 101‐106.
[96] Nilsson, C., Birnbaum, S., Nilsson, S., J. Chromatogr., A 2007, 1168,
212‐224; discussion 211.
[97] Jackson, P. E., Haddad, P. R., Ion Chromatography, Elsevier Science
1990, p 60.
[98] Thayer, J. R., Flook, K. J., Woodruff, A., Rao, S., Pohl, C. A., J.
Chromatogr., B 2010, 878, 933‐941.
[99] Xu, Y., Cao, Q., Svec, F., Fréchet, J. M. J., Anal. Chem. 2010, 82, 3352‐
3358.
[100] Gao, H., Min, K., Matyjaszewski, K., Macromolecules 2007, 40, 7763‐
7770.
[101] Kannurpatti, A. R., Anseth, J. W., Bowman, C. N., Polymer 1998, 39,
2507‐2513.
[102] Andrzejewska, E., Prog. Polym. Sci. 2001, 26, 605‐665.
[103] Svec, F., Frechet, J. M. J., Chem. Mater. 1995, 5, 707‐715.
[104] Hosoya, K., Hira, N., Yamamoto, K., Nishimura, M., Tanaka, N.,
Anal. Chem. 2006, 78, 5729‐5735.
[105] Xin, P., Shen, Y., Qi, L., Yang, G., Chen, Y., Talanta 2011, 85, 1180‐
1186.
[106] Tsujioka, N., Hira, N., Aoki, S., Tanaka, N., Hosoya, K.,
Macromolecules 2005, 38, 9901‐9903.
[107] Nguyen, A. M., Irgum, K., Chem. Mater. 2006, 18, 6308‐6315.
[108] Tsujioka, N., Ishizuka, N., Tanaka, N., Kubo, T., Hosoya, K., J.
Polym. Sci. A Polym. Chem. 2008, 46, 3272‐3281.
[109] Liu, J., Ren, L., Liu, Y., Li, H., Liu, Z., J. Chromatogr., A 2012, 1228,
276‐282.

160
[110] Nischang, I., Svec, F., Frechet, J. M. J., J. Chromatogr., A 2009, 1216,
2355‐2361.
[111] Hosoya, K., Mori, T., Sakamoto, M., Kubo, T., Kaya, K.,
Chromatographia 2009, 70, 699‐704.
[112] Wang, F., Chen, R., Zhu, J., Sun, D., Song, C., Wu, Y., Ye, M., Wang,
L., Zou, H., Anal. Chem. 2010, 82, 3007‐3015.
[113] Shen, Y., Zhao, R., Berger, S. J., Anderson, G. A., Rodriguez, N.,
Smith, R. D., Anal. Chem. 2002, 74, 4235‐4249.
[114] Tao, D., Zhu, G., Sun, L., Ma, J., Liang, Z., Zhang, W., Zhang, L.,
Zhang, Y., Proteomics 2009, 9, 2029‐2036.
[115] Giddings, J. C., Anal Chem 1984, 56, 1258A‐1260A, 1262A, 1264A
passim.
[116] Nischang, I., Svec, F., Frechet, J. M., Anal. Chem. 2009, 81, 7390‐7396.
[117] Guiochon, G., J. Chromatogr., A 2007, 1168, 101‐168; discussion 100.
[118] Ivanov, A. R., Zang, L., Karger, B. L., Anal. Chem. 2003, 75, 5306‐
5316.
[119] Zhang, J., Wu, S.‐L., Kim, J., Karger, B. L., J. Chromatogr., A 2007,
1154, 295‐307.
[120] Ro, K. W., Nayak, R., Knapp, D. R., Electrophoresis 2006, 27, 3547‐
3558.
[121] Moravcova, D., Kahle, V., Rehulkova, H., Chmelik, J., Rehulka, P., J.
Chromatogr., A 2009, 1216, 3629‐3636.
[122] Di Palma, S., Boersema, P. J., Heck, A. J., Mohammed, S., Anal.
Chem. 2011, 83, 3440‐3447.
[123] Wang, F., Dong, J., Jiang, X., Ye, M., Zou, H., Anal Chem 2007, 79,
6599‐6606.
[124] Link, A. J., Eng, J., Schieltz, D. M., Carmack, E., Mize, G. J., Morris,
D. R., Garvik, B. M., Yates, J. R., 3rd, Nature Biotechnol. 1999, 17, 676‐682.
[125] Alpert, A. J., J. Chromatogr. 1990, 499, 177‐196.
[126] Alpert, A. J., Anal. Chem. 2008, 80, 62‐76.
[127] Guo, Y., Gaiki, S., J. Chromatogr., A 2005, 1074, 71‐80.

161
[128] Hatambeygi, N., Abedi, G., Talebi, M., J. Chromatogr., A 2011, 1218,
5995‐6003.
[129] Alpert, A. J., Shukla, M., Shukla, A. K., Zieske, L. R., Yuen, S. W.,
Ferguson, M. A., Mehlert, A., Pauly, M., Orlando, R., J. Chromatogr., A
1994, 676, 191‐122.
[130] Yang, Y., Boysen, R. I., Hearn, M. T., J. Chromatogr., A 2009, 1216,
5518‐5524.
[131] Boersema, P. J., Mohammed, S., Heck, A. J., Anal. Bioanal. Chem.
2008, 391, 151‐159.
[132] Scott, N. E., Parker, B. L., Connolly, A. M., Paulech, J., Edwards, A.
V., Crossett, B., Falconer, L., Kolarich, D., Djordjevic, S. P., Hojrup, P.,
Packer, N. H., Larsen, M. R., Cordwell, S. J., Mol. Cell Proteomics 2011, 10,
M000031‐MCP000201.
[133] Wu, C. J., Chen, Y. W., Tai, J. H., Chen, S. H., J. Proteome Res. 2011,
10, 1088‐1097.
[134] Gilar, M., Olivova, P., Daly, A. E., Gebler, J. C., Anal. Chem. 2005, 77,
6426‐6434.
[135] Boersema, P. J., Divecha, N., Heck, A. J., Mohammed, S., J. Proteome
Res. 2007, 6, 937‐946.
[136] Ahamed, T., Nfor, B. K., Verhaert, P. D., van Dedem, G. W., van der
Wielen, L. A., Eppink, M. H., van de Sandt, E. J., Ottens, M., J.
Chromatogr., A 2007, 1164, 181‐188.
[137] Dean, J. A., Langeʹs Handbook of Chemistry, McGraw‐Hill, New York
1999.
[138] Rohr, T., Hilder, E. F., Donovan, J. J., Svec, F., Fréchet, J. M. J.,
Macromolecules 2003, 36, 1677‐1684.
[139] Smirnov, K. N., Dyatchkov, I. A., Telnov, M. V., Pirogov, A. V.,
Shpigun, O. A., J. Chromatogr., A 2010, 1218, 5510‐5519.
[140] Urban, J., Svec, F., Frechet, J. M., J. Chromatogr., A 2010, 1217, 8212‐
8221.
[141] Etzel, M. R., Riordan, W. T., J. Chromatogr., A 2009, 1216, 2621‐2624.

162
[142] Perkins, M., Theiler, R., Lunte, S., Jeschke, M., Pharm. Res. 2000, 17,
1110‐1117.
[143] Harris, R. J., Kabakoff, B., Macchi, F. D., Shen, F. J., Kwong, M.,
Andya, J. D., Shire, S. J., Bjork, N., Totpal, K., Chen, A. B., J. Chromatogr., B
2001, 752, 233‐245.
[144] Q6B: Specifications: Test procedures and acceptance criteria for
biotechnology, Federal Register 1996, 63, 31506‐31513.
[145] Tsonev, L. I., Hirsh, A. G., J. Chromatogr., A 2008, 1200, 166‐182.
[146] Sosic, Z., Houde, D., Blum, A., Carlage, T., Lyubarskaya, Y.,
Electrophoresis 2008, 29, 4368‐4376.
[147] He, Y., Lacher, N. A., Hou, W., Wang, Q., Isele, C., Starkey, J.,
Ruesch, M., Anal. Chem. 2010, 82, 3222‐3230.
[148] Xie, S., Allington, R. W., Svec, F., Frechet, J. M. J., J. Chromatogr., A
1999, 865, 169‐174.
[149] Nordborg, A., Zhang, B., He, X. Z., Hilder, E. F., Haddad, P. R., J.
Sep. Sci. 2009, 32, 2668‐2673.
[150] Liu, Y., Anderson, D. J., J. Chromatogr., A 1997, 762, 47‐54.
[151] Rehder, D. S., Dillon, T. M., Pipes, G. D., Bondarenko, P. V., J.
Chromatogr., A 2006, 1102, 164‐175.
[152] Chen, X., Tolley, H. D., Lee, M. L., J Chromatogr A 2010, 1217, 3844‐
3854.
[153] Wolters, D. A., Washburn, M. P., Yates, J. R., 3rd, Anal. Chem. 2001,
73, 5683‐5690.
[154] Alpert, A. J., Andrews, P. C., J. Chromatogr. 1988, 443, 85‐96.
[155] Chen, X., Tolley, H. D., Lee, M. L., J. Sep. Sci. 2009, 32, 2565‐2573.
[156] Peters, E. C., Petro, M., Svec, F., Frechet, J. M., Anal. Chem. 1998, 70,
2288‐2295.
[157] Yang, G., Liu, H., Zhang, Y., Wang, S., Yin, J., Yin, B., Chen, Y., J.
Chromatogr., A 2006, 1129, 231‐235.
[158] Bruchet, A., Dugas, V., Mariet, C., Goutelard, F., Randon, J., J Sep Sci
2011, n/a‐n/a.

163
[159] Wang, M., Xu, J., Zhou, X., Tan, T., J. Chromatogr., A 2007, 1147, 24‐
29.
[160] Dinh, N. P., Cam, Q. M., Nguyen, A. M., Shchukarev, A., Irgum, K.,
J. Sep. Sci. 2009, 32, 2556‐2564.
[161] Hutchinson, J. P., Hilder, E. F., Shellie, R. A., Smith, J. A., Haddad,
P. R., Analyst 2006, 131, 215‐221.
[162] Ueki, Y., Umemura, T., Li, J., Odake, T., Tsunoda, K., Anal. Chem.
2004, 76, 7007‐7012.
[163] Li, Y., Gu, B., Tolley, H. D., Lee, M. L., J. Chromatogr., A 2009, 1216,
5525‐5532.
[164] Krenkova, J., Lacher, N. A., Svec, F., Anal. Chem. 2009, 81, 2004‐2012.
[165] Chen, M. L., Wei, S. S., Yuan, B. F., Feng, Y. Q., J. Chromatogr., A
2012, 1228, 183‐192.
[166] Gunasena, D. N., El Rassi, Z., J. Sep. Sci. 2011.
[167] Lin, J., Lin, J., Lin, X., Xie, Z., J. Chromatogr., A 2009, 1216, 801‐806.
[168] Wang, X., Lin, X., Xie, Z., Giesy, J. P., J. Chromatogr., A 2009, 1216,
4611‐4617.
[169] Huang, H., Lin, Z., Lin, Y., Sun, X., Xie, Y., Zhang, L., Chen, G., J.
Chromatogr., A 2012, 1251, 82‐90.
[170] Wang, X., Ding, K., Yang, C., Lin, X., Lu, H., Wu, X., Xie, Z.,
Electrophoresis 2010, 31, 2997‐3005.
[171] Courtois, J., Bystrom, E., Irgum, K., Polymer 2006, 47, 2603‐2611.
[172] Sykora, D., Svec, F., Frechet, J. M., J. Chromatogr., A 1999, 852, 297‐
304.
[173] Allington, R. W., Xie, S., Jiang, T., Xu, M., Isco, Inc., USA; Dionex
Corporation . 2004, pp. 54 pp., Cont.‐in‐part of U.S. Ser. No. 180,350.
[174] Greiderer, A., Trojer, L., Huck, C. W., Bonn, G. K., J. Chromatogr., A
2009, 1216, 7747‐7754.
[175] Lubbad, S. H., Buchmeiser, M. R., J. Sep. Sci. 2009, 32, 2521‐2529.
[176] Hosoya, K., Hira, N., Yamamoto, K., Nishimura, M., Tanaka, N.,
Anal Chem 2006, 78, 5729‐5735.

164
[177] Liu, K., Tolley, H. D., Lee, M. L., J. Chromatogr., A 2012, 1227, 96‐104.
[178] Nischang, I., Bruggemann, O., J. Chromatogr., A 2010, 1217, 5389‐
5397.
[179] Urban, J., Svec, F., Frechet, J. M., Anal. Chem. 2010, 82, 1621‐1623.
[180] Causon, T. J., Shellie, R. A., Hilder, E. F., Analyst 2009, 134, 440‐442.
[181] Greiderer, A., Ligon, S. C., Jr., Huck, C. W., Bonn, G. K., J. Sep. Sci.
2009, 32, 2510‐2520.
[182] Chambers, S. D., Svec, F., Frechet, J. M., J. Chromatogr., A 2011, 1218,
2546‐2552.
[183] Bui, T. N., Verhage, J. J., Irgum, K., J. Sep. Sci. 2010, 33, 2965‐2976.
[184] Peters, E. C., Svec, F., Fréchet, J. M. J., Adv. Mater. 1997, 9, 630‐633.
[185] Courtois, J., Byström, E., Irgum, K., Polymer 2006, 47, 2603‐2611.
[186] Siouffi, A. M., J Chromatogr A 2006, 1126, 86‐94.
[187] Chen, M. L., Li, L. M., Yuan, B. F., Ma, Q., Feng, Y. Q., J. Chromatogr.,
A 2012, 1230, 54‐60.
[188] Jiang, Z., Smith, N. W., Ferguson, P. D., Taylor, M. R., Anal. Chem.
2007, 79, 1243‐1250.
[189] Gilar, M., Yu, Y. Q., Ahn, J., Fournier, J., Gebler, J. C., J. Chromatogr.,
A 2008, 1191, 162‐170.
[190] Liu, X., Pohl, C. A., J. Sep. Sci. 2010, 33, 779‐786.
[191] Zhang, K., Dai, L., Chetwyn, N. P., J. Chromatogr., A 2010, 1217,
5776‐5784.
[192] Jiang, Z., Smith, N. W., Ferguson, P. D., Taylor, M. R., J. Sep. Sci.
2009, 32, 2544‐2555.
[193] Skerikova, V., Jandera, P., J. Chromatogr., A 2010, 1217, 7981‐7989.
[194] Hemstrom, P., Irgum, K., J. Sep. Sci. 2006, 29, 1784‐1821.
[195] Dean, J. A., McGraw‐Hill, New York 1999.
[196] Horvath, C. G., Preiss, B. A., Lipsky, S. R., Anal. Chem. 1967, 39,
1422‐1428.
[197] Hao, Z., Xiao, B., Weng, N., J. Sep. Sci. 2008, 31, 1449‐1464.

165
[198] Padivitage, N. L., Armstrong, D. W., J. Sep. Sci. 2011, 34, 1636‐1647.
[199] Causon, T. J., Cortes, H. J., Shellie, R. A., Hilder, E. F., Anal. Chem.
2012, 84, 3362‐3368.
[200] Chen, X., Tolley, H. D., Lee, M. L., J Sep Sci 2011.
[201] Dong, X., Dong, J., Ou, J., Zhu, Y., Zou, H., Electrophoresis 2007, 28,
2606‐2612.
[202] Gunasena, D. N., El, R. Z., J. Sep. Sci. 2011, 34, 2097‐2105.
[203] Hrudkova, H., Svec, F., Kalal, J., Brit. Polym. J. 1977, 9, 238‐240.
[204] Lv, Y., Lin, Z., Svec, F., Analyst 2012, 137, 4114‐4118.
[205] Tripp, J. A., Svec, F., Frechet, J. M., J. Comb. Chem. 2001, 3, 216‐223.
[206] Peng, X. T., Yuan, B. F., Feng, Y. Q., J. Sep. Sci. 2011, 34, 3123‐3130.
[207] Lammerhofer, M., Richter, M., Wu, J., Nogueira, R., Bicker, W.,
Lindner, W., J Sep Sci 2008, 31, 2572‐2588.
[208] Gzil, P., De Smet, J., Vervoort, N., Verelst, H., Baron, G. V., Desmet,
G., J Chromatogr A 2004, 1030, 53‐62.
[209] Nevejans, F., Verzele, M., J. Chromatogr. 1985, 350, 145.
[210] Kim, J.‐W., Taki, K., Nagamine, S., Ohshima, M., Chemical
Engineering Science 2008, 63, 3858‐3863.
[211] Li, Y. M., Liao, J. L., Zhang, R., Henriksson, H., Hjerten, S., Anal.
Biochem. 1999, 267, 121‐124.