new york state item evaluation ... table 8.1 average rasch difficulty by grade span and ... test...
TRANSCRIPT

NEW YORK STATE TESTING PROGRAM
ENGLISH AS A SECOND LANGUAGE ACHIEVEMENT
TEST (NYSESLAT)
2006 ADMINISTRATION
TECHNICAL MANUAL
SUBMITTED BY
HARCOURT ASSESSMENT, INC.
DECEMBER 2007

2006 NYSESLAT Technical Manual
Page 2
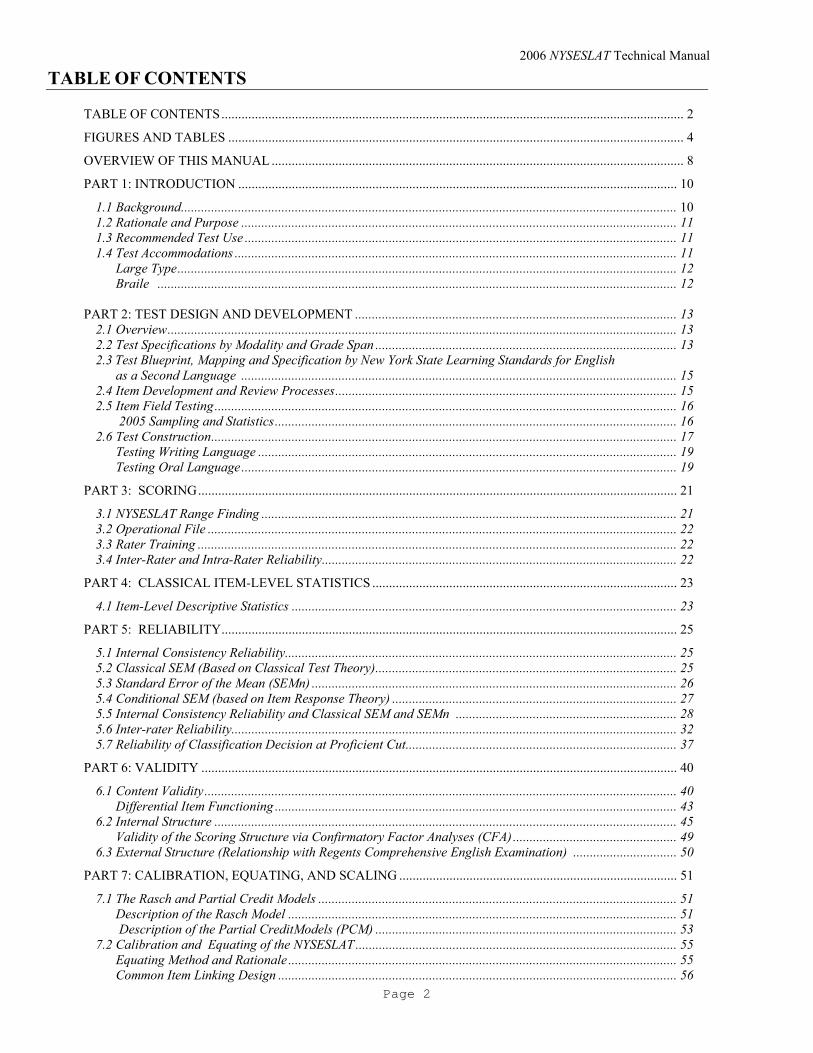
TABLE OF CONTENTS
TABLE OF CONTENTS.......................................................................................................................................... 2 FIGURES AND TABLES ........................................................................................................................................ 4 OVERVIEW OF THIS MANUAL ........................................................................................................................... 8 PART 1: INTRODUCTION ................................................................................................................................... 10
1.1 Background.................................................................................................................................................... 10 1.2 Rationale and Purpose .................................................................................................................................. 11 1.3 Recommended Test Use ................................................................................................................................. 11 1.4 Test Accommodations .................................................................................................................................... 11 Large Type..................................................................................................................................................... 12 Braile ........................................................................................................................................................... 12
PART 2: TEST DESIGN AND DEVELOPMENT ................................................................................................ 13
2.1 Overview........................................................................................................................................................ 13 2.2 Test Specifications by Modality and Grade Span .......................................................................................... 13 2.3 Test Blueprint, Mapping and Specification by New York State Learning Standards for English as a Second Language .................................................................................................................................. 15 2.4 Item Development and Review Processes...................................................................................................... 15 2.5 Item Field Testing.......................................................................................................................................... 16 2005 Sampling and Statistics........................................................................................................................ 16 2.6 Test Construction........................................................................................................................................... 17 Testing Writing Language ............................................................................................................................. 19 Testing Oral Language.................................................................................................................................. 19
PART 3: SCORING............................................................................................................................................... 21 3.1 NYSESLAT Range Finding ............................................................................................................................ 21 3.2 Operational File ............................................................................................................................................ 22 3.3 Rater Training ............................................................................................................................................... 22 3.4 Inter-Rater and Intra-Rater Reliability.......................................................................................................... 22
PART 4: CLASSICAL ITEM-LEVEL STATISTICS ........................................................................................... 23 4.1 Item-Level Descriptive Statistics ................................................................................................................... 23
PART 5: RELIABILITY........................................................................................................................................ 25 5.1 Internal Consistency Reliability..................................................................................................................... 25 5.2 Classical SEM (Based on Classical Test Theory).......................................................................................... 25 5.3 Standard Error of the Mean (SEMn) ............................................................................................................. 26 5.4 Conditional SEM (based on Item Response Theory) ..................................................................................... 27 5.5 Internal Consistency Reliability and Classical SEM and SEMn .................................................................. 28 5.6 Inter-rater Reliability..................................................................................................................................... 32 5.7 Reliability of Classification Decision at Proficient Cut................................................................................. 37
PART 6: VALIDITY .............................................................................................................................................. 40 6.1 Content Validity............................................................................................................................................. 40 Differential Item Functioning ........................................................................................................................ 43 6.2 Internal Structure .......................................................................................................................................... 45 Validity of the Scoring Structure via Confirmatory Factor Analyses (CFA)................................................. 49 6.3 External Structure (Relationship with Regents Comprehensive English Examination) ............................... 50
PART 7: CALIBRATION, EQUATING, AND SCALING ................................................................................... 51 7.1 The Rasch and Partial Credit Models ........................................................................................................... 51 Description of the Rasch Model .................................................................................................................... 51 Description of the Partial CreditModels (PCM) .......................................................................................... 53 7.2 Calibration and Equating of the NYSESLAT................................................................................................ 55 Equating Method and Rationale .................................................................................................................... 55 Common Item Linking Design ....................................................................................................................... 56

2006 NYSESLAT Technical Manual
Page 3
Linking Item Evaluation .............................................................................................................................. 57 Stability of Linking Items ............................................................................................................................... 57 TCC Comparison............................................................................................................................................ 58 7.3 Scaling of the NYSESLAT .............................................................................................................................. 62 Raw Score to Scale Score Tables..................................................................................................................... 62
PART 8: IRT STATISTICS................................................................................................................................... 63 8.1 Model and Rationale for Use......................................................................................................................... 63 8.2 Evidence of Model Fit.................................................................................................................................... 63 8.3 Rasch Information ......................................................................................................................................... 64
PART 9: STANDARD SETTING .......................................................................................................................... 66 9.1 Introduction ................................................................................................................................................... 66 9.2 Standard-setting Model ................................................................................................................................. 66 9.3 Committees of Panelists................................................................................................................................. 66 9.4 Performance Levels and Cut Scores.............................................................................................................. 67 9.5 Standard-setting Process ............................................................................................................................... 67 9.6 Agenda........................................................................................................................................................... 69 9.7 Summary Statistics for the Three Rounds of Ratings..................................................................................... 70 9.8 Evaluation Results ......................................................................................................................................... 70 9.9 Post-Standard-setting Analyses ..................................................................................................................... 70 9.10 Final Performance Level Cut Points ........................................................................................................... 70
PART 10: SUMMARY OF OPERATIONAL TEST RESULTS ........................................................................... 72 PART 11: FIELD TEST SUMMARY .................................................................................................................... 77
11.1 2006 Field Test Sampling ........................................................................................................................... 77 11.2 2006 Field Test Summary Statistics............................................................................................................ 79
APPENDIX............................................................................................................................................................. 80
APPENDIX A: TEST BLUEPRINT AND ITEM MAP.............................................................................................. 80 APPENDIX B: ITEM LEVEL STATISTICS BY GRADE SPAN.............................................................................. 128 APPENDIX C: RAW SCORE TO SCALE SCORE CONVERSION TABLES......................................................... 138 APPENDIX D: IRT STATISTICS .......................................................................................................................... 151 APPENDIX E1: CONFIRMATORY FACTOR ANALYSIS FOR THE 2005 NYSESLAT ........................................ 161 APPENDIX E2: CONFIRMATORY FACTOR ANALYSIS FOR THE 2006 NYSESLAT......................................... 171 APPENDIX F: STANDARD-SETTING MATERIALS............................................................................................ 181 APPENDIX G: ITEM INFORMATION AT DIFFERENT CUT POINTS BY GRADES.......................................... 201 APPENDIX H: SCALE SCORE SUMMARY BY SUBGROUPS............................................................................. 228 APPENDIX I: PROFICIENCY PERCENTAGES .................................................................................................. 254 APPENDIX J: EXIT RATE BY SUBGROUP ......................................................................................................... 293 APPENDIX K: EXTERNAL STRUCTURE CHECK ............................................................................................. 306 APPENDIX L: DIF CATEGORIES FOR OPERATIONAL ITEMS........................................................................ 310 APPENDIX M: REFERENCES ............................................................................................................................. 319
2006 NYSESLAT Technical Manual
Page 4
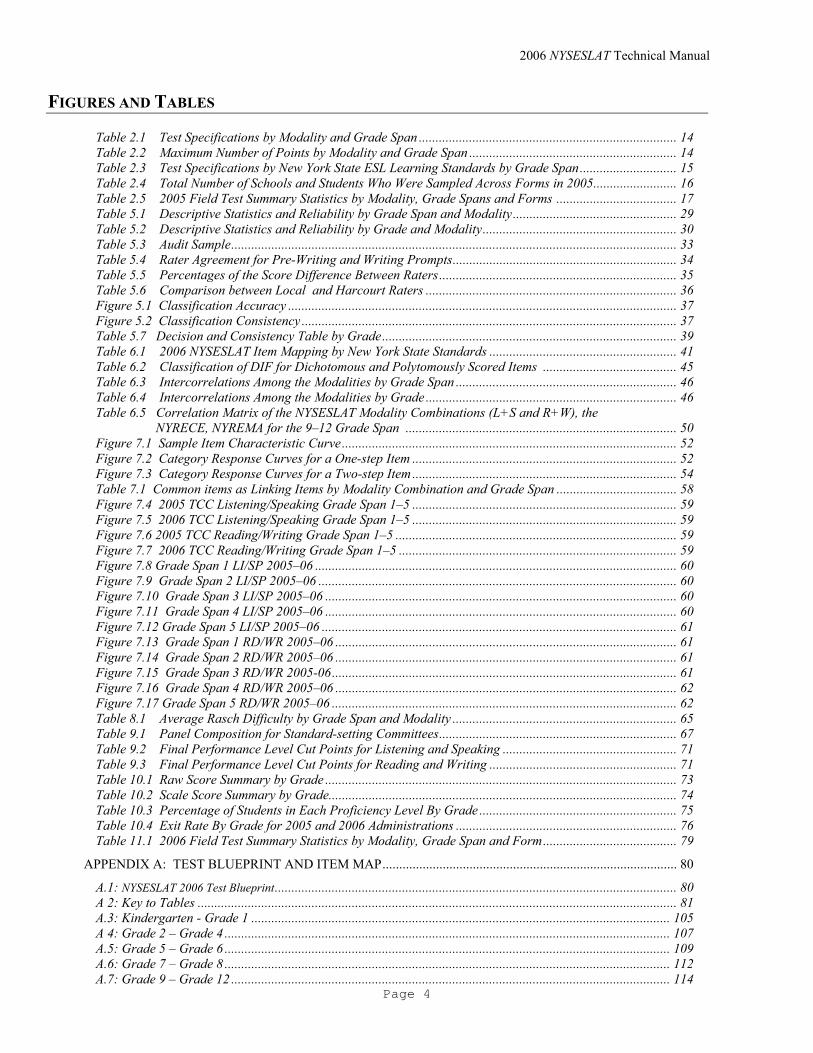
FIGURES AND TABLES
Table 2.1 Test Specifications by Modality and Grade Span ............................................................................. 14 Table 2.2 Maximum Number of Points by Modality and Grade Span .............................................................. 14 Table 2.3 Test Specifications by New York State ESL Learning Standards by Grade Span............................. 15 Table 2.4 Total Number of Schools and Students Who Were Sampled Across Forms in 2005......................... 16 Table 2.5 2005 Field Test Summary Statistics by Modality, Grade Spans and Forms .................................... 17 Table 5.1 Descriptive Statistics and Reliability by Grade Span and Modality................................................. 29 Table 5.2 Descriptive Statistics and Reliability by Grade and Modality.......................................................... 30 Table 5.3 Audit Sample..................................................................................................................................... 33 Table 5.4 Rater Agreement for Pre-Writing and Writing Prompts................................................................... 34 Table 5.5 Percentages of the Score Difference Between Raters....................................................................... 35 Table 5.6 Comparison between Local and Harcourt Raters ........................................................................... 36 Figure 5.1 Classification Accuracy .................................................................................................................... 37 Figure 5.2 Classification Consistency ................................................................................................................ 37 Table 5.7 Decision and Consistency Table by Grade........................................................................................ 39 Table 6.1 2006 NYSESLAT Item Mapping by New York State Standards ........................................................ 41 Table 6.2 Classification of DIF for Dichotomous and Polytomously Scored Items ........................................ 45 Table 6.3 Intercorrelations Among the Modalities by Grade Span .................................................................. 46 Table 6.4 Intercorrelations Among the Modalities by Grade ........................................................................... 46 Table 6.5 Correlation Matrix of the NYSESLAT Modality Combinations (L+S and R+W), the NYRECE, NYREMA for the 9–12 Grade Span ................................................................................. 50 Figure 7.1 Sample Item Characteristic Curve.................................................................................................... 52 Figure 7.2 Category Response Curves for a One-step Item ............................................................................... 52 Figure 7.3 Category Response Curves for a Two-step Item ............................................................................... 54 Table 7.1 Common items as Linking Items by Modality Combination and Grade Span .................................... 58 Figure 7.4 2005 TCC Listening/Speaking Grade Span 1–5 ............................................................................... 59 Figure 7.5 2006 TCC Listening/Speaking Grade Span 1–5 ............................................................................... 59 Figure 7.6 2005 TCC Reading/Writing Grade Span 1–5 .................................................................................... 59 Figure 7.7 2006 TCC Reading/Writing Grade Span 1–5 ................................................................................... 59 Figure 7.8 Grade Span 1 LI/SP 2005–06 ............................................................................................................ 60 Figure 7.9 Grade Span 2 LI/SP 2005–06 ........................................................................................................... 60 Figure 7.10 Grade Span 3 LI/SP 2005–06 ......................................................................................................... 60 Figure 7.11 Grade Span 4 LI/SP 2005–06 ......................................................................................................... 60 Figure 7.12 Grade Span 5 LI/SP 2005–06 .......................................................................................................... 61 Figure 7.13 Grade Span 1 RD/WR 2005–06 ...................................................................................................... 61 Figure 7.14 Grade Span 2 RD/WR 2005–06 ...................................................................................................... 61 Figure 7.15 Grade Span 3 RD/WR 2005-06....................................................................................................... 61 Figure 7.16 Grade Span 4 RD/WR 2005–06 ...................................................................................................... 62 Figure 7.17 Grade Span 5 RD/WR 2005–06 ....................................................................................................... 62 Table 8.1 Average Rasch Difficulty by Grade Span and Modality ................................................................... 65 Table 9.1 Panel Composition for Standard-setting Committees....................................................................... 67 Table 9.2 Final Performance Level Cut Points for Listening and Speaking .................................................... 71 Table 9.3 Final Performance Level Cut Points for Reading and Writing ........................................................ 71 Table 10.1 Raw Score Summary by Grade ......................................................................................................... 73 Table 10.2 Scale Score Summary by Grade........................................................................................................ 74 Table 10.3 Percentage of Students in Each Proficiency Level By Grade ........................................................... 75 Table 10.4 Exit Rate By Grade for 2005 and 2006 Administrations .................................................................. 76 Table 11.1 2006 Field Test Summary Statistics by Modality, Grade Span and Form........................................ 79
APPENDIX A: TEST BLUEPRINT AND ITEM MAP........................................................................................ 80 A.1: NYSESLAT 2006 Test Blueprint........................................................................................................................ 80 A 2: Key to Tables ............................................................................................................................................... 81 A.3: Kindergarten - Grade 1 ............................................................................................................................. 105 A 4: Grade 2 – Grade 4 ..................................................................................................................................... 107 A.5: Grade 5 – Grade 6 ..................................................................................................................................... 109 A.6: Grade 7 – Grade 8 ..................................................................................................................................... 112 A.7: Grade 9 – Grade 12 ................................................................................................................................... 114

2006 NYSESLAT Technical Manual
Page 5
A.8: Item Specs .................................................................................................................................................. 117 APPENDIX B: ITEM LEVEL STATISTICS BY LEVEL.................................................................................. 128
B.1: Kindergarten – Grade 1............................................................................................................................. 128 B.2: Grade 2 – Grade 4 ..................................................................................................................................... 130 B.3: Grade 5 – Grade 6 ..................................................................................................................................... 132 B.4: Grade 7 – Grade 8 ..................................................................................................................................... 134 B.5: Grade 9 – Grade 12 ................................................................................................................................... 136
APPENDIX C: RAW SCORE TO SCALE SCORE CONVERSION TABLES................................................. 138 C.1: Kindergarten – Grade 1............................................................................................................................. 138 C.2: Grade 2 – Grade 4..................................................................................................................................... 141 C.3: Grade 5 – Grade 6..................................................................................................................................... 143 C.4: Grade 7 – Grade 8..................................................................................................................................... 145 C.5: Grade 9 – Grade 12................................................................................................................................... 148
APPENDIX D: IRT STATISTICS....................................................................................................................... 151 D.1: Kindergarten – Grade 1 ............................................................................................................................ 151 D.2: Grade 2 – Grade 4..................................................................................................................................... 153 D.3: Grade 5 – Grade 6..................................................................................................................................... 155 D.4: Grade 7 – Grade 8..................................................................................................................................... 157 D.5: Grade 9 – Grade 12................................................................................................................................... 159
APPENDIX E.1: CONFIRMATORY FACTOR ANALYSIS FOR THE 2005 NYSESLAT............................. 161 Table E.1.1: Maximum Number of Points by Modality and Grade Span for the 2005 NYSESLAT................... 161 Figure E.1.1: Path Diagram for the One-Factor Model ................................................................................... 163 Figure E.1.2: Path Diagram for the Two-Factor Model ................................................................................... 164 Table E.1.2a: Summary Statistics ...................................................................................................................... 164 Table E.1.2b: Factor Loading Estimates for the One- and Two-Factor Models............................................... 165 Table E.1.2c: Global Fit Indices for the One- and Two-Factor Models ........................................................... 165 Table E.1.3a: Summary Statistics ...................................................................................................................... 165 Table E.1.3b: Factor Loading Estimates for the One- and Two-Factor Models............................................... 166 Table E.1.3c: Global Fit Indices for the One- and Two-Factor Models ........................................................... 166 Table E.1.4a: Summary Statistics ...................................................................................................................... 166 Table E.1.4b: Factor Loading Estimates for the One- and Two-Factor Models............................................... 167 Table E.1.4c: Global Fit Indices for the One- and Two-Factor Models ........................................................... 167 Table E.1.5a: Summary Statistics ...................................................................................................................... 167 Table E.1.5b: Factor Loading Estimates for the One- and Two-Factor Models............................................... 168 Table E.1.5c: Global Fit Indices for the One- and Two-Factor Models ........................................................... 168 Table E.1.6a: Summary Statistics ...................................................................................................................... 168 Table E.1.6b: Factor Loading Estimates for the One- and Two-Factor Models............................................... 169 Table E.1.6c: Global Fit Indices for the One- and Two-Factor Models ........................................................... 169
APPENDIX E.2: CONFIRMATORY FACTOR ANALYSIS FOR THE 2006 NYSESLAT............................. 171 TABLE E.2.1: Maximum Number of Points by Modality and Grade Span for the 2006 NYSESLAT ................ 171 Figure E.2.1: Path Diagram for the One-Factor Model .................................................................................. 173 Figure E.2.2: Path Diagram for the Two-Factor Model .................................................................................. 174 Table E.2.2a: Summary Statistics ...................................................................................................................... 174 Table E.2.2b: Factor Loading Estimates for the One- and Two-Factor Models............................................... 175 Table E.2.2c:. Global Fit Indices for the One- and Two-Factor Models .......................................................... 175 Table E.2.3a: Summary Statistics ...................................................................................................................... 176 Table E.2.3b: Factor Loading Estimates for the One- and Two-Factor Models............................................... 176 Table E.2.3c: Global Fit Indices for the One- and Two-Factor Models ........................................................... 176 Table E.2.4a: Summary Statistics ...................................................................................................................... 177 Table E.2.4b: Factor Loading Estimates for the One- and Two-Factor Models............................................... 177 Table E.2.4c: Global Fit Indices for the One- and Two-Factor Models ........................................................... 177 Table E.2.5a: Summary Statistics ...................................................................................................................... 178 Table E.2.5b: Factor Loading Estimates for the One- and Two-Factor Models............................................... 178
2006 NYSESLAT Technical Manual
Page 6
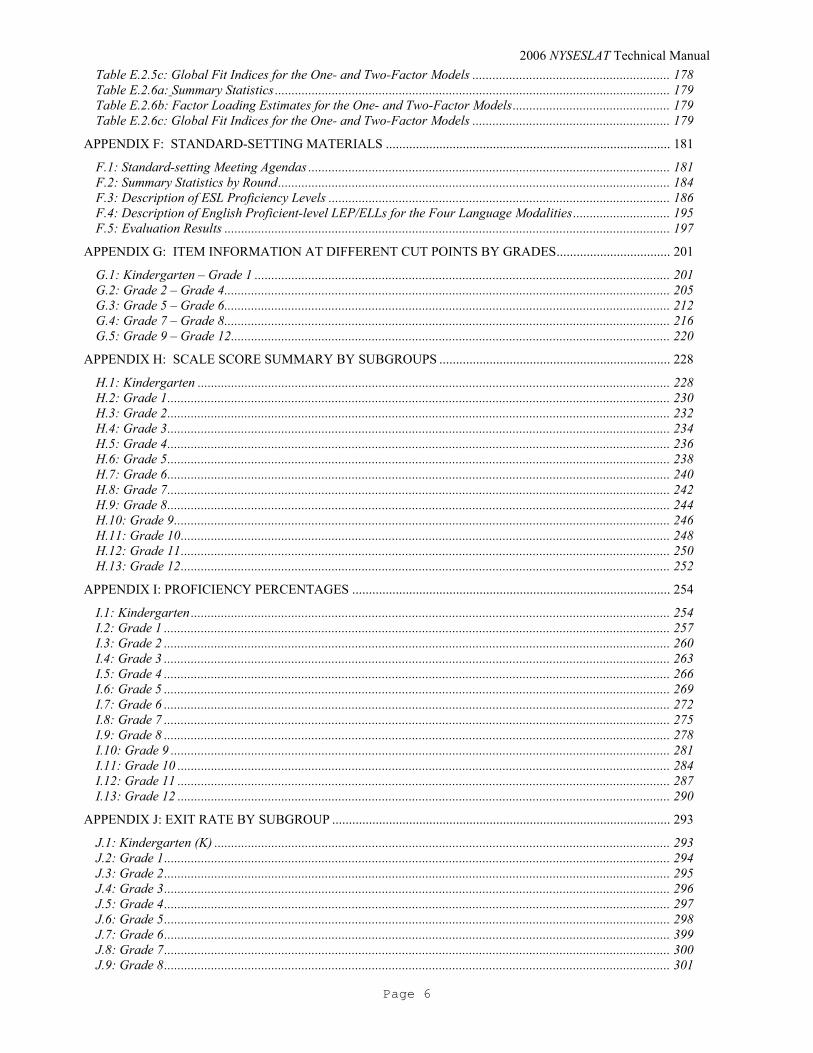
Table E.2.5c: Global Fit Indices for the One- and Two-Factor Models ........................................................... 178 Table E.2.6a: Summary Statistics ...................................................................................................................... 179 Table E.2.6b: Factor Loading Estimates for the One- and Two-Factor Models............................................... 179 Table E.2.6c: Global Fit Indices for the One- and Two-Factor Models ........................................................... 179
APPENDIX F: STANDARD-SETTING MATERIALS ..................................................................................... 181 F.1: Standard-setting Meeting Agendas ............................................................................................................ 181 F.2: Summary Statistics by Round..................................................................................................................... 184 F.3: Description of ESL Proficiency Levels ...................................................................................................... 186 F.4: Description of English Proficient-level LEP/ELLs for the Four Language Modalities............................. 195 F.5: Evaluation Results ..................................................................................................................................... 197
APPENDIX G: ITEM INFORMATION AT DIFFERENT CUT POINTS BY GRADES.................................. 201 G.1: Kindergarten – Grade 1 ............................................................................................................................ 201 G.2: Grade 2 – Grade 4..................................................................................................................................... 205 G.3: Grade 5 – Grade 6..................................................................................................................................... 212 G.4: Grade 7 – Grade 8..................................................................................................................................... 216 G.5: Grade 9 – Grade 12................................................................................................................................... 220
APPENDIX H: SCALE SCORE SUMMARY BY SUBGROUPS ..................................................................... 228 H.1: Kindergarten ............................................................................................................................................. 228 H.2: Grade 1...................................................................................................................................................... 230 H.3: Grade 2...................................................................................................................................................... 232 H.4: Grade 3...................................................................................................................................................... 234 H.5: Grade 4...................................................................................................................................................... 236 H.6: Grade 5...................................................................................................................................................... 238 H.7: Grade 6...................................................................................................................................................... 240 H.8: Grade 7...................................................................................................................................................... 242 H.9: Grade 8...................................................................................................................................................... 244 H.10: Grade 9.................................................................................................................................................... 246 H.11: Grade 10.................................................................................................................................................. 248 H.12: Grade 11.................................................................................................................................................. 250 H.13: Grade 12.................................................................................................................................................. 252
APPENDIX I: PROFICIENCY PERCENTAGES ............................................................................................... 254 I.1: Kindergarten ............................................................................................................................................... 254 I.2: Grade 1 ....................................................................................................................................................... 257 I.3: Grade 2 ....................................................................................................................................................... 260 I.4: Grade 3 ....................................................................................................................................................... 263 I.5: Grade 4 ....................................................................................................................................................... 266 I.6: Grade 5 ....................................................................................................................................................... 269 I.7: Grade 6 ....................................................................................................................................................... 272 I.8: Grade 7 ....................................................................................................................................................... 275 I.9: Grade 8 ....................................................................................................................................................... 278 I.10: Grade 9 ..................................................................................................................................................... 281 I.11: Grade 10 ................................................................................................................................................... 284 I.12: Grade 11 ................................................................................................................................................... 287 I.13: Grade 12 ................................................................................................................................................... 290
APPENDIX J: EXIT RATE BY SUBGROUP ..................................................................................................... 293 J.1: Kindergarten (K) ........................................................................................................................................ 293 J.2: Grade 1....................................................................................................................................................... 294 J.3: Grade 2....................................................................................................................................................... 295 J.4: Grade 3....................................................................................................................................................... 296 J.5: Grade 4....................................................................................................................................................... 297 J.6: Grade 5....................................................................................................................................................... 298 J.7: Grade 6....................................................................................................................................................... 399 J.8: Grade 7....................................................................................................................................................... 300 J.9: Grade 8....................................................................................................................................................... 301
2006 NYSESLAT Technical Manual
Page 7
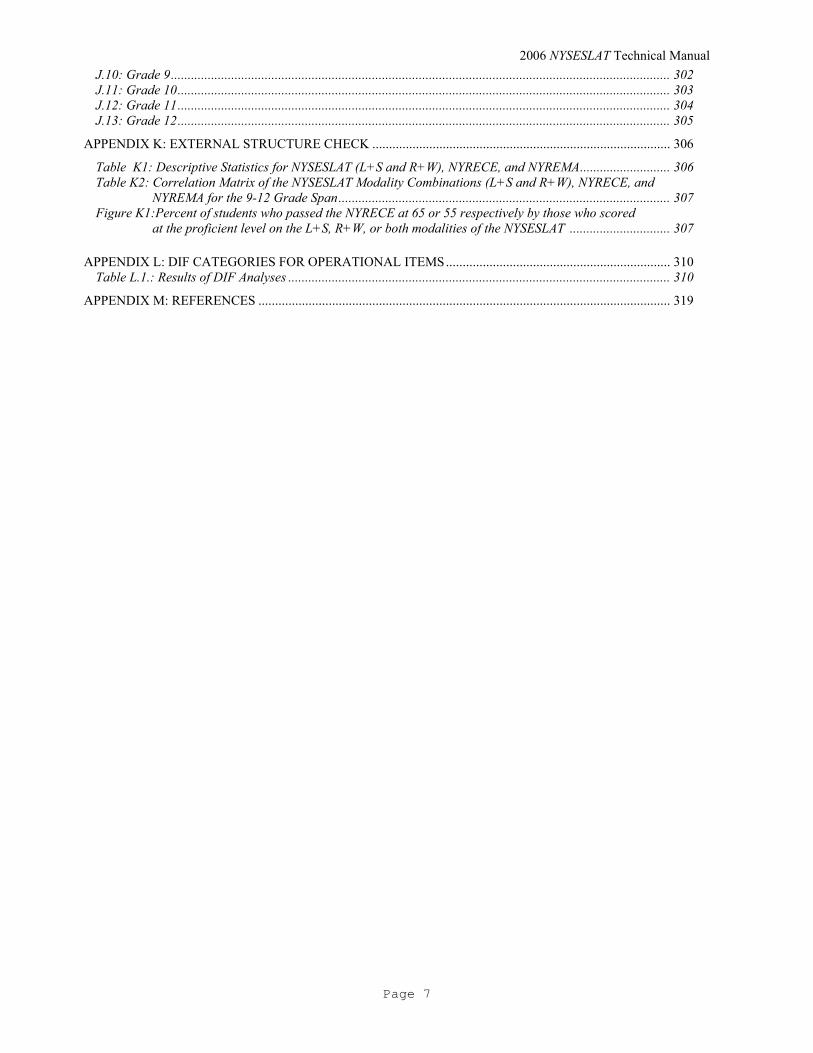
J.10: Grade 9..................................................................................................................................................... 302 J.11: Grade 10................................................................................................................................................... 303 J.12: Grade 11................................................................................................................................................... 304 J.13: Grade 12................................................................................................................................................... 305
APPENDIX K: EXTERNAL STRUCTURE CHECK ......................................................................................... 306
Table K1: Descriptive Statistics for NYSESLAT (L+S and R+W), NYRECE, and NYREMA........................... 306 Table K2: Correlation Matrix of the NYSESLAT Modality Combinations (L+S and R+W), NYRECE, and NYREMA for the 9-12 Grade Span................................................................................................... 307 Figure K1:Percent of students who passed the NYRECE at 65 or 55 respectively by those who scored at the proficient level on the L+S, R+W, or both modalities of the NYSESLAT .............................. 307
APPENDIX L: DIF CATEGORIES FOR OPERATIONAL ITEMS................................................................... 310
Table L.1.: Results of DIF Analyses .................................................................................................................. 310 APPENDIX M: REFERENCES ........................................................................................................................... 319

2006 NYSESLAT Technical Manual
Page 8
OVERVIEW OF THIS MANUAL
This New York State English as a Second Language Achievement Test (NYSESLAT) Technical Manual for the 2006 administration is organized around eleven major parts: Introduction; Test Design and Development; Scoring; Classical Item–Level Statistics; Reliability; Validity; Calibration, Equating, and Scaling (CES); Item Response Theory (IRT) Statistics; Standard Setting; Summary of Operational Test Results; and Field Test Sampling Plan and Analyses. An overview of this manual is provided below.
Part 1
Part 1 presents the background for the NYSESLAT, its rationale and purpose, recommended test use, and test accommodations. Test accommodations include large type and Braille.
Part 2
Part 2 describes the test development process of the NYSESLAT. It includes test specifications, item development and review processes, item field testing, and test construction.
Part 3
Part 3 provides a description of the scoring process. It includes the description of the range finding meeting that was held in Albany, New York, in 2005. It also provides information about the audit scoring process that was conducted on a 10% sample, description of rater training, and inter-rater reliability.
Part 4
Part 4 provides item-level descriptive statistics based on Classical Test Theory (CTT).
Part 5
Part 5 explains the internal consistency reliability, classical Standard Error of Measurement (SEM), conditional SEM based on IRT and inter-rater reliability. It also provides results of the inter-rater and intra-rater reliability, the rater agreement analyses, the reliability of each of the four modalities, and the reliability of classification decision at the proficient cut.
Part 6
Part 6 describes the validity studies that were conducted. It includes evidence of validity based on test content, internal structure, and relationships to other variables.

2006 NYSESLAT Technical Manual
Page 9
Part 7
Part 7 explains the Rasch and Partial Credit Models, and provides sample item characteristic curve for a one-step item and a two-step item. It also includes the process of the calibration, equating, and scaling of the 2006 administration of the NYSESLAT.
Part 8
Part 8 explains the rationale for use of the IRT model. It includes the IRT model fit statistics and the average Rasch difficulty of the subtests.
Part 9
Part 9 presents the standard-setting process that was followed to establish the performance level cuts. It includes the standard-setting model, the standard-setting process, summary statistics for the round-by-round ratings, evaluation results, post-standard-setting analyses, and final performance-level cut points.
Part 10
Part 10 presents the raw score summary, scale score summary, percentage of students in each performance category and exit rate for the 2005 and the 2006 administrations of the NYSESLAT.
Part 11
Part 11 presents the summary of the 2006 field testing, including a description of the sampling process, and summary statistics of the 2006 field test items.
2006 NYSESLAT Technical Manual
Page 10
PART 1: INTRODUCTION
1.1 Background
Title III of the Federal No Child Left Behind (NCLB) Act of 2001 requires annual assessment of the English language skills of limited English proficient (LEP) students. Section 3121 (d) (1) explains that each state must use evaluation measures designed to assess “the progress of children in attaining English proficiency, including a child’s level of comprehension, speaking, listening, reading, and writing skills in English.” NCLB requires demonstrated annual improvement in English proficiency for such students in order for them to meet “challenging State academic content and student academic achievement standards.” New York State regulations also require annual assessment of LEP students using a state-approved assessment. NCLB requires that the annual assessment of LEP students be based on specific student achievement objectives. Section 3122 (a) (1) states that “each State educational agency or specially qualified agency receiving a grant under subpart 1 shall develop annual measurable achievement objectives for limited English proficient children served under this part that relate to such children’s development and attainment of English proficiency while meeting challenging State academic content and student academic achievement standards.” Section 3113 (b) (2) explains that the “standards and objectives for raising the level of English proficiency [will be] derived from the four recognized domains of speaking, listening, reading, and writing, and [will be] aligned with achievement of the challenging State academic content and student academic achievement standards” set out in Title I of the Act. The New York State Education Department (NYSED) developed Learning Standards for English as a Second Language (ESL) to meet the requirements of NCLB. New York’s learning standards and performance indicators (achievement objectives) for ESL are derived from the domains of speaking, listening, reading, and writing and they align with the State’s English Language Arts standards. New York’s ESL learning standards and performance indicators are organized in four grade spans: Pre-K–1, 2–4, 5–8, and 9–12. To meet Federal and State requirements regarding the assessment of LEP students, NYSED requested test development, research, and scoring based on the State’s Learning Standards for English as a Second Language. Accordingly, the New York State English as a Second Language Achievement Test (NYSESLAT) was developed with four subtests—Speaking, Listening, Reading, and Writing—in each of five grade spans: K–1, 2–4, 5–6, 7–8, and 9–12. Individual test items match to specific ESL learning standards and performance indicators. In addition, the test was developed in accordance with the Standards for Educational and Psychological Testing (American Educational Research Association, 1999) and New York State testing requirements. The test is consistent with the principles of universal design, which means that the test is as accessible as possible to all populations, including special needs students. The test is also consistent with applicable federal and state testing requirements. In response to NYSED’s request, Harcourt Assessment offered a solution with two distinct phases. With respect to the first phase, custom items were developed and used to create the 2006 NYSESLAT operational forms. Linking items from the Harcourt English language learner item bank were pulled from the 2005 test and also used to produce custom forms for the 2006 test administration. With respect to the second phase, new custom items will be developed for the 2007 test administration.
2006 NYSESLAT Technical Manual
Page 11
1.2 Rationale and Purpose
The New York State Board of Regents has established learning standards for all English language learners attending New York State schools. NCLB mandates that all English language learners from kindergarten through grade 12 be assessed every year to measure their English language proficiency in speaking, listening, reading, and writing, and that their annual progress toward proficiency be tracked. In compliance with this directive, NYSED developed an annual test that measures student progress toward meeting the state’s ESL learning standards. This test is the NYSESLAT. The NYSESLAT helps schools determine which instructional standards teachers must devote time to in order to ensure their English language learners fully acquire the language proficiency that will prepare them for success in the classroom. The purpose of the test is to measure annual student improvement in achieving English language proficiency in order to ultimately exit an ESL or bilingual education program, move into an English Language Arts classroom, and function successfully without any additional support.
1.3 Recommended Test Use
The NYSESLAT is designed to assess students at all proficiency levels within each grade span. This vertical development of the language tested allows the test to discriminate more finely among students at different stages of language acquisition. Because test results provide students, teachers, and parents with an objective report of each student’s strengths and weaknesses in the English language skills of speaking, listening, reading, and writing, the NYSESLAT helps determine whether these students are making adequate progress toward English language proficiency. The test results can also help schools focus on ways to improve instruction so that English language learners become proficient in English, thereby allowing more time for content-based materials, such as mathematics and science.
1.4 Test Accommodations
All test items were developed following the guidelines of universal design. Adherence to these guidelines ensured that the assessments were accessible and valid for the widest range of students, including students with disabilities. Applying universal test design during the development process helped eliminate the need to address after-the-fact accommodations, and provided a better assessment for all students. Checklists were used to review every item to ensure that each was built with consideration of the following: equitable use, flexibility in use, simple intuitive design, perceptible information tolerance for error, low physical effort, and size and span for approach and use. During forms construction, Harcourt utilized in-house content and fairness experts to ensure that the forms were pulled with concepts of universal design in mind. Harcourt stringently reviewed forms for special populations—such as visually or hearing-impaired students—to ensure that items were fair, reliable, and accessible to all.

2006 NYSESLAT Technical Manual
Page 12
Large Type Harcourt has standardized large-type product specifications that serve to ease the test-taking experience for visually impaired children who require large type. One form in large type (i.e., type 18 points minimum and no larger than 24 points for titles) was produced for each grade span. Pages are printed in black only and on a cream colored, non-glare vellum stock to ease readability of pages. Covers are printed on heavier stock to provide stiffness to the booklets, which protects interior text pages. Plastic spiral binding makes turning of pages easy to accomplish.
Braille Harcourt produced a Braille version of the NYSESLAT for blind children. Harcourt’s accommodations expert is Dr. Betsy Case, who is on the Test Advisory Panel (Test Central) for the American Printing House for the Blind (APH) and is a lifetime member of the Braille Authority of North America (BANA). Harcourt created the Braille version of the NYSESLAT using certified and experienced transcribers who can work with the multiple codes, rules, and guidelines. Harcourt produced Braille forms for each NYSESLAT subtest and grade span. For the K-1 grade span, a checklist was provided rather than a Braille test. If a content area was difficult to Braille, Harcourt determined with content specialists if there were other ways that the construct could be worded or measured. To adapt some items, pictures were described. Care was taken not to convey the correct answer but to give a description that would enable the student to ascertain the correct answer.

2006 NYSESLAT Technical Manual
Page 13
PART 2: TEST DESIGN AND DEVELOPMENT
2.1 Overview
To meet the requirements of Title III of the Federal No Child Left Behind (NCLB) Act and of New York State regulations regarding the assessment of limited English proficient students, NYSED developed Learning Standards for English as a Second Language, a comprehensive set of ESL learning standards and performance indicators in the four domains of speaking, listening, reading, and writing. NYSED then requested test development, research, and scoring based on these standards. The NYSESLAT was developed with four subtests (Speaking, Listening, Reading, and Writing) in each of five grade spans (K–1, 2–4, 5–6, 7–8, 9–12) to assess the English language skills and the progress toward achieving full English language proficiency of students in kindergarten through grade 12 who are English language learners. The test was developed in accordance with the Standards for Educational and Psychological Testing (American Educational Research Association, 1999) and New York State testing requirements. The test is consistent with the principles of universal design, making it as accessible as possible to all populations, including special needs students, and is also consistent with applicable federal and state testing requirements.
2.2 Test Specifications by Modality and Grade Span
The NYSESLAT is divided into the four basic domains or modalities—Speaking, Listening, Reading, and Writing—for grades K–12. It includes multiple-choice, constructed-response, short-response, and extended-response items. The total number of items per grade span varies. For grade span K–1 there are a total of 74 items, for grade span 2–4 there are a total of 84 items, for grade span 5–6 there are a total of 88 items, and for grade spans 7–8 and 9–12 there are a total of 92 items each. The Speaking modality has 16 constructed-response items for all grade spans. The Listening and Reading modalities consist of only multiple-choice items. The number of items for the Listening modality varies from 24–27 for the different grade spans. The number of items for the Reading modality varies from 15–29 for the different grade spans. The number of items for the Writing modality ranges from 16–20 for the various grade spans. The Writing modality is composed of the following parts:
• Multiple-choice section that assesses English language learners’ understanding of the principles of written English at the phoneme, word, and sentence levels;
• Developmental writing items (K–1 only); • Pre-Writing activity (grades 2 through 12); • Extended responses to graphics–based prompts (grades K through 12).
Test specifications by modality by grade span for the 2006 administration of the NYSESLAT are shown in Table 2.1 below. Table 2.2 provides the maximum number of points by modality by grade span. Table 2.3 provides a breakdown of the number of items based on New York State’s ESL learning standards by modality and grade span. The 2006 test design consists of all custom developed items for the NYSESLAT, with the exception of linking items pulled from the 2005 test which were included in the 2006 test. All of the linking items were from the Harcourt English language learner item bank.

2006 NYSESLAT Technical Manual
Page 14
Table 2.1 Test Specifications by Modality and Grade Span
Number of Items and Passages in NYSESLAT Subtests
Speaking Listening Reading Writing
Writing Conventions Pre-Writing Writing Prompt
Grade Span
CR MC MC Passages MC SR ER
Total Number of Items per Grade Span
K–1 16 24 15 0 10 0 8 CR (Dev. Writing) + 1 ER
74
2–4 16 26 26 5 12 3 1 84 5–6 16 26 26 6 16 3 1 88 7–8 16 27 29 5 16 3 1 92 9–12 16 27 29 5 16 3 1 92
Table 2.2 Maximum Number of Points by Modality and Grade Span
Maximum Number of Points in NYSESLAT Subtests
Speaking Listening Reading Writing
Writing Conventions Pre-Writing Writing
Prompt Grade Span
CR MC MC Passages MC SR ER
Total Number of Points per
Grade Span
K–1 34 24 15 0 10 0 16 CR (Dev. Writing) + 2
ER 101
2–4 34 26 26 5 12 6 4 108 5–6 34 26 26 6 16 6 4 112 7–8 34 27 29 5 16 6 4 116 9–12 34 27 29 5 16 6 4 116
2006 NYSESLAT Technical Manual
Page 15
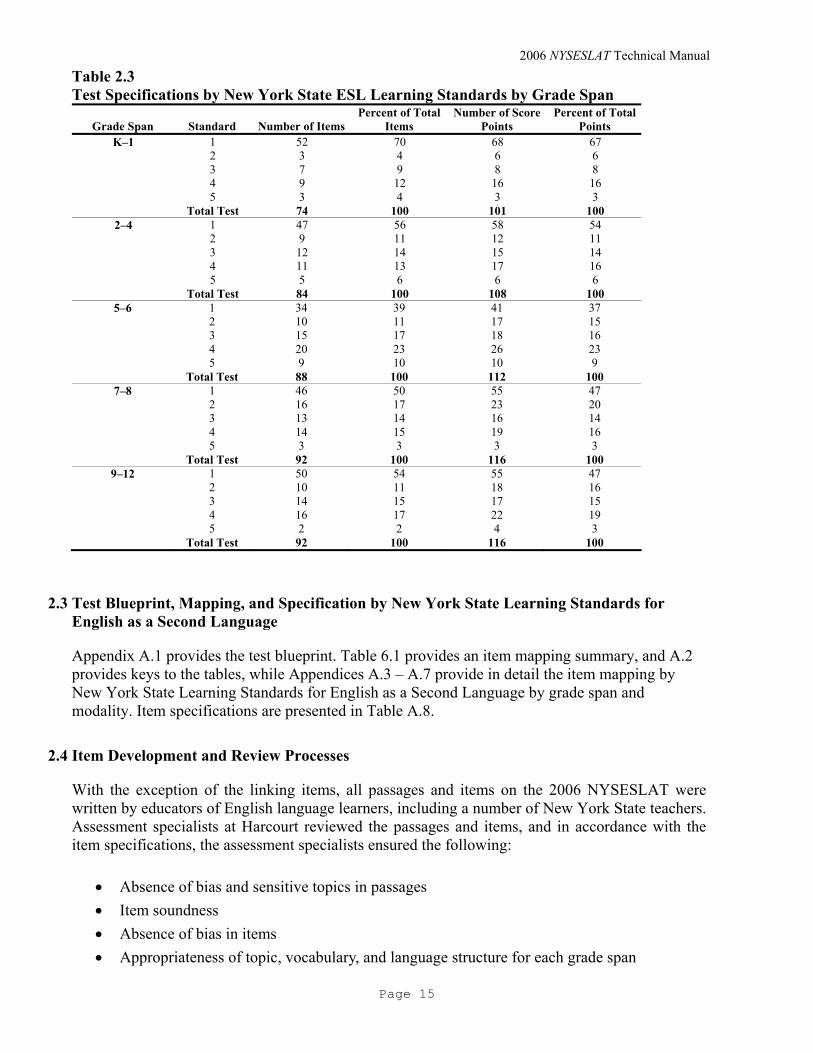
Table 2.3 Test Specifications by New York State ESL Learning Standards by Grade Span
Grade Span Standard Number of ItemsPercent of Total
Items Number of Score
Points Percent of Total
Points K–1 1 52 70 68 67
2 3 4 6 6 3 7 9 8 8 4 9 12 16 16 5 3 4 3 3 Total Test 74 100 101 100
2–4 1 47 56 58 54 2 9 11 12 11 3 12 14 15 14 4 11 13 17 16 5 5 6 6 6 Total Test 84 100 108 100
5–6 1 34 39 41 37 2 10 11 17 15 3 15 17 18 16 4 20 23 26 23 5 9 10 10 9 Total Test 88 100 112 100
7–8 1 46 50 55 47 2 16 17 23 20 3 13 14 16 14 4 14 15 19 16 5 3 3 3 3 Total Test 92 100 116 100
9–12 1 50 54 55 47 2 10 11 18 16 3 14 15 17 15 4 16 17 22 19 5 2 2 4 3 Total Test 92 100 116 100
2.3 Test Blueprint, Mapping, and Specification by New York State Learning Standards for English as a Second Language
Appendix A.1 provides the test blueprint. Table 6.1 provides an item mapping summary, and A.2 provides keys to the tables, while Appendices A.3 – A.7 provide in detail the item mapping by New York State Learning Standards for English as a Second Language by grade span and modality. Item specifications are presented in Table A.8.
2.4 Item Development and Review Processes
With the exception of the linking items, all passages and items on the 2006 NYSESLAT were written by educators of English language learners, including a number of New York State teachers. Assessment specialists at Harcourt reviewed the passages and items, and in accordance with the item specifications, the assessment specialists ensured the following:
• Absence of bias and sensitive topics in passages • Item soundness • Absence of bias in items • Appropriateness of topic, vocabulary, and language structure for each grade span

2006 NYSESLAT Technical Manual
Page 16
• Match to the intended New York State Learning Standards for English as a Second Language
The reading passages were then reviewed by a committee of New York State ESL teachers. Each test question was also reviewed by grade-level ESL educators from around New York State. Only those passages and test questions judged to be of acceptable quality and fair to students from the various ethnic/cultural backgrounds of those who presently live in New York State were approved for use.
2.5 Item Field Testing
Harcourt constructed, and NYSED reviewed and approved, field test forms to be administered to a sample of limited English proficient students around New York State. Two field test forms at each grade span, covering all four modalities in the grade span, were administered in October 2005. Data from this field test administration informed construction of the 2006 NYSESLAT operational test. The 2005 field-testing sampling plan is discussed below, while the 2006 sampling plan presented to NYSED by Harcourt is presented in Part 11.
2005 Sampling and Statistics
In sampling the field test item responses, each school was considered as the sampling unit in 2005 and was administered one of the two forms. All the grades in each of the randomly selected schools were included for the field testing. However, there were schools that did not have the entire grade span and only those grades that were available were included in the sampling. Although the sample n-counts were targeted at 2,000 per grade span, the n-counts could not be met for each of the two forms because this was not mandatory testing and some schools did not participate in spite of their commitment. A second sampling was requested by NYSED when the first sampling did not provide the required n-counts. Table 2.4 provides the total number of schools and students selected for the sampling plan and those who participated by grade span in 2005. The summary statistics for the 2005 field tests by modality and grade span from the report are provided in Table 2.5. Table 2.4 Total Number of Schools and Students Who Were Sampled Across Forms in 2005
Grade Span
Schools in Sample
(First Try)
Schools Participated (First Try)
Schools in Sample
(Second Try)
Schools Participated (Second Try)
Expected # of
Students
# of Students Participated (First Try)
# of Students Participated (Second Try)
Total # of Students
Participated1–2 77 8 65 2 2000 1404 279 1683 3–5 80 7 64 3 2000 1240 1434 2674 6–7 60 12 44 4 2000 2277 435 2712 8–9 66 7 45 4 2000 1313 783 2096
10–12 37 8 22 3 2000 1648 885 2533

2006 NYSESLAT Technical Manual
Page 17
Table 2.5 2005 Field Test Summary Statistics by Modality, Grade Spans and Forms
Grade Span
Modality Form N Mean SD Min Max
1–2 Listening A 1310 20.37 4.14 0 24 B 690 21.36 4.64 0 24
3–5 A 1357 18.80 5.58 0 28 B 815 16.14 5.00 0 26
6–7 A 258 18.96 5.49 0 26 B 649 18.45 7.89 0 28
8–9 A 163 19.19 7.22 0 28 B 637 14.84 7.76 0 29
10–12 A 122 16.79 5.05 0 27 B 386 15.65 6.12 0 25
1–2 Speaking A 1047 24.46 5.61 0 34 B 475 25.88 4.96 2 34
3–5 A 1063 28.65 5.15 0 34 B 767 29.31 4.75 0 34
6–7 A 231 26.68 6.29 0 34 B 386 26.29 5.74 0 34
8–9 A 276 26.58 5.51 8 34 B 369 27.01 6.88 0 34
10–12 A 279 25.47 4.60 10 34 B 255 26.06 5.67 6 34
1–2 Reading A 1310 8.50 3.72 0 15 B 690 9.98 3.72 0 15
3–5 A 1357 17.40 5.68 0 30 B 815 20.92 6.95 0 33
6–7 A 258 20.53 7.21 0 36 B 649 21.44 9.02 0 37
8–9 A 163 20.53 7.11 0 34 B 637 19.84 8.72 0 38
10–12 A 122 26.04 7.91 8 41 B 386 25.09 9.95 0 40
1–2 Writing A 1310 17.11 5.28 0 24 B 690 17.37 5.30 0 24
3–5 A 1357 12.35 5.61 0 22 B 815 13.86 5.04 0 22
6–7 A 258 15.71 6.72 0 26 B 649 15.56 6.94 0 26
8–9 A 163 16.48 6.35 0 26 B 637 13.64 7.36 0 26
10–12 A 122 17.15 5.47 0 26 B 386 15.50 5.98 0 26

2006 NYSESLAT Technical Manual
Page 18
2.6 Test Construction
Items selected for the 2006 NYSESLAT represented a complete range of difficulty at all grade levels from K through 12. Items ranged from easier ones with high p-values, primarily aimed at measuring the skills of students with very limited ability in English, to items with fairly low p-values, aimed at measuring the skills of students with advanced ability in English. The number of both multiple-choice and constructed-response items was increased at each proficiency level, meeting the requirements of the NYSED. The selection criteria for choosing items for the 2006 NYSESLAT operational forms included: item content, skill measured, item difficulty, gender balance, and ethnic balance. Content considerations include having a variety of settings and activities represented in items, having a mix of people, animals, and objects represented, and ensuring that there was no content overlap within a subtest or across subtests in the same grade span. Skills measured varied by subtest and by sections within a subtest. For example, the Word/Sentence Reading items in the first section of the Reading subtest for grades 2–12 tested ability to read a mixture of nouns, verbs, noun phrases, verb phrases, sometimes adjectives and adjective phrases, and occasionally adverbs. The Reading Comprehension items in the second section of the 2–12 Reading subtest tested ability to identify the main idea or the topic of a passage, to understand details in a passage, to make inferences based on information in a passage, to infer the meaning of a vocabulary word from context, to infer an author’s purpose, and to understand why information was organized or presented in a particular way in a passage. Similar specific content criteria applied for the other subtests. Items selected for the 2006 NYSESLAT represented a complete range of difficulty at all grade levels from K–12. As explained above, items ranged from easier ones with high p-values to items with fairly low p-values. Difficulty level of reading passages, as distinct from the difficulty of the Reading Comprehension items on the passages, was a criterion as well for the Reading subtest. Finally, gender and ethnic balance were considered in item selection. The people represented in the items across a subtest represented a balance of male and female and a variety of ethnic backgrounds. Differential Item Functioning (DIF) analyses, described in Section 6.1, were performed to identify potential items that needed to be scrutinized for item bias. None of the items that showed DIF were considered, by content specialists, to be biased either on the basis of gender or ethnicity. The process for constructing the 2006 NYSESLAT operational forms was as follows: As soon as Harcourt had clean statistics from the Fall 2005 field test, Harcourt ESL assessment specialists reviewed all items from the field test and pulled forms based on the above criteria. In addition to the Fall 2005 field test items, items were pulled from the 2005 operational test to be used as linking items in the 2006 operational test. The linking items were necessary for placing the 2006 operational items on the NYSESLAT established scale and constituted roughly 25% of the items in each subtest. The above selection criteria for the non-linking items (unique items) applied to linking items as well. Harcourt produced proposed draft operational forms which were then presented to NYSED. A joint Harcourt-NYSED team reviewed these forms, following all item selection criteria, and made various changes to the draft forms. Final forms were then reviewed by Harcourt ESL assessment specialists, editorial staff, psychometricians, and quality control staff, as well as by NYSED.

2006 NYSESLAT Technical Manual
Page 19
Testing Written Language A fundamental consideration in constructing the NYSESLAT is the language that is being tested. While the test developer’s native speaker intuition provides choices about what language is tested, more rigorous methods in language choice need to be applied to provide consistency across the forms of the five grade spans and to create a vertical structure within each form, wherein language ranges from the most simple—that which is first acquired by non-native speakers—to advanced language that would indicate a level of English proficiency sufficient for participation in regular academic classes. For the NYSESLAT, a test designed to assess students at all proficiency levels—beginning, intermediate, and advanced—within each grade span, this vertical development of the language tested allows the test to discriminate more finely among students at different stages of language acquisition. Being able to accurately identify students at different levels of language development provides better information to classroom teachers, who must find the most effective way to help their students reach proficiency. It also provides the very important evidence of students’ progress toward proficiency, which is required by the NCLB legislation. To determine the appropriate language for reading passages, Harcourt assessment specialists, editors, and item and passage writers applied the Flesch-Kincaid grade level readability analyses to all reading passages. Readability measures are primarily based on factors such as the number of words in the sentences and the number of letters or syllables per word. Additionally, ESL assessment specialists also evaluate the coherence of a passage, the number of anaphora, vocabulary difficulty, sentence and text structure, and concreteness and abstractness. Finally, input from the New York State teacher committee that reviewed the passages was considered. It is the sum of these analyses and evaluations that determines the appropriateness of the language of a passage. There is a gradual increase in difficulty from passage to passage at every grade span, so that each form includes beginning-level passages as well as passages that are representative of on-grade reading passages found on English Language Arts reading tests. Harcourt also uses the Educational Developmental Laboratory (EDL) Core Vocabularies in Reading, Mathematics, Science, and Social Studies, published by Steck-Vaughn, to help determine age- and grade-appropriate language for English language learner items and stimuli for the oral language subtests. Further, Harcourt ESL assessment specialists and editors ensure that the language in all stimuli and items, from kindergarten through grade 12, is both topic- and age-appropriate for test takers.
Testing Oral Language Recognizing that oral language structure and vocabulary in English differ vastly from the written language, issues of oral language assessment among kindergarten through grade 12 English language learners have been the subject of special investigation at Harcourt. Harcourt’s English language proficiency professionals have conducted research on the item types that appear in the NYSESLAT Speaking and Listening subtests by presenting examples of these item types to English language learners in cognitive laboratories. This setting allows for careful observation and recording of student responses and their reactions to items. Outcomes of this procedure led to important design decisions regarding:

2006 NYSESLAT Technical Manual
Page 20
• Item types • Number of items • Length of pauses between items • Use of recorded stimuli • Recording student spoken responses
The Speaking and Listening subtests of the NYSESLAT are based on these decisions. To ensure that the language in the Speaking and Listening stimuli and items reflect current spoken language as much as possible, Speaking and Listening scripts were submitted to a read-aloud proofing process with English language learner assessment specialists and editors. Additionally, for the oral components of the NYSESLAT to be relevant, the Speaking and Listening subtests had to have predictive validity for academic achievement. Therefore, both academic and social languages are integral components of the Speaking and Listening subtests of the NYSESLAT.
2006 NYSESLAT Technical Manual
Page 21
PART 3: SCORING
This part describes the process for scoring the Field Test, Operational Test, and Audit. For field test scoring, each grade span had at least one team of five readers scoring. There was a 10% check score done by team leaders. Anchors, training sets, and rubrics were used as scoring guides. Readers scored Pre-Writing (PW) 1, 2, then 3 successively. If questions arose during scoring, usually the problem was discussed by the group, in order to maintain consistency in scoring. The operational testing items were scored by local New York State Data Repository, with rubrics and training material as scoring aids. The details of the scoring process for operational items are described below.
3.1 NYSESLAT Range Finding
Range finding was held in Albany on February 21 and 22, 2006. The participants included:
• One full-time Harcourt Supervisor and five temporary Harcourt Performance Assessment Scoring Center (PASC) facilitators (one for each grade span: K–1, 2–4, 5–6, 7–8, and 9–12)
• Three state department representatives, who were there to greet participants and show support for the range finding process. Two of the three NYSED representatives participated in range finding.
• Four teachers and/or state department representatives for each grade span
Teachers were informed of the selection process for “paper-pulling.” At Harcourt, facilitators were teamed up with a second developer, and this team read several hundred papers to find clear-cut, typical examples of score points to share with New York teachers. This range of papers also contained exemplars that would be helpful to include in training sets to make scoring clear.
Either the facilitators or their partners had participated in scoring the field test prior to range finding and were well-acquainted with the rubric, prompts, and hundreds of papers reviewed during scoring. Sample responses for each item were sorted into preliminary range sets. These sets were presented at the range finding meeting in Albany.
Three Pre-Writing items and one writing prompt were reviewed per grade span. Each group of teachers read three assembled sets of sample papers per item. Two sets ranged from possible low to high responses and one set was a mixed range of papers. Each set included at least 15 papers.
Teachers read and assigned scores to each paper and then, as a group, discussed the scores they gave. The group came to a consensus of how each paper should be scored. After coming to agreement about the scores, the group discussed the merits of each paper and selected which would be used as training sets. They used the rubric as their scoring guide. Harcourt’s PASC facilitators documented discussions and decisions made at each grade span session. This documentation helped guide the facilitator in later preparing annotations for each anchor paper selected within each grade span.

2006 NYSESLAT Technical Manual
Page 22
The anchor sets contained three examples of each score point, and the annotations explained the reasoning that was used to assign the given score point. Training sets included papers that helped to discriminate the difference between “line papers.” A variety of examples were used to show other types of responses different from the anchors, as well as those similar to anchor papers. Through this process, the papers chosen were carefully reviewed and compared through this process to assure consistency.
3.2 Operational File
The Operational File came from New York State Data Repository after scoring was completed. These files were verified by Harcourt’s Quality Assurance (QA) Department to ensure data accuracy based on the description values in the file layout. Once all individual files were verified, a concatenated file was built. This file then became the Operational File for the spring 2006 NYSESLAT. Below are the procedures that Harcourt conducted to assure reliable and accurate scoring of the items.
3.3 Rater Training
The accuracy of scoring was monitored by training team leaders who are experienced, proficient readers. These team leaders successfully completed a two-day general team leader training workshop and have had the experience of training as Room Directors for many custom projects. These trainers are seasoned Performance Assessment Scoring Center (PASC) readers who have vast experience in all facets of scoring. They carefully monitored the scoring and accuracy of their teams of readers. All responses received a single reading with at least 10 % getting a second reading to monitor for reliability and accuracy. Team leaders independently gave the check score. All readers maintained at least an 88 % agreement rate.
All PASC readers have a minimum of a bachelor’s degree and have successfully completed generalized workshops in performance assessment scoring before ever being considered as a potential reader for a specific project such as NYSESLAT. Training of readers is based on anchors and training sets that are part of the sampler incorporated into the training procedures for operational scoring done by New York teachers. The sets were developed by New York teachers during range finding in March.
3.4 Inter-Rater and Intra-Rater Reliability
All readers were trained to score to the same scale to ensure accurate, consistent, reliable scoring. PASC adhered to stringent criteria in its general screening, training, and qualifying procedures as preliminary measures for obtaining high levels of consistency and reliability. Team leaders conducted “read behinds,” reading the same booklets after readers to check for accuracy of scores. At least 20 % of all booklets were read by both the reader and the training team leader to check accuracy. If individuals were not “on track,” retraining ensued. (These readers were perhaps being systematically too lenient or too harsh in their ratings or varied unsystematically and unpredictably from other raters and deviated from the training standards in their scores.) The statistics of the rater reliability are presented in Section 5.6.

2006 NYSESLAT Technical Manual
Page 23
PART 4: CLASSICAL ITEM-LEVEL STATISTICS
4.1 Item-Level Descriptive Statistics
This section presents the raw score summary statistics for all items in the spring 2006 administration of the NYSESLAT within the framework of Classical Test Theory. The concatenated file from the New York State Data Repository was used to obtain all raw score statistics. The p-value for each item is defined as the proportion of students that answer an item correctly for the multiple-choice items. A high p-value means that an item is easy; a low p-value means that an item is difficult. For the constructed-response items, the p-value is reported as the average number of points out of the maximum number of possible points.
The point biserial correlation for each item is an index of the association between the item-score and the total-test score. It shows the ability of the item to discriminate between low-ability and high-ability students. An item with a high point biserial correlation discriminates more effectively between the low and the high ability students than a low point biserial correlation. The item-level statistics for the operational 2006 NYSESLAT are presented in Appendices B.1–B.5 by grade span. The tables are grouped by Listening/Speaking and Reading/Writing modality combinations. The following item information and statistics are presented for each item:
• Item number • Item format (multiple-choice, constructed-response, short-response, or extended-response) • Maximum number of possible points • N-count (number of students) • Response options for multiple-choice items and percentage of students obtaining each
score point for constructed-response items • Omits (percentage of students omitting an item) • P-value for multiple-choice items (percentage of examinees that answered the item
correctly) • Item mean for constructed-response items (average number of points earned out of the
maximum number of possible points) • Point Biserial (index of discrimination between high and low scoring students)
Items that are too easy or too difficult are flagged on the basis of their p-values. Such items do not provide adequate information and their inclusion serves a limited purpose in the measurement process. However, the NYSESLAT, being a standard-referenced examination, allows exception to the rule if the item is deemed absolutely necessary by content experts. Although there is no consensus as to what is an acceptable p-value, the guiding policy during item review and form building is a p-value <= 0.90 and >= 0.30.
2006 NYSESLAT Technical Manual
Page 24
As explained above, the point biserial is another index that indicates the statistical suitability of an item for inclusion in the examination. Since it is an index of correlation of the item to the total test, one would expect a larger point biserial to indicate a desirable value for item inclusion. However, in the context of form building, items are selected not only for their adherence in measuring the underlying trait, i.e., unidimensionality (high correlation) but also on the basis of local independence of the item (low correlation). Very high correlation, in fact, may mean a redundancy of the item vis-à-vis some other items that perform the same function. On the other hand, too low a value for the point biserial may indicate a “shaky” association of the item with the underlying trait.
For the NYSESLAT, the upper limit of the point biserial was fixed at 0.80 while the lower limit was fixed at 0.25. Although there is seldom an occurrence of the upper limit violation for the NYSESLAT examination, the negative value of the point biserial is stringently observed since this may indicate a wrong key during the scoring process or an item with a very bad distractor or distractors. These items are never used in the form-building process. Once again, the setting of the upper and lower limits are subjective issues and may be acceptable in many cases, especially if the examination of the response pattern for each distractor shows a negative point biserial with the positive value being only for the correct answer. As can be seen from Appendix B, with the exception of some high p-values, all the items fall well within our pre-set level of acceptance both in terms of the p-values and the point biserials.

2006 NYSESLAT Technical Manual
Page 25
PART 5: RELIABILITY
5.1 Internal Consistency Reliability
The internal consistency of a test is measured by the stability of scores from one sample of content to another. Several methods can be used to estimate the internal consistency of a test. One approach is to split all test questions into two groups and then correlate student scores on the two half-tests. This is known as a split-half estimate of reliability. This method avoids the implications of any changes in the individual by administering only a single test. If scores have a high rate of correlation on the two half-tests, it can be concluded that the test questions complement one another, function well as a group, and measure similar concepts. This also suggests that measurement error is minimal. The split-half method’s decision about which questions contribute to each half-test’s score can have an impact on the resulting correlation. Harcourt uses Cronbach’s coefficient alpha statistic (Cronbach, 1951) to avoid this concern about the split-half method. The coefficient alpha is the average split-half correlation based on all possible divisions of a test into two parts. The coefficient alpha can be used to estimate the internal consistency of both dichotomously (right or wrong, 0 or 1 score values) and polytomously (a wide range of score values) scored test items. Coefficient alpha is computed by the following formula:
⎟⎟⎠
⎞⎜⎜⎝
⎛−
−= ∑
2
2
11 X
I
i i
Ss
IIα (1)
where
I is the number of items on the test, 2is is the variance of item i, and 2XS is the total test variance.
5.2 Classical SEM (based on Classical Test Theory)
Since no assessment measures ability with perfect consistency, it is useful to take into account the likely size of measurement errors. One way to describe the inconsistency of assessment results is to assess a student on multiple occasions and note how much the scores vary. Repeatedly measuring a student can only be done hypothetically, however, if you could assess a student on multiple occasions you would obtain a collection of the student’s obtained scores. The scores would cluster around an average value. The standard deviation, or spread, of these obtained scores is known as the standard error of measurement (SEM). The SEM is another index of reliability and provides an estimate of the amount of error in an individual’s observed test score. The individual’s observed total score is considered the estimate of the person’s true score. Because the standard error of measurement is inversely related to the reliability of a test, the greater the reliability, the less the standard error of measurement, and the more confidence one may have in the accuracy, or precision, of the observed test score. The measurement error is commonly expressed in terms of standard deviation units; that is, the

2006 NYSESLAT Technical Manual
Page 26
standard error of measurement is the standard deviation of the measurement error distribution. The standard error of measurement is calculated with the following equation:
xxrSDSEM −= 1 ⇔ 2
2
1x
txe s
sss −= (2)
where,
SEM (= es ) refers to the standard error of measurement,
SD (= xs ) is the standard deviation unit of the scale for a test,
xxr is the reliability coefficient for a sample test (or estimate of XXρ , which is a population reliability coefficient),
2ts is the estimate of
2Tσ , and
2xs is the estimate of
2Xσ .
The SEMs are presented in Tables 5.1 and 5.2 in Section 5.5.
5.3 Standard Error of the Mean (SEMn)
The standard error of the mean, on the other hand, is an estimate of the magnitude of sampling error associated with the sample mean in the estimation of the population mean. This expected standard mean of sampling errors of the mean is called the standard error of the mean (SEMn), and is defined as follows:
n
SEMn σ= (3)
where
SEMn = standard error of the mean
= standard deviation of the population
n = number of responses in each sample
The SEMns are presented in Tables 5.1 and 5.2 in Section 5.5.

2006 NYSESLAT Technical Manual
Page 27
5.4 Conditional SEM (Based on Item Response Theory)
Unlike the SEM based on the classical test theory, the SEM based on the item response theory (IRT) is not the same for all persons. For example, if a person gets either a few or a large number of items correct (extreme score), the standard error is greater than if the person gets a moderate number of items correct. This implies that the standard error of measurement depends on the total score (Andrich & Luo, 2004). Under the Rasch model, the SEM for each person is as follows:
∑=
−
=L
ivivi pp
1
ˆ
)1(
1βσ (4)
where
v is subscript for a person
i is subscript for an item,
L is length of the test,
β̂ is ability estimate, and
vip is the probability that a person answers an item correctly and is defined as follows:
iv
iv
eePvi δβ
δβ
−
−
+=
1 (5)
where vβ is person v’s ability and iδ is the item’s difficulty.
A confidence band can be used in interpreting the ability estimate. For example, an approximate
68% confidence interval for β̂ is given by
SEM±β̂ .
Note that the standard error for item difficulty is smallest when the probability of passing is close to the probability of failing. That is, when an item is near the threshold level for many persons in the sample, the standard error is small (Embretson & Reise, 2000). According to the general consensus in measurement, an aspect for the popularity of IRT methods in analyzing data is based on the fact while classical stats assume equivalency of students and item measurements for all examinees and items in a test. IRT methods allow for the differentiation of varied student and item performances in estimating the reliability of the measurement (Crocker & Algina, 1986). As is evident by Equation 5 above, one reason for the fluctuation in the standard errors of students is that they are a function of the n-counts. As such, the standard errors for each of the ability score estimates are smallest in the middle of the score distribution (where most examinees perform) and greatest for estimates in the extreme where subsequently lower numbers of students perform on a test, and thus produce less precise estimates. It is for this reason that IRT estimates with individual standard errors at score points, i.e., conditioned on theta (student ability

2006 NYSESLAT Technical Manual
Page 28
estimates) are preferred to classical SEMs which do not differentiate between the precision of student estimates at different levels of performances.
The conditional standard errors of measurement are presented in the raw score to scale score conversion tables in Appendix C and for IRT statistics in Appendix D.
5.5 Internal Consistency Reliability and Classical SEM and SEMn
Tables 5.1 and 5.2 provide the raw score descriptive statistics and reliabilities by grade span and grade level. The tables include the following information:
• Number of items • Maximum number of possible points • Number of students • Means and standard deviations in raw scores • Mean p-values • Cronbach’s alpha internal consistency reliability • Standard error of measurement (SEM)
In analyzing the information provided in Tables 5.1 and 5.2, the measures of reliability should be examined by keeping to the general trend that associates greater reliability with a lower error index for that particular measure. Since there is no consensus in literature as to what is an acceptable value of reliability and error, one has to look at these indices in the context of other indices. Of course, if an item has, for example, an SEMn greater than the standard deviation of the mean, then one would definitely question the relevancy of the information, which might be the result of an outlier or outliers. In Table 5.2 the reliability for Grade K Reading may seem a little low in relation to the other reliability values, but this could partially be explained by the relatively erratic learning to read in the kindergarten grades, which could be based on students being in a new environment, missing their home, the level of learning at home (which may not be uniform across students), etc. This kind of reasoning seems plausible by the fact it is the same type of reasoning kindergarten kids are separated from other grade levels and tested on their own by some large-scale assessments (e.g., the state of MI).
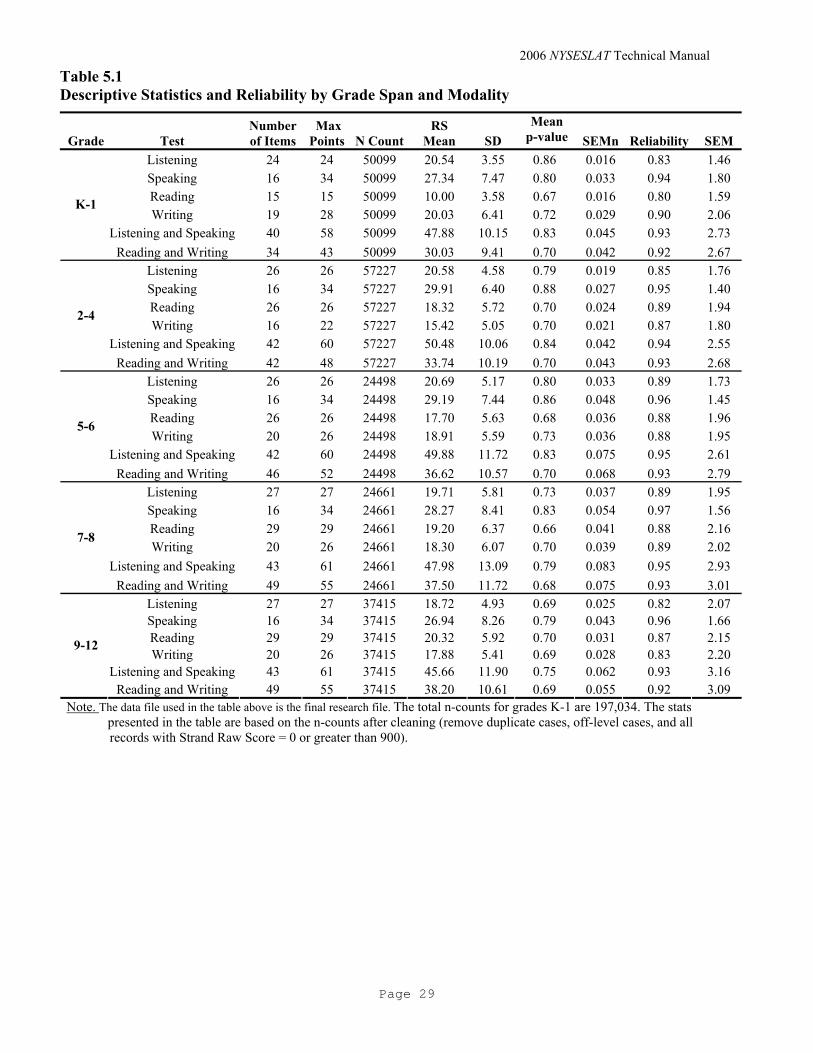
2006 NYSESLAT Technical Manual
Page 29
Table 5.1 Descriptive Statistics and Reliability by Grade Span and Modality
Grade Test Number of Items
Max Points N Count
RS Mean SD
Mean p-value SEMn Reliability SEM
Listening 24 24 50099 20.54 3.55 0.86 0.016 0.83 1.46 Speaking 16 34 50099 27.34 7.47 0.80 0.033 0.94 1.80 Reading 15 15 50099 10.00 3.58 0.67 0.016 0.80 1.59 Writing 19 28 50099 20.03 6.41 0.72 0.029 0.90 2.06
Listening and Speaking 40 58 50099 47.88 10.15 0.83 0.045 0.93 2.73
K-1
Reading and Writing 34 43 50099 30.03 9.41 0.70 0.042 0.92 2.67 Listening 26 26 57227 20.58 4.58 0.79 0.019 0.85 1.76 Speaking 16 34 57227 29.91 6.40 0.88 0.027 0.95 1.40 Reading 26 26 57227 18.32 5.72 0.70 0.024 0.89 1.94 Writing 16 22 57227 15.42 5.05 0.70 0.021 0.87 1.80
Listening and Speaking 42 60 57227 50.48 10.06 0.84 0.042 0.94 2.55
2-4
Reading and Writing 42 48 57227 33.74 10.19 0.70 0.043 0.93 2.68 Listening 26 26 24498 20.69 5.17 0.80 0.033 0.89 1.73 Speaking 16 34 24498 29.19 7.44 0.86 0.048 0.96 1.45 Reading 26 26 24498 17.70 5.63 0.68 0.036 0.88 1.96 Writing 20 26 24498 18.91 5.59 0.73 0.036 0.88 1.95
Listening and Speaking 42 60 24498 49.88 11.72 0.83 0.075 0.95 2.61
5-6
Reading and Writing 46 52 24498 36.62 10.57 0.70 0.068 0.93 2.79 Listening 27 27 24661 19.71 5.81 0.73 0.037 0.89 1.95 Speaking 16 34 24661 28.27 8.41 0.83 0.054 0.97 1.56 Reading 29 29 24661 19.20 6.37 0.66 0.041 0.88 2.16 Writing 20 26 24661 18.30 6.07 0.70 0.039 0.89 2.02
Listening and Speaking 43 61 24661 47.98 13.09 0.79 0.083 0.95 2.93
7-8
Reading and Writing 49 55 24661 37.50 11.72 0.68 0.075 0.93 3.01 Listening 27 27 37415 18.72 4.93 0.69 0.025 0.82 2.07 Speaking 16 34 37415 26.94 8.26 0.79 0.043 0.96 1.66 Reading 29 29 37415 20.32 5.92 0.70 0.031 0.87 2.15 Writing 20 26 37415 17.88 5.41 0.69 0.028 0.83 2.20
Listening and Speaking 43 61 37415 45.66 11.90 0.75 0.062 0.93 3.16
9-12
Reading and Writing 49 55 37415 38.20 10.61 0.69 0.055 0.92 3.09 Note. The data file used in the table above is the final research file. The total n-counts for grades K-1 are 197,034. The stats
presented in the table are based on the n-counts after cleaning (remove duplicate cases, off-level cases, and all records with Strand Raw Score = 0 or greater than 900).
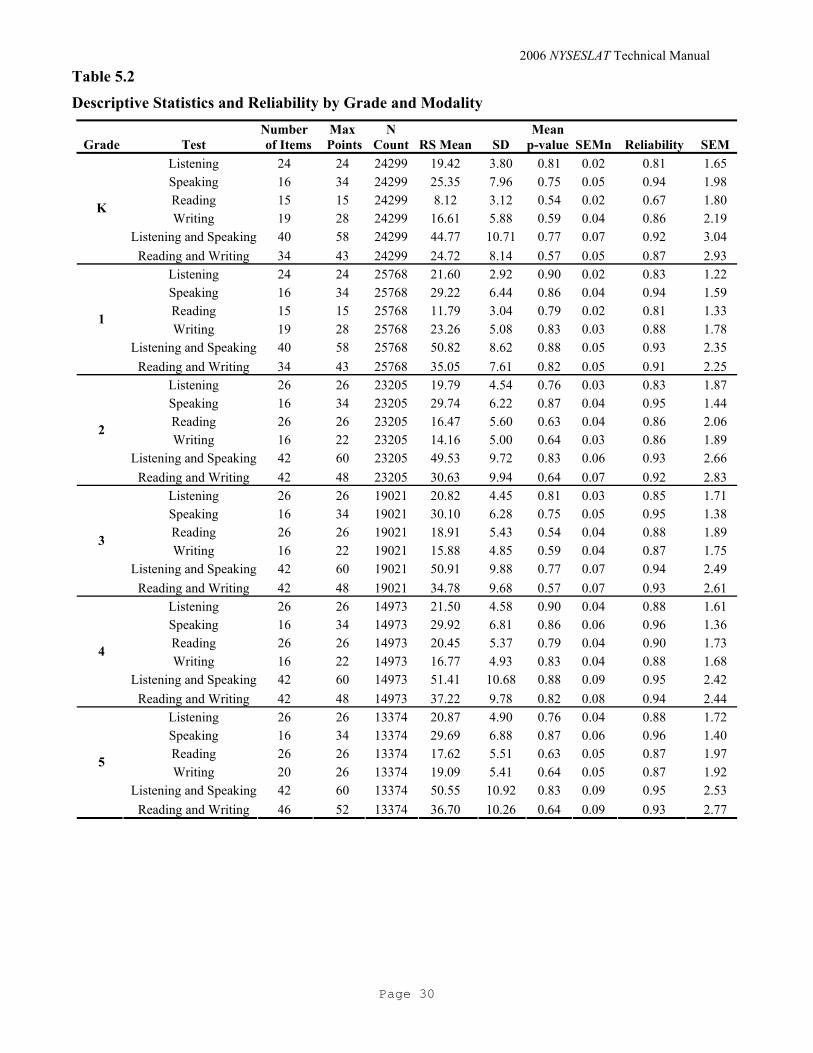
2006 NYSESLAT Technical Manual
Page 30
Table 5.2
Descriptive Statistics and Reliability by Grade and Modality
Grade Test Number of Items
Max Points
N Count RS Mean SD
Mean p-value SEMn Reliability SEM
Listening 24 24 24299 19.42 3.80 0.81 0.02 0.81 1.65 Speaking 16 34 24299 25.35 7.96 0.75 0.05 0.94 1.98 Reading 15 15 24299 8.12 3.12 0.54 0.02 0.67 1.80 Writing 19 28 24299 16.61 5.88 0.59 0.04 0.86 2.19
Listening and Speaking 40 58 24299 44.77 10.71 0.77 0.07 0.92 3.04
K
Reading and Writing 34 43 24299 24.72 8.14 0.57 0.05 0.87 2.93 Listening 24 24 25768 21.60 2.92 0.90 0.02 0.83 1.22 Speaking 16 34 25768 29.22 6.44 0.86 0.04 0.94 1.59 Reading 15 15 25768 11.79 3.04 0.79 0.02 0.81 1.33 Writing 19 28 25768 23.26 5.08 0.83 0.03 0.88 1.78
Listening and Speaking 40 58 25768 50.82 8.62 0.88 0.05 0.93 2.35
1
Reading and Writing 34 43 25768 35.05 7.61 0.82 0.05 0.91 2.25 Listening 26 26 23205 19.79 4.54 0.76 0.03 0.83 1.87 Speaking 16 34 23205 29.74 6.22 0.87 0.04 0.95 1.44 Reading 26 26 23205 16.47 5.60 0.63 0.04 0.86 2.06 Writing 16 22 23205 14.16 5.00 0.64 0.03 0.86 1.89
Listening and Speaking 42 60 23205 49.53 9.72 0.83 0.06 0.93 2.66
2
Reading and Writing 42 48 23205 30.63 9.94 0.64 0.07 0.92 2.83 Listening 26 26 19021 20.82 4.45 0.81 0.03 0.85 1.71 Speaking 16 34 19021 30.10 6.28 0.75 0.05 0.95 1.38 Reading 26 26 19021 18.91 5.43 0.54 0.04 0.88 1.89 Writing 16 22 19021 15.88 4.85 0.59 0.04 0.87 1.75
Listening and Speaking 42 60 19021 50.91 9.88 0.77 0.07 0.94 2.49
3
Reading and Writing 42 48 19021 34.78 9.68 0.57 0.07 0.93 2.61 Listening 26 26 14973 21.50 4.58 0.90 0.04 0.88 1.61 Speaking 16 34 14973 29.92 6.81 0.86 0.06 0.96 1.36 Reading 26 26 14973 20.45 5.37 0.79 0.04 0.90 1.73 Writing 16 22 14973 16.77 4.93 0.83 0.04 0.88 1.68
Listening and Speaking 42 60 14973 51.41 10.68 0.88 0.09 0.95 2.42
4
Reading and Writing 42 48 14973 37.22 9.78 0.82 0.08 0.94 2.44 Listening 26 26 13374 20.87 4.90 0.76 0.04 0.88 1.72 Speaking 16 34 13374 29.69 6.88 0.87 0.06 0.96 1.40 Reading 26 26 13374 17.62 5.51 0.63 0.05 0.87 1.97 Writing 20 26 13374 19.09 5.41 0.64 0.05 0.87 1.92
Listening and Speaking 42 60 13374 50.55 10.92 0.83 0.09 0.95 2.53
5
Reading and Writing 46 52 13374 36.70 10.26 0.64 0.09 0.93 2.77

2006 NYSESLAT Technical Manual
Page 31
Table 5.2 (Continued)
Descriptive Statistics and Reliability by Grade by Modality
Grade Test Number of Items
Max Points N Count RS Mean SD
Mean p-value SEMn Reliability SEM
Listening 26 26 11113 20.48 5.46 0.79 0.05 0.90 1.74 Speaking 16 34 11113 28.59 8.03 0.84 0.08 0.96 1.51 Reading 26 26 11113 17.80 5.77 0.68 0.05 0.89 1.96 Writing 20 26 11113 18.71 5.78 0.72 0.05 0.88 1.97
Listening and Speaking 42 60 11113 49.07 12.57 0.82 0.12 0.95 2.69
6
Reading and Writing 46 52 11113 36.51 10.93 0.70 0.10 0.93 2.80 Listening 27 27 12374 19.66 5.75 0.73 0.05 0.88 1.95 Speaking 16 34 12374 28.35 8.48 0.83 0.08 0.97 1.54 Reading 29 29 12374 18.79 6.29 0.65 0.06 0.88 2.19 Writing 20 26 12374 18.26 6.08 0.70 0.05 0.89 2.02
Listening and Speaking 43 61 12374 48.00 13.12 0.79 0.12 0.95 2.94
7
Reading and Writing 49 55 12374 37.05 11.62 0.67 0.10 0.93 3.03 Listening 27 27 12272 19.76 5.86 0.73 0.05 0.89 1.95 Speaking 16 34 12272 28.21 8.33 0.83 0.08 0.96 1.58 Reading 29 29 12272 19.61 6.42 0.68 0.06 0.89 2.14 Writing 20 26 12272 18.35 6.06 0.71 0.05 0.89 2.03
Listening and Speaking 43 61 12272 47.97 13.05 0.79 0.12 0.95 2.93
8
Reading and Writing 49 55 12272 37.96 11.79 0.69 0.11 0.94 2.99 Listening 27 27 14625 17.67 5.30 0.65 0.04 0.84 2.13 Speaking 16 34 14625 25.42 9.32 0.75 0.08 0.96 1.75 Reading 29 29 14625 18.75 6.18 0.65 0.05 0.87 2.25 Writing 20 26 14625 16.62 5.82 0.64 0.05 0.84 2.30
Listening and Speaking 43 61 14625 43.09 13.38 0.71 0.11 0.94 3.36
9
Reading and Writing 49 55 14625 35.37 11.26 0.64 0.09 0.92 3.24 Listening 27 27 12879 18.90 4.69 0.70 0.04 0.81 2.06 Speaking 16 34 12879 27.08 7.88 0.80 0.07 0.96 1.67 Reading 29 29 12879 20.69 5.71 0.71 0.05 0.86 2.13 Writing 20 26 12879 18.15 5.18 0.70 0.05 0.82 2.17
Listening and Speaking 43 61 12879 45.98 11.23 0.75 0.10 0.92 3.15
10
Reading and Writing 49 55 12879 38.84 10.15 0.71 0.09 0.91 3.05 Listening 27 27 6909 20.09 4.30 0.74 0.05 0.79 1.98 Speaking 16 34 6909 28.93 6.38 0.85 0.08 0.94 1.53 Reading 29 29 6909 22.29 5.09 0.77 0.06 0.85 2.00 Writing 20 26 6909 19.51 4.50 0.75 0.05 0.80 2.02
Listening and Speaking 43 61 6909 49.01 9.28 0.80 0.11 0.91 2.84
11
Reading and Writing 49 55 6909 41.80 8.89 0.76 0.11 0.90 2.85 Listening 27 27 2760 20.21 4.04 0.75 0.08 0.75 2.00 Speaking 16 34 2760 29.38 6.32 0.86 0.12 0.95 1.43 Reading 29 29 2760 22.09 5.04 0.76 0.10 0.84 2.04 Writing 20 26 2760 19.43 4.48 0.75 0.09 0.78 2.11
Listening and Speaking 43 61 2760 49.59 8.68 0.81 0.17 0.89 2.85
12
Reading and Writing 49 55 2760 41.53 8.67 0.76 0.17 0.89 2.94 Note. The data file used in the table above is the final research file. The total n-counts for grades K-12 are 197,034. The stats presented in the table are based on the N counts after cleaning (remove duplicate cases, off-level cases, and all records with Strand Raw Score = 0 or greater than 900).
2006 NYSESLAT Technical Manual
Page 32
5.6 Inter-rater Reliability
Another source of measurement error results in the evaluation of student work. Inter-rater reliability investigates the extent to which examinees would obtain the same score if the assessment task is scored two or more times by the same rater or different raters. One way to estimate this type of reliability is to have two raters score each student’s paper and then obtain the correlation. In this case, consistency is defined as similarity of students’ rank orderings by two raters. Another way to obtain evidence of inter-rater reliability is to calculate the percent agreement between raters. If raters always agree in their assignment of scores, there is 100% agreement. If raters never agree in their assignment of scores, there is 0% agreement. The choice between using a correlation coefficient or percent agreement depends upon whether students’ absolute (actual) or relative (rank order) score level is important for a particular interpretation and use.
To ensure that local teachers apply the same rigorous scoring standards as intended by the New York State Education Department (NYSED) and to provide evidence of inter-rater reliability, the Department requires that HAI rescore 10% of all test papers after each test administration.
The selection of the 10% audit sample for each grade span followed a stratified random selection procedure based on the Need/Resource Category, which divided the State schools into six categories: New York City, Big 4 Cities (Buffalo, Rochester, Syracuse, and Yonkers), High Need Urban/Suburbs, High Need Rural, Average Need, and Low Need.
Target values were calculated for each level using the percentage of enrollment data for each of the above classifications applied to the level targets for '10% Plus 40% Over Sample' as listed in the spreadsheet titled 'Book1.xls' NYSED provided on April 7th. Since the sample selection level was by school, enrollment data collected for the spring 2006 administration was used to select schools to be used for the sampling and analysis, with the goals of acquiring at least 95% but no more than 105% of the target count for each grade span.
These schools returned their booklets to Harcourt for rescoring. Below are the procedures that Harcourt conducted to assure reliable and accurate scoring of the items.
Table 5.3 provides the audit sample information regarding the number of students obtained for the rater analyses after merging the auditing file (Accudata) and Final Research File. The Accudata and Research file were merged by student’s ID (SID). The Ns in the table are based on the 98% of the Accudata file from auditing to match to the research file data base. The percentage of the audit sample ranged from 10% to 15% across five grade spans.

2006 NYSESLAT Technical Manual
Page 33
Table 5.3 Audit Sample
Grade Span
Number of Students in Audit Sample after
Merging1
Number of Students in Final Research File by
Grade Percentage of Total
Population2 K-1 5140 50201 10 2-4 6348 57497 11 5-6 3529 24612 14 7-8 3422 24873 14
9-12 5803 38234 15 Total 24242 195417 12
Note 1: There are 614 Accudata students that did not merge with the Final Research file and 41 Accudata students that did merge with the Final research file but had missing data. Note 2: Percentage of Total Population=Number of Students in Audit Sample/Number of students in Final Research File. Table 5.4 provides the rater agreement for the Pre-Writing and Writing constructed-response items between local raters and Harcourt raters. The Harcourt raters scored the items independently. When the two raters assigned the same score to a student’s paper, the agreement rating was denoted as exact, i.e., there was perfect agreement. Ratings that differed by exactly one score point were denoted as adjacent. Ratings that differed by two or more score points were denoted as non-adjacent. The results are presented by grade span and items. For Grade K–1, items 1–9 were scored 2. For Grade 2–12, items 1–3 were scored 0, 1, or 2, and item number 4 was scored 0, 1, 2, 3, or 4. Following are the descriptions of the rater agreement variable: Exact: 0 Score Point Difference between local and Harcourt raters Adjacent: +/–1 Score Point Difference between local and Harcourt raters Non-Adjacent: +/–2 Score Point Difference between local and Harcourt raters In Table 5.4, the percent of exact rating ranged from 47.55 to 97.00 across all the grade spans. The percent of exact rating is relatively low for item 4 (Grade 2–12) because it has a greater range (0–4). The table also provides the intraclass correlations between the local raters and Harcourt raters, Kappa coefficient, the asymptotic standard error (ASE) of the Kappa coefficient, and its lower and upper 95% confidence limits. The Intraclass Correlation assesses rating reliability by comparing the variability of different ratings of the same subject to the total variation across all ratings and all subjects. The intra-class correlations in Table 5.4 were calculated by using the random and fixed effects model introduced by Shrout and Fleiss (1979) to measure the agreement of the local and Harcourt raters. The SAS program from Douglas Steinley and Philip Karl Wood (2000) was modified so that large student samples could be used for the analyses. The intraclass correlations ranged from 0.58 to 0.92 across all the grade spans. The lowest correlations occurred at Grade Span 9-12. Kappa coefficient is an index of measuring the rater agreement with the value always less than or equal to 1. A value of 1 implies perfect agreement and values less than 1 imply less than perfect agreement. In rare situations, Kappa can be negative. This is a sign that the two observers agreed less than would be expected just by chance. It is rare that we get perfect agreement. Different people have different interpretations as to what is a good level of agreement.
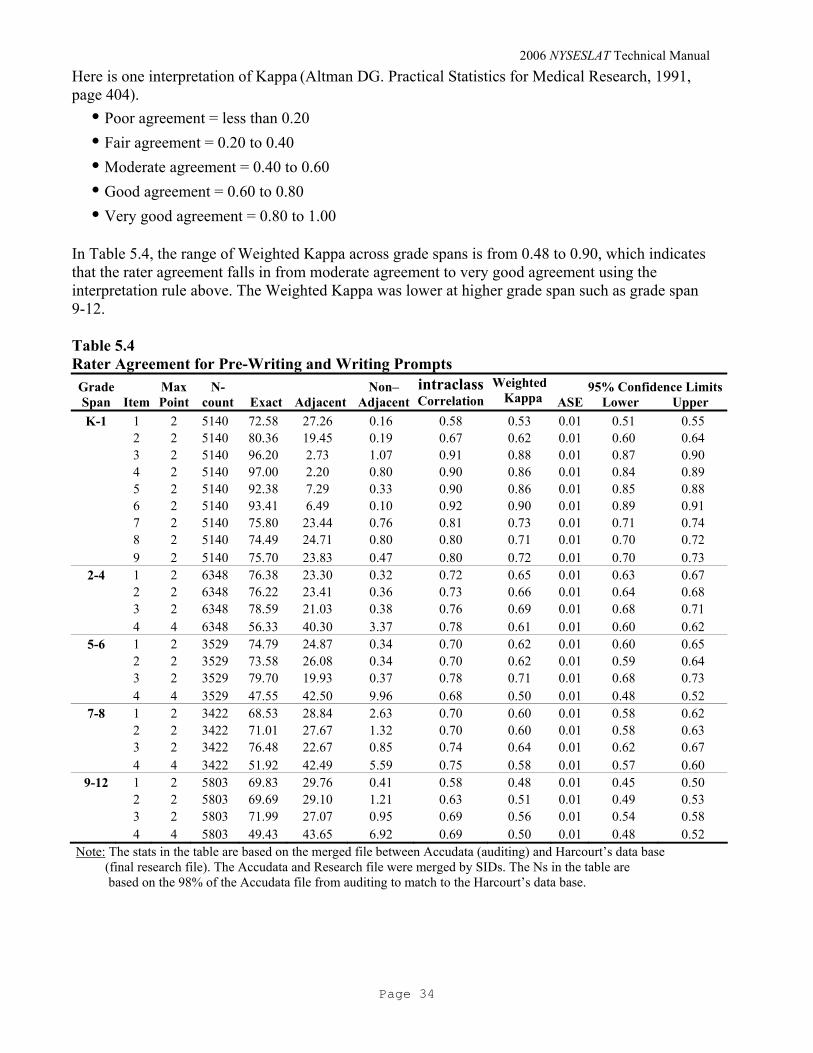
2006 NYSESLAT Technical Manual
Page 34
Here is one interpretation of Kappa (Altman DG. Practical Statistics for Medical Research, 1991, page 404). • Poor agreement = less than 0.20 • Fair agreement = 0.20 to 0.40 • Moderate agreement = 0.40 to 0.60 • Good agreement = 0.60 to 0.80 • Very good agreement = 0.80 to 1.00 In Table 5.4, the range of Weighted Kappa across grade spans is from 0.48 to 0.90, which indicates that the rater agreement falls in from moderate agreement to very good agreement using the interpretation rule above. The Weighted Kappa was lower at higher grade span such as grade span 9-12. Table 5.4 Rater Agreement for Pre-Writing and Writing Prompts Grade Span Item
Max Point
N-count Exact Adjacent
Non–Adjacent
intraclass Correlation
Weighted Kappa ASE
95% Confidence LimitsLower Upper
K-1 1 2 5140 72.58 27.26 0.16 0.58 0.53 0.01 0.51 0.55 2 2 5140 80.36 19.45 0.19 0.67 0.62 0.01 0.60 0.64 3 2 5140 96.20 2.73 1.07 0.91 0.88 0.01 0.87 0.90 4 2 5140 97.00 2.20 0.80 0.90 0.86 0.01 0.84 0.89 5 2 5140 92.38 7.29 0.33 0.90 0.86 0.01 0.85 0.88 6 2 5140 93.41 6.49 0.10 0.92 0.90 0.01 0.89 0.91 7 2 5140 75.80 23.44 0.76 0.81 0.73 0.01 0.71 0.74 8 2 5140 74.49 24.71 0.80 0.80 0.71 0.01 0.70 0.72 9 2 5140 75.70 23.83 0.47 0.80 0.72 0.01 0.70 0.73
2-4 1 2 6348 76.38 23.30 0.32 0.72 0.65 0.01 0.63 0.67 2 2 6348 76.22 23.41 0.36 0.73 0.66 0.01 0.64 0.68 3 2 6348 78.59 21.03 0.38 0.76 0.69 0.01 0.68 0.71 4 4 6348 56.33 40.30 3.37 0.78 0.61 0.01 0.60 0.62
5-6 1 2 3529 74.79 24.87 0.34 0.70 0.62 0.01 0.60 0.65 2 2 3529 73.58 26.08 0.34 0.70 0.62 0.01 0.59 0.64 3 2 3529 79.70 19.93 0.37 0.78 0.71 0.01 0.68 0.73 4 4 3529 47.55 42.50 9.96 0.68 0.50 0.01 0.48 0.52
7-8 1 2 3422 68.53 28.84 2.63 0.70 0.60 0.01 0.58 0.62 2 2 3422 71.01 27.67 1.32 0.70 0.60 0.01 0.58 0.63 3 2 3422 76.48 22.67 0.85 0.74 0.64 0.01 0.62 0.67 4 4 3422 51.92 42.49 5.59 0.75 0.58 0.01 0.57 0.60
9-12 1 2 5803 69.83 29.76 0.41 0.58 0.48 0.01 0.45 0.50 2 2 5803 69.69 29.10 1.21 0.63 0.51 0.01 0.49 0.53 3 2 5803 71.99 27.07 0.95 0.69 0.56 0.01 0.54 0.58 4 4 5803 49.43 43.65 6.92 0.69 0.50 0.01 0.48 0.52
Note: The stats in the table are based on the merged file between Accudata (auditing) and Harcourt’s data base (final research file). The Accudata and Research file were merged by SIDs. The Ns in the table are based on the 98% of the Accudata file from auditing to match to the Harcourt’s data base.
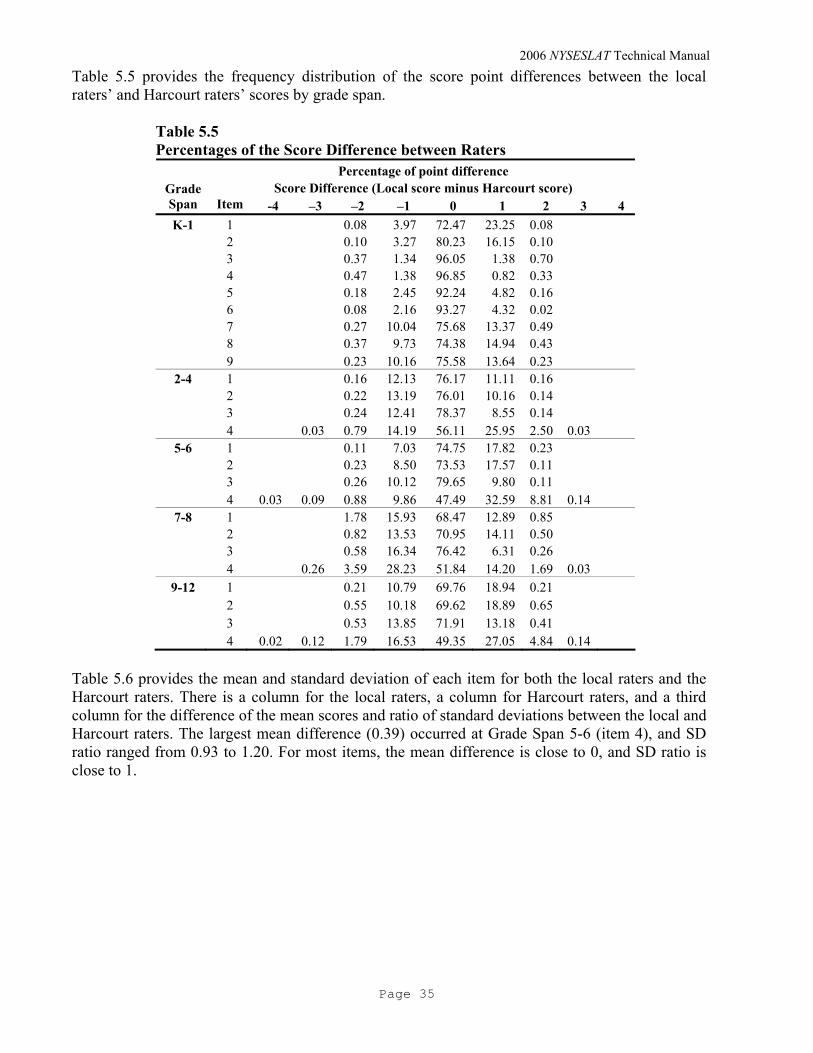
2006 NYSESLAT Technical Manual
Page 35
Table 5.5 provides the frequency distribution of the score point differences between the local raters’ and Harcourt raters’ scores by grade span.
Table 5.5 Percentages of the Score Difference between Raters
Percentage of point difference Score Difference (Local score minus Harcourt score) Grade
Span Item -4 –3 –2 –1 0 1 2 3 4 K-1 1 0.08 3.97 72.47 23.25 0.08
2 0.10 3.27 80.23 16.15 0.10 3 0.37 1.34 96.05 1.38 0.70 4 0.47 1.38 96.85 0.82 0.33 5 0.18 2.45 92.24 4.82 0.16 6 0.08 2.16 93.27 4.32 0.02 7 0.27 10.04 75.68 13.37 0.49 8 0.37 9.73 74.38 14.94 0.43 9 0.23 10.16 75.58 13.64 0.23
2-4 1 0.16 12.13 76.17 11.11 0.16 2 0.22 13.19 76.01 10.16 0.14 3 0.24 12.41 78.37 8.55 0.14 4 0.03 0.79 14.19 56.11 25.95 2.50 0.03
5-6 1 0.11 7.03 74.75 17.82 0.23 2 0.23 8.50 73.53 17.57 0.11 3 0.26 10.12 79.65 9.80 0.11 4 0.03 0.09 0.88 9.86 47.49 32.59 8.81 0.14
7-8 1 1.78 15.93 68.47 12.89 0.85 2 0.82 13.53 70.95 14.11 0.50 3 0.58 16.34 76.42 6.31 0.26 4 0.26 3.59 28.23 51.84 14.20 1.69 0.03
9-12 1 0.21 10.79 69.76 18.94 0.21 2 0.55 10.18 69.62 18.89 0.65 3 0.53 13.85 71.91 13.18 0.41 4 0.02 0.12 1.79 16.53 49.35 27.05 4.84 0.14
Table 5.6 provides the mean and standard deviation of each item for both the local raters and the Harcourt raters. There is a column for the local raters, a column for Harcourt raters, and a third column for the difference of the mean scores and ratio of standard deviations between the local and Harcourt raters. The largest mean difference (0.39) occurred at Grade Span 5-6 (item 4), and SD ratio ranged from 0.93 to 1.20. For most items, the mean difference is close to 0, and SD ratio is close to 1.

2006 NYSESLAT Technical Manual
Page 36
Table 5.6 Comparison between Local and Harcourt Raters
Local Harcourt Differences Grade Span Item Mean SD Mean SD Mean SD Ratio K-1 1 1.61 0.55 1.41 0.57 0.19 0.96
2 1.69 0.53 1.57 0.57 0.13 0.93 3 1.77 0.62 1.76 0.64 0.01 0.97 4 1.85 0.52 1.85 0.51 -0.01 1.02 5 1.63 0.64 1.61 0.67 0.02 0.96 6 1.45 0.66 1.43 0.66 0.02 1.00 7 1.04 0.83 1.00 0.86 0.04 0.97 8 1.04 0.82 0.99 0.85 0.05 0.96 9 0.91 0.81 0.87 0.80 0.04 1.01
2-4 1 1.39 0.66 1.40 0.67 -0.01 0.99 2 1.35 0.68 1.38 0.69 -0.03 0.99 3 1.37 0.69 1.41 0.70 -0.04 0.99 4 2.18 1.14 2.03 1.05 0.15 1.09
5-6 1 1.46 0.66 1.35 0.65 0.11 1.02 2 1.44 0.68 1.35 0.67 0.09 1.01 3 1.44 0.70 1.45 0.69 -0.01 1.01 4 2.21 1.20 1.82 1.00 0.39 1.20
7-8 1 1.26 0.79 1.31 0.82 -0.05 0.96 2 1.36 0.74 1.37 0.73 0.00 1.01 3 1.46 0.71 1.57 0.69 -0.11 1.03 4 1.92 1.18 2.10 1.14 -0.19 1.04
9-12 1 1.61 0.61 1.53 0.61 0.08 1.00 2 1.59 0.67 1.50 0.66 0.09 1.02 3 1.51 0.69 1.52 0.67 -0.01 1.03 4 2.23 1.13 2.06 0.96 0.17 1.18
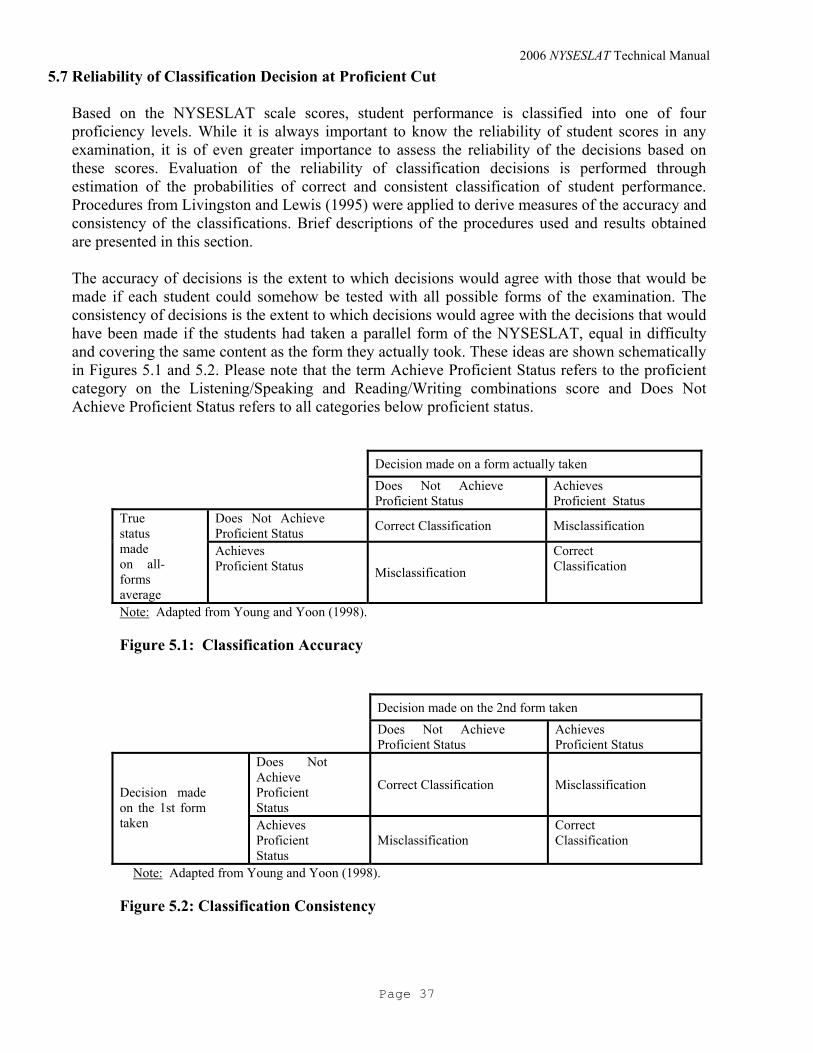
2006 NYSESLAT Technical Manual
Page 37
5.7 Reliability of Classification Decision at Proficient Cut Based on the NYSESLAT scale scores, student performance is classified into one of four proficiency levels. While it is always important to know the reliability of student scores in any examination, it is of even greater importance to assess the reliability of the decisions based on these scores. Evaluation of the reliability of classification decisions is performed through estimation of the probabilities of correct and consistent classification of student performance. Procedures from Livingston and Lewis (1995) were applied to derive measures of the accuracy and consistency of the classifications. Brief descriptions of the procedures used and results obtained are presented in this section. The accuracy of decisions is the extent to which decisions would agree with those that would be made if each student could somehow be tested with all possible forms of the examination. The consistency of decisions is the extent to which decisions would agree with the decisions that would have been made if the students had taken a parallel form of the NYSESLAT, equal in difficulty and covering the same content as the form they actually took. These ideas are shown schematically in Figures 5.1 and 5.2. Please note that the term Achieve Proficient Status refers to the proficient category on the Listening/Speaking and Reading/Writing combinations score and Does Not Achieve Proficient Status refers to all categories below proficient status.
Decision made on a form actually taken Does Not Achieve Proficient Status
Achieves Proficient Status
Does Not Achieve Proficient Status Correct Classification Misclassification True
status made on all-forms average
Achieves Proficient Status Misclassification
Correct Classification
Note: Adapted from Young and Yoon (1998).
Figure 5.1: Classification Accuracy
Decision made on the 2nd form taken Does Not Achieve Proficient Status
Achieves Proficient Status
Does Not Achieve Proficient Status
Correct Classification Misclassification Decision made on the 1st form taken Achieves
Proficient Status
Misclassification Correct Classification
Note: Adapted from Young and Yoon (1998).
Figure 5.2: Classification Consistency

2006 NYSESLAT Technical Manual
Page 38
In Figure 5.1, accurate classifications occur when the decision made on the basis of the all-forms average agrees with the decision made on the basis of the form actually taken.
Misclassifications occur when, for example, a student who actually accomplished Does Not Achieve Proficient Status on the basis of his or her all-forms average is classified incorrectly as accomplishing Achieves Proficient Status. Consistent classification occurs (Figure 5.2) when two forms agree on the classification of a student as either Achieves Proficient Status or Does Not Achieve Proficient Status, whereas inconsistent classification occurs when the decisions made by the forms differ. These analyses make use of the techniques outlined and implemented by Hanson (1991), Haertel (1996), Livingston and Lewis (1995), and Young and Yoon (1998). The software developed by Hanson (1995) was used for the analyses. Estimates of decision accuracy and consistency were made for the Achieves Proficient Status cut points on the Listening/Speaking and Reading/Writing scores reported in the NYSESLAT. The table also includes the proportions of False Positive and False Negative classifications. The sum of values of Accuracy, False Positive, and False Negative is equal to 1.00, but due to rounding the table values may or may not equal 1.00. False Positive and False Negative classifications refer to the mismatch between student true scores and observed scores. The False Positive value is the proportion of student scores misclassified to the category Achieves Proficient Status when student scores do not meet proficient status. The False Negative value is the proportion of student scores misclassified to the category Does Not Achieve Proficient Status when student scores actually do meet proficient status.
Table 5.7 presents the results of the decision accuracy and consistency of the Achieves Proficient Status cut scores for the Listening/Speaking and Reading/Writing scores. The table contains the following:
• Accuracy • False positives • False negatives • Consistency • Proficient Conditional SEM
Decision accuracy refers to the agreement between the classifications based on the form actually taken and the classifications that would be made if each student could somehow be tested with all possible forms (or true score) of the examination. For Listening/Speaking combination proficiency level classification, the accuracy ranged from 73% to 88% across all grade levels. For Reading/Writing combination proficiency level classification, the accuracy ranged from 86% to 96% across all the grade levels. Decision consistency refers to the agreement between the classifications based on the form actually taken and the classifications that would be made on the basis of an alternate form. For the Listening/Speaking combination proficiency level classifications, the consistency ranged from 68% to 84% across all the grade levels. For the Reading/Writing combination proficiency level classifications, the consistency ranged from 81% to 94% across all the grade levels. Both decision accuracy and consistency for the proficiency level were higher for Reading/Writing combination than those for the Listening/Speaking. The table also illustrates the general rule that decision

2006 NYSESLAT Technical Manual
Page 39
consistency is less than decision accuracy. This is understandable since decision consistency is dependent on a single alternate form while accuracy relates to the agreement of the assessment classification with the classification on multiple forms where the variation on a single form would be subsumed under the overall variation based on countless multiple forms to produce true scores.
The false positive ranged from 0.05 to 0.25 for Listening/Speaking, and 0.03 to 0.10 for Reading/Writing across all the grade levels. The false negative ranged from 0.00 to 0.21 for Listening/Speaking, and 0.01 to 0.08 for Reading/Writing across all the grade levels. Relatively speaking, the NYSESLAT shows a high degree of accuracy and consistency with respect to the false positive and negatives.
Table 5.7
Decision and Consistency Table by Grade
Grade Test AccuracyFalse
Positives False
Negatives ConsistencyProficient
Conditional SEM Listening and Speaking 0.84 0.08 0.08 0.79 17.20 K
Reading and Writing 0.96 0.03 0.01 0.94 16.50 Listening and Speaking 0.87 0.13 0.00 0.79 25.90 1 Reading and Writing 0.87 0.10 0.04 0.83 26.00 Listening and Speaking 0.80 0.07 0.13 0.72 16.00 2 Reading and Writing 0.92 0.05 0.03 0.89 14.70 Listening and Speaking 0.73 0.13 0.14 0.68 19.00 3
Reading and Writing 0.88 0.05 0.07 0.83 16.40 Listening and Speaking 0.75 0.25 0.00 0.70 21.50 4 Reading and Writing 0.86 0.06 0.08 0.81 19.30 Listening and Speaking 0.73 0.06 0.21 0.69 18.70 5 Reading and Writing 0.90 0.06 0.04 0.86 15.30 Listening and Speaking 0.76 0.24 0.00 0.73 21.30 6 Reading and Writing 0.91 0.05 0.05 0.87 16.20 Listening and Speaking 0.83 0.06 0.11 0.76 16.80 7 Reading and Writing 0.92 0.05 0.04 0.88 15.80 Listening and Speaking 0.87 0.05 0.08 0.81 16.80 8 Reading and Writing 0.91 0.05 0.04 0.88 15.80 Listening and Speaking 0.88 0.07 0.05 0.84 14.70 9 Reading and Writing 0.93 0.04 0.04 0.90 14.10 Listening and Speaking 0.86 0.07 0.07 0.82 15.70 10 Reading and Writing 0.91 0.06 0.03 0.88 14.80 Listening and Speaking 0.83 0.08 0.09 0.79 16.90 11
Reading and Writing 0.89 0.07 0.04 0.84 15.80 Listening and Speaking 0.84 0.16 0.00 0.77 16.90 12
Reading and Writing 0.87 0.09 0.05 0.82 15.80 Note: The data file used in the table above is the final research file. The total n-counts for grades K–12 are 197,034. The stats presented in the table are based on the n-counts after cleaning (remove duplicate cases, off-level
cases, and all records with Strand Raw Score = 0 or greater than 900). Additionally, cases with missing grade are also removed.
2006 NYSESLAT Technical Manual
Page 40
PART 6: VALIDITY
Assessments constructed from Harcourt support the validity related standards set forth in the Standards for Educational and Psychological Testing. Our judgments about test validity are based on the following sources of evidence of validity1:
• Test content—“an analysis of the relationship between a test’s content and the construct it is intended to measure” (p. 11)
• Internal structure—“the degree to which the relationships among test items and test components conform to the construct on which the proposed test score interpretations are made” (p. 13)
• Relationships to other variables—“analyses of the relationship of test scores to variables external to the test” (p. 13)
6.1 Content Validity
Evidence of validity based on test content is revealed by the extent to which the material on the test represents an appropriate sampling of skills, knowledge, and understanding of the domain tested. The New York State Learning Standards for English as a Second Language defines the skills, knowledge, and understanding which are expected for English language learner (ELL) children in New York State. There are several steps involved in aligning NYSESLAT items and test forms to these standards in order to ensure the content validity of the test.
Harcourt psychometricians and ELL assessment specialists, with input from NYSED assessment and content specialists, developed a test blueprint that includes a range of item types which can measure all those standards and performance indicators from the New York State Learning Standards for English as a Second Language that are measurable on a standardized test. (Harcourt ELL assessment specialists, working with committees of New York State ESL teachers, identified performance indicators that were designed for classroom use only, and thus could not be measured in a standardized test.)
When NYSESLAT item writers received item writing assignments, they were instructed to use NYSESLAT item type specifications in conjunction with the New York State Learning Standards for English as a Second Language to guide their writing, and then to identify a particular standard and performance indicator that best matches what each item is measuring. When items were reviewed by committees of New York State teachers, an integral part of the review process was discussion of and agreement on the standard and performance indicator assigned to each item.
Footnote
1The page number in the parenthesis is the page number in the Standards for Educational and Psychological Testing, 1999.

2006 NYSESLAT Technical Manual
Page 41
The assigned standards and performance indicators were one of several criteria (e.g., item statistics, content diversity, gender and ethnic balance, etc.) that were then considered by Harcourt ELL assessment specialists and NYSED assessment and content specialists during forms construction, to ensure that forms reflected broad coverage of the Learning Standards. After forms construction was completed, item maps were developed for each form to show this coverage item by item. ELL assessment specialists at Harcourt and content specialists at NYSED reviewed the item maps to confirm the alignment of a given form to the New York State Learning Standards for English as a Second Language. The item mapping provided in Table 6.1 below and Appendices A.2–A.8 gives concrete evidence for the alignment to the New York State Learning Standards for English as a Second Language.
Table 6.1: 2006 NYSESLAT Item Mapping by New York State Standards Subtest Standards and PIs
Covered Items in Subtest Percentage of
Subtest Score K-1 Speaking Standard 1 / PI 7, 9, 12 1, 2, 6, 9-11 41
Standard 2 / PI 6 3-5 18 Standard 4 / PI 4, 5, 9, 11 7, 8, 12-16 41
K-1 Listening Standard 1 / PI 1, 3, 12, 16 1-16, 21 71 Standard 3 / PI 9 17, 19 8 Standard 4 / PI 7 20, 24 8 Standard 5 / PI 2 18, 22, 23 13
K-1 Reading Standard 1 / PI 1, 5, 16 1-11, 14, 15 87 Standard 2 / PI 2 12, 13 13
K-1 WC Standard 1 / PI 12, 15 1-8 29 Standard 3 / PI 5, 8 9, 10 7
K-1 Writing Standard 1 / PI 11, 12 1-8 57 Standard 3 / PI 1 9 7
2-4 Speaking Standard 1 / PI 7, 9, 12 1, 2, 6-8, 11 41 Standard 2 / PI 6 3-5 18 Standard 4 / PI 2, 3, 8, 9 9, 12-16 35 Standard 5 / PI 2 10 6
2-4 Listening Standard 1 / PI 1, 3, 16 1-7, 9-12, 20, 21 50 Standard 3 / PI 1, 3, 9 8, 15, 16, 19 15 Standard 4 / PI 3, 7, 8 22-26 20 Standard 5 / PI 2, 4, 6 13, 14, 17, 18 15
2-4 Reading Standard 1 / PI 1, 3, 6, 16 1-14, 16, 17, 19 65 Standard 2 / PI 2, 5, 12 21-26 23 Standard 3 / PI 3, 5 15, 18, 20 12

2006 NYSESLAT Technical Manual
Page 42
Table 6.1: 2006 NYSESLAT Item Mapping by New York State Standards (Continued) Subtest Standards and PIs
Covered Items in Subtest Percentage of
Subtest Score
2-4 WC Standard 1 / PI 5, 12, 15 1-8 36 Standard 3 / PI 4 9-12 18
2-4 Writing Standard 1 / PI 11 Pre-Writing 1, 2, 3 28 Standard 3 / PI 1 Writing 1 18
5-6 Speaking Standard 1 / PI 9, 12 1, 6, 7, 9 24 Standard 2 / PI 6, 8, 11 2-5, 11 35 Standard 4 / PI 2, 3, 8 8, 12-16 35 Standard 5 / PI 2 10 6
5-6 Listening Standard 1 / PI 1, 5, 16 1-5, 8, 11 27 Standard 3 / PI 3 9 4 Standard 4 / PI 4, 7, 8, 9, 10 6, 12, 14, 16-26 54 Standard 5 / PI 1, 2, 4 7, 10, 13, 15 15
5-6 Reading Standard 1 / PI 1, 5, 16 1-6, 11, 12, 20, 21, 25 43 Standard 2 / PI 2, 5, 12 13, 16-19 19 Standard 3 / PI 3, 5, 9 14, 15, 22-24, 26 23 Standard 5 / PI 3, 6 7-10 15
5-6 WC Standard 1 / PI 1, 12, 15 1-9 35 Standard 3 / PI 4, 6 10-16 27
5-6 Writing Standard 1 / PI 11 Pre-Writing 1, 2, 3 23 Standard 3 / PI 1 Writing 1 15
7-8 Speaking Standard 1 / PI 9, 12 1, 6-10 35 Standard 2 / PI 6, 8 2-5, 11 35 Standard 4 / PI 3, 5, 9 12-16 30
7-8 Listening Standard 1 / PI 1, 6, 10, 16 1-7, 13-17, 22-24 56 Standard 4 / PI 7, 9 8, 9, 18-21, 25-27 33 Standard 5 / PI 4 10-12 11
7-8 Reading Standard 1 / PI 1, 4, 6, 16 1-7, 20-25, 27 48 Standard 2 / PI 2, 4, 5, 12 10-13, 15, 17-19, 26, 28, 29 38 Standard 3 / PI 5, 9 8, 9, 14, 16 14
7-8 WC Standard 1 / PI 6, 12 1-8 31 Standard 3 / PI 8 9-16 31
7-8 Writing Standard 1 / PI 11 Pre-Writing 1, 2, 3 23 Standard 3 / PI 1 Writing 1 15

2006 NYSESLAT Technical Manual
Page 43
Table 6.1: 2006 NYSESLAT Item Mapping by New York State Standards (Continued) Subtest Standards and PIs
Covered Items in Subtest Percentage of
Subtest Score 9-12 Speaking Standard 1 / PI 9 6, 9 12
Standard 2 / PI 6, 8 1-5, 11 41 Standard 4 / PI 2, 3, 5 7, 12-16 35 Standard 5 / PI 6 8, 10 12
9-12 Listening Standard 1 / PI 1, 6, 16 1-5, 8-11, 16, 17, 20-22, 24, 26, 27
63
Standard 4 / PI 7, 9 6, 7, 12-15, 18, 19, 23, 25 37
9-12 Reading Standard 1 / PI 1, 6, 16 1-5, 7, 9-21, 28 69 Standard 2 / PI 4, 5, 12 25-27, 29 14 Standard 3 / PI 5, 9 6, 8, 22-24 17
9-12 WC Standard 1 / PI 6, 12 1-8 31 Standard 3 / PI 8 9-16 31
9-12 Writing Standard 1 / PI 11 Pre-Writing 1, 2, 3 23 Standard 3 / PI 1 Writing 1 15
Differential Item Functioning Differential Item Functioning (DIF) analyses are often used to identify potential items that need to be scrutinized for item bias. Differential item functioning (DIF) statistical procedures compute the probability that one demographic group is more likely to answer an item correctly than another group, when the groups are equally able. This information is useful in reviewing items and tests for potential bias in items. However, DIF does not necessarily indicate the existence of bias. As such, the flagging of an item for DIF must be evaluated substantively for bias indication For NYSESLAT, we proposed a contingency table approach for analyzing DIF. However, besides the usual tests of significance (e.g., the Mantel-Haenszel and the Mantel Chi-square – MHχ2 and Mχ2), we also proposed to use an effect size index, i.e., the standardized mean difference (SMD) in categorizing items that function differentially. The categories outlined in this paper are a modification of what is commonly referred to as the ETS DIF categories and are widely accepted in the field of psychometrics as a method of categorizing the degree of DIF based on both the significance testing and the effect size of DIF. For the dichotomously scored item, the MHχ2 introduced by Mantel and Haenszel (1959) will be used as a test for significance testing. Under the null hypothesis, the MHχ2 is distributed approximately as a Chi-square with one degree of freedom. This is a very popular method of detecting DIF in many large-scale assessments and further information on it can easily be obtained in literature, e.g., Camilli and Shepard (1994). Since the NYSESLAT examinations also include constructed response items that are polytomously scored, the Mantel-Haenszel Chi-square cannot be used as a DIF index for these field test (FT) items. Instead, a generalization of the Mantel-Haenszel (1959) procedure for ordered categories, the Mantel Statistic (Mantel, 1963), will be used for the assessment of DIF for the constructed and extended responses (CR and ER) of the NYSESLAT examinations. The Mantel Chi-square involves comparing the mean for two groups, conditional on a matching variable. It has 1 degree of freedom under the null hypothesis of no conditional association between group

2006 NYSESLAT Technical Manual
Page 44
membership and response. For dichotomous items the Mantel statistic reduces to the usual Mantel-Haenszel Chi-square statistic (without continuity correction). The Mantel statistics has the following mathematical formulation:
Mantel Chi–square = ∑
∑−∑
KK
KKK
K
FVar
FEF
)(
)( )( 2
(7)
where FK is the sum of scores for the Focal group at the Kth level of the matching variable, E is the expected and Var is the variance of FK.
FK = ny FTKT
T∑ ,
where yT represent the T scores that can be obtained on the item while nFTK denotes the number of focal group members who are on the Kth level of the matching variable and received an item score of yT . The expectation of FK under the hypothesis of no association is
E(FK) =
nn
K
KF
++
+ ny TKT
T +∑ (8)
The Mantel-Haenszel and the Mantel statistic, however, offer a significance test of the presence of DIF without an indication of the direction of DIF, i.e. whether in favor of the reference or the comparison group. The statistic has low power in detecting an association in which the pattern of association for some of the strata is in the opposite direction of the patterns displayed by other strata. On the other hand, as a significance test, its power increases with the number of responses in the two groups of comparison.
The effect size index for DIF was analyzed by the standardized mean differences (SMDs) (Zwick, Donoghue & Grima, 1993) for both the dichotomous and the polytomous items. The SMDs, which take into account the natural ordering of the item’s response levels, are based on only those ability levels where members of the comparison groups are present. This index also helps in discerning the direction of DIF. A negative value for SMD reflects differential item functioning in favor of the reference group and against the comparison or focal group. Mathematically SMD is defined as follows:
∑∑ −=k
RkFkk
FkFk mpmpSMD (9)
where pFk is the proportion of focal group members who are at the kth level of the matching variable, mFk is the mean item score for the focal group at the kth level, and mRk is the analogous value for the reference group.

2006 NYSESLAT Technical Manual
Page 45
Similar to the dichotomously scored item classification, DIF is also categorized as “no-DIF” (A), “mild/moderate-DIF” (B) or “extreme-DIF” (C). However, for DIF classification with polytomously scored items, the Mantel statistic is used in conjunction with SMDs divided by the total group standard deviation (SD) – (see Table 6.2).
Table 6.2 Classification of DIF for Dichotomous and Polytomously Scored Items Type of Scoring Condition of Category Classification DIF Category
Dichotomous Mantel-Haenszel Chi-square not significant, or Mantel Chi-square significantand |SMD/SD| ≤ 0.17 A
Dichotomous Mantel-Haenszel Chi-square significant and 0.17 < |SMD/SD| ≤ 0.25 B
Dichotomous
Mantel-Haenszel Chi-square significant and |SMD/SD| > 0.25
C
Polytomous Mantel Chi-square not significant, or Mantel Chi-square significant and |SMD/SD| ≤ 0.17 A
Polytomous
Mantel Chi-square significant and 0.17 < |SMD/SD| ≤ 0.25
B
Polytomous
Mantel Chi-square significant and |SMD/SD| > 0.25
C
For NYSESLAT, we compared the performance of male with female students and of Hispanic students with the rest of the ethnic groups including white students. In these comparisons, male students and Hispanic students were considered the reference groups while females and the other ethnicities were considered the focal groups. However, all groups could not be analyzed for DIF because of the low n-counts in some of the groups. For the field test items, Spanish speaking students were compared with students whose home language was other than Spanish, provided enough n-counts were available for the comparison. In the separate 2006 Field Test Report, DIF analysis results for each grade span by form for the field test items were provided, while Appendix L of this report provides the same for the operational items. The > sign next to DIF category indicates that the item is in favor of the reference group while < indicates in favor of the focal groups. It is important to note that DIF does not indicate bias. None of the items showing moderate or extreme DIF in Table 6.2 were identified as “biased” by the content specialists.
6.2 Internal Structure
An assessment procedure should not be a random collection of assessment tasks or test questions. Each task in the assessment should contribute positively to the total result. The interrelationship among the tasks on an assessment is known as the internal structure of the assessment. Typical questions that investigate the relationships among assessment parts (Nitko, 2004) include:
• Do all of the assessment tasks “work together” so that each task contributes positively toward assessing the quality of interest?
• If different parts of the assessment procedure are to provide unique information, do the results support this uniqueness?
• If different parts of the assessment procedure are to provide the same or similar information, do the results support this?

2006 NYSESLAT Technical Manual
Page 46
In order to investigate the answers to these questions, correlations based on raw scores were obtained between the four modalities. Tables 6.3 and 6.4 present the intercorrelations among the four modalities by grade span and grade. The evidence of internal structure of the 2006 NYSESLAT is also depicted by the point biserial correlation coefficient and fit statistics. Appendices B.1–B.5 and D.1–D.5 provide these statistics for the 2006 NYSESLAT.
Table 6.3
Intercorrelations among the Modalities by Grade Span Correlation Coefficient Grade Span Test Listening Speaking Reading Writing
K–1 Listening 1.00 Speaking 0.65 1.00 Reading 0.49 0.44 1.00 Writing 0.58 0.54 0.76 1.00
2–4 Listening 1.00 Speaking 0.67 1.00 Reading 0.67 0.51 1.00 Writing 0.68 0.60 0.79 1.00
5–6 Listening 1.00 Speaking 0.72 1.00 Reading 0.72 0.58 1.00 Writing 0.75 0.68 0.77 1.00
7–8 Listening 1.00 Speaking 0.68 1.00 Reading 0.72 0.58 1.00 Writing 0.78 0.72 0.77 1.00
9–12 Listening 1.00 Speaking 0.60 1.00 Reading 0.70 0.55 1.00 Writing 0.71 0.64 0.75 1.00
Note: The data file used in the table above is the final research file. The total n-counts for grades K–12 are 197,034. The stats presented in the table are based on raw scores with the n-counts after cleaning (remove duplicate cases, off-level cases, and all records with Strand Raw Score = 0 or greater than 900). Additionally, cases with missing grade are also removed.
Table 6.4
Intercorrelations among the Modalities by Grade Correlation Coefficient Grade Test Listening Speaking Reading Writing
K Listening 1.00 Speaking 0.61 1.00 Reading 0.36 0.30 1.00 Writing 0.50 0.44 0.60 1.00
1 Listening 1.00 Speaking 0.65 1.00 Reading 0.48 0.47 1.00 Writing 0.55 0.55 0.74 1.00
2 Listening 1.00 Speaking 0.62 1.00 Reading 0.62 0.46 1.00 Writing 0.63 0.55 0.76 1.00

2006 NYSESLAT Technical Manual
Page 47
Table 6.4 (Continued)
Interco relations Among the Modalities by Grade Correlation Coefficient Grade Test Listening Speaking Reading Writing
3 Listening 1.00 Speaking 0.69 1.00 Reading 0.65 0.54 1.00 Writing 0.67 0.62 0.77 1.00
4 Listening 1.00 Speaking 0.75 1.00 Reading 0.72 0.61 1.00 Writing 0.73 0.69 0.80 1.00
5 Listening 1.00 Speaking 0.71 1.00 Reading 0.70 0.56 1.00 Writing 0.73 0.68 0.76 1.00
6 Listening 1.00 Speaking 0.73 1.00 Reading 0.74 0.60 1.00 Writing 0.77 0.69 0.79 1.00
7 Listening 1.00 Speaking 0.69 1.00 Reading 0.71 0.57 1.00 Writing 0.78 0.72 0.77 1.00
8 Listening 1.00 Speaking 0.68 1.00 Reading 0.73 0.59 1.00 Writing 0.78 0.72 0.78 1.00
9 Listening 1.00 Speaking 0.65 1.00 Reading 0.71 0.58 1.00 Writing 0.74 0.69 0.76 1.00
10 Listening 1.00 Speaking 0.57 1.00 Reading 0.69 0.53 1.00 Writing 0.70 0.62 0.74 1.00
11 Listening 1.00 Speaking 0.49 1.00 Reading 0.67 0.47 1.00 Writing 0.64 0.52 0.72 1.00
12 Listening 1.00 Speaking 0.37 1.00 Reading 0.57 0.33 1.00 Writing 0.56 0.42 0.66 1.00
Note: The data file used in the table above is the final research file. The total n-counts for grades K–12 are 197,034. The stats presented in the table are based on the n-counts after cleaning (remove duplicate cases, off-level cases, and all records with Strand Raw Score = 0 or greater than 900). Additionally, cases with missing grade are also removed.

2006 NYSESLAT Technical Manual
Page 48
Observations of language proficiency assessment subtests in Table 6.3:
• Listening and Speaking are moderately correlated for Grades 2–12 ranging from 0.60 to 0.72;
• Listening and Reading are moderately correlated for Grades 2–12 ranging from 0.49 to 0.72;
• Reading and Writing are moderately correlated for Grades 2–12 ranging from 0.75 to 0.79;
• Speaking and Writing are moderately correlated for Grades 2–12 ranging from 0.54 to 0.72;
• Historically, the language domain pairs of Listening and Speaking and Reading and Writing are moderately to highly correlated while Speaking and Writing are not highly correlated.
Observations of language proficiency assessment subtests in Table 6.4:
Kindergarten
• Students in this age group do not usually read or write yet but can have Listening and Speaking skills. The expected outcome is that neither Reading nor Writing will correlate highly with Listening or Speaking.
• In Table 6.4, for kindergarten students, Speaking and Listening have a correlation of 0.61, and Reading and Writing have a correlation of 0.60. Speaking and Reading have a low correlation of 0.30, Listening and Reading have a low correlation of 0.36, Speaking and Writing have a correlation of 0.44, and Listening and Writing have a correlation of 0.50.
Grades 1-8
• A steady increase in the correlation (from 0.55 to 0.78) between Writing and Listening is observed.
• A possible explanation (personal communication with Harcourt content specialists Diane Johnson and Frantz Rodger) is that, in general, students during this age span experience expanding use and development in their Writing skills. At the same time, demands on the Listening skills of this age group remain fairly static with only moderate development.
Grades 9-12
• A steady decrease in the correlation (from 0.74 to 0.56) between Writing and Listening is observed.
• A possible explanation (personal communication with Harcourt content specialists Diane Johnson and Roger Frantz) is that by high school, there is an increased focus on use of Writing skills, especially an increased focus on academic content. Requirements of high school age student Listening skills also increase, but not nearly at as steep a curve as Writing.
• Similar arguments may be made for the correlational behavior between Speaking and Writing in grades 1-12. There is a steady increase in the correlation (from 0.55 to 0.72) for Grades 1-8, and there is a steady decrease in the correlation from (0.69 to 0.42) for Grades 9-12.

2006 NYSESLAT Technical Manual
Page 49
Validity of the Scoring Structure via Confirmatory Factor Analyses (CFA)
In order to assess the validity of the scoring structure, i.e., Speaking and Listening as one score, and Reading and Writing as the other, a confirmatory factor analysis was undertaken with the 2005 full population data as well as the 2006 full population data to compare the two-factor modality combinations with the unidimensional model (i.e., the total test providing a single score). The 2005 NYSESLAT scoring dimensionality tests produced results that substantiate the use of the two-factor model in reporting IRT scores. With the exception of the 7–8 and 9–12 grade spans, the two-factor model provided a similar fit of the model to the data as the one-factor unidimensional model as measured by global indices of fit. The unidimensional scoring model for the 7–8 and 9–12 grade spans, however, did not outweigh the use of the two-factor model in terms of model-fit and, as such, there was no clear preference of one model over the other for these two grade spans. Overall, there seemed to be a decrease in the precision of model-fit for the two-factor model regarding the unidimensional model as one progressed from lower grade spans to the higher ones.
Similar to the 2005 data, the 2006 data also produced results that substantiate the use of the two-factor model in reporting IRT scores. However, the 7–8 grade spans behaved in much the same way as the 9–12 grade span, i.e., the unidimensional scoring model for the 7–8 and the 9–12 grade span did not outweigh the use of the two-factor model in terms of model-fit and, as such, there was no clear preference of one model over the other for these grade spans. This pattern, however, was justifiable by content experts as a distinct demarcation of modalities for younger students for whom a marked differentiation did exist between their Speaking and Listening ability as compared to their Reading and Writing ability. This differentiation, according to content experts, blurs for students in the higher grades. (Appendix E.1 and E.2 provide 2005 and the 2006 CFA analyses in their entirety.)
6.3 External Structure (Relationship with Regents Comprehensive English Examination)
In order to ascertain the external structure of the NYSESLAT vis-à-vis an external criterion, data on grades 9–12 English Language Learners (ELLs) who took the NYSESLAT in May 2006 and the New York State Regents Examination in Comprehensive English (NYRECE) and/or the New York State Regents Examination in Mathematics A (NYREMA) in June 2006, were analyzed. In New York State, all high school students, including ELLs, are required to take the NYRECE in grade 11 and the NYREMA in grade 10 as high school graduation requirements. The purpose of the NYSESLAT is to measure annual student progress in achieving English language proficiency in order to ultimately exit an ESL or bilingual program. It is also expected that ELLs who score proficient on the NYSESLAT will be able to function successfully in mainstream education programs, and to have the same chance as their English proficient counterparts to pass the required State examinations. It is, therefore, hypothesized that a relationship exists between the NYSESLAT and the NYRECE, i.e., those who perform well on the NYSESLAT are generally expected to perform well on the NYRECE. On the other hand, it is assumed that there would be a negligible or a very low relationship between those who are proficient on the NYSESLAT and those who pass the NYREMA, primarily because the unidimensional construction of the NYREMA precludes proficiency in English as a requirement for proficiency in mathematics.

2006 NYSESLAT Technical Manual
Page 50
The correlation analyses provide evidence that the external structure check of the NYSESLAT with respect to the New York State Regents Examination in Comprehensive English ascertains a positive relationship between the two examinations (see Table 6.5 below, and Appendix L: External Structure Check, for the complete report on the analysis of data). This indicates that higher scores on the NYSESLAT, especially the RW modality combination, are associated with higher scores on the NYRECE. As expected, the relationship between the NYSESLAT and NYREMA was much weaker than that between NYSESLAT and NYRECE. Table 6.5 Correlation Matrix of the NYSESLAT Modality Combinations (L+S and R+W), the NYRECE, and NYREMA for the 9–12 Grade Span
NYSESLAT REGENT
Examination
NYSESLAT Modality Combinations or
Regent Components
L+S Correlation
(n-count)
R+W Correlation
(n-count)
NYRECE Correlation
(n-count)
NYREMA Correlation
(n-count)
LS 1.00 (12742)
NYSESLAT R+W 0.65
(12742) 1.00
(12742)
NYRECE 0.40 (6787)
0.57 (6787)
1.00 (6787)
REGENT NYREMA 0.17
(8113) 0.33
(8113) 0.36
(2158) 1.00
(8113) In absolute terms, the analysis could be seen as an indication of a positive relationship in the examination of validity since over three-quarters of those who scored at the proficient level on the LS and RW modality combinations of the NYSESLAT passed the NYRECE at the 55 raw score cut and two-thirds pass the NYRECE at the 65 cut. Furthermore, because of the higher correlation, it seems that scoring proficient on the RW modality combination is a better predictor for passing the NYRECE than proficient score on the LS component. Detail analyses of the external structure check can be found in Appendix K.

2006 NYSESLAT Technical Manual
Page 51
PART 7: CALIBRATION, EQUATING, AND SCALING
This part introduces the IRT models and the processes that were used to calibrate, equate, and scale the NYSESLAT using these IRT models.
The Rasch model (Rasch, 1960) for dichotomous items and the Partial Credit Model (PCM) (Masters, 1982) for polytomous items were used to calibrate, equate, and scale the NYSESLAT. These measurement models are regularly used to construct test forms, for scaling and equating, and to develop and maintain large item banks. All item and test analyses, including item-fit analysis, scaling, equating, diagnosis, and performance prediction were accomplished within this framework. The statistical software used to calibrate and scale the NYSESLAT was Winsteps Version 3.29 (Linacre & Wright, 2000).
7.1 The Rasch and Partial Credit Models
Description of the Rasch Model
Mathematically, the Rasch model (Rasch, 1980), also known as the one-parameter logistic (1-PL) model can be formulated as:
}{ )(exp11)/1(
iijUP
δθθ
−−+== (10)
Where
δi is item difficulty, and θ is examinee ability.
The most basic expression of the Rasch model, however, is in the Item Characteristic Curve (ICC). It shows the probability of a correct response to an item as a function of the ability level. The probability of a correct response is bounded by 1 (correct response) and 0 (incorrect response). The ability scale is, in theory, unbounded. In practice, the ability scale typically ranges from -4 to +4 logits for heterogeneous ability groups where the logit (log-odds unit) is nothing more than a unit of interval measurement which is well-defined within the context of a single homogeneous test in the same manner that the height of a person is measured in feet or meters.
As an example, consider Figure 7.1, which depicts an item that falls at approximately 0.85 on the ability (horizontal) scale. When a person answers an item at the same level as their ability, then that person has a probability of roughly 50% of answering the item correctly. Another way of expressing Figure 7.1 is that if we have a group of 100 people, all of whom have an ability of 0.85, we would expect about 50% of them to answer the item correctly. A person whose ability was above 0.85 would have a higher probability of getting the item right, while a person whose ability is below 0.85 would have a lower probability of getting the item right. This is the basic formulation of Rasch measurement for test items having only two possible categories (i.e., wrong or correct).
Figure 7.2 extends this formulation to show the probabilities of obtaining a wrong answer or a correct answer. The curve on the left (j=0) shows the probability of getting a score of “0” while the curve on the right (j=1) shows the probability of getting a score of “1.” The point at which the two curves cross indicates the transition point on the ability scale where the most likely score on the item changes from a “0” to a “1.” Here, the probability of answering the item correctly is 50%.

2006 NYSESLAT Technical Manual
Page 52
Figure 7.1: Sample Item Characteristic Curve
Figure 7.2: Category Response Curves for a One-step Item
0.00
0.25
0.50
0.75
1.00
-4.00 -3.00 -2.00 -1.00 0.00 1.00 2.00 3.00 4.00
Ability
Prob
abili
ty o
f Cat
egor
y j R
espo
nse
(j =
0, 1
) j = 0 j = 1
0.00
0.25
0.50
0.75
1.00
-4.00 -3.00 -2.00 -1.00 0.00 1.00 2.00 3.00 4.00
Ability
Prob
abili
ty o
f a C
orre
ct R
espo
nse Probability
2006 NYSESLAT Technical Manual
Page 53
Description of the Partial Credit Models (PCM)
The PCM is a direct extension of the dichotomous, one-parameter IRT model developed by Rasch in the 1950s (Rasch, 1980). For an item/task involving mi score categories, one general expression for the probability of scoring x on item/task i is given by
( ) ( )∑ ∑ ∑= = =
⎥⎦
⎤⎢⎣
⎡−−=
x
j
m
k
k
jijijxi
i
DDP0 0 0
exp/exp θθ (11)
where x = 0, 1, ..., mi, and by definition,
( )∑=
=−0
00
jijDθ
.
The above equation gives the probability of scoring x on the i-th test item as a function of ability (θ ) and the difficulty of the mi steps of the task (Masters, 1982).
According to this model, the probability of an examinee scoring in a particular category (step) is the sum of the logit (log-odds) differences between θ and Dij of all the completed steps, divided by the sum of the differences of all the steps of a task. Thissen and Steinberg (1983) refer to this model as a divide-by-total model. The parameters estimated by this model are (a) an ability estimate for each person (or ability estimate at each raw score level) and (b) mi threshold (difficulty) estimates for each task with mi + 1 score categories.
The key step in the formulation and the point at which the Rasch dichotomous model merges with the PCM, requires us to assume an additional score category. Suppose that, rather than scoring items as completely wrong or completely correct, we add a category representing answers that, though not totally correct, are still clearly not totally incorrect. These relationships are shown in Figure 7.3.
The left-most curve (j=0) in Figure 7.3 represents the probability for all examinees getting a score of “0” (completely incorrect) on the item, given their ability. Those of very low ability (e.g., below -2) are very likely to be in this category and, in fact, are more likely to be in this category than the other two. Those receiving a “1” (partial credit) tend to fall in the middle range of abilities (the middle curve, j=1). The final, right-most curve (j=2) represents the probability for those receiving scores of “2” (completely correct). Anyone has a chance of getting full credit for the item, however, we may not expect everyone to receive full credit based on our data.

2006 NYSESLAT Technical Manual
Page 54
Figure 7.3: Category Response Curves for a Two-step Item
Although the actual computations are quite complex, the points at which lines cross each other have a similar interpretation as for the dichotomous case. Consider the point at which the j=0 line crosses the j=1 line, indicated by the left arrow. For abilities to the left of (or less than) this point, the probability is greatest for a “0” response. To the right of (or above) this point, and up to the point at which the j=1 and j=2 lines cross (marked by the right arrow), the most likely response is a “1.” For abilities to the right of this point, the most likely score is a “2.”
Scaling multiple-choice items together with polytomous items, whether they have three or more response categories, is a straightforward process of applying the appropriate measurement model, i.e., the Rasch model for the dichotomously scored items and the PCM for the polytomously scored items. The quality of the scaling then can be assessed in terms of known procedures that are applicable to the two measurement models discussed above.
One important property of these models is their ability to separate the estimation of item/task parameters from the person parameters. The total score given by the sum of the categories in which a person responds is a sufficient statistic for estimating person ability (i.e., no additional information need be estimated). The total number of scores across examinees in a particular category is a sufficient statistic for estimating the step difficulty for that category. Thus with the Rasch and the PCM, the same total score will yield the same ability estimate for different examinees.
0.00
0.25
0.50
0.75
1.00
-4.00 -3.00 -2.00 -1.00 0.00 1.00 2.00 3.00 4.00
Ability
Prob
ability
of
Cate
gory
j R
espo
nse
(j =
0,
1, 2
)
j = 0 j = 1 j = 2
Threshold betweenj = 0 and j = 1
Threshold betweenj = 1 and j = 2

2006 NYSESLAT Technical Manual
Page 55
7.2 Equating of the NYSESLAT
Equating Method and Rationale The 2005 NYSESLAT vertical scale was used to establish the 2006 NYSESLAT scale. The 2005 NYSESLAT administration was selected from the SELP examinations and the SELP scale has a well-established record as being a stable scale. The common item, non-equivalent group design was used for 2006 equating because it is one of the most practical of the various designs used for equating. This design does not, for example, require large sample sizes necessary for the random groups design or a concern towards student fatigue by using the single group design (Kolen and Brennan, 1995), which makes the common items non-equivalent group design a very popular choice for large-scale assessments. The common-item, non-equivalent group design necessitates the inclusion of items that are common to both administrations that would allow the linking of the tests and/or forms to be placed on the same scale. There are several methods used for this item response theory (IRT) scale transformation. Kolen and Brennan (1995) provide several IRT scale transformation methods that include the Mean/Mean, Mean/Sigma, Haebara, and the Stocking-Lord methods. For the Rasch model, the equating constant of scale transformation is often used by researchers and practitioners alike. A fairly common practice among psychometricians is to use a method called “the anchor or the fixed parameter method.” In this method, the common items whose calibrations are known (either through a previous-year calibration or a separate calibration of the form) are anchored or fixed to their known estimates during calibration of the other forms that are to be put on the scale of the first form. In treating these common item parameters as known, they are not estimated and the remaining item parameters (for the uncommon items) are forced onto the same scale as the anchored (fixed) items (Hanson & Béguin, 1999; Linacre, 2003; Taherbhai & Seo, 2007). For the NYSESLAT, the fixed method of scale transformation was used by Harcourt. This transformation was achieved with the Winsteps program that calibrated the items with the use of the two IRT models discussed above. As Kolen and Brennan (1995) state, “After the item parameters are on the same scale, IRT true score equating can be used to relate number-correct scores on Form X and Form Y. In this process, the true score associated on one form associated with a given θ is considered to be equivalent to the true score on another form associated with that θ (p. 175).” Furthermore, observed scores can easily be substituted for true scores because doing so has been justified in IRT by the observance that the true score conversions are similar to observed score conversions (Lord & Wingersky, 1984). Harcourt has used true score equating for the NYSESLAT by the application of the Newton-Raphson method for finding the roots of the non-linear function associated in the true score equating process. This procedure allows observed scores to be matched to their respective theta values, which in turn are converted to more acceptable scale score values (see scale score transformation to the SELP scale equations, p.56). These thetas for the different forms/tests are on the same scale as established by the scale transformation method discussed above. By applying the true score equating process, Harcourt has successfully equated the 2006 NYSESLAT to the 2005 NYSESLAT while maintaining the established 2005 common vertical scale, i.e., the SELP scale.
In establishing the vertical scale, the data file used for the calibration and equating of the NYSESLAT had 191,642 cases, which was 97% of the final operational research file (total N=197,457) that Harcourt received from NY. The calibration/equating data was representative of the population covering New York City, and three of the Big Four Cities (Buffalo, Syracuse, Rochester). Yonkers, whose data arrived too late, was not included in the equating sample.

2006 NYSESLAT Technical Manual
Page 56
Thus by fixing the known parameters of the common set of items between the two years, the items on the 2006 operational form were calibrated, and the newly administered items were then located on the 2005 scale. Once the scale locations of the 2006 NYSESLAT were known, IRT true score equating was used to relate the raw scores on the 2006 NYSESLAT to the 2005 scale. In this process, the true score on the NYSESLAT with a given level of examinee ability was considered to be equivalent true score on the 2005 associated with that level of examinee ability (Kolen and Brennan, 2004, p. 178).
Common Item Linking Design
As explained in the previous section, the common item design is contingent upon the use of items that are common on two administrations, i.e., between the examination already placed on the established scale and the one that is to be placed on that scale. Alternatively, one can use items on the current examination that have already been placed on an established scale. These items then act as linking items to place the new form on the existing scale. For the NYSESLAT, Harcourt used the pre-existing SELP vertical scale to create the NYSESLAT vertical scale1. For the 2006 administration, the SELP items, which were the linking items on the 2006 NYSESLAT, were, as explained earlier, fixed to the parameter values from the pre-existing vertical scale. That is, the SELP items were used as a common item link or anchor between the NYSESLAT and the SELP item bank. Any remaining non-SELP items on the NYSESLAT were calibrated together with the SELP items using the Rasch and Partial Credit models. Fixing the values of the SELP items prior to calibration resulted in the item difficulty and step parameters of all the items being placed on the same ability metric. The separate scales, one for Speaking/Listening and one for Reading/Writing, were then obtained by taking the item parameters for those separate combinations and using them to create raw score-to-scale score tables. Finally, when these calibrations and scales were completed, the items field-tested for the 2006 administration were calibrated to the pre-existing vertical scale.
A more detailed outline of the procedure follows:
• The calibration file was created from item-level data files using a sample that included NYC, and the three of the Big Four Cities: Buffalo, Syracuse, and Rochester (Yonkers excluded).
• The Winsteps software program was used to conduct the item calibration, and fixing the item parameters for the anchor set items to the SELP item bank values.
• The results of this calibration were used as the operational item parameters used to create the preliminary scales for the NYSESLAT spring 2006 administration. Item estimates of the common items from the 2005 administration were used as anchors to place the 2006 scale to the established vertical scale. The final reporting scale was derived from the vertical scale using a linear transformation.
Footnote
1For additional details of how the original Stanford ELP vertical scale was established, please see the Stanford English Language Proficiency Test Technical Manual, 2005. Harcourt Assessment, Inc.

2006 NYSESLAT Technical Manual
Page 57
Linking Item Evaluation There are some general guidelines (2006 NYSESLAT Form Construction Specification) in the use of linking items. These guidelines are as follows:
• Use an adequate number of linking items;
• Linking items selected for linking the two forms need to represent a miniature version of the test in terms of content;
• Linking items need to appear in the same location as test that we are equating to;
• Linking items are expected to have strong statistical properties (e.g., pbis>0.3) and span the range of difficulty including easy, medium, and difficult items.
Stability of Linking Items The stability of the common item parameters was examined prior to their use as linking items in the equating. There are various methods of evaluating linking item stability. Most of them are based on how much of a difference exists between the parameters on the established scale and those on the transformed scale. Since the Winsteps program provides “Displacement” values for the common items that are anchored, a check of these values can be used to exclude items from being linking items. Items that exceed the displacement value of say, 0.30 can be excluded as linking items and the process is repeated until all displacement values are less than or equal to 0.30 or some other criterion for retention is reached (e.g., no more than 20% exclusion rule). For the NYSESLAT the common items did not meet the minimum of 20 linking item criteria for each modality combination. As such, we used a slightly higher displacement value of 0.50 displacement value (as is done by many large-scale assessments) for an item to be considered as an outlier. The higher exclusion criteria allowed a minimum of items to be excluded, thereby preserving the overall number of linking items to be around the 20% of the total items. See Table 7.1 for the number of items excluded for each modality combination by grade span.
Items that were excluded from being linking items had their parameters estimated and the new estimate became the adjusted item parameter in the item bank for future use. There are no true or correct procedures that can be applied in excluding common items as linking items. A balance has to be determined between the minimum items desired in the linking pool and the number of common items that are excluded from being linking items. However, as a general rule, since the number of linking items used in equating is an important criterion in the stability of the linking procedure, many psychometricians recommend no more than 20% of the common items from exclusion as linking items, e.g., the PACT Assessment Huynh (2000).
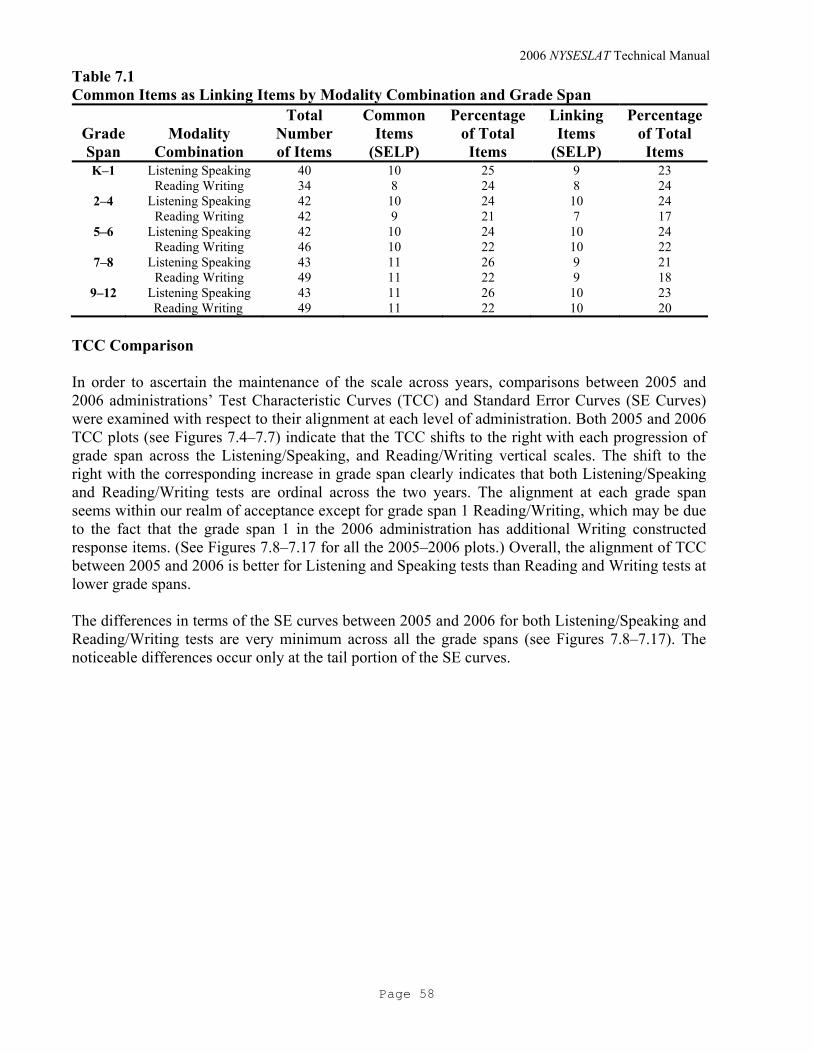
2006 NYSESLAT Technical Manual
Page 58
Table 7.1 Common Items as Linking Items by Modality Combination and Grade Span
Grade Span
Modality Combination
Total Number of Items
Common Items
(SELP)
Percentage of Total Items
Linking Items
(SELP)
Percentage of Total Items
K–1 Listening Speaking 40 10 25 9 23 Reading Writing 34 8 24 8 24
2–4 Listening Speaking 42 10 24 10 24 Reading Writing 42 9 21 7 17
5–6 Listening Speaking 42 10 24 10 24 Reading Writing 46 10 22 10 22
7–8 Listening Speaking 43 11 26 9 21 Reading Writing 49 11 22 9 18
9–12 Listening Speaking 43 11 26 10 23 Reading Writing 49 11 22 10 20
TCC Comparison In order to ascertain the maintenance of the scale across years, comparisons between 2005 and 2006 administrations’ Test Characteristic Curves (TCC) and Standard Error Curves (SE Curves) were examined with respect to their alignment at each level of administration. Both 2005 and 2006 TCC plots (see Figures 7.4–7.7) indicate that the TCC shifts to the right with each progression of grade span across the Listening/Speaking, and Reading/Writing vertical scales. The shift to the right with the corresponding increase in grade span clearly indicates that both Listening/Speaking and Reading/Writing tests are ordinal across the two years. The alignment at each grade span seems within our realm of acceptance except for grade span 1 Reading/Writing, which may be due to the fact that the grade span 1 in the 2006 administration has additional Writing constructed response items. (See Figures 7.8–7.17 for all the 2005–2006 plots.) Overall, the alignment of TCC between 2005 and 2006 is better for Listening and Speaking tests than Reading and Writing tests at lower grade spans.
The differences in terms of the SE curves between 2005 and 2006 for both Listening/Speaking and Reading/Writing tests are very minimum across all the grade spans (see Figures 7.8–7.17). The noticeable differences occur only at the tail portion of the SE curves.
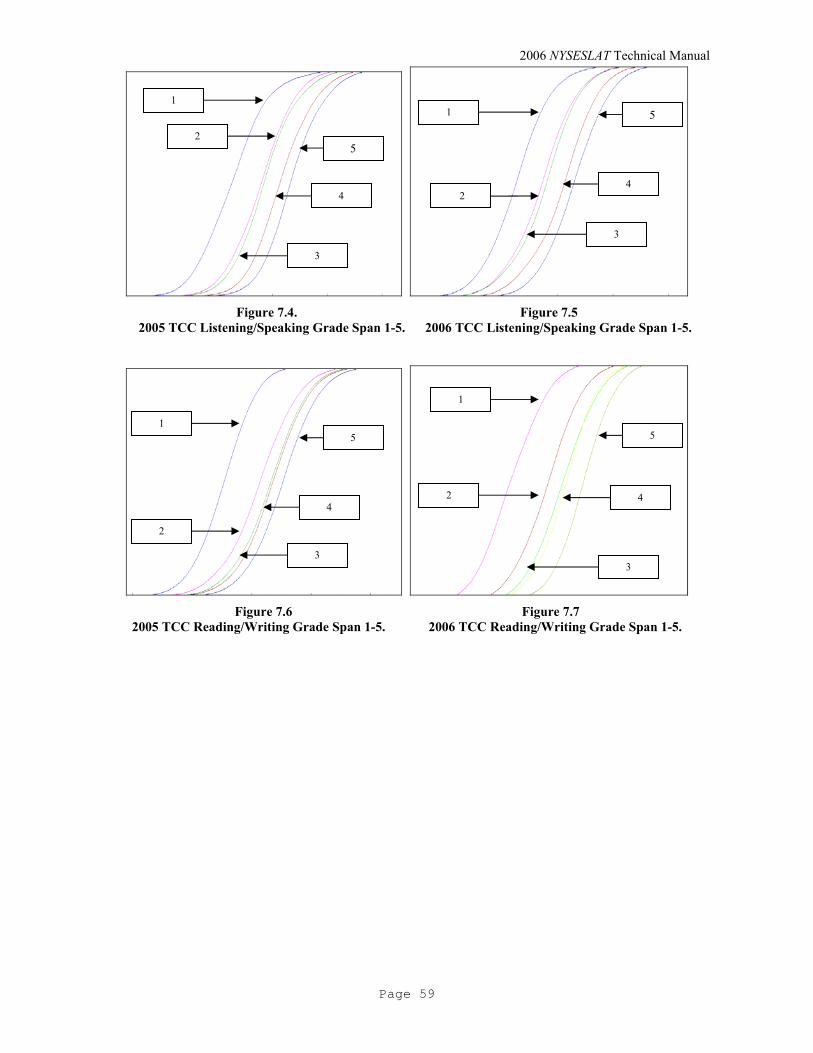
2006 NYSESLAT Technical Manual
Page 59
Figure 7.4. Figure 7.5
2005 TCC Listening/Speaking Grade Span 1-5. 2006 TCC Listening/Speaking Grade Span 1-5.
Figure 7.6 Figure 7.7
2005 TCC Reading/Writing Grade Span 1-5. 2006 TCC Reading/Writing Grade Span 1-5.
1
2
3
4
5
1
2
3
4
5
1
2
3
4
5
1
2
3
4
5

60
Figure 7.8 Figure 7.9
Grade Span 1 LI/SP 2005-2006 Grade Span 2 2005-2006 LI/SP
Figure 7.10 Figure 7.11
Grade Span 3 LI/SP 2005-2006 Grade Span 4 LI/SP 2005-2006
2006
2005
2005
2006
2005
2006
2005
2006

2006 NYSESLAT Technical Manual
Page 61
Figure 7.12 Figure 7.13
Grade Span 5 LI/SP 2005–2006 Grade Span 1 RD/WR 2005–2006
Figure 7.14 Figure 7.15
Grade Span 2 RD/WR 2005–2006 Grade Span 3, RD/WR 2005–2006
2005
2006
2005
2006
20052006 2006
2005
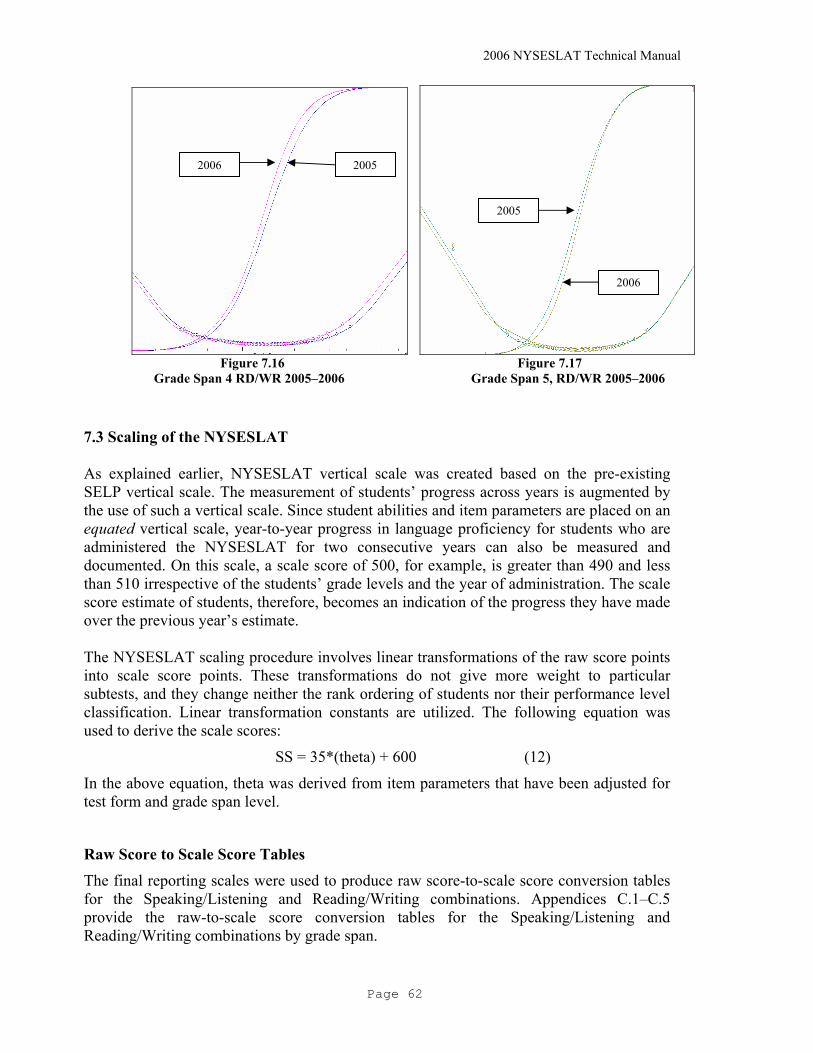
2006 NYSESLAT Technical Manual
Page 62
Figure 7.16 Figure 7.17
Grade Span 4 RD/WR 2005–2006 Grade Span 5, RD/WR 2005–2006
7.3 Scaling of the NYSESLAT As explained earlier, NYSESLAT vertical scale was created based on the pre-existing SELP vertical scale. The measurement of students’ progress across years is augmented by the use of such a vertical scale. Since student abilities and item parameters are placed on an equated vertical scale, year-to-year progress in language proficiency for students who are administered the NYSESLAT for two consecutive years can also be measured and documented. On this scale, a scale score of 500, for example, is greater than 490 and less than 510 irrespective of the students’ grade levels and the year of administration. The scale score estimate of students, therefore, becomes an indication of the progress they have made over the previous year’s estimate. The NYSESLAT scaling procedure involves linear transformations of the raw score points into scale score points. These transformations do not give more weight to particular subtests, and they change neither the rank ordering of students nor their performance level classification. Linear transformation constants are utilized. The following equation was used to derive the scale scores:
SS = 35*(theta) + 600 (12)
In the above equation, theta was derived from item parameters that have been adjusted for test form and grade span level.
Raw Score to Scale Score Tables
The final reporting scales were used to produce raw score-to-scale score conversion tables for the Speaking/Listening and Reading/Writing combinations. Appendices C.1–C.5 provide the raw-to-scale score conversion tables for the Speaking/Listening and Reading/Writing combinations by grade span.
20052006
2005
2006

2006 NYSESLAT Technical Manual
Page 63
PART 8: IRT STATISTICS
8.1 Model and Rationale for Use
In addition to reporting raw score summary statistics and item level statistics using the classical test theory (CTT), the items on the NYSESLAT test were also analyzed within the framework of Item Response Theory (IRT). The Rasch model (Rasch, 1960) for dichotomous items and the Partial Credit Model (Masters, 1982) for polytomous items were used for developing, scoring, and reporting the NYSESLAT assessment. These models were recommended for several reasons. First, the NYSESLAT vertical scale was created based on the pre-existing SELP vertical scale that was developed using the Rasch model. By using SELP items with known Rasch item difficulties, Harcourt was able to create the NYSESLAT vertical scale in a timely fashion. Second, the sample size requirements for calibration, scaling, and equating under the Rasch and Partial Credit models are significantly smaller than for other IRT models. For example, the Rasch model requires on the order of 400 examinees per form for equating versus approximately 1,500 examinees per form under the 3PL IRT model (Kolen and Brennan, 2004, p. 288). Finally, for the requirements of the NYSESLAT program, the Rasch model has one characteristic that makes it very useful. There exists a one-to-one relationship between raw scores and scale scores. That is, a student who answers a certain number of items correctly will receive the same scale score as a second student with the same raw score, regardless of which particular items within the test form were answered correctly. These reasons lead Harcourt to recommend that for the NYSESLAT the Rasch model be adopted as the IRT methodology.
8.2 Evidence of Model Fit
Fit statistics are used for evaluating the goodness-of-fit of a model to the data. Fit statistics are calculated by comparing the observed and expected trace lines obtained for an item after parameter estimates are obtained using a particular model. Winsteps provides two kinds of fit statistics called mean-squares that show the size of the randomness or amount of distortion of the measurement system. The OUTFIT and the INFIT statistics are used in order to ascertain the suitability of the data for constructing variables and making measures with the Rasch model. These fit statistics are mean square standardized residuals for item by person responses averaged over persons and partitioned between ability groups (OUTFIT) and within ability groups (INFIT). When the observed item characteristic curve (ICC) departs from the expected ICC from a reference value of 1, there is an expectation of high-ability students failing on an easy item or low-ability students succeeding on a difficult one. The OUTFIT mean square evaluates the agreement between the observed ICC and the best-fitting Rasch model curve over the ability subgroups. It is a standardized outlier-sensitive mean square fit statistic, more sensitive to unexpected behavior by persons on items far from the person’s ability

2006 NYSESLAT Technical Manual
Page 64
level. The INFIT, on the other hand, is a within-group mean square, which summarizes the degree of misfit remaining within ability groups after the between-group misfit has been removed from the total. The INFIT, therefore, is a standardized information-weighted mean square statistic, which is more sensitive to unexpected responses to items near the person’s ability level.
OUTFIT mean-squares are influenced by outliers and are usually easy to diagnose and remedy. INFIT mean-squares, on the other hand, are influenced by response patterns and are harder to diagnose and remedy. In general, mean-squares near 1.0 indicate little distortion of the measurement system, while values less than 1.0 indicate that observations are too predictable (redundancy, model overfit). Values greater than 1.0 indicate unpredictability (unmodeled noise, model underfit). Generally speaking, when item fit indices are lower than 0.6, they do not discriminate well and show greater than expected degree of consistency. Similarly, a fit value higher than 1.5 indicates inconsistency in examinee scores on the item (e.g., some unexpectedly high scores for low-ability candidates and low scores for high-ability candidates). To an extent, no data fits the IRT model perfectly. Items that degraded or distorted the measurement system were also not included as linking items and were excluded from the linking pool. For NYSESLAT, no items that had an INFIT/OUTFIT value greater than or equal to 2.0 were included as linking items. The percentage of items that were flagged for INFIT and OUTFIT varied depending on grade spans and subtests. In general, around 0–2% of items were flagged for INFIT. However, the percent of misfit was greater for OUTFIT across grade spans. The OUTFIT and the INFIT statistics are presented in the item statistics tables in Appendices D.1–D.5.
8.3 Rasch Information
Table 8.1 presents the grade span, the modality, the number of items in each modality, the maximum number of points attainable for each modality, and the average Rasch difficulty for each modality. Appendix G includes item information at different cut points at each grade level.

2006 NYSESLAT Technical Manual
Page 65
Table 8.1
Average Rasch Difficulty by Grade Span and Modality Grade Span Test
Number of Items Max Points Average Rasch Difficulty
K–1 Listening 24 24 –2.43 Speaking 16 34 –2.00 Reading 15 15 –1.66 Writing 19 28 –2.03 Total 74 101 –2.08
2–4 Listening 26 26 –0.29 Speaking 16 34 –1.13 Reading 26 26 –0.14 Writing 16 22 –0.24 Total 84 108 –0.40
5–6 Listening 26 26 –0.11 Speaking 16 34 –0.99 Reading 26 26 0.81 Writing 20 26 0.41 Total 88 112 0.12
7–8 Listening 27 27 0.85 Speaking 16 34 –0.08 Reading 29 29 0.89 Writing 20 26 0.49 Total 92 116 0.62
9–12 Listening 27 27 1.39 Speaking 16 34 0.57 Reading 29 29 1.59 Writing 20 26 1.72 Total 92 116 1.38
Note: The statistics above are based on the equating sample (invalid cases were removed after cleaning procedures.) Appendices D.1–D.5 contain the results of the operational items for the NYSESLAT which includes the Rasch item parameters. The following IRT item parameters are presented for each item grouped by Listening/Speaking and Reading/Writing combinations:
• Number of students • Rasch difficulty value • Standard error (SE) of Rasch difficulty • MNSQ Infit: Standardized information-weighted mean square statistic, which is
sensitive to unexpected behavior affecting responses to items near the person’s ability level
• MNSQ Outfit: Standardized outlier-sensitive mean square fit statistic that is sensitive to unexpected behavior by persons on items far from the person’s ability level

2006 NYSESLAT Technical Manual
Page 66
PART 9: STANDARD SETTING
9.1 Introduction
As the contractor for the New York State English as a Second Language Achievement Test (NYSESLAT), Harcourt organized a performance standard-setting meeting. The standard-setting sessions were conducted in Albany, New York, from March 28 to April 1, 2005. The purpose of this meeting was to provide preliminary recommendations on performance cut scores for the NYSESLAT. For each group, there was one psychometrics staff member from Harcourt to facilitate the technical part of the standard setting. In addition, a content specialist from Harcourt and a NYSED official were present to provide support during the standard-setting sessions.
9.2 Standard-Setting Model
Item mapping is a well-established method available for establishing performance standards. The item-mapping procedure is capable of incorporating both multiple-choice and constructed-response items into the same process (Mitzel, H.C., Lewis, D.M., & Green, D.R., 2001). It has several other favorable characteristics, including:
• Simplifying the judgment task by reducing the cognitive load required by panelists • Connecting the judgment task of setting cut scores with the measurement model • Connecting content with performance level descriptors
The item-mapping procedure orders items for each test into a booklet according to the difficulty of the items, which is determined by IRT scaling techniques. Easy items are placed in the beginning of the booklet, and subsequent items become increasingly more difficult to the end of the booklet. Passages, rubrics, and sample student responses are placed in the booklet for reference purposes. Panelists are also provided with test blueprints and various other materials, including performance level descriptors, scoring rubrics, test booklets, and anchor papers.
9.3 Committees of Panelists
Five standard-setting committees were established to set the cut scores for the five grade spans of the NYSESLAT. As indicated in Table 9.1 below, the first group recommended standards on grades K and 1; the second group recommended standards on grades 2, 3, and 4; the third group recommended standards on grades 5 and 6, the fourth group recommended standards on grades 7 and 8; and the fifth group recommended standards on grades 9, 10, 11, and 12. The panel members were New York State certified ESL, English language arts, bilingual education, and bilingual special education teachers who were familiar with the content standards. The NYSESLAT panelists were recruited by NYSED to participate in the standard-setting meeting. The panelists possess knowledge of working with students with limited English proficiency and also represent all regions of the state of New York. It was also recommended to have other educational stakeholders as well, such as administrators,
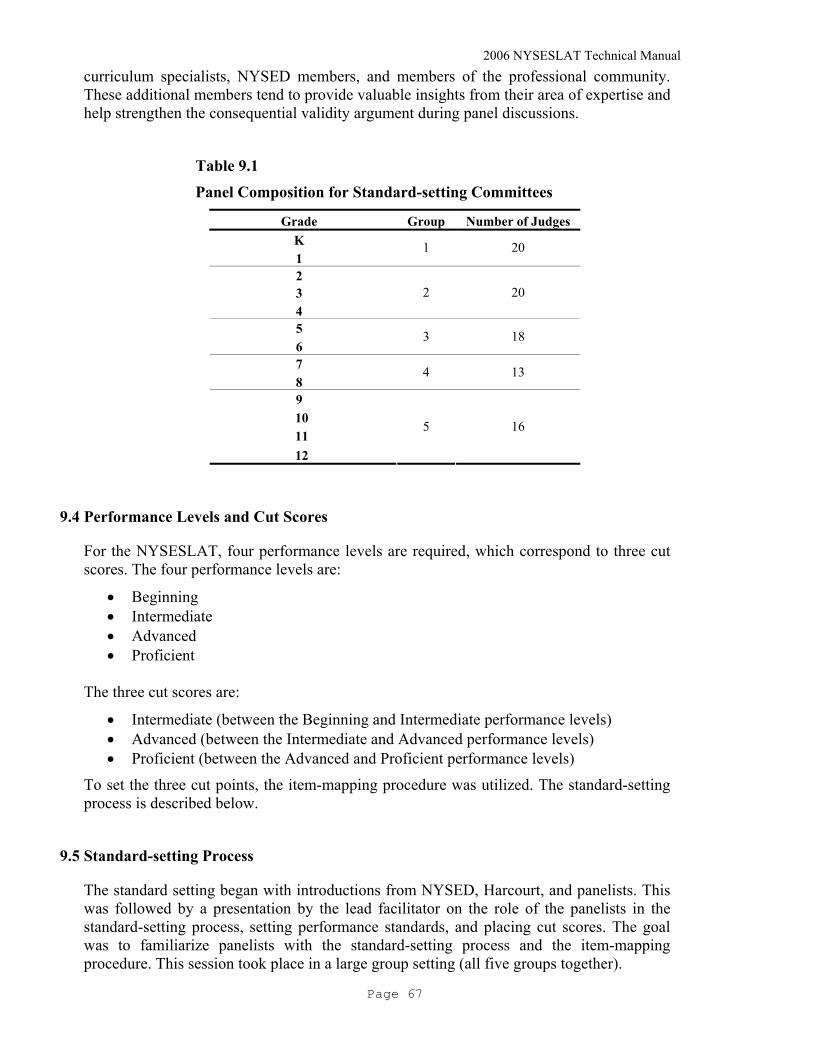
2006 NYSESLAT Technical Manual
Page 67
curriculum specialists, NYSED members, and members of the professional community. These additional members tend to provide valuable insights from their area of expertise and help strengthen the consequential validity argument during panel discussions.
Table 9.1
Panel Composition for Standard-setting Committees
Grade Group Number of Judges K 1
1 20
2 3 4
2 20
5 6
3 18
7 8
4 13
9 10 11 12
5 16
9.4 Performance Levels and Cut Scores
For the NYSESLAT, four performance levels are required, which correspond to three cut scores. The four performance levels are:
• Beginning • Intermediate • Advanced • Proficient
The three cut scores are:
• Intermediate (between the Beginning and Intermediate performance levels) • Advanced (between the Intermediate and Advanced performance levels) • Proficient (between the Advanced and Proficient performance levels)
To set the three cut points, the item-mapping procedure was utilized. The standard-setting process is described below.
9.5 Standard-setting Process
The standard setting began with introductions from NYSED, Harcourt, and panelists. This was followed by a presentation by the lead facilitator on the role of the panelists in the standard-setting process, setting performance standards, and placing cut scores. The goal was to familiarize panelists with the standard-setting process and the item-mapping procedure. This session took place in a large group setting (all five groups together).
2006 NYSESLAT Technical Manual
Page 68
After the orientation, the panelists were separated into specific breakout rooms according to their group assignments. Each group/room was led by a facilitator who was an expert in the standard-setting methodology. Assessment specialists rotated from group to group in order to provide content support. In addition, the panel members were further divided into three smaller table groups within their grade spans, each composed of five to seven members. These small groups worked independently but had the opportunity to collaborate with the other table groups in their grade span during the standard-setting process. The following sequences of tasks were followed.
Review of the Assessment The first task was to review the assessment blueprint. This was done in order for the panelists to gain an understanding of what the assessment was intended to measure. Discussions about the assessment content, the use of different item types, and number of questions were conducted. The panel members further defined the general performance level descriptors into specific descriptors to help the panel members come to a shared understanding about what it meant to be performing at each of the performance levels. The facilitator led this discussion with support from the assessment specialist who floated between the rooms.
Experience the Assessment Next, the panel members had an opportunity to experience the assessment administered at the grade span assigned to them. This was an effective way to demonstrate to the panelists the knowledge and skills that students must possess to obtain a high score. It is assumed that panelists are likely to set more realistic performance standards if they experience the assessment themselves.
Scoring the Assessment After the panelists finished taking the assessment, they were provided with an answer key to grade their test. The panelists scored their own assessments using the scoring rubrics and answer key provided. The scoring process offered an opportunity for the panelist to develop an understanding of the scoring of open-ended responses. They were provided with exemplars of score points. A discussion session followed the scoring of the assessment.
Review of Student Performance Levels Panelists reviewed the previously established definitions of performance levels (Appendices F.3–F.4). Then they discussed the performance levels. The goal was to help panelists clearly distinguish between student performance levels. Panelists’ suggestions were related to the performance standards and content frameworks. The suggestions were retained for reference during the standard-setting process. Panelists reviewed definitions and offered illustrative suggestions for the Beginning, Intermediate, Advanced, and Proficient performance standards. After all the performance levels were reviewed, a discussion section was held. The focus was on the characteristics and interrelationships between and among performance standards.
2006 NYSESLAT Technical Manual
Page 69
Three Rounds of Ratings The actual standard setting proceeded in three rounds. Each round was designed to foster increased consensus among panelists, although reaching consensus was not necessary. Panelists expressed their cut score judgment by placing a marker on the item that a student at that threshold of a performance level should master. One marker was placed for each cut score. There were three cut points. During the Round 1 ratings, each panelist began by setting his/her three cut scores. The data was captured for each panelist. Before the Round 2 ratings, panelists were provided feedback on the Round 1 cut score positions of all panelists and their group medians. The panelists then discussed the Round 1 results. After the discussions, the Round 2 cuts were made, followed by further discussions. At this point, the panelists were provided with information about the percentage of students who would be classified in each of the performance levels, if those cuts were to be implemented. In order to promote consistency across the grade spans, the groups came together to discuss the process and results of their assigned grades between all grade spans. Panelists then got back into their breakout groups and proceeded to make their Round 3 ratings. The median cut scores of the panelists then served as the starting point for the decision-makers on establishing the cut scores for the assessment.
Evaluation
At the end of the final rating, panelists filled out an evaluation form that assessed their beliefs about each component of the standard-setting process and how confident they felt in the overall results (Appendix F.5). After the evaluation the panelists had a debriefing session.
9.6 Agenda
There were three separate agendas for the standard-setting groups:
• Groups 1, 3, and 4 set standards for two grades each and they followed the first agenda in Appendix F.1
• Group 2 set standards for three grades and they followed the second agenda in Appendix F.1
• Group 5 set standards for four grades and they followed the third agenda in Appendix F.1

2006 NYSESLAT Technical Manual
Page 70
9.7 Summary Statistics for the Three Rounds of Ratings
Appendix F.2 provides the summary statistics for the round-by-round results by grade of the three performance level cuts. The statistics include the range, the raw score mean and standard deviation, the standard error of the mean, the median, standard error of the median, and the interquartile range.
9.8 Evaluation Results
Appendix F.5 provides the results of the evaluation of the standard-setting process provided by the panelists.
9.9 Post-Standard-setting Analyses
The median scores from the standard-setting committees were used as the recommended cuts. The cut scores were based on the total NYSESLAT score. After the standard-setting meetings, Harcourt performed several post-standard-setting analyses. The first step was to look up the equivalent scale scores corresponding to the raw score cuts recommended by the committees. Graphs were then plotted using the grades as the independent variable and scale score as the dependent variable. The three cut points were then plotted on the same graph to show that the cuts were monotonically increasing from the lower cuts to the higher cuts. Some technical adjustments were made to the recommended cuts. Any adjustments made were within one standard error of the median. A quadratic equation was then applied to the scaled cut scores across all thirteen grades, K–12. Further analyses were performed to smooth the cuts. This was done in order to ensure that there are no reversals. Next, the proportion of the three cut points in raw score points based on the total test was applied to the Listening/Speaking and Reading/Writing combinations for each of the grades. Impact analysis was conducted on the 2005 operational data. The percentage of students falling into each of the performance levels was calculated for each grade if those cut points were adopted. This information was provided to NYSED to make their final decisions on the cut points for the Listening/Speaking and Reading/Writing combinations.
9.10 Final Performance-Level Cut Points
The final cut points adopted by NYSED for the 2006 administration of the NYSESLAT for the Listening/Speaking and Reading/Writing combinations in raw score points, scale score, and theta metric are presented in Table 9.2 and Table 9.3. There are three cut points which correspond to four performance levels. Any score below the Intermediate cut point is the Beginning performance level.
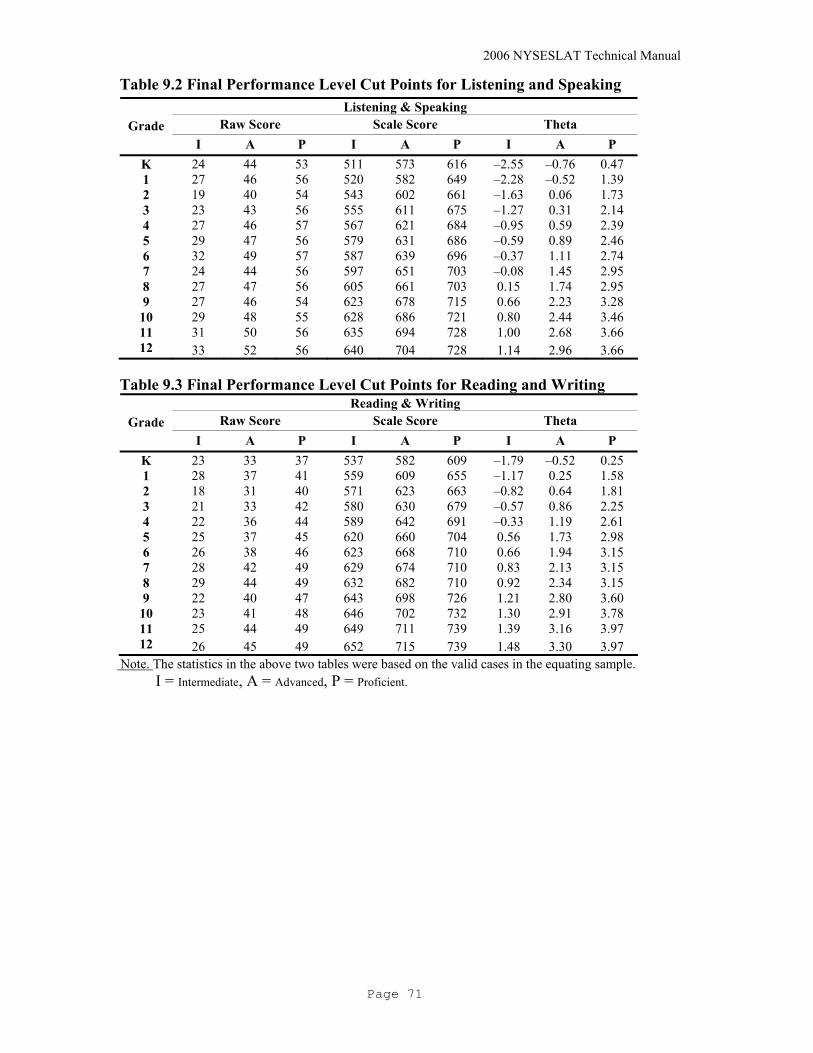
2006 NYSESLAT Technical Manual
Page 71
Table 9.2 Final Performance Level Cut Points for Listening and Speaking Listening & Speaking
Raw Score Scale Score Theta Grade I A P I A P I A P
K 24 44 53 511 573 616 –2.55 –0.76 0.47 1 27 46 56 520 582 649 –2.28 –0.52 1.39 2 19 40 54 543 602 661 –1.63 0.06 1.73 3 23 43 56 555 611 675 –1.27 0.31 2.14 4 27 46 57 567 621 684 –0.95 0.59 2.39 5 29 47 56 579 631 686 –0.59 0.89 2.46 6 32 49 57 587 639 696 –0.37 1.11 2.74 7 24 44 56 597 651 703 –0.08 1.45 2.95 8 27 47 56 605 661 703 0.15 1.74 2.95 9 27 46 54 623 678 715 0.66 2.23 3.28
10 29 48 55 628 686 721 0.80 2.44 3.46 11 31 50 56 635 694 728 1.00 2.68 3.66 12 33 52 56 640 704 728 1.14 2.96 3.66
Table 9.3 Final Performance Level Cut Points for Reading and Writing
Reading & Writing Raw Score Scale Score Theta Grade
I A P I A P I A P K 23 33 37 537 582 609 –1.79 –0.52 0.25 1 28 37 41 559 609 655 –1.17 0.25 1.58 2 18 31 40 571 623 663 –0.82 0.64 1.81 3 21 33 42 580 630 679 –0.57 0.86 2.25 4 22 36 44 589 642 691 –0.33 1.19 2.61 5 25 37 45 620 660 704 0.56 1.73 2.98 6 26 38 46 623 668 710 0.66 1.94 3.15 7 28 42 49 629 674 710 0.83 2.13 3.15 8 29 44 49 632 682 710 0.92 2.34 3.15 9 22 40 47 643 698 726 1.21 2.80 3.60
10 23 41 48 646 702 732 1.30 2.91 3.78 11 25 44 49 649 711 739 1.39 3.16 3.97 12 26 45 49 652 715 739 1.48 3.30 3.97
Note. The statistics in the above two tables were based on the valid cases in the equating sample. I = Intermediate, A = Advanced, P = Proficient.

2006 NYSESLAT Technical Manual
Page 72
PART 10: SUMMARY OF OPERATIONAL TEST RESULTS
This part presents both the raw score and scale score summaries for each of the reporting combinations, Listening/Speaking and Reading/Writing. Table 10.1 presents the raw score summary by grade. Table 10.2 presents the scale score summary by grade. Tables 10.1 and 10.2 include the sample size, the mean, median, interquartile range, and the standard deviation. Table 10.3 presents the percentage of students in each of the proficiency levels by grade. The overall proficiency level is defined by the lower of the two proficiency level designations (e.g., Listening/Speaking level=3, Reading/Writing Level=4, Overall level=3). Table 10.4 presents the percentage of the Exit Rate, including n counts and percentage of English language learners receiving Exit status when they score at the Proficient Level (level 4) on both the LS and RW modality combinations. Additionally, similar types of analyses (See Appendices H, I, and J) were done according to the following subgroups: 1) Gender; 2) Ethnicity (Asian, Black or African American, Hispanic or Latino, Native Native
American Indian or Alaska Native, White); 3) Needs/Resource Group (NYC, Big Four Cities, High Need Urban/Suburban, High Need
Rural, Average Need, Low Need, Charter Schools); 4) Five major language background (Arabic, Bengali, Chinese, English, Spanish), language
missing, and other languages; 5) Number of years with LEP; 6) Students with disability (Autism, Emotional Disturbance, Learning Disability, Mental
Retardation, Deafness, Hearing Impairment, Speech or Language Impairment, Visual Impairment, Orthopedic Impairment, other health impairment, multiple disabilities, Traumatic Brian Injury).
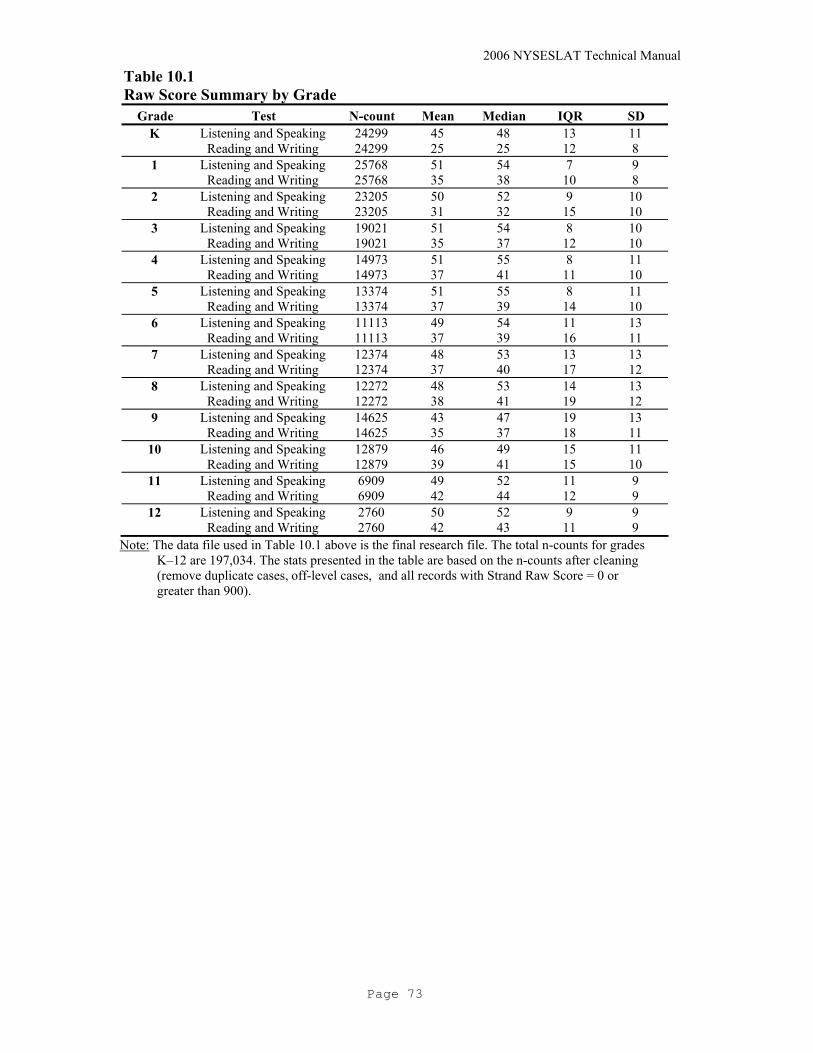
2006 NYSESLAT Technical Manual
Page 73
Table 10.1 Raw Score Summary by Grade
Grade Test N-count Mean Median IQR SD K Listening and Speaking 24299 45 48 13 11 Reading and Writing 24299 25 25 12 8
1 Listening and Speaking 25768 51 54 7 9 Reading and Writing 25768 35 38 10 8
2 Listening and Speaking 23205 50 52 9 10 Reading and Writing 23205 31 32 15 10
3 Listening and Speaking 19021 51 54 8 10 Reading and Writing 19021 35 37 12 10
4 Listening and Speaking 14973 51 55 8 11 Reading and Writing 14973 37 41 11 10
5 Listening and Speaking 13374 51 55 8 11 Reading and Writing 13374 37 39 14 10
6 Listening and Speaking 11113 49 54 11 13 Reading and Writing 11113 37 39 16 11
7 Listening and Speaking 12374 48 53 13 13 Reading and Writing 12374 37 40 17 12
8 Listening and Speaking 12272 48 53 14 13 Reading and Writing 12272 38 41 19 12
9 Listening and Speaking 14625 43 47 19 13 Reading and Writing 14625 35 37 18 11
10 Listening and Speaking 12879 46 49 15 11 Reading and Writing 12879 39 41 15 10
11 Listening and Speaking 6909 49 52 11 9 Reading and Writing 6909 42 44 12 9
12 Listening and Speaking 2760 50 52 9 9 Reading and Writing 2760 42 43 11 9
Note: The data file used in Table 10.1 above is the final research file. The total n-counts for grades K–12 are 197,034. The stats presented in the table are based on the n-counts after cleaning (remove duplicate cases, off-level cases, and all records with Strand Raw Score = 0 or greater than 900).

2006 NYSESLAT Technical Manual
Page 74
Table 10.2 Scale Score Summary by Grade
Grade Test N-count Mean Median IQR SD K Listening and Speaking 24299 588 590 62 51 Reading and Writing 24299 549 547 53 42
1 Listening and Speaking 25768 628 630 63 57 Reading and Writing 25768 617 619 82 60
2 Listening and Speaking 23205 652 652 54 48 Reading and Writing 23205 627 628 64 47
3 Listening and Speaking 19021 663 665 58 51 Reading and Writing 19021 649 650 61 51
4 Listening and Speaking 14973 671 673 69 57 Reading and Writing 14973 666 673 67 57
5 Listening and Speaking 13374 668 677 55 55 Reading and Writing 13374 670 673 63 48
6 Listening and Speaking 11113 664 669 67 61 Reading and Writing 11113 671 673 70 52
7 Listening and Speaking 12374 684 690 66 57 Reading and Writing 12374 665 668 60 47
8 Listening and Speaking 12272 685 690 69 58 Reading and Writing 12272 669 671 72 49
9 Listening and Speaking 14625 680 684 71 50 Reading and Writing 14625 688 688 62 43
10 Listening and Speaking 12879 690 692 63 45 Reading and Writing 12879 702 702 58 42
11 Listening and Speaking 6909 702 706 54 42 Reading and Writing 6909 714 714 54 41
12 Listening and Speaking 2760 704 706 44 40 Reading and Writing 2760 712 710 48 39
Note: Generally speaking, the mean for each grade should increase from one grade to the next higher grade in a similar manner as shown in Table 9.2 and Table 9.3 of this manual, which depicts increases across grade levels. However, due to artifacts of the population whereby some grades may have a greater percentage of higher scoring students than the next higher grade, the mean for the lower grade can be higher than the next higher grades. The statistics above are based on the final research file. The total n-counts for grade K–12 are 197,034. The stats presented in the table are based on the n-counts after cleaning (remove duplicate cases, off-level cases, and all records with Strand Raw Score = 0 or greater than 900).
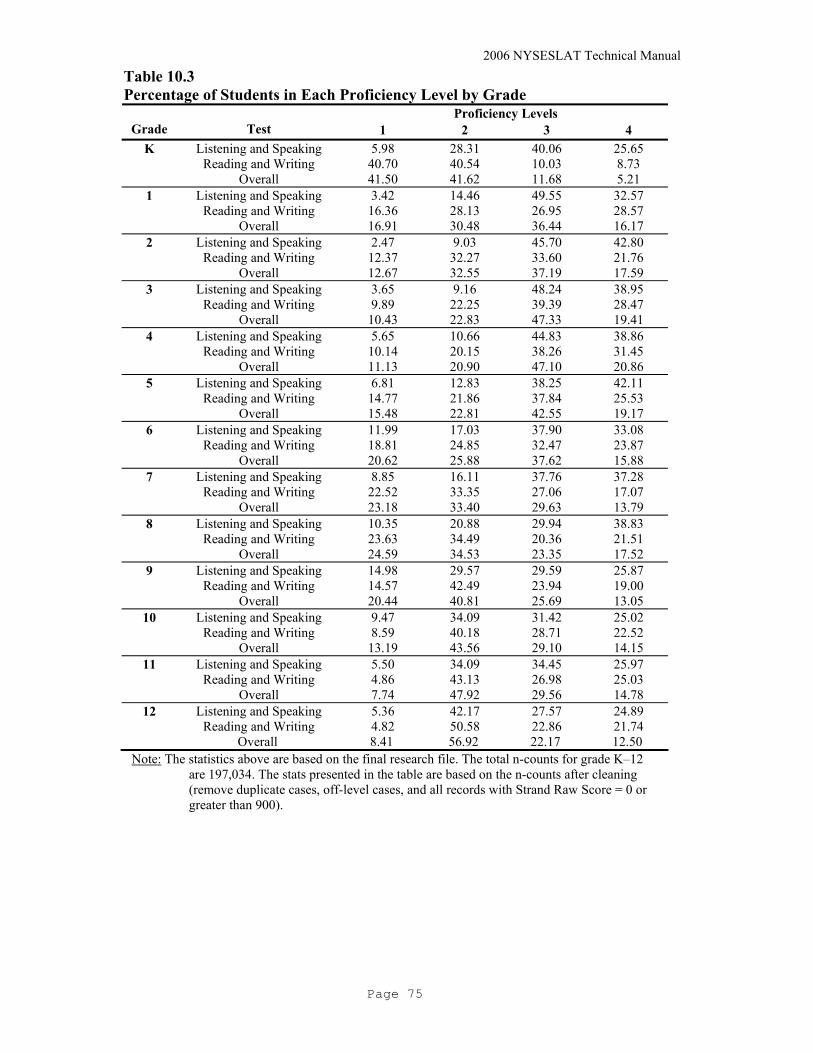
2006 NYSESLAT Technical Manual
Page 75
Table 10.3 Percentage of Students in Each Proficiency Level by Grade
Proficiency Levels Grade
Test 1 2 3 4
K Listening and Speaking 5.98 28.31 40.06 25.65 Reading and Writing 40.70 40.54 10.03 8.73 Overall 41.50 41.62 11.68 5.21
1 Listening and Speaking 3.42 14.46 49.55 32.57 Reading and Writing 16.36 28.13 26.95 28.57 Overall 16.91 30.48 36.44 16.17
2 Listening and Speaking 2.47 9.03 45.70 42.80 Reading and Writing 12.37 32.27 33.60 21.76 Overall 12.67 32.55 37.19 17.59
3 Listening and Speaking 3.65 9.16 48.24 38.95 Reading and Writing 9.89 22.25 39.39 28.47 Overall 10.43 22.83 47.33 19.41
4 Listening and Speaking 5.65 10.66 44.83 38.86 Reading and Writing 10.14 20.15 38.26 31.45 Overall 11.13 20.90 47.10 20.86
5 Listening and Speaking 6.81 12.83 38.25 42.11 Reading and Writing 14.77 21.86 37.84 25.53 Overall 15.48 22.81 42.55 19.17
6 Listening and Speaking 11.99 17.03 37.90 33.08 Reading and Writing 18.81 24.85 32.47 23.87 Overall 20.62 25.88 37.62 15.88
7 Listening and Speaking 8.85 16.11 37.76 37.28 Reading and Writing 22.52 33.35 27.06 17.07 Overall 23.18 33.40 29.63 13.79
8 Listening and Speaking 10.35 20.88 29.94 38.83 Reading and Writing 23.63 34.49 20.36 21.51 Overall 24.59 34.53 23.35 17.52
9 Listening and Speaking 14.98 29.57 29.59 25.87 Reading and Writing 14.57 42.49 23.94 19.00 Overall 20.44 40.81 25.69 13.05
10 Listening and Speaking 9.47 34.09 31.42 25.02 Reading and Writing 8.59 40.18 28.71 22.52 Overall 13.19 43.56 29.10 14.15
11 Listening and Speaking 5.50 34.09 34.45 25.97 Reading and Writing 4.86 43.13 26.98 25.03 Overall 7.74 47.92 29.56 14.78
12 Listening and Speaking 5.36 42.17 27.57 24.89 Reading and Writing 4.82 50.58 22.86 21.74
Overall 8.41 56.92 22.17 12.50 Note: The statistics above are based on the final research file. The total n-counts for grade K–12
are 197,034. The stats presented in the table are based on the n-counts after cleaning (remove duplicate cases, off-level cases, and all records with Strand Raw Score = 0 or greater than 900).

2006 NYSESLAT Technical Manual
Page 76
Table 10.4 Exit Rate by Grade for 2005 and 2006 Administrations
2005 2006 Grade N-count Percent N-count Percent
K 225 2.66 1265 5.21 1 2953 12.07 4166 16.17 2 3582 17.22 4081 17.59 3 2518 15.20 3692 19.41 4 3088 20.99 3124 20.86 5 2268 19.53 2564 19.17 6 1979 15.86 1765 15.88 7 1479 12.05 1706 13.79 8 2070 17.26 2150 17.52 9 1634 11.33 1909 13.05
10 1588 11.40 1822 14.15 11 894 11.62 1021 14.78 12 445 10.36 345 12.50
Total 24723 14.41 29610 15.27

2006 NYSESLAT Technical Manual
Page 77
PART 11: FIELD TEST SUMMARY
11.1 2006 Field Test Sampling
In sampling the field test item responses, each school was considered as the sampling unit in 2006 and was administered one of the two forms. All the grades in each of the randomly selected schools were included for the field testing. However, there were schools that did not have the entire grade span and only those grades that were available were included in the sampling. There were three major processes required for the Fall 2006 sample. The first process was the assignment of a code to each district which would be used over the next several years to indicate which field test strand the district would be assigned. The second step was to project the Fall 2006 enrollments so selection could be made early for schools to participate. The third part of the process is the selection of schools to participate in the actual Fall 2006 field test. The process used for these two steps follow: Assignment of the Sampling Matrix code
1. Schools or school districts were assigned one of six stratification codes. The stratification codes and assignment were based on a Wealth/Needs value provided by the State Department of Education. The classification codes for this stratification are:
a. New York City b. Big Four c. High Urban/Suburban d. High Rural e. Average f. Low
2. Within each stratification code, with the exception of the Big Four, each district was assigned one of four unique codes. Since each of the Big Four districts has only one district, only one code was assigned The unique code will, for the next several years, identify which field test strand will be assigned to the district. Although the code assigned will not change, the field test strand the code relates to will change.
3. These unique codes were randomly assigned to produce assignments with the intent to
have as even a distribution of the student population as possible within the six stratification codes and across the grade span. Due to the extremely wide variance of enrollments for the districts (ranging from 1 to 3,906 students at the HS level), some reassignment was required after the initial assignments to bring the matrix into a more balanced distribution.

2006 NYSESLAT Technical Manual
Page 78
Estimating the Fall 2006 enrollments The estimated enrollments for the Fall 2006 administration were to be based on the Spring 2006 enrollment data. Since grade spans for the Fall administration have different grade assignments than the grade spans used in the Spring administration, and since the enrollment data used in the Spring 2006 administration were collected by grade span, it was necessary to estimate the enrollments by grade for the Spring administration, then calculate the enrollments for the grade spans for the Fall.
1. Estimated enrollments were developed using data from the Fall 2005 administration, which was collected by grade. Using the Fall 2005 enrollments, we established a ratio for each of the grades within a grade span.
2. Those ratios were applied to the Spring 2006 enrollments to estimate the enrollments by
grade. 3. The estimated enrollments by grade were then converted to the equivalent Fall grade span
values. Selection of Schools for Fall Field Test
1. In an attempt to minimize the impact of the field test on any one school, it was decided the assignments for the schools would be to one grade span only. Additional assignments would be made only if an insufficient number of students were available.
2. Based on a desired target of 2,000 students per form per grade span per field test strand
(with a maximum of 2,100 students), targets were established within each strata, grade span, and field test strand. Actual form assignments would be made after the initial enrollment collection is complete.
3. Schools were considered randomly. If the desired target count had not been reached for
the strata, grade span, and field test strand, the school would then be selected to participate at that grade span. If the target had been reached, the school would then be considered for inclusion at a different grade span.
4. Some adjustments were made to the list of selected schools to attempt to reach the
maximum number of students while maintaining the stratification ratios. 5. Once the initial enrollment period ends, the schools that have provided enrollment data
will be assigned a form such that the enrollment counts will be evenly distributed by grade span. Reports of the distribution of forms not only by grade span but also by grade will be generated. If the grade distribution of forms is skewed, then adjustments may be made to the form assignments to bring them into alignment.
6. Schools which have not provided enrollment data will be contacted in an attempt to
acquire their enrollments. For these schools, forms will be assigned based on grade span and their estimated enrollments in an attempt to provide an even distribution of forms across the grade spans.

2006 NYSESLAT Technical Manual
Page 79
11.2 2006 Field Test Summary Statistics
Although the sample n-counts were targeted at 2000 per grade span, the n-counts could not be met for each of the two forms because this was not mandatory testing and some schools did not participate in spite of their commitment. A second sampling was requested by NYSED when the first sampling did not provide the required n-counts. The summary statistics for the 2006 field tests by modality and grade span from the report are provided in Table 11.1 Table 11.1 2006 Field Test Summary Statistics by Modality, Grade Span and Form
Grade Span
Modality Form N Mean SD Min Max
1–2 Listening A 838 0.88 0.29 0 24 B 640 0.90 0.28 0 24
3–5 A 1012 0.70 0.41 0 28 B 792 0.69 0.41 0 28
6–7 A 452 0.72 0.42 0 26 B 698 0.70 0.43 0 26
8–9 A 498 0.56 0.47 0 26 B 643 0.56 0.46 0 26
10–12 A 412 0.56 0.47 0 27 B 542 0.59 0.43 0 27
1–2 Speaking A 608 0.66 0.68 0 16 B 752 0.68 0.67 0 16
3–5 A 652 0.72 0.67 0 16 B 516 0.70 0.73 0 16
6–7 A 503 0.72 0.69 0 16 B 449 0.75 0.67 0 16
8–9 A 196 0.63 0.70 0 16 B 483 0.64 0.70 0 16
10–12 A 126 0.72 0.61 0 16 B 134 0.64 0.62 0 16
1–2 Reading A 911 0.67 0.46 0 15 B 937 0.62 0.47 0 15
3–5 A 1012 0.55 0.43 0 28 B 1072 0.57 0.44 0 28
6–7 A 512 0.58 0.46 0 33 B 792 0.55 0.46 0 33
8–9 A 473 0.56 0.46 0 27 B 605 0.54 0.45 0 27
10–12 A 243 0.59 0.45 0 31 B 48 0.49 0.48 0 31
1–2 Writing A 291 0.72 0.55 0 15 B 466 0.72 0.53 0 15
3–5 A 687 0.57 0.52 0 16 B 792 0.66 0.52 0 16
6–7 A 946 0.55 0.54 0 19 B 493 0.68 0.49 0 19
8–9 A 284 0.66 0.52 0 19 B 425 0.66 0.52 0 19
10–12 A 357 0.67 0.51 0 19 B 194 0.56 0.54 0 19

2006 NYSESLAT Technical Manual
Page 80
APPENDIX A: TEST BLUEPRINT AND ITEM MAP
A.1: NYSESLAT 2006 Test Blueprint
NYSESLAT 2006 Operational Test Blueprint
Strand Cluster Number of Items Notes
K–1 2–4 5–6 7–8 9–12
Word/Sentence Comprehension 14 12 5 5 5
Comprehension of Conversational Language
10 9 11 12 12 Listening
Synthesizing Information (Task-Based)
5 10 10 10
Total Points 24 26 26 27 27
Word Reading 11
Sentence Reading 2
Short Passages with Questions 2
Word/Sentence Reading 9 6 5 5
Reading
Comprehension 17 20 24 24
Total Points 15 26 26 29 29 Phonemic Understanding 8 4 4 3 3
Mechanics & Structure A 2 4 5 5 5 Writing
Conventions
Mechanics & Structure B 4 7 8 8
Developmental Writing 8
Pre-Writing 3 3 3 3 Writing
Extended Response 1 1 1 1 1
Total Points 28 22 26 26 26
The eight K–1 Developmental Writing items, the K–1 Extended Response item, and the Pre-Writing items are worth up to two points. Extended Response at 2–4 to 9–12 is worth up to four points.

2006 NYSESLAT Technical Manual
Page 81
A.1: NYSESLAT 2006 Test Blueprint (Continued)
NYSESLAT 2006 Operational Test Blueprint
Strand Cluster Number of Items Notes
K–1 2–4 5–6 7–8 9–12
Repeat/Read Aloud 5 5 5 5 5
Sentence Completion 5 5 5 5 5
Storytelling 1 1 1 1 1
All Speaking items are scored on a 2-point rubric, except the Storytelling item, which is worth up to 4 points at each grade span.
Speaking
Social Interaction 5 5 5 5 5
Total Points 34 34 34 34 34
The following tables depict each item position on the examination, the cluster it belongs to, the standard it relates to, and its performance indicators by grades, modality, and forms: A2: Key to Tables Grade Span and Modality
Cluster Key
Refers to: Standard Key
Refers to: Performance Indication
Key
Refers to:
K-G1 Listening
1 Word/Sentence Comprehension
1 Students will listen, speak, read, and write in English for information
and understanding.
1 Identify and use basic reading and listening strategies to make text comprehensible and meaningful.
1 1 16 Apply learning strategies to acquire information and make oral and written texts comprehensible and meaningful.
1 1 3 Select information appropriate to the purpose of the investigation.
1 1 12 Become familiar with some conventions of American English.
2 Comprehension of Conversational
Language
1 Students will listen, speak, read, and write in English for information
and understanding.
3 Select information appropriate to the purpose of the investigation.
2 1 1 Identify and use basic reading and listening strategies to make text comprehensible and meaningful.

2006 NYSESLAT Technical Manual
Page 82
A2: Key to Tables (Continued) Grade Span and Modality
Cluster Key
Refers to: StandardKey
Refers to: Performance Indication
Key
Refers to:
2 3 Students will listen, speak, read, and write in English
for critical analysis and evaluation.
9 Apply learning strategies to explore a variety of materials.
2 5 Students will demonstrate cross-
cultural knowledge and understanding.
2 Demonstrate familiarity with some U. S. cultural referents at the local and national levels.
2 4 Students will listen, speak, read, and write in English
for classroom and social interaction.
7 Follow oral directions and written directions to participate in classroom and social activities.
2 5 Students will demonstrate cross-
cultural knowledge and understanding.
1 Demonstrate familiarity with some cultural and language patterns and norms in American English.
K-G1 Speaking
1 Repeat/Read Aloud
1 Students will listen, speak, read, and write in English for information
and understanding.
12 Become familiar with some conventions of American English.
1 2 Students will listen, speak, read, and write in English
for literary response,
enjoyment, and expression.
6 Develop comprehension of text to prepare to read aloud.
2 Sentence Completion
1 Students will listen, speak, read, and write in English for information
and understanding.
9 Convey information, using some organizational patterns and structures.
2 4 Students will listen, speak, read, and write in English
for classroom and social interaction.
5 Explain actions, choices, and decisions in social and classroom situations.
2 1 Students will listen, speak, read, and write in English for information
and understanding.
9 Convey information, using some organizational patterns and structures.

2006 NYSESLAT Technical Manual
Page 83
A2: Key to Tables (Continued) Grade Span and Modality
Cluster Key
Refers to: Standard Key
Refers to: Performance Indication
Key
Refers to:
3 Storytelling 1 Students will listen, speak, read, and write in English for information
and understanding.
7 Present information clearly in oral and graphic forms.
4 Social Interaction
4 Students will listen, speak, read, and write in English
for classroom and social interaction.
9 Use appropriate vocabulary, language, and interaction styles for various audiences and social or school situations.
4 4 11 Discover alternative ways of saying things in social and classroom interactions.
4 4 4 Listen attentively and take turns speaking when engaged in pair, group, or full-class discussions on personal, social, and academic topics.
K-G1 Reading
1 Word Reading 1 Students will listen, speak, read, and write in English for information
and understanding.
1 Identify and use basic reading and listening strategies to make text comprehensible and meaningful.
1 1 5 Formulate, ask, and respond to questions to obtain and provide information and meaning.
1 1 16 Apply learning strategies to acquire information and make oral and written texts comprehensible and meaningful.
2 Sentence Reading
2 Students will listen, speak, read, and write in English
for literary response,
enjoyment, and expression.
2 Use basic reading and listening strategies to make literary text comprehensible and meaningful.
3 Short Passage with Question
1 Students will listen, speak, read, and write in English for information
and understanding.
16 Apply learning strategies to acquire information and make oral and written texts comprehensible and meaningful.
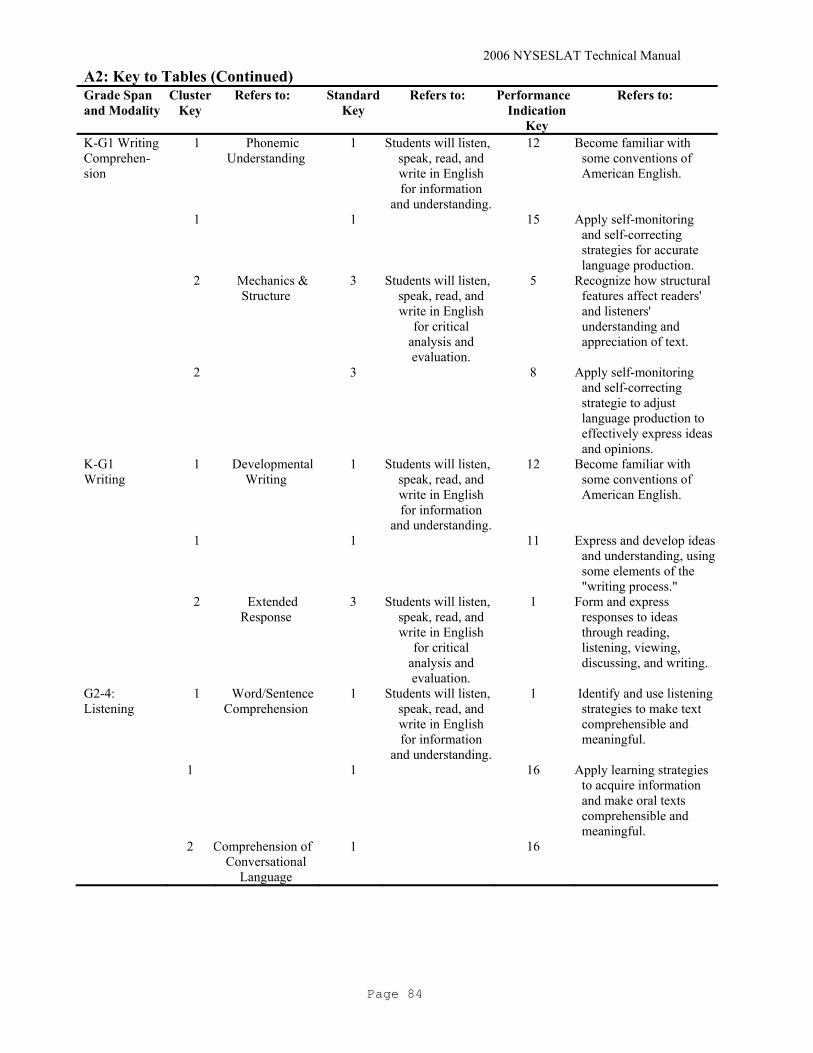
2006 NYSESLAT Technical Manual
Page 84
A2: Key to Tables (Continued) Grade Span and Modality
Cluster Key
Refers to: Standard Key
Refers to: Performance Indication
Key
Refers to:
K-G1 Writing Comprehen-sion
1 Phonemic Understanding
1 Students will listen, speak, read, and write in English for information
and understanding.
12 Become familiar with some conventions of American English.
1 1 15 Apply self-monitoring and self-correcting strategies for accurate language production.
2 Mechanics & Structure
3 Students will listen, speak, read, and write in English
for critical analysis and evaluation.
5 Recognize how structural features affect readers' and listeners' understanding and appreciation of text.
2 3 8 Apply self-monitoring and self-correcting strategie to adjust language production to effectively express ideas and opinions.
K-G1 Writing
1 Developmental Writing
1 Students will listen, speak, read, and write in English for information
and understanding.
12 Become familiar with some conventions of American English.
1 1 11 Express and develop ideas and understanding, using some elements of the "writing process."
2 Extended Response
3 Students will listen, speak, read, and write in English
for critical analysis and evaluation.
1 Form and express responses to ideas through reading, listening, viewing, discussing, and writing.
G2-4: Listening
1 Word/Sentence Comprehension
1 Students will listen, speak, read, and write in English for information
and understanding.
1 Identify and use listening strategies to make text comprehensible and meaningful.
1 1 16 Apply learning strategies to acquire information and make oral texts comprehensible and meaningful.
2 Comprehension of Conversational
Language
1 16

2006 NYSESLAT Technical Manual
Page 85
A2: Key to Tables (Continued) Grade Span and Modality
Cluster Key
Refers to: Standard Key
Refers to: Performance Indication
Key
Refers to:
2 3 Sudents will listen, speak, read, and write in English
for critical analysis and evaluation.
9 Apply learning strategies to examine, interpret, and evaluate a variety of materials.
2 1 3 Select information appropriate to the purpose of the investigation and relate ideas from one written or spoken source to another.
2 5 Students will demonstrate cross-
cultural knowledge and understanding.
2 Demonstrate familiarity with a broad range of U. S. cultural and political referents through institutions, functions, and processes at the local and national levels.
2 5 6 Recognize and demonstrate an appreciation of some commonalities and distinctions across cultures and groups (differentiated by gender, ability, generations, etc.) including the students' own.
2 3 3 Recognize personal point of view in self and others in discussing, interpreting, and evaluating information.
2 3 1 Form and express responses to a variety of literary, informational, and persuasive material through reading, listening, viewing, discussing, and writing; use details and evidence for support.
2 5 4 Interpret and demonstrate knowledge of nonverbal and oral communication features and understand the contexts in which they are used appropriately.

2006 NYSESLAT Technical Manual
Page 86
A2: Key to Tables (Continued) Grade Span and Modality
Cluster Key
Refers to: Standard Key
Refers to: Performance Indication
Key
Refers to:
2 1 1 Identify and use listening strategies to make text comprehensible and meaningful.
3 Synthesizing Information
4 Students will listen, speak, read, and write in English
for classroom and social interaction.
3 Request and provide information and assistance, orally or in writing, for personal, social, and academic purposes.
3 4 7 Follow oral directions to participate in classroom and social activities.
3 4 8 Negotiate and manage interactions to accomplish social and classroom tasks.
3 4 3 Request and provide information and assistance, orally or in writing, for personal, social, and academic purposes.
G2-4: Speaking
1 Repeat/ Read Aloud
1 Students will listen, speak, read, and write in English for information
and understanding.
12 Convey information and ideas through spoken and written language, using conventions and features of American English.
1 2 Students will listen, speak, read,
and write in English for literary
response, enjoyment, and
expression.
6 Read aloud with confidence, accuracy, and fluency.
2 Sentence Completion
1 Students will listen, speak, read, and write in English for information
and understanding.
9 Convey information, using a variety of organizational patterns
and structures.
2 1 12
2 4 Students will listen, speak, read, and write in English
for classroom and social interaction.
9 Use appropriate vocabulary, language, and interaction styles for various audiences and social or school situations.
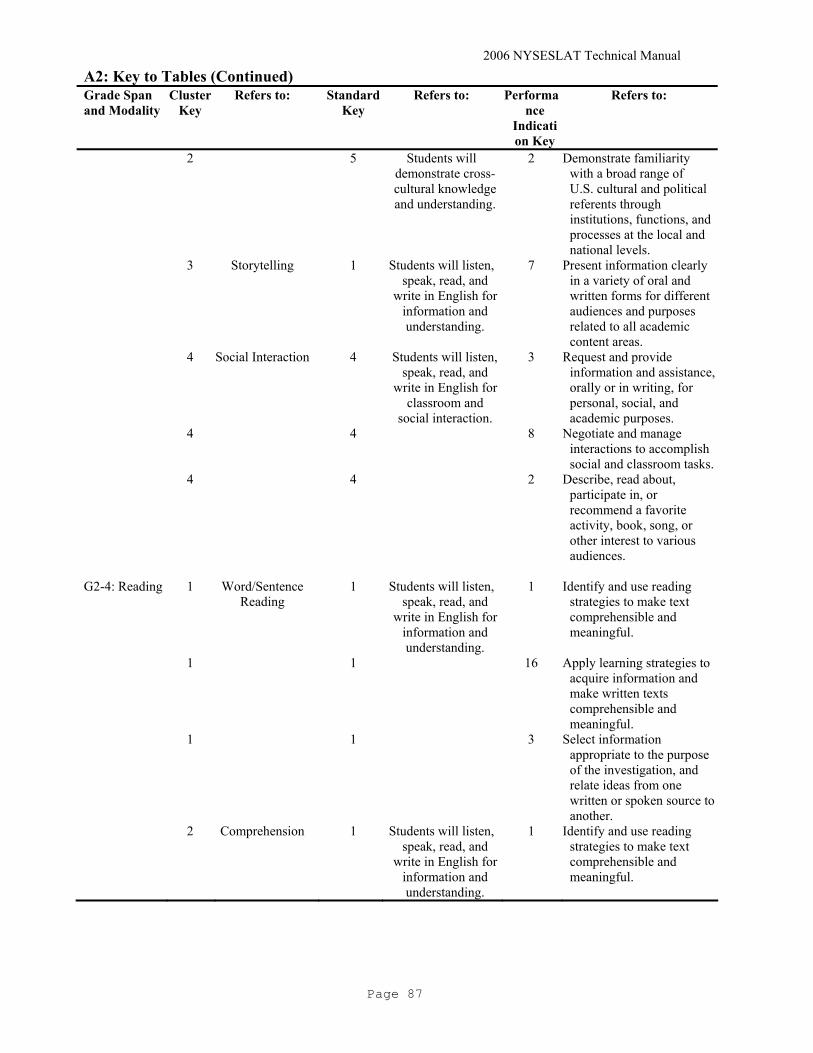
2006 NYSESLAT Technical Manual
Page 87
A2: Key to Tables (Continued) Grade Span and Modality
Cluster Key
Refers to: Standard Key
Refers to: Performance
Indication Key
Refers to:
2 5 Students will demonstrate cross-cultural knowledge and understanding.
2 Demonstrate familiarity with a broad range of U.S. cultural and political referents through institutions, functions, and processes at the local and national levels.
3 Storytelling 1 Students will listen, speak, read, and
write in English for information and understanding.
7 Present information clearly in a variety of oral and written forms for different audiences and purposes related to all academic content areas.
4 Social Interaction 4 Students will listen, speak, read, and
write in English for classroom and
social interaction.
3 Request and provide information and assistance, orally or in writing, for personal, social, and academic purposes.
4 4 8 Negotiate and manage interactions to accomplish social and classroom tasks.
4 4 2 Describe, read about, participate in, or recommend a favorite activity, book, song, or other interest to various audiences.
G2-4: Reading 1 Word/Sentence
Reading 1 Students will listen,
speak, read, and write in English for
information and understanding.
1 Identify and use reading strategies to make text comprehensible and meaningful.
1 1 16 Apply learning strategies to acquire information and make written texts comprehensible and meaningful.
1 1 3 Select information appropriate to the purpose of the investigation, and relate ideas from one written or spoken source to another.
2 Comprehension 1 Students will listen, speak, read, and
write in English for information and understanding.
1 Identify and use reading strategies to make text comprehensible and meaningful.

2006 NYSESLAT Technical Manual
Page 88
A2: Key to Tables (Continued) Grade Span and Modality
Cluster Key
Refers to: Standard Key
Refers to: Performance Indication
Key
Refers to:
2 1 6 Make and support inferences about information and ideas with reference to features in oral and written text.
2 3 Students will listen, speak, read, and write in English
for critical analysis and evaluation.
3 Recognize personal point of view in self and others in discussing, interpreting, and evaluating information.
2 3 5 Recognize and explain how structural features affect readers' and listeners' understanding and appreciation of text.
2 2 Students will listen, speak, read, and write in English
for literary response,
enjoyment, and expression.
2 Identify and use reading and listening strategies to make literary text comprehensible and meaningful.
2 2 5 Make predictions, inferences, and deductions and discuss the meaning of literary works with some attention beyond the literal level, to understand and interpret text presented orally and in written form.
2 2 12 Apply learning strategies to comprehend and make inferences about literature and produce literary responses.
G2-4: Writing Comprehen-sion
1 Phonemic Understanding
1 Students will listen, speak, read, and write in English for information
and understanding.
16 Apply learning strategies to acquire information and make oral texts comprehensible and meaningful.
1 1 12 Convey information and ideas through written language, using conventions and features of American English.

2006 NYSESLAT Technical Manual
Page 89
A2: Key to Tables (Continued) Grade Span and Modality
Cluster Key
Refers to: Standard Key
Refers to: Performance Indication
Key
Refers to:
2 Mechanics & Structure
1 5 Formulate, ask, and respond to questions to obtain, clarify, and extend information and meaning.
3 1 12 2 3 Students will listen,
speak, read, and write in English
for critical analysis and evaluation.
4 Evaluate students' own and others' work, individually and collaboratively, on the basis of a variety of criteria.
G2-4: Pre-Writing
1 Pre-Writing 1 Students will listen, speak, read, and write in English for information
and understanding.
11 Use the process of pre-writing, drafting, revising, and proofreading (the "writing process") to produce well-constructed informational texts.
G2-4: Writing 1 Writing 3 Students will listen, speak, read, and write in English
for critical analysis and evaluation.
1 Form and express responses to a variety of literary, informational, and persuasive material through reading, listening, viewing, discussing, and writing; use details and evidence as support.
G5-6: Listening 1 Word/Sentence Comprehension
1 Students will listen, speak, read, and write in English for information
and understanding.
1 Identify and use reading and listening strategies to make text comprehensible and meaningful.
1 1 16 Apply learning strategies to acquire information and make oral texts comprehensible and meaningful.
1 1 5 Formulate, ask, and respond to various question forms to obtain, clarify, and extend information and meaning.
2 Comprehension of Conversational
Language
4 Students will listen, speak, read, write
in English for classroom and
social interaction.
10 Demonstrate appropriate classroom behaviors (e.g., participating in small-group and whole-class discussions, being courteous, respecting the person and property of others).

2006 NYSESLAT Technical Manual
Page 90
A2: Key to Tables (Continued) Grade span and Modality
Cluster Key
Refers to: Standard Key
Refers to: Performance Indication
Key
Refers to:
2 5 Students will demonstrate cross-
cultural knowledge and understanding.
1 Demonstrate familiarity with cultural and language patterns and norms in American English, including different regional and social varieties of English.
2 1 1 2 3 Students will listen,
speak, read, and write in English
for critical analysis and evaluation.
3 Recognize and communicate personal and multiple points of view within and among groups, in discussing, interpreting, and evaluating information in texts and presentations.
2 4 Students will listen, speak, read, and write in English
for classroom and social interaction.
9 Use appropriate vocabulary, expressions, language, routines, and interaction styles for various audiences and formal and informal social or school situations, noticing how intention is realized through language.
2 5 2 Demonstrate an understanding of a broad range of U. S. cultural and political referents through institutions, functions, and processes at the local and national levels, and compare/ contrast these with parallels in the students' native community.
2 5 4 Interpret and demonstrate knowledge of nonverbal and oral communication features, and understand the contexts in which they are used appropriately.
2 4 4 Listen attentively, take turns speaking, and build on others' ideas when engaged in pair, group, or full-class discussions on personal, social, community, and academic topics.

2006 NYSESLAT Technical Manual
Page 91
A2: Key to Tables (Continued) Grade Span and Modality
Cluster Key
Refers to: Standard Key
Refers to: Performance Indication
Key
Refers to:
3 Synthesizing Information
4 4 Listen attentively, take turns speaking, and build on others' ideas when engaged in pair, group, or full-class discussions on personal, social, and academic topics.
3 4 7 Follow oral and written directions to participate in classroom and social activities, and provide directions to peers in selected interactions.
3 4 8 Negotiate and manage interactions to accomplish social and classroom tasks.
3 4 9 Use appropriate vocabulary, expressions, language, routines, and interaction styles for various audiences and formal and informal social or school situations, noticing how intention is realized through language.
G5-6: Speaking
1 Repeat/Read Aloud 1 Students will listen, speak, read, and write in English for information
and understanding.
12 Convey information and ideas through spoken and written language, using conventions and features of American English appropriate to audience and purpose.
1 2 Students will listen, speak, read, and write in English
for literary response,
enjoyment, and expression
6 Read aloud with confidence, accuracy, and fluency.
2 Sentence Completion
1 9 Convey and organize information, using facts, details, illustrative examples, and a variety of patterns and structures.
2 1 12 Convey information and ideas through spoken and written language, using conventions and features of American English appropriate to audience and purpose.
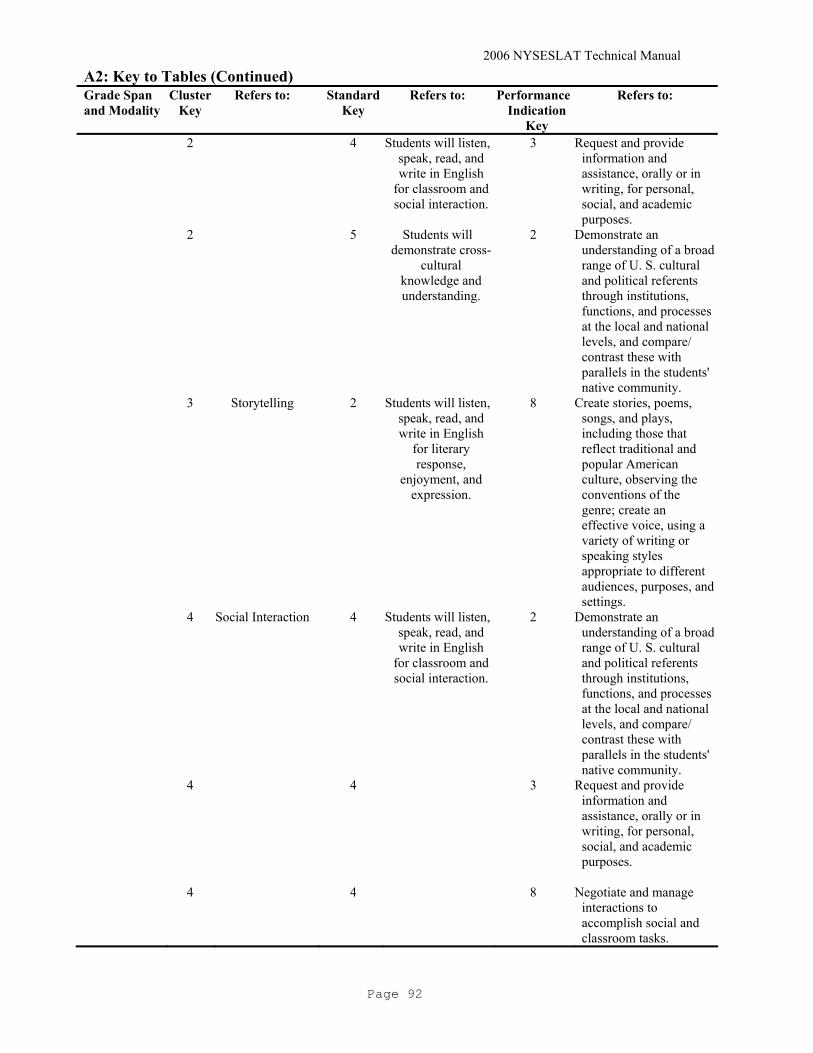
2006 NYSESLAT Technical Manual
Page 92
A2: Key to Tables (Continued) Grade Span and Modality
Cluster Key
Refers to: Standard Key
Refers to: Performance Indication
Key
Refers to:
2 4 Students will listen, speak, read, and write in English
for classroom and social interaction.
3 Request and provide information and assistance, orally or in writing, for personal, social, and academic purposes.
2 5 Students will demonstrate cross-
cultural knowledge and understanding.
2 Demonstrate an understanding of a broad range of U. S. cultural and political referents through institutions, functions, and processes at the local and national levels, and compare/ contrast these with parallels in the students' native community.
3 Storytelling 2 Students will listen, speak, read, and write in English
for literary response,
enjoyment, and expression.
8 Create stories, poems, songs, and plays, including those that reflect traditional and popular American culture, observing the conventions of the genre; create an effective voice, using a variety of writing or speaking styles appropriate to different audiences, purposes, and settings.
4 Social Interaction 4 Students will listen, speak, read, and write in English
for classroom and social interaction.
2 Demonstrate an understanding of a broad range of U. S. cultural and political referents through institutions, functions, and processes at the local and national levels, and compare/ contrast these with parallels in the students' native community.
4 4 3 Request and provide information and assistance, orally or in writing, for personal, social, and academic purposes.
4 4 8 Negotiate and manage
interactions to accomplish social and classroom tasks.

2006 NYSESLAT Technical Manual
Page 93
A2: Key to Tables (Continued) Grade Span and Modality
Cluster Key
Refers to: Standard Key
Refers to: Performance Indication
Key
Refers to:
G5-6: Reading 1 Word/Sentence Reading
1 Students will listen, speak, read, and write in English for information
and understanding.
1 Identify and use reading and listening strategies to make text comprehensible and meaningful.
1 1 16 Apply learning strategies to acquire information and make texts comprehensible and meaningful.
1 1 5 Formulate, ask, and respond to various question forms to obtain, clarify, and extend information and meaning.
2 Comprehension 5 Students will demonstrate cross-
cultural knowledge and understanding.
3 Recognize and share cross-cultural experiences and ideas, and connect with those of others.
2 5 6 Recognize and demonstrate an appreciation of some commonalities and distinctions across cultures and groups (differentiated by gender, ability, generations, etc.), including the students' own.
2 1 1 Identify and use reading and listening strategies to make text comprehensible and meaningful.
2 2 Students will listen, speak, read, and write in English
for literary response,
enjoyment, and expression.
5 Make predictions, inferences, and deductions, and describe different levels of meaning of literary works presented orally and in written form, including literal and implied meanings.

2006 NYSESLAT Technical Manual
Page 94
A2: Key to Tables (Continued) Grade Span and Modality
Cluster Key
Refers to: Standard Key
Refers to: Performance Indication
Key
Refers to:
2 3 Students will listen, speak, read, and write in English
for critical analysis and evaluation.
3 Recognize and communicate personal and multiple points of view within and among groups, in discussing, interpreting, and evaluating information in texts and presentations.
2 3 9 Apply learning strategies to examine and interpret a variety of materials.
2 2 Students will listen, speak, read, and write in English
for literary response,
enjoyment, and expression.
2 Identify and use reading and listening strategies to make literary text comprehensible and meaningful.
2 2 12 Apply learning strategies to comprehend and make inferences about literature and produce literary responses.
2 1 16 Apply learning strategies to acquire information and make texts comprehensible and meaningful.
2 3 5 Recognize, explain, and evaluate how structural features affect readers' and listeners' understanding and appreciation of text.
G5-6: Writing Comprehen-sion
1 Phonemic Understanding
1 Students will listen, speak, read, and write in English for information
and understanding.
15 Apply self-monitoring and self-correcting strategies for accurate language production and oral and written presentation, using established criteria for effective presentation of information.
1 1 12 Convey information and ideas through written language, using conventions and features of American English appropriate to audience and purpose.

2006 NYSESLAT Technical Manual
Page 95
A2: Key to Tables (Continued) Grade Span and Modality
Cluster Key
Refers to: Standard Key
Refers to: Performance Indication
Key
Refers to:
1 1 1 Identify and use reading and listening strategies to make text comprehensible and meaningful.
2 Mechanics & Structure
1 Students will listen, speak, read, and write in English for information
and understanding.
12 Convey information and ideas through written language, using conventions and features of American English appropriate to audience and purpose.
2 3 Students will listen, speak, read, and write in English
for critical analysis and evaluation.
4 Evaluate students' own and others' work, individually and collaboratively, on the basis of a variety of criteria.
2 3 6 Speak and write, using the conventions and features of American English, to effectively influence an audience (e.g., to persuade, negotiate, or argue).
G5-6: Pre-Writing
1 Pre-Writing 1 Students will listen, speak, read, and write in English for information
and understanding.
11 Use the process of pre-writing, drafting, revising, peer editing, and proofreading (the "writing process") to produce well-constructed informational texts.
G5-6: Writing 1 Writing 3 Students will listen, speak, read, and write in English
for critical analysis and evaluation.
1 Develop and present clear interpretations, analyses, and evaluations of issues, ideas, texts, and experiences, supporting positions with well-developed arguments.
G7-8: Listening
1 Word/Sentence Comprehension
1 Students will listen, speak, read, and write in English for information
and understanding.
1 Identify and use reading and listening strategies to make text comprehensible and meaningful.
1 1 16 Apply learning strategies to acquire information and make texts comprehensible and meaningful.

2006 NYSESLAT Technical Manual
Page 96
A2: Key to Tables (Continued) Grade Span and Modality
Cluster Key
Refers to: Standard Key
Refers to: Performance Indication
Key
Refers to:
2 Comprehension of Conversational
Language
1 Students will listen, speak, read, and write in English for information
and understanding.
1 Identify and use reading and listening strategies to make text comprehensible and meaningful.
2 1 6 Make and support inferences about information and ideas with reference to features in oral and written text.
2 4 Students will listen, speak, read, and write in English
for classroom and social interaction.
7 Follow oral and written directions to participate in classroom and social activities, and provide directions to peers in selected interactions.
2 4 9 Use appropriate vocabulary, expressions, language, routines, and interaction styles for various audiences and formal and informal social or school situations, noticing how intention is realized through language.
2 5 Students will demonstrate cross-
cultural knowledge and understanding.
4 Interpret and demonstrate knowledge of nonverbal and oral communication features, and understand the contexts in which they are used appropriately.
2 1 10 Distinguish between fact and opinion, and relevant and irrelevant information, and exclude nonessential information in oral and written presentations.
3 Synthesizing Information
4 Students will listen, speak, read, and write in English
for classroom and social interaction.
7 Follow oral and written directions to participate in classroom and social activities, and provide directions to peers in selected interactions.
3 1 Students will listen, speak, read, and write in English for information
and understanding.
1 Identify and use reading and listening strategies to make text comprehensible and meaningful.
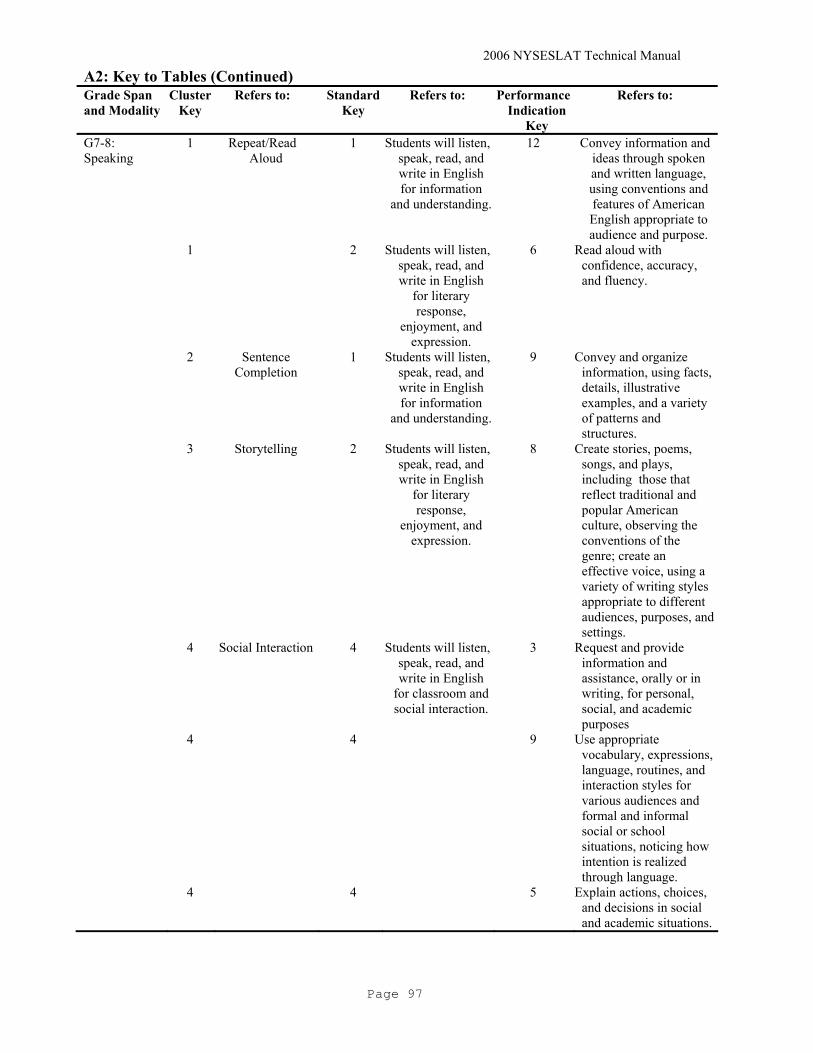
2006 NYSESLAT Technical Manual
Page 97
A2: Key to Tables (Continued) Grade Span and Modality
Cluster Key
Refers to: Standard Key
Refers to: Performance Indication
Key
Refers to:
G7-8: Speaking
1 Repeat/Read Aloud
1 Students will listen, speak, read, and write in English for information
and understanding.
12 Convey information and ideas through spoken and written language, using conventions and features of American English appropriate to audience and purpose.
1 2 Students will listen, speak, read, and write in English
for literary response,
enjoyment, and expression.
6 Read aloud with confidence, accuracy, and fluency.
2 Sentence Completion
1 Students will listen, speak, read, and write in English for information
and understanding.
9 Convey and organize information, using facts, details, illustrative examples, and a variety of patterns and structures.
3 Storytelling 2 Students will listen, speak, read, and write in English
for literary response,
enjoyment, and expression.
8 Create stories, poems, songs, and plays, including those that reflect traditional and popular American culture, observing the conventions of the genre; create an effective voice, using a variety of writing styles appropriate to different audiences, purposes, and settings.
4 Social Interaction 4 Students will listen, speak, read, and write in English
for classroom and social interaction.
3 Request and provide information and assistance, orally or in writing, for personal, social, and academic purposes
4 4 9 Use appropriate vocabulary, expressions, language, routines, and interaction styles for various audiences and formal and informal social or school situations, noticing how intention is realized through language.
4 4 5 Explain actions, choices, and decisions in social and academic situations.

2006 NYSESLAT Technical Manual
Page 98
A2: Key to Tables (Continued) Grade Span and Modality
Cluster Key
Refers to: Standard Key
Refers to: Performance Indication
Key
Refers to:
G7-8: Reading 1 Word/Sentence Reading
1 Students will listen, speak, read, and write in English for information and understanding.
1 Identify and use reading and listening strategies
to make text comprehensible and
meaningful. 2 Comprehension 1 Students will listen,
speak, read, and write in English for information and understanding.
6 Make and support inferences about information and ideas with reference to features in oral and written text.
2 3 Students will listen, speak, read, and write in English for critical analysis and evaluation.
5 Recognize, explain, and evaluate how structural features affect readers' and listeners' understanding and appreciation of text.
2 3 9 Apply learning strategies to examine and interpret a variety of materials.
2 2 Students will listen, speak, read, and write in English for literary response, enjoyment, and expression.
12 Apply learning strategies to comprehend and make inferences about literature and produce literary responses.
2 2 4 Locate and identify selected literary elements and techniques in texts and relate those elements to those in other works and to students’ own experiences.
2 1 16 Apply learning strategies to acquire information and make texts comprehensible and meaningful.
2 1 Students will listen, speak, read, and write in English for information and understanding.
1 Identify and use reading and listening strategies to make text comprehensible and meaningful.
2 1 4 Compare, contrast, categorize, and synthesize to gain a deeper understanding of information and objects.

2006 NYSESLAT Technical Manual
Page 99
A2: Key to Tables (Continued) Grade Span and Modality
Cluster Key
Refers to: Standard Key
Refers to: Performance Indication
Key
Refers to:
2 2 5 Make predictions, inferences, and deductions, and describe different levels of meaning of literary works presented orally and in written form, including literal and implied meanings.
G7-8: Writing Convention
1 Phonemic Understanding
1 Students will listen, speak, read, and write in English for information and understanding.
12 Convey information and ideas through written language, using conventions and features of American English.
2 Mechanics & Structure
1 Students will listen, speak, read, and write in English for information and understanding.
12 Convey information and ideas through written language, using conventions and features of American English.
2 1 6 Make and support inferences about information and ideas with reference to features in oral and written text.
2 3 Students will listen, speak, read, and write in English for critical analysis and evaluation.
8 Apply self-monitoring and self-correcting strategies to effectively express opinions and evaluations.
G7-8: Pre-Writing
1 Pre-Writing 1 Students will listen, speak, read, and write in English for information and understanding.
11 Use the process of pre-writing, drafting, revising, and proofreading (the "writing process") to produce well-constructed informational texts.
G7-8: Writing 1 Writing 3 Students will listen, speak, read, and write in English for critical analysis and evaluation.
1 Develop and present clear interpretations, analyses, and evaluations of issues, ideas, texts, and experiences, supporting positions with well-developed arguments.
G9-12: Listening
1 Word/Sentence Comprehension
1 Students will listen, speak, read, and write in English for information and understanding.
1 Identify and use reading and listening strategies to make text comprehensible and meaningful.

2006 NYSESLAT Technical Manual
Page 100
A2: Key to Tables (Continued) Grade Span and Modality
Cluster Key
Refers to: Standard Key
Refers to: Performance Indication
Key
Refers to:
2 Comprehension of Conversational
Language
4 Students will listen, speak, read, and write in English for classroom and social interaction.
7 Follow oral and written directions to participate in classroom and social activities, and provide directions to peers in selected interactions.
2 1 Students will listen, speak, read, and write in English for information and understanding.
1 Identify and use reading and listening strategies to make text comprehensible and meaningful.
2 4 9 Use appropriate vocabulary, expressions, language, routines, and interaction styles for various audiences and formal and informal social or school situations, noticing how intention is communicated in different ways through language in various contexts.
3 Synthesizing Information
4 Students will listen, speak, read, and write in English for classroom and social interaction.
7 Follow oral and written directions to participate in classroom and social activities, and provide directions to peers in selected interactions.
3 1 Students will listen, speak, read, and write in English for information and understanding.
6 Make and support inferences about information and ideas with reference to features in oral and written text.
3 1 1 Identify and use reading and listening strategies to make text comprehensible and meaningful.
3 1 16 Apply learning strategies to acquire information and make texts comprehensible and meaningful.
G9-12: Speaking
1 Repeat/Read Aloud
2 Students will listen, speak, read, and write in English for literary response, enjoyment, and expression.
6 Read aloud with confidence, accuracy, fluency, and expression to demonstrate understanding and to convey an interpretation of meaning.

2006 NYSESLAT Technical Manual
Page 101
A2: Key to Tables (Continued) Grade Span and Modality
Cluster Key
Refers to: Standard Key
Refers to: Performance Indication
Key
Refers to:
2 Sentence Completion
1 Students will listen, speak, read, and write in English for information and understanding.
9 Convey and organize information, using facts, details, illustrative examples, and a variety of patterns and structures.
2 4 Students will listen, speak, read, and write in English for classroom and social interaction.
5 Explain actions, choices, and decisions in social and academic situations.
2 5 Students will demonstrate cross-cultural knowledge and understanding.
6 Recognize and demonstrate an appreciation of some commonalities and distinctions across cultures and groups (differentiated by gender, ability, generations, etc.), including the students' own.
3 Storytelling 2 Students will listen, speak, read, and write in English for literary response, enjoyment, and expression.
8 Create stories, poems, and plays, including those that reflect traditional and popular American culture, observing the conventions of the genre; create an effective voice, using typical features of a given genre; create an effective voice, using a variety of writing styles appropriate to different audiences, purposes, and settings.
4 Social Interaction 4 Students will listen, speak, read, and write in English for classroom and social interaction.
2 Describe, read about, participate in, or recommend a favorite activity, book, song, or other interest to various audiences.
4 4 5 Explain actions, choices, and decisions in social and academic situations.
4 4 3 Request and provide information and assistance, orally or in writing, for personal, social, and academic purposes.

2006 NYSESLAT Technical Manual
Page 102
A2: Key to Tables (Continued) Grade Span and Modality
Cluster Key
Refers to: Standard Key
Refers to: Performance Indication
Key
Refers to:
G9-12: Reading
1 Word/Sentence Reading
1 Students will listen, speak, read, and write in English for information and understanding.
1 Identify and use reading and listening strategies to make text comprehensible and meaningful.
2 Comprehension 3 Students will listen, speak, read, and write in English for critical analysis and evaluation.
5 Recognize, explain, and evaluate and analyze how structural features affect readers' and listeners' understanding and appreciation of text.
2 1 Students will listen, speak, read, and write in English for information and understanding.
6 Make and support inferences about information and ideas with reference to features in oral and written text.
2 1 Students will listen, speak, read, and write in English for information and understanding.
1 Identify and use reading and listening strategies to make text comprehensible and meaningful.
2 1 16 Apply learning strategies to acquire information and make texts comprehensible and meaningful.
2 3 9 Apply learning strategies to examine, interpret, analyze, synthesize, and evaluate a variety of materials.
2 3 2 Assess, compare, and evaluate the quality of spoken or written texts and visual presentations, using different criteria related to the organization, subject area, and purpose of text.
2 2 Students will listen, speak, read, and write in English for literary response, enjoyment, and expression
4 Locate and identify a wide range of significant literary elements and techniques in texts and use those elements to interpret the work, comparing and contrasting the work to other works and to student's own experiences.
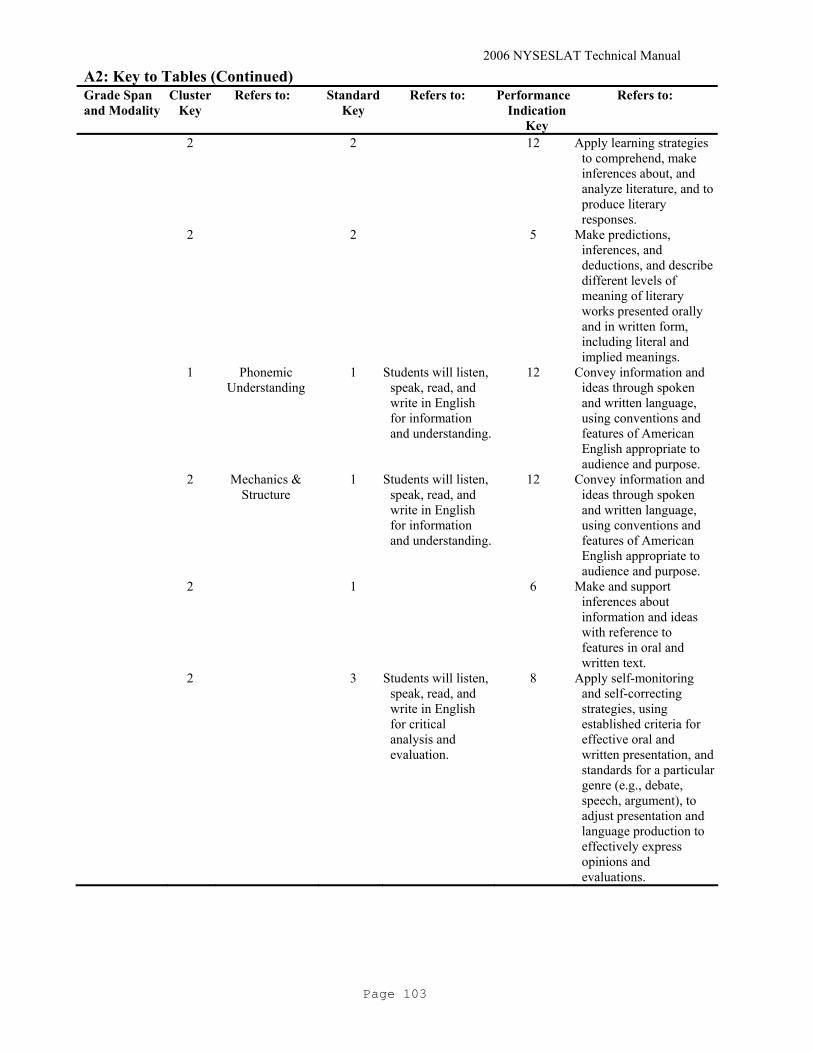
2006 NYSESLAT Technical Manual
Page 103
A2: Key to Tables (Continued) Grade Span and Modality
Cluster Key
Refers to: Standard Key
Refers to: Performance Indication
Key
Refers to:
2 2 12 Apply learning strategies to comprehend, make inferences about, and analyze literature, and to produce literary responses.
2 2 5 Make predictions, inferences, and deductions, and describe different levels of meaning of literary works presented orally and in written form, including literal and implied meanings.
1 Phonemic Understanding
1 Students will listen, speak, read, and write in English for information and understanding.
12 Convey information and ideas through spoken and written language, using conventions and features of American English appropriate to audience and purpose.
2 Mechanics & Structure
1 Students will listen, speak, read, and write in English for information and understanding.
12 Convey information and ideas through spoken and written language, using conventions and features of American English appropriate to audience and purpose.
2 1 6 Make and support inferences about information and ideas with reference to features in oral and written text.
2 3 Students will listen, speak, read, and write in English for critical analysis and evaluation.
8 Apply self-monitoring and self-correcting strategies, using established criteria for effective oral and written presentation, and standards for a particular genre (e.g., debate, speech, argument), to adjust presentation and language production to effectively express opinions and evaluations.
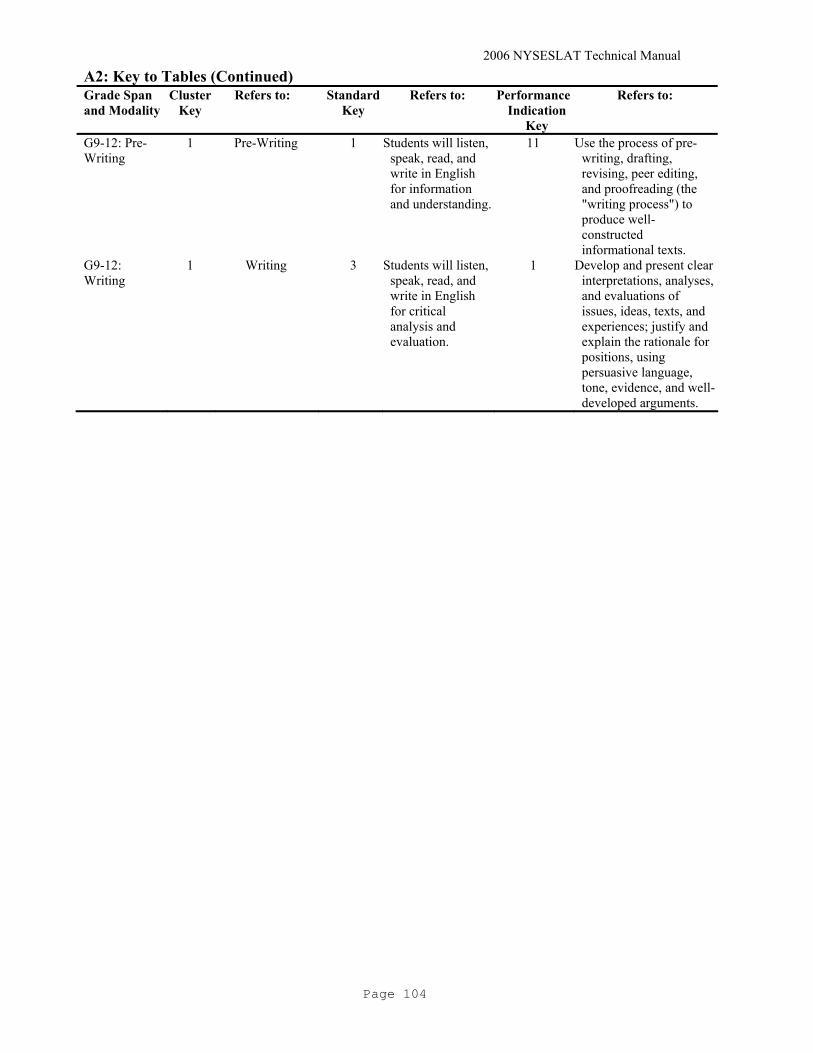
2006 NYSESLAT Technical Manual
Page 104
A2: Key to Tables (Continued) Grade Span and Modality
Cluster Key
Refers to: Standard Key
Refers to: Performance Indication
Key
Refers to:
G9-12: Pre-Writing
1 Pre-Writing 1 Students will listen, speak, read, and write in English for information and understanding.
11 Use the process of pre-writing, drafting, revising, peer editing, and proofreading (the "writing process") to produce well-constructed informational texts.
G9-12: Writing
1 Writing 3 Students will listen, speak, read, and write in English for critical analysis and evaluation.
1 Develop and present clear interpretations, analyses, and evaluations of issues, ideas, texts, and experiences; justify and explain the rationale for positions, using persuasive language, tone, evidence, and well-developed arguments.
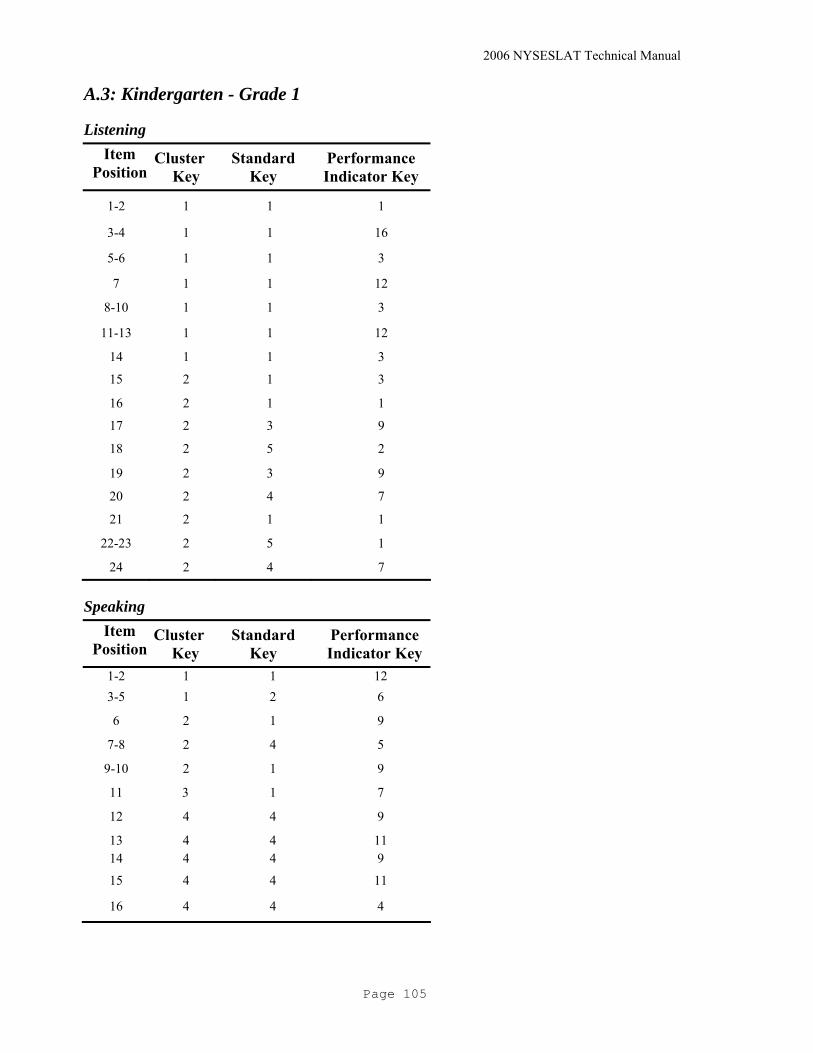
2006 NYSESLAT Technical Manual
Page 105
A.3: Kindergarten - Grade 1
Listening Item
Position Cluster
Key Standard
Key Performance Indicator Key
1-2 1 1 1
3-4 1 1 16
5-6 1 1 3
7 1 1 12
8-10 1 1 3
11-13 1 1 12
14 1 1 3
15 2 1 3
16 2 1 1
17 2 3 9
18 2 5 2
19 2 3 9
20 2 4 7
21 2 1 1
22-23 2 5 1
24 2 4 7
Speaking Item
Position Cluster
Key Standard
Key Performance Indicator Key
1-2 1 1 12 3-5 1 2 6
6 2 1 9
7-8 2 4 5
9-10 2 1 9
11 3 1 7
12 4 4 9
13 4 4 11 14 4 4 9
15 4 4 11
16 4 4 4

2006 NYSESLAT Technical Manual
Page 106
A.3: Kindergarten - Grade 1
Reading Item
Position Cluster
Key Standard
Key Performance Indicator Key
1-3 1 1 1
4-7 1 1 5
8 1 1 16
9-10 1 1 1
11 1 1 5
12-13 2 2 2
14-15 3 1 16
Writing Conventions Item
Position Cluster
Key Standard
Key Performance Indicator Key
1-7 1 1 12
8 1 1 15
9 2 3 5 10 2 3. 8
Writing Item
Position Cluster
Key Standard
Key Performance Indicator Key
1-4 1 1 12 5-8 1 1 11
9 2 3 1

2006 NYSESLAT Technical Manual
Page 107
A.4: Grade 2 - Grade 4
Listening Item
Position Cluster
Key Standard
Key Performance Indicator Key
1-4 1 1 1 5-6 1 1 16 7 2 1 16 8 2 3 9
9-12 2 1 3 13 2 5 2 14 2 5 6 15 2 3 3 16 2 3 1
17 2 5 4
18 2 5 2
19 2 3 3 20-21 2 1 1
22 3 4 3
23 3 4 7
24 3 4 8
25 3 4 3
26 3 4 7
Speaking Item
Position Cluster
Key Standard
Key Performance Indicator Key
1-2 1 1 12 3-5 1 2 6
6 2 1 9
7-8 2 1 12 9 2 4 9
10 2 5 2
11 3 1 7 12 4 4 3
13 4 4 8
14-15 4 4 3 16 4 4 2

2006 NYSESLAT Technical Manual
Page 108
A.4: Grade 2 - Grade 4
Reading Item
Position Cluster
Key Standard
Key Performance Indicator Key
1-5 1 1 1 6 1 1 16 7 1 1 16 8 1 1 16 9 1 1 3
10-11 2 1 1 12 2 1 6
13-14 2 1 1 15 2 3 3
16-17 2 1 1 18 2 3 3 19 2 1 6
20 2 3 5
21-22 2 2 2 23 2 2 5
24-25 2 2 2 26 2 2. 12
Writing Conventions Item
Position Cluster
Key Standard
Key Performance Indicator Key
1-3 1 1 16 4 1 1 12
5 2 1 5
6-8 2 1 12 9-12 2 3 4
Pre-Writing Item
Position Cluster
Key Standard
Key Performance Indicator Key
1-3 1 1 11

2006 NYSESLAT Technical Manual
Page 109
A.4: Grade 2 - Grade 4
Writing Item
Position Cluster Key Standard Key
Performance Indicator Key
1 1 3 1
A.5: Grade 5 - Grade 6
Listening Item
Position Cluster
Key Standard
Key Performance Indicator Key
1 1 1 1 2 1 1 16.
3 1 1 1
4 1 1 5
5 1 1 1
6 2 4 10 7 2 5 1 8 2 1 1 9 2 3 3
10 2 5 1 11 2 1 1 12 2 4 9 13 2 5 2
14 2 4 10
15 2 5 4 16-17 2 4 4
18 3 4 7
19 3 4 8
20 3 4 9
21 3 4 4
22 3 4 7
23 3 4 8
24 3 4 9
25-26 3 4 4
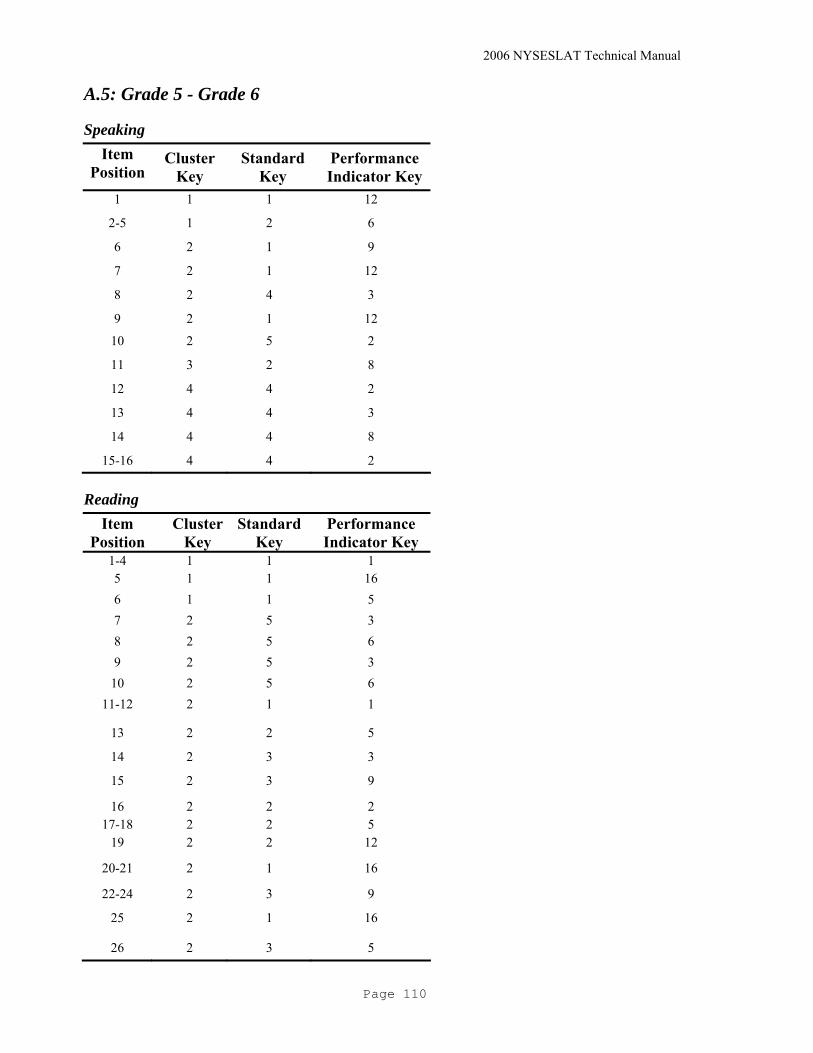
2006 NYSESLAT Technical Manual
Page 110
A.5: Grade 5 - Grade 6
Speaking Item
Position Cluster
Key Standard
Key Performance Indicator Key
1 1 1 12
2-5 1 2 6
6 2 1 9
7 2 1 12
8 2 4 3
9 2 1 12
10 2 5 2
11 3 2 8
12 4 4 2
13 4 4 3
14 4 4 8
15-16 4 4 2
Reading Item
Position Cluster
Key Standard
Key Performance Indicator Key
1-4 1 1 1 5 1 1 16 6 1 1 5 7 2 5 3 8 2 5 6 9 2 5 3
10 2 5 6 11-12 2 1 1
13 2 2 5
14 2 3 3
15 2 3 9
16 2 2 2 17-18 2 2 5
19 2 2 12
20-21 2 1 16 22-24 2 3 9
25 2 1 16
26 2 3 5

2006 NYSESLAT Technical Manual
Page 111
A.5: Grade 5 - Grade 6
Writing Conventions Item
Position Cluster
Key Standard
Key Performance Indicator Key
1 1 1 15
2 1 1 12
3 1 1 1
4 1 1 15
5-9 2 1 12 10 2 3 4
11 2 3 6
12 2 3 4
13 2 3 6
14 2 3 4
15 2 3 6
16 2 3 4
Pre-Writing Item
Position Cluster
Key Standard
Key Performance Indicator Key
1-3 1 1 11
Writing Item
Position Cluster
Key Standard
Key Performance Indicator Key
1 1 3 1

2006 NYSESLAT Technical Manual
Page 112
A.6: Grade 7 - Grade 8
Listening Item
Position Cluster
Key Standard
Key Performance Indicator Key
1-4 1 1 1 5 1 1 16
6 2 1 1
7 2 1 6
8 2 4 7
9 2 4 9
10-12 2 5 4 13-14 2 1 1
15 2 1 10
16 2 1 6
17 2 1 1
18-21 3 4 7
22-24 3 1 1 25-27 3 4 7
Speaking Item
Position Cluster
Key Standard
Key Performance Indicator Key
1 1 1 12 2-5 1 2 6
6-10 2 1 9
11 3 2 8
12-14 4 4 3
15 4 4 9
16 4 4 5

2006 NYSESLAT Technical Manual
Page 113
A.6: Grade 7 - Grade 8
Reading Item
Position Cluster Key Standard Key
Performance Indicator
Key 1-5 1 1 1
6-7 2 1 6
8 2 3 5.
9 2 3 9
10 2 2 12
11-12 2 2 4 13 2 2 12
14 2 3 9
15 2 2 2 16 2 3 9
17 2 2 2
18 2 2 12
19 2 2 2
20 2 1 6
21-22 2 1 16
23 2 1 6
24 2 1 16
25 2 1 1
26 2 2 12
27 2 1 4
28 2 2 5
29 2 2 2
Writing Conventions Item
Position Cluster
Key Standard
Key Performance Indicator Key
1-3 1 1 12 4-7 2 1 12 8 2 1 6
9-16 2 3 8

2006 NYSESLAT Technical Manual
Page 114
A.6: Grade 7 - Grade 8
Pre-Writing Item
Position Cluster
Key Standard
Key Performance Indicator Key
1-3 1 1 11
Writing Item
Position Cluster
Key Standard Key Performance Indicator
1 1 3 1
A.7: Grade 9 - Grade 12
Listening Item
Position Cluster
Key Standard Key Performance Indicator Key
1-5 1 1 1
6-7 2 4 7
8-11 2 1 1
12-13 2 4 7
14-15 2 4 9
16-17 2 1 1
18-19 3 4 7
20 3 1 6
21-22 3 1 1
23 3 4 7
24 3 1 1
25 3 4 7
26 3 1 1
27 3 1 16
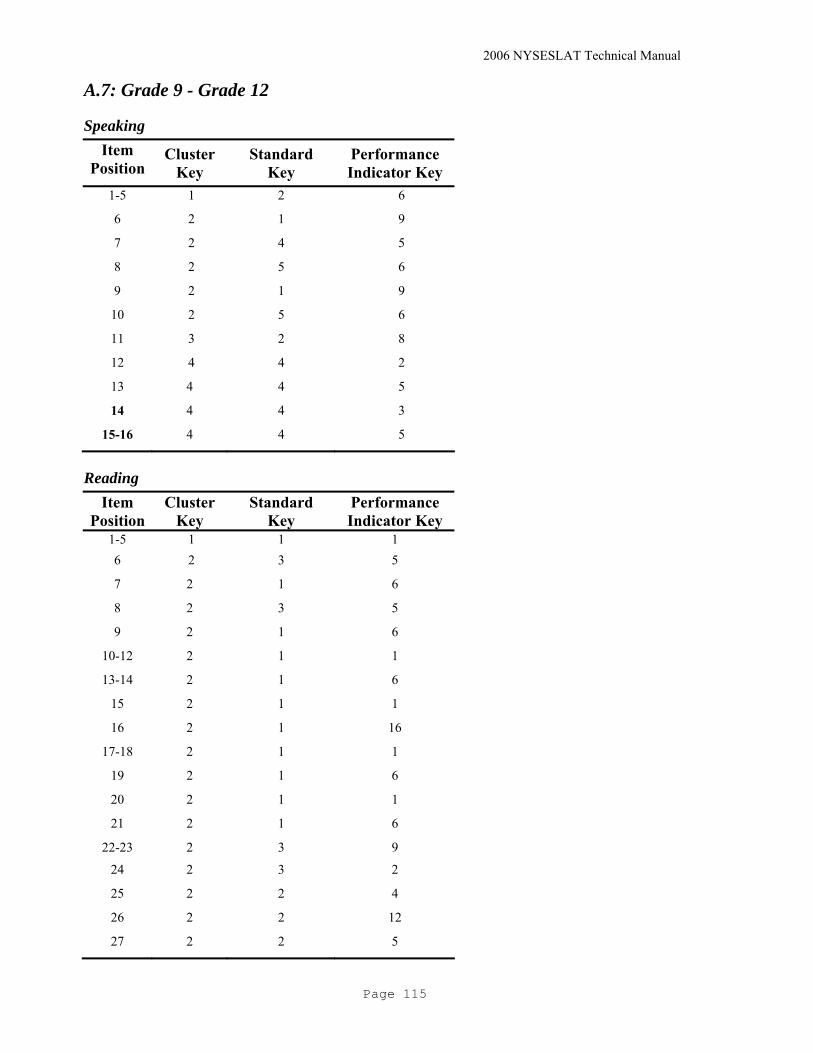
2006 NYSESLAT Technical Manual
Page 115
A.7: Grade 9 - Grade 12
Speaking Item
Position Cluster
Key Standard
Key Performance Indicator Key
1-5 1 2 6
6 2 1 9
7 2 4 5
8 2 5 6
9 2 1 9
10 2 5 6
11 3 2 8
12 4 4 2
13 4 4 5
14 4 4 3
15-16 4 4 5
Reading Item
Position Cluster
Key Standard
Key Performance Indicator Key
1-5 1 1 1 6 2 3 5
7 2 1 6
8 2 3 5
9 2 1 6
10-12 2 1 1
13-14 2 1 6 15 2 1 1
16 2 1 16
17-18 2 1 1 19 2 1 6
20 2 1 1
21 2 1 6
22-23 2 3 9
24 2 3 2
25 2 2 4
26 2 2 12
27 2 2 5

2006 NYSESLAT Technical Manual
Page 116
A.7: Grade 9 - Grade 12
Reading Item
Position Cluster
Key Standard
Key Performance Indicator Key
28 2 1 6
29 2 2 12
Writing Conventions Item
Position Cluster
Key Standard
Key Performance Indicator Key
1-3 1 1 12 4-7 2 1 12 8 2 1 6
9-16 2 3 8
Pre-Writing Item
Position Cluster
Key Standard
Key Performance Indicator Key
1-3 1 1 11
Writing Item
Position Cluster
Key Standard Key Performance Indicator Key
1 1 3 1

2006 NYSESLAT Technical Manual
Page 117
A.8: Item Specs LISTENING: Phonemic Recognition, grades K – 1 The test taker must choose which of three letters represent the first sound in a word. These items measure phonemic discrimination, and are designed especially to test students who are just beginning to learn the sound system in English. Item Component Description of Component
Stimulus --
Stem closed stem question: “What is the first sound in the word
_____?”
Answer options 3 answer options consisting of 3 individual letter graphics
Graphic --
LISTENING: Word/Sentence Comprehension, all grades The test taker hears a question and must choose which of three small graphics represents the correct answer to the question. These items measure comprehension of words, phrases, and sentences, and are designed especially to test students at lower levels of proficiency. Item Component Description of Component
Stimulus --
Stem closed stem question, maximum 15 words: “Which picture
shows _____?” , “Which girl is _____?” , “Which building is where _____?” , etc.
Answer options 3 answer options consisting of 3 small individual graphics lettered A-C
Graphic --
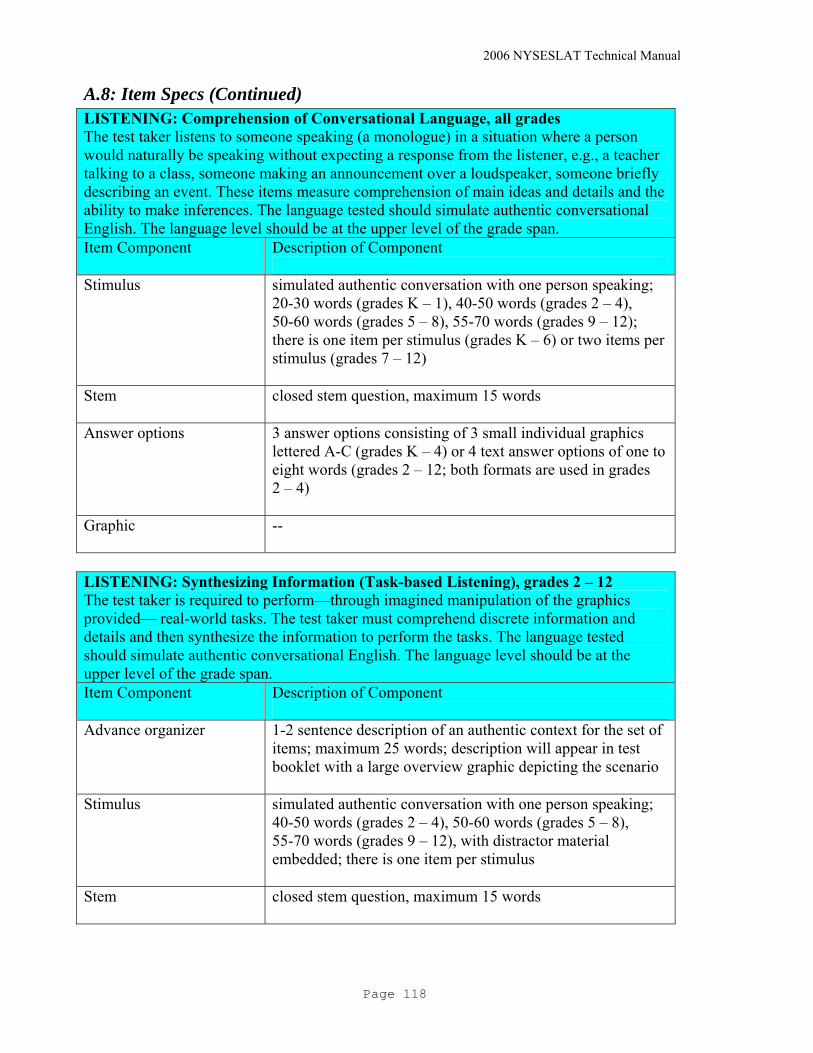
2006 NYSESLAT Technical Manual
Page 118
A.8: Item Specs (Continued) LISTENING: Comprehension of Conversational Language, all grades The test taker listens to someone speaking (a monologue) in a situation where a person would naturally be speaking without expecting a response from the listener, e.g., a teacher talking to a class, someone making an announcement over a loudspeaker, someone briefly describing an event. These items measure comprehension of main ideas and details and the ability to make inferences. The language tested should simulate authentic conversational English. The language level should be at the upper level of the grade span. Item Component Description of Component
Stimulus simulated authentic conversation with one person speaking;
20-30 words (grades K – 1), 40-50 words (grades 2 – 4), 50-60 words (grades 5 – 8), 55-70 words (grades 9 – 12); there is one item per stimulus (grades K – 6) or two items per stimulus (grades 7 – 12)
Stem closed stem question, maximum 15 words
Answer options 3 answer options consisting of 3 small individual graphics lettered A-C (grades K – 4) or 4 text answer options of one to eight words (grades 2 – 12; both formats are used in grades 2 – 4)
Graphic --
LISTENING: Synthesizing Information (Task-based Listening), grades 2 – 12 The test taker is required to perform—through imagined manipulation of the graphics provided— real-world tasks. The test taker must comprehend discrete information and details and then synthesize the information to perform the tasks. The language tested should simulate authentic conversational English. The language level should be at the upper level of the grade span. Item Component Description of Component
Advance organizer 1-2 sentence description of an authentic context for the set of
items; maximum 25 words; description will appear in test booklet with a large overview graphic depicting the scenario
Stimulus simulated authentic conversation with one person speaking; 40-50 words (grades 2 – 4), 50-60 words (grades 5 – 8), 55-70 words (grades 9 – 12), with distractor material embedded; there is one item per stimulus
Stem closed stem question, maximum 15 words

2006 NYSESLAT Technical Manual
Page 119
A.8: Item Specs (Continued) LISTENING: Synthesizing Information (Task-based Listening), grades 2 – 12 The test taker is required to perform—through imagined manipulation of the graphics provided— real-world tasks. The test taker must comprehend discrete information and details and then synthesize the information to perform the tasks. The language tested should simulate authentic conversational English. The language level should be at the upper level of the grade span. Item Component Description of Component
Answer options 4 answer options consisting of either 4 small individual
graphics lettered A-D or 1 large graphic with 4 options lettered A-D
Graphic large overview graphic depicting the scenario and containing elements of the items
READING: Word Reading, grades K – 4 The test taker reads a question, looks at a small graphic, and must choose which of three words correctly identifies the graphic. These items measure word recognition skills. This item type is especially designed to test students at lower levels of proficiency. Item Component Description of Component
Stimulus graphic (below)
Stem closed stem question, maximum 10 words: “What do you
see?” , “What is the boy doing?” (grades K-1), “Which word tells what is in the picture?”, “Which word tells what the girl is holding?” (grades 2-4), etc.
Answer options 3 answer options consisting of 1 word each
Graphic graphic depicting correct answer option

2006 NYSESLAT Technical Manual
Page 120
A.8: Item Specs (Continued) READING: Sentence Reading, grades K – 4 The test taker reads a question that includes a descriptive phrase, or several descriptive sentences followed by a question, and must choose which of three graphics correctly represents what is described. These items measure basic phrase and sentence comprehension. Item Component Description of Component
Stimulus (optional) description of context with distractor material
embedded; maximum 25 words
Stem closed stem question, maximum 10 words: “Which one tells you _____?” , “Which one can you _____?” , etc.
Answer options 3 answer options consisting of 3 small individual graphics
Graphic --
READING: Short Passage with Question, grades K – 1 The test taker reads a brief passage and answers one question about the passage. These items measure comprehension of main ideas and details and the ability to make inferences. Item Component Description of Component
Stimulus fictional, descriptive, informational, or functional passage;
maximum 30 words
Stem closed stem question, maximum 10 words
Answer options 3 answer options consisting of 3 small individual graphics
Graphic --

2006 NYSESLAT Technical Manual
Page 121
A.8: Item Specs (Continued) READING: Word/Sentence Reading, grades 5 – 12 The test taker reads a question that includes a key word or a descriptive phrase, or several descriptive sentences followed by a question, and must choose which of three graphics correctly represents what is named or described. These items measure word recognition skills and basic phrase and sentence comprehension. Item Component Description of Component
Stimulus (optional) description of context with distractor material
embedded; maximum 25 words
Stem closed stem question, maximum 10 words: “Which picture shows _____?” , “Which person is _____?” , etc.
Answer options 3 answer options consisting of 3 small individual graphics
Graphic --
READING: Comprehension, grades 2 – 12 The test taker reads a passage and answers several questions about the passage. These items measure comprehension of main ideas and details, the ability to make inferences, literary analysis skills, the ability to understand how and why information is organized in a passage, and other typical reading comprehension skills. Item Component Description of Component
Stimulus fictional, descriptive, informational, or functional passage;
maximum 200 words (grades 2 – 4), 250 words (grades 5 – 8), or 350 words (grades 9 – 12)
Stem closed stem question, maximum 20 words
Answer options 4 answer options consisting of 1 word, phrase, or sentence each, maximum 15 words
Graphic --

2006 NYSESLAT Technical Manual
Page 122
A.8: Item Specs (Continued) WRITING CONVENTIONS: Phonemic Understanding, grades K – 1 The test taker listens to a question, looks at a small graphic, and must choose which of three letters or letter blends correctly relates to the graphic. These items measure understanding of phonemes as they relate to writing. This item type is especially designed to test students at beginning levels of proficiency, who often read and write based on phonics rules. Item Component Description of Component
Stimulus --
Stem closed stem question: “Which letter(s) begin(s)/end(s) the
word _____?”
Answer options 3 answer options consisting of 1 letter each or 1 letter blend each
Graphic graphic depicting the word that begins or ends with the correct answer option

2006 NYSESLAT Technical Manual
Page 123
A.8: Item Specs (Continued) WRITING CONVENTIONS: Phonemic Understanding, grades K – 12 The test taker reads a question, looks at a small graphic, and must choose which of three words correctly identifies the graphic. These items measure understanding of phonemes as they relate to writing. This item type is especially designed to test students at lower levels of proficiency, who often read and write based on phonics rules. Item Component Description of Component
Stimulus --
Stem closed stem question: “Which word goes with the picture?”
Answer options 3 answer options consisting of 1 word each
Graphic graphic depicting correct answer option
WRITING CONVENTIONS: Mechanics and Structure Type 1, grades K – 12 The test taker must choose which of the options is a correct sentence. These items measure understanding of sentence-level grammar and other writing conventions in English. Item Component Description of Component
Stimulus --
Stem closed stem question: “Which sentence is correct?”
Answer options 3 answer options (grades K – 1) or 4 answer options (grades
2 – 12) consisting of 1 sentence (or sentence fragment) each, maximum 20 words
Graphic --
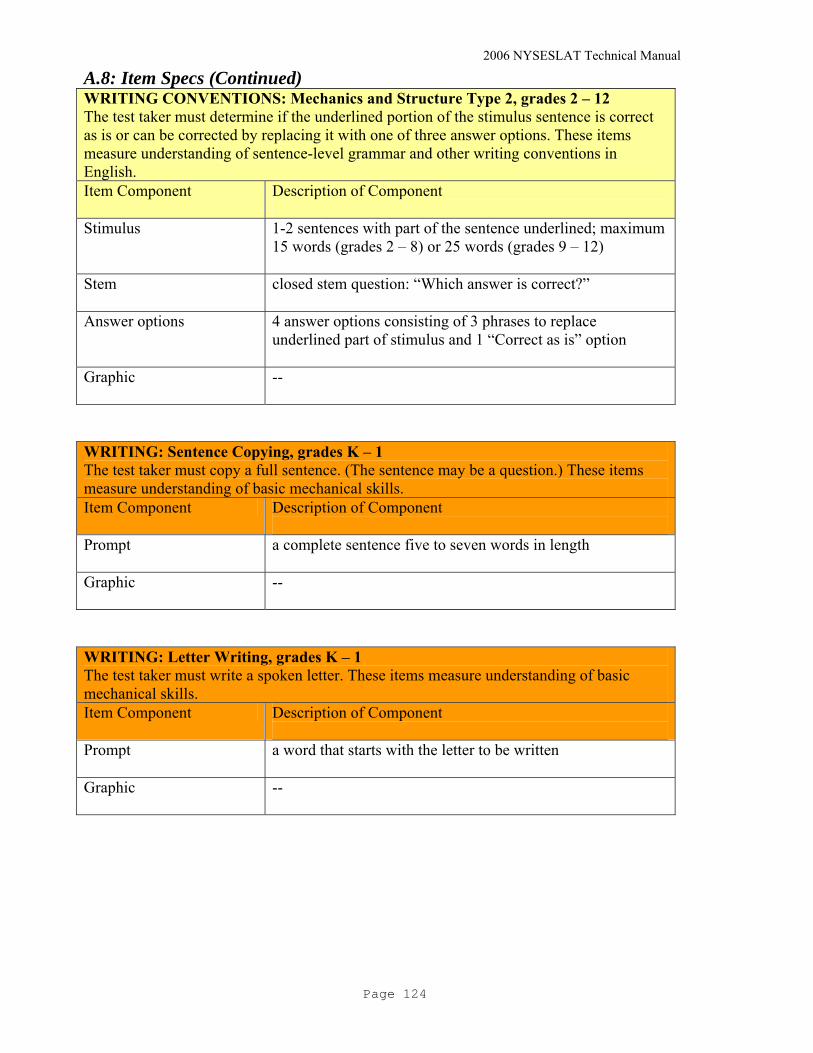
2006 NYSESLAT Technical Manual
Page 124
A.8: Item Specs (Continued) WRITING CONVENTIONS: Mechanics and Structure Type 2, grades 2 – 12 The test taker must determine if the underlined portion of the stimulus sentence is correct as is or can be corrected by replacing it with one of three answer options. These items measure understanding of sentence-level grammar and other writing conventions in English. Item Component Description of Component
Stimulus 1-2 sentences with part of the sentence underlined; maximum
15 words (grades 2 – 8) or 25 words (grades 9 – 12)
Stem closed stem question: “Which answer is correct?”
Answer options 4 answer options consisting of 3 phrases to replace underlined part of stimulus and 1 “Correct as is” option
Graphic --
WRITING: Sentence Copying, grades K – 1 The test taker must copy a full sentence. (The sentence may be a question.) These items measure understanding of basic mechanical skills. Item Component Description of Component
Prompt a complete sentence five to seven words in length
Graphic --
WRITING: Letter Writing, grades K – 1 The test taker must write a spoken letter. These items measure understanding of basic mechanical skills. Item Component Description of Component
Prompt a word that starts with the letter to be written
Graphic --
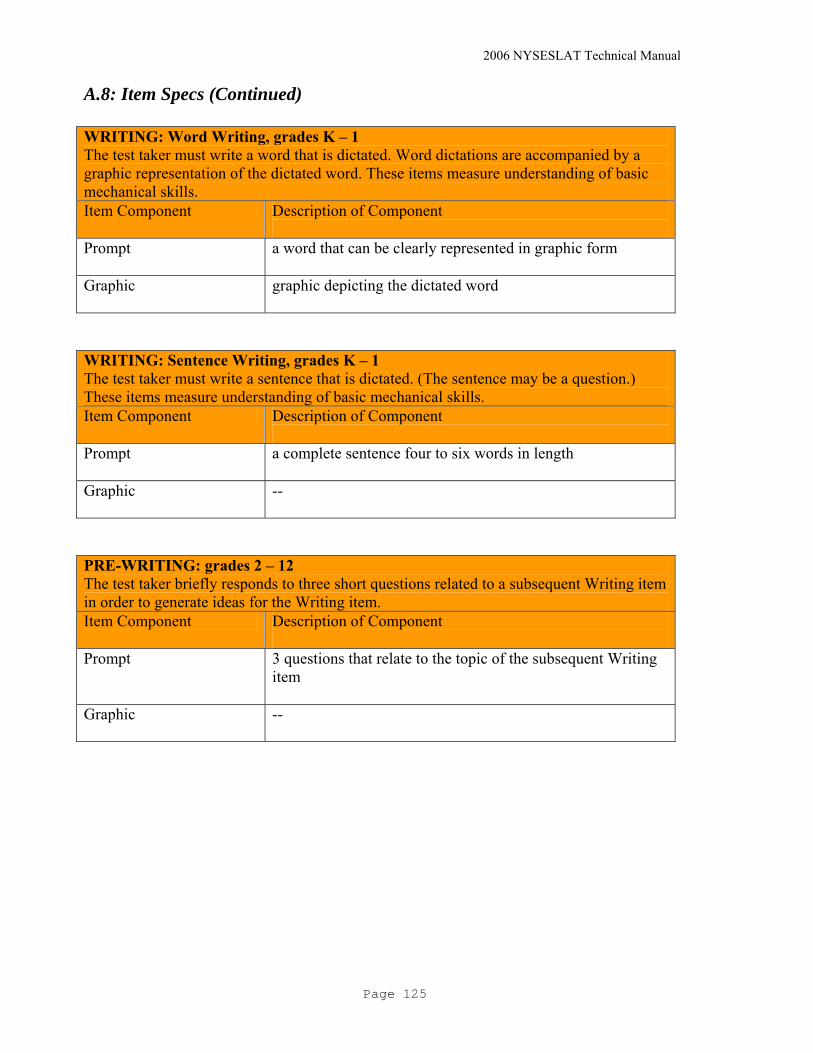
2006 NYSESLAT Technical Manual
Page 125
A.8: Item Specs (Continued) WRITING: Word Writing, grades K – 1 The test taker must write a word that is dictated. Word dictations are accompanied by a graphic representation of the dictated word. These items measure understanding of basic mechanical skills. Item Component Description of Component
Prompt a word that can be clearly represented in graphic form
Graphic graphic depicting the dictated word
WRITING: Sentence Writing, grades K – 1 The test taker must write a sentence that is dictated. (The sentence may be a question.) These items measure understanding of basic mechanical skills. Item Component Description of Component
Prompt a complete sentence four to six words in length
Graphic --
PRE-WRITING: grades 2 – 12 The test taker briefly responds to three short questions related to a subsequent Writing item in order to generate ideas for the Writing item. Item Component Description of Component
Prompt 3 questions that relate to the topic of the subsequent Writing
item
Graphic --

2006 NYSESLAT Technical Manual
Page 126
A.8: Item Specs (Continued) WRITING: Extended Response: Description and/or Narrative, grades K – 6 The test taker describes or tells a story about a picture. This item measures the ability to use vocabulary, grammar, features of extended discourse, and other writing conventions correctly and appropriately in order to describe or to tell a story. Item Component Description of Component
Prompt graphic and directions: “Look at the picture. Write about
what you see in the picture. Tell a story about this picture.”
Graphic 1 large graphic (drawing for K – 1, photograph for 2 – 6)
WRITING: Extended Response: Exposition, grades 7 – 12 The test taker compares and/or discusses activities of a particular type. This item measures the ability to use vocabulary, grammar, features of extended discourse, and other writing conventions correctly and appropriately to write an expository essay. Item Component Description of Component
Prompt graphics and directions: “There are different/many ways to . .
. . Write a well-organized essay that discusses . . . .”
Graphic 2 graphics (photographs) depicting related activities or situations
SPEAKING: Repeat/Read Aloud, all grades The test taker hears and reads a word, phrase, or sentence and then repeats it. These items measure pronunciation and fluency. Item Component Description of Component
Prompt a word, phrase, or sentence, one to six words in length
Graphic --
SPEAKING: Sentence Completion, all grades The test taker hears and reads the beginning of a sentence, and must complete the sentence based on a scenario depicted in an accompanying graphic. These items measure the ability to use vocabulary and grammar correctly and appropriately. Item Component Description of Component
Prompt graphic and beginning of a sentence, maximum 10 words
Graphic graphic depicting a recognizable scene or activity

2006 NYSESLAT Technical Manual
Page 127
A.8: Item Specs (Continued) SPEAKING: Story-Telling, all grades The test taker must present a brief narrative based on three graphics that show a sequence of events. This item measures pronunciation, intonation, rhythm, fluency, and the ability to use vocabulary, grammar, and discourse organizational features correctly and appropriately. Item Component Description of Component
Prompt graphics
Graphic 3 sequenced graphics labeled First (1), Next (2), Last (3)
SPEAKING: Social Interaction, all grades The test taker responds to a question or statement as though in an actual conversation. These items measure appropriateness of response, as well as pronunciation, intonation, rhythm, fluency, and the ability to use vocabulary and grammar correctly. Item Component Description of Component
Prompt a question or statement, maximum 10 words, requiring a
rejoinder
Graphic --

2006 NYSESLAT Technical Manual
Page 128
APPENDIX B: ITEM LEVEL STATISTICS BY GRADE SPAN
B.1: Kindergarten – Grade 1
Listening and Speaking Item
Number Item
Format Max
Points N
Count
% at 0
% at 1
% at 2
% at 3
% at 4 %
Omit
P-value Point
Biserial
1 MC 1 49663 0.00 94.33 2.52 2.04 0.00 1.11 0.95 0.29 2 MC 1 49555 0.00 3.51 3.73 91.40 0.00 1.37 0.93 0.35 3 MC 1 49471 0.00 2.11 94.18 2.28 0.00 1.44 0.95 0.40 4 MC 1 49745 0.00 1.63 96.23 1.23 0.00 0.91 0.97 0.37 5 MC 1 49896 0.00 1.29 1.30 96.81 0.00 0.59 0.97 0.39 6 MC 1 49847 0.00 96.52 1.33 1.45 0.00 0.70 0.97 0.37 7 MC 1 49906 0.00 1.42 9.99 88.01 0.00 0.57 0.88 0.34 8 MC 1 49911 0.00 3.81 0.65 94.99 0.00 0.55 0.95 0.30 9 MC 1 49850 0.00 2.44 94.26 2.64 0.00 0.67 0.95 0.48
10 MC 1 49931 0.00 2.85 1.99 94.61 0.00 0.55 0.95 0.46 11 MC 1 49826 0.00 92.89 2.64 3.74 0.00 0.73 0.94 0.46 12 MC 1 49765 0.00 2.44 3.74 92.96 0.00 0.86 0.94 0.50 13 MC 1 49941 0.00 97.90 0.57 1.01 0.00 0.51 0.98 0.25 14 MC 1 49869 0.00 1.59 17.60 80.11 0.00 0.70 0.81 0.48 15 MC 1 49705 0.00 35.39 53.93 9.63 0.00 1.05 0.54 0.35 16 MC 1 49833 0.00 6.64 6.00 86.62 0.00 0.75 0.87 0.36 17 MC 1 49806 0.00 7.67 75.09 16.40 0.00 0.84 0.76 0.32 18 MC 1 49715 0.00 74.57 10.13 14.10 0.00 1.21 0.75 0.28 19 MC 1 49733 0.00 14.41 71.60 13.06 0.00 0.93 0.72 0.40 20 MC 1 49756 0.00 6.75 5.19 87.12 0.00 0.94 0.88 0.37 21 MC 1 49660 0.00 67.71 7.31 23.82 0.00 1.17 0.68 0.38 22 MC 1 49801 0.00 11.11 83.62 4.38 0.00 0.89 0.84 0.39 23 MC 1 49695 0.00 69.64 8.48 20.77 0.00 1.11 0.70 0.26
LI
24 MC 1 49610 0.00 16.53 78.60 3.65 0.00 1.22 0.79 0.37 1 SS 2 50164 1.56 8.41 90.02 0.00 0.00 0.00 0.94 0.58 2 SS 2 50163 1.70 10.67 87.62 0.00 0.00 0.01 0.93 0.58 3 SS 2 50160 5.64 12.46 81.90 0.00 0.00 0.01 0.88 0.58 4 SS 2 50164 3.28 19.97 76.75 0.00 0.00 0.00 0.87 0.66 5 SS 2 50163 5.09 25.57 69.34 0.00 0.00 0.01 0.82 0.71 6 SS 2 50161 9.14 31.16 59.69 0.00 0.00 0.01 0.75 0.74 7 SS 2 50162 6.75 21.06 72.18 0.00 0.00 0.01 0.83 0.75 8 SS 2 50163 6.22 13.39 80.39 0.00 0.00 0.01 0.87 0.72 9 SS 2 50162 8.37 39.13 52.49 0.00 0.00 0.01 0.72 0.70
10 SS 2 50163 8.14 32.02 59.84 0.00 0.00 0.01 0.76 0.74 11 SE 4 50148 6.16 6.15 22.03 34.61 31.01 0.04 0.70 0.82 12 SS 2 50154 7.55 15.88 76.54 0.00 0.00 0.02 0.85 0.74 13 SS 2 50154 13.52 19.12 67.34 0.00 0.00 0.02 0.77 0.76 14 SS 2 50154 8.53 17.62 73.83 0.00 0.00 0.02 0.83 0.72 15 SS 2 50154 12.62 20.19 67.17 0.00 0.00 0.02 0.77 0.74
SP
16 SS 2 50153 18.25 25.15 56.57 0.00 0.00 0.03 0.69 0.70 Note. The data file used in Table B.1 to B.5 were based on the final research file (N=197,034) after cleaning (remove duplicate cases, off-level cases, and all records with Strand Raw Score = 0 or greater than 900).

2006 NYSESLAT Technical Manual
Page 129
B.1: Kindergarten – Grade 1
Reading and Writing Item
Number Item
Format Max
Points N
Count
% at 0
% at 1
% at 2
% at 3
% at 4 %
Omit
P-value Point
Biserial1 MC 1 49370 0.00 82.85 9.93 5.63 0.00 1.59 0.84 0.40 2 MC 1 49834 0.00 77.02 17.56 4.76 0.00 0.67 0.77 0.42 3 MC 1 49759 0.00 13.74 9.34 76.10 0.00 0.81 0.77 0.59 4 MC 1 49520 0.00 71.47 13.92 13.34 0.00 1.27 0.72 0.43 5 MC 1 49502 0.00 55.90 12.19 30.59 0.00 1.31 0.57 0.17 6 MC 1 49399 0.00 18.35 63.10 17.02 0.00 1.52 0.64 0.54 7 MC 1 49229 0.00 61.52 19.63 17.00 0.00 1.85 0.63 0.43 8 MC 1 49269 0.00 69.35 18.02 10.86 0.00 1.78 0.71 0.44 9 MC 1 49488 0.00 14.91 6.22 77.53 0.00 1.35 0.79 0.57
10 MC 1 49432 0.00 17.73 74.52 6.28 0.00 1.46 0.76 0.60 11 MC 1 49187 0.00 14.73 9.02 74.29 0.00 1.96 0.76 0.60 12 MC 1 49040 0.00 9.23 74.79 13.68 0.00 2.30 0.76 0.43 13 MC 1 48896 0.00 19.09 33.64 44.72 0.00 2.55 0.46 0.49 14 MC 1 48785 0.00 35.50 47.13 14.58 0.00 2.79 0.48 0.42
RD
15 MC 1 48657 0.00 24.24 22.88 49.85 0.00 3.04 0.51 0.39 1 MC 1 49853 0.00 91.80 3.46 4.13 0.00 0.61 0.92 0.37 2 MC 1 49840 0.00 17.24 77.91 4.22 0.00 0.63 0.78 0.50 3 MC 1 49856 0.00 8.14 10.50 80.77 0.00 0.59 0.81 0.50 4 MC 1 49804 0.00 12.28 83.46 3.57 0.00 0.70 0.84 0.51 5 MC 1 49792 0.00 19.01 4.67 75.57 0.00 0.74 0.76 0.53 6 MC 1 49663 0.00 88.27 5.42 5.35 0.00 0.97 0.89 0.42 7 MC 1 49528 0.00 24.72 63.16 10.85 0.00 1.27 0.64 0.45 8 MC 1 49243 0.00 14.02 66.71 17.45 0.00 1.83 0.68 0.57 9 MC 1 48860 0.00 27.99 21.26 48.12 0.00 2.63 0.49 0.56
10 MC 1 48467 0.00 22.31 56.09 18.21 0.00 3.39 0.58 0.55 11 CR 2 50093 3.55 34.79 61.58 0.00 0.00 0.08 0.79 0.52 12 CR 2 50094 3.21 25.94 70.78 0.00 0.00 0.08 0.84 0.38 13 CR 2 50097 10.44 2.73 86.75 0.00 0.00 0.07 0.88 0.52 14 CR 2 50097 7.08 1.49 91.36 0.00 0.00 0.07 0.92 0.46 15 CR 2 50097 9.45 21.03 69.45 0.00 0.00 0.07 0.80 0.70 16 CR 2 50097 9.81 39.09 51.03 0.00 0.00 0.07 0.71 0.78 17 CR 2 50096 35.29 30.54 34.09 0.00 0.00 0.07 0.49 0.83 18 CR 2 50096 33.60 33.41 32.92 0.00 0.00 0.07 0.50 0.83
WR
19 ER 2 50093 40.41 33.33 26.18 0.00 0.00 0.08 0.43 0.81

2006 NYSESLAT Technical Manual
Page 130
B.2: Grade 2 – Grade 4
Listening and Speaking Item
Number Item
Format Max
Points N
Count
% at 0
% at 1
% at 2
% at 3
% at 4%
Omit
P-value Point
Biserial
1 MC 1 57061 0.00 6.19 26.64 66.59 0.00 0.58 0.67 0.33 2 MC 1 57187 0.00 1.59 96.06 1.99 0.00 0.35 0.96 0.47 3 MC 1 57163 0.00 7.05 7.35 85.15 0.00 0.45 0.85 0.39 4 MC 1 57156 0.00 87.77 6.65 5.19 0.00 0.40 0.88 0.52 5 MC 1 57149 0.00 1.82 95.36 2.44 0.00 0.38 0.96 0.35 6 MC 1 57162 0.00 21.09 74.46 4.09 0.00 0.36 0.75 0.40 7 MC 1 57148 0.00 89.94 2.13 7.51 0.00 0.42 0.90 0.45 8 MC 1 57173 0.00 1.80 96.55 1.31 0.00 0.34 0.97 0.39 9 MC 1 57171 0.00 92.51 3.67 3.46 0.00 0.36 0.93 0.46
10 MC 1 57162 0.00 4.58 87.53 7.56 0.00 0.33 0.88 0.48 11 MC 1 57156 0.00 3.04 89.03 7.58 0.00 0.36 0.89 0.53 12 MC 1 57116 0.00 67.24 10.94 21.40 0.00 0.42 0.67 0.37 13 MC 1 57060 0.00 4.55 3.11 4.57 87.15 0.61 0.88 0.38 14 MC 1 57026 0.00 3.91 4.15 86.61 4.71 0.61 0.87 0.50 15 MC 1 57083 0.00 3.01 8.85 79.27 8.36 0.51 0.80 0.35 16 MC 1 57012 0.00 7.01 77.13 8.10 7.11 0.66 0.78 0.46 17 MC 1 57030 0.00 11.14 7.20 75.76 5.28 0.62 0.76 0.40 18 MC 1 57030 0.00 7.65 3.90 4.81 82.95 0.70 0.83 0.53 19 MC 1 57013 0.00 80.88 11.67 3.42 3.38 0.64 0.81 0.52 20 MC 1 56959 0.00 14.58 53.52 17.00 14.14 0.75 0.54 0.33 21 MC 1 56950 0.00 13.17 14.06 51.18 20.78 0.81 0.52 0.29 22 MC 1 56986 0.00 4.87 61.73 6.16 26.46 0.77 0.62 0.21 23 MC 1 57000 0.00 6.48 9.31 4.49 78.98 0.74 0.79 0.48 24 MC 1 56980 0.00 11.94 5.16 74.39 7.80 0.71 0.75 0.45 25 MC 1 56558 0.00 16.22 9.64 57.73 14.91 1.49 0.59 0.40
LI
26 MC 1 56573 0.00 3.46 2.68 11.15 81.30 1.41 0.82 0.22 1 SS 2 57326 1.04 2.92 96.03 0.00 0.00 0.01 0.98 0.55 2 SS 2 57325 1.33 5.50 93.16 0.00 0.00 0.01 0.96 0.63 3 SS 2 57325 1.29 11.00 87.70 0.00 0.00 0.01 0.93 0.63 4 SS 2 57323 1.66 9.84 88.49 0.00 0.00 0.01 0.93 0.68 5 SS 2 57325 1.21 3.36 95.42 0.00 0.00 0.01 0.97 0.58 6 SS 2 57323 5.72 17.34 76.92 0.00 0.00 0.01 0.86 0.76 7 SS 2 57326 7.47 20.29 72.24 0.00 0.00 0.01 0.82 0.75 8 SS 2 57325 5.92 16.97 77.11 0.00 0.00 0.01 0.86 0.75 9 SS 2 57326 4.45 23.55 72.00 0.00 0.00 0.01 0.84 0.73
10 SS 2 57319 4.14 11.98 83.86 0.00 0.00 0.02 0.90 0.76 11 SE 4 57319 4.74 2.93 14.22 34.16 43.93 0.02 0.77 0.82 12 SS 2 57315 6.94 9.87 83.17 0.00 0.00 0.02 0.88 0.76 13 SS 2 57317 4.19 9.49 86.30 0.00 0.00 0.02 0.91 0.75 14 SS 2 57316 4.68 14.34 80.96 0.00 0.00 0.02 0.88 0.75 15 SS 2 57314 8.93 18.30 72.75 0.00 0.00 0.03 0.82 0.73
SP
16 SS 2 57313 6.28 14.66 79.03 0.00 0.00 0.03 0.86 0.76
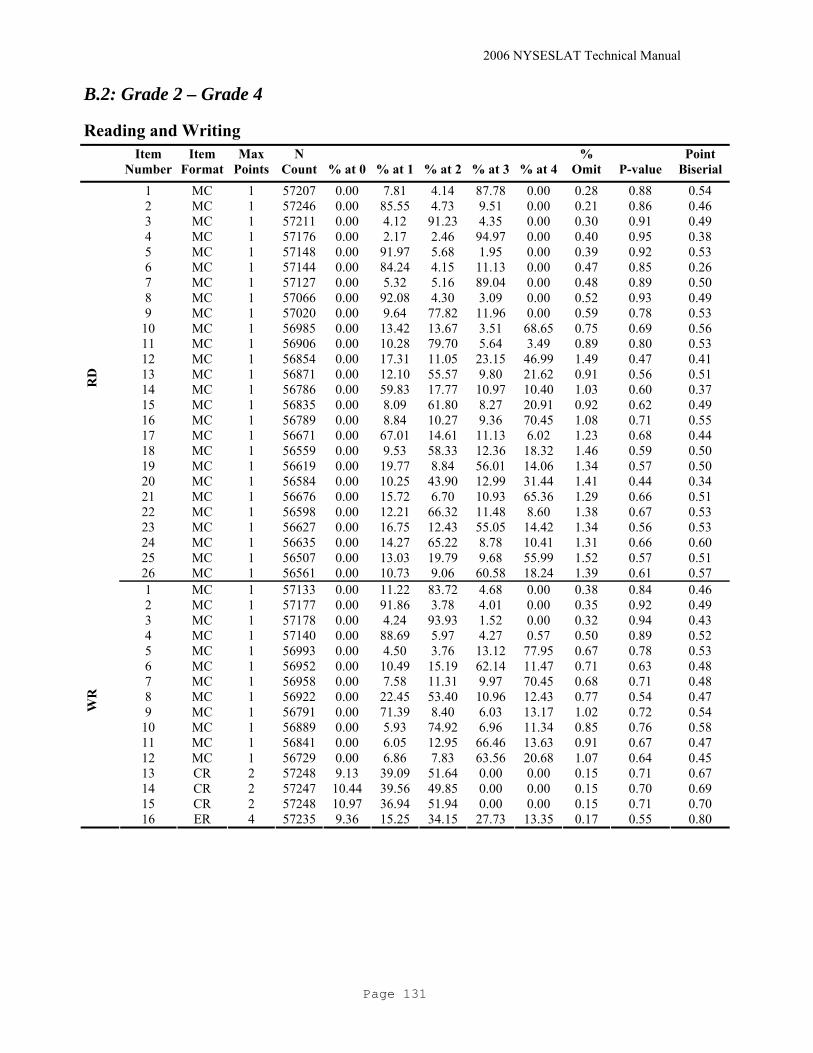
2006 NYSESLAT Technical Manual
Page 131
B.2: Grade 2 – Grade 4
Reading and Writing Item
Number Item
Format Max
Points N
Count
% at 0
% at 1
% at 2
% at 3
% at 4%
Omit
P-value Point
Biserial
1 MC 1 57207 0.00 7.81 4.14 87.78 0.00 0.28 0.88 0.54 2 MC 1 57246 0.00 85.55 4.73 9.51 0.00 0.21 0.86 0.46 3 MC 1 57211 0.00 4.12 91.23 4.35 0.00 0.30 0.91 0.49 4 MC 1 57176 0.00 2.17 2.46 94.97 0.00 0.40 0.95 0.38 5 MC 1 57148 0.00 91.97 5.68 1.95 0.00 0.39 0.92 0.53 6 MC 1 57144 0.00 84.24 4.15 11.13 0.00 0.47 0.85 0.26 7 MC 1 57127 0.00 5.32 5.16 89.04 0.00 0.48 0.89 0.50 8 MC 1 57066 0.00 92.08 4.30 3.09 0.00 0.52 0.93 0.49 9 MC 1 57020 0.00 9.64 77.82 11.96 0.00 0.59 0.78 0.53
10 MC 1 56985 0.00 13.42 13.67 3.51 68.65 0.75 0.69 0.56 11 MC 1 56906 0.00 10.28 79.70 5.64 3.49 0.89 0.80 0.53 12 MC 1 56854 0.00 17.31 11.05 23.15 46.99 1.49 0.47 0.41 13 MC 1 56871 0.00 12.10 55.57 9.80 21.62 0.91 0.56 0.51 14 MC 1 56786 0.00 59.83 17.77 10.97 10.40 1.03 0.60 0.37 15 MC 1 56835 0.00 8.09 61.80 8.27 20.91 0.92 0.62 0.49 16 MC 1 56789 0.00 8.84 10.27 9.36 70.45 1.08 0.71 0.55 17 MC 1 56671 0.00 67.01 14.61 11.13 6.02 1.23 0.68 0.44 18 MC 1 56559 0.00 9.53 58.33 12.36 18.32 1.46 0.59 0.50 19 MC 1 56619 0.00 19.77 8.84 56.01 14.06 1.34 0.57 0.50 20 MC 1 56584 0.00 10.25 43.90 12.99 31.44 1.41 0.44 0.34 21 MC 1 56676 0.00 15.72 6.70 10.93 65.36 1.29 0.66 0.51 22 MC 1 56598 0.00 12.21 66.32 11.48 8.60 1.38 0.67 0.53 23 MC 1 56627 0.00 16.75 12.43 55.05 14.42 1.34 0.56 0.53 24 MC 1 56635 0.00 14.27 65.22 8.78 10.41 1.31 0.66 0.60 25 MC 1 56507 0.00 13.03 19.79 9.68 55.99 1.52 0.57 0.51
RD
26 MC 1 56561 0.00 10.73 9.06 60.58 18.24 1.39 0.61 0.57 1 MC 1 57133 0.00 11.22 83.72 4.68 0.00 0.38 0.84 0.46 2 MC 1 57177 0.00 91.86 3.78 4.01 0.00 0.35 0.92 0.49 3 MC 1 57178 0.00 4.24 93.93 1.52 0.00 0.32 0.94 0.43 4 MC 1 57140 0.00 88.69 5.97 4.27 0.57 0.50 0.89 0.52 5 MC 1 56993 0.00 4.50 3.76 13.12 77.95 0.67 0.78 0.53 6 MC 1 56952 0.00 10.49 15.19 62.14 11.47 0.71 0.63 0.48 7 MC 1 56958 0.00 7.58 11.31 9.97 70.45 0.68 0.71 0.48 8 MC 1 56922 0.00 22.45 53.40 10.96 12.43 0.77 0.54 0.47 9 MC 1 56791 0.00 71.39 8.40 6.03 13.17 1.02 0.72 0.54
10 MC 1 56889 0.00 5.93 74.92 6.96 11.34 0.85 0.76 0.58 11 MC 1 56841 0.00 6.05 12.95 66.46 13.63 0.91 0.67 0.47 12 MC 1 56729 0.00 6.86 7.83 63.56 20.68 1.07 0.64 0.45 13 CR 2 57248 9.13 39.09 51.64 0.00 0.00 0.15 0.71 0.67 14 CR 2 57247 10.44 39.56 49.85 0.00 0.00 0.15 0.70 0.69 15 CR 2 57248 10.97 36.94 51.94 0.00 0.00 0.15 0.71 0.70
WR
16 ER 4 57235 9.36 15.25 34.15 27.73 13.35 0.17 0.55 0.80
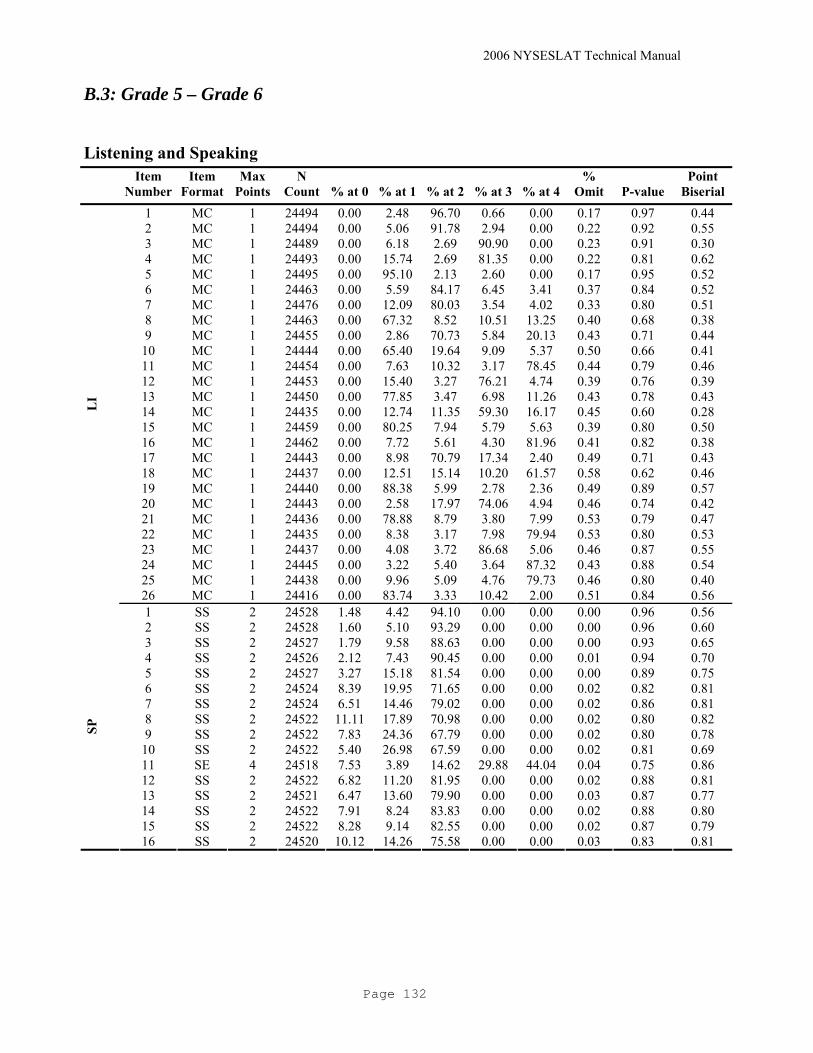
2006 NYSESLAT Technical Manual
Page 132
B.3: Grade 5 – Grade 6
Listening and Speaking Item
Number Item
Format Max
Points N
Count
% at 0
% at 1
% at 2
% at 3
% at 4%
Omit
P-value Point
Biserial
1 MC 1 24494 0.00 2.48 96.70 0.66 0.00 0.17 0.97 0.44 2 MC 1 24494 0.00 5.06 91.78 2.94 0.00 0.22 0.92 0.55 3 MC 1 24489 0.00 6.18 2.69 90.90 0.00 0.23 0.91 0.30 4 MC 1 24493 0.00 15.74 2.69 81.35 0.00 0.22 0.81 0.62 5 MC 1 24495 0.00 95.10 2.13 2.60 0.00 0.17 0.95 0.52 6 MC 1 24463 0.00 5.59 84.17 6.45 3.41 0.37 0.84 0.52 7 MC 1 24476 0.00 12.09 80.03 3.54 4.02 0.33 0.80 0.51 8 MC 1 24463 0.00 67.32 8.52 10.51 13.25 0.40 0.68 0.38 9 MC 1 24455 0.00 2.86 70.73 5.84 20.13 0.43 0.71 0.44
10 MC 1 24444 0.00 65.40 19.64 9.09 5.37 0.50 0.66 0.41 11 MC 1 24454 0.00 7.63 10.32 3.17 78.45 0.44 0.79 0.46 12 MC 1 24453 0.00 15.40 3.27 76.21 4.74 0.39 0.76 0.39 13 MC 1 24450 0.00 77.85 3.47 6.98 11.26 0.43 0.78 0.43 14 MC 1 24435 0.00 12.74 11.35 59.30 16.17 0.45 0.60 0.28 15 MC 1 24459 0.00 80.25 7.94 5.79 5.63 0.39 0.80 0.50 16 MC 1 24462 0.00 7.72 5.61 4.30 81.96 0.41 0.82 0.38 17 MC 1 24443 0.00 8.98 70.79 17.34 2.40 0.49 0.71 0.43 18 MC 1 24437 0.00 12.51 15.14 10.20 61.57 0.58 0.62 0.46 19 MC 1 24440 0.00 88.38 5.99 2.78 2.36 0.49 0.89 0.57 20 MC 1 24443 0.00 2.58 17.97 74.06 4.94 0.46 0.74 0.42 21 MC 1 24436 0.00 78.88 8.79 3.80 7.99 0.53 0.79 0.47 22 MC 1 24435 0.00 8.38 3.17 7.98 79.94 0.53 0.80 0.53 23 MC 1 24437 0.00 4.08 3.72 86.68 5.06 0.46 0.87 0.55 24 MC 1 24445 0.00 3.22 5.40 3.64 87.32 0.43 0.88 0.54 25 MC 1 24438 0.00 9.96 5.09 4.76 79.73 0.46 0.80 0.40
LI
26 MC 1 24416 0.00 83.74 3.33 10.42 2.00 0.51 0.84 0.56 1 SS 2 24528 1.48 4.42 94.10 0.00 0.00 0.00 0.96 0.56 2 SS 2 24528 1.60 5.10 93.29 0.00 0.00 0.00 0.96 0.60 3 SS 2 24527 1.79 9.58 88.63 0.00 0.00 0.00 0.93 0.65 4 SS 2 24526 2.12 7.43 90.45 0.00 0.00 0.01 0.94 0.70 5 SS 2 24527 3.27 15.18 81.54 0.00 0.00 0.00 0.89 0.75 6 SS 2 24524 8.39 19.95 71.65 0.00 0.00 0.02 0.82 0.81 7 SS 2 24524 6.51 14.46 79.02 0.00 0.00 0.02 0.86 0.81 8 SS 2 24522 11.11 17.89 70.98 0.00 0.00 0.02 0.80 0.82 9 SS 2 24522 7.83 24.36 67.79 0.00 0.00 0.02 0.80 0.78
10 SS 2 24522 5.40 26.98 67.59 0.00 0.00 0.02 0.81 0.69 11 SE 4 24518 7.53 3.89 14.62 29.88 44.04 0.04 0.75 0.86 12 SS 2 24522 6.82 11.20 81.95 0.00 0.00 0.02 0.88 0.81 13 SS 2 24521 6.47 13.60 79.90 0.00 0.00 0.03 0.87 0.77 14 SS 2 24522 7.91 8.24 83.83 0.00 0.00 0.02 0.88 0.80 15 SS 2 24522 8.28 9.14 82.55 0.00 0.00 0.02 0.87 0.79
SP
16 SS 2 24520 10.12 14.26 75.58 0.00 0.00 0.03 0.83 0.81

2006 NYSESLAT Technical Manual
Page 133
B.3: Grade 5 – Grade 6
Reading and Writing Item
Number Item
Format Max
Points N
Count
% at 0
% at 1
% at 2
% at 3
% at 4%
Omit
P-value Point
Biserial
1 MC 1 24547 0.00 2.88 94.75 2.30 0.00 0.07 0.95 0.36 2 MC 1 24534 0.00 93.31 2.70 3.77 0.00 0.22 0.93 0.47 3 MC 1 24533 0.00 4.68 4.43 90.69 0.00 0.20 0.91 0.50 4 MC 1 24524 0.00 86.90 9.21 3.65 0.00 0.24 0.87 0.44 5 MC 1 24521 0.00 6.22 90.04 3.55 0.00 0.19 0.90 0.41 6 MC 1 24515 0.00 2.79 93.27 3.43 0.29 0.22 0.93 0.38 7 MC 1 24468 0.00 6.53 12.66 75.07 5.28 0.46 0.75 0.51 8 MC 1 24480 0.00 6.07 72.75 5.06 15.72 0.41 0.73 0.55 9 MC 1 24470 0.00 80.46 11.09 4.15 3.80 0.49 0.81 0.61
10 MC 1 24473 0.00 7.25 4.51 84.10 3.70 0.45 0.84 0.46 11 MC 1 24476 0.00 12.08 9.70 8.49 69.31 0.43 0.70 0.58 12 MC 1 24481 0.00 13.95 9.81 68.30 7.54 0.40 0.69 0.58 13 MC 1 24453 0.00 61.17 10.96 10.28 17.09 0.51 0.61 0.49 14 MC 1 24453 0.00 60.82 8.27 21.07 9.35 0.49 0.61 0.54 15 MC 1 24458 0.00 23.76 44.10 13.35 18.32 0.46 0.44 0.34 16 MC 1 24461 0.00 57.89 11.50 22.62 7.51 0.48 0.58 0.54 17 MC 1 24437 0.00 10.56 62.14 11.82 14.87 0.61 0.62 0.56 18 MC 1 24440 0.00 8.49 25.56 4.64 60.69 0.62 0.61 0.45 19 MC 1 24436 0.00 10.65 12.26 59.22 17.28 0.59 0.60 0.48 20 MC 1 24420 0.00 10.45 32.64 18.52 37.74 0.65 0.38 0.43 21 MC 1 24430 0.00 13.78 7.13 57.45 21.00 0.64 0.58 0.35 22 MC 1 24422 0.00 57.55 17.18 13.50 11.14 0.63 0.58 0.56 23 MC 1 24419 0.00 7.94 67.78 11.62 11.99 0.67 0.68 0.53 24 MC 1 24415 0.00 61.45 11.27 15.26 11.34 0.68 0.62 0.52 25 MC 1 24418 0.00 42.47 24.00 23.31 9.58 0.63 0.43 0.29
RD
26 MC 1 24413 0.00 18.29 40.44 16.64 24.00 0.64 0.41 0.35 1 MC 1 24517 0.00 95.37 3.53 0.91 0.00 0.19 0.96 0.41 2 MC 1 24507 0.00 11.30 84.47 3.98 0.00 0.25 0.85 0.45 3 MC 1 24502 0.00 90.30 4.78 4.62 0.00 0.31 0.91 0.47 4 MC 1 24502 0.00 5.00 92.99 1.76 0.00 0.25 0.93 0.44 5 MC 1 24496 0.00 13.86 10.39 67.88 7.54 0.32 0.68 0.40 6 MC 1 24484 0.00 4.10 6.51 10.20 78.86 0.34 0.79 0.53 7 MC 1 24478 0.00 9.02 73.44 12.22 4.98 0.35 0.74 0.53 8 MC 1 24469 0.00 42.64 38.78 11.53 6.64 0.41 0.39 0.21 9 MC 1 24455 0.00 11.78 6.57 12.28 68.89 0.48 0.69 0.46
10 MC 1 24452 0.00 3.07 81.93 6.88 7.65 0.46 0.82 0.43 11 MC 1 24464 0.00 4.32 17.90 49.01 28.33 0.43 0.49 0.35 12 MC 1 24458 0.00 7.84 60.66 12.80 18.18 0.52 0.61 0.53 13 MC 1 24461 0.00 5.82 3.66 5.81 84.24 0.47 0.85 0.57 14 MC 1 24443 0.00 12.46 5.77 3.36 77.89 0.53 0.78 0.64 15 MC 1 24406 0.00 78.30 6.33 9.48 5.22 0.67 0.79 0.50 16 MC 1 24411 0.00 77.37 4.55 5.23 12.24 0.61 0.78 0.56 17 CR 2 24537 7.69 32.55 59.67 0.00 0.00 0.09 0.76 0.65 18 CR 2 24537 8.86 32.57 58.49 0.00 0.00 0.09 0.75 0.68 19 CR 2 24536 9.77 28.92 61.22 0.00 0.00 0.09 0.76 0.70
WR
20 ER 4 24533 8.40 12.83 29.90 29.77 19.00 0.10 0.60 0.80

2006 NYSESLAT Technical Manual
Page 134
B.4: Grade 7 – Grade 8
Listening and Speaking Item
Number Item
Format Max
Points N
Count
% at 0
% at 1
% at 2
% at 3
% at 4%
Omit
P-value Point
Biserial
1 MC 1 24681 0.00 3.47 0.71 95.64 0.00 0.19 0.96 0.41 2 MC 1 24677 0.00 90.47 7.59 1.67 0.00 0.27 0.91 0.49 3 MC 1 24652 0.00 5.01 7.17 87.47 0.00 0.36 0.88 0.51 4 MC 1 24681 0.00 1.71 97.42 0.71 0.00 0.17 0.98 0.32 5 MC 1 24663 0.00 6.57 84.88 8.32 0.00 0.23 0.85 0.50 6 MC 1 24649 0.00 7.83 4.69 81.15 6.02 0.32 0.81 0.49 7 MC 1 24630 0.00 78.57 9.83 5.52 5.64 0.44 0.79 0.52 8 MC 1 24645 0.00 10.47 11.17 4.76 73.18 0.42 0.73 0.56 9 MC 1 24635 0.00 3.84 8.10 5.75 81.82 0.49 0.82 0.57
10 MC 1 24617 0.00 7.27 57.87 10.37 23.99 0.51 0.58 0.29 11 MC 1 24635 0.00 13.64 6.62 64.57 14.77 0.40 0.65 0.40 12 MC 1 24605 0.00 62.66 18.87 12.74 5.17 0.56 0.63 0.32 13 MC 1 24629 0.00 8.69 8.84 72.29 9.75 0.44 0.73 0.47 14 MC 1 24631 0.00 9.23 10.49 72.60 7.27 0.40 0.73 0.32 15 MC 1 24662 0.00 12.52 13.05 7.52 66.63 0.28 0.67 0.50 16 MC 1 24616 0.00 7.17 23.97 61.60 6.79 0.47 0.62 0.37 17 MC 1 24634 0.00 12.51 66.36 12.44 8.25 0.45 0.67 0.37 18 MC 1 24630 0.00 7.53 9.96 10.27 71.69 0.55 0.72 0.46 19 MC 1 24621 0.00 53.06 16.76 20.72 8.97 0.49 0.53 0.35 20 MC 1 24630 0.00 6.83 64.02 10.86 17.82 0.47 0.64 0.50 21 MC 1 24637 0.00 7.61 7.49 6.43 78.02 0.45 0.78 0.59 22 MC 1 24620 0.00 9.57 6.77 74.85 8.32 0.50 0.75 0.55 23 MC 1 24627 0.00 60.02 21.01 10.98 7.53 0.47 0.60 0.45 24 MC 1 24619 0.00 12.83 67.47 12.75 6.43 0.52 0.68 0.40 25 MC 1 24643 0.00 67.21 9.42 19.38 3.58 0.41 0.67 0.44 26 MC 1 24630 0.00 6.39 25.09 62.98 5.12 0.42 0.63 0.39
LI
27 MC 1 24604 0.00 9.83 75.69 9.79 4.18 0.51 0.76 0.58 1 SS 2 24715 2.13 10.84 87.03 0.00 0.00 0.00 0.92 0.58 2 SS 2 24715 2.61 10.96 86.43 0.00 0.00 0.00 0.92 0.66 3 SS 2 24715 2.48 12.31 85.20 0.00 0.00 0.00 0.91 0.66 4 SS 2 24715 2.44 11.35 86.22 0.00 0.00 0.00 0.92 0.63 5 SS 2 24715 3.45 15.02 81.53 0.00 0.00 0.00 0.89 0.70 6 SS 2 24714 12.90 23.46 63.64 0.00 0.00 0.00 0.75 0.83 7 SS 2 24714 11.01 23.21 65.78 0.00 0.00 0.00 0.77 0.82 8 SS 2 24713 8.10 21.50 70.39 0.00 0.00 0.01 0.81 0.79 9 SS 2 24713 11.85 20.80 67.35 0.00 0.00 0.01 0.78 0.82
10 SS 2 24712 11.27 21.45 67.26 0.00 0.00 0.01 0.78 0.80 11 SE 4 24711 7.80 5.01 14.06 26.72 46.40 0.02 0.75 0.87 12 SS 2 24712 12.53 11.24 76.22 0.00 0.00 0.01 0.82 0.80 13 SS 2 24711 11.08 6.35 82.55 0.00 0.00 0.02 0.86 0.80 14 SS 2 24712 9.38 10.50 80.11 0.00 0.00 0.01 0.85 0.80 15 SS 2 24712 13.74 10.83 75.42 0.00 0.00 0.01 0.81 0.81
SP
16 SS 2 24712 11.75 9.06 79.18 0.00 0.00 0.01 0.84 0.82

2006 NYSESLAT Technical Manual
Page 135
B.4: Grade 7 – Grade 8
Reading and Writing Item
Number Item
Format Max
Points N
Count
% at 0
% at 1
% at 2
% at 3
% at 4%
Omit
P-value Point
Biserial
1 MC 1 24749 0.00 2.47 94.34 3.05 0.00 0.13 0.94 0.36 2 MC 1 24744 0.00 78.37 11.04 10.41 0.00 0.17 0.78 0.49 3 MC 1 24741 0.00 2.00 5.11 92.71 0.00 0.18 0.93 0.41 4 MC 1 24735 0.00 11.74 83.61 4.45 0.00 0.20 0.84 0.54 5 MC 1 24739 0.00 7.39 7.34 85.11 0.00 0.17 0.85 0.51 6 MC 1 24663 0.00 8.27 74.38 8.38 8.48 0.49 0.75 0.33 7 MC 1 24695 0.00 10.21 62.18 13.48 13.77 0.38 0.62 0.43 8 MC 1 24712 0.00 4.32 4.86 4.68 85.81 0.33 0.86 0.55 9 MC 1 24691 0.00 56.08 17.30 9.00 17.24 0.38 0.56 0.17
10 MC 1 24701 0.00 4.48 78.63 5.68 10.87 0.34 0.79 0.60 11 MC 1 24705 0.00 9.65 14.22 64.77 11.01 0.35 0.65 0.49 12 MC 1 24644 0.00 64.82 17.00 10.55 7.04 0.60 0.65 0.42 13 MC 1 24688 0.00 28.82 12.71 52.99 5.06 0.42 0.53 0.44 14 MC 1 24635 0.00 13.31 50.39 19.13 16.56 0.61 0.51 0.24 15 MC 1 24653 0.00 21.90 57.10 10.91 9.56 0.54 0.57 0.50 16 MC 1 24695 0.00 11.09 15.08 17.14 56.31 0.38 0.56 0.39 17 MC 1 24688 0.00 15.53 14.47 16.89 52.67 0.44 0.53 0.48 18 MC 1 24674 0.00 69.32 12.18 9.85 8.17 0.48 0.70 0.61 19 MC 1 24679 0.00 7.81 10.26 73.97 7.52 0.44 0.74 0.59 20 MC 1 24680 0.00 11.97 8.42 15.48 63.68 0.45 0.64 0.55 21 MC 1 24667 0.00 6.30 5.78 66.30 21.07 0.55 0.67 0.50 22 MC 1 24657 0.00 26.21 48.39 10.85 14.02 0.54 0.49 0.33 23 MC 1 24654 0.00 15.17 10.67 8.82 64.79 0.55 0.65 0.52 24 MC 1 24650 0.00 36.24 27.04 25.59 10.56 0.57 0.36 0.37 25 MC 1 24630 0.00 12.69 18.70 58.41 9.55 0.66 0.59 0.52 26 MC 1 24627 0.00 6.22 55.34 15.80 21.98 0.67 0.56 0.42 27 MC 1 24656 0.00 14.13 10.74 14.75 59.77 0.61 0.60 0.55 28 MC 1 24645 0.00 65.97 11.54 9.89 12.03 0.57 0.66 0.55
RD
29 MC 1 24663 0.00 14.38 66.07 9.30 9.76 0.49 0.66 0.53 1 MC 1 24730 0.00 3.99 1.44 94.36 0.00 0.21 0.95 0.32 2 MC 1 24728 0.00 3.25 94.30 2.25 0.00 0.20 0.94 0.35 3 MC 1 24707 0.00 10.50 83.53 5.65 0.00 0.31 0.84 0.53 4 MC 1 24708 0.00 70.87 12.13 10.91 5.76 0.33 0.71 0.52 5 MC 1 24711 0.00 9.74 58.45 23.03 8.45 0.33 0.59 0.48 6 MC 1 24689 0.00 11.79 54.53 15.66 17.63 0.40 0.55 0.48 7 MC 1 24713 0.00 79.76 5.80 5.52 8.63 0.28 0.80 0.57 8 MC 1 24664 0.00 13.33 48.23 17.06 20.89 0.50 0.48 0.42 9 MC 1 24695 0.00 81.03 3.44 3.58 11.61 0.35 0.81 0.50
10 MC 1 24704 0.00 78.44 11.02 3.43 6.78 0.34 0.79 0.41 11 MC 1 24698 0.00 9.91 8.69 6.06 74.98 0.36 0.75 0.61 12 MC 1 24697 0.00 4.48 6.84 77.41 10.94 0.34 0.78 0.44 13 MC 1 24701 0.00 16.21 5.31 8.57 69.59 0.31 0.70 0.57 14 MC 1 24693 0.00 11.50 15.09 9.54 63.51 0.37 0.64 0.52 15 MC 1 24669 0.00 14.16 4.64 74.89 5.86 0.45 0.75 0.50 16 MC 1 24678 0.00 2.75 8.05 81.00 7.80 0.41 0.81 0.44 17 CR 2 24752 17.39 27.24 55.29 0.00 0.00 0.08 0.69 0.69 18 CR 2 24752 13.40 28.63 57.89 0.00 0.00 0.08 0.72 0.69 19 CR 2 24751 11.92 26.47 61.53 0.00 0.00 0.08 0.75 0.70
WR
20 ER 4 24734 11.65 18.21 29.59 26.74 13.66 0.15 0.53 0.78

2006 NYSESLAT Technical Manual
Page 136
B.5: Grade 9 – Grade 12
Listening and Speaking Item
Number Item
Format Max
Points N
Count
% at 0
% at 1
% at 2
% at 3
% at 4%
Omit
P-value Point
Biserial
1 MC 1 37545 0.00 94.31 2.68 2.65 0.00 0.36 0.95 0.39 2 MC 1 37518 0.00 6.20 89.21 4.11 0.00 0.48 0.90 0.43 3 MC 1 37571 0.00 89.91 3.27 6.47 0.00 0.35 0.90 0.46 4 MC 1 37512 0.00 8.50 83.82 7.18 0.00 0.50 0.84 0.22 5 MC 1 37558 0.00 2.90 1.66 95.10 0.00 0.34 0.95 0.36 6 MC 1 37536 0.00 66.98 10.15 6.73 15.66 0.49 0.67 0.44 7 MC 1 37518 0.00 8.90 5.44 68.15 17.00 0.51 0.68 0.32 8 MC 1 37437 0.00 21.94 13.24 59.67 4.41 0.74 0.60 0.32 9 MC 1 37347 0.00 8.47 17.15 9.75 63.64 0.98 0.64 0.45
10 MC 1 37464 0.00 7.50 64.91 21.01 5.93 0.64 0.65 0.22 11 MC 1 37428 0.00 20.47 16.81 52.62 9.35 0.74 0.53 0.29 12 MC 1 37474 0.00 8.27 22.99 5.92 62.14 0.67 0.62 0.43 13 MC 1 37461 0.00 18.56 21.19 40.13 19.43 0.70 0.40 0.19 14 MC 1 37461 0.00 25.96 56.73 10.62 6.06 0.63 0.57 0.13 15 MC 1 37490 0.00 18.72 12.15 56.24 12.35 0.55 0.57 0.20 16 MC 1 37515 0.00 58.58 26.24 8.11 6.54 0.53 0.59 0.45 17 MC 1 37477 0.00 16.82 54.15 17.66 10.73 0.64 0.54 0.33 18 MC 1 37442 0.00 11.49 13.10 16.27 58.39 0.75 0.59 0.34 19 MC 1 37509 0.00 11.95 4.28 4.74 78.47 0.56 0.79 0.39 20 MC 1 37437 0.00 75.57 12.69 5.92 5.11 0.71 0.76 0.50 21 MC 1 37478 0.00 21.41 67.69 4.57 5.72 0.60 0.68 0.23 22 MC 1 37491 0.00 6.30 84.86 6.77 1.52 0.56 0.85 0.42 23 MC 1 37462 0.00 4.59 8.85 80.17 5.71 0.67 0.81 0.43 24 MC 1 37471 0.00 84.21 6.08 5.01 4.08 0.63 0.85 0.38 25 MC 1 37434 0.00 27.09 44.24 9.46 18.43 0.79 0.45 0.34 26 MC 1 37438 0.00 60.32 3.70 15.23 20.03 0.72 0.61 0.40
LI
27 MC 1 37399 0.00 8.85 5.58 80.93 3.88 0.77 0.82 0.51 1 SS 2 37677 3.26 13.56 83.18 0.00 0.00 0.00 0.90 0.67 2 SS 2 37675 3.44 22.98 73.57 0.00 0.00 0.01 0.85 0.68 3 SS 2 37675 3.82 14.58 81.59 0.00 0.00 0.01 0.89 0.70 4 SS 2 37674 2.99 15.11 81.89 0.00 0.00 0.01 0.89 0.65 5 SS 2 37674 3.59 22.58 73.82 0.00 0.00 0.01 0.85 0.66 6 SS 2 37670 12.21 26.75 61.01 0.00 0.00 0.02 0.74 0.78 7 SS 2 37672 8.74 24.56 66.69 0.00 0.00 0.01 0.79 0.79 8 SS 2 37673 14.08 33.20 52.71 0.00 0.00 0.01 0.69 0.74 9 SS 2 37674 8.58 28.44 62.97 0.00 0.00 0.01 0.77 0.76
10 SS 2 37672 9.05 29.35 61.59 0.00 0.00 0.01 0.76 0.76 11 SE 4 37671 6.25 6.84 20.92 32.84 33.14 0.02 0.70 0.83 12 SS 2 37668 9.29 22.56 68.12 0.00 0.00 0.02 0.79 0.74 13 SS 2 37668 9.99 25.67 64.31 0.00 0.00 0.02 0.77 0.76 14 SS 2 37668 13.16 20.43 66.39 0.00 0.00 0.02 0.77 0.79 15 SS 2 37668 10.11 17.76 72.10 0.00 0.00 0.02 0.81 0.79
SP
16 SS 2 37665 10.83 25.17 63.96 0.00 0.00 0.03 0.77 0.78
2006 NYSESLAT Technical Manual
Page 137
B.5: Grade 9 – Grade 12
Reading and Writing Item
Number Item
Format Max
Points N
Count
% at 0
% at 1
% at 2
% at 3
% at 4%
Omit
P-value Point
Biserial
1 MC 1 37868 0.00 86.34 6.74 6.71 0.00 0.21 0.86 0.39 2 MC 1 37893 0.00 0.99 98.31 0.56 0.00 0.13 0.98 0.18 3 MC 1 37869 0.00 77.11 21.25 1.45 0.00 0.19 0.77 0.55 4 MC 1 37643 0.00 17.37 8.30 73.54 0.00 0.78 0.74 0.21 5 MC 1 37867 0.00 7.08 88.24 4.50 0.00 0.18 0.88 0.42 6 MC 1 37779 0.00 4.10 43.15 29.89 22.40 0.46 0.43 0.35 7 MC 1 37819 0.00 74.50 11.98 3.46 9.72 0.34 0.75 0.52 8 MC 1 37820 0.00 5.36 5.60 12.56 76.13 0.35 0.76 0.62 9 MC 1 37739 0.00 18.29 14.50 10.29 56.38 0.54 0.57 0.39
10 MC 1 37785 0.00 86.32 7.15 3.59 2.51 0.44 0.87 0.39 11 MC 1 37824 0.00 4.53 2.63 3.65 88.83 0.36 0.89 0.43 12 MC 1 37747 0.00 68.33 10.97 10.15 10.02 0.52 0.69 0.59 13 MC 1 37746 0.00 10.41 72.70 10.56 5.81 0.52 0.73 0.47 14 MC 1 37732 0.00 5.44 24.48 44.93 24.57 0.57 0.45 0.30 15 MC 1 37668 0.00 5.52 8.90 77.82 7.03 0.72 0.78 0.42 16 MC 1 37774 0.00 78.47 6.77 6.45 7.85 0.45 0.79 0.50 17 MC 1 37681 0.00 10.50 10.57 64.44 13.81 0.68 0.65 0.42 18 MC 1 37748 0.00 6.04 13.30 4.95 75.12 0.59 0.75 0.45 19 MC 1 37701 0.00 9.90 69.69 12.98 6.78 0.65 0.70 0.44 20 MC 1 37527 0.00 14.57 20.86 17.03 46.42 1.13 0.47 0.46 21 MC 1 37663 0.00 75.10 13.61 5.96 4.56 0.77 0.76 0.34 22 MC 1 37524 0.00 9.85 19.51 64.35 5.19 1.09 0.65 0.39 23 MC 1 37563 0.00 10.24 66.48 7.52 14.71 1.04 0.67 0.50 24 MC 1 37554 0.00 71.45 7.99 13.42 6.12 1.03 0.72 0.45 25 MC 1 37467 0.00 8.77 59.60 17.70 12.65 1.28 0.60 0.36 26 MC 1 37453 0.00 7.46 17.89 67.85 5.49 1.31 0.69 0.52 27 MC 1 37450 0.00 5.91 23.61 15.99 53.14 1.35 0.54 0.44 28 MC 1 37424 0.00 9.99 15.44 59.51 13.68 1.39 0.60 0.52
RD
29 MC 1 37431 0.00 15.73 7.35 11.33 64.23 1.35 0.65 0.56 1 MC 1 37754 0.00 10.74 4.52 84.26 0.00 0.48 0.85 0.41 2 MC 1 37775 0.00 6.50 89.92 3.16 0.00 0.42 0.90 0.39 3 MC 1 37650 0.00 22.54 9.92 66.78 0.00 0.76 0.67 0.38 4 MC 1 37761 0.00 2.90 7.10 8.62 80.92 0.46 0.81 0.42 5 MC 1 37745 0.00 5.44 6.20 5.57 82.26 0.54 0.83 0.42 6 MC 1 37713 0.00 55.61 15.06 18.34 10.34 0.65 0.56 0.51 7 MC 1 37756 0.00 7.99 10.81 20.15 60.57 0.48 0.61 0.36 8 MC 1 37617 0.00 9.03 28.41 51.17 10.54 0.85 0.52 0.33 9 MC 1 37734 0.00 7.04 2.67 7.69 82.04 0.57 0.82 0.52
10 MC 1 37710 0.00 18.57 71.11 6.47 3.23 0.62 0.72 0.48 11 MC 1 37715 0.00 66.26 12.56 11.78 8.80 0.60 0.67 0.44 12 MC 1 37706 0.00 10.91 20.72 39.61 28.16 0.60 0.40 0.24 13 MC 1 37723 0.00 84.87 3.71 3.16 7.70 0.56 0.85 0.30 14 MC 1 37668 0.00 11.25 51.89 6.79 29.33 0.73 0.52 0.26 15 MC 1 37662 0.00 7.79 5.42 21.57 64.47 0.75 0.65 0.52 16 MC 1 37624 0.00 68.08 6.30 10.17 14.64 0.82 0.69 0.39 17 CR 2 37835 7.42 25.60 66.73 0.00 0.00 0.24 0.80 0.61 18 CR 2 37832 11.94 20.10 67.71 0.00 0.00 0.25 0.78 0.67 19 CR 2 37830 12.23 27.32 60.19 0.00 0.00 0.26 0.74 0.65
WR
20 ER 4 37811 10.00 15.54 29.94 28.95 15.28 0.31 0.56 0.76
2006 NYSESLAT Technical Manual
Page 138
APPENDIX C: RAW SCORE TO SCALE SCORE CONVERSION TABLES
C.1: Kindergarten – Grade 1
Listening and Speaking Raw Score Measure SE Scale Score SE(SS)
0 –8.15 2.01 315 70 1 –6.73 1.02 364 36 2 –5.99 0.74 390 26 3 –5.54 0.62 406 22 4 –5.20 0.54 418 19 5 –4.93 0.50 427 17 6 –4.70 0.46 435 16 7 –4.51 0.43 442 15 8 –4.33 0.41 449 14 9 –4.16 0.39 454 14
10 –4.02 0.38 459 13 11 –3.88 0.37 464 13 12 –3.75 0.36 469 12 13 –3.62 0.35 473 12 14 –3.51 0.34 477 12 15 –3.39 0.33 481 12 16 –3.29 0.32 485 11 17 –3.18 0.32 489 11 18 –3.08 0.31 492 11 19 –2.99 0.31 495 11 20 –2.89 0.30 499 11 21 –2.80 0.30 502 11 22 –2.71 0.30 505 10 23 –2.62 0.29 508 10 24 –2.54 0.29 511 10 25 –2.45 0.29 514 10 26 –2.37 0.29 517 10 27 –2.29 0.29 520 10 28 –2.20 0.29 523 10 29 –2.12 0.29 526 10 30 –2.04 0.29 529 10 31 –1.96 0.29 531 10 32 –1.88 0.29 534 10 33 –1.79 0.29 537 10 34 –1.71 0.29 540 10 35 –1.63 0.29 543 10 36 –1.54 0.29 546 10 37 –1.46 0.30 549 10 38 –1.37 0.30 552 10

2006 NYSESLAT Technical Manual
Page 139
C.1: Kindergarten – Grade 1
Listening and Speaking Raw Score Measure SE Scale Score SE(SS)
39 –1.28 0.30 555 11 40 –1.18 0.31 559 11 41 –1.09 0.31 562 11 42 –0.99 0.32 565 11 43 –0.89 0.32 569 11 44 –0.78 0.33 573 12 45 –0.67 0.34 576 12 46 –0.56 0.35 581 12 47 –0.43 0.36 585 13 48 –0.30 0.37 590 13 49 –0.16 0.39 595 14 50 0.00 0.40 600 14 51 0.17 0.43 606 15 52 0.37 0.46 613 16 53 0.59 0.49 621 17 54 0.86 0.54 630 19 55 1.19 0.62 642 22 56 1.64 0.74 658 26 57 2.39 1.03 684 36 58 3.82 2.01 734 71
Note. The statistics in Tables C.1 to C.5 were based on the equating sample (Total N=191,642). Invalid cases were removed after cleaning procedures.

2006 NYSESLAT Technical Manual
Page 140
C.1: Kindergarten – Grade 1
Reading and Writing Raw Score Measure SE Scale Score SE(SS)
0 –7.47 2.02 338 71 1 –6.04 1.03 389 36 2 –5.28 0.75 415 26 3 –4.82 0.62 431 22 4 –4.48 0.55 443 19 5 –4.21 0.50 453 17 6 –3.99 0.46 461 16 7 –3.79 0.43 467 15 8 –3.62 0.41 473 14 9 –3.46 0.39 479 14
10 –3.31 0.37 484 13 11 –3.18 0.36 489 13 12 –3.05 0.36 493 12 13 –2.92 0.35 498 12 14 –2.80 0.34 502 12 15 –2.69 0.34 506 12 16 –2.57 0.34 510 12 17 –2.46 0.34 514 12 18 –2.34 0.34 518 12 19 –2.23 0.34 522 12 20 –2.11 0.34 526 12 21 –2.00 0.34 530 12 22 –1.88 0.34 534 12 23 –1.76 0.35 538 12 24 –1.64 0.35 543 12 25 –1.52 0.35 547 12 26 –1.39 0.35 551 12 27 –1.27 0.36 556 13 28 –1.14 0.36 560 13 29 –1.01 0.37 565 13 30 –0.87 0.37 570 13 31 –0.73 0.38 575 13 32 –0.58 0.39 580 14 33 –0.42 0.40 585 14 34 –0.26 0.41 591 14 35 –0.09 0.43 597 15 36 0.10 0.45 604 16 37 0.31 0.47 611 17 38 0.55 0.50 619 18 39 0.83 0.55 629 19 40 1.17 0.62 641 22 41 1.63 0.74 657 26 42 2.37 1.03 683 36 43 3.80 2.01 733 71

2006 NYSESLAT Technical Manual
Page 141
C.2: Grade 2 – Grade 4
Listening and Speaking Raw Score Measure SE Scale Score SE(SS)
0 –6.83 2.01 361 71 1 –5.40 1.03 411 36 2 –4.65 0.74 437 26 3 –4.19 0.62 453 22 4 –3.85 0.55 465 19 5 –3.58 0.50 475 18 6 –3.35 0.46 483 16 7 –3.15 0.44 490 15 8 –2.96 0.41 496 15 9 –2.80 0.40 502 14
10 –2.65 0.38 507 13 11 –2.51 0.37 512 13 12 –2.38 0.36 517 13 13 –2.26 0.35 521 12 14 –2.14 0.34 525 12 15 –2.03 0.33 529 12 16 –1.92 0.32 533 11 17 –1.82 0.32 536 11 18 –1.72 0.31 540 11 19 –1.63 0.31 543 11 20 –1.53 0.30 546 11 21 –1.44 0.30 549 10 22 –1.36 0.29 553 10 23 –1.27 0.29 556 10 24 –1.19 0.29 558 10 25 –1.11 0.29 561 10 26 –1.02 0.28 564 10 27 –0.94 0.28 567 10 28 –0.87 0.28 570 10 29 –0.79 0.28 572 10 30 –0.71 0.28 575 10 31 –0.63 0.28 578 10 32 –0.55 0.28 581 10 33 –0.47 0.28 583 10 34 –0.40 0.28 586 10 35 –0.32 0.28 589 10 36 –0.24 0.28 592 10 37 –0.15 0.29 595 10 38 –0.07 0.29 598 10 39 0.01 0.29 600 10 40 0.10 0.30 604 10 41 0.19 0.30 607 11 42 0.28 0.31 610 11 43 0.38 0.31 613 11 44 0.47 0.32 617 11 45 0.58 0.32 620 11 46 0.68 0.33 624 12 47 0.80 0.34 628 12 48 0.92 0.35 632 12 49 1.04 0.36 636 13 50 1.18 0.37 641 13

2006 NYSESLAT Technical Manual
Page 142
C.2: Grade 2 – Grade 4
Listening and Speaking Raw Score Measure SE Scale Score SE(SS)
51 1.32 0.39 646 14 52 1.48 0.41 652 14 53 1.66 0.43 658 15 54 1.85 0.46 665 16 55 2.08 0.49 673 17 56 2.35 0.54 682 19 57 2.68 0.62 694 22 58 3.13 0.74 710 26 59 3.87 1.02 736 36 60 5.30 2.01 785 70
Reading and Writing Raw Score Measure SE Scale Score SE(SS)
0 –6.04 2.01 389 71 1 –4.61 1.03 439 36 2 –3.86 0.75 465 26 3 –3.40 0.62 481 22 4 –3.06 0.55 493 19 5 –2.78 0.51 503 18 6 –2.54 0.47 511 17 7 –2.33 0.45 519 16 8 –2.14 0.43 525 15 9 –1.96 0.41 531 14
10 –1.80 0.40 537 14 11 –1.65 0.38 542 13 12 –1.51 0.38 547 13 13 –1.37 0.37 552 13 14 –1.24 0.36 557 13 15 –1.11 0.35 561 12 16 –0.99 0.35 565 12 17 –0.87 0.34 570 12 18 –0.75 0.34 574 12 19 –0.63 0.34 578 12 20 –0.52 0.33 582 12 21 –0.41 0.33 586 12 22 –0.30 0.33 589 12 23 –0.19 0.33 593 12 24 –0.08 0.33 597 12 25 0.02 0.33 601 12 26 0.13 0.33 605 12 27 0.24 0.33 608 12 28 0.35 0.33 612 12 29 0.46 0.33 616 12 30 0.57 0.34 620 12 31 0.68 0.34 624 12 32 0.80 0.34 628 12 33 0.92 0.35 632 12 34 1.04 0.35 636 12 35 1.17 0.36 641 13 36 1.30 0.37 646 13 37 1.44 0.38 650 13

2006 NYSESLAT Technical Manual
Page 143
C.2: Grade 2 – Grade 4
Reading and Writing Raw Score Measure SE Scale Score SE(SS)
38 1.59 0.39 655 14 39 1.74 0.40 661 14 40 1.91 0.42 667 15 41 2.10 0.44 673 15 42 2.30 0.47 681 16 43 2.54 0.50 689 18 44 2.81 0.55 699 19 45 3.16 0.63 711 22 46 3.62 0.75 727 26 47 4.38 1.03 753 36 48 5.82 2.02 804 71
C.3: Grade 5 – Grade 6
Listening and Speaking Raw Score Measure SE Scale Score SE(SS)
0 –6.81 2.02 361 71 1 –5.37 1.04 412 36 2 –4.60 0.76 439 27 3 –4.12 0.64 456 22 4 –3.76 0.57 468 20 5 –3.47 0.52 479 18 6 –3.22 0.48 487 17 7 –3.00 0.45 495 16 8 –2.81 0.43 502 15 9 –2.63 0.41 508 14
10 –2.47 0.39 514 14 11 –2.32 0.38 519 13 12 –2.18 0.37 524 13 13 –2.05 0.35 528 12 14 –1.93 0.34 532 12 15 –1.82 0.33 536 12 16 –1.71 0.33 540 11 17 –1.60 0.32 544 11 18 –1.50 0.31 547 11 19 –1.41 0.31 551 11 20 –1.32 0.30 554 11 21 –1.23 0.30 557 10 22 –1.14 0.29 560 10 23 –1.06 0.29 563 10 24 –0.97 0.28 566 10 25 –0.89 0.28 569 10 26 –0.81 0.28 571 10 27 –0.74 0.28 574 10 28 –0.66 0.28 577 10 29 –0.58 0.28 580 10 30 –0.51 0.28 582 10 31 –0.43 0.28 585 10 32 –0.36 0.28 588 10 33 –0.28 0.28 590 10 34 –0.20 0.28 593 10

2006 NYSESLAT Technical Manual
Page 144
C.3: Grade 5 – Grade 6
Listening and Speaking Raw Score Measure SE Scale Score SE(SS)
35 –0.13 0.28 596 10 36 –0.05 0.28 598 10 37 0.03 0.28 601 10 38 0.11 0.29 604 10 39 0.19 0.29 607 10 40 0.28 0.29 610 10 41 0.36 0.30 613 10 42 0.45 0.30 616 11 43 0.55 0.31 619 11 44 0.64 0.31 622 11 45 0.74 0.32 626 11 46 0.84 0.33 630 11 47 0.95 0.33 633 12 48 1.07 0.34 637 12 49 1.19 0.36 642 12 50 1.32 0.37 646 13 51 1.46 0.38 651 13 52 1.62 0.40 657 14 53 1.79 0.42 663 15 54 1.98 0.45 669 16 55 2.20 0.49 677 17 56 2.46 0.54 686 19 57 2.78 0.61 697 21 58 3.23 0.73 713 26 59 3.96 1.02 738 36 60 5.37 2.01 788 70
Reading and Writing Raw Score Measure SE Scale Score SE(SS)
0 –5.34 2.01 413 71 1 –3.91 1.03 463 36 2 –3.17 0.74 489 26 3 –2.71 0.62 505 22 4 –2.37 0.55 517 19 5 –2.09 0.50 527 18 6 –1.86 0.47 535 16 7 –1.65 0.44 542 15 8 –1.47 0.42 549 15 9 –1.30 0.40 555 14
10 –1.14 0.39 560 14 11 –1.00 0.38 565 13 12 –0.86 0.37 570 13 13 –0.73 0.36 575 13 14 –0.60 0.35 579 12 15 –0.48 0.34 583 12 16 –0.36 0.34 587 12 17 –0.25 0.33 591 12 18 –0.14 0.33 595 12 19 –0.03 0.33 599 11 20 0.07 0.32 602 11

2006 NYSESLAT Technical Manual
Page 145
C.3: Grade 5 – Grade 6
Reading and Writing Raw Score Measure SE Scale Score SE(SS)
21 0.17 0.32 606 11 22 0.28 0.32 610 11 23 0.38 0.32 613 11 24 0.48 0.32 617 11 25 0.58 0.32 620 11 26 0.68 0.32 624 11 27 0.78 0.32 627 11 28 0.88 0.32 631 11 29 0.98 0.32 634 11 30 1.08 0.32 638 11 31 1.18 0.32 641 11 32 1.28 0.32 645 11 33 1.39 0.33 649 11 34 1.49 0.33 652 12 35 1.60 0.33 656 12 36 1.71 0.34 660 12 37 1.83 0.34 664 12 38 1.95 0.35 668 12 39 2.07 0.36 673 12 40 2.20 0.36 677 13 41 2.34 0.37 682 13 42 2.48 0.39 687 14 43 2.63 0.40 692 14 44 2.80 0.42 698 15 45 2.98 0.44 704 15 46 3.18 0.46 711 16 47 3.41 0.50 719 17 48 3.68 0.54 729 19 49 4.02 0.62 741 22 50 4.47 0.74 756 26 51 5.21 1.02 782 36 52 6.63 2.01 832 70
C.4: Grade 7 – Grade 8
Listening and Speaking Raw Score Measure SE Scale Score SE(SS)
0 –6.00 2.02 390 71 1 –4.55 1.04 441 37 2 –3.77 0.77 468 27 3 –3.28 0.65 485 23 4 –2.91 0.58 498 20 5 –2.60 0.53 509 19 6 –2.34 0.49 518 17 7 –2.12 0.46 526 16 8 –1.91 0.44 533 15 9 –1.73 0.42 540 15
10 –1.56 0.40 545 14 11 –1.41 0.38 551 13 12 –1.27 0.37 556 13

2006 NYSESLAT Technical Manual
Page 146
C.4: Grade 7 – Grade 8
Listening and Speaking Raw Score Measure SE Scale Score SE(SS)
13 –1.13 0.36 560 13 14 –1.01 0.35 565 12 15 –0.89 0.34 569 12 16 –0.78 0.33 573 11 17 –0.68 0.32 576 11 18 –0.58 0.31 580 11 19 –0.49 0.30 583 11 20 –0.40 0.30 586 10 21 –0.31 0.29 589 10 22 –0.22 0.29 592 10 23 –0.14 0.29 595 10 24 –0.06 0.28 598 10 25 0.02 0.28 601 10 26 0.09 0.28 603 10 27 0.17 0.28 606 10 28 0.25 0.27 609 10 29 0.32 0.27 611 10 30 0.40 0.27 614 10 31 0.47 0.27 616 10 32 0.54 0.27 619 10 33 0.62 0.27 622 10 34 0.69 0.27 624 10 35 0.77 0.28 627 10 36 0.85 0.28 630 10 37 0.92 0.28 632 10 38 1.00 0.28 635 10 39 1.08 0.28 638 10 40 1.16 0.29 641 10 41 1.25 0.29 644 10 42 1.33 0.30 647 10 43 1.42 0.30 650 11 44 1.51 0.30 653 11 45 1.61 0.31 656 11 46 1.71 0.32 660 11 47 1.81 0.32 663 11 48 1.92 0.33 667 12 49 2.03 0.34 671 12 50 2.15 0.35 675 12 51 2.28 0.36 680 13 52 2.42 0.38 685 13 53 2.57 0.40 690 14 54 2.73 0.42 696 15 55 2.92 0.45 702 16 56 3.13 0.48 710 17 57 3.39 0.53 719 19 58 3.71 0.60 730 21 59 4.14 0.73 745 26 60 4.87 1.02 770 36 61 6.28 2.01 820 70

2006 NYSESLAT Technical Manual
Page 147
C.4: Grade 7 – Grade 8
Reading and Writing Raw Score Measure SE Scale Score SE(SS)
0 –5.15 2.01 420 71 1 –3.72 1.03 470 36 2 –2.97 0.75 496 26 3 –2.51 0.62 512 22 4 –2.17 0.55 524 19 5 –1.90 0.50 534 18 6 –1.67 0.46 542 16 7 –1.46 0.44 549 15 8 –1.28 0.41 555 15 9 –1.12 0.40 561 14
10 –0.97 0.38 566 13 11 –0.83 0.37 571 13 12 –0.70 0.36 575 12 13 –0.58 0.35 580 12 14 –0.46 0.34 584 12 15 –0.35 0.33 588 12 16 –0.24 0.32 591 11 17 –0.14 0.32 595 11 18 –0.04 0.31 598 11 19 0.05 0.31 602 11 20 0.15 0.30 605 11 21 0.24 0.30 608 11 22 0.33 0.30 611 10 23 0.42 0.30 615 10 24 0.50 0.29 618 10 25 0.59 0.29 621 10 26 0.67 0.29 624 10 27 0.76 0.29 627 10 28 0.84 0.29 630 10 29 0.93 0.29 633 10 30 1.01 0.29 636 10 31 1.10 0.29 638 10 32 1.19 0.29 642 10 33 1.27 0.30 645 10 34 1.36 0.30 648 10 35 1.45 0.30 651 11 36 1.54 0.30 654 11 37 1.64 0.31 657 11 38 1.73 0.31 661 11 39 1.83 0.32 664 11 40 1.93 0.32 668 11 41 2.04 0.33 671 12 42 2.15 0.34 675 12 43 2.27 0.35 679 12 44 2.39 0.36 684 13 45 2.52 0.37 688 13 46 2.66 0.38 693 13 47 2.82 0.40 699 14 48 2.99 0.42 705 15 49 3.18 0.45 711 16 50 3.40 0.49 719 17 51 3.66 0.54 728 19

2006 NYSESLAT Technical Manual
Page 148
C.4: Grade 7 – Grade 8
Reading and Writing Raw Score Measure SE Scale Score SE(SS)
52 3.99 0.61 740 21 53 4.43 0.74 755 26 54 5.17 1.02 781 36 55 6.59 2.01 830 70
C.5: Grade 9 – Grade 12
Listening and Speaking Raw Score Measure SE Scale Score SE(SS)
0 –5.13 2.01 421 71 1 –3.70 1.03 471 36 2 –2.95 0.74 497 26 3 –2.49 0.62 513 22 4 –2.16 0.55 525 19 5 –1.88 0.50 534 17 6 –1.65 0.46 542 16 7 –1.45 0.43 549 15 8 –1.27 0.41 555 14 9 –1.11 0.39 561 14
10 –0.96 0.38 566 13 11 –0.83 0.36 571 13 12 –0.70 0.35 576 12 13 –0.58 0.34 580 12 14 –0.46 0.33 584 12 15 –0.36 0.33 588 11 16 –0.25 0.32 591 11 17 –0.15 0.31 595 11 18 –0.06 0.31 598 11 19 0.04 0.30 601 11 20 0.13 0.30 604 10 21 0.21 0.29 607 10 22 0.30 0.29 610 10 23 0.38 0.29 613 10 24 0.46 0.29 616 10 25 0.54 0.28 619 10 26 0.62 0.28 622 10 27 0.70 0.28 625 10 28 0.78 0.28 627 10 29 0.86 0.28 630 10 30 0.94 0.28 633 10 31 1.01 0.28 636 10 32 1.09 0.28 638 10 33 1.17 0.28 641 10 34 1.25 0.28 644 10 35 1.33 0.28 646 10 36 1.41 0.28 649 10 37 1.49 0.29 652 10 38 1.57 0.29 655 10 39 1.65 0.29 658 10 40 1.74 0.29 661 10

2006 NYSESLAT Technical Manual
Page 149
C.5: Grade 9 – Grade 12
Listening and Speaking Raw Score Measure SE Scale Score SE(SS)
41 1.82 0.30 664 10 42 1.91 0.30 667 11 43 2.00 0.30 670 11 44 2.10 0.31 673 11 45 2.20 0.31 677 11 46 2.30 0.32 680 11 47 2.40 0.33 684 11 48 2.51 0.34 688 12 49 2.63 0.34 692 12 50 2.75 0.36 696 12 51 2.88 0.37 701 13 52 3.02 0.38 706 13 53 3.17 0.40 711 14 54 3.34 0.42 717 15 55 3.53 0.45 724 16 56 3.75 0.48 731 17 57 4.01 0.53 740 19 58 4.33 0.61 751 21 59 4.77 0.73 767 26 60 5.50 1.02 792 36 61 6.91 2.01 842 70
C.5: Grade 9 – Grade 12
Reading and Writing Raw Score Measure SE Scale Score SE(SS)
0 –4.33 2.03 448 71 1 –2.85 1.05 500 37 2 –2.06 0.77 528 27 3 –1.58 0.64 545 22 4 –1.23 0.56 557 20 5 –0.95 0.50 567 18 6 –0.72 0.46 575 16 7 –0.52 0.43 582 15 8 –0.34 0.41 588 14 9 –0.18 0.39 594 14
10 –0.03 0.37 599 13 11 0.10 0.36 604 13 12 0.23 0.35 608 12 13 0.34 0.34 612 12 14 0.46 0.33 616 12 15 0.56 0.32 620 11 16 0.67 0.32 623 11 17 0.76 0.31 627 11 18 0.86 0.31 630 11 19 0.95 0.30 633 11 20 1.04 0.30 636 11 21 1.13 0.30 640 10 22 1.22 0.29 643 10 23 1.30 0.29 646 10 24 1.39 0.29 649 10

2006 NYSESLAT Technical Manual
Page 150
C.5: Grade 9 – Grade 12
Reading and Writing Raw Score Measure SE Scale Score SE(SS)
25 1.47 0.29 652 10 26 1.56 0.29 654 10 27 1.64 0.29 657 10 28 1.72 0.29 660 10 29 1.81 0.29 663 10 30 1.89 0.29 666 10 31 1.98 0.29 669 10 32 2.06 0.29 672 10 33 2.15 0.30 675 10 34 2.24 0.30 678 10 35 2.32 0.30 681 11 36 2.42 0.30 685 11 37 2.51 0.31 688 11 38 2.61 0.31 691 11 39 2.71 0.32 695 11 40 2.81 0.32 698 11 41 2.92 0.33 702 12 42 3.03 0.34 706 12 43 3.15 0.35 710 12 44 3.27 0.36 714 13 45 3.40 0.37 719 13 46 3.55 0.39 724 14 47 3.70 0.40 730 14 48 3.87 0.42 736 15 49 4.06 0.45 742 16 50 4.28 0.49 750 17 51 4.55 0.54 759 19 52 4.87 0.61 771 21 53 5.32 0.73 786 26 54 6.05 1.02 812 36 55 7.46 2.01 861 70

2006 NYSESLAT Technical Manual
Page 151
APPENDIX D: IRT STATISTICS
D.1: Kindergarten – Grade 1
Listening and Speaking
Item
N-count Rasch
Difficulty
SE MNSQ
Infit MNSQ Outfit
1 45834 –3.20 0.02 1.03 0.90 2 45834 –2.69 0.02 0.98 0.88 3 45834 –3.61 0.02 0.98 0.95 4 45834 –3.63 0.02 0.94 0.78 5 45834 –3.76 0.02 0.90 0.61 6 45834 –3.69 0.02 0.92 0.52 7 45834 –2.57 0.02 1.16 1.59 8 45834 –3.42 0.02 1.06 1.12 9 45834 –3.23 0.02 0.87 0.55
10 45834 –3.30 0.02 0.88 0.57 11 45834 –3.00 0.02 0.90 0.60 12 45834 –3.02 0.02 0.85 0.52 13 45834 –4.04 0.03 1.00 0.67 14 45834 –1.65 0.01 0.98 0.93 15 45834 –0.10 0.01 1.20 1.41 16 45834 –2.39 0.02 1.16 1.53 17 45834 –1.28 0.01 1.24 1.50 18 45834 –1.24 0.01 1.28 1.57 19 45834 –1.03 0.01 1.12 1.17 20 45834 –2.31 0.01 1.07 1.15 21 45834 –0.78 0.01 1.14 1.24 22 45834 –1.95 0.01 1.08 1.17 23 45834 –0.91 0.01 1.29 1.47
LI
24 45834 –1.52 0.01 1.12 1.23 1 45834 –3.89 0.02 0.98 0.73 2 45834 –3.69 0.01 1.00 0.78 3 45834 –2.16 0.01 1.08 1.25 4 45834 –2.73 0.01 0.94 0.80 5 45834 –2.20 0.01 0.88 0.74 6 45834 –1.31 0.01 0.77 0.74 7 45834 –2.06 0.01 0.83 0.77 8 45834 –2.32 0.01 0.86 0.75 9 45834 –1.33 0.01 0.83 0.85
10 45834 –1.63 0.01 0.83 0.77 11 45834 –1.04 0.01 0.86 0.85 12 45834 –2.07 0.01 0.85 0.73 13 45834 –1.39 0.01 0.86 0.73 14 45834 –1.91 0.01 0.90 0.81 15 45834 –1.40 0.01 0.85 0.79
SP
16 45834 –0.91 0.01 0.97 0.92 Note. The statistics in Tables D.1 to D.5 were based on the equating sample (total N=191,642). Invalid cases were removed after cleaning procedures.

2006 NYSESLAT Technical Manual
Page 152
D.1: Kindergarten – Grade 1
Reading and Writing
Item
N-count Rasch
Difficulty
SE MNSQ
Infit MNSQ Outfit
1 46116 –2.77 0.01 1.05 0.99 2 46116 –2.30 0.01 1.10 1.03 3 46116 –2.24 0.01 0.85 0.72 4 46116 –1.91 0.01 1.13 1.06 5 46116 –0.91 0.01 1.67 2.13 6 46116 –1.36 0.01 1.01 0.94 7 46116 –1.26 0.01 1.18 1.17 8 46116 –1.77 0.01 1.13 1.00 9 46116 –2.52 0.01 0.92 0.82
10 46116 –2.33 0.01 0.92 0.73 11 46116 –2.01 0.01 0.83 0.70 12 46116 –2.13 0.01 1.08 1.02 13 46116 –0.23 0.01 1.14 1.26 14 46116 –0.58 0.01 1.23 1.34
RD
15 46116 –0.55 0.01 1.31 1.48 1 46116 –3.82 0.02 0.95 0.89 2 46116 –2.38 0.01 0.96 1.02 3 46116 –2.61 0.01 0.91 1.14 4 46116 –2.85 0.01 0.90 0.67 5 46116 –2.21 0.01 0.94 0.92 6 46116 –3.34 0.02 0.93 0.84 7 46116 –1.21 0.01 1.14 1.15 8 46116 –1.34 0.01 0.92 0.82 9 46116 –0.64 0.01 1.02 1.07
10 46116 –0.70 0.01 1.00 1.00 11 46116 –2.85 0.01 1.12 1.25 12 46116 –3.12 0.01 1.29 1.83 13 46116 –2.74 0.01 0.94 1.87 14 46116 –3.08 0.01 0.91 2.35 15 46116 –2.44 0.01 0.75 0.67 16 46116 –2.00 0.01 0.69 0.64 17 46116 –0.53 0.01 0.63 0.58 18 46116 –0.54 0.01 0.63 0.59
WR
19 46116 –0.10 0.01 0.67 0.63
2006 NYSESLAT Technical Manual
Page 153
D.2: Grade 2 – Grade 4
Listening and Speaking
Item
N-count Rasch
Difficulty
SE MNSQ
Infit MNSQ Outfit
1 54396 0.88 0.01 1.18 1.36 2 54396 –2.45 0.02 0.88 0.55 3 54396 –0.54 0.01 1.11 0.96 4 54396 –0.86 0.01 0.93 0.76 5 54396 –2.22 0.02 1.05 0.75 6 54396 0.36 0.01 1.08 1.05 7 54396 –1.14 0.02 1.00 0.87 8 54396 –2.64 0.03 0.93 1.02 9 54396 –1.58 0.02 0.99 0.79
10 54396 –0.72 0.01 0.93 0.90 11 54396 –1.02 0.02 0.91 0.68 12 54396 0.84 0.01 1.11 1.20 13 54396 –0.78 0.01 1.12 1.14 14 54396 –0.72 0.01 0.97 0.86 15 54396 –0.19 0.01 1.27 1.37 16 54396 0.16 0.01 1.01 0.98 17 54396 0.26 0.01 1.10 1.14 18 54396 –0.48 0.01 1.01 1.00 19 54396 –0.15 0.01 0.94 0.85 20 54396 1.62 0.01 1.13 1.32 21 54396 1.74 0.01 1.14 1.47 22 54396 1.17 0.01 1.35 1.63 23 54396 0.01 0.01 0.99 0.94 24 54396 0.36 0.01 1.04 1.03 25 54396 0.95 0.01 1.17 1.25
LI
26 54396 –0.48 0.01 1.51 2.11 1 54396 –3.10 0.02 0.91 0.44 2 54396 –2.54 0.02 0.84 0.51 3 54396 –2.36 0.01 0.92 0.69 4 54396 –2.07 0.01 0.83 0.59 5 54396 –2.11 0.02 0.64 0.43 6 54396 –0.61 0.01 0.76 0.68 7 54396 –0.14 0.01 0.74 0.71 8 54396 –0.58 0.01 0.77 0.69 9 54396 –0.70 0.01 0.80 0.76
10 54396 –0.59 0.01 0.57 0.49 11 54396 0.10 0.01 0.79 0.81 12 54396 –0.59 0.01 0.76 0.66 13 54396 –1.13 0.01 0.73 0.60 14 54396 –0.88 0.01 0.75 0.69 15 54396 –0.28 0.01 0.92 0.93
SP
16 54396 –0.58 0.01 0.76 0.70

2006 NYSESLAT Technical Manual
Page 154
D.2: Grade 2 – Grade 4
Reading and Writing
Item
N-count Rasch
Difficulty
SE MNSQ
Infit MNSQ Outfit
1 55887 –1.42 0.01 0.85 0.66 2 55887 –1.17 0.01 1.00 0.92 3 55887 –1.88 0.02 0.86 0.56 4 55887 –2.60 0.02 0.89 0.69 5 55887 –1.63 0.02 0.60 0.32 6 55887 –1.03 0.01 1.25 2.03 7 55887 –1.58 0.02 0.86 0.82 8 55887 –2.03 0.02 0.82 0.52 9 55887 –0.04 0.01 0.86 0.79
10 55887 0.18 0.01 0.95 0.96 11 55887 –0.62 0.01 0.95 0.84 12 55887 1.46 0.01 1.13 1.34 13 55887 0.97 0.01 1.01 1.06 14 55887 0.72 0.01 1.24 1.35 15 55887 0.61 0.01 1.06 1.11 16 55887 0.06 0.01 0.95 0.88 17 55887 0.29 0.01 1.13 1.20 18 55887 0.81 0.01 1.03 1.06 19 55887 0.95 0.01 1.03 1.12 20 55887 1.63 0.01 1.23 1.54 21 55887 0.39 0.01 1.02 1.03 22 55887 0.33 0.01 0.99 0.94 23 55887 1.00 0.01 0.97 1.01 24 55887 0.07 0.01 1.00 0.87 25 55887 0.59 0.01 1.08 1.08
RD
26 55887 0.28 0.01 1.04 0.97 1 55887 –1.00 0.01 1.04 0.96 2 55887 –2.01 0.02 0.86 0.52 3 55887 –2.39 0.02 0.87 0.56 4 55887 –1.54 0.02 0.87 0.61 5 55887 –0.49 0.01 0.96 0.89 6 55887 0.58 0.01 1.08 1.16 7 55887 0.43 0.01 1.01 1.10 8 55887 1.09 0.01 1.06 1.20 9 55887 –0.01 0.01 0.97 0.91
10 55887 0.03 0.01 0.84 0.76 11 55887 0.32 0.01 1.09 1.14 12 55887 0.50 0.01 1.12 1.21 13 55887 –0.20 0.01 0.91 0.92 14 55887 –0.06 0.01 0.87 0.87 15 55887 –0.08 0.01 0.87 0.87
WR
16 55887 0.98 0.01 0.82 0.82

2006 NYSESLAT Technical Manual
Page 155
D.3: Grade 5 – Grade 6
Listening and Speaking
Item
N-count Rasch
Difficulty
SE MNSQ
Infit MNSQ Outfit
1 22769 –2.74 0.04 0.89 0.63 2 22769 –1.44 0.03 0.91 0.47 3 22769 –1.45 0.03 1.40 1.85 4 22769 –0.12 0.02 0.86 0.69 5 22769 –1.82 0.03 0.66 0.31 6 22769 –0.41 0.02 1.02 0.94 7 22769 0.02 0.02 1.04 0.96 8 22769 0.98 0.02 1.23 1.47 9 22769 0.71 0.02 1.13 1.21
10 22769 1.11 0.02 1.17 1.32 11 22769 0.14 0.02 1.14 1.20 12 22769 0.34 0.02 1.25 1.45 13 22769 0.21 0.02 1.17 1.26 14 22769 1.49 0.02 1.30 1.67 15 22769 0.13 0.02 1.00 1.02 16 22769 –0.17 0.02 1.27 1.53 17 22769 0.75 0.02 1.15 1.22 18 22769 1.34 0.02 1.05 1.12 19 22769 –0.93 0.02 0.90 0.79 20 22769 0.50 0.02 1.20 1.32 21 22769 0.11 0.02 1.09 0.97 22 22769 0.01 0.02 1.02 0.94 23 22769 –0.70 0.02 0.96 0.84 24 22769 –0.80 0.02 0.97 0.97 25 22769 0.04 0.02 1.22 1.39
LI
26 22769 –0.11 0.02 0.86 0.74 1 22769 –3.04 0.03 0.93 0.56 2 22769 –2.79 0.03 0.89 0.55 3 22769 –2.37 0.02 0.91 0.64 4 22769 –2.24 0.02 0.78 0.41 5 22769 –1.14 0.02 0.76 0.64 6 22769 –0.48 0.02 0.86 0.83 7 22769 –0.66 0.02 0.68 0.57 8 22769 –0.26 0.01 0.89 0.91 9 22769 –0.17 0.01 0.77 0.76
10 22769 –0.51 0.01 0.94 0.93 11 22769 0.42 0.01 0.74 0.75 12 22769 –0.71 0.02 0.69 0.54 13 22769 –0.70 0.02 0.83 0.73 14 22769 –0.62 0.02 0.71 0.54 15 22769 –0.50 0.02 0.78 0.57
SP
16 22769 –0.14 0.01 0.75 0.69

2006 NYSESLAT Technical Manual
Page 156
D.3: Grade 5 – Grade 6
Reading and Writing
Item
N-count Rasch
Difficulty
SE MNSQ
Infit MNSQ Outfit
1 23994 –1.70 0.03 0.93 0.92 2 23994 –1.19 0.03 0.73 0.37 3 23994 –0.63 0.02 0.71 0.44 4 23994 –0.49 0.02 0.99 0.97 5 23994 –0.88 0.02 0.96 1.06 6 23994 –1.39 0.03 0.95 0.78 7 23994 0.53 0.02 0.99 0.93 8 23994 0.70 0.02 0.93 0.87 9 23994 0.11 0.02 0.82 0.64
10 23994 –0.21 0.02 0.97 0.98 11 23994 1.20 0.02 0.85 0.81 12 23994 0.88 0.02 0.93 0.85 13 23994 1.42 0.02 1.03 1.05 14 23994 1.44 0.02 0.95 0.92 15 23994 2.37 0.02 1.16 1.46 16 23994 1.60 0.02 0.95 0.94 17 23994 1.36 0.02 0.92 0.87 18 23994 1.18 0.02 1.17 1.21 19 23994 1.23 0.02 1.11 1.17 20 23994 2.72 0.02 0.99 1.26 21 23994 1.63 0.02 1.22 1.31 22 23994 1.62 0.02 0.91 0.89 23 23994 1.02 0.02 0.97 0.91 24 23994 1.39 0.02 0.98 0.96 25 23994 2.46 0.02 1.25 1.60
RD
26 23994 2.57 0.02 1.14 1.45 1 23994 –1.87 0.03 0.88 0.42 2 23994 –0.25 0.02 1.01 1.02 3 23994 –0.81 0.02 0.86 0.59 4 23994 –1.35 0.03 0.88 0.58 5 23994 1.01 0.02 1.17 1.23 6 23994 0.36 0.02 0.90 0.82 7 23994 0.64 0.02 0.97 0.93 8 23994 2.66 0.02 1.36 1.88 9 23994 0.95 0.02 1.08 1.12
10 23994 –0.02 0.02 1.03 1.24 11 23994 2.09 0.02 1.20 1.37 12 23994 1.41 0.02 0.99 0.99 13 23994 –0.23 0.02 0.84 0.67 14 23994 0.38 0.02 0.77 0.59 15 23994 0.28 0.02 0.98 0.99 16 23994 0.35 0.02 0.90 0.85 17 23994 0.31 0.01 0.90 0.92 18 23994 0.43 0.01 0.86 0.88 19 23994 0.44 0.01 0.83 0.82
WR
20 23994 1.46 0.01 0.83 0.84

2006 NYSESLAT Technical Manual
Page 157
D.4: Grade 7 – Grade 8
Listening and Speaking
Item
N-count Rasch
Difficulty
SE MNSQ
Infit MNSQ Outfit
1 –1.82 22634 0.04 0.93 0.70 2 –0.67 22634 0.03 0.94 0.69 3 –0.67 22634 0.03 1.23 0.90 4 –2.48 22634 0.05 0.95 0.64 5 0.01 22634 0.02 1.03 0.82 6 0.37 22634 0.02 1.07 1.00 7 0.59 22634 0.02 1.03 1.06 8 1.03 22634 0.02 0.97 0.89 9 0.31 22634 0.02 0.95 0.76
10 2.06 22634 0.02 1.35 1.63 11 1.64 22634 0.02 1.21 1.31 12 1.76 22634 0.02 1.35 1.55 13 1.11 22634 0.02 1.11 1.10 14 1.09 22634 0.02 1.38 1.59 15 1.13 22634 0.02 1.18 1.24 16 1.83 22634 0.02 1.25 1.43 17 1.53 22634 0.02 1.29 1.44 18 1.14 22634 0.02 1.15 1.19 19 2.33 22634 0.02 1.27 1.53 20 1.66 22634 0.02 1.04 1.06 21 0.63 22634 0.02 0.92 0.84 22 0.91 22634 0.02 0.98 0.87 23 1.91 22634 0.02 1.10 1.19 24 1.44 22634 0.02 1.24 1.37 25 1.42 22634 0.02 1.18 1.28 26 1.55 22634 0.02 1.23 1.37
LI
27 1.05 22634 0.02 0.87 0.79 1 –1.69 22634 0.02 1.02 0.85 2 –1.35 22634 0.02 0.86 0.55 3 –1.38 22634 0.02 0.87 0.63 4 –1.43 22634 0.02 0.90 0.71 5 –0.87 22634 0.02 0.85 0.72 6 0.83 22634 0.01 0.67 0.62 7 0.61 22634 0.01 0.72 0.64 8 0.24 22634 0.01 0.74 0.68 9 0.80 22634 0.01 0.67 0.59
10 0.61 22634 0.01 0.74 0.71 11 0.90 22634 0.01 0.74 0.78 12 0.48 22634 0.01 0.77 0.66 13 0.18 22634 0.02 0.69 0.43 14 0.09 22634 0.02 0.69 0.52 15 0.43 22634 0.01 0.83 0.60
SP
16 0.33 22634 0.01 0.66 0.46
2006 NYSESLAT Technical Manual
Page 158
D.4: Grade 7 – Grade 8
Reading and Writing
Item
N-count Rasch
Difficulty
SE MNSQ
Infit MNSQ Outfit
1 24003 –1.63 0.03 0.93 0.69 2 24003 0.56 0.02 0.87 0.81 3 24003 –1.33 0.03 0.91 0.54 4 24003 –0.24 0.02 0.87 0.69 5 24003 –0.39 0.02 0.88 0.76 6 24003 0.48 0.02 1.19 1.34 7 24003 1.24 0.02 1.11 1.16 8 24003 –0.46 0.02 0.82 0.62 9 24003 1.58 0.02 1.48 1.72
10 24003 0.17 0.02 0.82 0.68 11 24003 1.08 0.02 1.01 1.00 12 24003 1.08 0.02 1.11 1.09 13 24003 1.75 0.02 1.08 1.13 14 24003 1.89 0.02 1.35 1.53 15 24003 1.52 0.02 0.99 1.00 16 24003 1.56 0.02 1.15 1.22 17 24003 1.77 0.02 1.01 1.02 18 24003 0.81 0.02 0.85 0.76 19 24003 0.50 0.02 0.86 0.69 20 24003 1.48 0.02 0.91 0.87 21 24003 0.56 0.02 1.17 1.11 22 24003 1.59 0.02 1.28 1.38 23 24003 1.31 0.02 0.94 0.90 24 24003 2.42 0.02 1.07 1.20 25 24003 1.45 0.02 0.98 0.97 26 24003 1.62 0.02 1.10 1.14 27 24003 1.37 0.02 0.93 0.88 28 24003 1.01 0.02 0.93 0.87
RD
29 24003 1.00 0.02 0.97 0.96 1 24003 –1.65 0.03 0.94 1.03 2 24003 –1.65 0.03 0.94 0.66 3 24003 –0.42 0.02 0.98 0.76 4 24003 0.70 0.02 0.96 0.94 5 24003 1.45 0.02 1.03 1.08 6 24003 1.67 0.02 1.03 1.09 7 24003 0.32 0.02 0.78 0.66 8 24003 2.01 0.02 1.07 1.19 9 24003 –0.03 0.02 0.93 0.87
10 24003 0.18 0.02 1.05 1.28 11 24003 0.43 0.02 0.83 0.70 12 24003 0.26 0.02 1.03 1.07 13 24003 0.79 0.02 0.90 0.91 14 24003 1.16 0.02 0.98 0.97 15 24003 0.44 0.02 0.98 0.94 16 24003 0.40 0.02 0.89 0.82 17 24003 0.88 0.01 0.89 0.89 18 24003 0.64 0.01 0.86 0.87 19 24003 0.48 0.01 0.82 0.83
WR
20 24003 1.75 0.01 0.87 0.86

2006 NYSESLAT Technical Manual
Page 159
D.5: Grade 9 – Grade 12
Listening and Speaking
Item
N-count Rasch
Difficulty
SE MNSQ
Infit MNSQ Outfit
1 34500 –0.95 0.03 0.94 0.52 2 34500 –0.11 0.02 0.95 0.73 3 34500 –0.17 0.02 0.89 0.64 4 34500 0.49 0.02 1.26 1.53 5 34500 –1.13 0.03 0.91 0.74 6 34500 1.69 0.01 1.03 1.02 7 34500 1.63 0.01 1.19 1.27 8 34500 1.88 0.01 1.23 1.31 9 34500 2.06 0.01 0.98 0.97
10 34500 1.82 0.01 1.32 1.44 11 34500 2.50 0.01 1.21 1.35 12 34500 1.97 0.01 1.04 1.03 13 34500 3.16 0.01 1.24 1.73 14 34500 2.28 0.01 1.46 1.73 15 34500 2.31 0.01 1.35 1.54 16 34500 2.18 0.01 0.99 0.99 17 34500 2.42 0.01 1.14 1.26 18 34500 2.19 0.01 1.14 1.22 19 34500 0.92 0.01 1.07 1.17 20 34500 1.15 0.01 0.94 0.85 21 34500 1.67 0.01 1.32 1.59 22 34500 0.37 0.02 1.01 1.05 23 34500 0.78 0.02 1.01 1.06 24 34500 0.45 0.02 1.06 1.10 25 34500 2.83 0.01 1.10 1.23 26 34500 1.96 0.01 1.11 1.15
LI
27 34500 1.11 0.01 0.80 0.68 1 34500 –0.59 0.02 0.83 0.54 2 34500 0.11 0.01 0.79 0.75 3 34500 –0.36 0.01 0.76 0.54 4 34500 –0.69 0.02 0.84 0.66 5 34500 –0.25 0.01 0.88 0.80 6 34500 1.17 0.01 0.70 0.63 7 34500 0.76 0.01 0.68 0.59 8 34500 1.45 0.01 0.79 0.75 9 34500 0.69 0.01 0.80 0.74
10 34500 0.75 0.01 0.80 0.81 11 34500 1.39 0.01 0.73 0.74 12 34500 0.79 0.01 0.80 0.69 13 34500 0.93 0.01 0.75 0.67 14 34500 1.12 0.01 0.68 0.58 15 34500 0.84 0.01 0.64 0.54
SP
16 34500 1.00 0.01 0.71 0.63
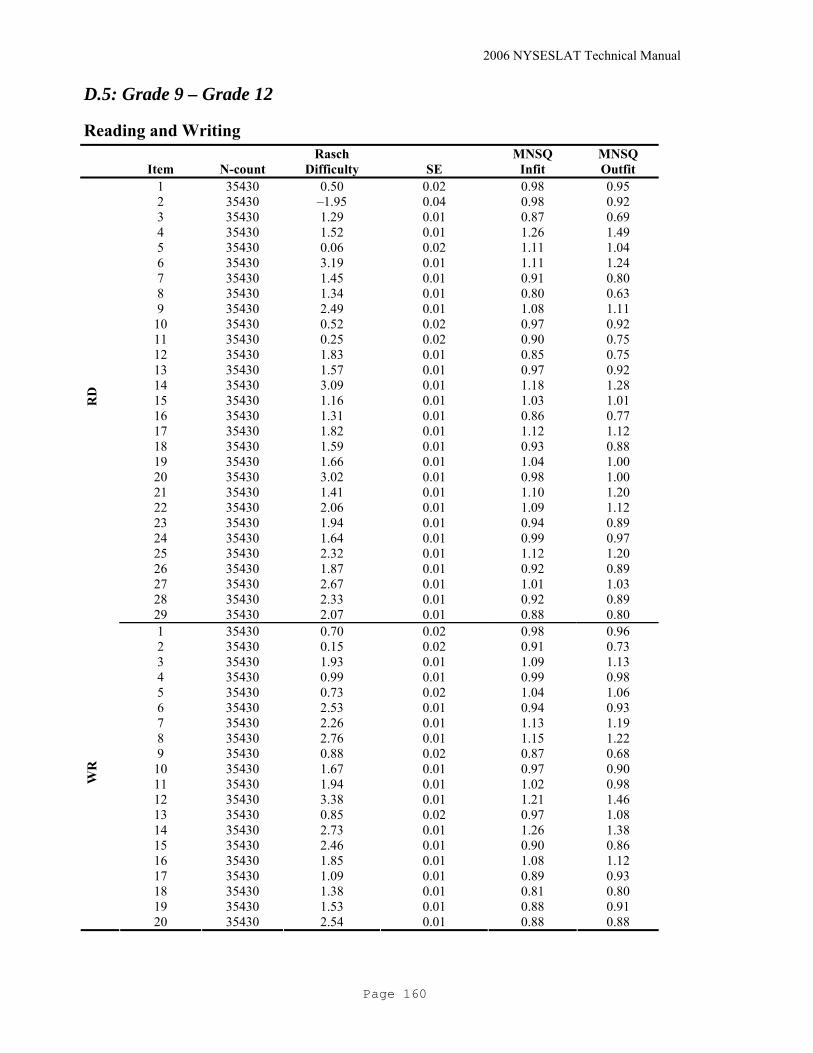
2006 NYSESLAT Technical Manual
Page 160
D.5: Grade 9 – Grade 12
Reading and Writing
Item
N-count Rasch
Difficulty
SE MNSQ
Infit MNSQ Outfit
1 35430 0.50 0.02 0.98 0.95 2 35430 –1.95 0.04 0.98 0.92 3 35430 1.29 0.01 0.87 0.69 4 35430 1.52 0.01 1.26 1.49 5 35430 0.06 0.02 1.11 1.04 6 35430 3.19 0.01 1.11 1.24 7 35430 1.45 0.01 0.91 0.80 8 35430 1.34 0.01 0.80 0.63 9 35430 2.49 0.01 1.08 1.11
10 35430 0.52 0.02 0.97 0.92 11 35430 0.25 0.02 0.90 0.75 12 35430 1.83 0.01 0.85 0.75 13 35430 1.57 0.01 0.97 0.92 14 35430 3.09 0.01 1.18 1.28 15 35430 1.16 0.01 1.03 1.01 16 35430 1.31 0.01 0.86 0.77 17 35430 1.82 0.01 1.12 1.12 18 35430 1.59 0.01 0.93 0.88 19 35430 1.66 0.01 1.04 1.00 20 35430 3.02 0.01 0.98 1.00 21 35430 1.41 0.01 1.10 1.20 22 35430 2.06 0.01 1.09 1.12 23 35430 1.94 0.01 0.94 0.89 24 35430 1.64 0.01 0.99 0.97 25 35430 2.32 0.01 1.12 1.20 26 35430 1.87 0.01 0.92 0.89 27 35430 2.67 0.01 1.01 1.03 28 35430 2.33 0.01 0.92 0.89
RD
29 35430 2.07 0.01 0.88 0.80 1 35430 0.70 0.02 0.98 0.96 2 35430 0.15 0.02 0.91 0.73 3 35430 1.93 0.01 1.09 1.13 4 35430 0.99 0.01 0.99 0.98 5 35430 0.73 0.02 1.04 1.06 6 35430 2.53 0.01 0.94 0.93 7 35430 2.26 0.01 1.13 1.19 8 35430 2.76 0.01 1.15 1.22 9 35430 0.88 0.02 0.87 0.68
10 35430 1.67 0.01 0.97 0.90 11 35430 1.94 0.01 1.02 0.98 12 35430 3.38 0.01 1.21 1.46 13 35430 0.85 0.02 0.97 1.08 14 35430 2.73 0.01 1.26 1.38 15 35430 2.46 0.01 0.90 0.86 16 35430 1.85 0.01 1.08 1.12 17 35430 1.09 0.01 0.89 0.93 18 35430 1.38 0.01 0.81 0.80 19 35430 1.53 0.01 0.88 0.91
WR
20 35430 2.54 0.01 0.88 0.88
2006 NYSESLAT Technical Manual
Page 161
APPENDIX E.1: CONFIRMATORY FACTOR ANALYSIS FOR THE 2005 NYSESLAT
New York State regulations, under the Federal Title III of the No Child Left Behind (NCLB) Act of 2001, require annual assessment of limited English proficient students using the New York State English as a Second Language Achievement Test (NYSESLAT) as a state-approved assessment tool. This test has been developed in accordance with the standards for Educational and Psychological Testing (American Educational Research Association, 1999) and the New York State testing requirements, within the principles and consistency of Universal Design and applicable Federal and State testing requirements. To meet these requirements, the test was developed for five grade spans (K–1, 2–4, 5–6, 7–8 and 9–12) in four modalities, i.e., Speaking, Listening, Reading, and Writing, to assess the English language proficiency of students from kindergarten through grade 12 who are English language learners. The maximum number of points by modalities and grade span is depicted in the following table:
Table E.1.1 Maximum Number of Points by Modality and Grade Span for the 2005 NYSESLAT
Maximum number of Points in NYSESLAT Subtests
Speaking Listening Reading Writing Writing
ConventionsPre–
Writing Writing Prompt
Grade Span CR MC MC MC SR ER
Total
Number of Points
K–1 34 24 15 15 0 0 88 2–4 34 26 26 12 6 4 108 5–6 34 26 26 16 6 4 112 7–8 34 27 29 16 6 4 116 9–12 34 27 29 16 6 4 116
E.1.1: Reporting of the NYSESLAT Scores The NYSESLAT scores are reported on two different scales, i.e., a scale that is a combination of Speaking and Listening modalities and another that is a combination of the Reading and Writing modalities. In 2006, the New York State Education Department (NYSED) professed an interest in examining the dimensionality of the data, with an eye toward the reporting of scores on a single English Language Performance Achievement (ELPA) score. In order to test the assumption of unidimensionality and compare it with the currently used two–dimensional model, a confirmatory factor analysis was used to examine the factor loading based on the different combination of the observed variables.

2006 NYSESLAT Technical Manual
Page 162
E.1.2: Method and Process Since the primary interest of this study was to compare the current reporting structure with an alternate preconceived unidimensional structure, a confirmatory factor model was the obvious choice for analysis from the various other factor models available. This study, therefore, tested the following two structures:
a. A one-factor model with the latent variable being ELPA. b. A two-factor model that tests the current structure of Speaking and Listening as one factor (SPKLIS), and Reading and Writing (Writing Conventions, Pre-Writing & Writing Prompt) as the other factor (WRTRD). For K-1, Writing includes Writing Conventions only.
Since this study was not intended to assess the appropriateness of individual item loading on the different modality-factors, all items were collapsed within their respective modality to produce five scores for each individual student, i.e., for Speaking, Listening, Reading, Writing Conventions, and Writing Constructed Response items (Pre-Writing + Writing Prompt). Since Writing Contentions are all multiple-choice items, and Pre-Writing and Writing prompts are constructed-response items, treating them as two indicator variables will help to enhance the discriminatory aspect of the separation and thus substantiate each individual cluster's standing in the model and improve the model fitting.
The factor loadings for the one- and two-factor models were therefore based on subtests of Speaking, Listening, Reading, Writing Conventions (Wrcon), and Writing Constructed Response Items (Wrcr). For the NYSESLAT, since the items were collapsed to produce the five subtests discussed above, there were measures that extend from a low of 10 scoring categories for the Writing constructed-response items, to a high of 35 categories for the Speaking subtest across all grade spans. The subtests can therefore be looked upon as polytomously scored items. Furthermore, as Jöreskog and Sörbom (1995a) have stated, for ordered categorical data that are not normally distributed but assumed to reflect normally distributed underlying variables, a better way to estimate the population correlations is by using polychoric correlation coefficients. With this in mind, polychoric correlations were used with the ML estimation procedure in this study. Although, there are various methods to evaluate the confirmatory factor model, a more global approach was used to assess the relative performance of the different models. The most commonly used indices were referenced in this study, i.e., the goodness-of-fit index (GFI), the adjusted-goodness-of-fit index (AGFI), the root mean squared residual (RMR) and the root-mean-squared error of approximation (RMSEA) and the χ2 index. However, a general consensus as to which of these methods is best does not exist, and no special weight is given to any of the indices outlined above in this study. According to Swygert, McLeod, and Thissen (2001), in the case of the overall fit of the model, the χ2 index should not be seen as much as a test of significance for the null of no difference in the fit of the model to the data but should be used as an indication of how far the data deviate from the model. High values indicate large deviance and small values

2006 NYSESLAT Technical Manual
Page 163
indicate small deviance. Furthermore, large sample sizes will generally produce larger Chi-square values. The GFI and AGFI indices have a range of 0 to 1, where values closer to 1 indicate a better fit of the model to the data. On the other hand the RMR is an index produced by the averaging of the fitted residuals. Hu and Bentler (1999) suggest RMR < 0.06 as acceptable. Similarly, Hu and Bentler (1999) suggest < 0.05 as acceptable for the RMSEA, which is a measure of the goodness of fit with known distribution properties. On the other hand, Browne and Cudeck (1993) and MacCallum, Browne, and Sugawara suggest RMSEA ≤ 0.05 as close model fit, values ranging from 0.06 to 0.08 as adequate fit, those between 0.09 and 0.10 as mediocre fit, and values greater than 0.10 as poor fit. The path diagrams for each of the one- and two-factor models are shown in Figures E.1.1 and E.1.2, below:
Figure E.1.1. Path Diagram for the one-factor model
Listen
Speak
Read
Wrcon
ELPA
Wrcr
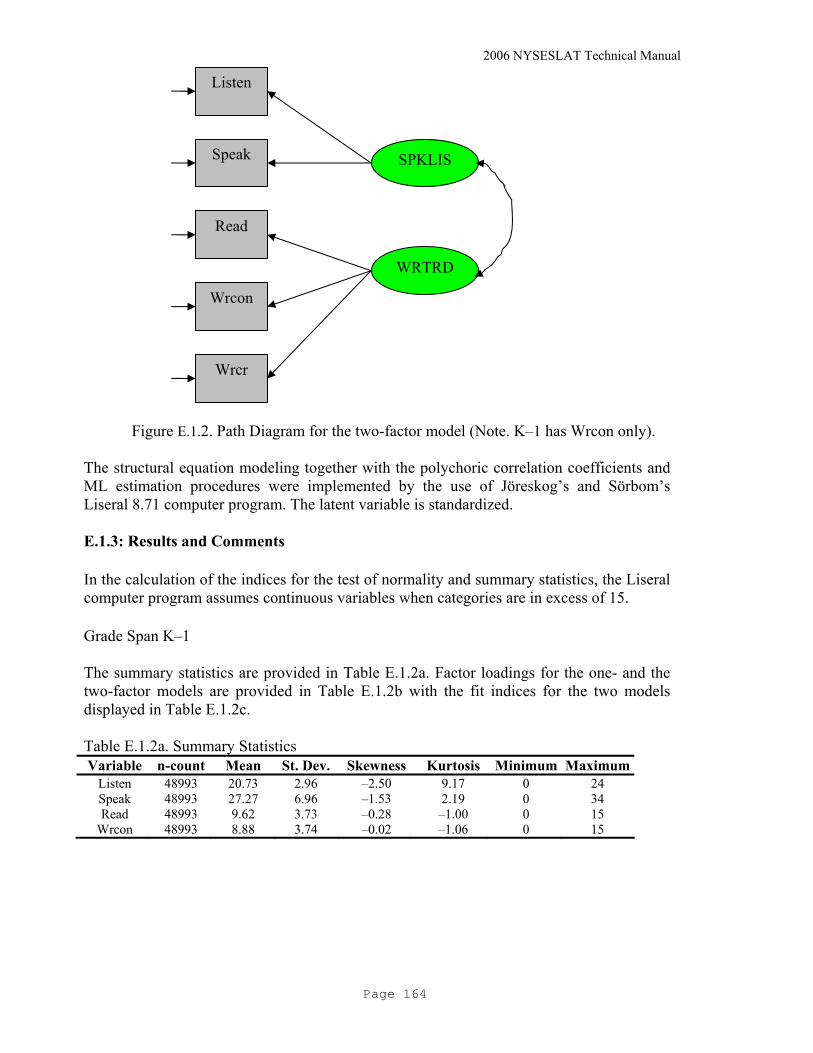
2006 NYSESLAT Technical Manual
Page 164
Figure E.1.2. Path Diagram for the two-factor model (Note. K–1 has Wrcon only).
The structural equation modeling together with the polychoric correlation coefficients and ML estimation procedures were implemented by the use of Jöreskog’s and Sörbom’s Liseral 8.71 computer program. The latent variable is standardized.
E.1.3: Results and Comments
In the calculation of the indices for the test of normality and summary statistics, the Liseral computer program assumes continuous variables when categories are in excess of 15.
Grade Span K–1
The summary statistics are provided in Table E.1.2a. Factor loadings for the one- and the two-factor models are provided in Table E.1.2b with the fit indices for the two models displayed in Table E.1.2c. Table E.1.2a. Summary Statistics Variable n-count Mean St. Dev. Skewness Kurtosis Minimum Maximum
Listen 48993 20.73 2.96 –2.50 9.17 0 24 Speak 48993 27.27 6.96 –1.53 2.19 0 34 Read 48993 9.62 3.73 –0.28 –1.00 0 15
Wrcon 48993 8.88 3.74 –0.02 –1.06 0 15
SPKLIS
WRTRD
Listen
Speak
Read
Wrcon
Wrcr

2006 NYSESLAT Technical Manual
Page 165
Table E.1.2b. Factor Loading Estimates for the One- and Two-Factor Models Modalities One-Factor Model Two-Factor Model
Λ Λ1 Λ2 Listen 0.54 0.76 – Speak 0.54 0.76 – Read 0.89 – 0.91
Wrcon 0.85 – 0.84 Correlation 0.66
Table E.1.2c. Global Fit Indices for the One- and Two-Factor Models
Fit Indices One-Factor Model Two-Factor Model Chi-square 9105.600 80.710
GFI 0.920 1.000 AGFI 0.580 0.990 RMR 0.091 0.004
RMSEA 0.300 0.041 Note: χ2 with 2 df, p=0.30 for the one-factor model and χ2 with 1 df, p=0.041 for the two-factor model. For the one-factor model, the values of GFI and AGFI are 0.92 and 0.58 respectively, and the RMR = 0.091 and the RMSEA = 0.30 are not sufficiently small, indicating that the model fit leaves much to be desired. The Chi-square value is also sufficiently large and significant with 2 degrees of freedom, suggesting a revision of the model for a better fit. In keeping with the current dimensionality of the test, the two-factor model with the loading of Speak and Listen on one factor (SPKLIS) and the Write (Wrcon) and Read on the second factor (WRTRD) was modeled. The results indicate a great improvement in fit of the model to the data. The rather weak loading of the Listen modality (0.54) is considerably improved with the two-factor model to 0.76. The RMR and RMSEA values have decreased a great deal to 0.004 and 0.041 respectively, and the GFI as well as the AGFI are at 1.00 and 0.99 respectively, which indicates that the model fits the data satisfactorily. Grade Span 2–4 The summary statistics are provided in Table E.1.3a. Factor loadings for the one- and two-factor models are provided in Table E.1.3b with the fit indices for the two models displayed in Table E.1.3c.
Table E.1.3a. Summary Statistics
Variable n-count Mean St. Dev. Skewness Kurtosis Minimum Maximum Listen 48997 19.25 4.24 –0.84 0.80 0 26 Speak 48997 29.45 6.51 –2.31 5.50 0 34 Read 48997 15.91 5.29 –0.27 –0.61 0 26
Wrcon 48997 8.21 2.49 –0.70 0.07 0 12 Wrcr 48997 6.51 2.95 –0.85 –0.23 0 10

2006 NYSESLAT Technical Manual
Page 166
Table E.1.3b. Factor Loading Estimates for the One- and Two-Factor Models Modalities One-Factor Model Two-Factor Model
Λ Λ1 Λ2 Listen 0.76 0.83 – Speak 0.65 0.70 – Read 0.83 – 0.84
Wrcon 0.79 – 0.80 Wrcr 0.83 0.83
Correlation 0.88 Table E.1.3c. Global Fit Indices for the One- and Two-Factor Models
Fit Indices One-Factor Model Two-Factor Model Chi-square 4775.550 2428.290
GFI 0.960 0.980 AGFI 0.890 0.930 RMR 0.035 0.022
RMSEA 0.140 0.110 Note: χ2 with 5 df, p=0.00 for the one-factor model and χ2 with 4 df, p=0.00 for the two-factor model. The fit of the model to the data is not acceptable with the one-factor model. The Chi-square value is extremely large (χ2 = 4775.550 with 5 df, p = 0.00). The value of GFI is 0.96 with a moderate value for the AGFI, i.e., 0.89. Both the RMR and the RMSEA are at 0.035 and 0.14 respectively. All these fit indices indicate that an alternate model might be justifiable. With the two-factor model, the Chi-square reduces substantially to 2428.29 (with 4df, p = 0.00). All the other fit indices also show improvement of the model fit with GFI and AGFI are at 0.98 and 0.93 respectively. RMR and RMSEA are also lower for the two-factor model, indicating that the two-factor model is better than the one-factor model. Grade Span 5–6 The summary statistics are provided in Table E.1.4a. Factor loadings for the one- and two-factor models are provided in Table E.1.4b with the fit indices for the two models displayed in Table E.1.4c. Table E.1.4a. Summary Statistics
Variable n-count Mean St. Dev. Skewness Kurtosis Minimum Maximum Listen 22114 18.81 4.77 –1.08 0.76 0 26 Speak 22114 28.68 7.95 –1.92 2.90 0 34 Read 22114 16.52 5.12 –0.39 –0.56 0 26
Wrcon 22114 11.87 3.62 –0.98 0.13 0 16 Wrcr 22114 6.79 2.95 –0.99 0.03 0 10
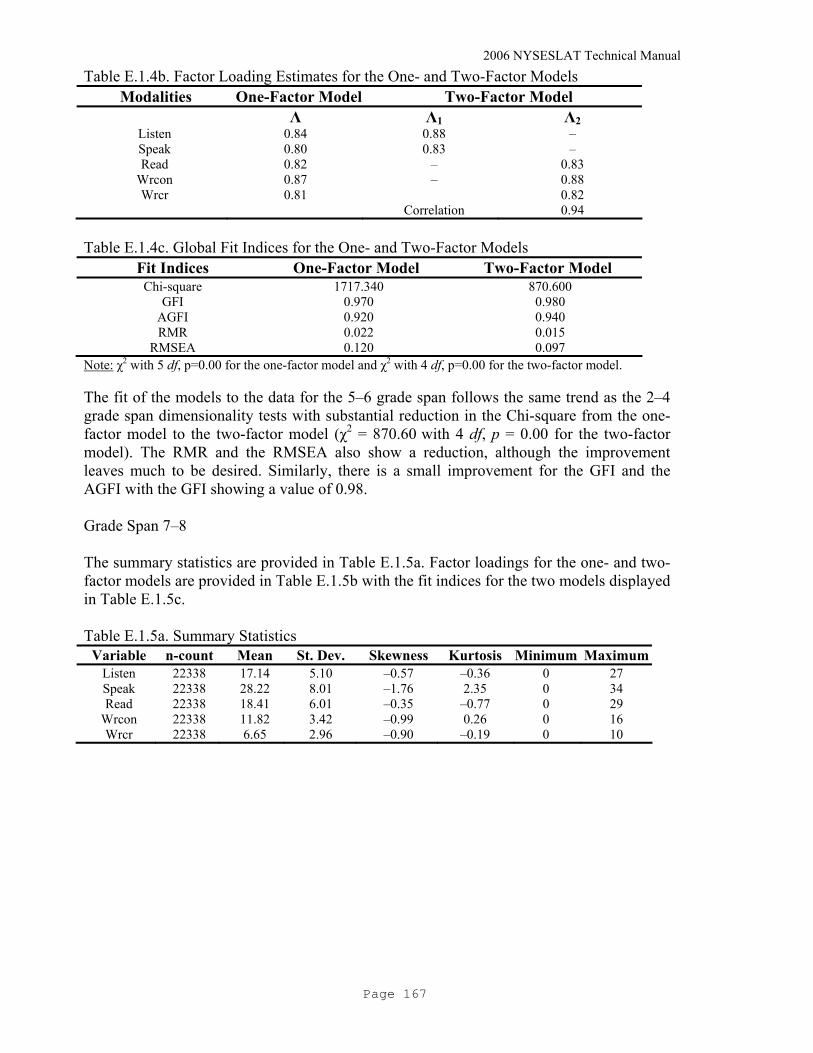
2006 NYSESLAT Technical Manual
Page 167
Table E.1.4b. Factor Loading Estimates for the One- and Two-Factor Models Modalities One-Factor Model Two-Factor Model
Λ Λ1 Λ2 Listen 0.84 0.88 – Speak 0.80 0.83 – Read 0.82 – 0.83
Wrcon 0.87 – 0.88 Wrcr 0.81 0.82
Correlation 0.94 Table E.1.4c. Global Fit Indices for the One- and Two-Factor Models
Fit Indices One-Factor Model Two-Factor Model Chi-square 1717.340 870.600
GFI 0.970 0.980 AGFI 0.920 0.940 RMR 0.022 0.015
RMSEA 0.120 0.097 Note: χ2 with 5 df, p=0.00 for the one-factor model and χ2 with 4 df, p=0.00 for the two-factor model. The fit of the models to the data for the 5–6 grade span follows the same trend as the 2–4 grade span dimensionality tests with substantial reduction in the Chi-square from the one-factor model to the two-factor model (χ2 = 870.60 with 4 df, p = 0.00 for the two-factor model). The RMR and the RMSEA also show a reduction, although the improvement leaves much to be desired. Similarly, there is a small improvement for the GFI and the AGFI with the GFI showing a value of 0.98. Grade Span 7–8 The summary statistics are provided in Table E.1.5a. Factor loadings for the one- and two-factor models are provided in Table E.1.5b with the fit indices for the two models displayed in Table E.1.5c.
Table E.1.5a. Summary Statistics
Variable n-count Mean St. Dev. Skewness Kurtosis Minimum Maximum Listen 22338 17.14 5.10 –0.57 –0.36 0 27 Speak 22338 28.22 8.01 –1.76 2.35 0 34 Read 22338 18.41 6.01 –0.35 –0.77 0 29
Wrcon 22338 11.82 3.42 –0.99 0.26 0 16 Wrcr 22338 6.65 2.96 –0.90 –0.19 0 10

2006 NYSESLAT Technical Manual
Page 168
Table E.1.5b. Factor Loading Estimates for the One- and Two-Factor Models Modalities One-Factor Model Two-Factor Model
Λ Λ1 Λ2 Listen 0.82 0.82 – Speak 0.78 0.78 – Read 0.82 – 0.83
Wrcon 0.87 – 0.87 Wrcr 0.77 0.77
correlation 1.00 Table E.1.5c. Global Fit Indices for the One- and Two-Factor Models
Fit Indices One-Factor Model Two-Factor Model Chi-square 1754.170 1753.020
GFI 0.970 0.970 AGFI 0.910 0.890 RMR 0.025 0.025
RMSEA 0.120 0.140 Note: χ2 with 5 df, p=0.00 for the one-factor model and χ2 with 4 df, p=0.00 for the two-factor model. For the 7–8 grade span, the performance of the two-factor model relative to the one-factor model is very similar. The factor loadings remain almost identical with the use of the two-factor model in comparison to their loadings on the one-factor model. The Chi-square, although still significant, remains unchanged. Furthermore, GFI and RMR are the same for both models. The AGFI and the RMSEA are slightly worse for the two-factor model than the one-factor model. Grade Span 9–12
The summary statistics are provided in Table E.1.6a. Factor loadings for the one- and two-factor models are provided in Table E.1.6b with the fit indices for the two models displayed in Table E.1.6c.
Table E.1.6a. Summary Statistics
Variable n-count Mean St. Dev. Skewness Kurtosis Minimum Maximum Listen 36994 16.87 4.84 –0.55 –0.08 0 27 Speak 36994 28.16 7.24 –1.73 2.74 0 34 Read 36994 21.50 5.60 –0.85 0.19 0 29
Wrcon 36994 10.74 2.90 –0.78 0.74 0 16 Wrcr 36994 6.95 2.90 –0.97 0.01 0 10

2006 NYSESLAT Technical Manual
Page 169
Table E.1.6b. Factor Loading Estimates for the One- and Two-Factor Models Modalities One-Factor Model Two-Factor Model
Λ Λ1 Λ2 Listen 0.79 0.79 – Speak 0.75 0.75 – Read 0.82 – 0.82
Wrcon 0.78 – 0.78 Wrcr 0.75 0.75
Correlation 1.00 Table E.1.6c. Global Fit Indices for the One- and Two-Factor Models
Fit Indices One-Factor Model Two-Factor Model Chi-square 2529.700 2523.730
GFI 0.970 0.970 AGFI 0.920 0.900 RMR 0.027 0.027
RMSEA 0.120 0.130 Note: χ2 with 5 df, p=0.00 for the one-factor model and χ2 with 4 df, p=0.00 for the two-factor model. The 9–12 grade span data did not show much improvement with the two-factor model over the one-factor model. The factor loadings remain almost identical with the use of the two-factor model in comparison to their loadings on the one-factor model. However, the Chi-square remained unchanged, and most other fit indices remained about the same from the one-factor to the two-factor model. The results were slightly mixed in the sense that in the case of GFI and RMR, the two-factor model produced same results, but by the same token, the AGFI reduced slightly and the RMSEA increased slightly in comparison to their values under the one-factor model. Once again, over-specification and the non-convergence of the model with different paths and additional constraints did not allow further modifications without crossing the boundaries of substantive understanding of the model. E.1.4: Conclusion Overall, the 2005 NYSESLAT dimensionality tests with the use of Confirmatory Factor Analysis produced results that substantiate the use of the two-factor model in reporting IRT scores, i.e., Speaking and Listening as one score and Writing and Reading as the other. With the exception of the 7–8 and 9–12 grade spans, the two-factor model provided a better fit of the model to the data than the one-factor unidimensional model as measured by global indices of fit. If one were to accept the recommendations of Browne et al. (1993) and MacCallum et al. (1996) for the evaluation of the RMSEA as a fit index, and Hu and Bentler (1999) for the RMR index, in conjunction with acceptable values of other fit indices, then the K–1 grade span has the most acceptable fit of the model to the data. Grade span K–1 was the only grade span that showed a non-significant Chi-square, and besides having acceptable RMR and RMSEA under the various criteria discussed above, the GFI and the AGFI were at 1.00 and 0.99.

2006 NYSESLAT Technical Manual
Page 170
In the 2–4 and the 5–6 grade spans, the unidimensionality of the NYSESLAT cannot be justifiable because of substantial improvement of the two-factor model fit to the data over the unidimensional model. With respect to the analysis of the 7-8 and 9–12 grade span tests, the factor loadings based on the one-factor model remain pretty much the same when they are loaded on two-factors. Since, the one-factor model does not show any improvement over the fit of the two-factor model it could be left alone to preserve the status quo of the NYSESLAT, at least for the next few years. Extra care could also be taken with an eye toward content and substantive issues in selecting items for the future.

2006 NYSESLAT Technical Manual
Page 171
APPENDIX E.2: CONFIRMATORY FACTOR ANALYSIS FOR THE 2006 NYSESLAT
New York State regulations, under the Federal Title III of the No Child Left Behind (NCLB) Act of 2001, require annual assessment of limited English proficient students using the New York State English as a Second Language Achievement Test (NYSESLAT) as a state-approved assessment tool. This test has been developed in accordance with the standards for Educational and Psychological Testing (American Educational Research Association, 1999) and the New York State testing requirements, within the principles and consistency of Universal Design and applicable Federal and State testing requirements. To meet these requirements, the test was developed for five grade spans (K–1, 2–4, 5–6, 7–8, and 9–12) in four modalities, i.e., Speaking, Listening, Reading, and Writing, to assess the English language proficiency of students from kindergarten through grade 12 who are English language learners. The maximum number of points by modalities and grade span is depicted in the following table: Table E.2.1. Maximum Number of Points by Modality and Grade Span for the 2006
NYSESLAT
Maximum number of Points in NYSESLAT Subtests
Speaking Listening Reading Writing
Writing Conventions
Pre- Writing
Writing Prompt
Grade Span CR MC MC MC SR ER
Total
Number of Points
K–1 34 24 15 10 0 18 101 2–4 34 26 26 12 6 4 108 5–6 34 26 26 16 6 4 112 7–8 34 27 29 16 6 4 116 9–12 34 27 29 16 6 4 116
E.2.1: Reporting of the NYSESLAT Scores The NYSESLAT scores are reported on two different scales, i.e., a scale that is a combination of Speaking and Listening modalities and another that is a combination of the Reading and Writing modalities. In 2006, the New York State Education Department, (NYSED) professed an interest in examining the dimensionality of the data, with an eye toward the reporting of scores on a single English Language Performance Achievement (ELPA) score. In order to test the assumption of unidimensionality and compare it with the currently used two-dimensional model, a confirmatory factor analysis was used to examine the factor loading based on the different combination of the observed variables.

2006 NYSESLAT Technical Manual
Page 172
E.2.2: Method and Process Since the primary interest of this study was to compare the current reporting structure with an alternate preconceived unidimensional structure, a confirmatory factor model was the obvious choice for analysis from the various other factor models available. This study, therefore, tested the following two structures:
a. A one-factor model with the latent variable being ELPA. b. A two-factor model that tests the current structure of Speaking and Listening as one factor (SPKLIS), and Reading, Writing Conventions (Wrcon), and Writing Constructed Response items (Wrcr, Pre-Writing + Writing Prompt) as the other factor (WRTRD).
The results of these confirmatory factor analyses based on the 2006 data set, and it is based on the full population responses. Since this study was not intended to assess the appropriateness of individual item loading on the different modality-factors, all items were collapsed within their respective modality to produce five scores for each individual student, i.e., for Speaking, Listening, Reading, Writing Conventions (Wrcon), and Writing Constructed Response Items (Wrcr). The factor loadings for the one- and two-factor models were therefore based on subtests of Speaking, Listening, Reading, Wrcon, and Wrcr. For the NYSESLAT, since the items were collapsed to produce the subtests discussed above, there were five modality measures that extend from a low of 10 scoring categories for the Writing Conventions to a high of 35 categories for the Speaking subtest across all grade spans. The subtests can therefore be looked upon as polytomously scored items. Furthermore, as Jöreskog and Sörbom (1995a) have stated, for ordered categorical data that are not normally distributed but assumed to reflect normally distributed underlying variables, a better way to estimate the population correlations is by using polychloric correlation coefficients. With this in mind, polychloric correlations were used with the ML estimation procedure in this study. Although there are various methods to evaluate the confirmatory factor model, a more global approach was used to assess the relative performance of the different models. The most commonly used indices were referenced in this study, i.e., the goodness-of-fit index (GFI), the adjusted-goodness-of-fit index (AGFI), the root mean squared residual (RMR) and the root-mean-squared error of approximation (RMSEA), and the χ2 index. However, a general consensus as to which of these methods is best does not exist, and no special weight is given to any of the indices outlined above, in this study. According to Swygert et al. (2001), in the case of the overall fit of the model, the χ2 index should not be seen as much as a test of significance for the null of no difference in the fit of the model to the data, but should be used as an indication of how far the data deviate from the model. High values indicate large deviance and small values indicate small deviance. Furthermore, large sample sizes will generally produce larger Chi-square values.

2006 NYSESLAT Technical Manual
Page 173
The GFI and AGFI indices have a range of 0 to 1, where values closer to 1 indicate a better fit of the model to the data. On the other hand, the RMR is an index produced by the averaging of the fitted residuals. Hu and Bentler (1999) suggest RMR < 0.06 as acceptable. Similarly, Hu and Bentler (1999) suggest < 0.05 as acceptable for the RMSEA, which is a measure of the goodness of fit with known distribution properties. On the other hand, Browne and Cudeck (1993) and MacCallum, Browne, and Sugawara suggest RMSEA ≤ 0.05 as close model fit, values ranging form 0.06 to 0.08 as adequate fit, those between 0.09 and 0.10 as mediocre fit, and values greater than 0.10 as poor fit. The path diagrams for each of the one- and two-factor models are shown in Figures E.2.1 and E.2.2, below:
Figure E.2.1. Path Diagram for the one-factor model
Listen
Speak
Read
Wrcon
ELPA
Wrcr

2006 NYSESLAT Technical Manual
Page 174
Figure E.2.2. Path Diagram for the two-factor model
The structural equation modeling together with the polychloric correlation coefficients and ML estimation procedures were implemented by the use of Jöreskog’s and Sörbom’s Liseral 8.71 computer program. The latent variable is standardized.
E.2.3: Results and Comments
Grade Span K–1
The summary statistics are provided in Table E.2.2a. Factor loadings for the one and two factor models are provided in Table E.2.2b with the fit indices for the two models displayed in Table E.2.2c.
Table E.2.2a. Summary Statistics
Variable n-count Mean St. Dev. Skewness Kurtosis Minimum MaximumListen 48867 20.32 4.10 –2.18 5.72 0 24 Speak 48867 27.63 6.97 –1.55 2.09 1 34 Read 48867 10.06 3.56 –0.31 –0.92 0 15
Wrcon 48867 7.38 2.38 –0.72 –0.39 0 10 Wrcr 48867 12.81 4.26 –0.69 –0.20 0 18
SPKLIS
WRTRD
Listen
Speak
Read
Wrcon
Wrcr
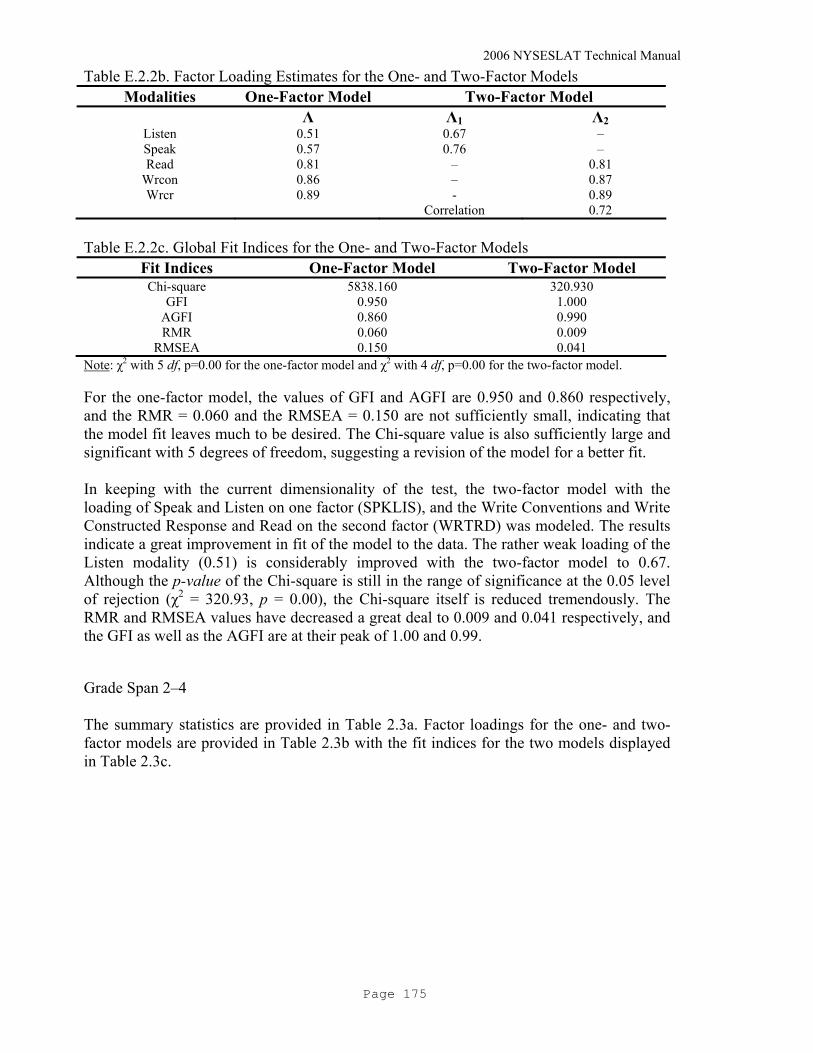
2006 NYSESLAT Technical Manual
Page 175
Table E.2.2b. Factor Loading Estimates for the One- and Two-Factor Models Modalities One-Factor Model Two-Factor Model
Λ Λ1 Λ2 Listen 0.51 0.67 – Speak 0.57 0.76 – Read 0.81 – 0.81
Wrcon 0.86 – 0.87 Wrcr 0.89 - 0.89
Correlation 0.72 Table E.2.2c. Global Fit Indices for the One- and Two-Factor Models
Fit Indices One-Factor Model Two-Factor Model Chi-square 5838.160 320.930
GFI 0.950 1.000 AGFI 0.860 0.990 RMR 0.060 0.009
RMSEA 0.150 0.041 Note: χ2 with 5 df, p=0.00 for the one-factor model and χ2 with 4 df, p=0.00 for the two-factor model. For the one-factor model, the values of GFI and AGFI are 0.950 and 0.860 respectively, and the RMR = 0.060 and the RMSEA = 0.150 are not sufficiently small, indicating that the model fit leaves much to be desired. The Chi-square value is also sufficiently large and significant with 5 degrees of freedom, suggesting a revision of the model for a better fit. In keeping with the current dimensionality of the test, the two-factor model with the loading of Speak and Listen on one factor (SPKLIS), and the Write Conventions and Write Constructed Response and Read on the second factor (WRTRD) was modeled. The results indicate a great improvement in fit of the model to the data. The rather weak loading of the Listen modality (0.51) is considerably improved with the two-factor model to 0.67. Although the p-value of the Chi-square is still in the range of significance at the 0.05 level of rejection (χ2 = 320.93, p = 0.00), the Chi-square itself is reduced tremendously. The RMR and RMSEA values have decreased a great deal to 0.009 and 0.041 respectively, and the GFI as well as the AGFI are at their peak of 1.00 and 0.99. Grade Span 2–4
The summary statistics are provided in Table 2.3a. Factor loadings for the one- and two-factor models are provided in Table 2.3b with the fit indices for the two models displayed in Table 2.3c.
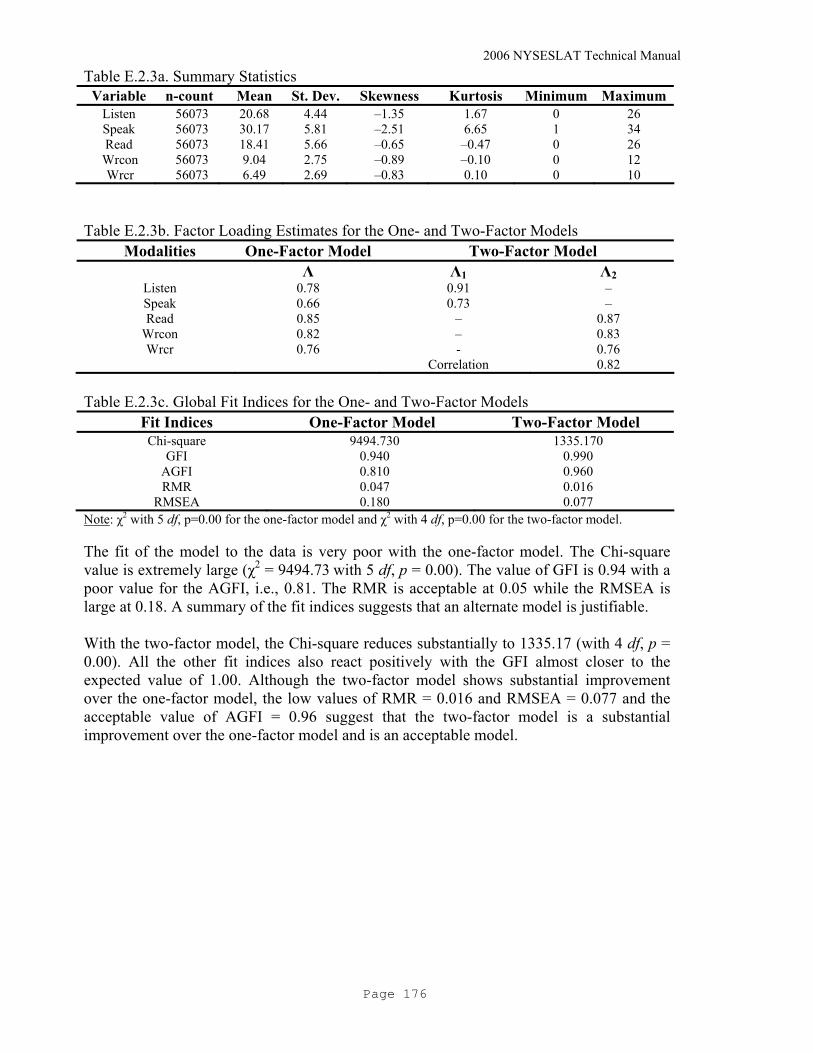
2006 NYSESLAT Technical Manual
Page 176
Table E.2.3a. Summary Statistics Variable n-count Mean St. Dev. Skewness Kurtosis Minimum Maximum
Listen 56073 20.68 4.44 –1.35 1.67 0 26 Speak 56073 30.17 5.81 –2.51 6.65 1 34 Read 56073 18.41 5.66 –0.65 –0.47 0 26 Wrcon 56073 9.04 2.75 –0.89 –0.10 0 12 Wrcr 56073 6.49 2.69 –0.83 0.10 0 10
Table E.2.3b. Factor Loading Estimates for the One- and Two-Factor Models
Modalities One-Factor Model Two-Factor Model Λ Λ1 Λ2
Listen 0.78 0.91 – Speak 0.66 0.73 – Read 0.85 – 0.87
Wrcon 0.82 – 0.83 Wrcr 0.76 - 0.76
Correlation 0.82 Table E.2.3c. Global Fit Indices for the One- and Two-Factor Models
Fit Indices One-Factor Model Two-Factor Model Chi-square 9494.730 1335.170
GFI 0.940 0.990 AGFI 0.810 0.960 RMR 0.047 0.016
RMSEA 0.180 0.077 Note: χ2 with 5 df, p=0.00 for the one-factor model and χ2 with 4 df, p=0.00 for the two-factor model. The fit of the model to the data is very poor with the one-factor model. The Chi-square value is extremely large (χ2 = 9494.73 with 5 df, p = 0.00). The value of GFI is 0.94 with a poor value for the AGFI, i.e., 0.81. The RMR is acceptable at 0.05 while the RMSEA is large at 0.18. A summary of the fit indices suggests that an alternate model is justifiable. With the two-factor model, the Chi-square reduces substantially to 1335.17 (with 4 df, p = 0.00). All the other fit indices also react positively with the GFI almost closer to the expected value of 1.00. Although the two-factor model shows substantial improvement over the one-factor model, the low values of RMR = 0.016 and RMSEA = 0.077 and the acceptable value of AGFI = 0.96 suggest that the two-factor model is a substantial improvement over the one-factor model and is an acceptable model.
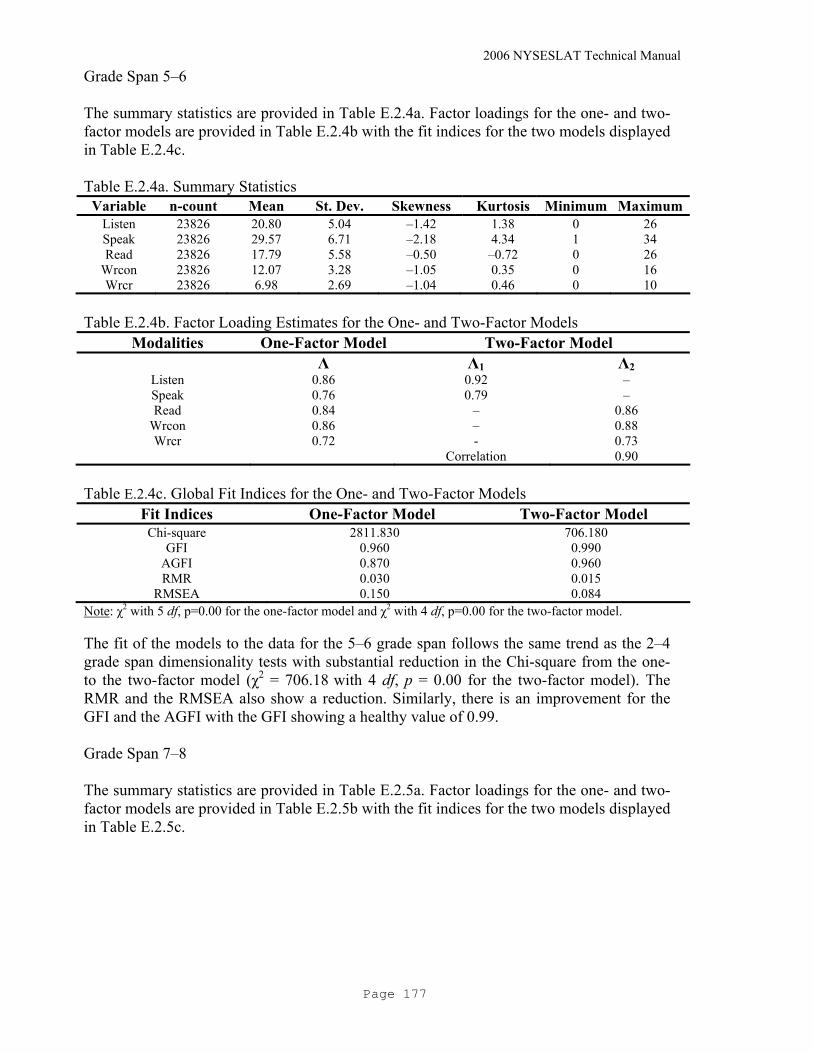
2006 NYSESLAT Technical Manual
Page 177
Grade Span 5–6 The summary statistics are provided in Table E.2.4a. Factor loadings for the one- and two-factor models are provided in Table E.2.4b with the fit indices for the two models displayed in Table E.2.4c. Table E.2.4a. Summary Statistics
Variable n-count Mean St. Dev. Skewness Kurtosis Minimum MaximumListen 23826 20.80 5.04 –1.42 1.38 0 26 Speak 23826 29.57 6.71 –2.18 4.34 1 34 Read 23826 17.79 5.58 –0.50 –0.72 0 26
Wrcon 23826 12.07 3.28 –1.05 0.35 0 16 Wrcr 23826 6.98 2.69 –1.04 0.46 0 10
Table E.2.4b. Factor Loading Estimates for the One- and Two-Factor Models
Modalities One-Factor Model Two-Factor Model Λ Λ1 Λ2
Listen 0.86 0.92 – Speak 0.76 0.79 – Read 0.84 – 0.86
Wrcon 0.86 – 0.88 Wrcr 0.72 - 0.73
Correlation 0.90 Table E.2.4c. Global Fit Indices for the One- and Two-Factor Models
Fit Indices One-Factor Model Two-Factor Model Chi-square 2811.830 706.180
GFI 0.960 0.990 AGFI 0.870 0.960 RMR 0.030 0.015
RMSEA 0.150 0.084 Note: χ2 with 5 df, p=0.00 for the one-factor model and χ2 with 4 df, p=0.00 for the two-factor model. The fit of the models to the data for the 5–6 grade span follows the same trend as the 2–4 grade span dimensionality tests with substantial reduction in the Chi-square from the one- to the two-factor model (χ2 = 706.18 with 4 df, p = 0.00 for the two-factor model). The RMR and the RMSEA also show a reduction. Similarly, there is an improvement for the GFI and the AGFI with the GFI showing a healthy value of 0.99. Grade Span 7–8
The summary statistics are provided in Table E.2.5a. Factor loadings for the one- and two-factor models are provided in Table E.2.5b with the fit indices for the two models displayed in Table E.2.5c.
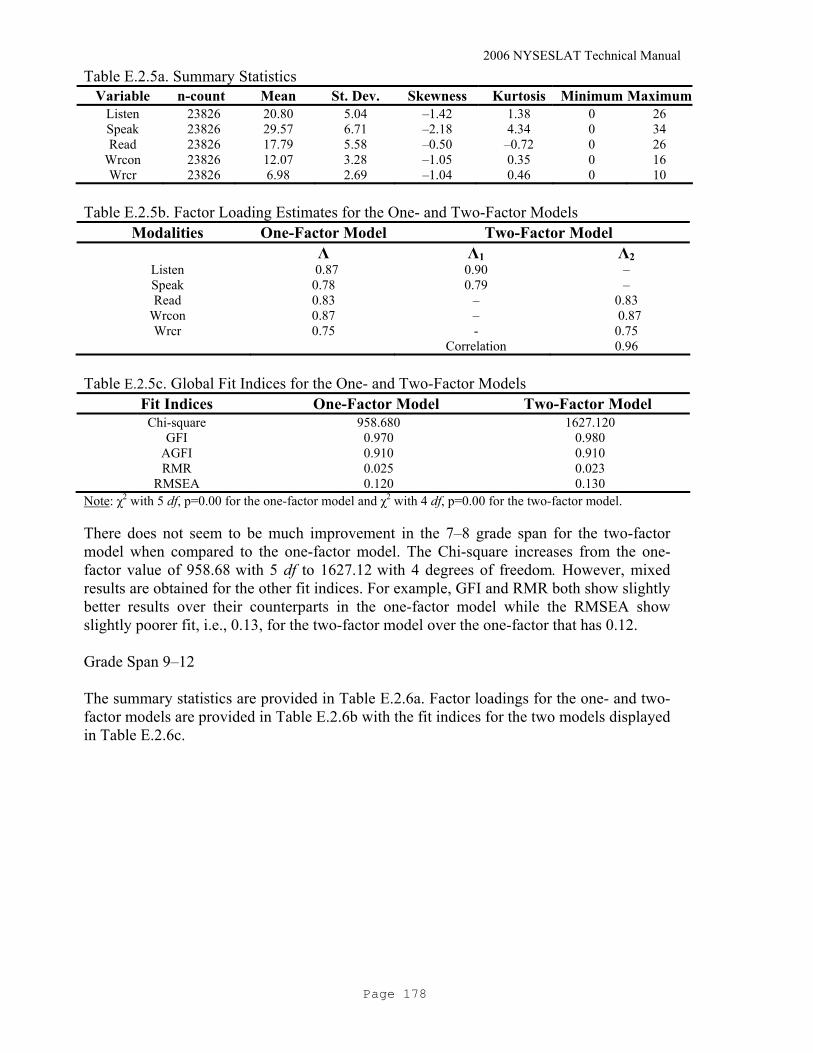
2006 NYSESLAT Technical Manual
Page 178
Table E.2.5a. Summary Statistics Variable n-count Mean St. Dev. Skewness Kurtosis Minimum Maximum
Listen 23826 20.80 5.04 –1.42 1.38 0 26 Speak 23826 29.57 6.71 –2.18 4.34 0 34 Read 23826 17.79 5.58 –0.50 –0.72 0 26
Wrcon 23826 12.07 3.28 –1.05 0.35 0 16 Wrcr 23826 6.98 2.69 –1.04 0.46 0 10
Table E.2.5b. Factor Loading Estimates for the One- and Two-Factor Models
Modalities One-Factor Model Two-Factor Model Λ Λ1 Λ2
Listen 0.87 0.90 – Speak 0.78 0.79 – Read 0.83 – 0.83
Wrcon 0.87 – 0.87 Wrcr 0.75 - 0.75
Correlation 0.96 Table E.2.5c. Global Fit Indices for the One- and Two-Factor Models
Fit Indices One-Factor Model Two-Factor Model Chi-square 958.680 1627.120
GFI 0.970 0.980 AGFI 0.910 0.910 RMR 0.025 0.023
RMSEA 0.120 0.130 Note: χ2 with 5 df, p=0.00 for the one-factor model and χ2 with 4 df, p=0.00 for the two-factor model. There does not seem to be much improvement in the 7–8 grade span for the two-factor model when compared to the one-factor model. The Chi-square increases from the one-factor value of 958.68 with 5 df to 1627.12 with 4 degrees of freedom. However, mixed results are obtained for the other fit indices. For example, GFI and RMR both show slightly better results over their counterparts in the one-factor model while the RMSEA show slightly poorer fit, i.e., 0.13, for the two-factor model over the one-factor that has 0.12. Grade Span 9–12
The summary statistics are provided in Table E.2.6a. Factor loadings for the one- and two-factor models are provided in Table E.2.6b with the fit indices for the two models displayed in Table E.2.6c.

2006 NYSESLAT Technical Manual
Page 179
Table E.2.6a. Summary Statistics Variable n-count Mean St. Dev. Skewness Kurtosis Minimum Maximum
Listen 34446 18.81 4.87 –0.72 0.03 0 27 Speak 34446 27.47 7.44 –1.40 1.30 0 34 Read 34446 20.45 5.85 –0.60 –0.52 0 29
Wrcon 34446 11.09 3.23 –0.58 –0.38 0 16 Wrcr 34446 6.97 2.65 –1.07 0.43 0 10
Table E.2.6b. Factor Loading Estimates for the One- and Two-Factor Models
Modalities One-Factor Model Two-Factor Model Λ Λ1 Λ2
Listen 0.83 0.85 – Speak 0.75 0.76 – Read 0.84 – 0.85
Wrcon 0.81 – 0.82 Wrcr 0.74 - 0.74
Correlation 0.96 Table E.2.6c. Global Fit Indices for the One- and Two-Factor Models
Fit Indices One-Factor Model Two-Factor Model Chi-square 1698.330 1390.910
GFI 0.980 0.980 AGFI 0.940 0.940 RMR 0.022 0.021
RMSEA 0.096 0.099 Note: χ2 with 2 df, p=0.00 for the one-factor model and χ2 with 1 df, p=0.00 for the two-factor model. Similar to the 2005 data and the 2006 7–8 grade span results, the 9–12 grade span data also did not show much improvement with the two-factor model over the one-factor model. The factor loadings remain almost identical with the use of the two-factor model in comparison to their loadings on the one-factor model. However, the Chi-square reduced (χ2 = 1698.33 with 5 df for the one-factor model and χ2 = 1390.91with 4 df for the two-factor model), most other fit indices remained about the same from the one-factor to the two-factor model. The results were slightly mixed in the sense that in the case of RMR, the two-factor model produced slightly better results, and the RMSEA increased slightly in comparison to their values under the one-factor model. E.2.4: Conclusion Overall, the 2006 NYSESLAT dimensionality tests with the use of Confirmatory Factor Analysis produced results that substantiate the use of the two-factor model in reporting IRT scores, i.e., Speaking and Listening as one score and Writing Conventions and Writing Constructed Response Items and Reading as the other. With the exception of the 7–8 and the 9–12 grade spans, the two-factor model provided a better fit of the model to the data than the one-factor unidimensional model as measured by global indices of fit. If one were to accept the recommendations of Browne et al. (1993) and MacCallum et al. (1996) for the evaluation of the RMSEA as a fit index, and Hu and Bentler (1999) for the RMR index, in conjunction with acceptable values of other fit indices, then the two-factor model for K–1 grade span has the most acceptable fit of the model to the data. Grade span

2006 NYSESLAT Technical Manual
Page 180
K–1, besides having acceptable RMR and RMSEA under the various criteria discussed above, the GFI and the AGFI were 1.00 and 0.99. In the 2–4 and the 5–6 grade spans, the unidimensionality of the NYSESLAT scoring cannot be justifiable because of substantial improvement of the two-factor model fit to the data over the unidimensional model. With respect to the analysis of the 7–8 and the 9–12 grade span tests, the factor loadings based on the one-factor model remain pretty much the same when they are loaded on two-factors. Since the one-factor model does not show any improvement over the fit of the two-factor model it could be left alone to preserve the status quo of the NYSESLAT, at least for the next few years. Extra care could also be taken with an eye towards content and substantive issues in selecting items for the future.

2006 NYSESLAT Technical Manual
Page 181
APPENDIX F: STANDARD-SETTING MATERIALS
F.1: Standard-setting Meeting Agendas
Groups 1, 3, and 4 (Grade Spans K–1, 5–6, and 7–8)
Time Agenda Topic Group
Mon 1:00–1:30 Check-in (30min) All 1:30–1:45 Welcome and Introductions (15 min) All 1:45–2:45 Orientation to Standard Setting (60 min) All 2:45–3:00 Break (15 min) All 3:00–5:00 Experience Test Break-out Tues 8:00–8:30 Continental Breakfast All 8:30–9:30 Develop Common Understanding of Proficiency Levels Test 1 Break-out 9:30–10:30 Round 1 Ratings for Test 1 Break-out 10:30–11:30 Develop Common Understanding of Proficiency Levels Test 2 Break-out 11:30–12:30 Round 1 Ratings for Test 2 Break-out 12:30–1:30 Lunch All 1:30–3:00 Round 2 Ratings for Test 1 Break-out 3:00–4:30 Round 2 Ratings for Test 2 Break-out Wed 8:00–8:30 Continental Breakfast All 8:30–10:30 Combined Discussion Between All Groups All 10:30–12:00 Review of Round 2 Ratings for Test 1 + Final Round of Ratings for
Test 1 Break-out
12:00–1:00 Lunch All 1:00–2:30 Review of Round 2 Ratings for Test 2 + Final Round of Ratings for
Test 2 Break-out
2:30–3:00 Review Final Ratings for Test 1 and Test 2 + Debriefing

2006 NYSESLAT Technical Manual
Page 182
Group 2 (Grade Span 2–4)
Time
Agenda Topic
Group
Mon 1:00–1:30 Check-in (30min) All 1:30–1:45 Welcome and Introductions (15 min) All 1:45–2:45 Orientation to Standard Setting (60 min) All 2:45–3:00 Break (15 min) All 3:00–5:00 Experience Test Break-out Tues 8:00–8:30 Continental Breakfast All 8:30–9:30 Develop Common Understanding of Proficiency Levels Test 1 Break-out 9:30–10:30 Round 1 Ratings for Test 1 Break-out 10:30–11:30 Develop Common Understanding of Proficiency Levels Test 2 Break-out 11:30–12:30 Round 1 Ratings for Test 2 Break-out 12:30–1:30 Lunch All 1:30–2:30 Develop Common Understanding of Proficiency Levels Test 3 Break-out 2:30–3:30 Round 1 Ratings for Test 3 Break-out 3:30–5:00 Round 2 Ratings for Test 1 Break-out Wed 8:00–8:30 Continental Breakfast All 8:30–10:30 Combined Discussion Between All Groups All 10:30–12:00 Round 2 Ratings for Test 2 Break-out 12:00–1:00 Lunch All 1:00–2:30 Round 2 Ratings for Test 3 Break-out 2:30–4:30 Review of Round 2 Ratings for Test 1 + Final Round of Ratings for
Test 1 Break-out
Thurs 8:00–8:30 Continental Breakfast All 8:30–10:30 Review of Round 2 Ratings for Test 2 + Final Round of Ratings for
Test 2 Break-out
10:30–12:00 Review of Round 2 Ratings for Test 3 + Final Round of Ratings for Test 3
Break-out
12:00–12:30 Review Final Ratings for Test 1, Test 2 and Test 3 + Debriefing Break-out
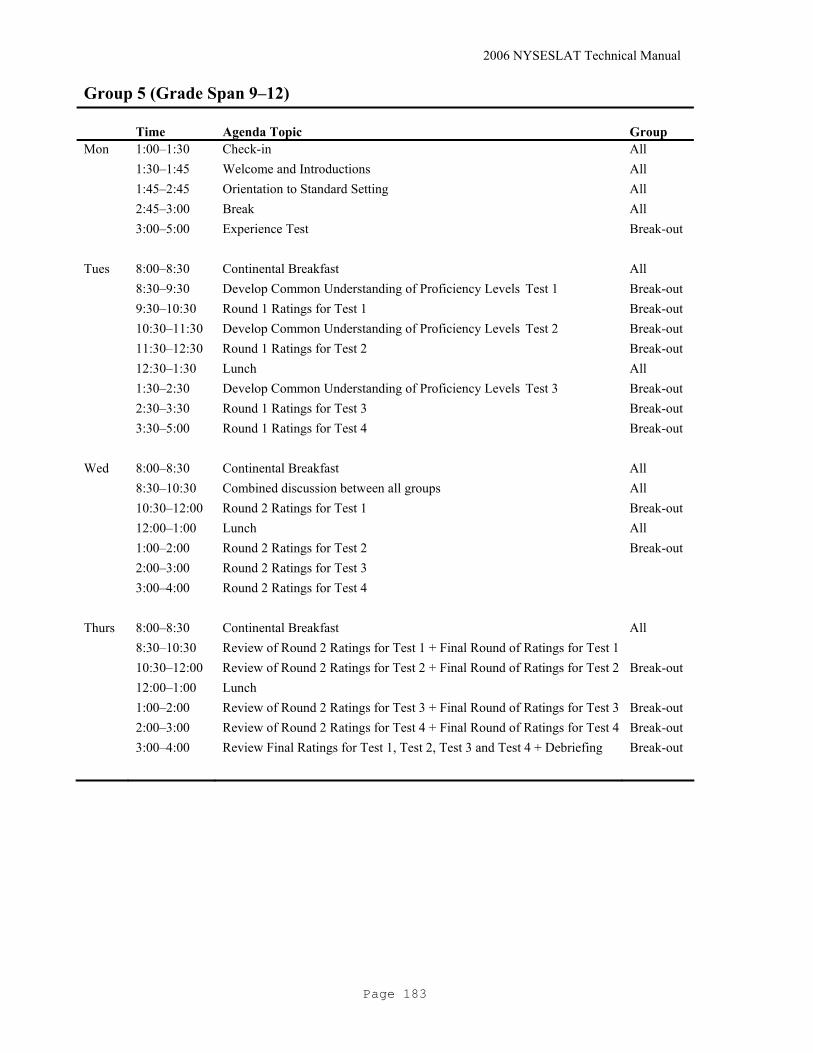
2006 NYSESLAT Technical Manual
Page 183
Group 5 (Grade Span 9–12)
Time
Agenda Topic
Group
Mon 1:00–1:30 Check-in All 1:30–1:45 Welcome and Introductions All 1:45–2:45 Orientation to Standard Setting All 2:45–3:00 Break All 3:00–5:00 Experience Test Break-out Tues 8:00–8:30 Continental Breakfast All 8:30–9:30 Develop Common Understanding of Proficiency Levels Test 1 Break-out 9:30–10:30 Round 1 Ratings for Test 1 Break-out 10:30–11:30 Develop Common Understanding of Proficiency Levels Test 2 Break-out 11:30–12:30 Round 1 Ratings for Test 2 Break-out 12:30–1:30 Lunch All 1:30–2:30 Develop Common Understanding of Proficiency Levels Test 3 Break-out 2:30–3:30 Round 1 Ratings for Test 3 Break-out 3:30–5:00 Round 1 Ratings for Test 4 Break-out Wed 8:00–8:30 Continental Breakfast All 8:30–10:30 Combined discussion between all groups All 10:30–12:00 Round 2 Ratings for Test 1 Break-out 12:00–1:00 Lunch All 1:00–2:00 Round 2 Ratings for Test 2 Break-out 2:00–3:00 Round 2 Ratings for Test 3 3:00–4:00 Round 2 Ratings for Test 4 Thurs 8:00–8:30 Continental Breakfast All 8:30–10:30 Review of Round 2 Ratings for Test 1 + Final Round of Ratings for Test 1 10:30–12:00 Review of Round 2 Ratings for Test 2 + Final Round of Ratings for Test 2 Break-out 12:00–1:00 Lunch 1:00–2:00 Review of Round 2 Ratings for Test 3 + Final Round of Ratings for Test 3 Break-out 2:00–3:00 Review of Round 2 Ratings for Test 4 + Final Round of Ratings for Test 4 Break-out 3:00–4:00 Review Final Ratings for Test 1, Test 2, Test 3 and Test 4 + Debriefing Break-out
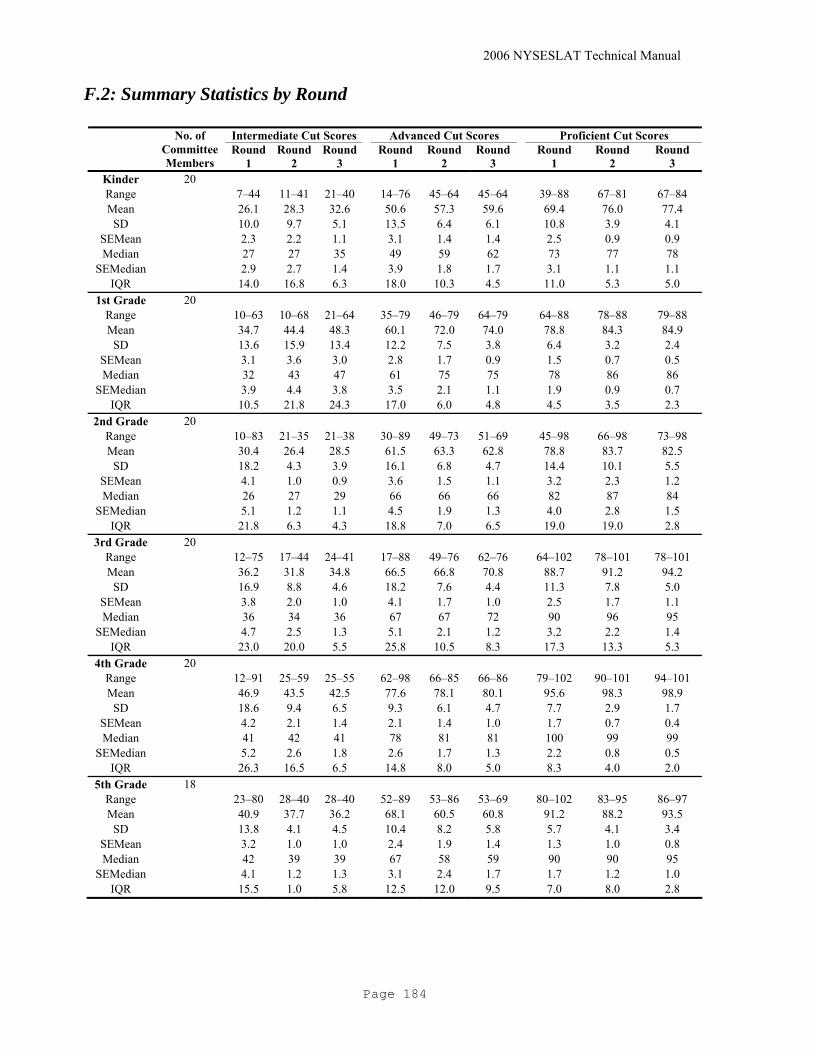
2006 NYSESLAT Technical Manual
Page 184
F.2: Summary Statistics by Round
Intermediate Cut Scores Advanced Cut Scores Proficient Cut Scores No. of Committee Members
Round 1
Round 2
Round3
Round 1
Round 2
Round 3
Round 1
Round 2
Round 3
Kinder 20 Range 7–44 11–41 21–40 14–76 45–64 45–64 39–88 67–81 67–84 Mean 26.1 28.3 32.6 50.6 57.3 59.6 69.4 76.0 77.4
SD 10.0 9.7 5.1 13.5 6.4 6.1 10.8 3.9 4.1 SEMean 2.3 2.2 1.1 3.1 1.4 1.4 2.5 0.9 0.9 Median 27 27 35 49 59 62 73 77 78
SEMedian 2.9 2.7 1.4 3.9 1.8 1.7 3.1 1.1 1.1 IQR 14.0 16.8 6.3 18.0 10.3 4.5 11.0 5.3 5.0
1st Grade 20 Range 10–63 10–68 21–64 35–79 46–79 64–79 64–88 78–88 79–88 Mean 34.7 44.4 48.3 60.1 72.0 74.0 78.8 84.3 84.9
SD 13.6 15.9 13.4 12.2 7.5 3.8 6.4 3.2 2.4 SEMean 3.1 3.6 3.0 2.8 1.7 0.9 1.5 0.7 0.5 Median 32 43 47 61 75 75 78 86 86
SEMedian 3.9 4.4 3.8 3.5 2.1 1.1 1.9 0.9 0.7 IQR 10.5 21.8 24.3 17.0 6.0 4.8 4.5 3.5 2.3
2nd Grade 20 Range 10–83 21–35 21–38 30–89 49–73 51–69 45–98 66–98 73–98 Mean 30.4 26.4 28.5 61.5 63.3 62.8 78.8 83.7 82.5
SD 18.2 4.3 3.9 16.1 6.8 4.7 14.4 10.1 5.5 SEMean 4.1 1.0 0.9 3.6 1.5 1.1 3.2 2.3 1.2 Median 26 27 29 66 66 66 82 87 84
SEMedian 5.1 1.2 1.1 4.5 1.9 1.3 4.0 2.8 1.5 IQR 21.8 6.3 4.3 18.8 7.0 6.5 19.0 19.0 2.8
3rd Grade 20 Range 12–75 17–44 24–41 17–88 49–76 62–76 64–102 78–101 78–101 Mean 36.2 31.8 34.8 66.5 66.8 70.8 88.7 91.2 94.2
SD 16.9 8.8 4.6 18.2 7.6 4.4 11.3 7.8 5.0 SEMean 3.8 2.0 1.0 4.1 1.7 1.0 2.5 1.7 1.1 Median 36 34 36 67 67 72 90 96 95
SEMedian 4.7 2.5 1.3 5.1 2.1 1.2 3.2 2.2 1.4 IQR 23.0 20.0 5.5 25.8 10.5 8.3 17.3 13.3 5.3
4th Grade 20 Range 12–91 25–59 25–55 62–98 66–85 66–86 79–102 90–101 94–101 Mean 46.9 43.5 42.5 77.6 78.1 80.1 95.6 98.3 98.9
SD 18.6 9.4 6.5 9.3 6.1 4.7 7.7 2.9 1.7 SEMean 4.2 2.1 1.4 2.1 1.4 1.0 1.7 0.7 0.4 Median 41 42 41 78 81 81 100 99 99
SEMedian 5.2 2.6 1.8 2.6 1.7 1.3 2.2 0.8 0.5 IQR 26.3 16.5 6.5 14.8 8.0 5.0 8.3 4.0 2.0
5th Grade 18 Range 23–80 28–40 28–40 52–89 53–86 53–69 80–102 83–95 86–97 Mean 40.9 37.7 36.2 68.1 60.5 60.8 91.2 88.2 93.5
SD 13.8 4.1 4.5 10.4 8.2 5.8 5.7 4.1 3.4 SEMean 3.2 1.0 1.0 2.4 1.9 1.4 1.3 1.0 0.8 Median 42 39 39 67 58 59 90 90 95
SEMedian 4.1 1.2 1.3 3.1 2.4 1.7 1.7 1.2 1.0 IQR 15.5 1.0 5.8 12.5 12.0 9.5 7.0 8.0 2.8
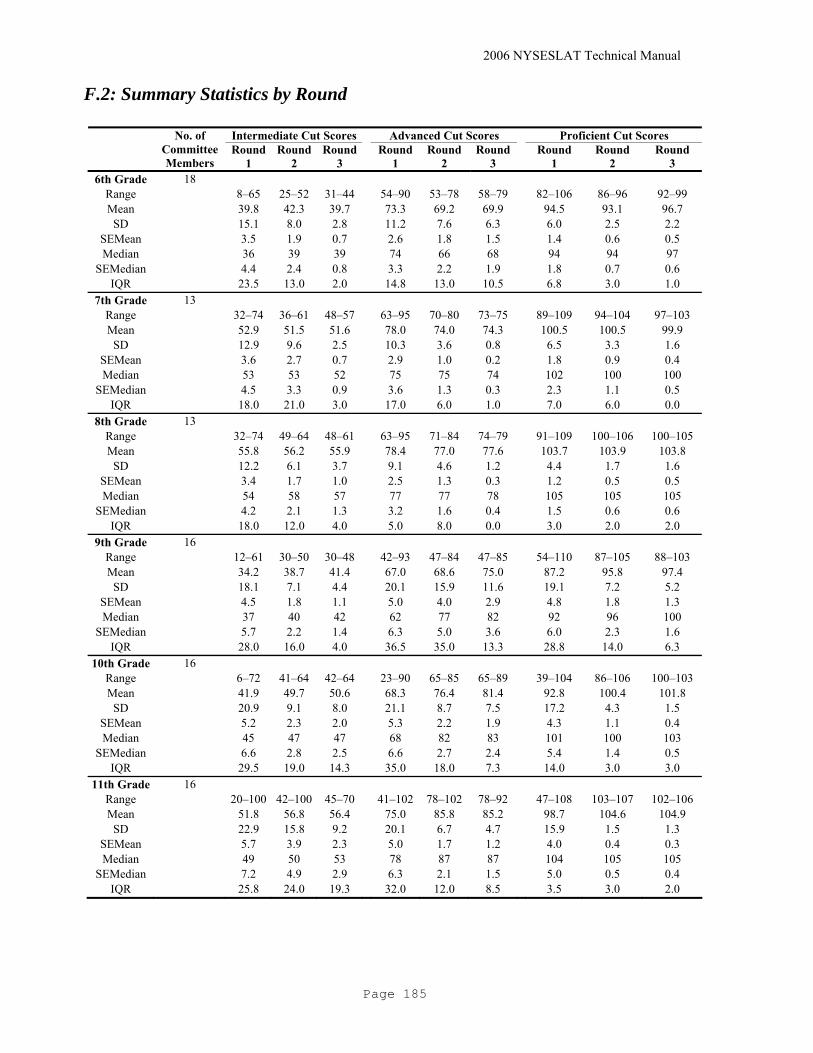
2006 NYSESLAT Technical Manual
Page 185
F.2: Summary Statistics by Round
Intermediate Cut Scores Advanced Cut Scores Proficient Cut Scores No. of Committee Members
Round 1
Round 2
Round3
Round 1
Round 2
Round 3
Round 1
Round 2
Round 3
6th Grade 18 Range 8–65 25–52 31–44 54–90 53–78 58–79 82–106 86–96 92–99 Mean 39.8 42.3 39.7 73.3 69.2 69.9 94.5 93.1 96.7
SD 15.1 8.0 2.8 11.2 7.6 6.3 6.0 2.5 2.2 SEMean 3.5 1.9 0.7 2.6 1.8 1.5 1.4 0.6 0.5 Median 36 39 39 74 66 68 94 94 97
SEMedian 4.4 2.4 0.8 3.3 2.2 1.9 1.8 0.7 0.6 IQR 23.5 13.0 2.0 14.8 13.0 10.5 6.8 3.0 1.0
7th Grade 13 Range 32–74 36–61 48–57 63–95 70–80 73–75 89–109 94–104 97–103 Mean 52.9 51.5 51.6 78.0 74.0 74.3 100.5 100.5 99.9
SD 12.9 9.6 2.5 10.3 3.6 0.8 6.5 3.3 1.6 SEMean 3.6 2.7 0.7 2.9 1.0 0.2 1.8 0.9 0.4 Median 53 53 52 75 75 74 102 100 100
SEMedian 4.5 3.3 0.9 3.6 1.3 0.3 2.3 1.1 0.5 IQR 18.0 21.0 3.0 17.0 6.0 1.0 7.0 6.0 0.0
8th Grade 13 Range 32–74 49–64 48–61 63–95 71–84 74–79 91–109 100–106 100–105 Mean 55.8 56.2 55.9 78.4 77.0 77.6 103.7 103.9 103.8
SD 12.2 6.1 3.7 9.1 4.6 1.2 4.4 1.7 1.6 SEMean 3.4 1.7 1.0 2.5 1.3 0.3 1.2 0.5 0.5 Median 54 58 57 77 77 78 105 105 105
SEMedian 4.2 2.1 1.3 3.2 1.6 0.4 1.5 0.6 0.6 IQR 18.0 12.0 4.0 5.0 8.0 0.0 3.0 2.0 2.0
9th Grade 16 Range 12–61 30–50 30–48 42–93 47–84 47–85 54–110 87–105 88–103 Mean 34.2 38.7 41.4 67.0 68.6 75.0 87.2 95.8 97.4
SD 18.1 7.1 4.4 20.1 15.9 11.6 19.1 7.2 5.2 SEMean 4.5 1.8 1.1 5.0 4.0 2.9 4.8 1.8 1.3 Median 37 40 42 62 77 82 92 96 100
SEMedian 5.7 2.2 1.4 6.3 5.0 3.6 6.0 2.3 1.6 IQR 28.0 16.0 4.0 36.5 35.0 13.3 28.8 14.0 6.3
10th Grade 16 Range 6–72 41–64 42–64 23–90 65–85 65–89 39–104 86–106 100–103 Mean 41.9 49.7 50.6 68.3 76.4 81.4 92.8 100.4 101.8
SD 20.9 9.1 8.0 21.1 8.7 7.5 17.2 4.3 1.5 SEMean 5.2 2.3 2.0 5.3 2.2 1.9 4.3 1.1 0.4 Median 45 47 47 68 82 83 101 100 103
SEMedian 6.6 2.8 2.5 6.6 2.7 2.4 5.4 1.4 0.5 IQR 29.5 19.0 14.3 35.0 18.0 7.3 14.0 3.0 3.0
11th Grade 16 Range 20–100 42–100 45–70 41–102 78–102 78–92 47–108 103–107 102–106 Mean 51.8 56.8 56.4 75.0 85.8 85.2 98.7 104.6 104.9
SD 22.9 15.8 9.2 20.1 6.7 4.7 15.9 1.5 1.3 SEMean 5.7 3.9 2.3 5.0 1.7 1.2 4.0 0.4 0.3 Median 49 50 53 78 87 87 104 105 105
SEMedian 7.2 4.9 2.9 6.3 2.1 1.5 5.0 0.5 0.4 IQR 25.8 24.0 19.3 32.0 12.0 8.5 3.5 3.0 2.0
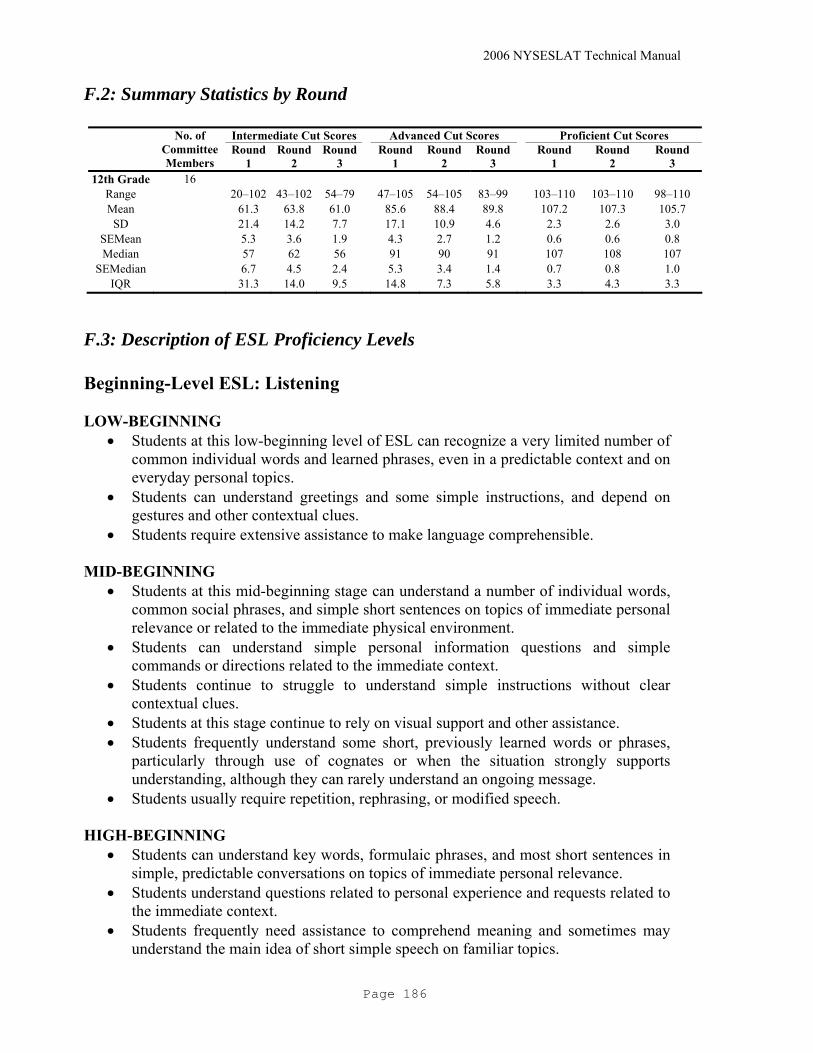
2006 NYSESLAT Technical Manual
Page 186
F.2: Summary Statistics by Round
Intermediate Cut Scores Advanced Cut Scores Proficient Cut Scores No. of Committee Members
Round 1
Round 2
Round3
Round 1
Round 2
Round 3
Round 1
Round 2
Round 3
12th Grade 16 Range 20–102 43–102 54–79 47–105 54–105 83–99 103–110 103–110 98–110 Mean 61.3 63.8 61.0 85.6 88.4 89.8 107.2 107.3 105.7
SD 21.4 14.2 7.7 17.1 10.9 4.6 2.3 2.6 3.0 SEMean 5.3 3.6 1.9 4.3 2.7 1.2 0.6 0.6 0.8 Median 57 62 56 91 90 91 107 108 107
SEMedian 6.7 4.5 2.4 5.3 3.4 1.4 0.7 0.8 1.0 IQR 31.3 14.0 9.5 14.8 7.3 5.8 3.3 4.3 3.3
F.3: Description of ESL Proficiency Levels Beginning-Level ESL: Listening LOW-BEGINNING
• Students at this low-beginning level of ESL can recognize a very limited number of common individual words and learned phrases, even in a predictable context and on everyday personal topics.
• Students can understand greetings and some simple instructions, and depend on gestures and other contextual clues.
• Students require extensive assistance to make language comprehensible. MID-BEGINNING
• Students at this mid-beginning stage can understand a number of individual words, common social phrases, and simple short sentences on topics of immediate personal relevance or related to the immediate physical environment.
• Students can understand simple personal information questions and simple commands or directions related to the immediate context.
• Students continue to struggle to understand simple instructions without clear contextual clues.
• Students at this stage continue to rely on visual support and other assistance. • Students frequently understand some short, previously learned words or phrases,
particularly through use of cognates or when the situation strongly supports understanding, although they can rarely understand an ongoing message.
• Students usually require repetition, rephrasing, or modified speech. HIGH-BEGINNING
• Students can understand key words, formulaic phrases, and most short sentences in simple, predictable conversations on topics of immediate personal relevance.
• Students understand questions related to personal experience and requests related to the immediate context.
• Students frequently need assistance to comprehend meaning and sometimes may understand the main idea of short simple speech on familiar topics.

2006 NYSESLAT Technical Manual
Page 187
• Students can sometimes understand an ongoing message but still often require repetition, rephrasing, or modified speech.
Beginning-Level ESL: Speaking LOW-BEGINNING
• Students demonstrate little or no functional communicative ability in English. • Students demonstrate almost no control of basic grammar structures and verb
tenses, and have a very limited vocabulary. • Students depend greatly on gestures in expressing meaning and may also switch to
first language at times. • Students’ pronunciation difficulties may significantly impede communication.
MID-BEGINNING
• Students can communicate in face-to-face interactions in a very limited way, using single words and short, learned phrases sufficient for meeting simple needs and for expressing basic courtesies.
• Students demonstrate little control of basic grammar structures and verb tenses, and continue to depend on gestures in expressing meaning.
• Students’ pronunciation difficulties may significantly impede communication. • Students frequently need assistance and are often misunderstood even by attentive
listeners. • Students’ speech is characterized by frequent pauses and occasionally by use of
native language. HIGH-BEGINNING
• Students can communicate basic immediate needs and simple personal experiences with some difficulty in short, informal face-to-face conversations.
• Students can describe a situation or tell a simple story, using a variety of short sentences.
• Students demonstrate some control of basic grammar and can use basic time expressions to communicate past events with limited accuracy.
• Students demonstrate adequate vocabulary for everyday communication that relates to familiar topics.
• Students can ask and answer simple questions, and initiate and respond to simple statements.
• Students can sometimes recombine learned material in original ways, although with limited grammatical accuracy.
• Students are sometimes misunderstood even by attentive listeners.

2006 NYSESLAT Technical Manual
Page 188
Beginning-Level ESL: Reading LOW-BEGINNING
• Students are limited in their ability to meaningfully decode words and interpret sound-symbol relationships in English.
• Students may be able to read isolated words, common phrases, and familiar public signs with visual support.
MID-BEGINNING
• Students can read familiar person and place names, common public signs, and simple texts, especially if related to immediate needs.
• Students can find information in a simple text with clear format and layout. • Students can match illustrations to short sentences containing some familiar words. • Students may understand clearly related sentences when context, background
knowledge, or visual information supports meaning. • Punctuation clues rarely support students’ comprehension.
HIGH-BEGINNING
• Students usually read slowly, word by word. • Students understand many common words and/or phrases, and can phonetically
decode familiar and some unfamiliar words. • Students sometimes understand new words and phrases in context or through
cognates. • Students sometimes understand common sentence connectors. • Students can sometimes locate facts and specific details in short, simple texts with
clear layout. • Students often understand related sentences when context, prior knowledge, or
visual information supports meaning. • Punctuation clues begin to support students’ comprehension.
Beginning-Level ESL: Writing LOW-BEGINNING
• Students have few or no practical writing skills in English. • Students’ limited knowledge of English and English spelling conventions limits
their ability to write down unfamiliar words. • Students are sometimes able to write isolated words and/or common phrases, and
may be able to copy/record time, addresses, names, and numbers. MID-BEGINNING
• Students can write a few phrases about themselves and family or other highly familiar information, such as a simple description.
• Students have minimal practical writing skills in English and demonstrate limited awareness of sound-letter correspondence and mechanics.
• Students can write some familiar numbers, letters, and words and can write down basic personal identification information.
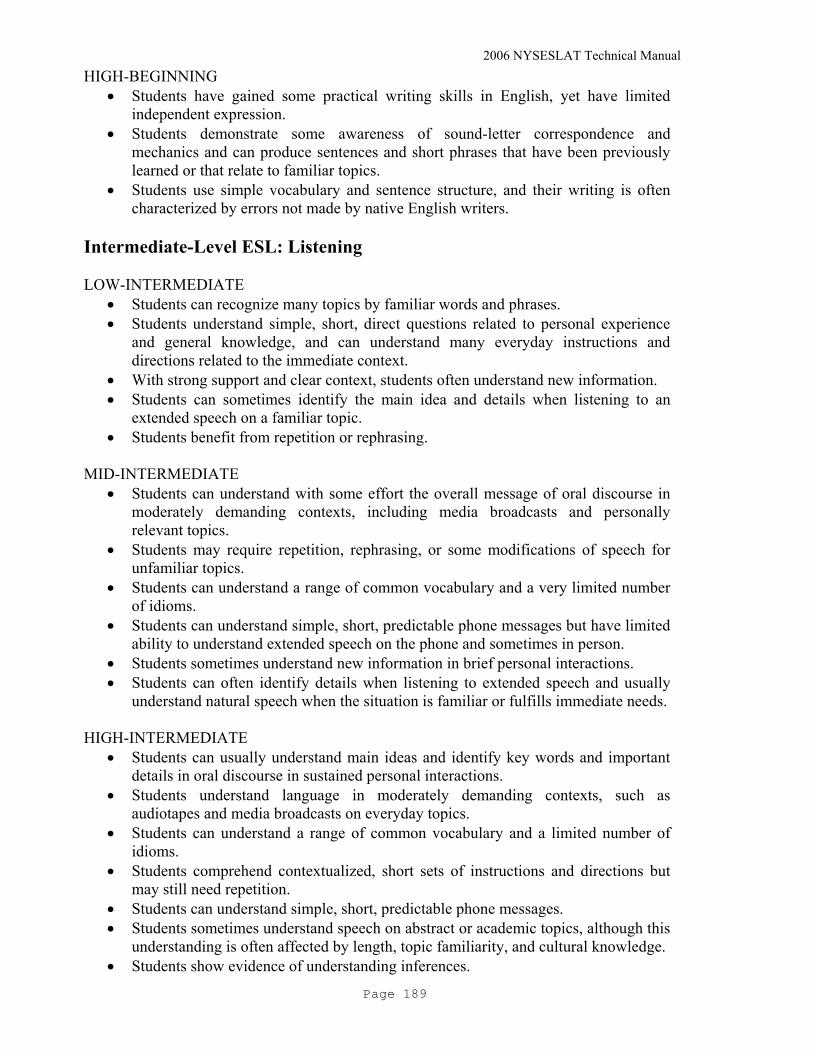
2006 NYSESLAT Technical Manual
Page 189
HIGH-BEGINNING • Students have gained some practical writing skills in English, yet have limited
independent expression. • Students demonstrate some awareness of sound-letter correspondence and
mechanics and can produce sentences and short phrases that have been previously learned or that relate to familiar topics.
• Students use simple vocabulary and sentence structure, and their writing is often characterized by errors not made by native English writers.
Intermediate-Level ESL: Listening LOW-INTERMEDIATE
• Students can recognize many topics by familiar words and phrases. • Students understand simple, short, direct questions related to personal experience
and general knowledge, and can understand many everyday instructions and directions related to the immediate context.
• With strong support and clear context, students often understand new information. • Students can sometimes identify the main idea and details when listening to an
extended speech on a familiar topic. • Students benefit from repetition or rephrasing.
MID-INTERMEDIATE
• Students can understand with some effort the overall message of oral discourse in moderately demanding contexts, including media broadcasts and personally relevant topics.
• Students may require repetition, rephrasing, or some modifications of speech for unfamiliar topics.
• Students can understand a range of common vocabulary and a very limited number of idioms.
• Students can understand simple, short, predictable phone messages but have limited ability to understand extended speech on the phone and sometimes in person.
• Students sometimes understand new information in brief personal interactions. • Students can often identify details when listening to extended speech and usually
understand natural speech when the situation is familiar or fulfills immediate needs. HIGH-INTERMEDIATE
• Students can usually understand main ideas and identify key words and important details in oral discourse in sustained personal interactions.
• Students understand language in moderately demanding contexts, such as audiotapes and media broadcasts on everyday topics.
• Students can understand a range of common vocabulary and a limited number of idioms.
• Students comprehend contextualized, short sets of instructions and directions but may still need repetition.
• Students can understand simple, short, predictable phone messages. • Students sometimes understand speech on abstract or academic topics, although this
understanding is often affected by length, topic familiarity, and cultural knowledge. • Students show evidence of understanding inferences.

2006 NYSESLAT Technical Manual
Page 190
Intermediate-Level ESL: Speaking LOW-INTERMEDIATE
• Students can maintain a face-to-face conversation on a familiar topic, using a variety of simple structures and even some complex ones.
• Students’ speech demonstrates a range of common words, some low-frequency vocabulary, and a limited number of idioms, although they may avoid topics with unfamiliar vocabulary.
• Students’ speech may include occasional word-for-word translations, and they sometimes have to repeat themselves to be understood by the general public.
• Students correctly use a limited range of grammatical structures, and grammar and pronunciation errors are frequent and sometimes impede communication.
• Students occasionally express original ideas with limited grammatical accuracy and much circumlocution regarding low-frequency vocabulary.
• Students continue to employ use of gestures and rely less frequently on visuals to communicate.
MID-INTERMEDIATE
• Students can communicate in social situations and in some less routine situations on familiar topics of personal relevance.
• Students can communicate facts and ideas in some detail, adding details or rephrasing messages to facilitate conversation.
• Students can use a variety of structures with some omission or reduction of elements such as articles.
• Grammar and pronunciation errors are still common and may sometimes impede communication, especially when the students are speaking about academic topics.
• Students demonstrate a range of everyday vocabulary and some common phrases and idioms.
• Students’ use of more academic vocabulary may be characterized by inappropriate word choice and awkward phrasing.
• Students’ discourse is reasonably fluent, but hesitations and pauses are still frequent.
• Students may rely too heavily on familiar grammatical structures and vocabulary to communicate message.
HIGH-INTERMEDIATE
• Students can communicate somewhat comfortably and spontaneously in many common daily situations, participating in informal conversations and some formal conversations with some confidence.
• Students can speak on familiar concrete and academic topics at a descriptive level, using a variety of vocabulary resources, although sometimes inappropriately.
• Grammar and pronunciation errors are relatively frequent but rarely impede communication.
• Students’ discourse is reasonably fluent but with frequent self-corrections and/or rephrasing to facilitate communication.
• Students demonstrate control over most basic and many complex grammatical structures and have a growing inventory of common idiomatic language.
• Students at this stage can usually be understood by attentive listeners.
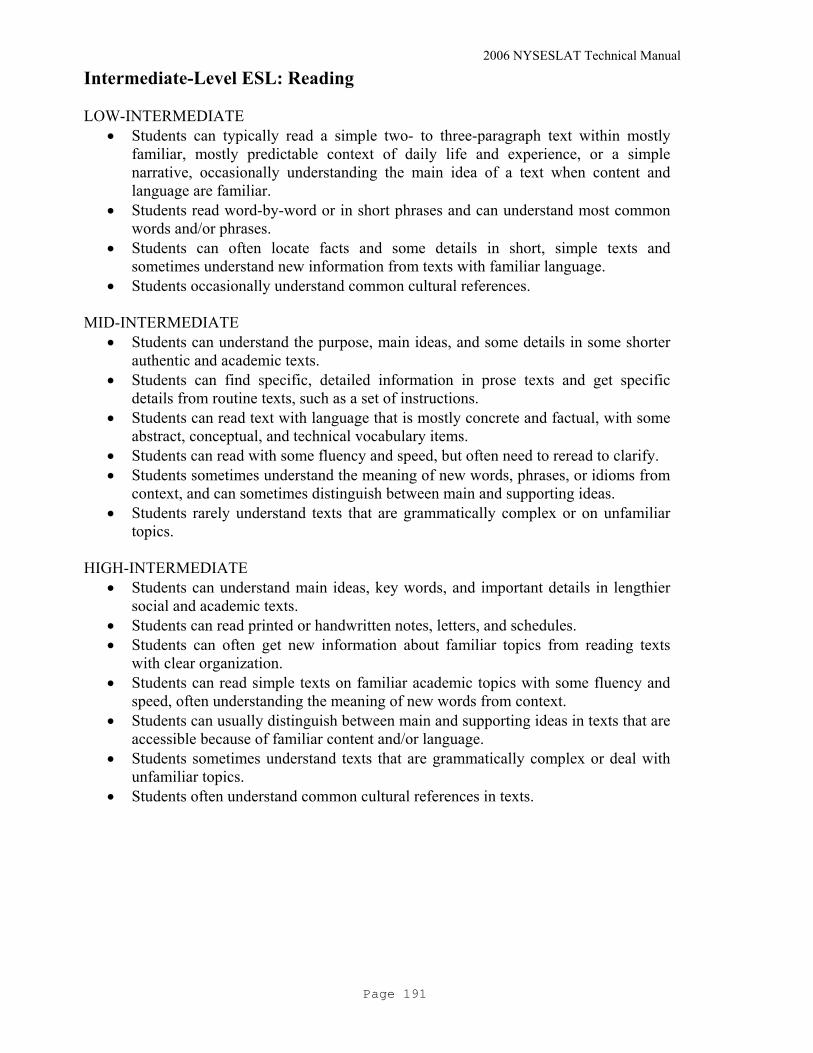
2006 NYSESLAT Technical Manual
Page 191
Intermediate-Level ESL: Reading LOW-INTERMEDIATE
• Students can typically read a simple two- to three-paragraph text within mostly familiar, mostly predictable context of daily life and experience, or a simple narrative, occasionally understanding the main idea of a text when content and language are familiar.
• Students read word-by-word or in short phrases and can understand most common words and/or phrases.
• Students can often locate facts and some details in short, simple texts and sometimes understand new information from texts with familiar language.
• Students occasionally understand common cultural references. MID-INTERMEDIATE
• Students can understand the purpose, main ideas, and some details in some shorter authentic and academic texts.
• Students can find specific, detailed information in prose texts and get specific details from routine texts, such as a set of instructions.
• Students can read text with language that is mostly concrete and factual, with some abstract, conceptual, and technical vocabulary items.
• Students can read with some fluency and speed, but often need to reread to clarify. • Students sometimes understand the meaning of new words, phrases, or idioms from
context, and can sometimes distinguish between main and supporting ideas. • Students rarely understand texts that are grammatically complex or on unfamiliar
topics. HIGH-INTERMEDIATE
• Students can understand main ideas, key words, and important details in lengthier social and academic texts.
• Students can read printed or handwritten notes, letters, and schedules. • Students can often get new information about familiar topics from reading texts
with clear organization. • Students can read simple texts on familiar academic topics with some fluency and
speed, often understanding the meaning of new words from context. • Students can usually distinguish between main and supporting ideas in texts that are
accessible because of familiar content and/or language. • Students sometimes understand texts that are grammatically complex or deal with
unfamiliar topics. • Students often understand common cultural references in texts.

2006 NYSESLAT Technical Manual
Page 192
Intermediate-Level ESL: Writing LOW-INTERMEDIATE
• Students can write simple descriptions and narrations of events, stories, and plans about themselves and family or other highly familiar topics.
• Students use familiar vocabulary and structures but often exhibit a lack of control over grammar, vocabulary, punctuation, and spelling.
• Students can write original short texts and demonstrate some evidence of organizational ability in their writing.
• Students can write on some concrete and familiar topics and write short messages such as postcards, notes, directions, and letters.
MID-INTERMEDIATE
• Students can effectively convey an idea, opinion, feeling, or experience in a simple paragraph, though their writing often exhibits a lack of strong control over grammar, vocabulary, punctuation, and spelling.
• Students can write short letters and notes on a familiar topic and reproduce in writing simple information they have received orally or visually.
• Students demonstrate some effective control over writing when reproducing information.
• When creating their own texts, students’ language remains simple, and some phrases may be characterized by nonnative English word combinations.
• Students can write on a variety of familiar topics and write original short texts, using familiar vocabulary and structures.
• Students demonstrate some evidence of organizational ability. HIGH-INTERMEDIATE
• Students can effectively convey familiar information in familiar standard formats. • Students can effectively reproduce information received orally or visually, and can
take simple notes from short oral presentations or from reference materials. • Students demonstrate good control over simple structures but have difficulty with
some complex structures and produce some nonstandard word combinations. • Students can write about topics relating to personal and academic interests, and
show some ability to write organized and developed text. • Students use some cohesive devices appropriately and display some control of
sentence structure and punctuation to indicate sentence boundaries and separation of ideas.
• Students sometimes use inappropriate vocabulary and word forms. Advanced-Level ESL: Listening LOW-ADVANCED
• Students can usually comprehend main points and most important details in oral discourse in moderately demanding language contexts, including media broadcasts.
• Students often cannot sustain understanding of conceptually or linguistically complex speech and require slower speech, repetitions, and rewording.
• Students often understand implications beyond surface meaning.

2006 NYSESLAT Technical Manual
Page 193
• Students recognize but do not always understand an expanded inventory of concrete and idiomatic language.
• Students can understand more complex indirect questions about personal experience, familiar topics, and general knowledge.
• Students can understand short, predictable phone messages on familiar matters but have problems understanding unknown details on unfamiliar matters.
• Students have some difficulty following a faster conversation between native English speakers.
• Students’ understanding of speech continues to be affected by length, topic familiarity, and cultural knowledge.
HIGH-ADVANCED
• Students can comprehend many important aspects of oral language on social and academic topics, such as main points, most details, speaker’s purpose, attitudes, levels of formality, and inferences.
• Students can comprehend an expanded range of concrete, abstract, and conceptual language and can sustain understanding of conceptually or linguistically complex speech.
• Students can understand sufficient vocabulary, idioms, colloquial expressions, and cultural references to understand detailed stories of general popular interest.
• Students often have difficulty following rapid, colloquial, or idiomatic speech between native English speakers.
• Students’ understanding of English is much less frequently affected by length, topic familiarity, and cultural knowledge.
Advanced-Level ESL: Speaking LOW-ADVANCED
• Students can communicate effectively in most daily social and school situations. • Students can initiate and participate in conversations with confidence, speaking on
familiar social and academic topics. • Students can provide more nuanced descriptions, opinions, and explanations, using
a wide variety of concrete and abstract vocabulary and some technical vocabulary. • Students attempt to use precise word choice to communicate shades of meaning. • Grammar and pronunciation errors still arise but rarely impede communication. • Students’ speech is reasonably fluent, and they are usually easily understood by
native English speakers. • Students have control over most basic and complex grammatical structures and
demonstrate increased understanding of use of situational and culturally appropriate language.
HIGH-ADVANCED
• Students can confidently make prepared academic presentations. • Students’ speech is fluent; they use a sophisticated range of vocabulary, including
technical vocabulary, in both formal and informal settings. • Students demonstrate mastery of almost all grammatical structures. • Grammar, vocabulary, and pronunciation errors very rarely impede communication. • Students usually use precise word choice to communicate shades of meaning.

2006 NYSESLAT Technical Manual
Page 194
• Students can actively and effectively engage in extended discussions in most social and academic situations.
• Students use greater language resources to analyze, solve problems, and make decisions.
• Students are easily understood by native speakers of English. Advanced-Level ESL: Reading LOW-ADVANCED
• Students can understand main ideas, key words, and important details in lengthier passages in a wider range of personal and academic texts.
• Students can usually adjust reading rate according to the content of the text, are able to use a wide range of complex textual cues to comprehend the meaning and structure of a text, including punctuation clues.
• Students can understand most new words, given a clear context. • Students usually make appropriate low-level inferences, understand figurative
language, and understand the author’s purpose, point of view, and tone. • Students often understand texts that are either conceptually or linguistically
complex.
HIGH-ADVANCED • Students can grasp main ideas, key words, and important details in a wide range of
authentic social and academic texts. • Students read most texts fluently, including grade-appropriate academic texts,
adjusting reading rate according to the text. • Students usually understand texts that are conceptually and/or linguistically
complex and make appropriate inferences when necessary. • Students understand the author’s purpose, point of view, tone, and often figurative
language. Advanced-Level ESL: Writing LOW-ADVANCED
• Students can construct coherent paragraphs on familiar concrete topics, with clear main ideas and some supporting details, and with a developing sense of audience.
• Students can effectively join two or three paragraphs into larger text. • Students sometimes produce written discourse patterns in lengthier texts that are
typical for their first language rather than typical for English. • Students can write effectively about a variety of topics, including academic topics,
and usually display clear organization and development. • Students display an awareness of audience and purpose. • Students demonstrate control of most kinds of sentence structure, yet continue to
make some errors in grammar, vocabulary, and punctuation. These errors, however, rarely interfere with communication.

2006 NYSESLAT Technical Manual
Page 195
HIGH-ADVANCED • Students can link sentences and paragraphs to form coherent texts to express ideas
on familiar concrete and abstract topics with clear main ideas and with an appropriate sense of audience.
• Students demonstrate good control over common sentence patterns, coordination, subordination, spelling, and mechanics.
• Students continue to have occasional difficulty with some complex structures, naturalness of phrases and expressions, organization, and style.
• Students can write about a variety of topics and use a variety of sentence structures for stylistic purposes.
• Students make some errors in grammar, vocabulary, and punctuation, but these do not interfere with communication.
F.4: Description of English Proficient-Level LEP/ELLs for the Four Language Modalities
Proficient-Level ESL: Reading English • Students read English fluently and confidently and reflect upon a wide range of grade-
appropriate English language texts.
• Students identify and interpret relevant data, facts, and main ideas in English literary and informational texts.
• Students comprehend and analyze the author’s purpose, point of view, tone, and figurative language and appropriate inferences in English.
• Students analyze experiences, ideas, information, and issues presented by others in printed English languages text, using a variety of established criteria.
• Students demonstrate inference and “beyond the text” understanding of grade-level written English language texts.
• Students interpret, predict, draw conclusions, categorize, and make connections to their own lives and other texts.
Proficient-Level ESL: Writing English • Students utilize standard written English to express ideas on a grade-appropriate level
by using varied sentence structure, language patterns, and descriptive language.
• Students apply appropriate grade-level strategies to produce a variety of English language written products that demonstrate an awareness of audience, purpose, point of view, tone, and sense of voice.
• Students use written English language to acquire, interpret, apply, and transmit information.
• Students present, in written English language and from a variety of perspectives, their opinions and judgments on experiences, ideas, information, and issues.

2006 NYSESLAT Technical Manual
Page 196
• Students use written English for effective social communication with a wide variety of people.
• Students integrate conventions of English language grammar, usage, spelling, capitalization, and punctuation to communicate effectively about various topics. (Minor errors in spelling grammar or punctuation do not interfere with comprehension.)
• Students self-monitor and edit their English language written work.
• Students write literary, interpretive, and responsive essays for personal expression.
Proficient-Level ESL: Listening in English • Students interpret important features of oral English language, at their grade level,
relating to social academic topics and can discriminate between what is and what is not relevant.
• Students distinguish, conceptually or linguistically, complex oral English language expected of their grade level of fluent and/or native English speakers.
• Students comprehend grade-level English vocabulary, idioms, colloquial expressions, and apply their prior knowledge to grasp complex ideas expressed in English
• Students listen to spoken English for a variety of purposes, including to acquire information and to take notes.
Proficient-Level ESL: Speaking English • Students select precise and descriptive grade-level vocabulary to participate actively in
both social and academic English language settings.
• Students make use of standard English to communicate their ideas effectively in an organized and cohesive manner by adjusting to the social context to make themselves understood in English
• Students utilize a variety of oral standard English language resources to analyze, solve problems, make decisions, and communicate shades of meaning in English.
• Students use oral standard English language to acquire, interpret, apply, and transmit information
• Students present, in oral standard English language, their opinions and judgments on experiences, ideas, information, and issues.
• Students use the English language for effective social communication in socially and culturally appropriate manners.
Understanding English • Students use the English language in socially and culturally appropriate manners with
an understanding of the cultural impact on academic materials of varying genres.
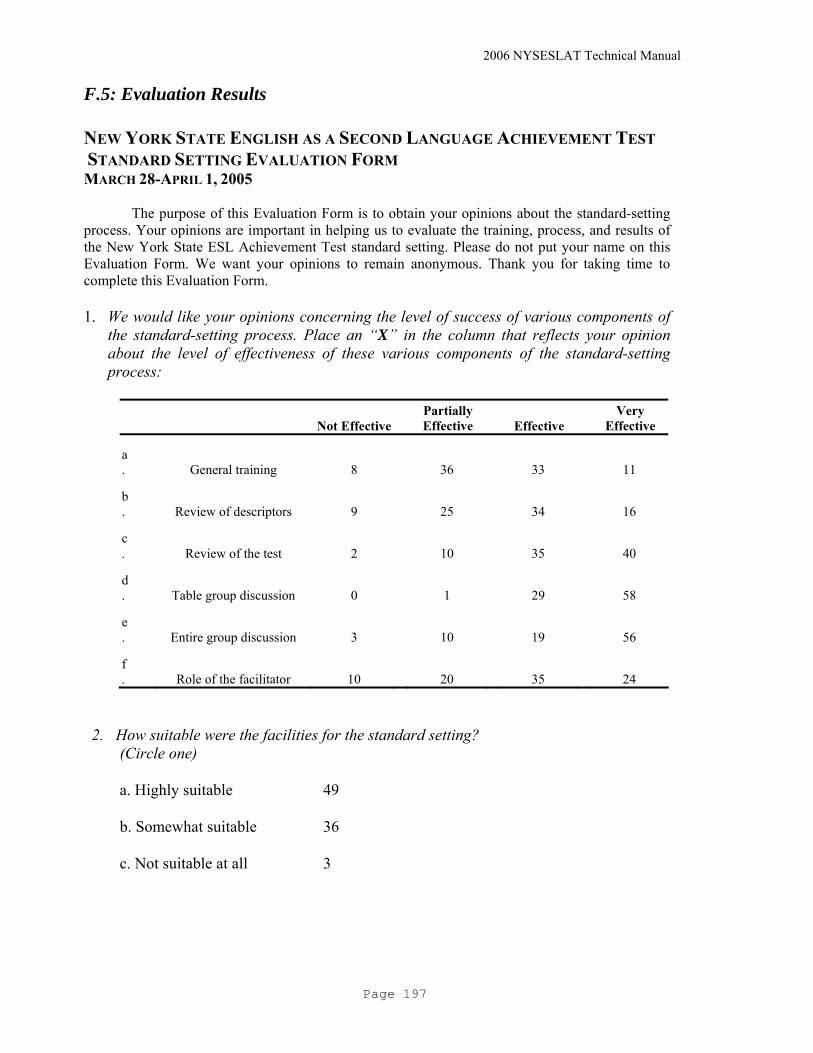
2006 NYSESLAT Technical Manual
Page 197
F.5: Evaluation Results NEW YORK STATE ENGLISH AS A SECOND LANGUAGE ACHIEVEMENT TEST STANDARD SETTING EVALUATION FORM MARCH 28-APRIL 1, 2005
The purpose of this Evaluation Form is to obtain your opinions about the standard-setting process. Your opinions are important in helping us to evaluate the training, process, and results of the New York State ESL Achievement Test standard setting. Please do not put your name on this Evaluation Form. We want your opinions to remain anonymous. Thank you for taking time to complete this Evaluation Form. 1. We would like your opinions concerning the level of success of various components of
the standard-setting process. Place an “X” in the column that reflects your opinion about the level of effectiveness of these various components of the standard-setting process:
Not EffectivePartially Effective Effective
Very Effective
a. General training 8 36 33 11
b. Review of descriptors 9 25 34 16
c. Review of the test 2 10 35 40
d. Table group discussion 0 1 29 58
e. Entire group discussion 3 10 19 56
f. Role of the facilitator 10 20 35 24
2. How suitable were the facilities for the standard setting? (Circle one) a. Highly suitable 49 b. Somewhat suitable 36 c. Not suitable at all 3

2006 NYSESLAT Technical Manual
Page 198
3. Do you have any additional comments about the facilities?
4. Please indicate your opinion regarding the amount of time that was spent on each of the following activities.
Too Little
Time About Right
Too Much Time
a.
Do you think that enough time was allotted for training to help prepare you for making your ratings in the ordered item
booklet? 41 47 1
b. Do you think that enough time was allotted to make your first round of ratings in the ordered item booklets? 13 74 1
c. Do you think that enough time was allotted to make your second round of ratings in the ordered item booklets? 1 82 6
d. Do you think that enough time was allotted for discussion with your table group after the first round of ratings? 3 83 3
e. Do you think that enough time was allotted for discussion with your table group after the second round of ratings? 4 80 5
f. Do you think that enough time was allotted for discussion with the entire group after the first round of ratings? 15 66 7
g. Do you think that enough time was allotted for discussion with the entire group after the second round of ratings? 8 72 9

2006 NYSESLAT Technical Manual
Page 199
5. Please indicate the importance that you placed on the following factors in selecting your final round of ratings in the ordered item booklets.
Not Important
Somewhat Important
Important
Very Important
a. Performance level descriptors
4
17
26
36
b. Content of test items
1
5
24
57
c. Difficulty level of items
2
4
22
58
d. Your own classroom experience
0
2
19
64
e. Feedback from your table group
0
2
42
43
f. Feedback from the facilitator
14
35
24
14
g. Feedback from room discussions
2
21
36
28
h. Ability values
6
8
27
43
Please share any additional comments:

2006 NYSESLAT Technical Manual
Page 200
6. Please indicate your level of confidence on the following questions.
Very
Confident Confident Somewhat Confident
Not Confident
at All
a.
How confident are you in the placement of your final cut points? 41 34 11 0
b.
How confident are you in the final cut points that were generated by the group as a whole? 24 33 27 2
c.
How confident are you in the text of the performance level descriptors? 18 46 15 0
d.
How confident are you that the item-mapping standard-setting method has been an effective process for classifying student performance? 22 26 32 6
7. Would you welcome the opportunity to be a panel member at a future standard setting?
Yes No 81 6
8. In your opinion, would other educators benefit from the opportunity to attend a staff development workshop on the results of this standard setting?
Yes No 79 8 Please share any other comments:
Thank you for your cooperation.
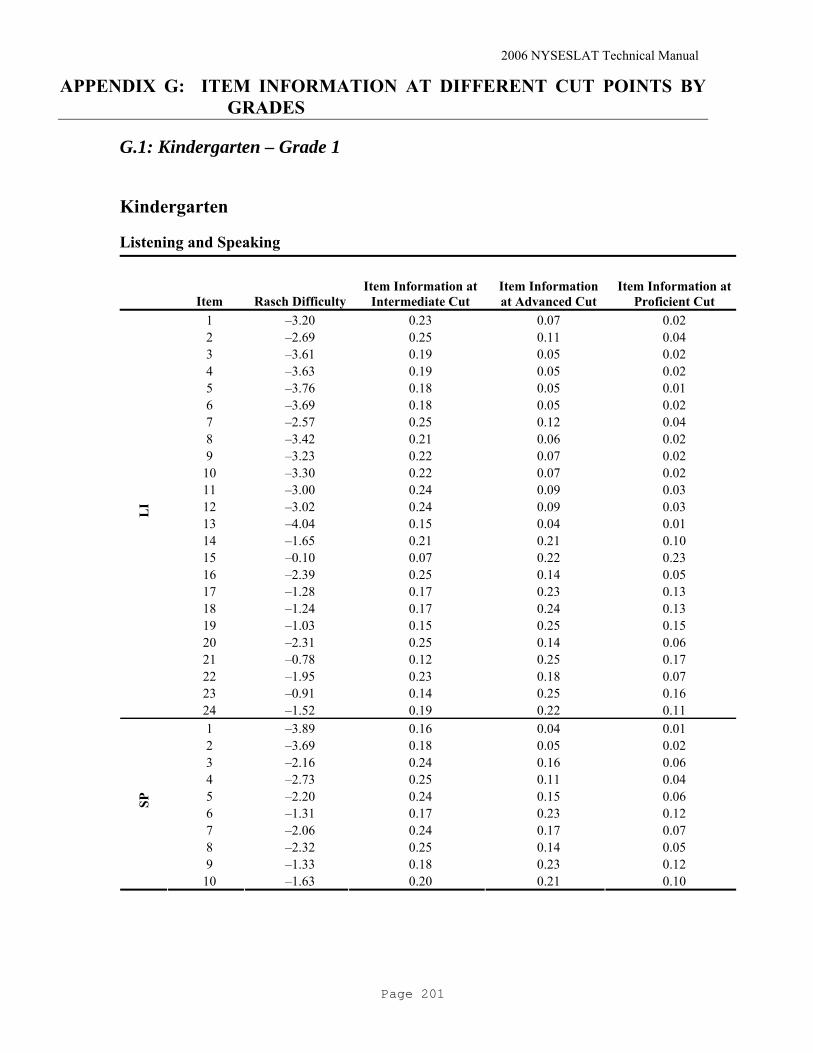
2006 NYSESLAT Technical Manual
Page 201
APPENDIX G: ITEM INFORMATION AT DIFFERENT CUT POINTS BY GRADES
G.1: Kindergarten – Grade 1
Kindergarten
Listening and Speaking
Item Rasch DifficultyItem Information at
Intermediate Cut Item Information at Advanced Cut
Item Information at Proficient Cut
1 –3.20 0.23 0.07 0.02 2 –2.69 0.25 0.11 0.04 3 –3.61 0.19 0.05 0.02 4 –3.63 0.19 0.05 0.02 5 –3.76 0.18 0.05 0.01 6 –3.69 0.18 0.05 0.02 7 –2.57 0.25 0.12 0.04 8 –3.42 0.21 0.06 0.02 9 –3.23 0.22 0.07 0.02
10 –3.30 0.22 0.07 0.02 11 –3.00 0.24 0.09 0.03 12 –3.02 0.24 0.09 0.03 13 –4.04 0.15 0.04 0.01 14 –1.65 0.21 0.21 0.10 15 –0.10 0.07 0.22 0.23 16 –2.39 0.25 0.14 0.05 17 –1.28 0.17 0.23 0.13 18 –1.24 0.17 0.24 0.13 19 –1.03 0.15 0.25 0.15 20 –2.31 0.25 0.14 0.06 21 –0.78 0.12 0.25 0.17 22 –1.95 0.23 0.18 0.07 23 –0.91 0.14 0.25 0.16
LI
24 –1.52 0.19 0.22 0.11 1 –3.89 0.16 0.04 0.01 2 –3.69 0.18 0.05 0.02 3 –2.16 0.24 0.16 0.06 4 –2.73 0.25 0.11 0.04 5 –2.20 0.24 0.15 0.06 6 –1.31 0.17 0.23 0.12 7 –2.06 0.24 0.17 0.07 8 –2.32 0.25 0.14 0.05 9 –1.33 0.18 0.23 0.12
SP
10 –1.63 0.20 0.21 0.10
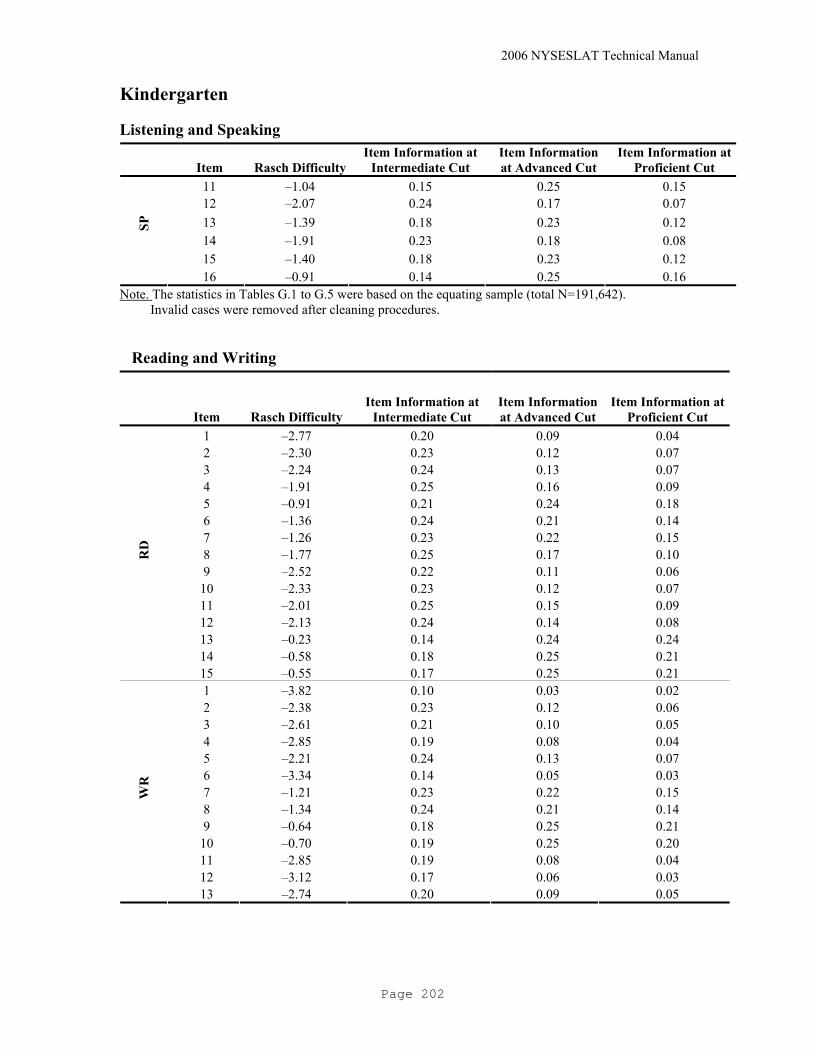
2006 NYSESLAT Technical Manual
Page 202
Kindergarten
Listening and Speaking
Item Rasch DifficultyItem Information at
Intermediate Cut Item Information at Advanced Cut
Item Information at Proficient Cut
11 –1.04 0.15 0.25 0.15 12 –2.07 0.24 0.17 0.07 13 –1.39 0.18 0.23 0.12 14 –1.91 0.23 0.18 0.08 15 –1.40 0.18 0.23 0.12
SP
16 –0.91 0.14 0.25 0.16 Note. The statistics in Tables G.1 to G.5 were based on the equating sample (total N=191,642). Invalid cases were removed after cleaning procedures.
Reading and Writing
Item Rasch DifficultyItem Information at
Intermediate Cut Item Information at Advanced Cut
Item Information at Proficient Cut
1 –2.77 0.20 0.09 0.04 2 –2.30 0.23 0.12 0.07 3 –2.24 0.24 0.13 0.07 4 –1.91 0.25 0.16 0.09 5 –0.91 0.21 0.24 0.18 6 –1.36 0.24 0.21 0.14 7 –1.26 0.23 0.22 0.15 8 –1.77 0.25 0.17 0.10 9 –2.52 0.22 0.11 0.06
10 –2.33 0.23 0.12 0.07 11 –2.01 0.25 0.15 0.09 12 –2.13 0.24 0.14 0.08 13 –0.23 0.14 0.24 0.24 14 –0.58 0.18 0.25 0.21
RD
15 –0.55 0.17 0.25 0.21 1 –3.82 0.10 0.03 0.02 2 –2.38 0.23 0.12 0.06 3 –2.61 0.21 0.10 0.05 4 –2.85 0.19 0.08 0.04 5 –2.21 0.24 0.13 0.07 6 –3.34 0.14 0.05 0.03 7 –1.21 0.23 0.22 0.15 8 –1.34 0.24 0.21 0.14 9 –0.64 0.18 0.25 0.21
10 –0.70 0.19 0.25 0.20 11 –2.85 0.19 0.08 0.04 12 –3.12 0.17 0.06 0.03
WR
13 –2.74 0.20 0.09 0.05
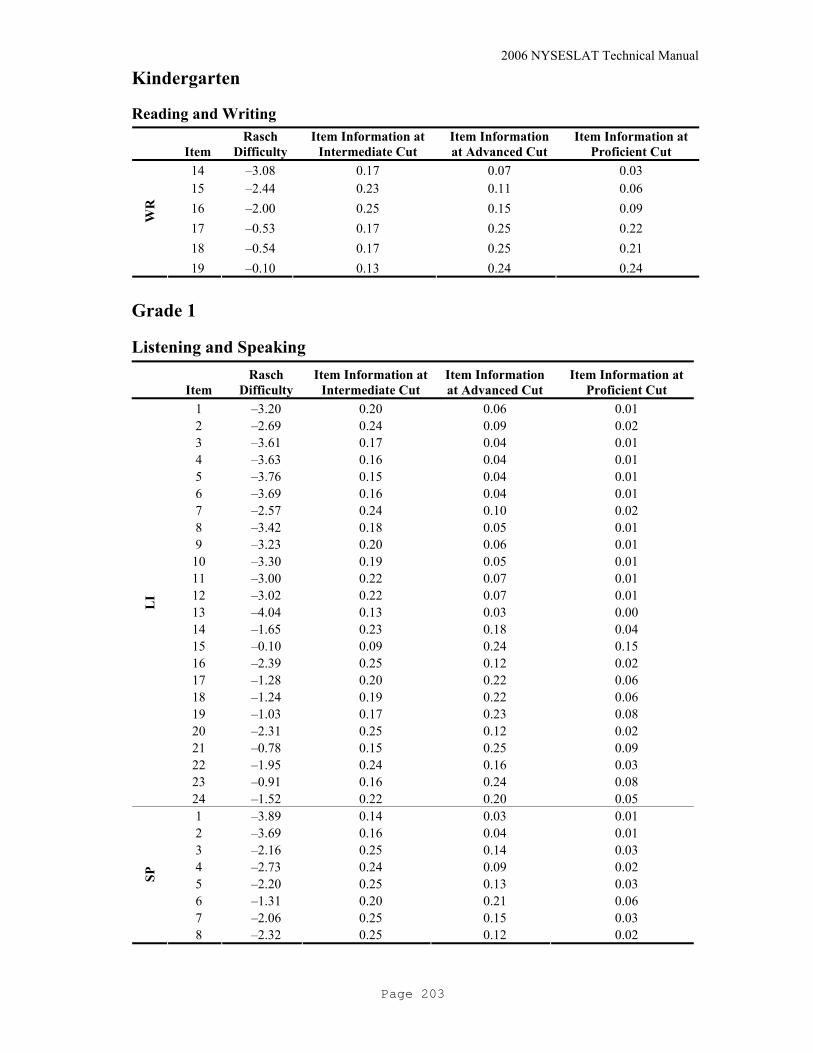
2006 NYSESLAT Technical Manual
Page 203
Kindergarten
Reading and Writing
Item Rasch
Difficulty Item Information at
Intermediate Cut Item Information at Advanced Cut
Item Information at Proficient Cut
14 –3.08 0.17 0.07 0.03 15 –2.44 0.23 0.11 0.06 16 –2.00 0.25 0.15 0.09 17 –0.53 0.17 0.25 0.22 18 –0.54 0.17 0.25 0.21
WR
19 –0.10 0.13 0.24 0.24
Grade 1
Listening and Speaking
Item Rasch
Difficulty Item Information at
Intermediate Cut Item Information at Advanced Cut
Item Information at Proficient Cut
1 –3.20 0.20 0.06 0.01 2 –2.69 0.24 0.09 0.02 3 –3.61 0.17 0.04 0.01 4 –3.63 0.16 0.04 0.01 5 –3.76 0.15 0.04 0.01 6 –3.69 0.16 0.04 0.01 7 –2.57 0.24 0.10 0.02 8 –3.42 0.18 0.05 0.01 9 –3.23 0.20 0.06 0.01
10 –3.30 0.19 0.05 0.01 11 –3.00 0.22 0.07 0.01 12 –3.02 0.22 0.07 0.01 13 –4.04 0.13 0.03 0.00 14 –1.65 0.23 0.18 0.04 15 –0.10 0.09 0.24 0.15 16 –2.39 0.25 0.12 0.02 17 –1.28 0.20 0.22 0.06 18 –1.24 0.19 0.22 0.06 19 –1.03 0.17 0.23 0.08 20 –2.31 0.25 0.12 0.02 21 –0.78 0.15 0.25 0.09 22 –1.95 0.24 0.16 0.03 23 –0.91 0.16 0.24 0.08
LI
24 –1.52 0.22 0.20 0.05 1 –3.89 0.14 0.03 0.01 2 –3.69 0.16 0.04 0.01 3 –2.16 0.25 0.14 0.03 4 –2.73 0.24 0.09 0.02 5 –2.20 0.25 0.13 0.03 6 –1.31 0.20 0.21 0.06 7 –2.06 0.25 0.15 0.03
SP
8 –2.32 0.25 0.12 0.02

2006 NYSESLAT Technical Manual
Page 204
Grade 1
Listening and Speaking
Item Rasch DifficultyItem Information at
Intermediate Cut Item Information at
Advanced Cut Item Information at
Proficient Cut 9 –1.33 0.20 0.21 0.06
10 –1.63 0.23 0.19 0.04 11 –1.04 0.17 0.23 0.07 12 –2.07 0.25 0.14 0.03 13 –1.39 0.21 0.21 0.05 14 –1.91 0.24 0.16 0.03 15 –1.40 0.21 0.21 0.05
SP
16 –0.91 0.16 0.24 0.08
Reading and Writing
Item Rasch Difficulty Item Information at
Intermediate Cut Item Information at
Advanced Cut Item Information at
Proficient Cut 1 –2.77 0.14 0.04 0.01 2 –2.30 0.18 0.07 0.02 3 –2.24 0.19 0.07 0.02 4 –1.91 0.22 0.09 0.03 5 –0.91 0.25 0.18 0.07 6 –1.36 0.25 0.14 0.05 7 –1.26 0.25 0.15 0.05 8 –1.77 0.23 0.10 0.03 9 –2.52 0.16 0.06 0.02
10 –2.33 0.18 0.07 0.02 11 –2.01 0.21 0.09 0.03 12 –2.13 0.20 0.08 0.02 13 –0.23 0.20 0.24 0.12 14 –0.58 0.23 0.21 0.09
RD
15 –0.55 0.23 0.21 0.10 1 –3.82 0.06 0.02 0.00 2 –2.38 0.18 0.06 0.02 3 –2.61 0.15 0.05 0.01 4 –2.85 0.13 0.04 0.01 5 –2.21 0.19 0.07 0.02 6 –3.34 0.09 0.03 0.01 7 –1.21 0.25 0.15 0.05 8 –1.34 0.25 0.14 0.05 9 –0.64 0.23 0.21 0.09
10 –0.70 0.24 0.20 0.08 11 –2.85 0.13 0.04 0.01 12 –3.12 0.11 0.03 0.01 13 –2.74 0.14 0.05 0.01 14 –3.08 0.11 0.03 0.01
WR
15 –2.44 0.17 0.06 0.02
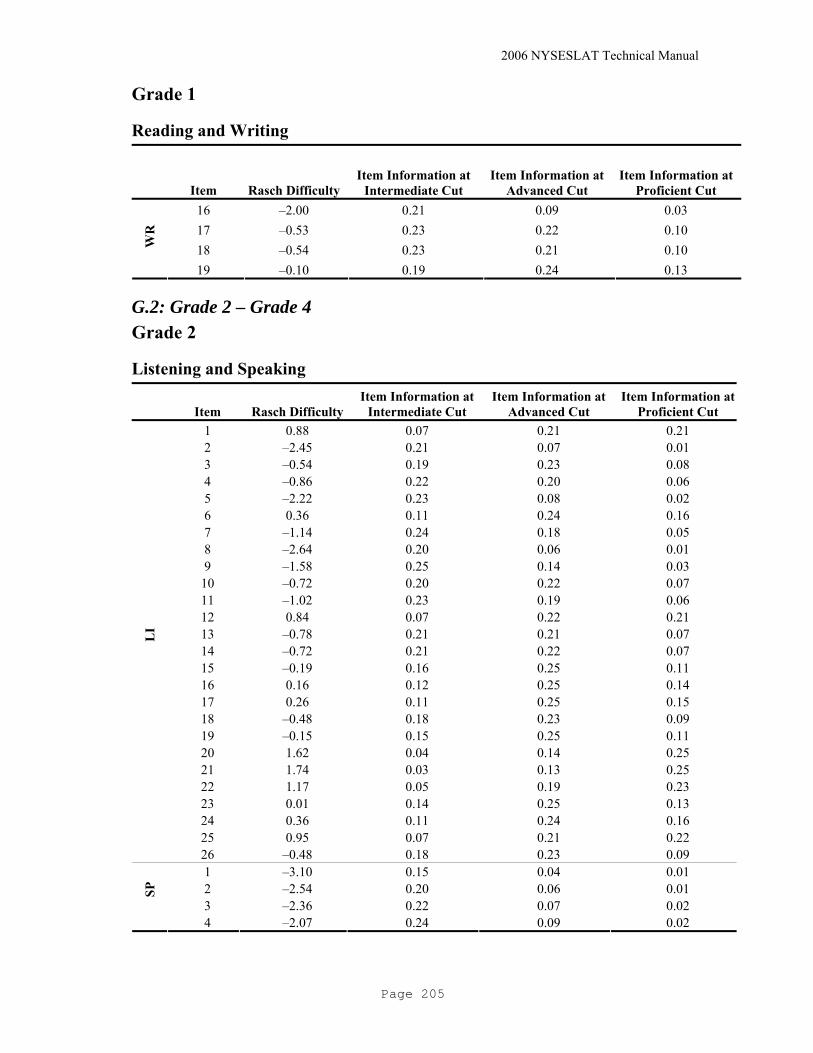
2006 NYSESLAT Technical Manual
Page 205
Grade 1
Reading and Writing
Item Rasch Difficulty Item Information at
Intermediate Cut Item Information at
Advanced Cut Item Information at
Proficient Cut 16 –2.00 0.21 0.09 0.03 17 –0.53 0.23 0.22 0.10 18 –0.54 0.23 0.21 0.10 W
R
19 –0.10 0.19 0.24 0.13
G.2: Grade 2 – Grade 4 Grade 2
Listening and Speaking
Item Rasch DifficultyItem Information at
Intermediate Cut Item Information at
Advanced Cut Item Information at
Proficient Cut 1 0.88 0.07 0.21 0.21 2 –2.45 0.21 0.07 0.01 3 –0.54 0.19 0.23 0.08 4 –0.86 0.22 0.20 0.06 5 –2.22 0.23 0.08 0.02 6 0.36 0.11 0.24 0.16 7 –1.14 0.24 0.18 0.05 8 –2.64 0.20 0.06 0.01 9 –1.58 0.25 0.14 0.03
10 –0.72 0.20 0.22 0.07 11 –1.02 0.23 0.19 0.06 12 0.84 0.07 0.22 0.21 13 –0.78 0.21 0.21 0.07 14 –0.72 0.21 0.22 0.07 15 –0.19 0.16 0.25 0.11 16 0.16 0.12 0.25 0.14 17 0.26 0.11 0.25 0.15 18 –0.48 0.18 0.23 0.09 19 –0.15 0.15 0.25 0.11 20 1.62 0.04 0.14 0.25 21 1.74 0.03 0.13 0.25 22 1.17 0.05 0.19 0.23 23 0.01 0.14 0.25 0.13 24 0.36 0.11 0.24 0.16 25 0.95 0.07 0.21 0.22
LI
26 –0.48 0.18 0.23 0.09 1 –3.10 0.15 0.04 0.01 2 –2.54 0.20 0.06 0.01 3 –2.36 0.22 0.07 0.02
SP
4 –2.07 0.24 0.09 0.02
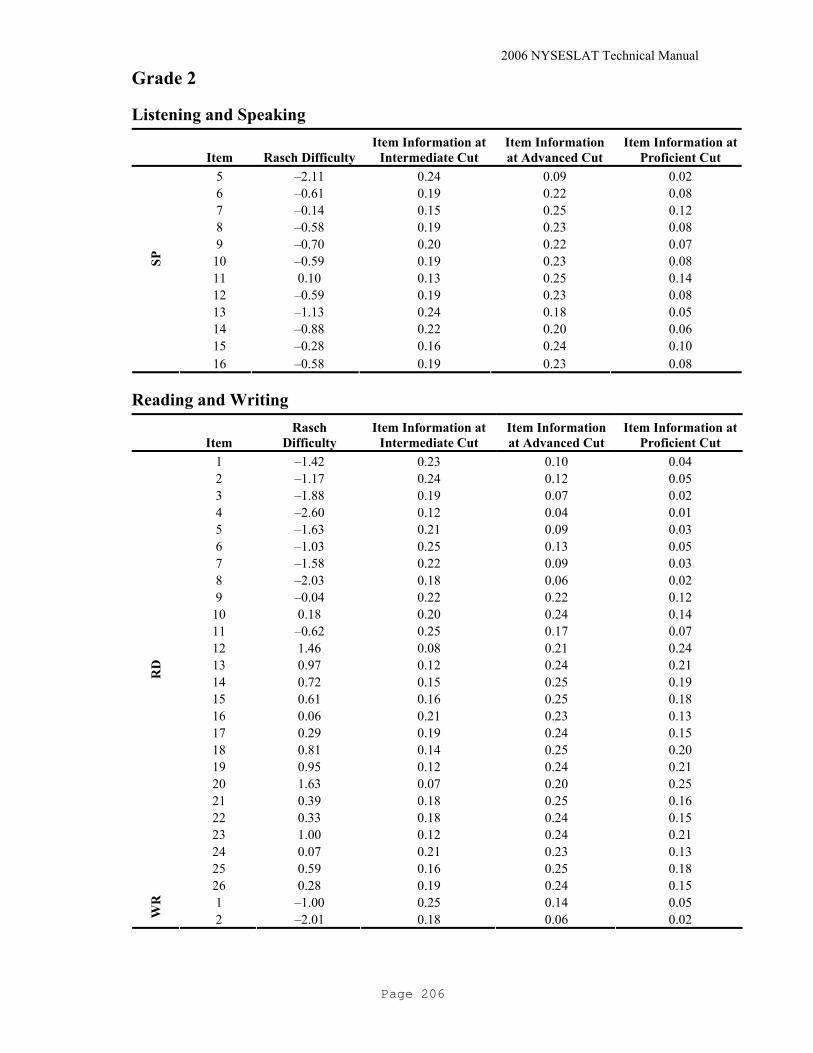
2006 NYSESLAT Technical Manual
Page 206
Grade 2
Listening and Speaking
Item Rasch DifficultyItem Information at
Intermediate Cut Item Information at Advanced Cut
Item Information at Proficient Cut
5 –2.11 0.24 0.09 0.02 6 –0.61 0.19 0.22 0.08 7 –0.14 0.15 0.25 0.12 8 –0.58 0.19 0.23 0.08 9 –0.70 0.20 0.22 0.07
10 –0.59 0.19 0.23 0.08 11 0.10 0.13 0.25 0.14 12 –0.59 0.19 0.23 0.08 13 –1.13 0.24 0.18 0.05 14 –0.88 0.22 0.20 0.06 15 –0.28 0.16 0.24 0.10
SP
16 –0.58 0.19 0.23 0.08
Reading and Writing
Item Rasch
Difficulty Item Information at
Intermediate Cut Item Information at Advanced Cut
Item Information at Proficient Cut
1 –1.42 0.23 0.10 0.04 2 –1.17 0.24 0.12 0.05 3 –1.88 0.19 0.07 0.02 4 –2.60 0.12 0.04 0.01 5 –1.63 0.21 0.09 0.03 6 –1.03 0.25 0.13 0.05 7 –1.58 0.22 0.09 0.03 8 –2.03 0.18 0.06 0.02 9 –0.04 0.22 0.22 0.12
10 0.18 0.20 0.24 0.14 11 –0.62 0.25 0.17 0.07 12 1.46 0.08 0.21 0.24 13 0.97 0.12 0.24 0.21 14 0.72 0.15 0.25 0.19 15 0.61 0.16 0.25 0.18 16 0.06 0.21 0.23 0.13 17 0.29 0.19 0.24 0.15 18 0.81 0.14 0.25 0.20 19 0.95 0.12 0.24 0.21 20 1.63 0.07 0.20 0.25 21 0.39 0.18 0.25 0.16 22 0.33 0.18 0.24 0.15 23 1.00 0.12 0.24 0.21 24 0.07 0.21 0.23 0.13 25 0.59 0.16 0.25 0.18
RD
26 0.28 0.19 0.24 0.15 1 –1.00 0.25 0.14 0.05
WR
2 –2.01 0.18 0.06 0.02

2006 NYSESLAT Technical Manual
Page 207
Grade 2
Reading and Writing
3 –2.39 0.14 0.04 0.01 4 –1.54 0.22 0.09 0.03 5 –0.49 0.24 0.18 0.08 6 0.58 0.16 0.25 0.18 7 0.43 0.17 0.25 0.16 8 1.09 0.11 0.24 0.22 9 –0.01 0.21 0.23 0.12
10 0.03 0.21 0.23 0.12 11 0.32 0.18 0.24 0.15 12 0.50 0.17 0.25 0.17 13 –0.20 0.23 0.21 0.10 14 –0.06 0.22 0.22 0.12 15 –0.08 0.22 0.22 0.11
WR
16 0.98 0.12 0.24 0.21
Grade 3
Listening and Speaking
Item Rasch Difficulty Item Information at
Intermediate Cut Item Information at Advanced Cut
Item Information at Proficient Cut
1 0.88 0.09 0.23 0.17 2 –2.45 0.18 0.06 0.01 3 –0.54 0.22 0.21 0.06 4 –0.86 0.24 0.18 0.05 5 –2.22 0.20 0.07 0.01 6 0.36 0.14 0.25 0.12 7 –1.14 0.25 0.15 0.03 8 –2.64 0.16 0.05 0.01 9 –1.58 0.24 0.11 0.02
10 –0.72 0.23 0.19 0.05 11 –1.02 0.25 0.17 0.04 12 0.84 0.10 0.23 0.17 13 –0.78 0.24 0.19 0.05 14 –0.72 0.23 0.19 0.05 15 –0.19 0.19 0.23 0.08 16 0.16 0.16 0.25 0.11 17 0.26 0.15 0.25 0.12 18 –0.48 0.21 0.21 0.06 19 –0.15 0.19 0.24 0.08 20 1.62 0.05 0.17 0.23 21 1.74 0.04 0.16 0.24 22 1.17 0.07 0.21 0.20
LI
23 0.01 0.17 0.24 0.09
2006 NYSESLAT Technical Manual
Page 208
Grade 3
Listening and Speaking
Item Rasch
Difficulty Item Information at
Intermediate Cut Item Information at Advanced Cut
Item Information at Proficient Cut
24 0.36 0.14 0.25 0.12 25 0.95 0.09 0.23 0.18 L
I
26 –0.48 0.21 0.21 0.06 1 –3.10 0.12 0.03 0.01 2 –2.54 0.17 0.05 0.01 3 –2.36 0.19 0.06 0.01 4 –2.07 0.21 0.08 0.01 5 –2.11 0.21 0.08 0.01 6 –0.61 0.22 0.20 0.06 7 –0.14 0.18 0.24 0.08 8 –0.58 0.22 0.21 0.06 9 –0.70 0.23 0.20 0.05
10 –0.59 0.22 0.21 0.06 11 0.10 0.16 0.25 0.10 12 –0.59 0.22 0.21 0.06 13 –1.13 0.25 0.15 0.04 14 –0.88 0.24 0.18 0.04 15 –0.28 0.20 0.23 0.08
SP
16 –0.58 0.22 0.21 0.06
Reading and Writing
Item Rasch
Difficulty Item Information at
Intermediate Cut Item Information at
Advanced Cut Item Information at
Proficient Cut 1 –1.42 0.21 0.08 0.02 2 –1.17 0.23 0.10 0.03 3 –1.88 0.17 0.06 0.02 4 –2.60 0.10 0.03 0.01 5 –1.63 0.19 0.07 0.02 6 –1.03 0.24 0.11 0.03 7 –1.58 0.20 0.07 0.02 8 –2.03 0.15 0.05 0.01 9 –0.04 0.23 0.21 0.08
10 0.18 0.22 0.22 0.10 11 –0.62 0.25 0.15 0.05 12 1.46 0.10 0.23 0.21 13 0.97 0.15 0.25 0.17 14 0.72 0.17 0.25 0.15 15 0.61 0.18 0.25 0.14 16 0.06 0.23 0.21 0.09 17 0.29 0.21 0.23 0.11 18 0.81 0.16 0.25 0.16
RD
19 0.95 0.15 0.25 0.17
2006 NYSESLAT Technical Manual
Page 209
Grade 3
Reading and Writing
Item Rasch
Difficulty Item Information at
Intermediate Cut Item Information at
Advanced Cut Item Information at
Proficient Cut 20 1.63 0.09 0.22 0.23 21 0.39 0.20 0.24 0.12 22 0.33 0.21 0.23 0.11 23 1.00 0.14 0.25 0.17 24 0.07 0.23 0.21 0.09 25 0.59 0.18 0.25 0.13
RD
26 0.28 0.21 0.23 0.11 1 –1.00 0.24 0.12 0.04 2 –2.01 0.15 0.05 0.01 3 –2.39 0.12 0.04 0.01 4 –1.54 0.20 0.08 0.02 5 –0.49 0.25 0.16 0.06 6 0.58 0.18 0.25 0.13 7 0.43 0.20 0.24 0.12 8 1.09 0.13 0.25 0.18 9 –0.01 0.23 0.21 0.09
10 0.03 0.23 0.21 0.09 11 0.32 0.21 0.23 0.11 12 0.50 0.19 0.24 0.13 13 –0.20 0.24 0.19 0.07 14 –0.06 0.23 0.20 0.08 15 –0.08 0.24 0.20 0.08
WR
16 0.98 0.14 0.25 0.17

2006 NYSESLAT Technical Manual
Page 210
Grade 4
Listening and Speaking
Item Rasch
Difficulty Item Information at
Intermediate Cut Item Information at Advanced Cut
Item Information at Proficient Cut
1 0.88 0.12 0.24 0.15 2 –2.45 0.15 0.04 0.01 3 –0.54 0.24 0.18 0.05 4 –0.86 0.25 0.15 0.04 5 –2.22 0.17 0.05 0.01 6 0.36 0.17 0.25 0.10 7 –1.14 0.25 0.13 0.03 8 –2.64 0.13 0.04 0.01 9 –1.58 0.23 0.09 0.02
10 –0.72 0.25 0.17 0.04 11 –1.02 0.25 0.14 0.03 12 0.84 0.12 0.25 0.14 13 –0.78 0.25 0.16 0.04 14 –0.72 0.25 0.17 0.04 15 –0.19 0.22 0.22 0.07 16 0.16 0.19 0.24 0.09 17 0.26 0.18 0.24 0.10 18 –0.48 0.24 0.19 0.05 19 –0.15 0.21 0.22 0.07 20 1.62 0.07 0.19 0.22 21 1.74 0.06 0.18 0.23 22 1.17 0.10 0.23 0.18 23 0.01 0.20 0.23 0.08 24 0.36 0.17 0.25 0.10 25 0.95 0.11 0.24 0.15
LI
26 –0.48 0.24 0.19 0.05 1 –3.10 0.09 0.02 0.00 2 –2.54 0.14 0.04 0.01 3 –2.36 0.16 0.05 0.01 4 –2.07 0.19 0.06 0.01 5 –2.11 0.18 0.06 0.01 6 –0.61 0.24 0.18 0.05 7 –0.14 0.21 0.22 0.07 8 –0.58 0.24 0.18 0.05 9 –0.70 0.25 0.17 0.04
10 –0.59 0.24 0.18 0.05 11 0.10 0.19 0.24 0.08 12 –0.59 0.24 0.18 0.05 13 –1.13 0.25 0.13 0.03 14 –0.88 0.25 0.15 0.04 15 –0.28 0.22 0.21 0.06
SP
16 –0.58 0.24 0.18 0.05
2006 NYSESLAT Technical Manual
Page 211
Grade 4
Reading and Writing
Item Rasch DifficultyItem Information at
Intermediate Cut Item Information at
Advanced Cut Item Information at
Proficient Cut 1 –1.42 0.19 0.06 0.02 2 –1.17 0.21 0.08 0.02 3 –1.88 0.14 0.04 0.01 4 –2.60 0.08 0.02 0.01 5 –1.63 0.17 0.05 0.01 6 –1.03 0.22 0.09 0.02 7 –1.58 0.17 0.06 0.01 8 –2.03 0.13 0.04 0.01 9 –0.04 0.24 0.18 0.06
10 0.18 0.23 0.20 0.07 11 –0.62 0.24 0.12 0.04 12 1.46 0.12 0.25 0.18 13 0.97 0.17 0.25 0.14 14 0.72 0.19 0.24 0.11 15 0.61 0.20 0.23 0.10 16 0.06 0.24 0.18 0.07 17 0.29 0.23 0.21 0.08 18 0.81 0.18 0.24 0.12 19 0.95 0.17 0.25 0.13 20 1.63 0.11 0.24 0.20 21 0.39 0.22 0.21 0.09 22 0.33 0.22 0.21 0.08 23 1.00 0.17 0.25 0.14 24 0.07 0.24 0.19 0.07 25 0.59 0.20 0.23 0.10
RD
26 0.28 0.23 0.20 0.08 1 –1.00 0.22 0.09 0.03 2 –2.01 0.13 0.04 0.01 3 –2.39 0.10 0.03 0.01 4 –1.54 0.18 0.06 0.02 5 –0.49 0.25 0.13 0.04 6 0.58 0.20 0.23 0.10 7 0.43 0.22 0.22 0.09 8 1.09 0.16 0.25 0.15 9 –0.01 0.24 0.18 0.06
10 0.03 0.24 0.18 0.07 11 0.32 0.23 0.21 0.08 12 0.50 0.21 0.22 0.10 13 –0.20 0.25 0.16 0.05 14 –0.06 0.25 0.17 0.06 15 –0.08 0.25 0.17 0.06
WR
16 0.98 0.17 0.25 0.14

2006 NYSESLAT Technical Manual
Page 212
G.3: Grade 5 – Grade 6 Grade 5
Listening and Speaking
Item Rasch
Difficulty Item Information at
Intermediate Cut Item Information at
Advanced Cut Item Information at
Proficient Cut 1 –2.74 0.09 0.03 0.01 2 –1.44 0.21 0.08 0.02 3 –1.45 0.21 0.08 0.02 4 –0.12 0.24 0.20 0.07 5 –1.82 0.17 0.06 0.01 6 –0.41 0.25 0.17 0.05 7 0.02 0.23 0.21 0.07 8 0.98 0.14 0.25 0.15 9 0.71 0.17 0.25 0.13
10 1.11 0.13 0.25 0.16 11 0.14 0.22 0.22 0.08 12 0.34 0.20 0.23 0.10 13 0.21 0.21 0.22 0.09 14 1.49 0.10 0.23 0.20 15 0.13 0.22 0.22 0.08 16 –0.17 0.24 0.19 0.06 17 0.75 0.16 0.25 0.13 18 1.34 0.11 0.24 0.19 19 –0.93 0.24 0.12 0.03 20 0.50 0.19 0.24 0.11 21 0.11 0.22 0.22 0.08 22 0.01 0.23 0.21 0.07 23 –0.70 0.25 0.14 0.04 24 –0.80 0.25 0.13 0.04 25 0.04 0.23 0.21 0.07
LI
26 –0.11 0.24 0.20 0.07 1 –3.04 0.07 0.02 0.00 2 –2.79 0.09 0.02 0.01 3 –2.37 0.12 0.04 0.01 4 –2.24 0.14 0.04 0.01 5 –1.14 0.23 0.10 0.03 6 –0.48 0.25 0.16 0.05 7 –0.66 0.25 0.14 0.04 8 –0.26 0.24 0.18 0.06 9 –0.17 0.24 0.19 0.06
10 –0.51 0.25 0.16 0.05 11 0.42 0.20 0.24 0.10 12 –0.71 0.25 0.14 0.04 13 –0.70 0.25 0.14 0.04 14 –0.62 0.25 0.15 0.04 15 –0.50 0.25 0.16 0.05
SP
16 –0.14 0.24 0.19 0.06

2006 NYSESLAT Technical Manual
Page 213
Reading and Writing
Item Rasch
Difficulty Item Information at
Intermediate Cut Item Information at
Advanced Cut Item Information at
Proficient Cut 1 –1.70 0.09 0.03 0.01 2 –1.19 0.13 0.05 0.01 3 –0.63 0.18 0.08 0.03 4 –0.49 0.19 0.09 0.03 5 –0.88 0.15 0.06 0.02 6 –1.39 0.11 0.04 0.01 7 0.53 0.25 0.18 0.07 8 0.70 0.25 0.19 0.08 9 0.11 0.24 0.14 0.05
10 –0.21 0.22 0.11 0.04 11 1.20 0.23 0.23 0.12 12 0.88 0.24 0.21 0.10 13 1.42 0.21 0.24 0.14 14 1.44 0.21 0.24 0.15 15 2.37 0.12 0.23 0.23 16 1.60 0.19 0.25 0.16 17 1.36 0.21 0.24 0.14 18 1.18 0.23 0.23 0.12 19 1.23 0.22 0.24 0.13 20 2.72 0.09 0.20 0.25 21 1.63 0.19 0.25 0.16 22 1.62 0.19 0.25 0.16 23 1.02 0.24 0.22 0.11 24 1.39 0.21 0.24 0.14 25 2.46 0.11 0.22 0.23
RD
26 2.57 0.10 0.21 0.24 1 –1.87 0.07 0.03 0.01 2 –0.25 0.21 0.11 0.04 3 –0.81 0.16 0.07 0.02 4 –1.35 0.11 0.04 0.01 5 1.01 0.24 0.22 0.11 6 0.36 0.25 0.16 0.06 7 0.64 0.25 0.19 0.08 8 2.66 0.10 0.20 0.24 9 0.95 0.24 0.22 0.10
10 –0.02 0.23 0.13 0.05 11 2.09 0.15 0.24 0.21 12 1.41 0.21 0.24 0.14 13 –0.23 0.21 0.11 0.04 14 0.38 0.25 0.16 0.06 15 0.28 0.25 0.15 0.06 16 0.35 0.25 0.16 0.06 17 0.31 0.25 0.16 0.06 18 0.43 0.25 0.17 0.07 19 0.44 0.25 0.17 0.07
WR
20 1.46 0.21 0.25 0.15

2006 NYSESLAT Technical Manual
Page 214
Grade 6
Listening and Speaking
Item Rasch
Difficulty Item Information at
Intermediate Cut Item Information at
Advanced Cut Item Information at
Proficient Cut 1 –2.74 0.08 0.02 0.00 2 –1.44 0.19 0.07 0.01 3 –1.45 0.19 0.07 0.01 4 –0.12 0.25 0.17 0.05 5 –1.82 0.15 0.05 0.01 6 –0.41 0.25 0.15 0.04 7 0.02 0.24 0.19 0.06 8 0.98 0.16 0.25 0.13 9 0.71 0.19 0.24 0.10
10 1.11 0.15 0.25 0.14 11 0.14 0.23 0.20 0.06 12 0.34 0.22 0.22 0.08 13 0.21 0.23 0.21 0.07 14 1.49 0.12 0.24 0.17 15 0.13 0.23 0.20 0.06 16 –0.17 0.25 0.17 0.05 17 0.75 0.19 0.24 0.11 18 1.34 0.13 0.25 0.16 19 –0.93 0.23 0.10 0.02 20 0.50 0.21 0.23 0.09 21 0.11 0.24 0.20 0.06 22 0.01 0.24 0.19 0.06 23 –0.70 0.24 0.12 0.03 24 –0.80 0.24 0.11 0.03 25 0.04 0.24 0.19 0.06
LI
26 –0.11 0.25 0.18 0.05 1 –3.04 0.06 0.02 0.00 2 –2.79 0.08 0.02 0.00 3 –2.37 0.11 0.03 0.01 4 –2.24 0.12 0.03 0.01 5 –1.14 0.22 0.09 0.02 6 –0.48 0.25 0.14 0.04 7 –0.66 0.24 0.12 0.03 8 –0.26 0.25 0.16 0.05 9 –0.17 0.25 0.17 0.05
10 –0.51 0.25 0.14 0.04 11 0.42 0.21 0.22 0.08 12 –0.71 0.24 0.12 0.03 13 –0.70 0.24 0.12 0.03 14 –0.62 0.25 0.13 0.03 15 –0.50 0.25 0.14 0.04
SP
16 –0.14 0.25 0.17 0.05
2006 NYSESLAT Technical Manual
Page 215
Grade 6
Reading and Writing
Item Rasch
Difficulty Item Information at
Intermediate Cut Item Information at
Advanced Cut Item Information at
Proficient Cut 1 –1.70 0.08 0.02 0.01 2 –1.19 0.12 0.04 0.01 3 –0.63 0.17 0.07 0.02 4 –0.49 0.18 0.07 0.02 5 –0.88 0.15 0.05 0.02 6 –1.39 0.10 0.03 0.01 7 0.53 0.25 0.16 0.06 8 0.70 0.25 0.17 0.07 9 0.11 0.23 0.12 0.04
10 –0.21 0.21 0.09 0.03 11 1.20 0.23 0.22 0.11 12 0.88 0.25 0.19 0.08 13 1.42 0.22 0.23 0.13 14 1.44 0.22 0.23 0.13 15 2.37 0.13 0.24 0.22 16 1.60 0.20 0.24 0.14 17 1.36 0.22 0.23 0.12 18 1.18 0.23 0.22 0.11 19 1.23 0.23 0.22 0.11 20 2.72 0.10 0.22 0.24 21 1.63 0.20 0.24 0.15 22 1.62 0.20 0.24 0.15 23 1.02 0.24 0.20 0.09 24 1.39 0.22 0.23 0.13 25 2.46 0.12 0.23 0.22
RD
26 2.57 0.11 0.23 0.23 1 –1.87 0.07 0.02 0.01 2 –0.25 0.20 0.09 0.03 3 –0.81 0.15 0.06 0.02 4 –1.35 0.10 0.03 0.01 5 1.01 0.24 0.20 0.09 6 0.36 0.24 0.14 0.05 7 0.64 0.25 0.17 0.07 8 2.66 0.11 0.22 0.24 9 0.95 0.24 0.20 0.09
10 –0.02 0.22 0.11 0.04 11 2.09 0.16 0.25 0.19 12 1.41 0.22 0.23 0.13 13 –0.23 0.21 0.09 0.03 14 0.38 0.25 0.14 0.06 15 0.28 0.24 0.13 0.05 16 0.35 0.24 0.14 0.05 17 0.31 0.24 0.14 0.05 18 0.43 0.25 0.15 0.06 19 0.44 0.25 0.15 0.06
WR
20 1.46 0.21 0.24 0.13

2006 NYSESLAT Technical Manual
Page 216
G.4: Grade 7 – Grade 8 Grade 7
Listening and Speaking
Item Rasch
Difficulty Item Information at
Intermediate Cut Item Information at
Advanced Cut Item Information at
Proficient Cut 1 –1.82 0.13 0.04 0.01 2 –0.67 0.23 0.10 0.03 3 –0.67 0.23 0.10 0.03 4 –2.48 0.08 0.02 0.00 5 0.01 0.25 0.15 0.05 6 0.37 0.24 0.19 0.07 7 0.59 0.22 0.21 0.08 8 1.03 0.19 0.24 0.11 9 0.31 0.24 0.18 0.06
10 2.06 0.09 0.23 0.21 11 1.64 0.13 0.25 0.17 12 1.76 0.12 0.24 0.18 13 1.11 0.18 0.24 0.12 14 1.09 0.18 0.24 0.12 15 1.13 0.18 0.24 0.12 16 1.83 0.11 0.24 0.19 17 1.53 0.14 0.25 0.16 18 1.14 0.18 0.24 0.12 19 2.33 0.08 0.21 0.23 20 1.66 0.13 0.25 0.17 21 0.63 0.22 0.21 0.08 22 0.91 0.20 0.23 0.10 23 1.91 0.11 0.24 0.19 24 1.44 0.15 0.25 0.15 25 1.42 0.15 0.25 0.15 26 1.55 0.14 0.25 0.16
LI
27 1.05 0.19 0.24 0.11 1 –1.69 0.14 0.04 0.01 2 –1.35 0.17 0.05 0.01 3 –1.38 0.17 0.05 0.01 4 –1.43 0.16 0.05 0.01 5 –0.87 0.21 0.08 0.02 6 0.83 0.20 0.23 0.10 7 0.61 0.22 0.21 0.08 8 0.24 0.24 0.18 0.06 9 0.80 0.21 0.23 0.09
10 0.61 0.22 0.21 0.08 11 0.90 0.20 0.23 0.10 12 0.48 0.23 0.20 0.07 13 0.18 0.25 0.17 0.06 14 0.09 0.25 0.16 0.05 15 0.43 0.23 0.19 0.07
SP
16 0.33 0.24 0.19 0.06

2006 NYSESLAT Technical Manual
Page 217
Grade 7
Reading and Writing
Item Rasch
Difficulty Item Information at
Intermediate Cut Item Information at
Advanced Cut Item Information at Proficient Cut
1 –1.63 0.07 0.02 0.01 2 0.56 0.25 0.14 0.07 3 –1.33 0.09 0.03 0.01 4 –0.24 0.19 0.08 0.03 5 –0.39 0.18 0.07 0.03 6 0.48 0.24 0.14 0.06 7 1.24 0.24 0.21 0.11 8 –0.46 0.17 0.06 0.03 9 1.58 0.22 0.23 0.14
10 0.17 0.22 0.11 0.05 11 1.08 0.25 0.19 0.10 12 1.08 0.25 0.19 0.10 13 1.75 0.20 0.24 0.16 14 1.89 0.19 0.25 0.17 15 1.52 0.22 0.23 0.14 16 1.56 0.22 0.23 0.14 17 1.77 0.20 0.24 0.16 18 0.81 0.25 0.17 0.08 19 0.50 0.24 0.14 0.06 20 1.48 0.23 0.23 0.13 21 0.56 0.25 0.14 0.07 22 1.59 0.22 0.23 0.14 23 1.31 0.24 0.21 0.12 24 2.42 0.14 0.24 0.22 25 1.45 0.23 0.22 0.13 26 1.62 0.21 0.23 0.15 27 1.37 0.23 0.22 0.12 28 1.01 0.25 0.19 0.09
RD
29 1.00 0.25 0.18 0.09 1 –1.65 0.07 0.02 0.01 2 –1.65 0.07 0.02 0.01 3 –0.42 0.17 0.07 0.03 4 0.70 0.25 0.16 0.07 5 1.45 0.23 0.22 0.13 6 1.67 0.21 0.24 0.15 7 0.32 0.23 0.12 0.05 8 2.01 0.18 0.25 0.18 9 –0.03 0.21 0.09 0.04
10 0.18 0.23 0.11 0.05 11 0.43 0.24 0.13 0.06 12 0.26 0.23 0.12 0.05 13 0.79 0.25 0.16 0.08 14 1.16 0.24 0.20 0.11 15 0.44 0.24 0.13 0.06 16 0.40 0.24 0.13 0.06 17 0.88 0.25 0.17 0.08 18 0.64 0.25 0.15 0.07 19 0.48 0.24 0.14 0.06
WR
20 1.75 0.20 0.24 0.16

2006 NYSESLAT Technical Manual
Page 218
Grade 8
Listening and Speaking
Item Rasch
Difficulty Item Information at
Intermediate Cut Item Information at
Advanced Cut Item Information at
Proficient Cut 1 –1.82 0.11 0.03 0.01 2 –0.67 0.21 0.08 0.03 3 –0.67 0.21 0.08 0.03 4 –2.48 0.06 0.01 0.00 5 0.01 0.25 0.13 0.05 6 0.37 0.25 0.16 0.07 7 0.59 0.24 0.18 0.08 8 1.03 0.21 0.22 0.11 9 0.31 0.25 0.16 0.06
10 2.06 0.11 0.24 0.21 11 1.64 0.15 0.25 0.17 12 1.76 0.14 0.25 0.18 13 1.11 0.20 0.23 0.12 14 1.09 0.20 0.23 0.12 15 1.13 0.20 0.23 0.12 16 1.83 0.13 0.25 0.19 17 1.53 0.16 0.25 0.16 18 1.14 0.20 0.23 0.12 19 2.33 0.09 0.23 0.23 20 1.66 0.15 0.25 0.17 21 0.63 0.24 0.19 0.08 22 0.91 0.22 0.21 0.10 23 1.91 0.13 0.25 0.19 24 1.44 0.17 0.24 0.15 25 1.42 0.17 0.24 0.15 26 1.55 0.16 0.25 0.16
LI
27 1.05 0.21 0.22 0.11 1 –1.69 0.12 0.03 0.01 2 –1.35 0.15 0.04 0.01 3 –1.38 0.15 0.04 0.01 4 –1.43 0.14 0.04 0.01 5 –0.87 0.20 0.06 0.02 6 0.83 0.22 0.20 0.10 7 0.61 0.24 0.18 0.08 8 0.24 0.25 0.15 0.06 9 0.80 0.23 0.20 0.09
10 0.61 0.24 0.18 0.08 11 0.90 0.22 0.21 0.10 12 0.48 0.24 0.17 0.07 13 0.18 0.25 0.14 0.06 14 0.09 0.25 0.14 0.05 15 0.43 0.25 0.17 0.07
SP
16 0.33 0.25 0.16 0.06

2006 NYSESLAT Technical Manual
Page 219
Grade 8
Reading and Writing
Item Rasch
Difficulty Item Information at
Intermediate Cut Item Information at Advanced Cut
Item Information atProficient Cut
1 –1.63 0.07 0.02 0.01 2 0.56 0.24 0.12 0.07 3 –1.33 0.09 0.02 0.01 4 –0.24 0.18 0.07 0.03 5 –0.39 0.17 0.06 0.03 6 0.48 0.24 0.12 0.06 7 1.24 0.24 0.19 0.11 8 –0.46 0.16 0.05 0.03 9 1.58 0.22 0.22 0.14
10 0.17 0.22 0.09 0.05 11 1.08 0.25 0.17 0.10 12 1.08 0.25 0.17 0.10 13 1.75 0.21 0.23 0.16 14 1.89 0.20 0.24 0.17 15 1.52 0.23 0.21 0.14 16 1.56 0.23 0.22 0.14 17 1.77 0.21 0.23 0.16 18 0.81 0.25 0.15 0.08 19 0.50 0.24 0.12 0.06 20 1.48 0.23 0.21 0.13 21 0.56 0.24 0.12 0.07 22 1.59 0.22 0.22 0.14 23 1.31 0.24 0.19 0.12 24 2.42 0.15 0.25 0.22 25 1.45 0.23 0.21 0.13 26 1.62 0.22 0.22 0.15 27 1.37 0.24 0.20 0.12 28 1.01 0.25 0.17 0.09
RD
29 1.00 0.25 0.16 0.09 1 –1.65 0.07 0.02 0.01 2 –1.65 0.07 0.02 0.01 3 –0.42 0.16 0.06 0.03 4 0.70 0.25 0.14 0.07 5 1.45 0.23 0.21 0.13 6 1.67 0.22 0.22 0.15 7 0.32 0.23 0.10 0.05 8 2.01 0.19 0.24 0.18 9 –0.03 0.20 0.08 0.04
10 0.18 0.22 0.09 0.05 11 0.43 0.24 0.11 0.06 12 0.26 0.22 0.10 0.05 13 0.79 0.25 0.14 0.08 14 1.16 0.25 0.18 0.11 15 0.44 0.24 0.11 0.06 16 0.40 0.23 0.11 0.06 17 0.88 0.25 0.15 0.08 18 0.64 0.25 0.13 0.07 19 0.48 0.24 0.12 0.06
WR
20 1.75 0.21 0.23 0.16

2006 NYSESLAT Technical Manual
Page 220
G.5: Grade 9 – Grade 12
Grade 9
Listening and Speaking
Item Rasch
Difficulty Item Information at
Intermediate Cut Item Information at Advanced Cut
Item Information at Proficient Cut
1 –0.95 0.14 0.04 0.01 2 –0.11 0.22 0.08 0.03 3 –0.17 0.21 0.08 0.03 4 0.49 0.25 0.13 0.05 5 –1.13 0.12 0.03 0.01 6 1.69 0.19 0.23 0.14 7 1.63 0.20 0.23 0.13 8 1.88 0.18 0.24 0.16 9 2.06 0.16 0.25 0.18
10 1.82 0.18 0.24 0.15 11 2.50 0.12 0.25 0.22 12 1.97 0.17 0.25 0.17 13 3.16 0.07 0.20 0.25 14 2.28 0.14 0.25 0.20 15 2.31 0.14 0.25 0.20 16 2.18 0.15 0.25 0.19 17 2.42 0.13 0.25 0.21 18 2.19 0.15 0.25 0.19 19 0.92 0.25 0.17 0.08 20 1.15 0.24 0.19 0.09 21 1.67 0.20 0.23 0.14 22 0.37 0.24 0.12 0.05 23 0.78 0.25 0.15 0.07 24 0.45 0.25 0.12 0.05 25 2.83 0.09 0.23 0.24 26 1.96 0.17 0.25 0.17
LI
27 1.11 0.24 0.19 0.09 1 –0.59 0.17 0.05 0.02 2 0.11 0.23 0.10 0.04 3 –0.36 0.20 0.07 0.02 4 –0.69 0.16 0.05 0.02 5 –0.25 0.21 0.07 0.03 6 1.17 0.23 0.19 0.10 7 0.76 0.25 0.15 0.07 8 1.45 0.21 0.22 0.12 9 0.69 0.25 0.15 0.06
10 0.75 0.25 0.15 0.07 11 1.39 0.22 0.21 0.11 12 0.79 0.25 0.15 0.07 13 0.93 0.25 0.17 0.08 14 1.12 0.24 0.19 0.09 15 0.84 0.25 0.16 0.07
SP
16 1.00 0.24 0.17 0.08

2006 NYSESLAT Technical Manual
Page 221
Grade 9
Reading and Writing
Item Rasch
Difficulty Item Information at
Intermediate Cut Item Information at Advanced Cut
Item Information at Proficient Cut
1 0.50 0.22 0.08 0.04 2 –1.95 0.04 0.01 0.00 3 1.29 0.25 0.15 0.08 4 1.52 0.24 0.17 0.10 5 0.06 0.18 0.06 0.03 6 3.19 0.11 0.24 0.24 7 1.45 0.25 0.16 0.09 8 1.34 0.25 0.15 0.09 9 2.49 0.17 0.24 0.19
10 0.52 0.22 0.08 0.04 11 0.25 0.20 0.07 0.03 12 1.83 0.23 0.20 0.12 13 1.57 0.24 0.18 0.10 14 3.09 0.11 0.24 0.23 15 1.16 0.25 0.14 0.07 16 1.31 0.25 0.15 0.08 17 1.82 0.23 0.20 0.12 18 1.59 0.24 0.18 0.10 19 1.66 0.24 0.18 0.11 20 3.02 0.12 0.25 0.23 21 1.41 0.25 0.16 0.09 22 2.06 0.21 0.22 0.15 23 1.94 0.22 0.21 0.13 24 1.64 0.24 0.18 0.11 25 2.32 0.19 0.24 0.17 26 1.87 0.22 0.20 0.13 27 2.67 0.15 0.25 0.20 28 2.33 0.19 0.24 0.17
RD
29 2.07 0.21 0.22 0.15 1 0.70 0.23 0.10 0.05 2 0.15 0.19 0.06 0.03 3 1.93 0.22 0.21 0.13 4 0.99 0.25 0.12 0.06 5 0.73 0.24 0.10 0.05 6 2.53 0.17 0.25 0.19 7 2.26 0.19 0.23 0.16 8 2.76 0.14 0.25 0.21 9 0.88 0.24 0.11 0.06
10 1.67 0.24 0.18 0.11 11 1.94 0.22 0.21 0.13 12 3.38 0.09 0.23 0.25 13 0.85 0.24 0.11 0.06 14 2.73 0.15 0.25 0.21 15 2.46 0.17 0.24 0.18 16 1.85 0.23 0.20 0.13 17 1.09 0.25 0.13 0.07 18 1.38 0.25 0.16 0.09 19 1.53 0.24 0.17 0.10
WR
20 2.54 0.17 0.25 0.19

2006 NYSESLAT Technical Manual
Page 222
Grade 10
Listening and Speaking
Item Rasch
Difficulty Item Information at
Intermediate Cut Item Information at
Advanced Cut Item Information at
Proficient Cut 1 –0.95 0.13 0.03 0.01 2 –0.11 0.20 0.07 0.03 3 –0.17 0.20 0.06 0.03 4 0.49 0.24 0.11 0.05 5 –1.13 0.11 0.03 0.01 6 1.69 0.21 0.22 0.12 7 1.63 0.21 0.21 0.12 8 1.88 0.19 0.23 0.14 9 2.06 0.17 0.24 0.16
10 1.82 0.19 0.23 0.14 11 2.50 0.13 0.25 0.20 12 1.97 0.18 0.24 0.15 13 3.16 0.08 0.22 0.24 14 2.28 0.15 0.25 0.18 15 2.31 0.15 0.25 0.18 16 2.18 0.16 0.25 0.17 17 2.42 0.14 0.25 0.19 18 2.19 0.16 0.25 0.17 19 0.92 0.25 0.15 0.07 20 1.15 0.24 0.17 0.08 21 1.67 0.21 0.22 0.12 22 0.37 0.24 0.10 0.04 23 0.78 0.25 0.13 0.06 24 0.45 0.24 0.11 0.04 25 2.83 0.10 0.24 0.23 26 1.96 0.18 0.24 0.15
LI
27 1.11 0.24 0.17 0.08 1 –0.59 0.16 0.04 0.02 2 0.11 0.22 0.08 0.03 3 –0.36 0.18 0.05 0.02 4 –0.69 0.15 0.04 0.02 5 –0.25 0.19 0.06 0.02 6 1.17 0.24 0.17 0.08 7 0.76 0.25 0.13 0.06 8 1.45 0.23 0.20 0.10 9 0.69 0.25 0.13 0.06
10 0.75 0.25 0.13 0.06 11 1.39 0.23 0.19 0.10 12 0.79 0.25 0.14 0.06 13 0.93 0.25 0.15 0.07 14 1.12 0.24 0.17 0.08 15 0.84 0.25 0.14 0.06
SP
16 1.00 0.25 0.15 0.07

2006 NYSESLAT Technical Manual
Page 223
Grade 10
Reading and Writing
Item Rasch
Difficulty Item Information at
Intermediate Cut Item Information at
Advanced Cut Item Information at
Proficient Cut 1 0.50 0.21 0.08 0.04 2 –1.95 0.04 0.01 0.00 3 1.29 0.25 0.14 0.07 4 1.52 0.25 0.16 0.09 5 0.06 0.17 0.05 0.02 6 3.19 0.11 0.25 0.23 7 1.45 0.25 0.15 0.08 8 1.34 0.25 0.14 0.07 9 2.49 0.18 0.24 0.17
10 0.52 0.22 0.08 0.04 11 0.25 0.19 0.06 0.03 12 1.83 0.23 0.19 0.11 13 1.57 0.25 0.16 0.09 14 3.09 0.12 0.25 0.22 15 1.16 0.25 0.13 0.06 16 1.31 0.25 0.14 0.07 17 1.82 0.23 0.19 0.11 18 1.59 0.24 0.17 0.09 19 1.66 0.24 0.17 0.10 20 3.02 0.13 0.25 0.22 21 1.41 0.25 0.15 0.08 22 2.06 0.22 0.21 0.13 23 1.94 0.23 0.20 0.12 24 1.64 0.24 0.17 0.09 25 2.32 0.19 0.23 0.15 26 1.87 0.23 0.19 0.11 27 2.67 0.16 0.25 0.19 28 2.33 0.19 0.23 0.15
RD
29 2.07 0.22 0.21 0.13 1 0.70 0.23 0.09 0.04 2 0.15 0.18 0.06 0.03 3 1.93 0.23 0.20 0.12 4 0.99 0.24 0.11 0.05 5 0.73 0.23 0.09 0.04 6 2.53 0.18 0.24 0.17 7 2.26 0.20 0.23 0.15 8 2.76 0.15 0.25 0.20 9 0.88 0.24 0.10 0.05
10 1.67 0.24 0.17 0.10 11 1.94 0.23 0.20 0.12 12 3.38 0.10 0.24 0.24 13 0.85 0.24 0.10 0.05 14 2.73 0.16 0.25 0.19 15 2.46 0.18 0.24 0.17 16 1.85 0.23 0.19 0.11 17 1.09 0.25 0.12 0.06 18 1.38 0.25 0.15 0.08 19 1.53 0.25 0.16 0.09
WR
20 2.54 0.17 0.24 0.17

2006 NYSESLAT Technical Manual
Page 224
Grade 11
Listening and Speaking
Item Rasch
Difficulty Item Information at
Intermediate Cut Item Information at
Advanced Cut Item Information at Proficient Cut
1 –0.95 0.11 0.03 0.01 2 –0.11 0.19 0.05 0.02 3 –0.17 0.18 0.05 0.02 4 0.49 0.23 0.09 0.04 5 –1.13 0.09 0.02 0.01 6 1.69 0.22 0.20 0.11 7 1.63 0.23 0.19 0.10 8 1.88 0.21 0.21 0.12 9 2.06 0.19 0.23 0.14
10 1.82 0.21 0.21 0.12 11 2.50 0.15 0.25 0.18 12 1.97 0.20 0.22 0.13 13 3.16 0.09 0.24 0.24 14 2.28 0.17 0.24 0.16 15 2.31 0.17 0.24 0.16 16 2.18 0.18 0.24 0.15 17 2.42 0.16 0.25 0.17 18 2.19 0.18 0.24 0.15 19 0.92 0.25 0.13 0.06 20 1.15 0.25 0.15 0.07 21 1.67 0.22 0.20 0.11 22 0.37 0.23 0.08 0.03 23 0.78 0.25 0.11 0.05 24 0.45 0.23 0.09 0.04 25 2.83 0.12 0.25 0.21 26 1.96 0.20 0.22 0.13
LI
27 1.11 0.25 0.14 0.07 1 –0.59 0.14 0.04 0.01 2 0.11 0.21 0.07 0.03 3 –0.36 0.16 0.04 0.02 4 –0.69 0.13 0.03 0.01 5 –0.25 0.17 0.05 0.02 6 1.17 0.25 0.15 0.07 7 0.76 0.25 0.11 0.05 8 1.45 0.24 0.17 0.09 9 0.69 0.24 0.11 0.05
10 0.75 0.25 0.11 0.05 11 1.39 0.24 0.17 0.09 12 0.79 0.25 0.11 0.05 13 0.93 0.25 0.13 0.06 14 1.12 0.25 0.14 0.07 15 0.84 0.25 0.12 0.05
SP
16 1.00 0.25 0.13 0.06

2006 NYSESLAT Technical Manual
Page 225
Grade 11
Reading and Writing
Item Rasch
Difficulty Item Information at
Intermediate Cut Item Information at Advanced Cut
Item Information at Proficient Cut
1 0.50 0.21 0.06 0.03 2 –1.95 0.03 0.01 0.00 3 1.29 0.25 0.12 0.06 4 1.52 0.25 0.14 0.07 5 0.06 0.17 0.04 0.02 6 3.19 0.12 0.25 0.22 7 1.45 0.25 0.13 0.07 8 1.34 0.25 0.12 0.06 9 2.49 0.19 0.22 0.15
10 0.52 0.21 0.06 0.03 11 0.25 0.18 0.05 0.02 12 1.83 0.24 0.17 0.09 13 1.57 0.25 0.14 0.08 14 3.09 0.13 0.25 0.21 15 1.16 0.25 0.10 0.05 16 1.31 0.25 0.12 0.06 17 1.82 0.24 0.16 0.09 18 1.59 0.25 0.14 0.08 19 1.66 0.25 0.15 0.08 20 3.02 0.14 0.25 0.20 21 1.41 0.25 0.13 0.07 22 2.06 0.22 0.19 0.11 23 1.94 0.23 0.18 0.10 24 1.64 0.25 0.15 0.08 25 2.32 0.20 0.21 0.14 26 1.87 0.24 0.17 0.10 27 2.67 0.17 0.24 0.17 28 2.33 0.20 0.21 0.14
RD
29 2.07 0.22 0.19 0.11 1 0.70 0.22 0.07 0.04 2 0.15 0.17 0.04 0.02 3 1.93 0.23 0.18 0.10 4 0.99 0.24 0.09 0.05 5 0.73 0.22 0.07 0.04 6 2.53 0.18 0.23 0.15 7 2.26 0.21 0.21 0.13 8 2.76 0.16 0.24 0.18 9 0.88 0.23 0.08 0.04
10 1.67 0.25 0.15 0.08 11 1.94 0.23 0.18 0.10 12 3.38 0.11 0.25 0.23 13 0.85 0.23 0.08 0.04 14 2.73 0.16 0.24 0.17 15 2.46 0.19 0.22 0.15 16 1.85 0.24 0.17 0.10 17 1.09 0.24 0.10 0.05 18 1.38 0.25 0.12 0.06 19 1.53 0.25 0.14 0.07
WR
20 2.54 0.18 0.23 0.16

2006 NYSESLAT Technical Manual
Page 226
Grade 12
Listening and Speaking
Item Rasch
Difficulty Item Information at
Intermediate Cut Item Information at Advanced Cut
Item Information at Proficient Cut
1 –0.95 0.10 0.02 0.01 2 –0.11 0.17 0.04 0.02 3 –0.17 0.17 0.04 0.02 4 0.49 0.23 0.07 0.04 5 –1.13 0.08 0.02 0.01 6 1.69 0.23 0.17 0.11 7 1.63 0.24 0.17 0.10 8 1.88 0.22 0.19 0.12 9 2.06 0.20 0.21 0.14
10 1.82 0.22 0.18 0.12 11 2.50 0.16 0.24 0.18 12 1.97 0.21 0.20 0.13 13 3.16 0.10 0.25 0.24 14 2.28 0.18 0.22 0.16 15 2.31 0.18 0.23 0.16 16 2.18 0.19 0.22 0.15 17 2.42 0.17 0.23 0.17 18 2.19 0.19 0.22 0.15 19 0.92 0.25 0.10 0.06 20 1.15 0.25 0.12 0.07 21 1.67 0.23 0.17 0.11 22 0.37 0.22 0.06 0.03 23 0.78 0.24 0.09 0.05 24 0.45 0.22 0.07 0.04 25 2.83 0.13 0.25 0.21 26 1.96 0.21 0.20 0.13
LI
27 1.11 0.25 0.12 0.07 1 –0.59 0.13 0.03 0.01 2 0.11 0.19 0.05 0.03 3 –0.36 0.15 0.03 0.02 4 –0.69 0.12 0.02 0.01 5 –0.25 0.16 0.04 0.02 6 1.17 0.25 0.12 0.07 7 0.76 0.24 0.09 0.05 8 1.45 0.24 0.15 0.09 9 0.69 0.24 0.08 0.05
10 0.75 0.24 0.09 0.05 11 1.39 0.25 0.14 0.09 12 0.79 0.24 0.09 0.05 13 0.93 0.25 0.10 0.06 14 1.12 0.25 0.12 0.07 15 0.84 0.24 0.10 0.05
SP
16 1.00 0.25 0.11 0.06
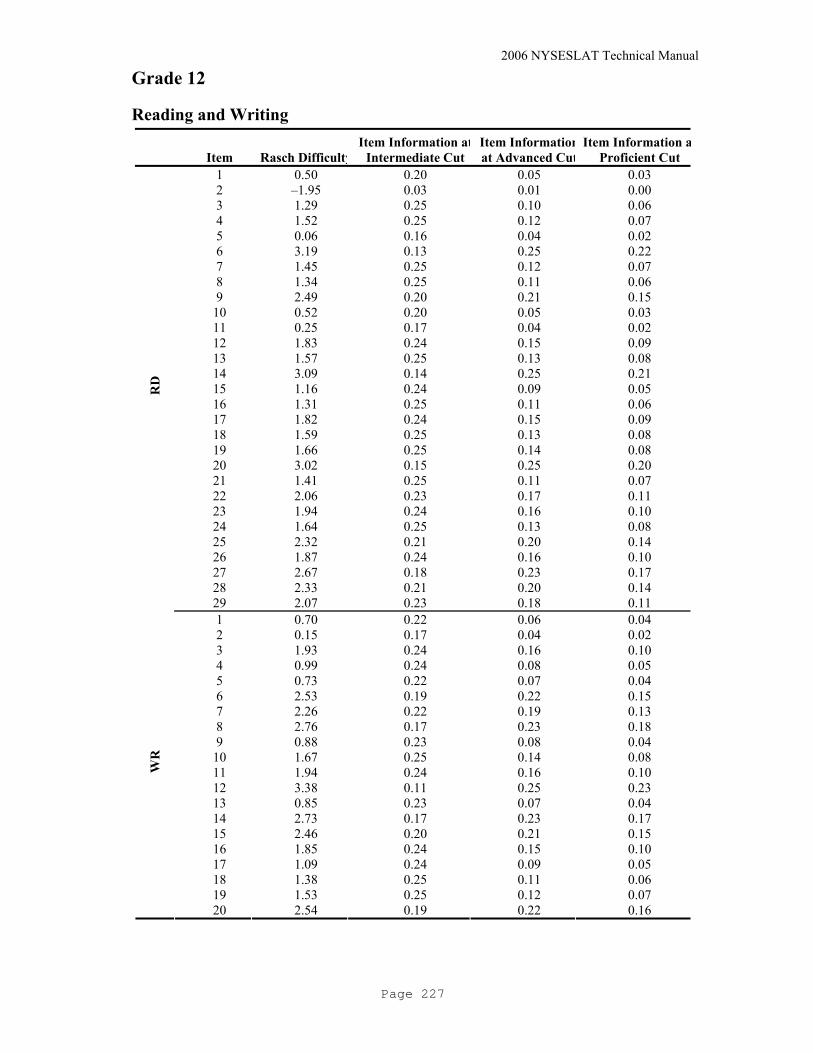
2006 NYSESLAT Technical Manual
Page 227
Grade 12
Reading and Writing
Item Rasch DifficultyItem Information at
Intermediate CutItem Informationat Advanced Cut
Item Information aProficient Cut
1 0.50 0.20 0.05 0.03 2 –1.95 0.03 0.01 0.00 3 1.29 0.25 0.10 0.06 4 1.52 0.25 0.12 0.07 5 0.06 0.16 0.04 0.02 6 3.19 0.13 0.25 0.22 7 1.45 0.25 0.12 0.07 8 1.34 0.25 0.11 0.06 9 2.49 0.20 0.21 0.15
10 0.52 0.20 0.05 0.03 11 0.25 0.17 0.04 0.02 12 1.83 0.24 0.15 0.09 13 1.57 0.25 0.13 0.08 14 3.09 0.14 0.25 0.21 15 1.16 0.24 0.09 0.05 16 1.31 0.25 0.11 0.06 17 1.82 0.24 0.15 0.09 18 1.59 0.25 0.13 0.08 19 1.66 0.25 0.14 0.08 20 3.02 0.15 0.25 0.20 21 1.41 0.25 0.11 0.07 22 2.06 0.23 0.17 0.11 23 1.94 0.24 0.16 0.10 24 1.64 0.25 0.13 0.08 25 2.32 0.21 0.20 0.14 26 1.87 0.24 0.16 0.10 27 2.67 0.18 0.23 0.17 28 2.33 0.21 0.20 0.14
RD
29 2.07 0.23 0.18 0.11 1 0.70 0.22 0.06 0.04 2 0.15 0.17 0.04 0.02 3 1.93 0.24 0.16 0.10 4 0.99 0.24 0.08 0.05 5 0.73 0.22 0.07 0.04 6 2.53 0.19 0.22 0.15 7 2.26 0.22 0.19 0.13 8 2.76 0.17 0.23 0.18 9 0.88 0.23 0.08 0.04
10 1.67 0.25 0.14 0.08 11 1.94 0.24 0.16 0.10 12 3.38 0.11 0.25 0.23 13 0.85 0.23 0.07 0.04 14 2.73 0.17 0.23 0.17 15 2.46 0.20 0.21 0.15 16 1.85 0.24 0.15 0.10 17 1.09 0.24 0.09 0.05 18 1.38 0.25 0.11 0.06 19 1.53 0.25 0.12 0.07
WR
20 2.54 0.19 0.22 0.16

2006 NYSESLAT Technical Manual
Page 228
APPENDIX H: SCALE SCORE SUMMARY BY SUBGROUPS H.1: Kindergarten Listening/Speaking (LS) Grade Test Group N-count Mean Median SD IQR
K LS Female 11408 591 590 52 59 K LS Male 12891 586 585 50 54 K LS Asian 5423 591 590 49 59 K LS Black or African American 892 584 585 51 61 K LS Hispanic or Latino 15522 585 585 51 58 K LS Native American Indian/Alaska Native 39 589 590 51 51 K LS Native Hawaiian/Other Pacific Islander 8 595 615 62 93 K LS White 2415 601 600 53 61 K LS NYC 15741 588 590 52 62 K LS Big 4 Cities 1171 577 581 47 57 K LS High Need Urban/Suburban 2933 585 585 48 54 K LS High Need Rural 189 596 595 44 52 K LS Average Need 2717 594 595 49 56 K LS Low Need 1444 596 595 47 52 K LS Charter Schools 104 596 595 41 52 K LS 0 Years LEP 3901 589 590 49 59 K LS 1 Years LEP 15107 590 590 48 62 K LS Arabic 483 586 590 62 72 K LS Bengali 594 594 595 52 56 K LS Chinese 739 588 585 47 51 K LS English 2242 593 593 48 56 K LS Spanish 13218 586 585 51 58 K LS Language Missing 2227 588 590 50 51 K LS Other Language 4796 592 590 51 59 K LS Students with Disabilities 1892 568 569 48 55
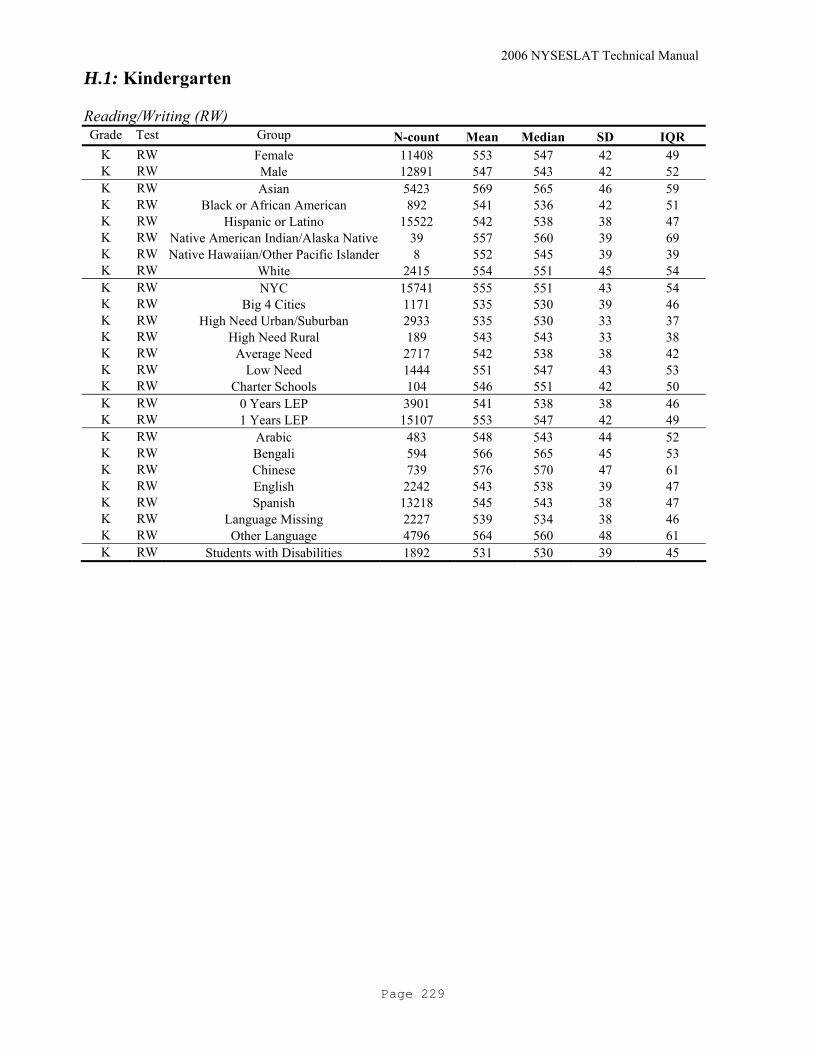
2006 NYSESLAT Technical Manual
Page 229
H.1: Kindergarten Reading/Writing (RW) Grade Test Group N-count Mean Median SD IQR
K RW Female 11408 553 547 42 49 K RW Male 12891 547 543 42 52 K RW Asian 5423 569 565 46 59 K RW Black or African American 892 541 536 42 51 K RW Hispanic or Latino 15522 542 538 38 47 K RW Native American Indian/Alaska Native 39 557 560 39 69 K RW Native Hawaiian/Other Pacific Islander 8 552 545 39 39 K RW White 2415 554 551 45 54 K RW NYC 15741 555 551 43 54 K RW Big 4 Cities 1171 535 530 39 46 K RW High Need Urban/Suburban 2933 535 530 33 37 K RW High Need Rural 189 543 543 33 38 K RW Average Need 2717 542 538 38 42 K RW Low Need 1444 551 547 43 53 K RW Charter Schools 104 546 551 42 50 K RW 0 Years LEP 3901 541 538 38 46 K RW 1 Years LEP 15107 553 547 42 49 K RW Arabic 483 548 543 44 52 K RW Bengali 594 566 565 45 53 K RW Chinese 739 576 570 47 61 K RW English 2242 543 538 39 47 K RW Spanish 13218 545 543 38 47 K RW Language Missing 2227 539 534 38 46 K RW Other Language 4796 564 560 48 61 K RW Students with Disabilities 1892 531 530 39 45

2006 NYSESLAT Technical Manual
Page 230
H.2: Grade 1 Listening/Speaking (LS) Grade Test Group N-count Mean Median SD IQR
1 LS Female 12033 631 630 57 63 1 LS Male 13735 626 621 56 63 1 LS Asian 4696 633 630 56 58 1 LS Black or African American 1108 622 621 55 68 1 LS Hispanic or Latino 17433 625 621 56 63 1 LS Native American Indian/Alaska Native 39 634 630 54 84 1 LS Native Hawaiian/Other Pacific Islander 8 665 671 71 117 1 LS White 2484 643 642 59 78 1 LS NYC 17174 628 630 57 63 1 LS Big 4 Cities 1318 613 613 51 57 1 LS High Need Urban/Suburban 2979 623 621 56 68 1 LS High Need Rural 155 631 630 48 58 1 LS Average Need 2597 638 630 56 84 1 LS Low Need 1438 641 642 56 78 1 LS Charter Schools 107 637 630 42 45 1 LS 0 Years LEP 918 606 606 65 89 1 LS 1 Years LEP 5751 623 621 58 73 1 LS 2 Years LEP 14999 636 630 50 58 1 LS Arabic 476 620 621 65 68 1 LS Bengali 620 635 630 57 84 1 LS Chinese 597 634 630 55 58 1 LS English 2056 633 630 53 58 1 LS Spanish 14700 625 621 56 68 1 LS Language Missing 2374 628 630 58 63 1 LS Other Language 4945 636 630 57 84 1 LS Students with Disabilities 2743 608 606 52 66
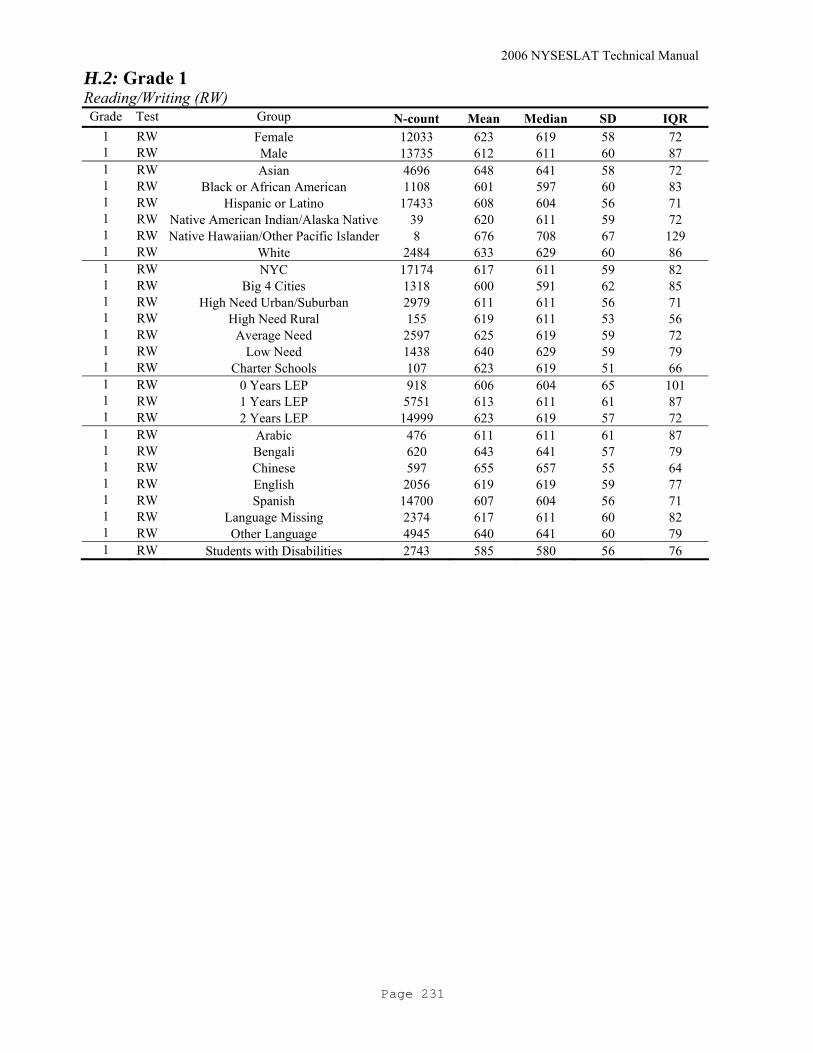
2006 NYSESLAT Technical Manual
Page 231
H.2: Grade 1 Reading/Writing (RW) Grade Test Group N-count Mean Median SD IQR
1 RW Female 12033 623 619 58 72 1 RW Male 13735 612 611 60 87 1 RW Asian 4696 648 641 58 72 1 RW Black or African American 1108 601 597 60 83 1 RW Hispanic or Latino 17433 608 604 56 71 1 RW Native American Indian/Alaska Native 39 620 611 59 72 1 RW Native Hawaiian/Other Pacific Islander 8 676 708 67 129 1 RW White 2484 633 629 60 86 1 RW NYC 17174 617 611 59 82 1 RW Big 4 Cities 1318 600 591 62 85 1 RW High Need Urban/Suburban 2979 611 611 56 71 1 RW High Need Rural 155 619 611 53 56 1 RW Average Need 2597 625 619 59 72 1 RW Low Need 1438 640 629 59 79 1 RW Charter Schools 107 623 619 51 66 1 RW 0 Years LEP 918 606 604 65 101 1 RW 1 Years LEP 5751 613 611 61 87 1 RW 2 Years LEP 14999 623 619 57 72 1 RW Arabic 476 611 611 61 87 1 RW Bengali 620 643 641 57 79 1 RW Chinese 597 655 657 55 64 1 RW English 2056 619 619 59 77 1 RW Spanish 14700 607 604 56 71 1 RW Language Missing 2374 617 611 60 82 1 RW Other Language 4945 640 641 60 79 1 RW Students with Disabilities 2743 585 580 56 76
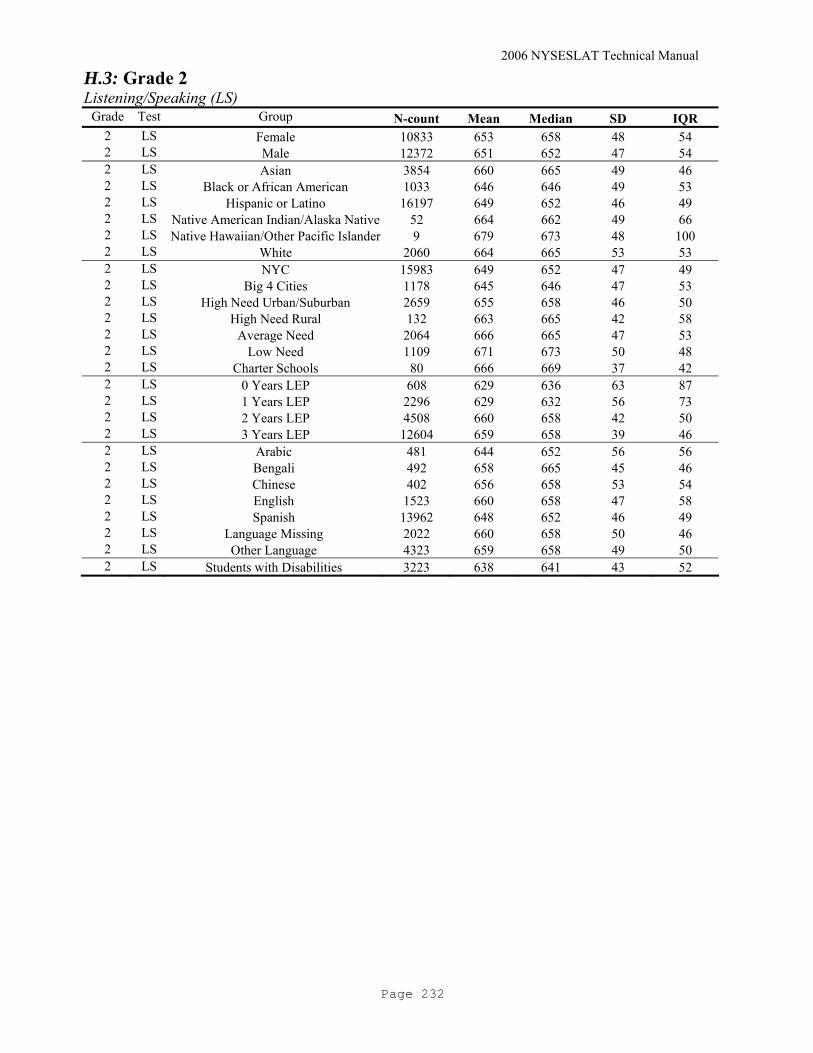
2006 NYSESLAT Technical Manual
Page 232
H.3: Grade 2 Listening/Speaking (LS)
Grade Test Group N-count Mean Median SD IQR 2 LS Female 10833 653 658 48 54 2 LS Male 12372 651 652 47 54 2 LS Asian 3854 660 665 49 46 2 LS Black or African American 1033 646 646 49 53 2 LS Hispanic or Latino 16197 649 652 46 49 2 LS Native American Indian/Alaska Native 52 664 662 49 66 2 LS Native Hawaiian/Other Pacific Islander 9 679 673 48 100 2 LS White 2060 664 665 53 53 2 LS NYC 15983 649 652 47 49 2 LS Big 4 Cities 1178 645 646 47 53 2 LS High Need Urban/Suburban 2659 655 658 46 50 2 LS High Need Rural 132 663 665 42 58 2 LS Average Need 2064 666 665 47 53 2 LS Low Need 1109 671 673 50 48 2 LS Charter Schools 80 666 669 37 42 2 LS 0 Years LEP 608 629 636 63 87 2 LS 1 Years LEP 2296 629 632 56 73 2 LS 2 Years LEP 4508 660 658 42 50 2 LS 3 Years LEP 12604 659 658 39 46 2 LS Arabic 481 644 652 56 56 2 LS Bengali 492 658 665 45 46 2 LS Chinese 402 656 658 53 54 2 LS English 1523 660 658 47 58 2 LS Spanish 13962 648 652 46 49 2 LS Language Missing 2022 660 658 50 46 2 LS Other Language 4323 659 658 49 50 2 LS Students with Disabilities 3223 638 641 43 52
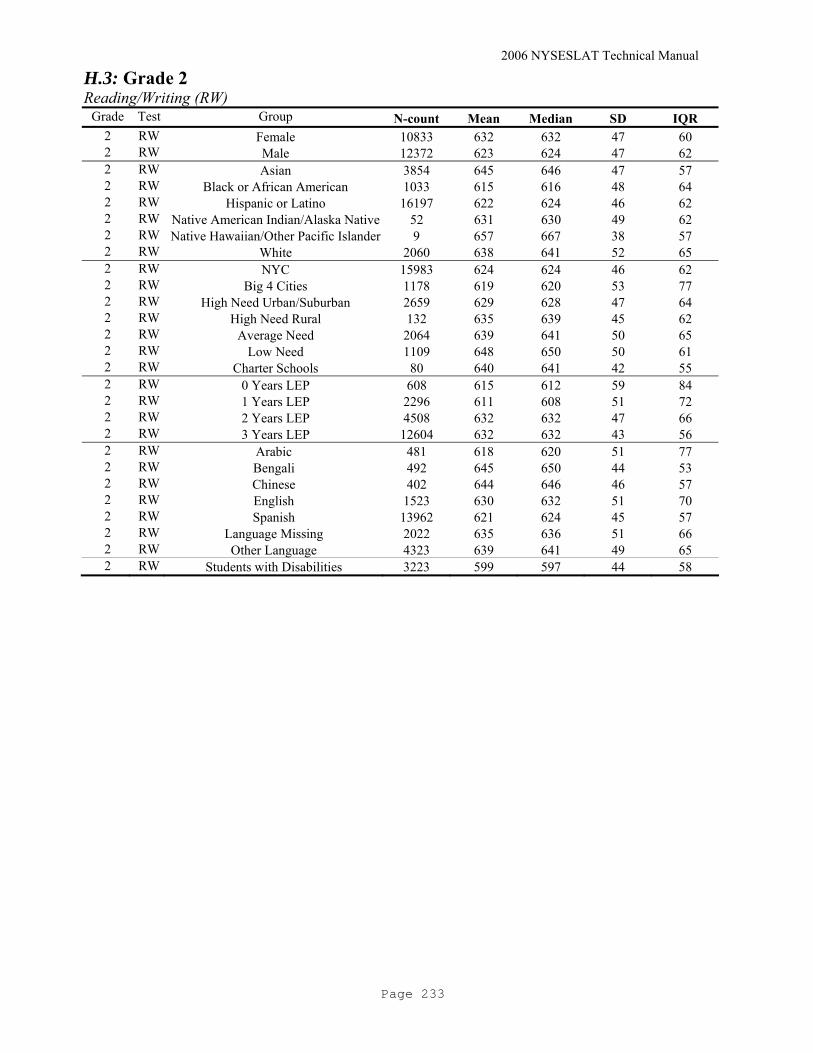
2006 NYSESLAT Technical Manual
Page 233
H.3: Grade 2 Reading/Writing (RW)
Grade Test Group N-count Mean Median SD IQR 2 RW Female 10833 632 632 47 60 2 RW Male 12372 623 624 47 62 2 RW Asian 3854 645 646 47 57 2 RW Black or African American 1033 615 616 48 64 2 RW Hispanic or Latino 16197 622 624 46 62 2 RW Native American Indian/Alaska Native 52 631 630 49 62 2 RW Native Hawaiian/Other Pacific Islander 9 657 667 38 57 2 RW White 2060 638 641 52 65 2 RW NYC 15983 624 624 46 62 2 RW Big 4 Cities 1178 619 620 53 77 2 RW High Need Urban/Suburban 2659 629 628 47 64 2 RW High Need Rural 132 635 639 45 62 2 RW Average Need 2064 639 641 50 65 2 RW Low Need 1109 648 650 50 61 2 RW Charter Schools 80 640 641 42 55 2 RW 0 Years LEP 608 615 612 59 84 2 RW 1 Years LEP 2296 611 608 51 72 2 RW 2 Years LEP 4508 632 632 47 66 2 RW 3 Years LEP 12604 632 632 43 56 2 RW Arabic 481 618 620 51 77 2 RW Bengali 492 645 650 44 53 2 RW Chinese 402 644 646 46 57 2 RW English 1523 630 632 51 70 2 RW Spanish 13962 621 624 45 57 2 RW Language Missing 2022 635 636 51 66 2 RW Other Language 4323 639 641 49 65 2 RW Students with Disabilities 3223 599 597 44 58

2006 NYSESLAT Technical Manual
Page 234
H.4: Grade 3 Listening/Speaking (LS) Grade Test Group N-count Mean Median SD IQR
3 LS Female 8768 663 665 51 58 3 LS Male 10253 663 665 51 58 3 LS Asian 2904 666 673 54 53 3 LS Black or African American 953 657 658 51 66 3 LS Hispanic or Latino 13506 661 665 50 58 3 LS Native American Indian/Alaska Native 33 678 673 32 52 3 LS Native Hawaiian/Other Pacific Islander 5 632 658 58 6 3 LS White 1620 675 673 52 64 3 LS NYC 13636 661 665 50 58 3 LS Big 4 Cities 927 655 658 50 54 3 LS High Need Urban/Suburban 1955 662 665 51 58 3 LS High Need Rural 115 671 665 48 48 3 LS Average Need 1529 674 682 53 64 3 LS Low Need 788 677 682 53 64 3 LS Charter Schools 71 678 673 43 42 3 LS 0 Years LEP 509 627 632 67 92 3 LS 1 Years LEP 1798 625 624 56 82 3 LS 2 Years LEP 1756 663 665 45 62 3 LS 3 Years LEP 3321 677 673 41 42 3 LS 4 Years LEP 8820 674 673 39 42 3 LS Arabic 335 654 665 56 70 3 LS Bengali 351 672 673 49 69 3 LS Chinese 319 660 665 61 62 3 LS English 1032 671 673 50 53 3 LS Spanish 11821 660 665 50 58 3 LS Language Missing 1562 671 673 49 48 3 LS Other Language 3601 667 673 53 58 3 LS Students with Disabilities 3168 656 658 42 50

2006 NYSESLAT Technical Manual
Page 235
H.4: Grade 3 Reading/Writing (RW) Grade Test Group N-count Mean Median SD IQR
3 RW Female 8768 653 655 51 65 3 RW Male 10253 646 650 51 65 3 RW Asian 2904 662 667 52 57 3 RW Black or African American 953 633 636 53 66 3 RW Hispanic or Latino 13506 646 650 50 65 3 RW Native American Indian/Alaska Native 33 678 673 55 61 3 RW Native Hawaiian/Other Pacific Islander 5 622 673 78 139 3 RW White 1620 659 661 54 61 3 RW NYC 13636 648 650 51 61 3 RW Big 4 Cities 927 638 646 55 68 3 RW High Need Urban/Suburban 1955 650 655 51 61 3 RW High Need Rural 115 649 650 49 61 3 RW Average Need 1529 655 661 50 61 3 RW Low Need 788 665 667 51 63 3 RW Charter Schools 71 656 661 42 49 3 RW 0 Years LEP 509 622 620 63 93 3 RW 1 Years LEP 1798 621 616 57 83 3 RW 2 Years LEP 1756 651 653 50 61 3 RW 3 Years LEP 3321 660 661 46 57 3 RW 4 Years LEP 8820 658 661 44 49 3 RW Arabic 335 637 646 58 72 3 RW Bengali 351 669 673 54 58 3 RW Chinese 319 657 667 54 57 3 RW English 1032 653 655 52 69 3 RW Spanish 11821 645 650 50 65 3 RW Language Missing 1562 655 655 50 65 3 RW Other Language 3601 657 661 53 61 3 RW Students with Disabilities 3168 624 624 46 62

2006 NYSESLAT Technical Manual
Page 236
H.5: Grade 4 Listening/Speaking (LS) Grade Test Group N-count Mean Median SD IQR
4 LS Female 6819 671 673 57 64 4 LS Male 8154 671 673 58 69 4 LS Asian 2238 670 673 60 74 4 LS Black or African American 821 670 673 55 74 4 LS Hispanic or Latino 10681 670 673 57 64 4 LS Native American Indian/Alaska Native 17 670 673 65 69 4 LS Native Hawaiian/Other Pacific Islander 8 655 662 41 55 4 LS White 1208 681 682 59 58 4 LS NYC 10110 667 673 57 69 4 LS Big 4 Cities 1013 668 673 57 74 4 LS High Need Urban/Suburban 1684 678 682 56 58 4 LS High Need Rural 87 690 694 53 58 4 LS Average Need 1367 684 682 58 52 4 LS Low Need 673 687 694 53 52 4 LS Charter Schools 39 709 694 43 63 4 LS 0 Years LEP 517 638 641 70 99 4 LS 1 Years LEP 1689 628 628 62 90 4 LS 2 Years LEP 1466 667 665 52 66 4 LS 3 Years LEP 1425 685 682 47 52 4 LS 4 Years LEP 2318 693 694 41 45 4 LS 5 Years LEP 5134 687 682 41 45 4 LS Arabic 266 656 665 71 103 4 LS Bengali 233 676 673 52 58 4 LS Chinese 189 662 673 71 90 4 LS English 868 685 682 52 52 4 LS Spanish 9257 668 673 57 69 4 LS Language Missing 1379 681 682 55 58 4 LS Other Language 2781 673 673 58 69 4 LS Students with Disabilities 2707 671 673 45 48
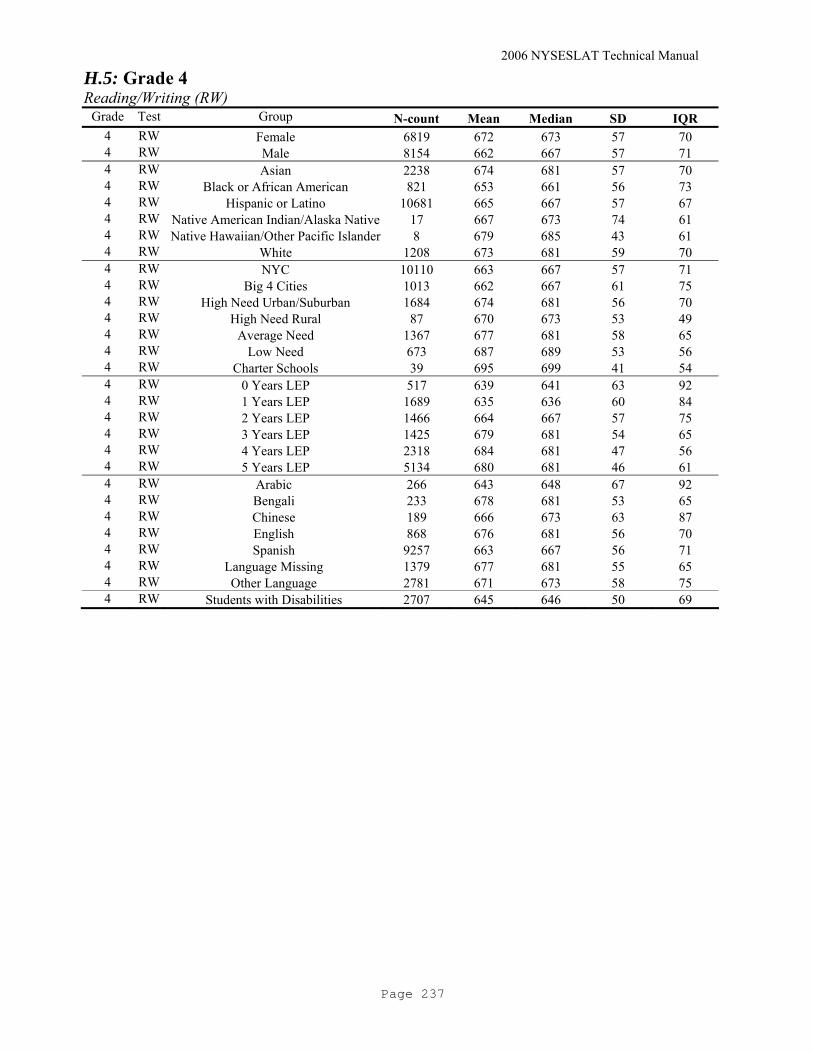
2006 NYSESLAT Technical Manual
Page 237
H.5: Grade 4 Reading/Writing (RW)
Grade Test Group N-count Mean Median SD IQR 4 RW Female 6819 672 673 57 70 4 RW Male 8154 662 667 57 71 4 RW Asian 2238 674 681 57 70 4 RW Black or African American 821 653 661 56 73 4 RW Hispanic or Latino 10681 665 667 57 67 4 RW Native American Indian/Alaska Native 17 667 673 74 61 4 RW Native Hawaiian/Other Pacific Islander 8 679 685 43 61 4 RW White 1208 673 681 59 70 4 RW NYC 10110 663 667 57 71 4 RW Big 4 Cities 1013 662 667 61 75 4 RW High Need Urban/Suburban 1684 674 681 56 70 4 RW High Need Rural 87 670 673 53 49 4 RW Average Need 1367 677 681 58 65 4 RW Low Need 673 687 689 53 56 4 RW Charter Schools 39 695 699 41 54 4 RW 0 Years LEP 517 639 641 63 92 4 RW 1 Years LEP 1689 635 636 60 84 4 RW 2 Years LEP 1466 664 667 57 75 4 RW 3 Years LEP 1425 679 681 54 65 4 RW 4 Years LEP 2318 684 681 47 56 4 RW 5 Years LEP 5134 680 681 46 61 4 RW Arabic 266 643 648 67 92 4 RW Bengali 233 678 681 53 65 4 RW Chinese 189 666 673 63 87 4 RW English 868 676 681 56 70 4 RW Spanish 9257 663 667 56 71 4 RW Language Missing 1379 677 681 55 65 4 RW Other Language 2781 671 673 58 75 4 RW Students with Disabilities 2707 645 646 50 69
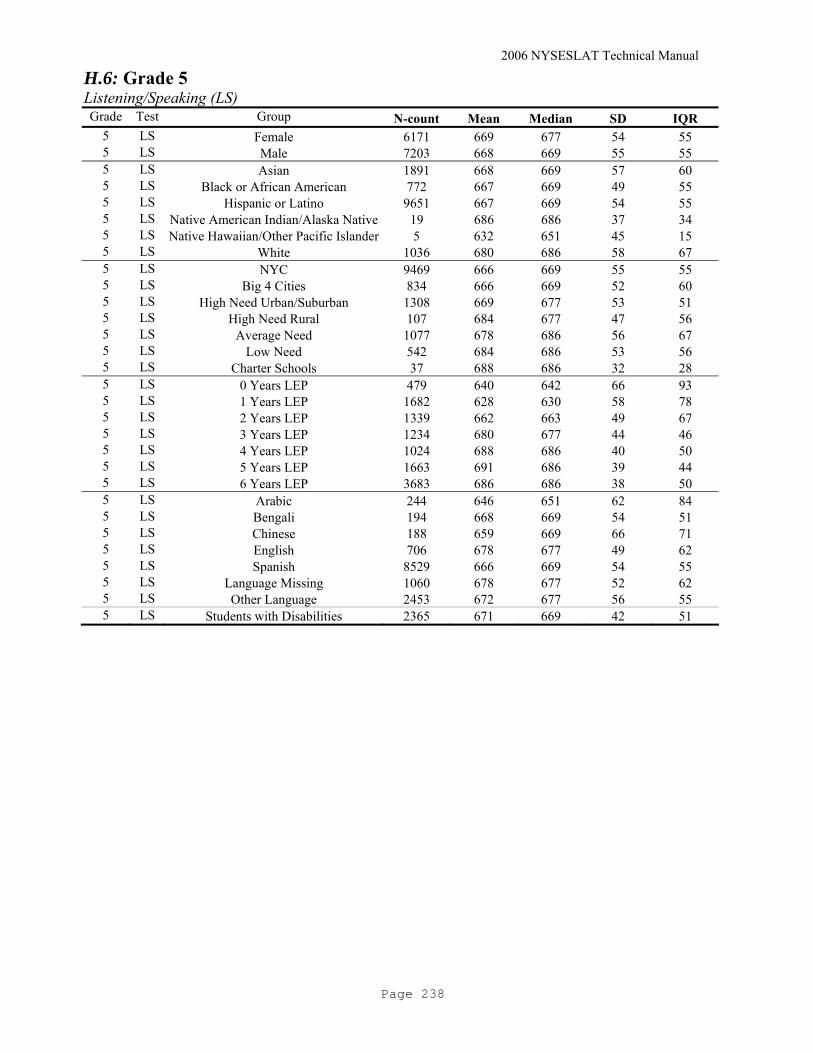
2006 NYSESLAT Technical Manual
Page 238
H.6: Grade 5 Listening/Speaking (LS) Grade Test Group N-count Mean Median SD IQR
5 LS Female 6171 669 677 54 55 5 LS Male 7203 668 669 55 55 5 LS Asian 1891 668 669 57 60 5 LS Black or African American 772 667 669 49 55 5 LS Hispanic or Latino 9651 667 669 54 55 5 LS Native American Indian/Alaska Native 19 686 686 37 34 5 LS Native Hawaiian/Other Pacific Islander 5 632 651 45 15 5 LS White 1036 680 686 58 67 5 LS NYC 9469 666 669 55 55 5 LS Big 4 Cities 834 666 669 52 60 5 LS High Need Urban/Suburban 1308 669 677 53 51 5 LS High Need Rural 107 684 677 47 56 5 LS Average Need 1077 678 686 56 67 5 LS Low Need 542 684 686 53 56 5 LS Charter Schools 37 688 686 32 28 5 LS 0 Years LEP 479 640 642 66 93 5 LS 1 Years LEP 1682 628 630 58 78 5 LS 2 Years LEP 1339 662 663 49 67 5 LS 3 Years LEP 1234 680 677 44 46 5 LS 4 Years LEP 1024 688 686 40 50 5 LS 5 Years LEP 1663 691 686 39 44 5 LS 6 Years LEP 3683 686 686 38 50 5 LS Arabic 244 646 651 62 84 5 LS Bengali 194 668 669 54 51 5 LS Chinese 188 659 669 66 71 5 LS English 706 678 677 49 62 5 LS Spanish 8529 666 669 54 55 5 LS Language Missing 1060 678 677 52 62 5 LS Other Language 2453 672 677 56 55 5 LS Students with Disabilities 2365 671 669 42 51

2006 NYSESLAT Technical Manual
Page 239
H.6: Grade 5 Reading/Writing (RW) Grade Test Group N-count Mean Median SD IQR
5 RW Female 6171 675 677 48 59 5 RW Male 7203 666 673 47 60 5 RW Asian 1891 679 682 52 66 5 RW Black or African American 772 663 668 49 67 5 RW Hispanic or Latino 9651 668 673 46 57 5 RW Native American Indian/Alaska Native 19 681 682 28 30 5 RW Native Hawaiian/Other Pacific Islander 5 662 668 36 13 5 RW White 1036 681 687 51 62 5 RW NYC 9469 668 673 47 60 5 RW Big 4 Cities 834 665 673 50 67 5 RW High Need Urban/Suburban 1308 676 682 48 59 5 RW High Need Rural 107 677 677 42 55 5 RW Average Need 1077 680 682 49 62 5 RW Low Need 542 691 692 48 55 5 RW Charter Schools 37 691 698 28 38 5 RW 0 Years LEP 479 654 649 57 88 5 RW 1 Years LEP 1682 641 638 51 75 5 RW 2 Years LEP 1339 667 668 49 67 5 RW 3 Years LEP 1234 679 682 44 55 5 RW 4 Years LEP 1024 686 687 41 47 5 RW 5 Years LEP 1663 687 687 38 47 5 RW 6 Years LEP 3683 681 682 36 48 5 RW Arabic 244 646 645 57 88 5 RW Bengali 194 676 682 48 59 5 RW Chinese 188 672 680 57 79 5 RW English 706 676 677 48 59 5 RW Spanish 8529 667 673 46 60 5 RW Language Missing 1060 680 687 47 61 5 RW Other Language 2453 678 682 51 62 5 RW Students with Disabilities 2365 657 660 38 48

2006 NYSESLAT Technical Manual
Page 240
H.7: Grade 6 Listening/Speaking (LS) Grade Test Group N-count Mean Median SD IQR
6 LS Female 5098 665 669 61 67 6 LS Male 6015 664 669 61 67 6 LS Asian 1723 661 663 62 71 6 LS Black or African American 662 664 669 54 64 6 LS Hispanic or Latino 7812 663 669 62 67 6 LS Native American Indian/Alaska Native 18 676 673 58 62 6 LS Native Hawaiian/Other Pacific Islander 4 635 647 32 39 6 LS White 894 678 686 58 67 6 LS NYC 7999 661 669 60 67 6 LS Big 4 Cities 658 673 677 59 76 6 LS High Need Urban/Suburban 976 664 669 66 92.5 6 LS High Need Rural 75 680 677 50 50 6 LS Average Need 985 677 686 63 71 6 LS Low Need 404 676 677 58 71 6 LS Charter Schools 16 687 686 16 20 6 LS 0 Years LEP 453 630 630 65 100 6 LS 1 Years LEP 1698 623 619 61 86 6 LS 2 Years LEP 1318 662 663 55 71 6 LS 3 Years LEP 1186 678 677 49 67 6 LS 4 Years LEP 915 691 686 44 50 6 LS 5 Years LEP 738 692 686 43 50 6 LS 6 Years LEP or More 2789 690 686 41 44 6 LS Arabic 204 644 649 63 85 6 LS Bengali 174 676 686 52 67 6 LS Chinese 134 647 644 62 76 6 LS English 563 678 677 58 67 6 LS Spanish 6941 662 669 62 67 6 LS Language Missing 884 675 677 61 71 6 LS Other Language 2213 666 669 60 64 6 LS Students with Disabilities 1827 672 669 46 51

2006 NYSESLAT Technical Manual
Page 241
H.7: Grade 6 Reading/Writing (RW) Grade Test Group N-count Mean Median SD IQR
6 RW Female 5098 676 677 52 70 6 RW Male 6015 667 673 52 73 6 RW Asian 1723 681 682 55 78 6 RW Black or African American 662 665 668 51 71 6 RW Hispanic or Latino 7812 668 673 51 70 6 RW Native American Indian/Alaska Native 18 683 682 52 62 6 RW Native Hawaiian/Other Pacific Islander 4 661 666 45 57 6 RW White 894 685 692 53 70 6 RW NYC 7999 668 673 51 70 6 RW Big 4 Cities 658 671 677 55 70 6 RW High Need Urban/Suburban 976 673 677 52 77 6 RW High Need Rural 75 677 682 44 52 6 RW Average Need 985 685 687 55 70 6 RW Low Need 404 694 698 54 71 6 RW Charter Schools 16 697 701 16 22 6 RW 0 Years LEP 453 651 649 55 77 6 RW 1 Years LEP 1698 644 634 54 80 6 RW 2 Years LEP 1318 670 671 53 73 6 RW 3 Years LEP 1186 684 687 52 70 6 RW 4 Years LEP 915 691 692 42 55 6 RW 5 Years LEP 738 690 690 42 47 6 RW 6 Years LEP or More 2789 686 687 38 47 6 RW Arabic 204 649 640 55 77 6 RW Bengali 174 692 698 50 73 6 RW Chinese 134 668 668 52 80 6 RW English 563 682 687 53 59 6 RW Spanish 6941 666 668 50 67 6 RW Language Missing 884 684 687 54 70 6 RW Other Language 2213 680 682 54 70 6 RW Students with Disabilities 1827 659 660 41 53

2006 NYSESLAT Technical Manual
Page 242
H.8: Grade 7 Listening/Speaking (LS) Grade Test Group N-count Mean Median SD IQR
7 LS Female 5769 686 696 58 66 7 LS Male 6605 683 690 56 69 7 LS Asian 1897 682 685 57 75 7 LS Black or African American 737 690 696 47 56 7 LS Hispanic or Latino 8732 682 690 58 69 7 LS Native American Indian/Alaska Native 21 693 719 48 67 7 LS Native Hawaiian/Other Pacific Islander 7 677 653 81 134 7 LS White 980 705 710 52 50 7 LS NYC 9276 683 690 57 69 7 LS Big 4 Cities 699 690 696 54 67 7 LS High Need Urban/Suburban 970 681 690 59 75 7 LS High Need Rural 81 689 696 48 56 7 LS Average Need 922 692 696 58 77 7 LS Low Need 422 696 702 54 67 7 LS Charter Schools 4 695 695 23 39 7 LS 0 Years LEP 592 664 663 62 95 7 LS 1 Years LEP 1877 643 641 54 77 7 LS 2 Years LEP 1456 674 675 53 71 7 LS 3 Years LEP 1263 694 696 48 56 7 LS 4 Years LEP 1050 706 702 42 50 7 LS 5 Years LEP 837 712 710 41 40 7 LS 6 Years LEP or More 3248 712 710 37 40 7 LS Arabic 225 672 680 56 75 7 LS Bengali 213 689 696 50 63 7 LS Chinese 150 682 675 57 78 7 LS English 563 702 702 50 55 7 LS Spanish 7884 681 690 58 72 7 LS Language Missing 817 687 696 56 66 7 LS Other Language 2522 690 696 55 59 7 LS Students with Disabilities 1694 691 690 44 52

2006 NYSESLAT Technical Manual
Page 243
H.8: Grade 7 Reading/Writing (RW)
Grade Test Group N-count Mean Median SD IQR 7 RW Female 5769 668 671 48 63 7 RW Male 6605 662 664 45 63 7 RW Asian 1897 670 671 51 72 7 RW Black or African American 737 665 668 43 55 7 RW Hispanic or Latino 8732 662 664 45 63 7 RW Native American Indian/Alaska Native 21 679 688 45 51 7 RW Native Hawaiian/Other Pacific Islander 7 684 688 85 193 7 RW White 980 680 684 49 57 7 RW NYC 9276 663 664 46 60 7 RW Big 4 Cities 699 663 668 47 60 7 RW High Need Urban/Suburban 970 665 668 48 69 7 RW High Need Rural 81 667 675 42 57 7 RW Average Need 922 675 675 50 69 7 RW Low Need 422 687 693 53 65 7 RW Charter Schools 4 679 682 30 46 7 RW 0 Years LEP 592 649 648 47 69 7 RW 1 Years LEP 1877 638 630 45 63 7 RW 2 Years LEP 1456 659 657 48 64 7 RW 3 Years LEP 1263 674 675 45 60 7 RW 4 Years LEP 1050 682 679 42 54 7 RW 5 Years LEP 837 684 684 38 54 7 RW 6 Years LEP or More 3248 680 679 35 48 7 RW Arabic 225 649 651 45 64 7 RW Bengali 213 671 671 50 69 7 RW Chinese 150 670 671 51 78 7 RW English 563 674 675 44 57 7 RW Spanish 7884 661 664 45 63 7 RW Language Missing 817 670 671 47 57 7 RW Other Language 2522 673 675 50 67 7 RW Students with Disabilities 1694 653 654 38 46

2006 NYSESLAT Technical Manual
Page 244
H.9: Grade 8 Listening/Speaking (LS)
Grade Test Group N-count Mean Median SD IQR 8 LS Female 5661 686 696 59 80 8 LS Male 6611 684 690 58 72 8 LS Asian 2069 683 685 58 75 8 LS Black or African American 829 693 690 51 70 8 LS Hispanic or Latino 8334 682 690 59 75 8 LS Native American Indian/Alaska Native 14 716 706 44 50 8 LS Native Hawaiian/Other Pacific Islander 5 697 710 47 55 8 LS White 1021 708 710 54 70 8 LS NYC 9403 684 690 59 72 8 LS Big 4 Cities 581 691 696 51 63 8 LS High Need Urban/Suburban 900 682 690 63 89 8 LS High Need Rural 72 693 699 52 71 8 LS Average Need 894 692 696 60 77 8 LS Low Need 415 695 696 53 67 8 LS Charter Schools 6 717 716 26 55 8 LS 0 Years LEP 852 684 690 56 71 8 LS 1 Years LEP 2112 648 644 57 76 8 LS 2 Years LEP 1509 671 671 54 75 8 LS 3 Years LEP 1354 691 690 50 63 8 LS 4 Years LEP 1090 710 710 45 50 8 LS 5 Years LEP 839 715 710 43 55 8 LS 6 Years LEP or More 2512 718 719 41 49 8 LS Arabic 263 680 685 56 75 8 LS Bengali 192 697 696 54 67 8 LS Chinese 207 666 663 56 75 8 LS English 573 700 702 54 63 8 LS Spanish 7567 682 690 59 75 8 LS Language Missing 755 687 690 60 83 8 LS Other Language 2715 692 696 56 74 8 LS Students with Disabilities 1561 695 696 43 48

2006 NYSESLAT Technical Manual
Page 245
H.9: Grade 8 Reading/Writing (RW) Grade Test Group N-count Mean Median SD IQR
8 RW Female 5661 673 675 49 67 8 RW Male 6611 667 668 49 69 8 RW Asian 2069 673 675 51 69 8 RW Black or African American 829 669 671 49 69 8 RW Hispanic or Latino 8334 666 668 48 69 8 RW Native American Indian/Alaska Native 14 689 684 34 51 8 RW Native Hawaiian/Other Pacific Islander 5 681 679 20 18 8 RW White 1021 686 688 49 65 8 RW NYC 9403 667 668 48 66 8 RW Big 4 Cities 581 673 679 49 69 8 RW High Need Urban/Suburban 900 671 675 53 78 8 RW High Need Rural 72 674 675 46 57 8 RW Average Need 894 679 684 51 74 8 RW Low Need 415 691 688 53 62 8 RW Charter Schools 6 706 694 27 52 8 RW 0 Years LEP 852 666 671 46 66 8 RW 1 Years LEP 2112 645 638 47 67 8 RW 2 Years LEP 1509 660 654 49 69 8 RW 3 Years LEP 1354 675 675 47 63 8 RW 4 Years LEP 1090 688 693 43 58 8 RW 5 Years LEP 839 691 693 40 55 8 RW 6 Years LEP or More 2512 691 693 38 43 8 RW Arabic 263 657 661 48 67 8 RW Bengali 192 681 675 49 61 8 RW Chinese 207 660 661 51 81 8 RW English 573 681 684 47 60 8 RW Spanish 7567 666 668 47 69 8 RW Language Missing 755 676 679 54 75 8 RW Other Language 2715 676 679 50 69 8 RW Students with Disabilities 1561 659 661 40 48
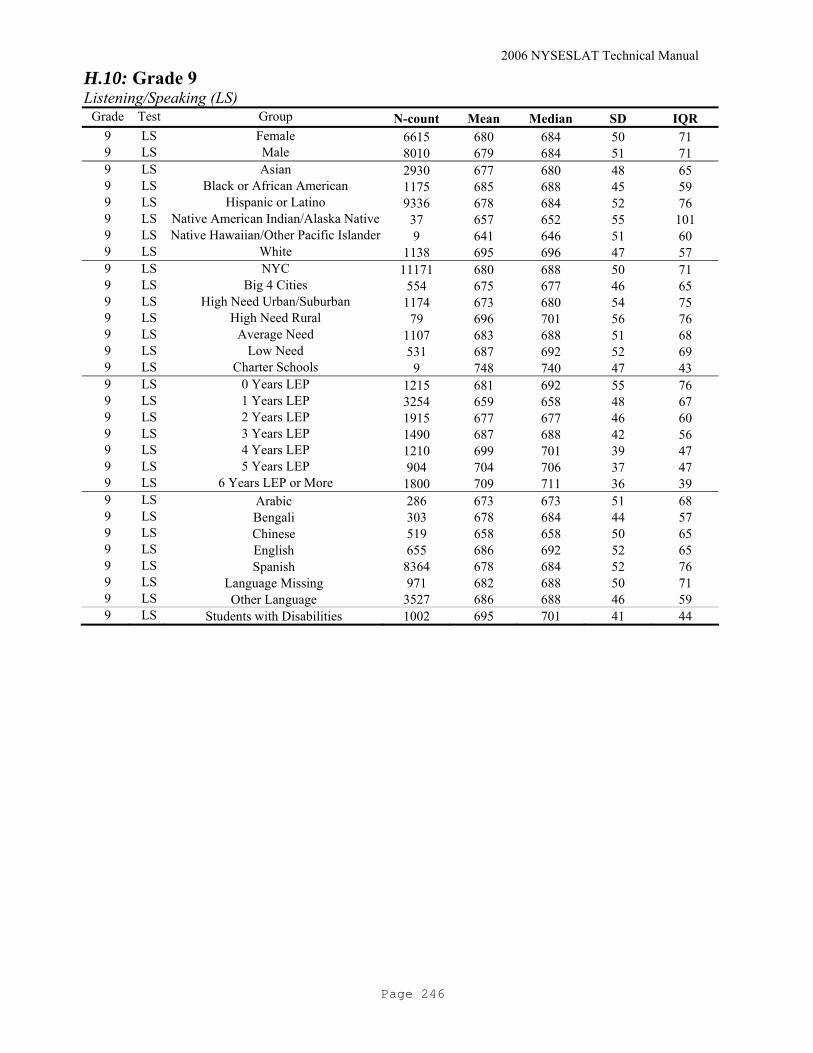
2006 NYSESLAT Technical Manual
Page 246
H.10: Grade 9 Listening/Speaking (LS)
Grade Test Group N-count Mean Median SD IQR 9 LS Female 6615 680 684 50 71 9 LS Male 8010 679 684 51 71 9 LS Asian 2930 677 680 48 65 9 LS Black or African American 1175 685 688 45 59 9 LS Hispanic or Latino 9336 678 684 52 76 9 LS Native American Indian/Alaska Native 37 657 652 55 101 9 LS Native Hawaiian/Other Pacific Islander 9 641 646 51 60 9 LS White 1138 695 696 47 57 9 LS NYC 11171 680 688 50 71 9 LS Big 4 Cities 554 675 677 46 65 9 LS High Need Urban/Suburban 1174 673 680 54 75 9 LS High Need Rural 79 696 701 56 76 9 LS Average Need 1107 683 688 51 68 9 LS Low Need 531 687 692 52 69 9 LS Charter Schools 9 748 740 47 43 9 LS 0 Years LEP 1215 681 692 55 76 9 LS 1 Years LEP 3254 659 658 48 67 9 LS 2 Years LEP 1915 677 677 46 60 9 LS 3 Years LEP 1490 687 688 42 56 9 LS 4 Years LEP 1210 699 701 39 47 9 LS 5 Years LEP 904 704 706 37 47 9 LS 6 Years LEP or More 1800 709 711 36 39 9 LS Arabic 286 673 673 51 68 9 LS Bengali 303 678 684 44 57 9 LS Chinese 519 658 658 50 65 9 LS English 655 686 692 52 65 9 LS Spanish 8364 678 684 52 76 9 LS Language Missing 971 682 688 50 71 9 LS Other Language 3527 686 688 46 59 9 LS Students with Disabilities 1002 695 701 41 44

2006 NYSESLAT Technical Manual
Page 247
H.10: Grade 9 Reading/Writing (RW) Grade Test Group N-count Mean Median SD IQR
9 RW Female 6615 690 691 42 59 9 RW Male 8010 687 688 44 65 9 RW Asian 2930 690 688 44 59 9 RW Black or African American 1175 688 688 43 62 9 RW Hispanic or Latino 9336 686 685 42 60 9 RW Native American Indian/Alaska Native 37 668 660 44 58 9 RW Native Hawaiian/Other Pacific Islander 9 653 657 40 64 9 RW White 1138 702 702 46 64 9 RW NYC 11171 689 688 42 62 9 RW Big 4 Cities 554 678 678 44 64 9 RW High Need Urban/Suburban 1174 683 678 44 65 9 RW High Need Rural 79 693 695 48 67 9 RW Average Need 1107 691 688 45 67 9 RW Low Need 531 700 698 49 76 9 RW Charter Schools 9 736 736 22 26 9 RW 0 Years LEP 1215 688 691 45 65 9 RW 1 Years LEP 3254 674 669 40 59 9 RW 2 Years LEP 1915 686 685 41 57 9 RW 3 Years LEP 1490 694 691 41 53 9 RW 4 Years LEP 1210 703 702 39 55 9 RW 5 Years LEP 904 706 706 37 49 9 RW 6 Years LEP or More 1800 709 710 36 42 9 RW Arabic 286 676 669 45 56 9 RW Bengali 303 689 685 41 54 9 RW Chinese 519 677 672 42 60 9 RW English 655 689 691 45 67 9 RW Spanish 8364 686 688 42 60 9 RW Language Missing 971 692 691 46 67 9 RW Other Language 3527 695 695 44 61 9 RW Students with Disabilities 1002 683 685 40 50

2006 NYSESLAT Technical Manual
Page 248
H.11: Grade 10 Listening/Speaking (LS) Grade Test Group N-count Mean Median SD IQR
10 LS Female 6210 690 692 46 63 10 LS Male 6669 690 692 45 56 10 LS Asian 3313 686 688 45 59 10 LS Black or African American 1142 696 696 41 54 10 LS Hispanic or Latino 7456 689 692 46 66 10 LS Native American Indian/Alaska Native 25 673 677 51 57 10 LS Native Hawaiian/Other Pacific Islander 1 680 680 0 10 LS White 942 706 706 40 51 10 LS NYC 10072 689 692 46 56 10 LS Big 4 Cities 411 685 692 46 56 10 LS High Need Urban/Suburban 920 689 688 44 56 10 LS High Need Rural 47 698 701 45 54 10 LS Average Need 927 695 696 43 57 10 LS Low Need 497 697 696 43 54 10 LS Charter Schools 5 717 731 35 44 10 LS 0 Years LEP 637 691 696 49 66 10 LS 1 Years LEP 2695 674 673 44 60 10 LS 2 Years LEP 2242 686 688 41 50 10 LS 3 Years LEP 1545 695 696 41 57 10 LS 4 Years LEP 1068 703 706 40 44 10 LS 5 Years LEP 848 707 706 37 47 10 LS 6 Years LEP or More 1632 715 717 36 44 10 LS Arabic 217 698 701 39 54 10 LS Bengali 304 692 692 43 50 10 LS Chinese 539 674 673 40 49 10 LS English 566 698 701 44 54 10 LS Spanish 6765 689 692 46 66 10 LS Language Missing 758 694 692 44 60 10 LS Other Language 3730 692 692 44 53 10 LS Students with Disabilities 733 699 701 42 40
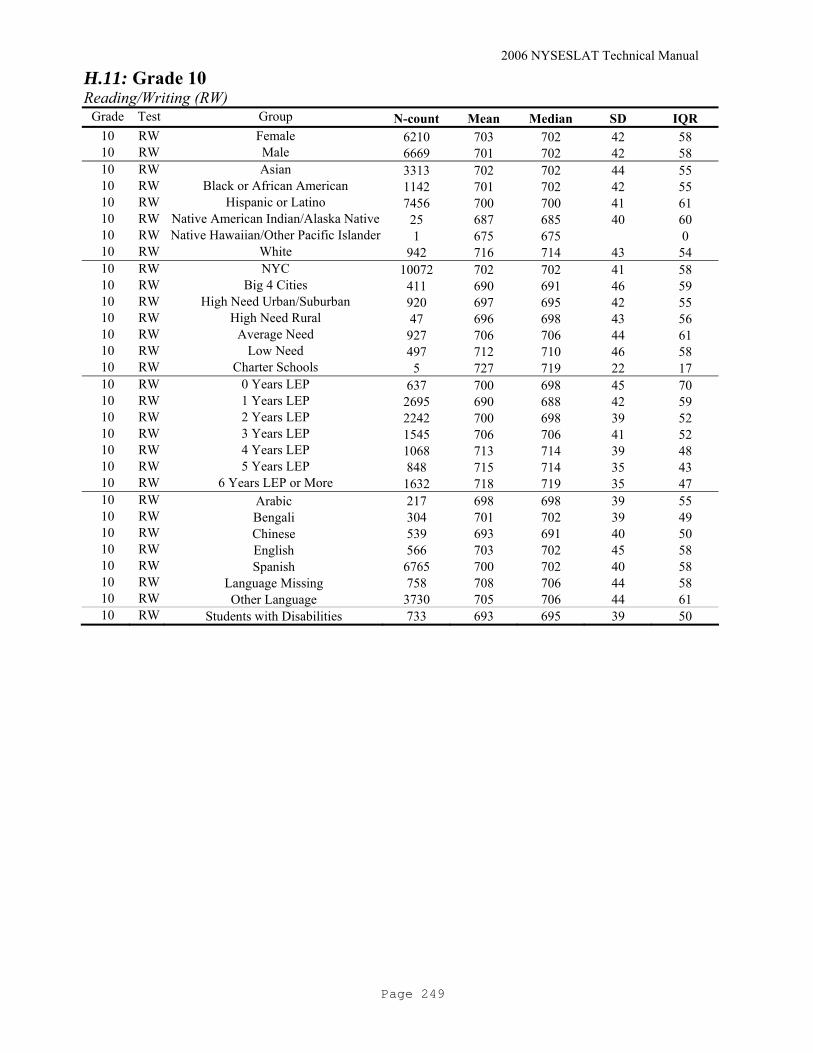
2006 NYSESLAT Technical Manual
Page 249
H.11: Grade 10 Reading/Writing (RW)
Grade Test Group N-count Mean Median SD IQR 10 RW Female 6210 703 702 42 58 10 RW Male 6669 701 702 42 58 10 RW Asian 3313 702 702 44 55 10 RW Black or African American 1142 701 702 42 55 10 RW Hispanic or Latino 7456 700 700 41 61 10 RW Native American Indian/Alaska Native 25 687 685 40 60 10 RW Native Hawaiian/Other Pacific Islander 1 675 675 0 10 RW White 942 716 714 43 54 10 RW NYC 10072 702 702 41 58 10 RW Big 4 Cities 411 690 691 46 59 10 RW High Need Urban/Suburban 920 697 695 42 55 10 RW High Need Rural 47 696 698 43 56 10 RW Average Need 927 706 706 44 61 10 RW Low Need 497 712 710 46 58 10 RW Charter Schools 5 727 719 22 17 10 RW 0 Years LEP 637 700 698 45 70 10 RW 1 Years LEP 2695 690 688 42 59 10 RW 2 Years LEP 2242 700 698 39 52 10 RW 3 Years LEP 1545 706 706 41 52 10 RW 4 Years LEP 1068 713 714 39 48 10 RW 5 Years LEP 848 715 714 35 43 10 RW 6 Years LEP or More 1632 718 719 35 47 10 RW Arabic 217 698 698 39 55 10 RW Bengali 304 701 702 39 49 10 RW Chinese 539 693 691 40 50 10 RW English 566 703 702 45 58 10 RW Spanish 6765 700 702 40 58 10 RW Language Missing 758 708 706 44 58 10 RW Other Language 3730 705 706 44 61 10 RW Students with Disabilities 733 693 695 39 50
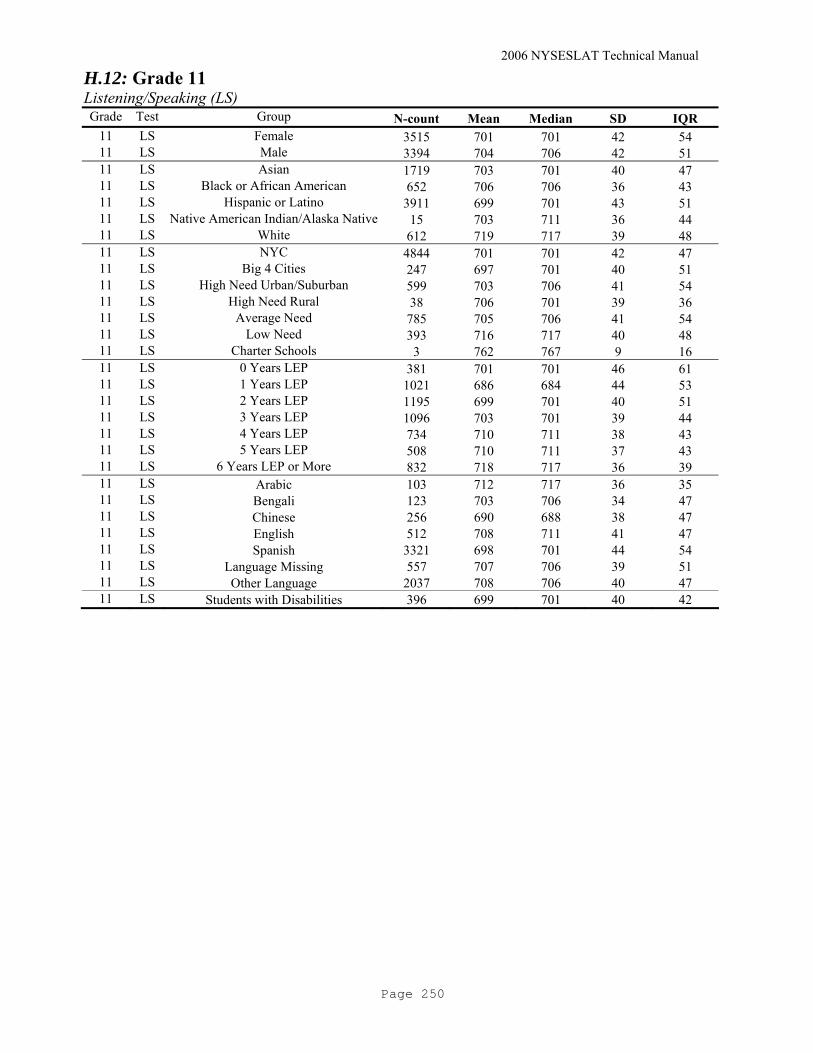
2006 NYSESLAT Technical Manual
Page 250
H.12: Grade 11 Listening/Speaking (LS) Grade Test Group N-count Mean Median SD IQR
11 LS Female 3515 701 701 42 54 11 LS Male 3394 704 706 42 51 11 LS Asian 1719 703 701 40 47 11 LS Black or African American 652 706 706 36 43 11 LS Hispanic or Latino 3911 699 701 43 51 11 LS Native American Indian/Alaska Native 15 703 711 36 44 11 LS White 612 719 717 39 48 11 LS NYC 4844 701 701 42 47 11 LS Big 4 Cities 247 697 701 40 51 11 LS High Need Urban/Suburban 599 703 706 41 54 11 LS High Need Rural 38 706 701 39 36 11 LS Average Need 785 705 706 41 54 11 LS Low Need 393 716 717 40 48 11 LS Charter Schools 3 762 767 9 16 11 LS 0 Years LEP 381 701 701 46 61 11 LS 1 Years LEP 1021 686 684 44 53 11 LS 2 Years LEP 1195 699 701 40 51 11 LS 3 Years LEP 1096 703 701 39 44 11 LS 4 Years LEP 734 710 711 38 43 11 LS 5 Years LEP 508 710 711 37 43 11 LS 6 Years LEP or More 832 718 717 36 39 11 LS Arabic 103 712 717 36 35 11 LS Bengali 123 703 706 34 47 11 LS Chinese 256 690 688 38 47 11 LS English 512 708 711 41 47 11 LS Spanish 3321 698 701 44 54 11 LS Language Missing 557 707 706 39 51 11 LS Other Language 2037 708 706 40 47 11 LS Students with Disabilities 396 699 701 40 42
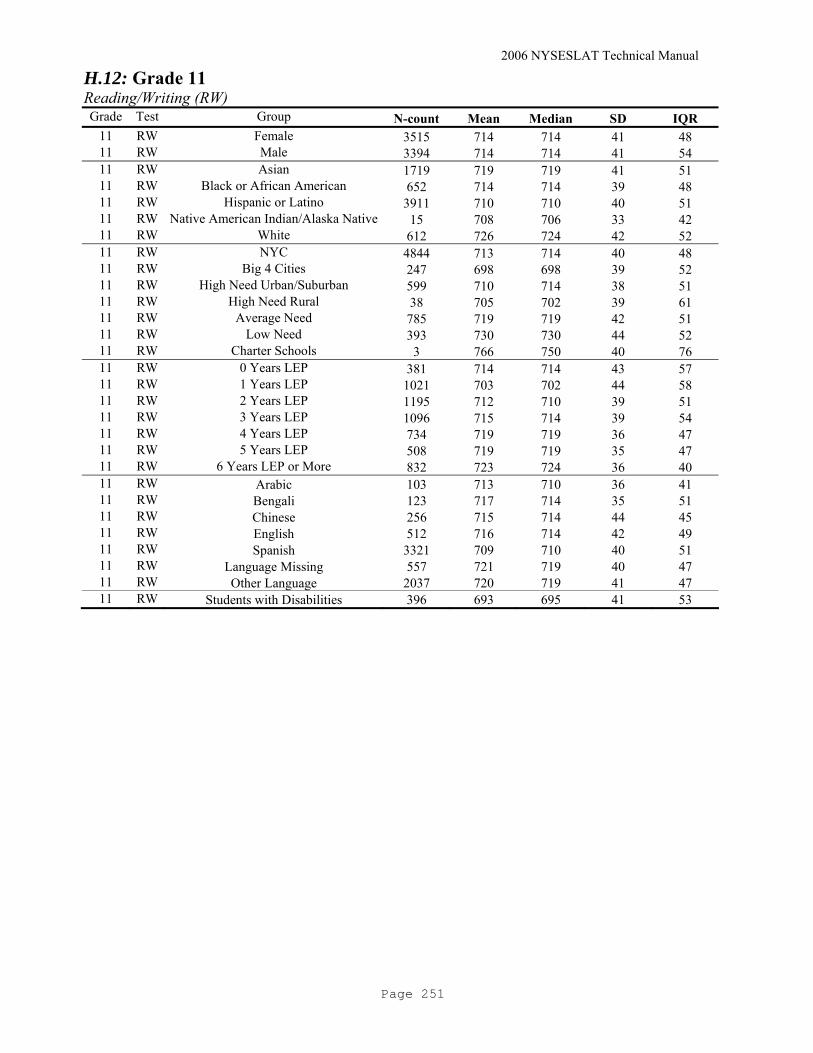
2006 NYSESLAT Technical Manual
Page 251
H.12: Grade 11 Reading/Writing (RW) Grade Test Group N-count Mean Median SD IQR
11 RW Female 3515 714 714 41 48 11 RW Male 3394 714 714 41 54 11 RW Asian 1719 719 719 41 51 11 RW Black or African American 652 714 714 39 48 11 RW Hispanic or Latino 3911 710 710 40 51 11 RW Native American Indian/Alaska Native 15 708 706 33 42 11 RW White 612 726 724 42 52 11 RW NYC 4844 713 714 40 48 11 RW Big 4 Cities 247 698 698 39 52 11 RW High Need Urban/Suburban 599 710 714 38 51 11 RW High Need Rural 38 705 702 39 61 11 RW Average Need 785 719 719 42 51 11 RW Low Need 393 730 730 44 52 11 RW Charter Schools 3 766 750 40 76 11 RW 0 Years LEP 381 714 714 43 57 11 RW 1 Years LEP 1021 703 702 44 58 11 RW 2 Years LEP 1195 712 710 39 51 11 RW 3 Years LEP 1096 715 714 39 54 11 RW 4 Years LEP 734 719 719 36 47 11 RW 5 Years LEP 508 719 719 35 47 11 RW 6 Years LEP or More 832 723 724 36 40 11 RW Arabic 103 713 710 36 41 11 RW Bengali 123 717 714 35 51 11 RW Chinese 256 715 714 44 45 11 RW English 512 716 714 42 49 11 RW Spanish 3321 709 710 40 51 11 RW Language Missing 557 721 719 40 47 11 RW Other Language 2037 720 719 41 47 11 RW Students with Disabilities 396 693 695 41 53
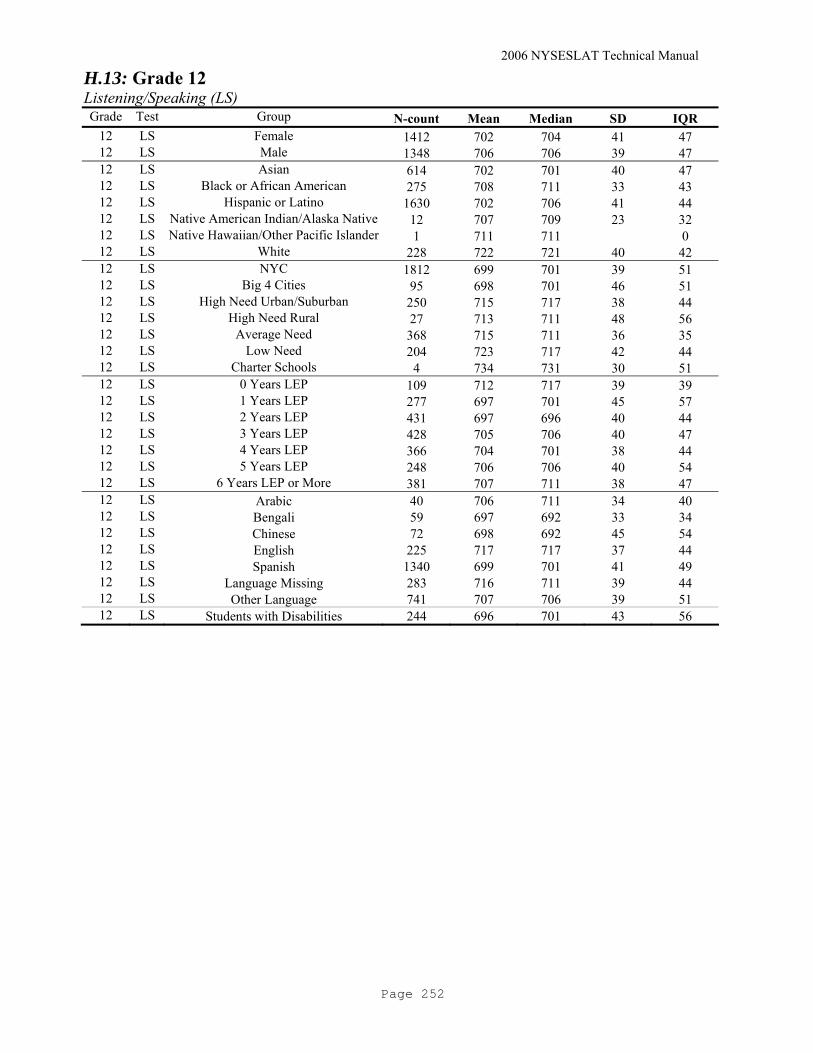
2006 NYSESLAT Technical Manual
Page 252
H.13: Grade 12 Listening/Speaking (LS) Grade Test Group N-count Mean Median SD IQR
12 LS Female 1412 702 704 41 47 12 LS Male 1348 706 706 39 47 12 LS Asian 614 702 701 40 47 12 LS Black or African American 275 708 711 33 43 12 LS Hispanic or Latino 1630 702 706 41 44 12 LS Native American Indian/Alaska Native 12 707 709 23 32 12 LS Native Hawaiian/Other Pacific Islander 1 711 711 0 12 LS White 228 722 721 40 42 12 LS NYC 1812 699 701 39 51 12 LS Big 4 Cities 95 698 701 46 51 12 LS High Need Urban/Suburban 250 715 717 38 44 12 LS High Need Rural 27 713 711 48 56 12 LS Average Need 368 715 711 36 35 12 LS Low Need 204 723 717 42 44 12 LS Charter Schools 4 734 731 30 51 12 LS 0 Years LEP 109 712 717 39 39 12 LS 1 Years LEP 277 697 701 45 57 12 LS 2 Years LEP 431 697 696 40 44 12 LS 3 Years LEP 428 705 706 40 47 12 LS 4 Years LEP 366 704 701 38 44 12 LS 5 Years LEP 248 706 706 40 54 12 LS 6 Years LEP or More 381 707 711 38 47 12 LS Arabic 40 706 711 34 40 12 LS Bengali 59 697 692 33 34 12 LS Chinese 72 698 692 45 54 12 LS English 225 717 717 37 44 12 LS Spanish 1340 699 701 41 49 12 LS Language Missing 283 716 711 39 44 12 LS Other Language 741 707 706 39 51 12 LS Students with Disabilities 244 696 701 43 56

2006 NYSESLAT Technical Manual
Page 253
H.13: Grade 12 Reading/Writing (RW) Grade Test Group N-count Mean Median SD IQR
12 RW Female 1412 711 710 39 51 12 RW Male 1348 713 714 40 48 12 RW Asian 614 714 710 39 48 12 RW Black or African American 275 709 706 37 48 12 RW Hispanic or Latino 1630 711 710 39 48 12 RW Native American Indian/Alaska Native 12 703 708 26 29 12 RW Native Hawaiian/Other Pacific Islander 1 730 730 0 12 RW White 228 720 719 43 48 12 RW NYC 1812 705 706 37 49 12 RW Big 4 Cities 95 704 706 44 64 12 RW High Need Urban/Suburban 250 720 724 37 44 12 RW High Need Rural 27 728 730 53 62 12 RW Average Need 368 727 724 38 48 12 RW Low Need 204 738 730 44 49 12 RW Charter Schools 4 737 735 29 48 12 RW 0 Years LEP 109 721 724 43 52 12 RW 1 Years LEP 277 709 710 42 58 12 RW 2 Years LEP 431 710 706 41 51 12 RW 3 Years LEP 428 712 710 39 48 12 RW 4 Years LEP 366 712 710 36 48 12 RW 5 Years LEP 248 712 710 34 45 12 RW 6 Years LEP or More 381 710 710 36 48 12 RW Arabic 40 704 706 29 51 12 RW Bengali 59 695 691 32 50 12 RW Chinese 72 717 710 46 58 12 RW English 225 721 719 40 44 12 RW Spanish 1340 707 710 38 45 12 RW Language Missing 283 731 730 43 44 12 RW Other Language 741 712 710 38 48 12 RW Students with Disabilities 244 684 687 41 57

2006 NYSESLAT Technical Manual
Page 254
APPENDIX I: PROFICIENCY PERCENTAGES
I.1: Kindergarten Listening/Speaking (LS) Grade Test Group Proficiency Levels
N-count 1 2 3 4 K LS Female 11408 5.93 26.67 39.53 27.88 K LS Male 12891 6.03 29.76 40.53 23.68 K LS Asian 5423 4.44 27.29 41.40 26.87 K LS Black or African American 892 6.17 31.17 41.93 20.74 K LS Hispanic or Latino 15522 6.72 29.74 39.76 23.78 K LS Native American Indian/Alaska Native 39 10.26 20.51 46.15 23.08 K LS Native Hawaiian/Other Pacific Islander 8 12.50 12.50 25.00 50.00 K LS White 2415 4.51 20.54 38.26 36.69 K LS NYC 15741 6.43 28.63 38.66 26.28 K LS Big 4 Cities 1171 8.03 34.24 40.48 17.25 K LS High Need Urban/Suburban 2933 5.97 31.16 41.22 21.65 K LS High Need Rural 189 3.70 23.81 44.44 28.04 K LS Average Need 2717 4.09 24.48 43.61 27.82 K LS Low Need 1444 3.60 22.30 44.88 29.22 K LS Charter Schools 104 1.92 25.00 47.12 25.96 K LS 0 Years LEP 3901 5.64 27.43 41.43 25.51 K LS 1 Years LEP 15107 4.53 28.99 40.62 25.87 K LS Arabic 483 8.70 30.02 34.16 27.12 K LS Bengali 594 4.88 23.40 40.40 31.31 K LS Chinese 739 3.52 30.72 43.57 22.19 K LS English 2242 3.43 26.45 42.69 27.43 K LS Spanish 13218 6.79 29.87 38.96 24.38 K LS Language Missing 2227 5.84 26.99 42.25 24.92 K LS Other Language 4796 5.23 25.56 40.87 28.34 K LS Students with Disabilities 1892 10.20 41.44 36.36 12.00

2006 NYSESLAT Technical Manual
Page 255
I.1: Kindergarten Reading/Writing (RW)
Proficiency Levels Grade Test Group N-count 1 2 3 4
K RW Female 11408 37.48 42.09 10.70 9.72 K RW Male 12891 43.55 39.16 9.43 7.86 K RW Asian 5423 24.62 41.18 15.75 18.46 K RW Black or African American 892 50.00 35.76 7.40 6.84 K RW Hispanic or Latino 15522 46.63 40.35 8.00 5.03 K RW Native American Indian/Alaska Native 39 33.33 38.46 20.51 7.69 K RW Native Hawaiian/Other Pacific Islander 8 25.00 50.00 12.50 12.50 K RW White 2415 35.45 42.07 11.06 11.43 K RW NYC 15741 35.68 41.61 11.87 10.83 K RW Big 4 Cities 1171 55.00 33.99 6.75 4.27 K RW High Need Urban/Suburban 2933 56.22 36.92 4.33 2.52 K RW High Need Rural 189 41.27 49.21 6.35 3.17 K RW Average Need 2717 47.99 40.01 6.40 5.59 K RW Low Need 1444 38.37 41.27 11.36 9.00 K RW Charter Schools 104 42.31 41.35 11.54 4.81 K RW 0 Years LEP 3901 48.76 39.89 6.46 4.90 K RW 1 Years LEP 15107 37.76 41.19 11.17 9.88 K RW Arabic 483 43.27 37.68 9.94 9.11 K RW Bengali 594 24.75 43.10 18.18 13.97 K RW Chinese 739 20.30 38.57 17.05 24.09 K RW English 2242 46.03 40.59 8.16 5.22 K RW Spanish 13218 44.12 41.18 8.77 5.93 K RW Language Missing 2227 51.10 38.44 5.88 4.58 K RW Other Language 4796 28.82 39.99 14.22 16.97 K RW Students with Disabilities 1892 59.04 32.03 5.55 3.38

2006 NYSESLAT Technical Manual
Page 256
I.1: Kindergarten Overall
Proficiency Levels Grade Test Group N-
count 1 2 3 4 K Overall Female 11408 38.47 43.10 12.33 6.09 K Overall Male 12891 44.17 40.31 11.09 4.42 K Overall Asian 5423 25.50 44.46 20.25 9.79 K Overall Black or African American 892 50.45 36.43 8.18 4.93 K Overall Hispanic or Latino 15522 47.46 40.77 8.73 3.03 K Overall Native American Indian/Alaska Native 39 33.33 46.15 17.95 2.56 K Overall Native Hawaiian/Other Pacific Islander 8 25.00 50.00 12.50 12.50 K Overall White 2415 35.94 42.53 12.55 8.99 K Overall NYC 15741 36.64 43.14 13.82 6.40 K Overall Big 4 Cities 1171 55.85 33.82 8.20 2.13 K Overall High Need Urban/Suburban 2933 56.77 36.72 4.50 2.01 K Overall High Need Rural 189 41.27 49.74 6.88 2.12 K Overall Average Need 2717 48.25 40.52 7.77 3.46 K Overall Low Need 1444 38.99 42.45 13.64 4.92 K Overall Charter Schools 104 42.31 41.35 12.50 3.85 K Overall 0 Years LEP 3901 49.24 39.94 7.64 3.18 K Overall 1 Years LEP 15107 38.50 42.68 13.11 5.71 K Overall Arabic 483 43.89 38.10 10.14 7.87 K Overall Bengali 594 25.25 45.62 19.87 9.26 K Overall Chinese 739 20.43 44.11 25.03 10.42 K Overall English 2242 46.21 41.35 9.14 3.30 K Overall Spanish 13218 45.01 41.71 9.69 3.59 K Overall Language Missing 2227 51.86 38.53 6.69 2.92 K Overall Other Language 4796 29.80 42.43 17.72 10.05 K Overall Students with Disabilities 1892 59.83 32.66 6.03 1.48

2006 NYSESLAT Technical Manual
Page 257
I.2: Grade 1 Listening/Speaking (LS)
Proficiency Levels Grade Test Group N-count 1 2 3 4
1 LS Female 12033 3.42 13.18 48.86 34.55 1 LS Male 13735 3.42 15.58 50.16 30.83 1 LS Asian 4696 2.85 12.41 49.34 35.39 1 LS Black or African American 1108 3.52 17.96 50.18 28.34 1 LS Hispanic or Latino 17433 3.73 15.35 50.55 30.37 1 LS Native American Indian/Alaska Native 39 2.56 20.51 38.46 38.46 1 LS Native Hawaiian/Other Pacific Islander 8 12.50 25.00 62.50 1 LS White 2484 2.29 10.43 42.91 44.36 1 LS NYC 17174 3.66 14.66 49.29 32.39 1 LS Big 4 Cities 1318 3.57 21.09 54.48 20.86 1 LS High Need Urban/Suburban 2979 3.73 16.62 51.02 28.63 1 LS High Need Rural 155 1.29 12.26 50.97 35.48 1 LS Average Need 2597 2.31 10.86 47.86 38.97 1 LS Low Need 1438 2.29 8.76 46.87 42.07 1 LS Charter Schools 107 7.48 65.42 27.10 1 LS 0 Years LEP 918 10.13 23.09 41.72 25.05 1 LS 1 Years LEP 5751 4.24 18.55 47.00 30.20 1 LS 2 Years LEP 14999 0.79 11.58 52.64 35.00 1 LS Arabic 476 6.51 16.81 47.69 28.99 1 LS Bengali 620 2.74 12.74 45.97 38.55 1 LS Chinese 597 2.35 14.24 45.90 37.52 1 LS English 2056 1.65 13.52 51.17 33.66 1 LS Spanish 14700 3.77 15.44 50.47 30.33 1 LS Language Missing 2374 3.96 14.28 49.03 32.73 1 LS Other Language 4945 2.77 12.05 47.48 37.69 1 LS Students with Disabilities 2743 4.01 25.81 51.88 18.30

2006 NYSESLAT Technical Manual
Page 258
I.2: Grade 1 Reading/Writing (RW)
Proficiency Levels Grade Test Group N-count 1 2 3 4 1 RW Female 12033 13.32 27.18 28.06 31.45 1 RW Male 13735 19.02 28.96 25.98 26.04 1 RW Asian 4696 6.77 16.42 27.43 49.38 1 RW Black or African American 1108 25.00 31.77 22.92 20.31 1 RW Hispanic or Latino 17433 19.15 31.95 26.88 22.02 1 RW Native American Indian/Alaska Native 39 12.82 33.33 25.64 28.21 1 RW Native Hawaiian/Other Pacific Islander 8 25.00 12.50 62.50 1 RW White 2484 11.15 21.74 28.38 38.73 1 RW NYC 17174 16.57 28.22 26.89 28.33 1 RW Big 4 Cities 1318 26.71 31.94 20.86 20.49 1 RW High Need Urban/Suburban 2979 17.93 30.18 28.57 23.33 1 RW High Need Rural 155 12.90 30.97 31.61 24.52 1 RW Average Need 2597 13.28 26.26 27.34 33.12 1 RW Low Need 1438 7.44 22.46 28.37 41.72 1 RW Charter Schools 107 11.21 27.10 30.84 30.84 1 RW 0 Years LEP 918 25.05 28.43 21.46 25.05 1 RW 1 Years LEP 5751 19.74 28.38 25.23 26.66 1 RW 2 Years LEP 14999 12.25 28.17 28.84 30.74 1 RW Arabic 476 21.64 23.74 28.15 26.47 1 RW Bengali 620 7.42 18.23 31.13 43.23 1 RW Chinese 597 4.02 14.57 26.47 54.94 1 RW English 2056 15.52 27.97 27.48 29.04 1 RW Spanish 14700 19.29 32.18 26.86 21.66 1 RW Language Missing 2374 16.72 28.77 26.03 28.48 1 RW Other Language 4945 9.91 19.13 26.84 44.13 1 RW Students with Disabilities 2743 33.47 32.37 20.96 13.20
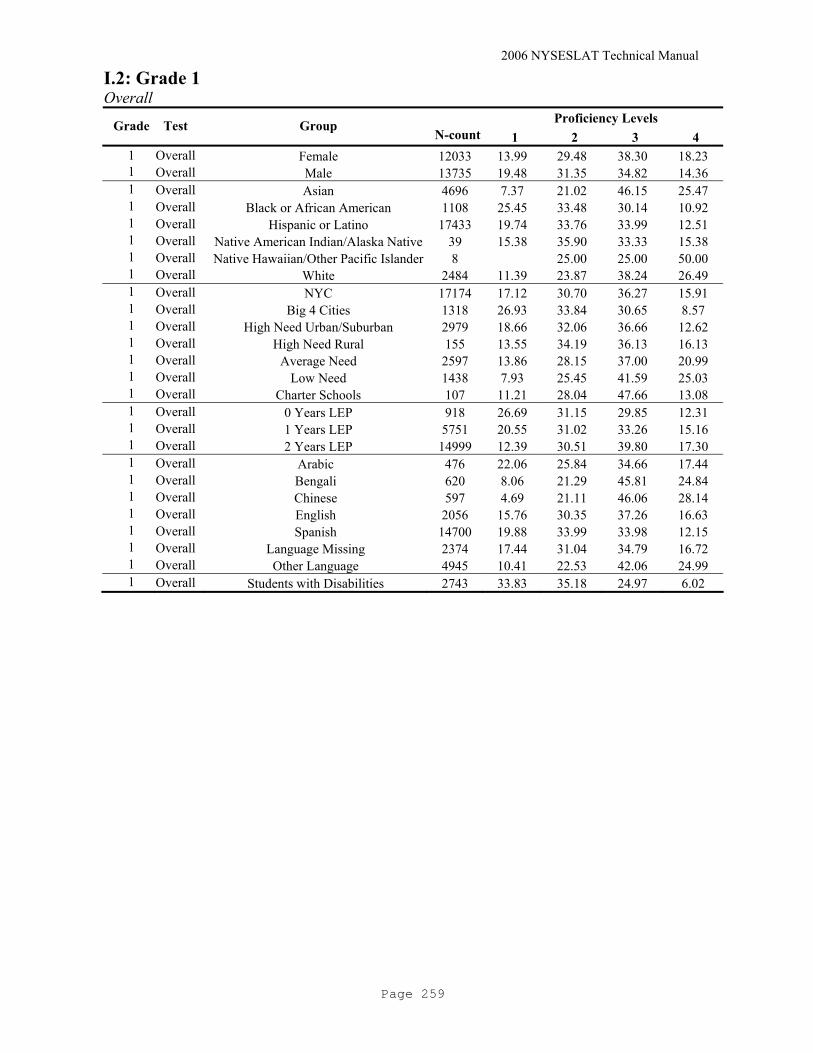
2006 NYSESLAT Technical Manual
Page 259
I.2: Grade 1 Overall
Proficiency Levels Grade Test Group N-count 1 2 3 4
1 Overall Female 12033 13.99 29.48 38.30 18.23 1 Overall Male 13735 19.48 31.35 34.82 14.36 1 Overall Asian 4696 7.37 21.02 46.15 25.47 1 Overall Black or African American 1108 25.45 33.48 30.14 10.92 1 Overall Hispanic or Latino 17433 19.74 33.76 33.99 12.51 1 Overall Native American Indian/Alaska Native 39 15.38 35.90 33.33 15.38 1 Overall Native Hawaiian/Other Pacific Islander 8 25.00 25.00 50.00 1 Overall White 2484 11.39 23.87 38.24 26.49 1 Overall NYC 17174 17.12 30.70 36.27 15.91 1 Overall Big 4 Cities 1318 26.93 33.84 30.65 8.57 1 Overall High Need Urban/Suburban 2979 18.66 32.06 36.66 12.62 1 Overall High Need Rural 155 13.55 34.19 36.13 16.13 1 Overall Average Need 2597 13.86 28.15 37.00 20.99 1 Overall Low Need 1438 7.93 25.45 41.59 25.03 1 Overall Charter Schools 107 11.21 28.04 47.66 13.08 1 Overall 0 Years LEP 918 26.69 31.15 29.85 12.31 1 Overall 1 Years LEP 5751 20.55 31.02 33.26 15.16 1 Overall 2 Years LEP 14999 12.39 30.51 39.80 17.30 1 Overall Arabic 476 22.06 25.84 34.66 17.44 1 Overall Bengali 620 8.06 21.29 45.81 24.84 1 Overall Chinese 597 4.69 21.11 46.06 28.14 1 Overall English 2056 15.76 30.35 37.26 16.63 1 Overall Spanish 14700 19.88 33.99 33.98 12.15 1 Overall Language Missing 2374 17.44 31.04 34.79 16.72 1 Overall Other Language 4945 10.41 22.53 42.06 24.99 1 Overall Students with Disabilities 2743 33.83 35.18 24.97 6.02

2006 NYSESLAT Technical Manual
Page 260
I.3: Grade 2 Listening/Speaking (LS)
Proficiency Levels Grade Test Group N-count 1 2 3 4
2 LS Female 10833 2.31 8.91 44.68 44.11 2 LS Male 12372 2.60 9.14 46.60 41.66 2 LS Asian 3854 1.87 7.84 39.72 50.57 2 LS Black or African American 1033 2.42 12.49 47.92 37.17 2 LS Hispanic or Latino 16197 2.56 9.34 48.51 39.60 2 LS Native American Indian/Alaska Native 52 11.54 38.46 50.00 2 LS Native Hawaiian/Other Pacific Islander 9 33.33 66.67 2 LS White 2060 2.96 7.14 33.93 55.97 2 LS NYC 15983 2.73 9.67 47.88 39.72 2 LS Big 4 Cities 1178 2.80 12.56 48.64 35.99 2 LS High Need Urban/Suburban 2659 1.99 7.56 45.58 44.87 2 LS High Need Rural 132 8.33 38.64 53.03 2 LS Average Need 2064 1.41 6.06 36.58 55.96 2 LS Low Need 1109 1.80 5.59 30.12 62.49 2 LS Charter Schools 80 1.25 3.75 35.00 60.00 2 LS 0 Years LEP 608 9.87 22.70 35.36 32.07 2 LS 1 Years LEP 2296 6.14 24.83 41.25 27.79 2 LS 2 Years LEP 4508 0.55 6.30 45.76 47.38 2 LS 3 Years LEP 12604 0.35 5.22 48.54 45.89 2 LS Arabic 481 6.03 12.89 40.75 40.33 2 LS Bengali 492 2.03 8.33 39.02 50.61 2 LS Chinese 402 2.24 9.70 38.81 49.25 2 LS English 1523 1.31 7.55 43.20 47.93 2 LS Spanish 13962 2.65 9.67 48.95 38.73 2 LS Language Missing 2022 2.37 6.48 41.54 49.60 2 LS Other Language 4323 1.99 8.28 40.00 49.73 2 LS Students with Disabilities 3223 2.26 14.33 56.50 26.90

2006 NYSESLAT Technical Manual
Page 261
I.3: Grade 2 Reading/Writing (RW)
Proficiency Levels Grade Test Group N-count 1 2 3 4
2 RW Female 10833 10.12 30.43 34.59 24.87 2 RW Male 12372 14.35 33.88 32.74 19.03 2 RW Asian 3854 6.20 21.87 37.42 34.51 2 RW Black or African American 1033 18.49 37.27 27.59 16.65 2 RW Hispanic or Latino 16197 13.71 35.44 32.99 17.87 2 RW Native American Indian/Alaska Native 52 9.62 34.62 36.54 19.23 2 RW Native Hawaiian/Other Pacific Islander 9 22.22 22.22 55.56 2 RW White 2060 10.49 24.27 34.27 30.97 2 RW NYC 15983 12.76 33.97 33.95 19.31 2 RW Big 4 Cities 1178 21.39 28.69 30.39 19.52 2 RW High Need Urban/Suburban 2659 12.15 32.23 32.61 23.02 2 RW High Need Rural 132 9.85 28.79 33.33 28.03 2 RW Average Need 2064 8.91 26.70 33.82 30.57 2 RW Low Need 1109 4.96 22.45 33.90 38.68 2 RW Charter Schools 80 5.00 32.50 33.75 28.75 2 RW 0 Years LEP 608 23.52 31.91 23.36 21.22 2 RW 1 Years LEP 2296 24.13 34.89 25.17 15.81 2 RW 2 Years LEP 4508 9.96 31.30 33.39 25.35 2 RW 3 Years LEP 12604 8.02 32.39 37.52 22.06 2 RW Arabic 481 19.96 31.81 29.52 18.71 2 RW Bengali 492 6.30 19.92 40.04 33.74 2 RW Chinese 402 6.72 21.14 40.30 31.84 2 RW English 1523 12.87 30.47 30.53 26.13 2 RW Spanish 13962 13.87 35.87 33.29 16.97 2 RW Language Missing 2022 10.68 28.09 32.89 28.34 2 RW Other Language 4323 8.51 25.72 35.11 30.65 2 RW Students with Disabilities 3223 27.15 43.78 21.50 7.57
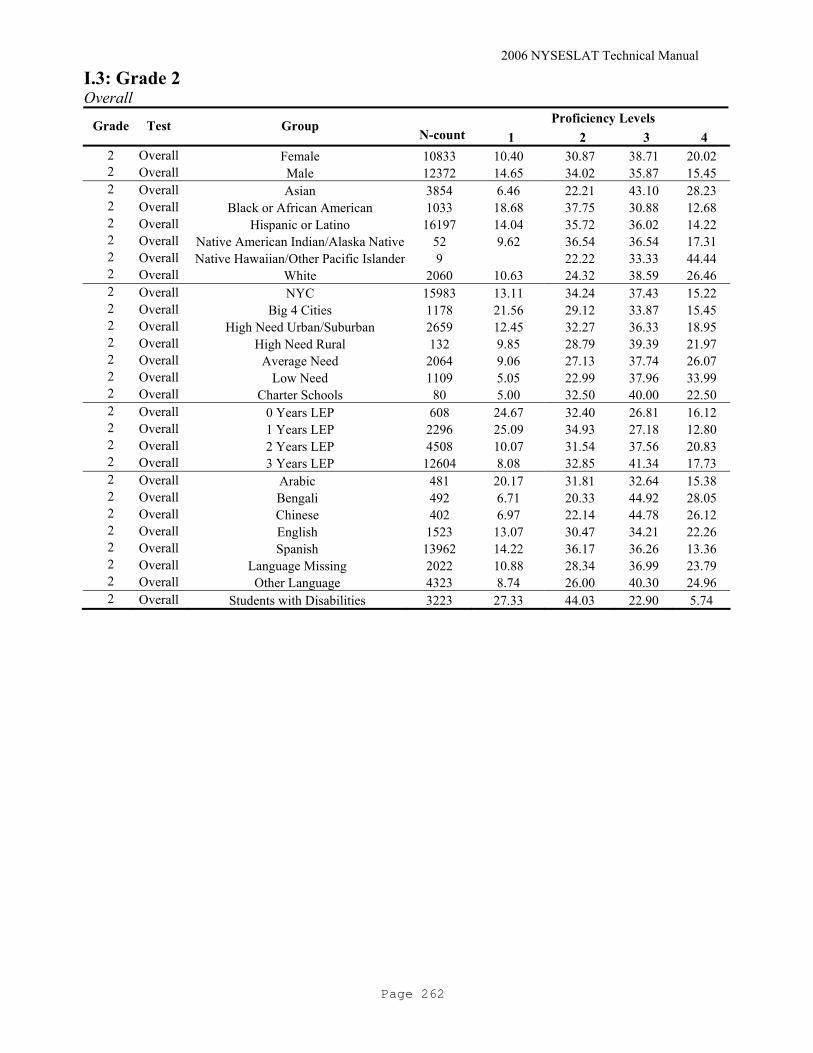
2006 NYSESLAT Technical Manual
Page 262
I.3: Grade 2 Overall
Proficiency Levels Grade Test Group N-count 1 2 3 4
2 Overall Female 10833 10.40 30.87 38.71 20.02 2 Overall Male 12372 14.65 34.02 35.87 15.45 2 Overall Asian 3854 6.46 22.21 43.10 28.23 2 Overall Black or African American 1033 18.68 37.75 30.88 12.68 2 Overall Hispanic or Latino 16197 14.04 35.72 36.02 14.22 2 Overall Native American Indian/Alaska Native 52 9.62 36.54 36.54 17.31 2 Overall Native Hawaiian/Other Pacific Islander 9 22.22 33.33 44.44 2 Overall White 2060 10.63 24.32 38.59 26.46 2 Overall NYC 15983 13.11 34.24 37.43 15.22 2 Overall Big 4 Cities 1178 21.56 29.12 33.87 15.45 2 Overall High Need Urban/Suburban 2659 12.45 32.27 36.33 18.95 2 Overall High Need Rural 132 9.85 28.79 39.39 21.97 2 Overall Average Need 2064 9.06 27.13 37.74 26.07 2 Overall Low Need 1109 5.05 22.99 37.96 33.99 2 Overall Charter Schools 80 5.00 32.50 40.00 22.50 2 Overall 0 Years LEP 608 24.67 32.40 26.81 16.12 2 Overall 1 Years LEP 2296 25.09 34.93 27.18 12.80 2 Overall 2 Years LEP 4508 10.07 31.54 37.56 20.83 2 Overall 3 Years LEP 12604 8.08 32.85 41.34 17.73 2 Overall Arabic 481 20.17 31.81 32.64 15.38 2 Overall Bengali 492 6.71 20.33 44.92 28.05 2 Overall Chinese 402 6.97 22.14 44.78 26.12 2 Overall English 1523 13.07 30.47 34.21 22.26 2 Overall Spanish 13962 14.22 36.17 36.26 13.36 2 Overall Language Missing 2022 10.88 28.34 36.99 23.79 2 Overall Other Language 4323 8.74 26.00 40.30 24.96 2 Overall Students with Disabilities 3223 27.33 44.03 22.90 5.74

2006 NYSESLAT Technical Manual
Page 263
I.4: Grade 3 Listening/Speaking (LS)
Proficiency Levels Grade Test Group N-count 1 2 3 4
3 LS Female 8768 3.65 9.27 47.71 39.37 3 LS Male 10253 3.65 9.07 48.69 38.59 3 LS Asian 2904 3.72 9.33 43.11 43.84 3 LS Black or African American 953 2.83 15.01 47.64 34.52 3 LS Hispanic or Latino 13506 3.75 9.04 50.27 36.94 3 LS Native American Indian/Alaska Native 33 54.55 45.45 3 LS Native Hawaiian/Other Pacific Islander 5 20.00 80.00 3 LS White 1620 3.15 6.67 40.62 49.57 3 LS NYC 13636 3.79 9.30 49.55 37.36 3 LS Big 4 Cities 927 3.78 13.48 49.84 32.90 3 LS High Need Urban/Suburban 1955 3.38 9.26 49.82 37.54 3 LS High Need Rural 115 4.35 2.61 48.70 44.35 3 LS Average Need 1529 3.27 7.06 39.05 50.62 3 LS Low Need 788 2.54 7.11 36.93 53.43 3 LS Charter Schools 71 1.41 2.82 53.52 42.25 3 LS 0 Years LEP 509 15.52 24.17 35.36 24.95 3 LS 1 Years LEP 1798 10.57 32.98 39.04 17.41 3 LS 2 Years LEP 1756 0.91 10.99 50.74 37.36 3 LS 3 Years LEP 3321 0.24 4.40 47.82 47.55 3 LS 4 Years LEP 8820 0.33 3.49 52.66 43.51 3 LS Arabic 335 6.57 14.03 42.39 37.01 3 LS Bengali 351 1.71 9.97 40.17 48.15 3 LS Chinese 319 6.90 11.29 38.56 43.26 3 LS English 1032 2.23 6.78 46.51 44.48 3 LS Spanish 11821 3.93 9.22 51.22 35.63 3 LS Language Missing 1562 2.56 7.23 42.51 47.70 3 LS Other Language 3601 3.25 9.78 43.60 43.38 3 LS Students with Disabilities 3168 1.74 10.32 61.62 26.33

2006 NYSESLAT Technical Manual
Page 264
I.4: Grade 3 Reading/Writing (RW)
Proficiency Levels Grade Test Group N-count 1 2 3 4
3 RW Female 8768 8.37 20.64 39.85 31.14 3 RW Male 10253 11.19 23.62 39.00 26.19 3 RW Asian 2904 6.68 16.08 38.91 38.33 3 RW Black or African American 953 16.26 27.18 36.73 19.83 3 RW Hispanic or Latino 13506 10.42 23.80 39.80 25.97 3 RW Native American Indian/Alaska Native 33 15.15 39.39 45.45 3 RW Native Hawaiian/Other Pacific Islander 5 40.00 20.00 40.00 3 RW White 1620 7.53 17.65 38.46 36.36 3 RW NYC 13636 10.10 22.90 39.57 27.43 3 RW Big 4 Cities 927 15.10 22.11 41.10 21.68 3 RW High Need Urban/Suburban 1955 8.90 22.92 38.16 30.03 3 RW High Need Rural 115 10.43 20.00 39.13 30.43 3 RW Average Need 1529 8.50 18.90 39.24 33.36 3 RW Low Need 788 5.84 16.50 37.06 40.61 3 RW Charter Schools 71 2.82 19.72 46.48 30.99 3 RW 0 Years LEP 509 27.90 25.93 27.11 19.06 3 RW 1 Years LEP 1798 26.20 31.87 25.81 16.13 3 RW 2 Years LEP 1756 9.17 22.32 38.38 30.13 3 RW 3 Years LEP 3321 4.88 18.25 43.45 33.42 3 RW 4 Years LEP 8820 4.07 20.39 43.95 31.60 3 RW Arabic 335 17.01 21.79 38.51 22.69 3 RW Bengali 351 5.13 15.10 35.33 44.44 3 RW Chinese 319 8.15 16.30 36.99 38.56 3 RW English 1032 9.98 19.57 37.69 32.75 3 RW Spanish 11821 10.68 24.35 39.95 25.02 3 RW Language Missing 1562 7.23 20.81 39.63 32.33 3 RW Other Language 3601 8.36 18.02 38.66 34.96 3 RW Students with Disabilities 3168 17.05 37.66 34.66 10.64

2006 NYSESLAT Technical Manual
Page 265
I.4: Grade 3 Overall
Proficiency Levels Grade Test Group N-count 1 2 3 4
3 Overall Female 8768 9.09 21.30 48.57 21.03 3 Overall Male 10253 11.58 24.13 46.27 18.02 3 Overall Asian 2904 7.33 16.91 49.17 26.58 3 Overall Black or African American 953 16.47 27.81 41.66 14.06 3 Overall Hispanic or Latino 13506 10.97 24.35 47.40 17.27 3 Overall Native American Indian/Alaska Native 33 15.15 57.58 27.27 3 Overall Native Hawaiian/Other Pacific Islander 5 40.00 60.00 3 Overall White 1620 8.02 18.02 46.54 27.41 3 Overall NYC 13636 10.66 23.54 47.52 18.28 3 Overall Big 4 Cities 927 15.75 22.65 47.46 14.13 3 Overall High Need Urban/Suburban 1955 9.51 23.27 48.49 18.72 3 Overall High Need Rural 115 10.43 20.87 48.70 20.00 3 Overall Average Need 1529 9.03 18.84 45.13 27.01 3 Overall Low Need 788 5.96 17.77 44.16 32.11 3 Overall Charter Schools 71 2.82 21.13 57.75 18.31 3 Overall 0 Years LEP 509 30.45 24.95 31.04 13.56 3 Overall 1 Years LEP 1798 27.98 32.98 29.25 9.79 3 Overall 2 Years LEP 1756 9.45 23.80 45.84 20.90 3 Overall 3 Years LEP 3321 4.91 19.09 51.61 24.39 3 Overall 4 Years LEP 8820 4.14 20.94 54.15 20.77 3 Overall Arabic 335 18.21 21.19 43.88 16.72 3 Overall Bengali 351 5.41 16.24 46.44 31.91 3 Overall Chinese 319 9.40 17.24 47.02 26.33 3 Overall English 1032 10.47 20.16 45.93 23.45 3 Overall Spanish 11821 11.24 24.92 47.46 16.38 3 Overall Language Missing 1562 7.36 21.25 47.44 23.94 3 Overall Other Language 3601 8.94 18.69 47.71 24.66 3 Overall Students with Disabilities 3168 17.36 38.01 37.78 6.85

2006 NYSESLAT Technical Manual
Page 266
I.5: Grade 4 Listening/Speaking (LS)
Proficiency Levels Grade Test Group N-count 1 2 3 4
4 LS Female 6819 5.79 10.57 44.42 39.21 4 LS Male 8154 5.53 10.73 45.17 38.57 4 LS Asian 2238 6.39 13.14 40.75 39.72 4 LS Black or African American 821 3.05 13.76 48.72 34.47 4 LS Hispanic or Latino 10681 5.82 10.00 46.09 38.09 4 LS Native American Indian/Alaska Native 17 11.76 5.88 41.18 41.18 4 LS Native Hawaiian/Other Pacific Islander 8 25.00 62.50 12.50 4 LS White 1208 4.47 9.77 38.49 47.27 4 LS NYC 10110 6.33 11.19 46.86 35.62 4 LS Big 4 Cities 1013 5.73 13.33 44.92 36.03 4 LS High Need Urban/Suburban 1684 4.57 8.97 40.97 45.49 4 LS High Need Rural 87 3.45 4.60 34.48 57.47 4 LS Average Need 1367 3.73 8.63 38.70 48.94 4 LS Low Need 673 2.53 8.47 38.19 50.82 4 LS Charter Schools 39 33.33 66.67 4 LS 0 Years LEP 517 16.25 25.15 35.59 23.02 4 LS 1 Years LEP 1689 16.04 31.50 35.88 16.58 4 LS 2 Years LEP 1466 1.71 18.14 48.57 31.58 4 LS 3 Years LEP 1425 0.56 6.81 48.07 44.56 4 LS 4 Years LEP 2318 0.30 2.85 44.22 52.63 4 LS 5 Years LEP 5134 0.49 3.35 50.70 45.46 4 LS Arabic 266 12.78 17.29 36.09 33.83 4 LS Bengali 233 3.86 8.15 46.35 41.63 4 LS Chinese 189 12.17 14.29 36.51 37.04 4 LS English 868 1.84 8.06 43.20 46.89 4 LS Spanish 9257 6.25 10.31 47.10 36.34 4 LS Language Missing 1379 3.63 8.99 40.32 47.06 4 LS Other Language 2781 4.85 12.80 41.28 41.06 4 LS Students with Disabilities 2707 1.66 9.35 56.19 32.80

2006 NYSESLAT Technical Manual
Page 267
I.5: Grade 4 Reading/Writing (RW)
Proficiency Levels Grade Test Group N-count 1 2 3 4
4 RW Female 6819 8.53 18.30 38.25 34.92 4 RW Male 8154 11.49 21.69 38.26 28.55 4 RW Asian 2238 8.27 17.11 37.40 37.22 4 RW Black or African American 821 14.86 22.17 40.07 22.90 4 RW Hispanic or Latino 10681 10.37 20.79 38.39 30.45 4 RW Native American Indian/Alaska Native 17 23.53 35.29 41.18 4 RW Native Hawaiian/Other Pacific Islander 8 25.00 50.00 25.00 4 RW White 1208 8.28 18.96 37.42 35.35 4 RW NYC 10110 11.06 21.41 38.48 29.05 4 RW Big 4 Cities 1013 13.13 21.42 36.33 29.12 4 RW High Need Urban/Suburban 1684 7.90 17.16 39.49 35.45 4 RW High Need Rural 87 6.90 17.24 41.38 34.48 4 RW Average Need 1367 7.68 16.53 37.02 38.77 4 RW Low Need 673 3.57 15.01 36.85 44.58 4 RW Charter Schools 39 10.26 38.46 51.28 4 RW 0 Years LEP 517 23.98 27.47 28.43 20.12 4 RW 1 Years LEP 1689 24.27 31.14 28.42 16.16 4 RW 2 Years LEP 1466 9.28 27.22 34.38 29.13 4 RW 3 Years LEP 1425 4.84 19.09 36.21 39.86 4 RW 4 Years LEP 2318 2.55 13.76 43.40 40.29 4 RW 5 Years LEP 5134 3.04 15.76 44.78 36.42 4 RW Arabic 266 22.18 26.32 29.70 21.80 4 RW Bengali 233 4.72 18.88 36.91 39.48 4 RW Chinese 189 13.76 16.93 34.92 34.39 4 RW English 868 6.68 19.35 35.71 38.25 4 RW Spanish 9257 11.00 21.25 38.68 29.07 4 RW Language Missing 1379 6.67 16.82 38.65 37.85 4 RW Other Language 2781 9.17 18.12 38.58 34.12 4 RW Students with Disabilities 2707 12.67 33.39 38.86 15.07

2006 NYSESLAT Technical Manual
Page 268
I.5: Grade 4 Overall
Proficiency Levels Grade Test Group N-
count 1 2 3 4 4 Overall Female 6819 9.68 19.30 48.38 22.64 4 Overall Male 8154 12.34 22.25 46.04 19.38 4 Overall Asian 2238 9.96 18.95 45.84 25.25 4 Overall Black or African American 821 14.86 23.14 47.75 14.25 4 Overall Hispanic or Latino 10681 11.32 21.31 47.57 19.80 4 Overall Native American Indian/Alaska Native 17 23.53 47.06 29.41 4 Overall Native Hawaiian/Other Pacific Islander 8 25.00 75.00 4 Overall White 1208 8.94 19.70 44.70 26.66 4 Overall NYC 10110 12.23 22.09 47.59 18.10 4 Overall Big 4 Cities 1013 13.72 22.01 44.32 19.94 4 Overall High Need Urban/Suburban 1684 8.73 17.87 47.92 25.48 4 Overall High Need Rural 87 8.05 17.24 43.68 31.03 4 Overall Average Need 1367 7.90 17.63 45.35 29.11 4 Overall Low Need 673 4.31 16.79 45.91 32.99 4 Overall Charter Schools 39 10.26 48.72 41.03 4 Overall 0 Years LEP 517 26.31 28.24 32.30 13.15 4 Overall 1 Years LEP 1689 27.77 32.27 30.61 9.35 4 Overall 2 Years LEP 1466 9.62 29.20 41.95 19.24 4 Overall 3 Years LEP 1425 5.12 20.07 48.00 26.81 4 Overall 4 Years LEP 2318 2.76 14.50 53.88 28.86 4 Overall 5 Years LEP 5134 3.25 16.32 57.13 23.30 4 Overall Arabic 266 24.06 24.81 36.09 15.04 4 Overall Bengali 233 6.44 19.31 46.78 27.47 4 Overall Chinese 189 16.40 17.46 43.39 22.75 4 Overall English 868 6.91 20.62 45.85 26.61 4 Overall Spanish 9257 12.01 21.65 48.02 18.32 4 Overall Language Missing 1379 7.25 18.20 46.63 27.92 4 Overall Other Language 2781 10.21 19.85 46.03 23.91 4 Overall Students with Disabilities 2707 13.08 33.84 43.18 9.90

2006 NYSESLAT Technical Manual
Page 269
I.6: Grade 5 Listening/Speaking (LS)
Proficiency Levels Grade Test Group N-
count 1 2 3 4 5 LS Female 6171 6.43 12.46 38.60 42.51 5 LS Male 7203 7.14 13.15 37.94 41.77 5 LS Asian 1891 6.87 14.49 36.65 41.99 5 LS Black or African American 772 4.27 15.80 41.19 38.73 5 LS Hispanic or Latino 9651 7.16 12.34 39.30 41.20 5 LS Native American Indian/Alaska Native 19 5.26 36.84 57.89 5 LS Native Hawaiian/Other Pacific Islander 5 20.00 80.00 5 LS White 1036 5.41 12.36 28.96 53.28 5 LS NYC 9469 7.33 12.96 39.19 40.52 5 LS Big 4 Cities 834 6.24 16.07 39.81 37.89 5 LS High Need Urban/Suburban 1308 6.57 11.93 38.15 43.35 5 LS High Need Rural 107 0.93 13.08 36.45 49.53 5 LS Average Need 1077 5.48 11.88 31.94 50.70 5 LS Low Need 542 3.51 10.52 32.10 53.87 5 LS Charter Schools 37 43.24 56.76 5 LS 0 Years LEP 479 18.37 25.47 30.48 25.68 5 LS 1 Years LEP 1682 20.99 31.75 29.49 17.78 5 LS 2 Years LEP 1339 3.29 21.88 41.67 33.16 5 LS 3 Years LEP 1234 0.65 10.78 43.19 45.38 5 LS 4 Years LEP 1024 0.20 5.47 39.65 54.69 5 LS 5 Years LEP 1663 0.18 4.39 38.36 57.07 5 LS 6 Years LEP 3683 0.43 4.13 43.01 52.43 5 LS Arabic 244 16.39 23.36 28.69 31.56 5 LS Bengali 194 4.64 15.98 39.69 39.69 5 LS Chinese 188 13.83 14.89 30.32 40.96 5 LS English 706 3.40 10.20 37.68 48.73 5 LS Spanish 8529 7.52 12.58 39.48 40.43 5 LS Language Missing 1060 4.06 10.94 36.70 48.30 5 LS Other Language 2453 5.22 13.82 36.24 44.72 5 LS Students with Disabilities 2365 1.78 10.82 50.02 37.38
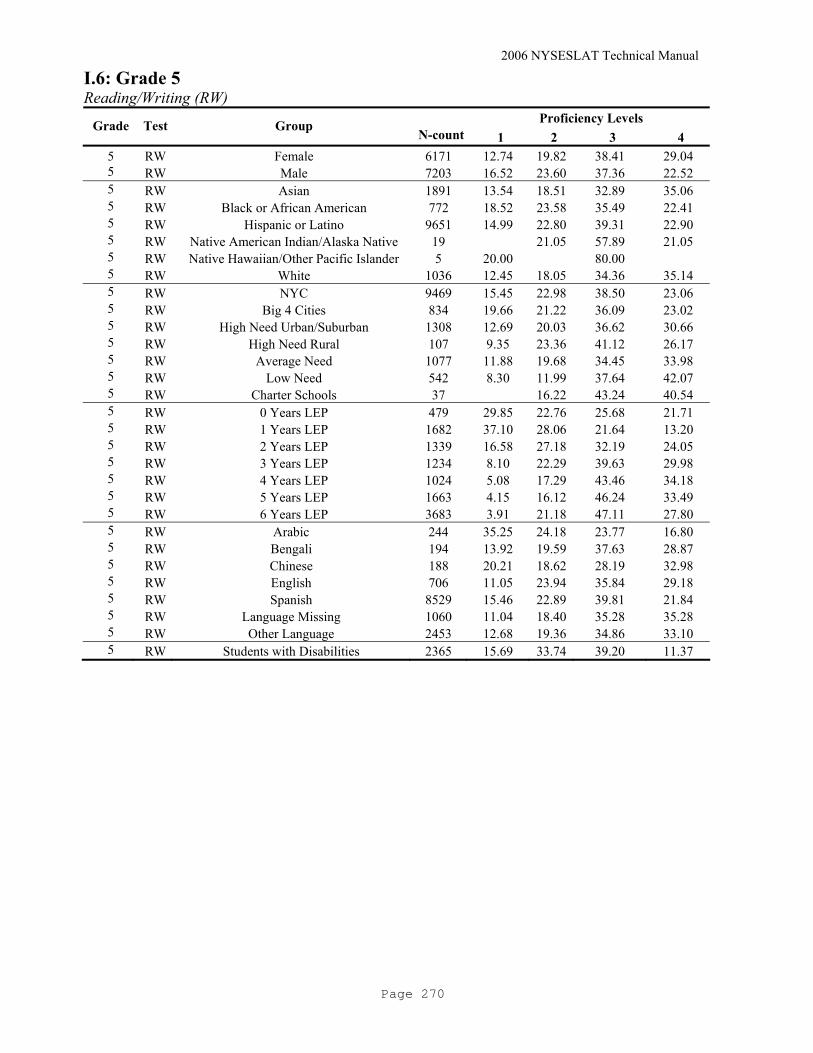
2006 NYSESLAT Technical Manual
Page 270
I.6: Grade 5 Reading/Writing (RW)
Proficiency Levels Grade Test Group N-count 1 2 3 4
5 RW Female 6171 12.74 19.82 38.41 29.04 5 RW Male 7203 16.52 23.60 37.36 22.52 5 RW Asian 1891 13.54 18.51 32.89 35.06 5 RW Black or African American 772 18.52 23.58 35.49 22.41 5 RW Hispanic or Latino 9651 14.99 22.80 39.31 22.90 5 RW Native American Indian/Alaska Native 19 21.05 57.89 21.05 5 RW Native Hawaiian/Other Pacific Islander 5 20.00 80.00 5 RW White 1036 12.45 18.05 34.36 35.14 5 RW NYC 9469 15.45 22.98 38.50 23.06 5 RW Big 4 Cities 834 19.66 21.22 36.09 23.02 5 RW High Need Urban/Suburban 1308 12.69 20.03 36.62 30.66 5 RW High Need Rural 107 9.35 23.36 41.12 26.17 5 RW Average Need 1077 11.88 19.68 34.45 33.98 5 RW Low Need 542 8.30 11.99 37.64 42.07 5 RW Charter Schools 37 16.22 43.24 40.54 5 RW 0 Years LEP 479 29.85 22.76 25.68 21.71 5 RW 1 Years LEP 1682 37.10 28.06 21.64 13.20 5 RW 2 Years LEP 1339 16.58 27.18 32.19 24.05 5 RW 3 Years LEP 1234 8.10 22.29 39.63 29.98 5 RW 4 Years LEP 1024 5.08 17.29 43.46 34.18 5 RW 5 Years LEP 1663 4.15 16.12 46.24 33.49 5 RW 6 Years LEP 3683 3.91 21.18 47.11 27.80 5 RW Arabic 244 35.25 24.18 23.77 16.80 5 RW Bengali 194 13.92 19.59 37.63 28.87 5 RW Chinese 188 20.21 18.62 28.19 32.98 5 RW English 706 11.05 23.94 35.84 29.18 5 RW Spanish 8529 15.46 22.89 39.81 21.84 5 RW Language Missing 1060 11.04 18.40 35.28 35.28 5 RW Other Language 2453 12.68 19.36 34.86 33.10 5 RW Students with Disabilities 2365 15.69 33.74 39.20 11.37

2006 NYSESLAT Technical Manual
Page 271
I.6: Grade 5 Overall
Proficiency Levels Grade Test Group N-
count 1 2 3 4 5 Overall Female 6171 13.34 21.21 44.01 21.44 5 Overall Male 7203 17.31 24.17 41.29 17.23 5 Overall Asian 1891 14.23 19.94 40.03 25.81 5 Overall Black or African American 772 18.65 24.74 39.90 16.71 5 Overall Hispanic or Latino 9651 15.74 23.61 43.74 16.91 5 Overall Native American Indian/Alaska Native 19 21.05 63.16 15.79 5 Overall Native Hawaiian/Other Pacific Islander 5 20.00 80.00 5 Overall White 1036 13.22 19.21 37.45 30.12 5 Overall NYC 9469 16.24 23.92 42.60 17.24 5 Overall Big 4 Cities 834 20.02 22.06 41.49 16.43 5 Overall High Need Urban/Suburban 1308 13.30 21.33 42.89 22.48 5 Overall High Need Rural 107 9.35 23.36 47.66 19.63 5 Overall Average Need 1077 12.53 19.96 40.20 27.30 5 Overall Low Need 542 8.49 14.02 45.39 32.10 5 Overall Charter Schools 37 16.22 51.35 32.43 5 Overall 0 Years LEP 479 31.73 23.17 29.85 15.24 5 Overall 1 Years LEP 1682 39.18 28.78 23.42 8.62 5 Overall 2 Years LEP 1339 16.88 29.20 35.62 18.30 5 Overall 3 Years LEP 1234 8.43 23.99 43.44 24.15 5 Overall 4 Years LEP 1024 5.27 18.16 51.37 25.20 5 Overall 5 Years LEP 1663 4.21 16.96 52.80 26.04 5 Overall 6 Years LEP 3683 4.18 21.94 53.14 20.74 5 Overall Arabic 244 36.07 24.18 25.00 14.75 5 Overall Bengali 194 14.43 21.13 43.30 21.13 5 Overall Chinese 188 20.74 18.62 37.23 23.40 5 Overall English 706 11.61 24.50 39.66 24.22 5 Overall Spanish 8529 16.25 23.73 44.07 15.95 5 Overall Language Missing 1060 11.51 19.15 41.89 27.45 5 Overall Other Language 2453 13.25 20.99 40.44 25.32 5 Overall Students with Disabilities 2365 16.24 34.21 41.06 8.50

2006 NYSESLAT Technical Manual
Page 272
I.7: Grade 6 Listening/Speaking (LS)
Proficiency Levels Grade Test Group N-count1 2 3 4
6 LS Female 5098 11.83 16.91 37.60 33.66 6 LS Male 6015 12.12 17.14 38.15 32.59 6 LS Asian 1723 11.49 21.82 35.58 31.11 6 LS Black or African American 662 7.85 21.60 41.84 28.70 6 LS Hispanic or Latino 7812 13.06 15.94 38.13 32.87 6 LS Native American Indian/Alaska Native 18 11.11 5.56 38.89 44.44 6 LS Native Hawaiian/Other Pacific Islander 4 25.00 75.00 6 LS White 894 6.71 14.21 37.25 41.83 6 LS NYC 7999 12.48 17.50 39.60 30.42 6 LS Big 4 Cities 658 8.51 16.57 36.17 38.75 6 LS High Need Urban/Suburban 976 15.16 16.39 32.38 36.07 6 LS High Need Rural 75 2.67 10.67 50.67 36.00 6 LS Average Need 985 9.95 15.03 30.05 44.97 6 LS Low Need 404 7.43 16.83 35.89 39.85 6 LS Charter Schools 16 68.75 31.25 6 LS 0 Years LEP 453 28.92 27.15 27.37 16.56 6 LS 1 Years LEP 1698 30.15 31.10 25.27 13.49 6 LS 2 Years LEP 1318 7.59 26.78 38.32 27.31 6 LS 3 Years LEP 1186 3.04 16.10 43.17 37.69 6 LS 4 Years LEP 915 0.98 8.85 44.92 45.25 6 LS 5 Years LEP 738 0.68 6.50 49.05 43.77 6 LS 6 Years LEP or More 2789 0.75 7.17 46.40 45.68 6 LS Arabic 204 17.65 24.02 35.78 22.55 6 LS Bengali 174 5.17 17.24 40.23 37.36 6 LS Chinese 134 16.42 29.85 32.09 21.64 6 LS English 563 6.04 15.81 38.54 39.61 6 LS Spanish 6941 13.51 16.08 38.73 31.68 6 LS Language Missing 884 9.73 14.93 32.92 42.42 6 LS Other Language 2213 9.35 19.75 37.51 33.39 6 LS Students with Disabilities 1827 3.23 17.13 49.10 30.54
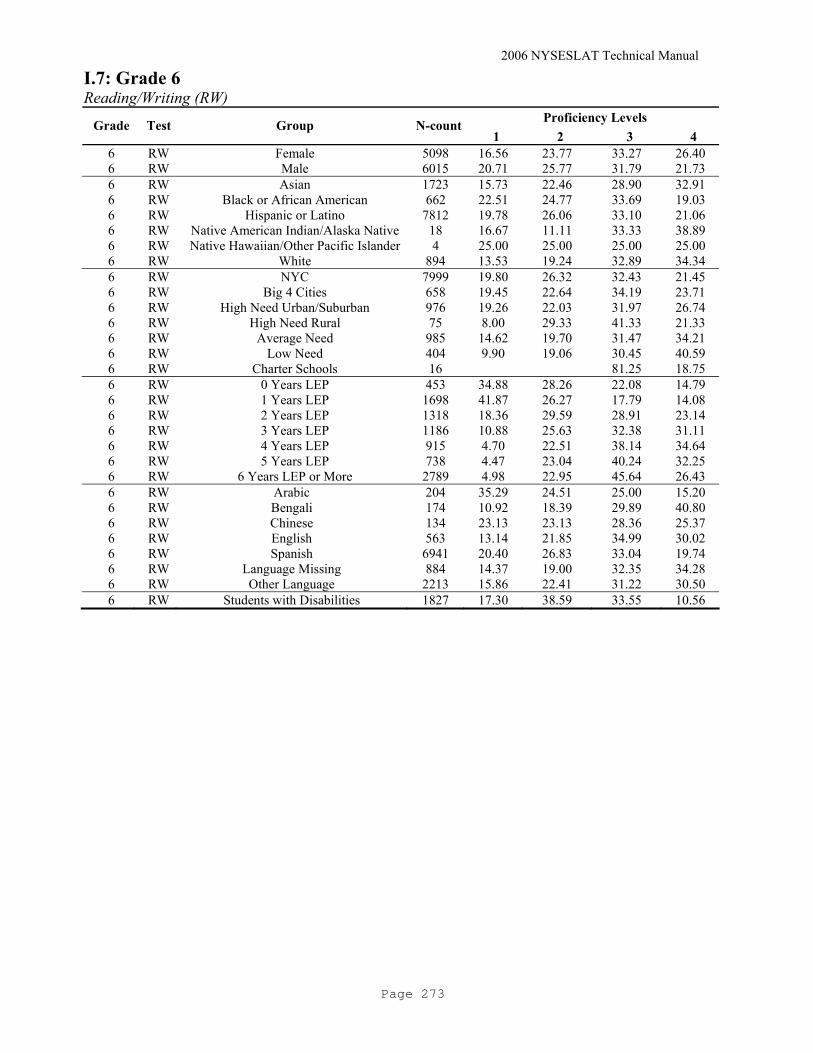
2006 NYSESLAT Technical Manual
Page 273
I.7: Grade 6 Reading/Writing (RW)
Proficiency Levels Grade Test Group N-count1 2 3 4
6 RW Female 5098 16.56 23.77 33.27 26.40 6 RW Male 6015 20.71 25.77 31.79 21.73 6 RW Asian 1723 15.73 22.46 28.90 32.91 6 RW Black or African American 662 22.51 24.77 33.69 19.03 6 RW Hispanic or Latino 7812 19.78 26.06 33.10 21.06 6 RW Native American Indian/Alaska Native 18 16.67 11.11 33.33 38.89 6 RW Native Hawaiian/Other Pacific Islander 4 25.00 25.00 25.00 25.00 6 RW White 894 13.53 19.24 32.89 34.34 6 RW NYC 7999 19.80 26.32 32.43 21.45 6 RW Big 4 Cities 658 19.45 22.64 34.19 23.71 6 RW High Need Urban/Suburban 976 19.26 22.03 31.97 26.74 6 RW High Need Rural 75 8.00 29.33 41.33 21.33 6 RW Average Need 985 14.62 19.70 31.47 34.21 6 RW Low Need 404 9.90 19.06 30.45 40.59 6 RW Charter Schools 16 81.25 18.75 6 RW 0 Years LEP 453 34.88 28.26 22.08 14.79 6 RW 1 Years LEP 1698 41.87 26.27 17.79 14.08 6 RW 2 Years LEP 1318 18.36 29.59 28.91 23.14 6 RW 3 Years LEP 1186 10.88 25.63 32.38 31.11 6 RW 4 Years LEP 915 4.70 22.51 38.14 34.64 6 RW 5 Years LEP 738 4.47 23.04 40.24 32.25 6 RW 6 Years LEP or More 2789 4.98 22.95 45.64 26.43 6 RW Arabic 204 35.29 24.51 25.00 15.20 6 RW Bengali 174 10.92 18.39 29.89 40.80 6 RW Chinese 134 23.13 23.13 28.36 25.37 6 RW English 563 13.14 21.85 34.99 30.02 6 RW Spanish 6941 20.40 26.83 33.04 19.74 6 RW Language Missing 884 14.37 19.00 32.35 34.28 6 RW Other Language 2213 15.86 22.41 31.22 30.50 6 RW Students with Disabilities 1827 17.30 38.59 33.55 10.56

2006 NYSESLAT Technical Manual
Page 274
I.7: Grade 6 Overall
Proficiency Levels Grade Test Group N-count1 2 3 4
6 Overall Female 5098 18.42 24.93 39.41 17.24 6 Overall Male 6015 22.48 26.68 36.11 14.73 6 Overall Asian 1723 17.99 25.59 35.40 21.01 6 Overall Black or African American 662 24.17 26.59 36.86 12.39 6 Overall Hispanic or Latino 7812 21.61 26.54 37.94 13.91 6 Overall Native American Indian/Alaska Native 18 16.67 11.11 55.56 16.67 6 Overall Native Hawaiian/Other Pacific Islander 4 25.00 25.00 50.00 6 Overall White 894 14.43 20.47 39.26 25.84 6 Overall NYC 7999 21.67 27.33 37.77 13.24 6 Overall Big 4 Cities 658 20.36 23.86 36.78 19.00 6 Overall High Need Urban/Suburban 976 21.93 22.13 36.89 19.06 6 Overall High Need Rural 75 9.33 29.33 45.33 16.00 6 Overall Average Need 985 15.94 21.12 35.63 27.31 6 Overall Low Need 404 11.39 21.53 39.11 27.97 6 Overall Charter Schools 16 93.75 6.25 6 Overall 0 Years LEP 453 39.51 27.15 25.17 8.17 6 Overall 1 Years LEP 1698 45.52 26.33 20.61 7.54 6 Overall 2 Years LEP 1318 19.65 32.09 33.08 15.17 6 Overall 3 Years LEP 1186 11.89 27.15 38.79 22.18 6 Overall 4 Years LEP 915 5.36 23.93 46.99 23.72 6 Overall 5 Years LEP 738 4.88 23.98 50.14 21.00 6 Overall 6 Years LEP or More 2789 5.45 24.42 52.24 17.89 6 Overall Arabic 204 37.75 22.55 27.94 11.76 6 Overall Bengali 174 11.49 20.11 41.95 26.44 6 Overall Chinese 134 24.63 28.36 35.07 11.94 6 Overall English 563 14.56 25.04 39.61 20.78 6 Overall Spanish 6941 22.24 27.27 37.83 12.65 6 Overall Language Missing 884 16.18 19.68 38.01 26.13 6 Overall Other Language 2213 17.71 24.81 37.01 20.47 6 Overall Students with Disabilities 1827 18.17 39.46 35.91 6.46

2006 NYSESLAT Technical Manual
Page 275
I.8: Grade 7 Listening/Speaking (LS)
Proficiency Levels Grade Test Group N-count1 2 3 4
7 LS Female 5769 8.96 15.83 35.90 39.31 7 LS Male 6605 8.75 16.35 39.39 35.50 7 LS Asian 1897 8.17 19.72 36.53 35.58 7 LS Black or African American 737 3.80 14.52 47.22 34.46 7 LS Hispanic or Latino 8732 10.04 16.10 37.61 36.25 7 LS Native American Indian/Alaska Native 21 9.52 9.52 23.81 57.14 7 LS Native Hawaiian/Other Pacific Islander 7 42.86 28.57 28.57 7 LS White 980 3.37 10.31 34.80 51.53 7 LS NYC 9276 9.24 16.15 38.61 36.01 7 LS Big 4 Cities 699 7.30 13.02 40.34 39.34 7 LS High Need Urban/Suburban 970 10.31 18.56 32.27 38.87 7 LS High Need Rural 81 6.17 12.35 44.44 37.04 7 LS Average Need 922 6.83 16.92 33.41 42.84 7 LS Low Need 422 4.50 13.74 35.78 45.97 7 LS Charter Schools 4 50.00 50.00 7 LS 0 Years LEP 592 17.57 22.80 32.43 27.20 7 LS 1 Years LEP 1877 21.47 36.60 29.94 11.99 7 LS 2 Years LEP 1456 6.46 26.30 41.07 26.17 7 LS 3 Years LEP 1263 2.53 15.12 44.34 38.00 7 LS 4 Years LEP 1050 0.95 7.62 43.62 47.81 7 LS 5 Years LEP 837 1.55 3.35 38.95 56.15 7 LS 6 Years LEP or More 3248 0.74 2.89 40.89 55.48 7 LS Arabic 225 9.78 22.67 37.78 29.78 7 LS Bengali 213 2.82 21.13 33.80 42.25 7 LS Chinese 150 6.00 24.67 37.33 32.00 7 LS English 563 3.91 9.59 38.01 48.49 7 LS Spanish 7884 10.34 16.17 37.77 35.72 7 LS Language Missing 817 7.22 16.52 37.94 38.31 7 LS Other Language 2522 6.42 15.70 37.99 39.89 7 LS Students with Disabilities 1694 3.72 9.98 51.30 35.01

2006 NYSESLAT Technical Manual
Page 276
I.8: Grade 7 Reading/Writing (RW)
Proficiency Levels Grade Test Group N-count1 2 3 4
7 RW Female 5769 21.41 31.48 27.27 19.85 7 RW Male 6605 23.48 34.99 26.89 14.64 7 RW Asian 1897 21.51 28.68 27.83 21.98 7 RW Black or African American 737 20.35 35.69 29.04 14.93 7 RW Hispanic or Latino 8732 23.82 34.93 26.18 15.07 7 RW Native American Indian/Alaska Native 21 14.29 23.81 38.10 23.81 7 RW Native Hawaiian/Other Pacific Islander 7 28.57 14.29 14.29 42.86 7 RW White 980 14.59 26.94 31.84 26.63 7 RW NYC 9276 23.09 34.59 26.79 15.52 7 RW Big 4 Cities 699 22.75 33.33 28.61 15.31 7 RW High Need Urban/Suburban 970 24.54 30.41 27.53 17.53 7 RW High Need Rural 81 20.99 28.40 34.57 16.05 7 RW Average Need 922 18.55 29.28 26.90 25.27 7 RW Low Need 422 13.98 22.51 28.44 35.07 7 RW Charter Schools 4 50.00 25.00 25.00 7 RW 0 Years LEP 592 34.63 33.78 20.27 11.32 7 RW 1 Years LEP 1877 47.84 31.33 12.79 8.04 7 RW 2 Years LEP 1456 27.68 35.58 21.70 15.04 7 RW 3 Years LEP 1263 14.96 34.92 28.50 21.62 7 RW 4 Years LEP 1050 8.86 32.67 33.24 25.24 7 RW 5 Years LEP 837 6.33 32.02 36.32 25.33 7 RW 6 Years LEP or More 3248 6.34 35.13 37.96 20.57 7 RW Arabic 225 35.11 34.67 20.89 9.33 7 RW Bengali 213 20.66 30.05 25.35 23.94 7 RW Chinese 150 21.33 30.67 22.67 25.33 7 RW English 563 14.21 33.21 31.44 21.14 7 RW Spanish 7884 24.24 35.03 25.98 14.75 7 RW Language Missing 817 19.09 33.54 28.76 18.60 7 RW Other Language 2522 19.19 28.39 29.90 22.52 7 RW Students with Disabilities 1694 22.37 47.11 23.38 7.14

2006 NYSESLAT Technical Manual
Page 277
I.8: Grade 7 Overall
Proficiency Levels Grade Test Group N-count1 2 3 4
7 Overall Female 5769 21.96 31.58 29.97 16.48 7 Overall Male 6605 24.24 34.99 29.34 11.43 7 Overall Asian 1897 21.88 29.63 31.26 17.24 7 Overall Black or African American 737 21.30 35.82 32.29 10.58 7 Overall Hispanic or Latino 8732 24.58 34.76 28.52 12.15 7 Overall Native American Indian/Alaska Native 21 14.29 23.81 42.86 19.05 7 Overall Native Hawaiian/Other Pacific Islander 7 28.57 28.57 14.29 28.57 7 Overall White 980 14.80 27.04 34.29 23.88 7 Overall NYC 9276 23.84 34.65 29.05 12.46 7 Overall Big 4 Cities 699 23.18 33.19 31.04 12.59 7 Overall High Need Urban/Suburban 970 24.95 30.72 30.00 14.33 7 Overall High Need Rural 81 20.99 28.40 38.27 12.35 7 Overall Average Need 922 19.20 28.74 30.80 21.26 7 Overall Low Need 422 13.98 23.46 35.07 27.49 7 Overall Charter Schools 4 50.00 25.00 25.00 7 Overall 0 Years LEP 592 35.81 33.11 22.80 8.28 7 Overall 1 Years LEP 1877 48.80 31.43 14.22 5.54 7 Overall 2 Years LEP 1456 28.09 36.13 23.08 12.71 7 Overall 3 Years LEP 1263 15.12 35.63 31.83 17.42 7 Overall 4 Years LEP 1050 9.24 32.95 37.33 20.48 7 Overall 5 Years LEP 837 7.05 31.90 40.50 20.55 7 Overall 6 Years LEP or More 3248 6.80 35.16 41.13 16.90 7 Overall Arabic 225 35.56 34.22 21.33 8.89 7 Overall Bengali 213 20.66 30.99 27.70 20.66 7 Overall Chinese 150 21.33 32.00 27.33 19.33 7 Overall English 563 14.92 33.21 34.28 17.58 7 Overall Spanish 7884 24.99 34.91 28.21 11.90 7 Overall Language Missing 817 19.83 33.41 32.07 14.69 7 Overall Other Language 2522 19.67 28.95 33.31 18.08 7 Overall Students with Disabilities 1694 23.02 46.93 24.73 5.31

2006 NYSESLAT Technical Manual
Page 278
I.9: Grade 8 Listening/Speaking (LS)
Proficiency Levels Grade Test Group N-count1 2 3 4
8 LS Female 5661 10.23 20.63 29.34 39.80 8 LS Male 6611 10.45 21.10 30.45 38.00 8 LS Asian 2069 9.23 25.76 29.77 35.23 8 LS Black or African American 829 4.46 21.59 34.86 39.08 8 LS Hispanic or Latino 8334 12.08 20.30 29.87 37.75 8 LS Native American Indian/Alaska Native 14 50.00 50.00 8 LS Native Hawaiian/Other Pacific Islander 5 20.00 20.00 60.00 8 LS White 1021 3.43 15.48 26.64 54.46 8 LS NYC 9403 10.79 20.98 30.09 38.14 8 LS Big 4 Cities 581 5.68 21.17 32.01 41.14 8 LS High Need Urban/Suburban 900 13.22 22.00 26.89 37.89 8 LS High Need Rural 72 6.94 18.06 26.39 48.61 8 LS Average Need 894 8.50 19.80 28.41 43.29 8 LS Low Need 415 5.30 19.04 33.73 41.93 8 LS Charter Schools 6 50.00 50.00 8 LS 0 Years LEP 852 10.92 20.19 30.52 38.38 8 LS 1 Years LEP 2112 23.67 37.55 22.87 15.91 8 LS 2 Years LEP 1509 10.14 33.33 31.08 25.45 8 LS 3 Years LEP 1354 3.91 23.86 35.08 37.15 8 LS 4 Years LEP 1090 0.64 13.21 33.21 52.94 8 LS 5 Years LEP 839 0.36 8.46 35.04 56.14 8 LS 6 Years LEP or More 2512 1.07 4.94 31.29 62.70 8 LS Arabic 263 9.13 27.38 29.66 33.84 8 LS Bengali 192 4.69 18.75 33.85 42.71 8 LS Chinese 207 11.11 37.20 30.43 21.26 8 LS English 573 4.01 18.67 29.49 47.82 8 LS Spanish 7567 12.25 20.25 29.88 37.62 8 LS Language Missing 755 10.60 20.79 28.74 39.87 8 LS Other Language 2715 6.78 21.44 30.24 41.55 8 LS Students with Disabilities 1561 3.07 14.67 43.31 38.95

2006 NYSESLAT Technical Manual
Page 279
I.9: Grade 8 Reading/Writing (RW)
Proficiency Levels Grade Test Group N-count1 2 3 4
8 RW Female 5661 21.60 34.39 20.37 23.64 8 RW Male 6611 25.37 34.58 20.36 19.69 8 RW Asian 2069 22.67 32.77 20.69 23.88 8 RW Black or African American 829 22.32 37.64 17.97 22.07 8 RW Hispanic or Latino 8334 25.13 35.22 20.10 19.56 8 RW Native American Indian/Alaska Native 14 7.14 42.86 21.43 28.57 8 RW Native Hawaiian/Other Pacific Islander 5 60.00 40.00 8 RW White 1021 14.79 29.29 23.70 32.22 8 RW NYC 9403 24.27 35.72 20.42 19.59 8 RW Big 4 Cities 581 24.10 30.12 24.27 21.51 8 RW High Need Urban/Suburban 900 24.78 31.67 17.67 25.89 8 RW High Need Rural 72 16.67 43.06 18.06 22.22 8 RW Average Need 894 20.25 28.75 20.13 30.87 8 RW Low Need 415 14.70 30.12 20.00 35.18 8 RW Charter Schools 6 16.67 50.00 33.33 8 RW 0 Years LEP 852 24.77 35.56 24.06 15.61 8 RW 1 Years LEP 2112 44.84 33.85 10.84 10.46 8 RW 2 Years LEP 1509 30.22 38.90 14.05 16.83 8 RW 3 Years LEP 1354 19.20 37.74 20.38 22.67 8 RW 4 Years LEP 1090 9.91 31.83 25.78 32.48 8 RW 5 Years LEP 839 6.20 35.16 25.63 33.02 8 RW 6 Years LEP or More 2512 5.81 32.21 30.89 31.09 8 RW Arabic 263 32.32 36.12 17.11 14.45 8 RW Bengali 192 17.19 35.94 16.67 30.21 8 RW Chinese 207 36.23 29.95 15.94 17.87 8 RW English 573 16.06 32.98 24.26 26.70 8 RW Spanish 7567 25.29 35.65 20.10 18.95 8 RW Language Missing 755 22.91 29.67 19.87 27.55 8 RW Other Language 2715 19.45 33.00 21.33 26.22 8 RW Students with Disabilities 1561 22.61 47.79 20.18 9.42

2006 NYSESLAT Technical Manual
Page 280
I.9: Grade 8 Overall
Proficiency Levels Grade Test Group N-count1 2 3 4
8 Overall Female 5661 22.61 34.45 23.64 19.31 8 Overall Male 6611 26.29 34.61 23.11 15.99 8 Overall Asian 2069 23.39 33.74 24.36 18.51 8 Overall Black or African American 829 23.04 38.12 20.27 18.58 8 Overall Hispanic or Latino 8334 26.24 34.95 22.94 15.86 8 Overall Native American Indian/Alaska Native 14 7.14 42.86 28.57 21.43 8 Overall Native Hawaiian/Other Pacific Islander 5 60.00 40.00 8 Overall White 1021 15.18 29.58 27.03 28.21 8 Overall NYC 9403 25.37 35.64 22.96 16.03 8 Overall Big 4 Cities 581 24.44 30.64 28.74 16.18 8 Overall High Need Urban/Suburban 900 25.67 31.56 21.44 21.33 8 Overall High Need Rural 72 16.67 43.06 18.06 22.22 8 Overall Average Need 894 20.69 29.08 24.83 25.39 8 Overall Low Need 415 14.70 32.05 26.02 27.23 8 Overall Charter Schools 6 16.67 66.67 16.67 8 Overall 0 Years LEP 852 25.82 36.03 25.47 12.68 8 Overall 1 Years LEP 2112 46.31 33.66 12.59 7.43 8 Overall 2 Years LEP 1509 30.82 39.43 16.43 13.32 8 Overall 3 Years LEP 1354 19.50 38.48 23.78 18.24 8 Overall 4 Years LEP 1090 10.00 32.48 30.73 26.79 8 Overall 5 Years LEP 839 6.44 36.23 29.56 27.77 8 Overall 6 Years LEP or More 2512 6.53 32.13 35.07 26.27 8 Overall Arabic 263 32.32 36.88 19.01 11.79 8 Overall Bengali 192 18.23 36.46 19.79 25.52 8 Overall Chinese 207 36.23 31.40 21.26 11.11 8 Overall English 573 16.40 33.33 26.70 23.56 8 Overall Spanish 7567 26.46 35.35 22.94 15.25 8 Overall Language Missing 755 23.84 30.07 23.71 22.38 8 Overall Other Language 2715 20.15 33.63 24.53 21.69 8 Overall Students with Disabilities 1561 23.57 47.53 21.72 7.17

2006 NYSESLAT Technical Manual
Page 281
I.10: Grade 9 Listening/Speaking (LS)
Proficiency Levels Grade Test Group N-count1 2 3 4
9 LS Female 6615 14.72 29.63 29.51 26.14 9 LS Male 8010 15.19 29.51 29.65 25.64 9 LS Asian 2930 13.86 34.20 30.38 21.57 9 LS Black or African American 1175 9.87 30.72 33.79 25.62 9 LS Hispanic or Latino 9336 16.75 28.62 28.46 26.17 9 LS Native American Indian/Alaska Native 37 35.14 24.32 24.32 16.22 9 LS Native Hawaiian/Other Pacific Islander 9 44.44 44.44 11.11 9 LS White 1138 7.73 24.25 32.86 35.15 9 LS NYC 11171 15.03 29.11 30.11 25.75 9 LS Big 4 Cities 554 13.72 37.18 27.08 22.02 9 LS High Need Urban/Suburban 1174 18.40 30.83 27.17 23.59 9 LS High Need Rural 79 12.66 25.32 17.72 44.30 9 LS Average Need 1107 12.74 30.35 30.26 26.65 9 LS Low Need 531 12.99 27.87 26.93 32.20 9 LS Charter Schools 9 22.22 77.78 9 LS 0 Years LEP 1215 17.20 26.17 26.42 30.21 9 LS 1 Years LEP 3254 24.31 40.38 22.56 12.75 9 LS 2 Years LEP 1915 12.79 37.65 29.14 20.42 9 LS 3 Years LEP 1490 6.85 33.22 34.23 25.70 9 LS 4 Years LEP 1210 3.88 22.81 37.85 35.45 9 LS 5 Years LEP 904 2.77 19.47 39.27 38.50 9 LS 6 Years LEP or More 1800 3.28 11.61 39.22 45.89 9 LS Arabic 286 16.78 36.71 29.02 17.48 9 LS Bengali 303 12.54 34.98 31.68 20.79 9 LS Chinese 519 23.51 42.39 20.62 13.49 9 LS English 655 12.06 27.79 29.92 30.23 9 LS Spanish 8364 16.81 28.44 28.79 25.96 9 LS Language Missing 971 14.52 29.97 27.81 27.70 9 LS Other Language 3527 10.12 29.52 33.09 27.28 9 LS Students with Disabilities 1002 6.49 17.76 43.51 32.24
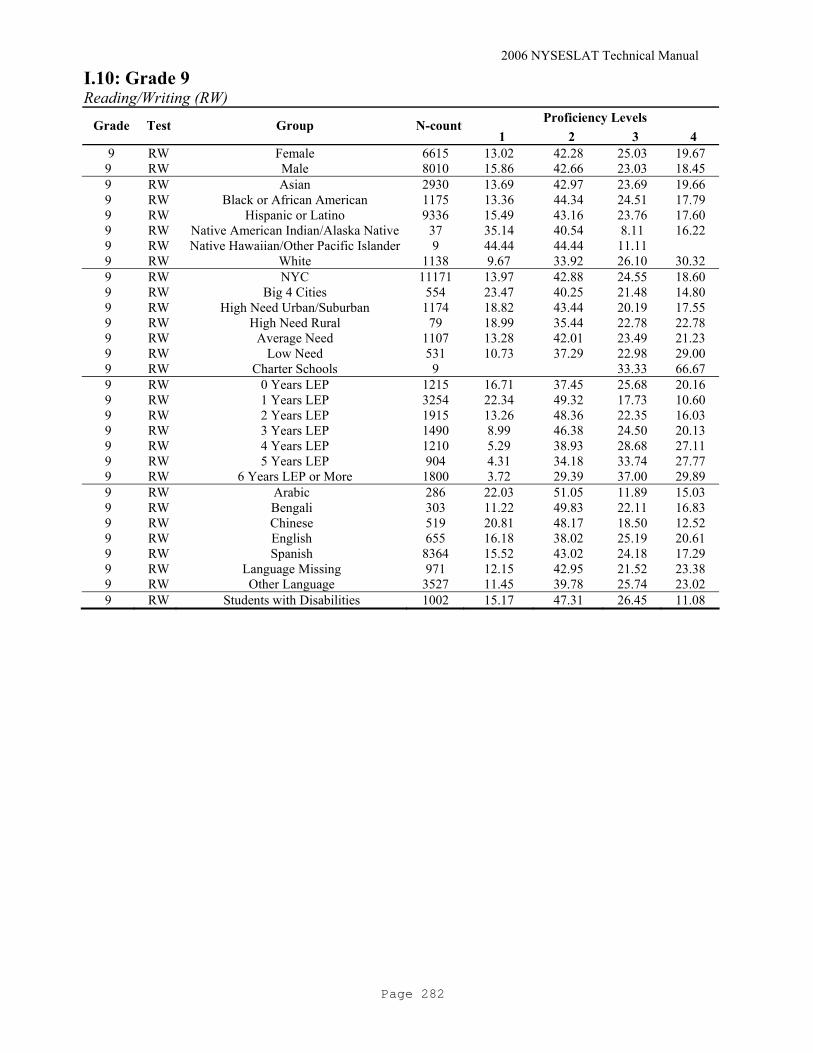
2006 NYSESLAT Technical Manual
Page 282
I.10: Grade 9 Reading/Writing (RW)
Proficiency Levels Grade Test Group N-count1 2 3 4
9 RW Female 6615 13.02 42.28 25.03 19.67 9 RW Male 8010 15.86 42.66 23.03 18.45 9 RW Asian 2930 13.69 42.97 23.69 19.66 9 RW Black or African American 1175 13.36 44.34 24.51 17.79 9 RW Hispanic or Latino 9336 15.49 43.16 23.76 17.60 9 RW Native American Indian/Alaska Native 37 35.14 40.54 8.11 16.22 9 RW Native Hawaiian/Other Pacific Islander 9 44.44 44.44 11.11 9 RW White 1138 9.67 33.92 26.10 30.32 9 RW NYC 11171 13.97 42.88 24.55 18.60 9 RW Big 4 Cities 554 23.47 40.25 21.48 14.80 9 RW High Need Urban/Suburban 1174 18.82 43.44 20.19 17.55 9 RW High Need Rural 79 18.99 35.44 22.78 22.78 9 RW Average Need 1107 13.28 42.01 23.49 21.23 9 RW Low Need 531 10.73 37.29 22.98 29.00 9 RW Charter Schools 9 33.33 66.67 9 RW 0 Years LEP 1215 16.71 37.45 25.68 20.16 9 RW 1 Years LEP 3254 22.34 49.32 17.73 10.60 9 RW 2 Years LEP 1915 13.26 48.36 22.35 16.03 9 RW 3 Years LEP 1490 8.99 46.38 24.50 20.13 9 RW 4 Years LEP 1210 5.29 38.93 28.68 27.11 9 RW 5 Years LEP 904 4.31 34.18 33.74 27.77 9 RW 6 Years LEP or More 1800 3.72 29.39 37.00 29.89 9 RW Arabic 286 22.03 51.05 11.89 15.03 9 RW Bengali 303 11.22 49.83 22.11 16.83 9 RW Chinese 519 20.81 48.17 18.50 12.52 9 RW English 655 16.18 38.02 25.19 20.61 9 RW Spanish 8364 15.52 43.02 24.18 17.29 9 RW Language Missing 971 12.15 42.95 21.52 23.38 9 RW Other Language 3527 11.45 39.78 25.74 23.02 9 RW Students with Disabilities 1002 15.17 47.31 26.45 11.08
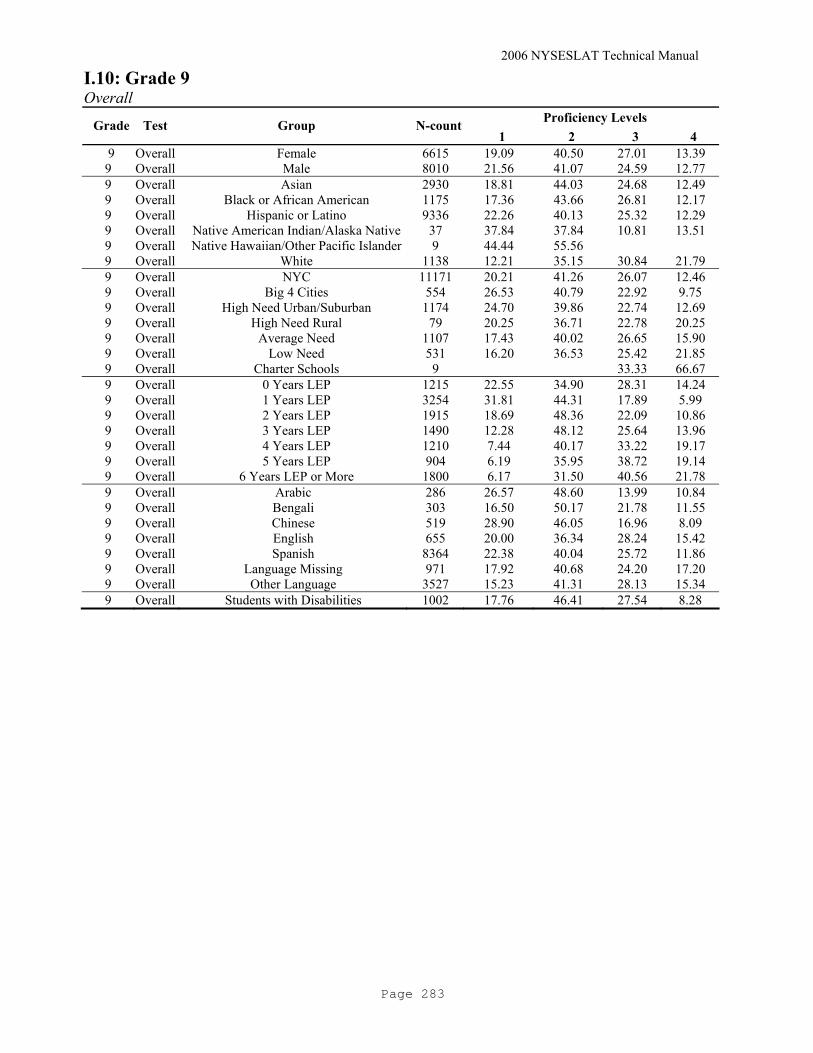
2006 NYSESLAT Technical Manual
Page 283
I.10: Grade 9 Overall
Proficiency Levels Grade Test Group N-count1 2 3 4
9 Overall Female 6615 19.09 40.50 27.01 13.39 9 Overall Male 8010 21.56 41.07 24.59 12.77 9 Overall Asian 2930 18.81 44.03 24.68 12.49 9 Overall Black or African American 1175 17.36 43.66 26.81 12.17 9 Overall Hispanic or Latino 9336 22.26 40.13 25.32 12.29 9 Overall Native American Indian/Alaska Native 37 37.84 37.84 10.81 13.51 9 Overall Native Hawaiian/Other Pacific Islander 9 44.44 55.56 9 Overall White 1138 12.21 35.15 30.84 21.79 9 Overall NYC 11171 20.21 41.26 26.07 12.46 9 Overall Big 4 Cities 554 26.53 40.79 22.92 9.75 9 Overall High Need Urban/Suburban 1174 24.70 39.86 22.74 12.69 9 Overall High Need Rural 79 20.25 36.71 22.78 20.25 9 Overall Average Need 1107 17.43 40.02 26.65 15.90 9 Overall Low Need 531 16.20 36.53 25.42 21.85 9 Overall Charter Schools 9 33.33 66.67 9 Overall 0 Years LEP 1215 22.55 34.90 28.31 14.24 9 Overall 1 Years LEP 3254 31.81 44.31 17.89 5.99 9 Overall 2 Years LEP 1915 18.69 48.36 22.09 10.86 9 Overall 3 Years LEP 1490 12.28 48.12 25.64 13.96 9 Overall 4 Years LEP 1210 7.44 40.17 33.22 19.17 9 Overall 5 Years LEP 904 6.19 35.95 38.72 19.14 9 Overall 6 Years LEP or More 1800 6.17 31.50 40.56 21.78 9 Overall Arabic 286 26.57 48.60 13.99 10.84 9 Overall Bengali 303 16.50 50.17 21.78 11.55 9 Overall Chinese 519 28.90 46.05 16.96 8.09 9 Overall English 655 20.00 36.34 28.24 15.42 9 Overall Spanish 8364 22.38 40.04 25.72 11.86 9 Overall Language Missing 971 17.92 40.68 24.20 17.20 9 Overall Other Language 3527 15.23 41.31 28.13 15.34 9 Overall Students with Disabilities 1002 17.76 46.41 27.54 8.28

2006 NYSESLAT Technical Manual
Page 284
I.11: Grade 10 Listening/Speaking (LS)
Proficiency Levels Grade Test Group N-count1 2 3 4
10 LS Female 6210 10.06 33.33 31.50 25.10 10 LS Male 6669 8.92 34.79 31.35 24.94 10 LS Asian 3313 8.81 41.14 29.07 20.98 10 LS Black or African American 1142 5.52 31.79 37.04 25.66 10 LS Hispanic or Latino 7456 11.17 32.28 31.22 25.32 10 LS Native American Indian/Alaska Native 25 20.00 32.00 28.00 20.00 10 LS Native Hawaiian/Other Pacific Islander 1 100.00 10 LS White 942 2.87 26.33 34.61 36.20 10 LS NYC 10072 9.91 33.81 31.47 24.81 10 LS Big 4 Cities 411 12.17 35.77 32.12 19.95 10 LS High Need Urban/Suburban 920 9.02 38.15 28.70 24.13 10 LS High Need Rural 47 8.51 27.66 34.04 29.79 10 LS Average Need 927 5.83 34.20 31.93 28.05 10 LS Low Need 497 6.24 31.39 33.80 28.57 10 LS Charter Schools 5 20.00 20.00 60.00 10 LS 0 Years LEP 637 11.93 30.93 29.51 27.63 10 LS 1 Years LEP 2695 14.69 46.75 23.97 14.58 10 LS 2 Years LEP 2242 7.58 42.28 30.33 19.80 10 LS 3 Years LEP 1545 5.24 34.50 33.40 26.86 10 LS 4 Years LEP 1068 3.65 25.19 39.61 31.55 10 LS 5 Years LEP 848 2.71 23.11 39.98 34.20 10 LS 6 Years LEP or More 1632 2.39 14.77 39.71 43.14 10 LS Arabic 217 4.15 32.26 36.41 27.19 10 LS Bengali 304 6.25 36.18 33.88 23.68 10 LS Chinese 539 10.39 51.58 26.16 11.87 10 LS English 566 5.30 32.51 33.22 28.98 10 LS Spanish 6765 11.50 31.60 31.44 25.45 10 LS Language Missing 758 6.73 35.09 30.61 27.57 10 LS Other Language 3730 7.43 36.03 31.55 24.99 10 LS Students with Disabilities 733 7.23 21.83 42.70 28.24

2006 NYSESLAT Technical Manual
Page 285
I.11: Grade 10 Reading/Writing (RW)
Proficiency Levels Grade Test Group N-count1 2 3 4
10 RW Female 6210 8.34 39.24 29.42 23.00 10 RW Male 6669 8.82 41.06 28.06 22.07 10 RW Asian 3313 8.81 41.02 26.83 23.33 10 RW Black or African American 1142 7.97 40.46 29.95 21.63 10 RW Hispanic or Latino 7456 9.04 40.96 29.22 20.78 10 RW Native American Indian/Alaska Native 25 16.00 52.00 20.00 12.00 10 RW Native Hawaiian/Other Pacific Islander 1 100.00 10 RW White 942 4.78 30.36 30.04 34.82 10 RW NYC 10072 8.49 40.08 29.11 22.32 10 RW Big 4 Cities 411 18.25 37.71 26.03 18.00 10 RW High Need Urban/Suburban 920 9.02 47.93 24.89 18.15 10 RW High Need Rural 47 10.64 42.55 31.91 14.89 10 RW Average Need 927 7.34 36.46 28.91 27.29 10 RW Low Need 497 4.02 37.02 28.97 29.98 10 RW Charter Schools 5 60.00 40.00 10 RW 0 Years LEP 637 10.68 40.35 23.55 25.43 10 RW 1 Years LEP 2695 13.73 48.31 23.04 14.92 10 RW 2 Years LEP 2242 6.78 45.81 27.16 20.25 10 RW 3 Years LEP 1545 5.89 39.48 30.23 24.40 10 RW 4 Years LEP 1068 3.65 32.49 34.64 29.21 10 RW 5 Years LEP 848 2.71 30.07 36.91 30.31 10 RW 6 Years LEP or More 1632 2.14 26.65 37.81 33.39 10 RW Arabic 217 8.29 43.78 29.03 18.89 10 RW Bengali 304 6.58 43.09 29.28 21.05 10 RW Chinese 539 10.02 48.98 25.23 15.77 10 RW English 566 8.13 39.93 27.56 24.38 10 RW Spanish 6765 9.15 40.75 29.58 20.52 10 RW Language Missing 758 5.67 38.92 28.10 27.31 10 RW Other Language 3730 8.20 37.72 27.88 26.19 10 RW Students with Disabilities 733 12.14 43.66 29.20 15.01

2006 NYSESLAT Technical Manual
Page 286
I.11: Grade 10 Overall
Proficiency Levels Grade Test Group N-count1 2 3 4
10 Overall Female 6210 13.38 42.27 29.89 14.46 10 Overall Male 6669 13.02 44.76 28.37 13.86 10 Overall Asian 3313 12.65 47.84 25.69 13.82 10 Overall Black or African American 1142 10.86 44.48 31.26 13.40 10 Overall Hispanic or Latino 7456 14.62 42.45 29.75 13.18 10 Overall Native American Indian/Alaska Native 25 20.00 48.00 24.00 8.00 10 Overall Native Hawaiian/Other Pacific Islander 1 100.00 10 Overall White 942 6.48 35.99 33.55 23.99 10 Overall NYC 10072 13.50 43.61 29.15 13.74 10 Overall Big 4 Cities 411 21.90 41.12 27.25 9.73 10 Overall High Need Urban/Suburban 920 12.50 49.24 25.43 12.83 10 Overall High Need Rural 47 14.89 38.30 31.91 14.89 10 Overall Average Need 927 9.39 41.32 30.64 18.66 10 Overall Low Need 497 8.05 39.03 33.20 19.72 10 Overall Charter Schools 5 20.00 40.00 40.00 10 Overall 0 Years LEP 637 15.86 40.50 27.63 16.01 10 Overall 1 Years LEP 2695 20.78 50.54 20.41 8.27 10 Overall 2 Years LEP 2242 10.88 51.29 26.23 11.60 10 Overall 3 Years LEP 1545 8.61 44.40 31.13 15.86 10 Overall 4 Years LEP 1068 6.27 37.83 37.64 18.26 10 Overall 5 Years LEP 848 4.36 37.50 39.03 19.10 10 Overall 6 Years LEP or More 1632 4.11 30.51 42.34 23.04 10 Overall Arabic 217 10.60 46.08 32.72 10.60 10 Overall Bengali 304 10.86 46.38 27.96 14.80 10 Overall Chinese 539 13.54 58.07 21.71 6.68 10 Overall English 566 9.72 42.58 28.98 18.73 10 Overall Spanish 6765 14.97 41.94 30.16 12.93 10 Overall Language Missing 758 8.71 44.46 29.42 17.41 10 Overall Other Language 3730 11.69 43.99 28.10 16.22 10 Overall Students with Disabilities 733 15.42 44.34 30.15 10.10

2006 NYSESLAT Technical Manual
Page 287
I.12: Grade 11 Listening/Speaking (LS)
Proficiency Levels Grade Test Group N-count1 2 3 4
11 LS Female 3515 5.58 35.36 33.97 25.09 11 LS Male 3394 5.42 32.76 34.94 26.87 11 LS Asian 1719 3.72 37.06 34.61 24.61 11 LS Black or African American 652 2.91 31.13 40.18 25.77 11 LS Hispanic or Latino 3911 7.39 34.80 33.19 24.62 11 LS Native American Indian/Alaska Native 15 46.67 40.00 13.33 11 LS White 612 1.31 24.02 35.78 38.89 11 LS NYC 4844 6.32 34.33 34.56 24.79 11 LS Big 4 Cities 247 8.10 34.41 35.63 21.86 11 LS High Need Urban/Suburban 599 4.01 33.89 34.56 27.55 11 LS High Need Rural 38 5.26 34.21 36.84 23.68 11 LS Average Need 785 2.80 37.20 31.59 28.41 11 LS Low Need 393 1.53 25.19 37.91 35.37 11 LS Charter Schools 3 100.00 11 LS 0 Years LEP 381 7.09 35.70 29.92 27.30 11 LS 1 Years LEP 1021 11.17 47.31 25.86 15.67 11 LS 2 Years LEP 1195 4.44 40.75 30.71 24.10 11 LS 3 Years LEP 1096 3.38 36.22 36.04 24.36 11 LS 4 Years LEP 734 2.18 29.56 39.37 28.88 11 LS 5 Years LEP 508 3.15 26.57 39.96 30.31 11 LS 6 Years LEP or More 832 2.28 18.27 41.35 38.10 11 LS Arabic 103 1.94 22.33 50.49 25.24 11 LS Bengali 123 1.63 36.59 39.84 21.95 11 LS Chinese 256 4.69 49.61 32.03 13.67 11 LS English 512 2.93 31.64 33.59 31.84 11 LS Spanish 3321 8.07 35.23 32.82 23.88 11 LS Language Missing 557 2.87 32.14 34.47 30.52 11 LS Other Language 2037 3.19 31.86 36.48 28.47 11 LS Students with Disabilities 396 7.83 31.57 39.90 20.71

2006 NYSESLAT Technical Manual
Page 288
I.12: Grade 11 Reading/Writing (RW)
Proficiency Levels Grade Test Group N-count1 2 3 4
11 RW Female 3515 4.61 44.67 26.06 24.67 11 RW Male 3394 5.13 41.54 27.93 25.40 11 RW Asian 1719 2.85 41.24 26.53 29.38 11 RW Black or African American 652 3.83 43.87 27.45 24.85 11 RW Hispanic or Latino 3911 6.29 45.18 26.77 21.76 11 RW Native American Indian/Alaska Native 15 66.67 20.00 13.33 11 RW White 612 2.61 33.99 29.25 34.15 11 RW NYC 4844 5.14 43.56 27.37 23.93 11 RW Big 4 Cities 247 9.72 53.04 23.48 13.77 11 RW High Need Urban/Suburban 599 4.84 43.91 27.71 23.54 11 RW High Need Rural 38 2.63 55.26 21.05 21.05 11 RW Average Need 785 2.93 41.78 25.99 29.30 11 RW Low Need 393 2.54 32.32 25.70 39.44 11 RW Charter Schools 3 33.33 66.67 11 RW 0 Years LEP 381 5.25 43.31 25.98 25.46 11 RW 1 Years LEP 1021 10.68 49.76 20.37 19.20 11 RW 2 Years LEP 1195 3.77 48.28 25.69 22.26 11 RW 3 Years LEP 1096 3.10 44.80 26.28 25.82 11 RW 4 Years LEP 734 2.04 40.60 31.34 26.02 11 RW 5 Years LEP 508 1.57 38.98 33.07 26.38 11 RW 6 Years LEP or More 832 2.52 31.37 33.65 32.45 11 RW Arabic 103 2.91 47.57 27.18 22.33 11 RW Bengali 123 0.81 47.97 24.39 26.83 11 RW Chinese 256 3.91 42.97 30.08 23.05 11 RW English 512 4.88 42.19 25.78 27.15 11 RW Spanish 3321 6.93 45.53 26.44 21.11 11 RW Language Missing 557 1.80 40.22 28.37 29.62 11 RW Other Language 2037 2.80 39.76 27.54 29.90 11 RW Students with Disabilities 396 14.39 53.54 19.44 12.63
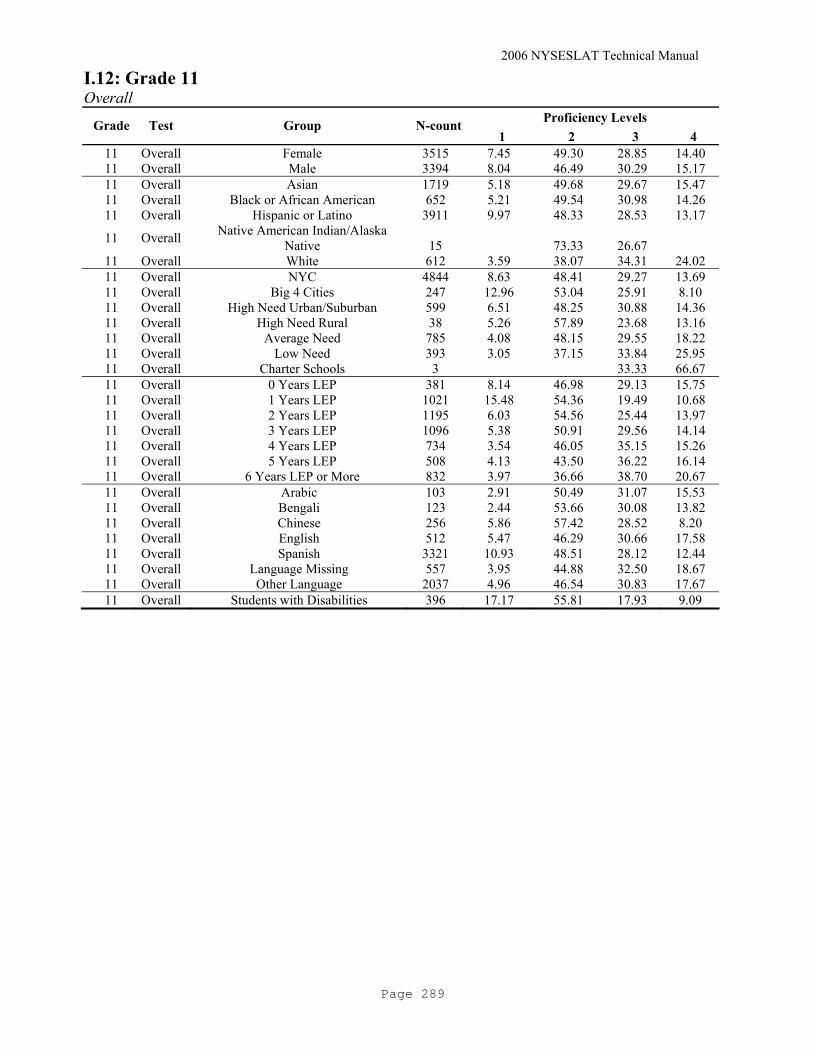
2006 NYSESLAT Technical Manual
Page 289
I.12: Grade 11 Overall
Proficiency Levels Grade Test Group N-count1 2 3 4
11 Overall Female 3515 7.45 49.30 28.85 14.40 11 Overall Male 3394 8.04 46.49 30.29 15.17 11 Overall Asian 1719 5.18 49.68 29.67 15.47 11 Overall Black or African American 652 5.21 49.54 30.98 14.26 11 Overall Hispanic or Latino 3911 9.97 48.33 28.53 13.17
11 Overall Native American Indian/Alaska Native 15 73.33 26.67
11 Overall White 612 3.59 38.07 34.31 24.02 11 Overall NYC 4844 8.63 48.41 29.27 13.69 11 Overall Big 4 Cities 247 12.96 53.04 25.91 8.10 11 Overall High Need Urban/Suburban 599 6.51 48.25 30.88 14.36 11 Overall High Need Rural 38 5.26 57.89 23.68 13.16 11 Overall Average Need 785 4.08 48.15 29.55 18.22 11 Overall Low Need 393 3.05 37.15 33.84 25.95 11 Overall Charter Schools 3 33.33 66.67 11 Overall 0 Years LEP 381 8.14 46.98 29.13 15.75 11 Overall 1 Years LEP 1021 15.48 54.36 19.49 10.68 11 Overall 2 Years LEP 1195 6.03 54.56 25.44 13.97 11 Overall 3 Years LEP 1096 5.38 50.91 29.56 14.14 11 Overall 4 Years LEP 734 3.54 46.05 35.15 15.26 11 Overall 5 Years LEP 508 4.13 43.50 36.22 16.14 11 Overall 6 Years LEP or More 832 3.97 36.66 38.70 20.67 11 Overall Arabic 103 2.91 50.49 31.07 15.53 11 Overall Bengali 123 2.44 53.66 30.08 13.82 11 Overall Chinese 256 5.86 57.42 28.52 8.20 11 Overall English 512 5.47 46.29 30.66 17.58 11 Overall Spanish 3321 10.93 48.51 28.12 12.44 11 Overall Language Missing 557 3.95 44.88 32.50 18.67 11 Overall Other Language 2037 4.96 46.54 30.83 17.67 11 Overall Students with Disabilities 396 17.17 55.81 17.93 9.09

2006 NYSESLAT Technical Manual
Page 290
I.13: Grade 12 Listening/Speaking (LS)
Proficiency Levels Grade Test Group N-count1 2 3 4
12 LS Female 1412 5.74 44.26 26.63 23.37 12 LS Male 1348 4.97 39.99 28.56 26.48 12 LS Asian 614 4.40 49.19 23.29 23.13 12 LS Black or African American 275 1.82 42.55 28.73 26.91 12 LS Hispanic or Latino 1630 6.87 41.53 28.28 23.31 12 LS Native American Indian/Alaska Native 12 41.67 33.33 25.00 12 LS Native Hawaiian/Other Pacific Islander 1 100.00 12 LS White 228 1.75 27.63 32.02 38.60 12 LS NYC 1812 6.35 46.96 26.10 20.58 12 LS Big 4 Cities 95 12.63 41.05 26.32 20.00 12 LS High Need Urban/Suburban 250 3.20 30.00 32.40 34.40 12 LS High Need Rural 27 3.70 40.74 25.93 29.63 12 LS Average Need 368 2.17 33.42 33.15 31.25 12 LS Low Need 204 1.96 31.86 25.00 41.18 12 LS Charter Schools 4 50.00 50.00 12 LS 0 Years LEP 109 4.59 29.36 37.61 28.44 12 LS 1 Years LEP 277 9.39 44.77 23.10 22.74 12 LS 2 Years LEP 431 7.66 47.80 25.52 19.03 12 LS 3 Years LEP 428 4.21 43.69 25.93 26.17 12 LS 4 Years LEP 366 3.83 47.54 25.41 23.22 12 LS 5 Years LEP 248 3.63 43.55 25.81 27.02 12 LS 6 Years LEP or More 381 3.94 40.16 28.61 27.30 12 LS Arabic 40 5.00 32.50 37.50 25.00 12 LS Bengali 59 3.39 57.63 27.12 11.86 12 LS Chinese 72 6.94 54.17 15.28 23.61 12 LS English 225 1.78 34.22 30.22 33.78 12 LS Spanish 1340 7.84 43.43 27.16 21.57 12 LS Language Missing 283 3.53 31.80 32.86 31.80 12 LS Other Language 741 2.70 44.40 26.18 26.72 12 LS Students with Disabilities 244 9.84 41.39 31.15 17.62

2006 NYSESLAT Technical Manual
Page 291
I.13: Grade 12 Reading/Writing (RW)
Proficiency Levels Grade Test Group N-count1 2 3 4
12 RW Female 1412 4.82 51.35 23.65 20.18 12 RW Male 1348 4.82 49.78 22.03 23.37 12 RW Asian 614 2.77 52.77 21.17 23.29 12 RW Black or African American 275 5.45 53.45 21.45 19.64 12 RW Hispanic or Latino 1630 5.34 50.67 22.76 21.23 12 RW Native American Indian/Alaska Native 12 8.33 58.33 33.33 12 RW Native Hawaiian/Other Pacific Islander 1 100.00 12 RW White 228 5.70 40.35 28.95 25.00 12 RW NYC 1812 6.02 56.68 21.19 16.11 12 RW Big 4 Cities 95 10.53 52.63 20.00 16.84 12 RW High Need Urban/Suburban 250 3.20 42.00 25.60 29.20 12 RW High Need Rural 27 3.70 33.33 29.63 33.33 12 RW Average Need 368 1.36 38.04 26.36 34.24 12 RW Low Need 204 31.37 28.43 40.20 12 RW Charter Schools 4 25.00 25.00 50.00 12 RW 0 Years LEP 109 5.50 41.28 22.02 31.19 12 RW 1 Years LEP 277 7.22 49.46 23.47 19.86 12 RW 2 Years LEP 431 5.57 52.44 20.42 21.58 12 RW 3 Years LEP 428 3.50 52.80 22.20 21.50 12 RW 4 Years LEP 366 3.83 51.37 25.96 18.85 12 RW 5 Years LEP 248 3.63 53.23 21.77 21.37 12 RW 6 Years LEP or More 381 3.94 50.92 25.20 19.95 12 RW Arabic 40 2.50 65.00 17.50 15.00 12 RW Bengali 59 5.08 67.80 18.64 8.47 12 RW Chinese 72 4.17 52.78 16.67 26.39 12 RW English 225 2.22 41.78 24.44 31.56 12 RW Spanish 1340 6.27 54.03 21.87 17.84 12 RW Language Missing 283 2.12 32.86 27.56 37.46 12 RW Other Language 741 4.18 51.42 23.62 20.78 12 RW Students with Disabilities 244 19.26 59.02 16.39 5.33
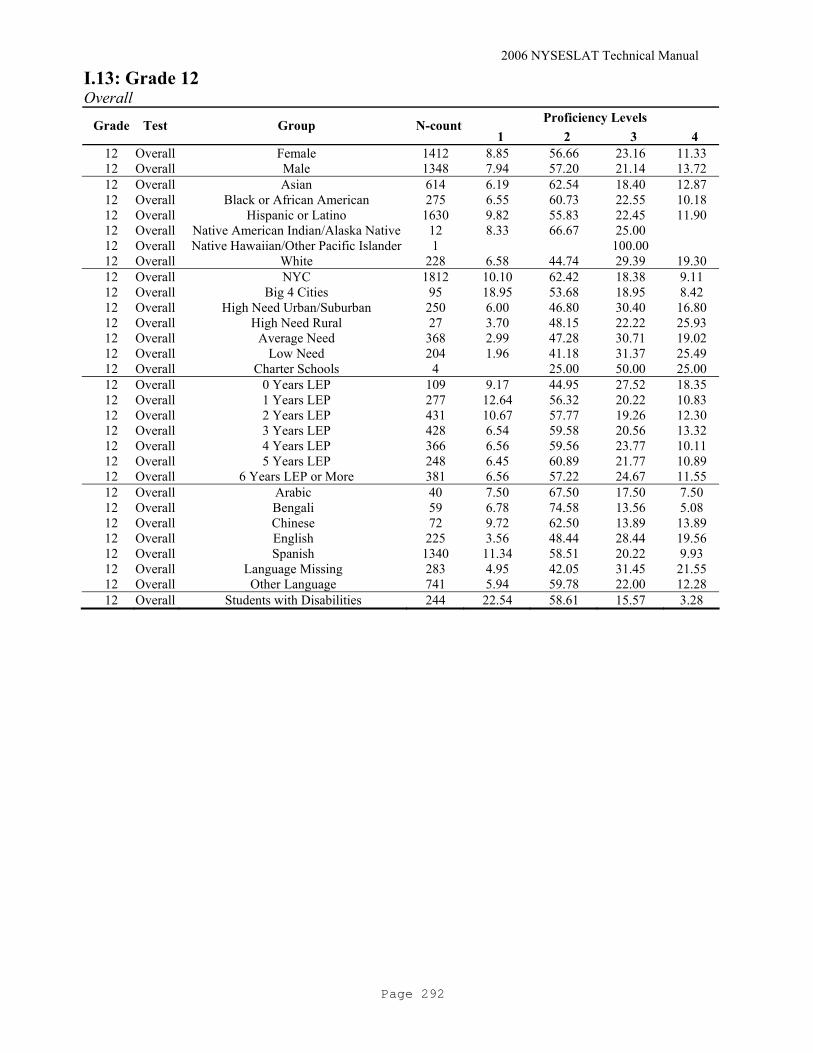
2006 NYSESLAT Technical Manual
Page 292
I.13: Grade 12 Overall
Proficiency Levels Grade Test Group N-count1 2 3 4
12 Overall Female 1412 8.85 56.66 23.16 11.33 12 Overall Male 1348 7.94 57.20 21.14 13.72 12 Overall Asian 614 6.19 62.54 18.40 12.87 12 Overall Black or African American 275 6.55 60.73 22.55 10.18 12 Overall Hispanic or Latino 1630 9.82 55.83 22.45 11.90 12 Overall Native American Indian/Alaska Native 12 8.33 66.67 25.00 12 Overall Native Hawaiian/Other Pacific Islander 1 100.00 12 Overall White 228 6.58 44.74 29.39 19.30 12 Overall NYC 1812 10.10 62.42 18.38 9.11 12 Overall Big 4 Cities 95 18.95 53.68 18.95 8.42 12 Overall High Need Urban/Suburban 250 6.00 46.80 30.40 16.80 12 Overall High Need Rural 27 3.70 48.15 22.22 25.93 12 Overall Average Need 368 2.99 47.28 30.71 19.02 12 Overall Low Need 204 1.96 41.18 31.37 25.49 12 Overall Charter Schools 4 25.00 50.00 25.00 12 Overall 0 Years LEP 109 9.17 44.95 27.52 18.35 12 Overall 1 Years LEP 277 12.64 56.32 20.22 10.83 12 Overall 2 Years LEP 431 10.67 57.77 19.26 12.30 12 Overall 3 Years LEP 428 6.54 59.58 20.56 13.32 12 Overall 4 Years LEP 366 6.56 59.56 23.77 10.11 12 Overall 5 Years LEP 248 6.45 60.89 21.77 10.89 12 Overall 6 Years LEP or More 381 6.56 57.22 24.67 11.55 12 Overall Arabic 40 7.50 67.50 17.50 7.50 12 Overall Bengali 59 6.78 74.58 13.56 5.08 12 Overall Chinese 72 9.72 62.50 13.89 13.89 12 Overall English 225 3.56 48.44 28.44 19.56 12 Overall Spanish 1340 11.34 58.51 20.22 9.93 12 Overall Language Missing 283 4.95 42.05 31.45 21.55 12 Overall Other Language 741 5.94 59.78 22.00 12.28 12 Overall Students with Disabilities 244 22.54 58.61 15.57 3.28

2006 NYSESLAT Technical Manual
Page 293
APPENDIX J: EXIT RATE BY SUBGROUP
J.1: Kindergarten (K) Grade Group N-count Percent
K Female 695 6.09 K Male 570 4.42 K Asian 531 9.79 K Black or African American 44 4.93 K Hispanic or Latino 471 3.03 K Native American Indian/Alaska Native 1 2.56 K Native Hawaiian/Other Pacific Islander 1 12.50 K White 217 8.99 K NYC 1008 6.40 K Big 4 Cities 25 2.13 K High Need Urban/Suburban 59 2.01 K High Need Rural 4 2.12 K Average Need 94 3.46 K Low Need 71 4.92 K Charter Schools 4 3.85 K 0 Years LEP 124 3.18 K 1 Years LEP 863 5.71 K Arabic 38 7.87 K Bengali 55 9.26 K Chinese 77 10.42 K English 74 3.30 K Spanish 474 3.59 K Language Missing 65 2.92 K Other Language 482 10.05 K Students with Disabilities 28 1.48

2006 NYSESLAT Technical Manual
Page 294
J.2: Grade 1 Grade Group N-count Percent
1 Female 2194 18.23 1 Male 1972 14.36 1 Asian 1196 25.47 1 Black or African American 121 10.92 1 Hispanic or Latino 2181 12.51 1 Native American Indian/Alaska Native 6 15.38 1 Native Hawaiian/Other Pacific Islander 4 50.00 1 White 658 26.49 1 NYC 2733 15.91 1 Big 4 Cities 113 8.57 1 High Need Urban/Suburban 376 12.62 1 High Need Rural 25 16.13 1 Average Need 545 20.99 1 Low Need 360 25.03 1 Charter Schools 14 13.08 1 0 Years LEP 113 12.31 1 1 Years LEP 872 15.16 1 2 Years LEP 2595 17.30 1 Arabic 83 17.44 1 Bengali 154 24.84 1 Chinese 168 28.14 1 English 342 16.63 1 Spanish 1786 12.15 1 Language Missing 397 16.72 1 Other Language 1236 24.99 1 Students with Disabilities 165 6.02

2006 NYSESLAT Technical Manual
Page 295
J.3: Grade 2 Grade Group N-count Percent
2 Female 2169 20.02 2 Male 1912 15.45 2 Asian 1088 28.23 2 Black or African American 131 12.68 2 Hispanic or Latino 2304 14.22 2 Native American Indian/Alaska Native 9 17.31 2 Native Hawaiian/Other Pacific Islander 4 44.44 2 White 545 26.46 2 NYC 2433 15.22 2 Big 4 Cities 182 15.45 2 High Need Urban/Suburban 504 18.95 2 High Need Rural 29 21.97 2 Average Need 538 26.07 2 Low Need 377 33.99 2 Charter Schools 18 22.50 2 0 Years LEP 98 16.12 2 1 Years LEP 294 12.80 2 2 Years LEP 939 20.83 2 3 Years LEP 2235 17.73 2 Arabic 74 15.38 2 Bengali 138 28.05 2 Chinese 105 26.12 2 English 339 22.26 2 Spanish 1865 13.36 2 Language Missing 481 23.79 2 Other Language 1079 24.96 2 Students with Disabilities 185 5.74

2006 NYSESLAT Technical Manual
Page 296
J.4: Grade 3 Grade Group N-count Percent
3 Female 1844 21.03 3 Male 1848 18.02 3 Asian 772 26.58 3 Black or African American 134 14.06 3 Hispanic or Latino 2333 17.27 3 Native American Indian/Alaska Native 9 27.27 3 White 444 27.41 3 NYC 2493 18.28 3 Big 4 Cities 131 14.13 3 High Need Urban/Suburban 366 18.72 3 High Need Rural 23 20.00 3 Average Need 413 27.01 3 Low Need 253 32.11 3 Charter Schools 13 18.31 3 0 Years LEP 69 13.56 3 1 Years LEP 176 9.79 3 2 Years LEP 367 20.90 3 3 Years LEP 810 24.39 3 4 Years LEP 1832 20.77 3 Arabic 56 16.72 3 Bengali 112 31.91 3 Chinese 84 26.33 3 English 242 23.45 3 Spanish 1936 16.38 3 Language Missing 374 23.94 3 Other Language 888 24.66 3 Students with Disabilities 217 6.85

2006 NYSESLAT Technical Manual
Page 297
J.5: Grade 4 Grade Group N-count Percent
4 Female 1544 22.64 4 Male 1580 19.38 4 Asian 565 25.25 4 Black or African American 117 14.25 4 Hispanic or Latino 2115 19.80 4 Native American Indian/Alaska Native 5 29.41 4 White 322 26.66 4 NYC 1830 18.10 4 Big 4 Cities 202 19.94 4 High Need Urban/Suburban 429 25.48 4 High Need Rural 27 31.03 4 Average Need 398 29.11 4 Low Need 222 32.99 4 Charter Schools 16 41.03 4 0 Years LEP 68 13.15 4 1 Years LEP 158 9.35 4 2 Years LEP 282 19.24 4 3 Years LEP 382 26.81 4 4 Years LEP 669 28.86 4 5 Years LEP 1196 23.30 4 Arabic 40 15.04 4 Bengali 64 27.47 4 Chinese 43 22.75 4 English 231 26.61 4 Spanish 1696 18.32 4 Language Missing 385 27.92 4 Other Language 665 23.91 4 Students with Disabilities 268 9.90
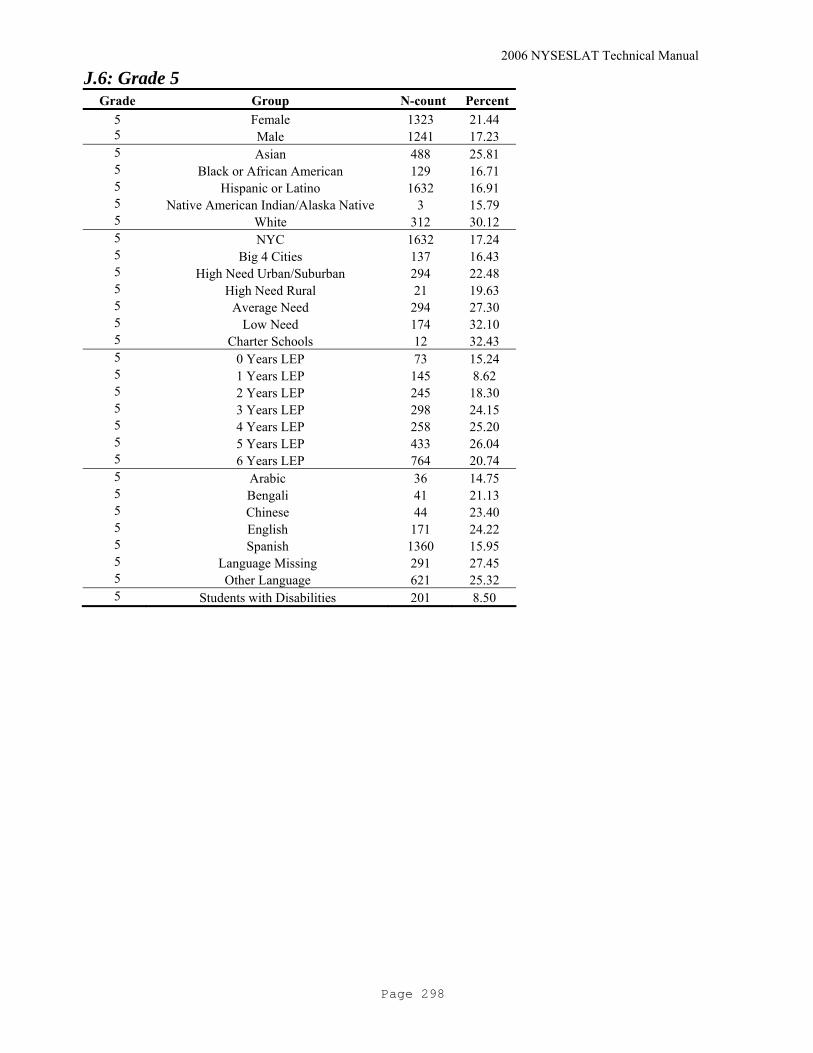
2006 NYSESLAT Technical Manual
Page 298
J.6: Grade 5 Grade Group N-count Percent
5 Female 1323 21.44 5 Male 1241 17.23 5 Asian 488 25.81 5 Black or African American 129 16.71 5 Hispanic or Latino 1632 16.91 5 Native American Indian/Alaska Native 3 15.79 5 White 312 30.12 5 NYC 1632 17.24 5 Big 4 Cities 137 16.43 5 High Need Urban/Suburban 294 22.48 5 High Need Rural 21 19.63 5 Average Need 294 27.30 5 Low Need 174 32.10 5 Charter Schools 12 32.43 5 0 Years LEP 73 15.24 5 1 Years LEP 145 8.62 5 2 Years LEP 245 18.30 5 3 Years LEP 298 24.15 5 4 Years LEP 258 25.20 5 5 Years LEP 433 26.04 5 6 Years LEP 764 20.74 5 Arabic 36 14.75 5 Bengali 41 21.13 5 Chinese 44 23.40 5 English 171 24.22 5 Spanish 1360 15.95 5 Language Missing 291 27.45 5 Other Language 621 25.32 5 Students with Disabilities 201 8.50

2006 NYSESLAT Technical Manual
Page 299
J.7: Grade 6 Grade Group N-count Percent
6 Female 879 17.24 6 Male 886 14.73 6 Asian 362 21.01 6 Black or African American 82 12.39 6 Hispanic or Latino 1087 13.91 6 Native American Indian/Alaska Native 3 16.67 6 White 231 25.84 6 NYC 1059 13.24 6 Big 4 Cities 125 19.00 6 High Need Urban/Suburban 186 19.06 6 High Need Rural 12 16.00 6 Average Need 269 27.31 6 Low Need 113 27.97 6 Charter Schools 1 6.25 6 0 Years LEP 37 8.17 6 1 Years LEP 128 7.54 6 2 Years LEP 200 15.17 6 3 Years LEP 263 22.18 6 4 Years LEP 217 23.72 6 5 Years LEP 155 21.00 6 6 Years LEP 499 17.89 6 Arabic 24 11.76 6 Bengali 46 26.44 6 Chinese 16 11.94 6 English 117 20.78 6 Spanish 878 12.65 6 Language Missing 231 26.13 6 Other Language 453 20.47 6 Students with Disabilities 118 6.46

2006 NYSESLAT Technical Manual
Page 300
J.8: Grade 7 Grade Group N-count Percent
7 Female 951 16.48 7 Male 755 11.43 7 Asian 327 17.24 7 Black or African American 78 10.58 7 Hispanic or Latino 1061 12.15 7 Native American Indian/Alaska Native 4 19.05 7 Native Hawaiian/Other Pacific Islander 2 28.57 7 White 234 23.88 7 NYC 1156 12.46 7 Big 4 Cities 88 12.59 7 High Need Urban/Suburban 139 14.33 7 High Need Rural 10 12.35 7 Average Need 196 21.26 7 Low Need 116 27.49 7 Charter Schools 1 25.00 7 0 Years LEP 49 8.28 7 1 Years LEP 104 5.54 7 2 Years LEP 185 12.71 7 3 Years LEP 220 17.42 7 4 Years LEP 215 20.48 7 5 Years LEP 172 20.55 7 6 Years LEP or more 549 16.90 7 Arabic 20 8.89 7 Bengali 44 20.66 7 Chinese 29 19.33 7 English 99 17.58 7 Spanish 938 11.90 7 Language Missing 120 14.69 7 Other Language 456 18.08 7 Students with Disabilities 90 5.31

2006 NYSESLAT Technical Manual
Page 301
J.9: Grade 8
Grade Group N-count Percent 8 Female 1093 19.31 8 Male 1057 15.99 8 Asian 383 18.51 8 Black or African American 154 18.58 8 Hispanic or Latino 1322 15.86 8 Native American Indian/Alaska Native 3 21.43 8 White 288 28.21 8 NYC 1507 16.03 8 Big 4 Cities 94 16.18 8 High Need Urban/Suburban 192 21.33 8 High Need Rural 16 22.22 8 Average Need 227 25.39 8 Low Need 113 27.23 8 Charter Schools 1 16.67 8 0 Years LEP 108 12.68 8 1 Years LEP 157 7.43 8 2 Years LEP 201 13.32 8 3 Years LEP 247 18.24 8 4 Years LEP 292 26.79 8 5 Years LEP 233 27.77 8 6 Years LEP or more 660 26.27 8 Arabic 31 11.79 8 Bengali 49 25.52 8 Chinese 23 11.11 8 English 135 23.56 8 Spanish 1154 15.25 8 Language Missing 169 22.38 8 Other Language 589 21.69 8 Students with Disabilities 112 7.17

2006 NYSESLAT Technical Manual
Page 302
J.10: Grade 9
Grade Group N-count Percent 9 Female 886 13.39 9 Male 1023 12.77 9 Asian 366 12.49 9 Black or African American 143 12.17 9 Hispanic or Latino 1147 12.29 9 Native American Indian/Alaska Native 5 13.51 9 White 248 21.79 9 NYC 1392 12.46 9 Big 4 Cities 54 9.75 9 High Need Urban/Suburban 149 12.69 9 High Need Rural 16 20.25 9 Average Need 176 15.90 9 Low Need 116 21.85 9 Charter Schools 6 66.67 9 0 Years LEP 173 14.24 9 1 Years LEP 195 5.99 9 2 Years LEP 208 10.86 9 3 Years LEP 208 13.96 9 4 Years LEP 232 19.17 9 5 Years LEP 173 19.14 9 6 Years LEP 392 21.78 9 Arabic 31 10.84 9 Bengali 35 11.55 9 Chinese 42 8.09 9 English 101 15.42 9 Spanish 992 11.86 9 Language Missing 167 17.20 9 Other Language 541 15.34 9 Students with Disabilities 83 8.28

2006 NYSESLAT Technical Manual
Page 303
J.11: Grade 10 Grade Group N-count Percent
10 Female 898 14.46 10 Male 924 13.86 10 Asian 458 13.82 10 Black or African American 153 13.40 10 Hispanic or Latino 983 13.18 10 Native American Indian/Alaska Native 2 8.00 10 White 226 23.99 10 NYC 1384 13.74 10 Big 4 Cities 40 9.73 10 High Need Urban/Suburban 118 12.83 10 High Need Rural 7 14.89 10 Average Need 173 18.66 10 Low Need 98 19.72 10 Charter Schools 2 40.00 10 0 Years LEP 102 16.01 10 1 Years LEP 223 8.27 10 2 Years LEP 260 11.60 10 3 Years LEP 245 15.86 10 4 Years LEP 195 18.26 10 5 Years LEP 162 19.10 10 6 Years LEP 376 23.04 10 Arabic 23 10.60 10 Bengali 45 14.80 10 Chinese 36 6.68 10 English 106 18.73 10 Spanish 875 12.93 10 Language Missing 132 17.41 10 Other Language 605 16.22 10 Students with Disabilities 74 10.10
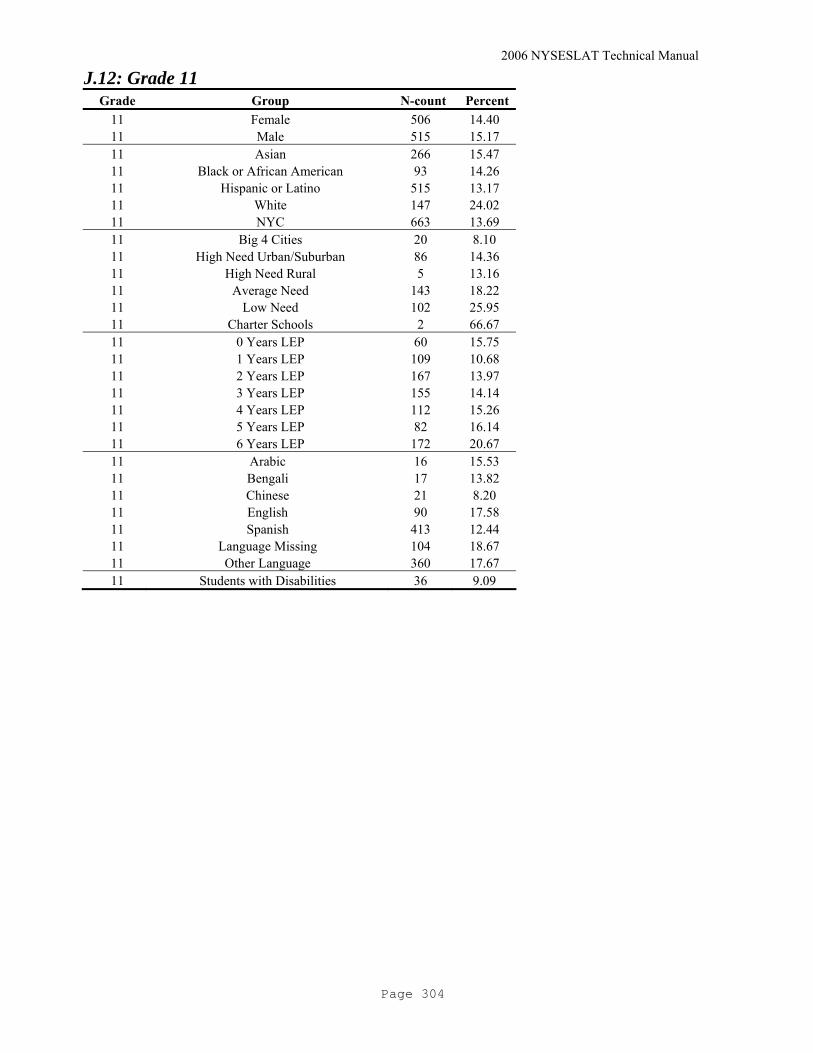
2006 NYSESLAT Technical Manual
Page 304
J.12: Grade 11 Grade Group N-count Percent
11 Female 506 14.40 11 Male 515 15.17 11 Asian 266 15.47 11 Black or African American 93 14.26 11 Hispanic or Latino 515 13.17 11 White 147 24.02 11 NYC 663 13.69 11 Big 4 Cities 20 8.10 11 High Need Urban/Suburban 86 14.36 11 High Need Rural 5 13.16 11 Average Need 143 18.22 11 Low Need 102 25.95 11 Charter Schools 2 66.67 11 0 Years LEP 60 15.75 11 1 Years LEP 109 10.68 11 2 Years LEP 167 13.97 11 3 Years LEP 155 14.14 11 4 Years LEP 112 15.26 11 5 Years LEP 82 16.14 11 6 Years LEP 172 20.67 11 Arabic 16 15.53 11 Bengali 17 13.82 11 Chinese 21 8.20 11 English 90 17.58 11 Spanish 413 12.44 11 Language Missing 104 18.67 11 Other Language 360 17.67 11 Students with Disabilities 36 9.09

2006 NYSESLAT Technical Manual
Page 305
J.13: Grade 12 Grade Group N-count Percent
12 Female 160 11.33 12 Male 185 13.72 12 Asian 79 12.87 12 Black or African American 28 10.18 12 Hispanic or Latino 194 11.90 12 White 44 19.30 12 NYC 165 9.11 12 Big 4 Cities 8 8.42 12 High Need Urban/Suburban 42 16.80 12 High Need Rural 7 25.93 12 Average Need 70 19.02 12 Low Need 52 25.49 12 Charter Schools 1 25.00 12 0 Years LEP 20 18.35 12 1 Years LEP 30 10.83 12 2 Years LEP 53 12.30 12 3 Years LEP 57 13.32 12 4 Years LEP 37 10.11 12 5 Years LEP 27 10.89 12 6 Years LEP 44 11.55 12 Arabic 3 7.50 12 Bengali 3 5.08 12 Chinese 10 13.89 12 English 44 19.56 12 Spanish 133 9.93 12 Language Missing 61 21.55 12 Other Language 91 12.28 12 Students with Disabilities 8 3.28

2006 NYSESLAT Technical Manual
Page 306
APPENDIX K: EXTERNAL STRUCTURE CHECK
Introduction In order to ascertain the external “structure” of the New York State English as a Second Language Achievement Test (NYSESLAT) vis-à-vis an external criterion, data on grades 9–12 English Language Learners (ELLs) who took the NYSESLAT in May 2006 and the New York State Regents Examination in Comprehensive English (NYRECE) and/or the New York State Regents Examination in Mathematics A (NYREMA) in June 2006, were analyzed. In New York State, all high school students, including ELLs, are required to take the NYRECE in grade 11 and the NYREMA in grade 10 as high school graduation requirements. The purpose of the NYSESLAT is to measure annual student progress in achieving English language proficiency in order to ultimately exit an ESL or bilingual program. It is also expected that ELLs who score proficient on the NYSESLAT will be able to function successfully in mainstream education programs and to have the same chance as their English proficient counterparts to pass the required State examinations. It is, therefore, hypothesized that a relationship exists between the NYSESLAT and the NYRECE, i.e., those who perform well on the NYSESLAT are generally expected to perform well on the NYRECE. On the other hand, it is assumed that there would be a negligible or a very low relationship between those who are proficient on the NYSESLAT and those who pass the NYREMA, primarily because the unidimensional construction of the NYREMA precludes proficiency in English as a requirement for proficiency in mathematics.
Analyses Table K1 provides descriptive statistics for the different examinations for the 9–12 Grade Span. Table K1 Descriptive Statistics for NYSESLAT (L+S and R+W), NYRECE, and NYREMA
Examination N -Count Mean
Scale Sore Std Dev
Minimum Obtained
Score
Maximum Obtained
Score NYRECE 6787 50.66 19.73 0 99 NYREMA 8113 61.61 15.99 0 100
NYSESLAT (L+S) 12742 700.66 40.62 471 842 NYSESLAT (R+W) 12742 710.78 38.52 575 861
The overall correlations for the NYSESLAT modality combinations and the Regents examinations are given in Table K2 below, where the highest within-examination correlation is between the two modality combinations of NYSESLAT, i.e., between L+S and R+W). The highest between-examination correlation is for the R+W modality combination of the NYSESLAT with the NYRECE (r =0.57). As expected, the relationship between NYSESLAT (L+S) with the NYREMA was much lower (r = 0.17).
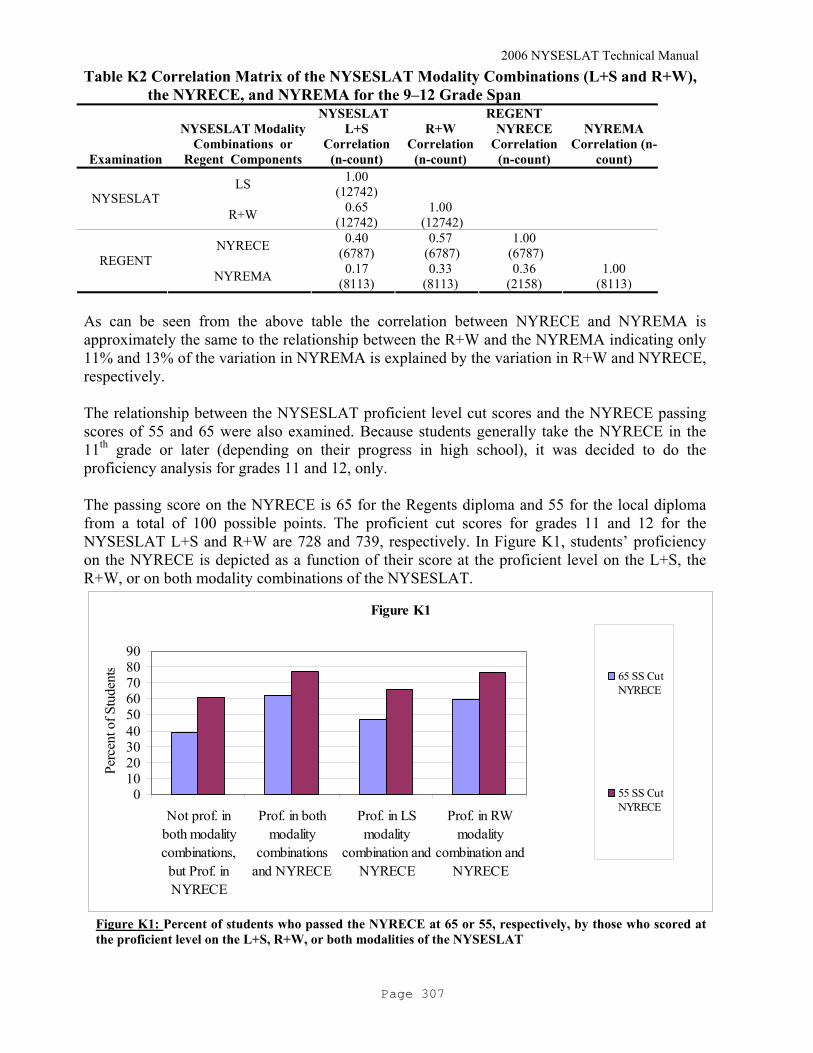
2006 NYSESLAT Technical Manual
Page 307
Table K2 Correlation Matrix of the NYSESLAT Modality Combinations (L+S and R+W), the NYRECE, and NYREMA for the 9–12 Grade Span NYSESLAT REGENT
Examination
NYSESLAT Modality Combinations or
Regent Components
L+S Correlation
(n-count)
R+W Correlation
(n-count)
NYRECE Correlation
(n-count)
NYREMA Correlation (n-
count)
LS 1.00 (12742)
NYSESLAT R+W 0.65
(12742) 1.00
(12742)
NYRECE 0.40 (6787)
0.57 (6787)
1.00 (6787)
REGENT NYREMA 0.17
(8113) 0.33
(8113) 0.36
(2158) 1.00
(8113) As can be seen from the above table the correlation between NYRECE and NYREMA is approximately the same to the relationship between the R+W and the NYREMA indicating only 11% and 13% of the variation in NYREMA is explained by the variation in R+W and NYRECE, respectively. The relationship between the NYSESLAT proficient level cut scores and the NYRECE passing scores of 55 and 65 were also examined. Because students generally take the NYRECE in the 11th grade or later (depending on their progress in high school), it was decided to do the proficiency analysis for grades 11 and 12, only. The passing score on the NYRECE is 65 for the Regents diploma and 55 for the local diploma from a total of 100 possible points. The proficient cut scores for grades 11 and 12 for the NYSESLAT L+S and R+W are 728 and 739, respectively. In Figure K1, students’ proficiency on the NYRECE is depicted as a function of their score at the proficient level on the L+S, the R+W, or on both modality combinations of the NYSESLAT.
Figure K1
0102030405060708090
Not prof. inboth modalitycombinations,but Prof. inNYRECE
Prof. in bothmodality
combinationsand NYRECE
Prof. in LSmodality
combination andNYRECE
Prof. in RWmodality
combination andNYRECE
Perc
ent o
f Stu
dent
s
65 SS CutNYRECE
55 SS CutNYRECE
Figure K1: Percent of students who passed the NYRECE at 65 or 55, respectively, by those who scored at the proficient level on the L+S, R+W, or both modalities of the NYSESLAT

2006 NYSESLAT Technical Manual
Page 308
As depicted in Figure K1, above, more than 75% of the students who scored at or above proficient level on both the L+S and R+W modality combinations of the NYSESLAT also passed the NYRECE at the 55-point scale score cut, while at the 65-point cut, the corresponding figure was approximately 65% students who passed the NYRECE. The figure also indicates almost 50% students passed the NYRECE at the 65-point cut from those who were only proficient on the L+S modality combination. The pass rates on the NYRECE for those who score proficient on the R+W modality combination at both cuts are even higher. Some students who have low ability on speaking, but have strong abilities on reading, writing, and listening are not able to pass NYSESLAT, but manage to pass the NYRECE test because NYRECE test does not have Speaking section. About 60% of the students who do not pass both modality combinations (LS and RW) of the NYSESLAT manage to pass the NYRECE at the 55-point cut. The pass rate falls substantially, i.e., approximately 39% when NYRECE cut-point is raised to 65.
Discussion and Conclusion The correlation analyses provide evidence that the external “structure” check of the NYSESLAT with respect to the New York State Regents Examination in Comprehensive English ascertains a positive relationship between the two examinations. This indicates that higher scores on the NYSESLAT, especially the RW modality combination, are associated with higher scores on the NYRECE. As expected, the relationship between the NYSESLAT and NYREMA was much weaker than that between NYSESLAT and NYRECE. The analysis also confirms the validity of NYSESLAT cut score for exiting in that over three quarters of those who scored at the proficient level on the LS and RW modality combinations passed the NYRECE at 55 and two-thirds pass the NYRECE at 65. Further, scoring proficient on the RW modality combination is a better predictor for passing the NYRECE than proficient score on the LS component. On the other hand, the relatively low correlation between the NYREMA and the L+S modality component of the NYSESLAT indicates that students’ performance on the L+S is not a major factor in their performance on the Math component of the Regent examination. Furthermore, the lower correlation between the NYREMA and the R+W modality component (relative to the L+S and R+W correlation with NYRECE) indicates the overall low dependency on total NYSESLAT performance as an indicator of the performance on the mathematics component of the Regents examination. As hypothesized above, this may very well indicate the unidimensionality of the NYREMA with respect to the utility of language in the evaluation of students’ ability in mathematics. Although there is no hard and fast rule as to what is considered good or bad correlation for prediction purposes, one can rely on relative relationships among variables to ascertain the value of the NYSESLAT examination in the prediction of ELLs’ performance on the NYRECE. As can be seen from this study, there is relatively higher percentage of students who pass both modalities of the NYSESLAT and the NYRECE than the percentage of students who are non-proficient on the NYSESLAT but manage to pass the NYRECE, i.e., approximately 39% and 62% at the 65-point cut for those who do not pass the two modality combinations of the NYSESLAT and those who pass them. It, therefore, stands to reason that the predictive value of the NYSESLAT in students’ performance on the NYRECE is justifiable. However, the results of

2006 NYSESLAT Technical Manual
Page 309
the analyses should be taken as just one of the many indicators in assessing the performance on the NYSESLAT as a predictor of student performance on the NYRECE; even with its relatively high convergent validity indication which, in turn, substantiates the external structure check for the NYSESLAT.

2006 NYSESLAT Technical Manual
Page 310
APPENDIX L: DIF CATEGORIES FOR OPERATIONAL ITEMS Table L.1 Results of DIF Analyses
Grade Span Modality
Item Seq. Number
DIF – Male/Female
DIF – Hispanic/Asian
DIF – Hispanic/Black
DIF– Hispanic/White
1–2 Listen/Speak 1 A A A A 2 A A A A 3 A A A A 4 A A A A 5 A A A A 6 A A A A 7 A A A A 8 A A A A 9 A A A A 10 A A A A 11 A A A A 12 A A A A 13 A A A A 14 A A A A 15 A A A A 16 A A A A 17 A A A A 18 A A A A 19 A A A A 20 A A A A 21 A A A A 22 A A A A 23 A A A A 24 A A A A 25 A A A A 26 A A A >B 27 A A A A 28 A A A A 29 A A A A 30 A A A A 31 A A A A 32 A A A A 33 A A A A 34 A A A A 35 A A A A 36 A A A A 37 A A A A 38 A A A A 39 A A A A 40 A A A A
3–5 Listen/Speak 1 A A A A 2 A A A A 3 A A A A 4 A A A A 5 A A A A 6 A A A >B 7 A A A A 8 A A A A

2006 NYSESLAT Technical Manual
Page 311
Table L.1 Results of DIF Analyses (Continued) Grade Span Modality
Item Seq. Number
DIF – Male/Female
DIF – Hispanic/Asian
DIF – Hispanic/Black
DIF– Hispanic/White
9 A A A A 10 A A A A 11 A A A A 12 A A A A 13 A A A A 14 A A A A 15 A A A A 16 A A A A 17 A A A A 18 A A A A 19 A A A A 20 A A A A 21 A A A A 22 A A A A 23 A A A A 24 A A A A 25 A A A A 26 A A A A 27 A A A A 28 A A A A 29 A A A A 30 A A A A 31 A A A A 32 A A A A 33 A A A A 34 A A A A 35 A A A A 36 A A A A 37 A A A A 38 A A A A 39 A A A A 40 A A A A 41 A A A A 42 A A A A
6–7 Listen/Speak 1 A A A A 2 A A A A 3 A A A A 4 A A A A 5 A A A A 6 A A A A 7 A A A A 8 A A A A 9 A A A A 10 A A A A 11 A A A A 12 A A A A 13 A A A A 14 A A A A 15 A A A A 16 A A A A

2006 NYSESLAT Technical Manual
Page 312
Table L.1 Results of DIF Analyses (Continued) Grade Span Modality
Item Seq. Number
DIF – Male/Female
DIF – Hispanic/Asian
DIF – Hispanic/Black
DIF– Hispanic/White
17 A A A A 18 A A A >B 19 A A A A 20 A A A A 21 A A A A 22 A A A A 23 A A A A 24 A A A A 25 A A A A 26 A A A A 27 A A A A 28 A A A A 29 A A A A 30 A A A A 31 A A A A 32 A A A A 33 A A A A 34 A A A A 35 A A A A 36 A A A A 37 A A A A 38 A A A A 39 A A A A 40 A A A A 41 A A A A 42 A A A A
8–9 Listen/Speak 1 A A A A 2 A A A A 3 A A A A 4 A A A A 5 A A A A 6 A A A A 7 A A A A 8 A A A A 9 A A A A 10 A A A A 11 A A A A 12 A A A A 13 A A A A 14 A A A A 15 A A A A 16 A A A A 17 A A A A 18 A A A A 19 A A A A 20 A A A A 21 A A A A 22 A A A A 23 A A A A

2006 NYSESLAT Technical Manual
Page 313
Table L.1 Results of DIF Analyses (Continued) Grade Span Modality
Item Seq. Number
DIF – Male/Female
DIF – Hispanic/Asian
DIF – Hispanic/Black
DIF– Hispanic/White
24 A A A A 25 A A A A 26 A A A A 27 A A A A 28 A A A A 29 A A A A 30 A A A A 31 A A A A 32 A A A A 33 A A A A 34 A A A A 35 A A A A 36 A A >B A 37 A A A A 38 A A A A 39 A A >B A 40 A A >B A 41 A A >B A 42 A A >B A 43 A A A A
10–12 Listen/Speak 1 A A A >B 2 A A A A 3 A A A A 4 A A A A 5 A A A A 6 A A A A 7 A A A A 8 A A A A 9 A A A A 10 A A A A 11 A A A A 12 A A A A 13 A A A A 14 A A A A 15 A A A A 16 A A A A 17 A A A A 18 A A A A 19 A A A A 20 A A A A 21 A A A A 22 A A A A 23 A A A A 24 A A A A 25 A A A A 26 A A A A 27 A A A A 28 A A A A 29 A A A A 30 A A A A

2006 NYSESLAT Technical Manual
Page 314
Table L.1 Results of DIF Analyses (Continued) Grade Span Modality
Item Seq. Number
DIF – Male/Female
DIF – Hispanic/Asian
DIF – Hispanic/Black
DIF– Hispanic/White
31 A A A A 32 A A >B A 33 A A A A 34 A A A A 35 A A A A 36 A A A A 37 A A A A 38 A A A A 39 A A A A 40 A A A A 41 A A A A 42 A A A A 43 A A A A
1–2 Read /Write 1 A A A A 2 A A A A 3 A A A A 4 A A A A 5 A A A A 6 A A A A 7 A A A A 8 A A A A 9 A A A A 10 A A A A 11 A A A A 12 A A A A 13 A A A A 14 A A A A 15 A A A A 16 A A A A 17 A A A A 18 A A A A 19 A A A A 20 A A A A 21 A A A A 22 A A A A 23 A A A A 24 A A A A 25 A A A A 26 A A A A 27 A A A A 28 A A A A 29 A A A A 30 A A A A 31 A A A A 32 A A A A 33 A A A A 34 A A A A
3–5 Read/Write 1 A A A A 2 A A A A 3 A A A A

2006 NYSESLAT Technical Manual
Page 315
Table L.1 Results of DIF Analyses (Continued) Grade Span Modality
Item Seq. Number
DIF – Male/Female
DIF – Hispanic/Asian
DIF – Hispanic/Black
DIF– Hispanic/White
4 A A A A 5 A A A A 6 A A A A 7 A A A A 8 A A A A 9 A A A A 10 A A A A 11 A A A A 12 A A A A 13 A A A A 14 A A A A 15 A A A A 16 A A A A 17 A A A A 18 A A A A 19 A A A A 20 A A A A 21 A A A A 22 A A A A 23 A A A A 24 A A A A 25 A A A A 26 A A A A 27 A A A A 28 A A A A 29 A A A A 30 A A A A 31 A A A A 32 A A A A 33 A A A A 34 A A A >B 35 A A A A 36 A A A A 37 A A A A 38 A A A A 39 A A A A 40 A A A A 41 A A A A 42 A A A A
6–7 Read/Write 1 A A A A 2 A A A A 3 A A A A 4 A A A A 5 A A A A 6 A A A A 7 A A A A 8 A A A A 9 A A A A 10 A A A A

2006 NYSESLAT Technical Manual
Page 316
Table L.1 Results of DIF Analyses (Continued) Grade Span Modality
Item Seq. Number
DIF – Male/Female
DIF – Hispanic/Asian
DIF – Hispanic/Black
DIF– Hispanic/White
11 A A A A 12 A A A A 13 A A A A 14 A A A A 15 A A A A 16 A A A A 17 A A A A 18 A A A A 19 A A A A 20 A A A A
21 A A A A 22 A A A A 23 A A A A 24 A A A A 25 A A A A 26 A A A A 27 A A A A 28 A A A A 29 A A A A 30 A A A A 31 A A A A 32 A A A A 33 A A A A 34 A A A A 35 A A A A 36 A A A A 37 A A A A 38 A A A A 39 A A A A 40 A A A A 41 A A A A 42 A A A A 43 A A A A 44 A A A A 45 A A A A 46 A A A A
8–9 Read/Write 1 A A A A 2 A A A >B 3 A A A <C 4 A A A A 5 A A A A 6 A A A <C 7 A A A A 8 A A A A 9 A A A A 10 A A A A 11 A A A A 12 A A A A 13 A A A A 14 A A A A
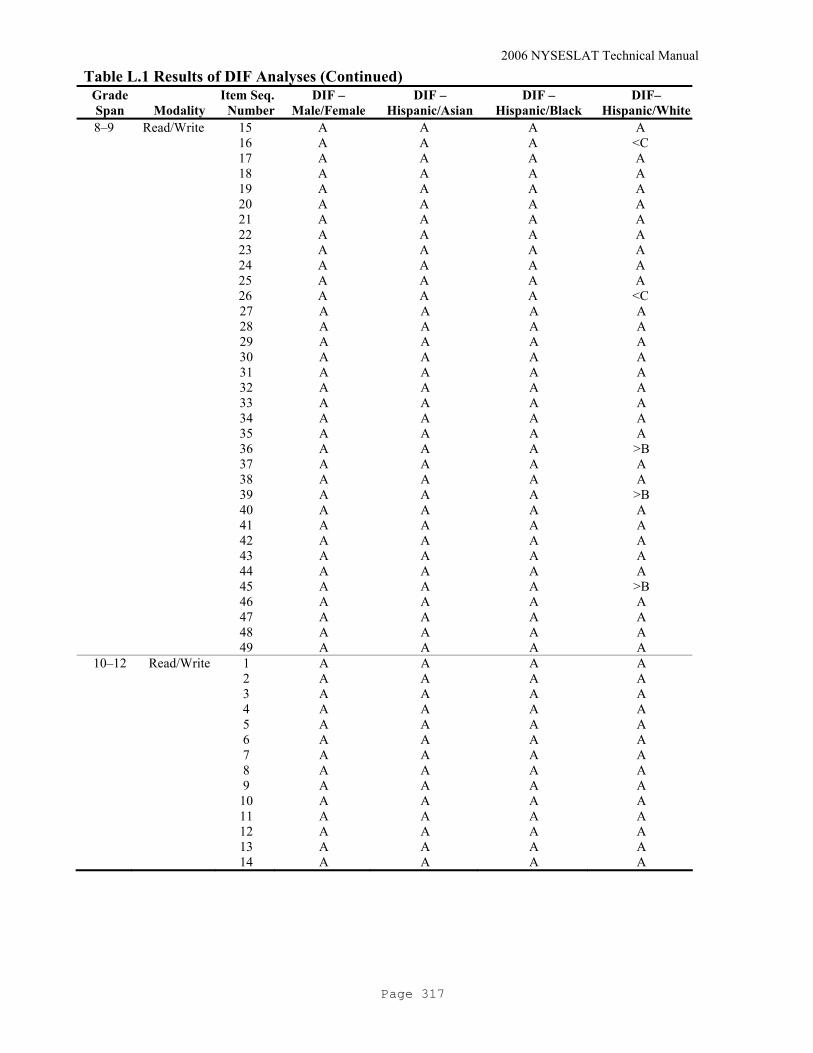
2006 NYSESLAT Technical Manual
Page 317
Table L.1 Results of DIF Analyses (Continued) Grade Span Modality
Item Seq. Number
DIF – Male/Female
DIF – Hispanic/Asian
DIF – Hispanic/Black
DIF– Hispanic/White
8–9 Read/Write 15 A A A A 16 A A A <C 17 A A A A 18 A A A A 19 A A A A 20 A A A A 21 A A A A 22 A A A A 23 A A A A 24 A A A A 25 A A A A 26 A A A <C 27 A A A A 28 A A A A 29 A A A A 30 A A A A 31 A A A A 32 A A A A 33 A A A A 34 A A A A 35 A A A A 36 A A A >B 37 A A A A 38 A A A A 39 A A A >B 40 A A A A 41 A A A A 42 A A A A 43 A A A A 44 A A A A 45 A A A >B 46 A A A A 47 A A A A 48 A A A A 49 A A A A
10–12 Read/Write 1 A A A A 2 A A A A 3 A A A A 4 A A A A 5 A A A A 6 A A A A 7 A A A A 8 A A A A 9 A A A A 10 A A A A 11 A A A A 12 A A A A 13 A A A A 14 A A A A

2006 NYSESLAT Technical Manual
Page 318
Table L.1 Results of DIF Analyses (Continued) Grade Span Modality
Item Seq. Number
DIF – Male/Female
DIF – Hispanic/Asian
DIF – Hispanic/Black
DIF– Hispanic/White
10–12 Read/Write 15 A A A A 16 A A A A 17 A A A A 18 A A A A 19 A A A <B 20 A A A A 21 A A A <C 22 A A A A 23 A A A A 24 A A A A 25 A A A A 26 A A A A 27 A A A A 28 A A A A 29 A A A A 30 A A A A 31 A A A A 32 A A A A 33 A A A A 34 A A A A 35 A A A A 36 A A A A 37 A A A A 38 A A A A 39 A A A >B 40 A A A A 41 A A A A 42 A A A A 43 A A A A 44 A A A A 45 A A A A 46 A A A A 47 A A A A 48 A A A A 49 <B A A A
Note: > indicates in favor of Males or Hispanics while < indicates in favor of the focal groups.

2006 NYSESLAT Technical Manual
Page 319
APPENDIX M: REFERENCES
Altman, D. G. (1991). Practical Statistics for Medical Research (pp.404). Champman and Hall/CRC.
Andrich, A., & Luo, G. (2004). Modern measurement and analysis in social science.
Murdoch University, Perth, Western Australia.
Angoff, W. H. (1971). Scales, norms and equivalent scores. In R. L. Thorndike (Ed.). Educational Measurement (2nd ed., pp. 508–600). Washington, D.C.: American Council on Education.
American Educational Research Association, American Psychological Association, and National Council on Measurement in Education (1999). Standards for educational and psychological testing. Washington, D.C.: American Psychological Association.
Browne, M. W. (1982). Covariance structures. In D. M. Hawkins (Ed.), Topics in applied multivariate analysis (pp. 72–141). Cambridge: Cambridge University Press.
Browne, M. W. & Cudeck, R. (1993). Alternative ways of assessing model fit. In K. A. Bollen & J. S. Long (Eds.), Testing structural equation models (pp. 136–162). Newbury Park, CA: Sage Publication.
Cronbach, L. J. (1951). Coefficient alpha and the internal structure of tests. Psychometrika, 16, 297–334.
Steinley, D. & Wood, P. (2000). ICC.SAS—a program to calculate intra-class correlations and confidence intervals, Univ. of Missouri-Columbia.
Embretson, S., & Reise, S. (2000). Item response theory for psychologists. New Jersey : Lawrence Erlbaum Associates, Publishers.
Haertel, E. H. (1996). Estimating the decision consistency from a single administration of a performance assessment battery. A report on the National Board of Professional Teaching Standards McGEN Assessment. Palo Alto, CA: Stanford University.
Hanson, B. A., & Beguin, A. A. (1999). Obtaining a common scale for IRT item parameters using separate versus concurrent estimation in the common item nonequivalent groups equating design. Paper presented at the meeting of the National Council on Measurement in Education in Montreal.
Hanson, B. A. (1995). USmooth: A program for smoothing univariate test score distribution (Version 1.5). Iowa City, IA: American College Testing.
Hanson, B. A. (1991). Method of moments estimates for the four–parameter beta compound binomial model and the calculation of classification consistency indexes. ACT Research Report 91–5. Iowa City, IA: American College Testing.
2006 NYSESLAT Technical Manual
Page 320
Hu, M., & Bentler, P. M. (1999). Cut off criteria for fit indexes in covariance structure analysis: Conventional criteria versus new alternatives. Structural Equation Modeling, 6, 1–55.
Huynh, H. (2000). Robust linking for PACT assessments. South Carolina PACT Technical Report.
Jöreskog, K. G., & Sörbom, D. (1995a). Liseral 8 user’s reference guide. Chicago Scientific Software, Inc.
Jöreskog, K. G., & Sörbom, D. (2004). Liseral 8.7 for Windows / Computer Software. Lincolnwood, IL: Scientific Software International, Inc.
Kolen, M. J., & Brennan, R. L. (1995). Test equating methods and practices. New York:
Springer–Verlag.
Kolen, M. J. and Brennan R. L. (2004). Test equating, scaling, and linking: Methods and practices (Second edition). New York, NY: Springer–Verlag.
Linacre, J. M. (2003). A user’s guide to to WINSTEPS: MINISTEP: Rasch–model computer programs, Chicago, IL:MESA Press.
Linacre, J. M., & Wright, B. D. (2000). A user’s guide to WINSTEPS: Rasch–model computer program. Chicago, IL: MESA Press
Livingston, S. A. & Lewis, C. (1995). Estimating the consistency and accuracy of classifications based on test scores. Journal of Educational Measurement, 32, 179–1987.
Lord , F. M., & Wingersky, M. S. (1984). Comparison of IRT true–score and eqipercentile observed–score "equatings". Applied Psychological Measurement, 8, 452–461.
MacCallum, R. C., Roznowski, M., & Necowitz, L. B. (1992). Model modifications in covariance structure analysis: The problem of capitalization on chance. Psychological Bulletin, 111, 490–504.
MacCallum, R. C., Browne, M., & Sugawara, H. M. (1996). Power analysis and determination of sample size for covariance structure modeling. Psychological Methods, 2(1), 130–149.
Masters, G. N. (1982). A Rasch model for partial credit scoring. Psychometrika, 47, 149–174.
McLeod, L. D., Swygert, K. A., & Thissen, D. (2001). Factor analysis for items scored in two categories. In D. Thissen and H. Wainer (Eds.), Test Scoring (pp. 189–216). Mahwah, N.J.: Lawrence Erlbaum Associates, Publishers.
Mitzel, H.C., Lewis, D.M., & Green, D.R. (2001). The bookmark procedure. In G.J. Cizek
(Ed.), Setting performance standards: concepts, methods, and perspectives (pp. 249–282). Mahwah, New Jersey. Lawrence Earlbaum Associates.

2006 NYSESLAT Technical Manual
Page 321
Nitko, A. J. (2004). Educational Assessment of Students (4th Ed.), Upper Saddle River, NJ, Person Education Inc.
Rasch, G. (1980). Probabilistic models for some intelligence and attainment tests. Chicago, IL: University of Chicago Press.
Rasch, G. (1960). Probabilistic models for some intelligence and attainment tests. Copenhagen: Danish Institute for Educational Research.
Siegel, S. (1956). Nonparametric statistics for the behavioral sciences. New York: McGraw-Hill.
Shrout, P. E., & Fleiss, J. L. (1979). Intraclass Correlations: uses in assessing rater reliability. Psychological Bulletin, 86(2), 420-428.
Swygert, K. A., McLeod, L. D., & Thissen, D. (2001). Factor analysis for items or testlets scored in more than two categories. In D. Thissen and H. Wainer (Eds.), Test Scoring (pp. 217–250). Mahwah, NJ: Lawrence Erlbaum Associates, Publishers.
Taherbhai, H., & Seo, D. (2007). Comparing Concurrent vs. Fixed Parameter Equating with Common Items, Using the Rasch Dichotomous and the Partial Credit Models in a Mixed–Item Format Test. Journal of Applied Measurement 8(1).
Thissen, D. & Steinberg, L. (1983). A response model for multiple choice items. Psychometric Technical Report No.1. National Opinion Research Center, Chicago, IL.
Young, M. J. & Yoon, B. (1998, April). Estimating the consistency and accuracy of classifications in a standards–referenced assessment. CSE Technical Report 475. Center for the Study of Evaluation, Standards, and Student Testing. Los Angeles, CA: University of California, Los Angeles.