newmont exploration of canada ltd. - · pdf fileof newmont exploration of canada ltd., ... if...
TRANSCRIPT

CeO5IC Inc.2.12447 POWELL 010
n" ll APR 28 1989/O
NEWMONT EXPLORATION OF CANADA LTD.
INDUCED POLARIZATION SURVEY ON THEPOWELL PROPERTY,
POWELL TOWNSHIP, ONTARIO
r:,- ' ^
IMCTO LMJWS SLC
Project 56.10
March 30, 1989
Normand Moreau, geologist
Edwin Gaucher, Eng., Ph.D.
2406 Quatre-Bourgeois, suite 200, Ste-Foy (Quebec) G1V 1W5-Te!.: (418) 659-3512-Telex: 051-31713 1137, 3e Rue, Val d'Or (Quebec) J9P 4A9- (819) 825-0445

42Ae2SW63e4 2.18447 POWELL 010C
1. INTRODUCTION..................................................
2. PROPERTY, LOCALIZATION AND ACCESS..........
3. FIELD WORK, PROCEDURE AND INSTRUMENTS.
4. GENERAL INFORMATION ON THE IP SURVEY....4.1 Purpose of the I.P. survey...........................4.2 Presentation of results.................................4.3 Usefulness of the Normalized Chargeability....,
5. PROBABILITY OF ANOMALIES AND PREDICTIONOF THE QUANTITY OF SULFIDES......................5.1 Probability..................................................5.2 Quantity of sulfides.....................................
6. DESCRIPTION OF THE I.P. SURVEY .................6.1 Resistivity..................................................6.2 Chargeability...............................................6.3 Normalized chargeability...............................6.4 Description of I.P. anomalies.......................
CONCLUSION.............................................................
RECOMMENDED TARGETS..........................................
2223
334
44555
GEO5IG Inc.

rl. INTRODUCTION
A the request of Mr. Peter Wood, project geologist, and Mr. Mike White, Regional Manager of Newmont Exploration of Canada Ltd., an Induced Polarization (I.P.) survey was run in in December 1988 and January 1989 on their Powell property by GEOSIG INC. This survey covered the surroundings of a gold showing on the property.
2 . PROPERTY, LOCALIZATION AND ACCESS
This mining property is situated some 10 kilometers west of Matachewan, Ontario, in the Powell township. The property is accessible by a trail from road 566. The base line is at about 500 meters south of this road.
The grid surveyed extends some 1200 meters in an east-west direction. The north-south oriented lines are spaced every 50 meters and their length varies from 800 to 1000 meters.
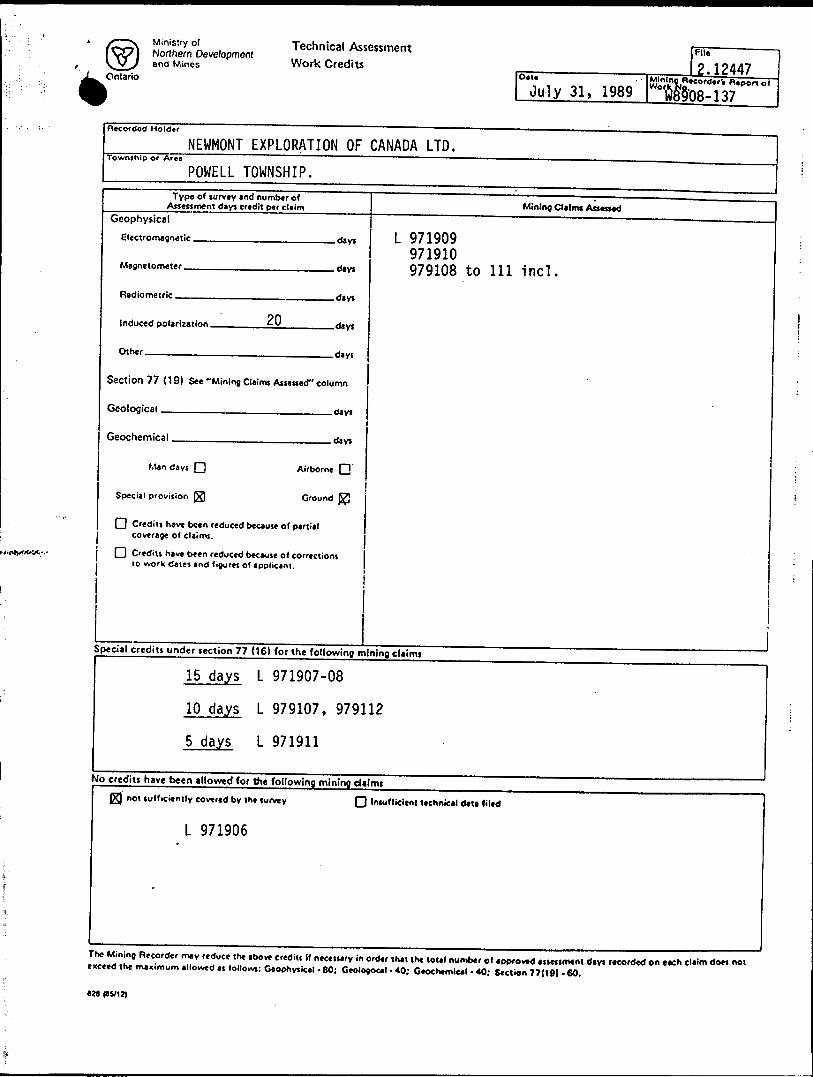
The following claims were covered by our survey:
979107 971907979108 971908979109 971909979110 971910979111 971911979112
3. FIELD WORK, PROCEDURE AND INSTRUMENTS
The field crew moved to the property on December 16,1988. Normand Moreau, geol., acted as party chief, and was assisted by Yvon Landry, Michel Landry, Carl Lajoie and I.R. Martel, technicians. In January, he was assisted by Youness Sa'i'm, eng., Johanne Laberge, geol., Gae"tan Royer and Denis Nolet, technicians.
The survey covered 23,5 km and was performed in the time domain with a standard waveform: 2 seconds ON, 2 seconds OFF. We used a dipole-dipole configuration, with a 25-meter electrode spacing, and readings were taken at four separations (n - l, 2, 3 and 4). Detail readings with a 12,5-m dipole were also taken over 325 meters on line 6+50E.
Steel pin electrodes were used for the receiver and the transmitter. On the receiver electrode spreads, stainless steel pin electrodes were used in order to improve the signal-to-noise ratio.
The following equipment was used:
Receiver: IP-6 built by EDA-BRGM, s/n 4 and 8 Transmitters:- T3P10 (650 W) 2kW built by
Instrumentation ODD Inc. - IPT1 (1500 W) built by Phoenix
A line of 25-meter cables connected to each other allowed us to read all four dipoles at once. The receiver read out chargeabilities (M) within 0,1 msec. Since the chargeability on the IP-6 receiver is half the normal calibration, we multiplied the value of the chargeability by two. The final chargeability was then identical to the Crone, Huntec or Scintrex receivers.
GEOJIG Inc.

4 . GENERAL INFORMATION ON THE I.P. SURVEY
4.1 Purpose of the I.P. survey
An I.P. survey is usually done in order to detect conductive and/or polarizable materials such as sulfides or graphite. Therefore, the survey consists in measuring the chargeability (M) and the apparent resistivity (R) along lines studied.
Theoretically, the resistivity map should pinpoint conductive sulfides or graphite bodies. In reality, resistivity maps usually reflect variations in the conductivity and thickness of the overburden. The chargeability (M) measurements do allow the detection of sulfides or graphite bodies, either massive or disseminated, as the overburden seldom if ever shows any chargeability.
In areas of variable overburden conductivity, chargeability "anomalies", even over massive sulfide bodies, are subdued where the surface conductivities are high. Readings may be lower over sulfide bodies covered by clays (as low as 3 msec) than over non-mineralized but highly resistive volcanic outcrops (10 to 20 msec). Tp interpret an I.P. survey with such variations, both sets of measurements, chargeability and resistivity, must therefore be studied together. Thus, in addition to resistivity and chargeability maps, we also prepare normalized chargeability (NC) maps as they often reflect better the actual distribution of sulfides and other polarizable materials.
4.2 Presentation of results
The results of the survey are represented at a 1:2000 scale. On one set of maps, we plotted the three profiles at the following scales:
Chargeability (M) 40 msec/cmSurface resistivity (R) Logarithmic scale:
l to l OOOOOOft-m, l cm per decade 1000 fl-meters centered on the line
Normalized chargeability (NC) 5 mhosec/cm
The localization of IP conductors is mostly based on the shape of the NC profiles which were calculated from M and R with the following formula:
if R-dOOO* NC - 9,58 * MA/R (formula 1) if R:* 1000* NC - 303 * M/R (formula 2)
where R ~ n a * n (n+1) * (n+2) * Vp/INC K normalized chargeability, mhosec R ss apparent surface resistivity, fi-metersM = chargeability read on the receiver display, msec.Vp = voltage between receiver electrodes, mvoltsI s current transmitted, milli-amperes
a = electrode spacing, metersn = number of separations
303 and 9,58 = normalization factor
* When the resistivity is equal to 1000 Q-meters, both formulas give the same NC value.
GEOSIG Inc.
We gave the name of mhosec to the normalized chargeability as it is obtained by multiplying the conductivity (I/R) measured in mhos by the chargeability (milliseconds), or mhosec. By combining those two parameters, we created the new name, mhdsec.
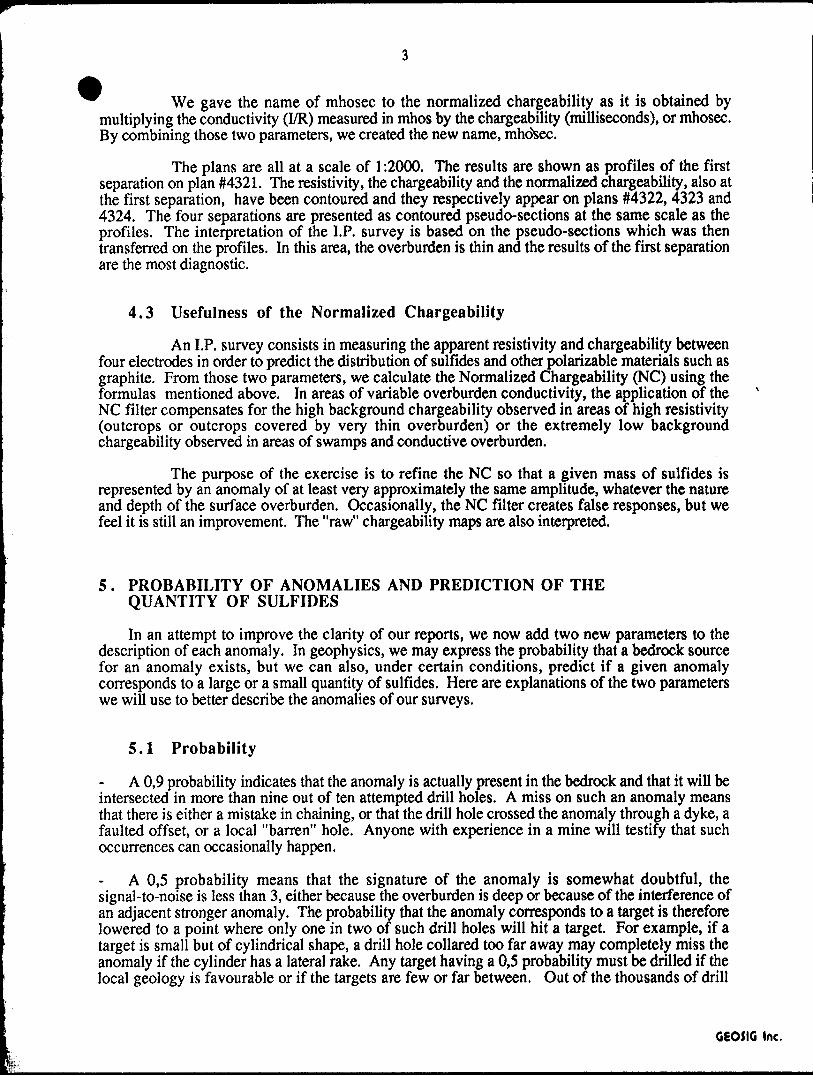
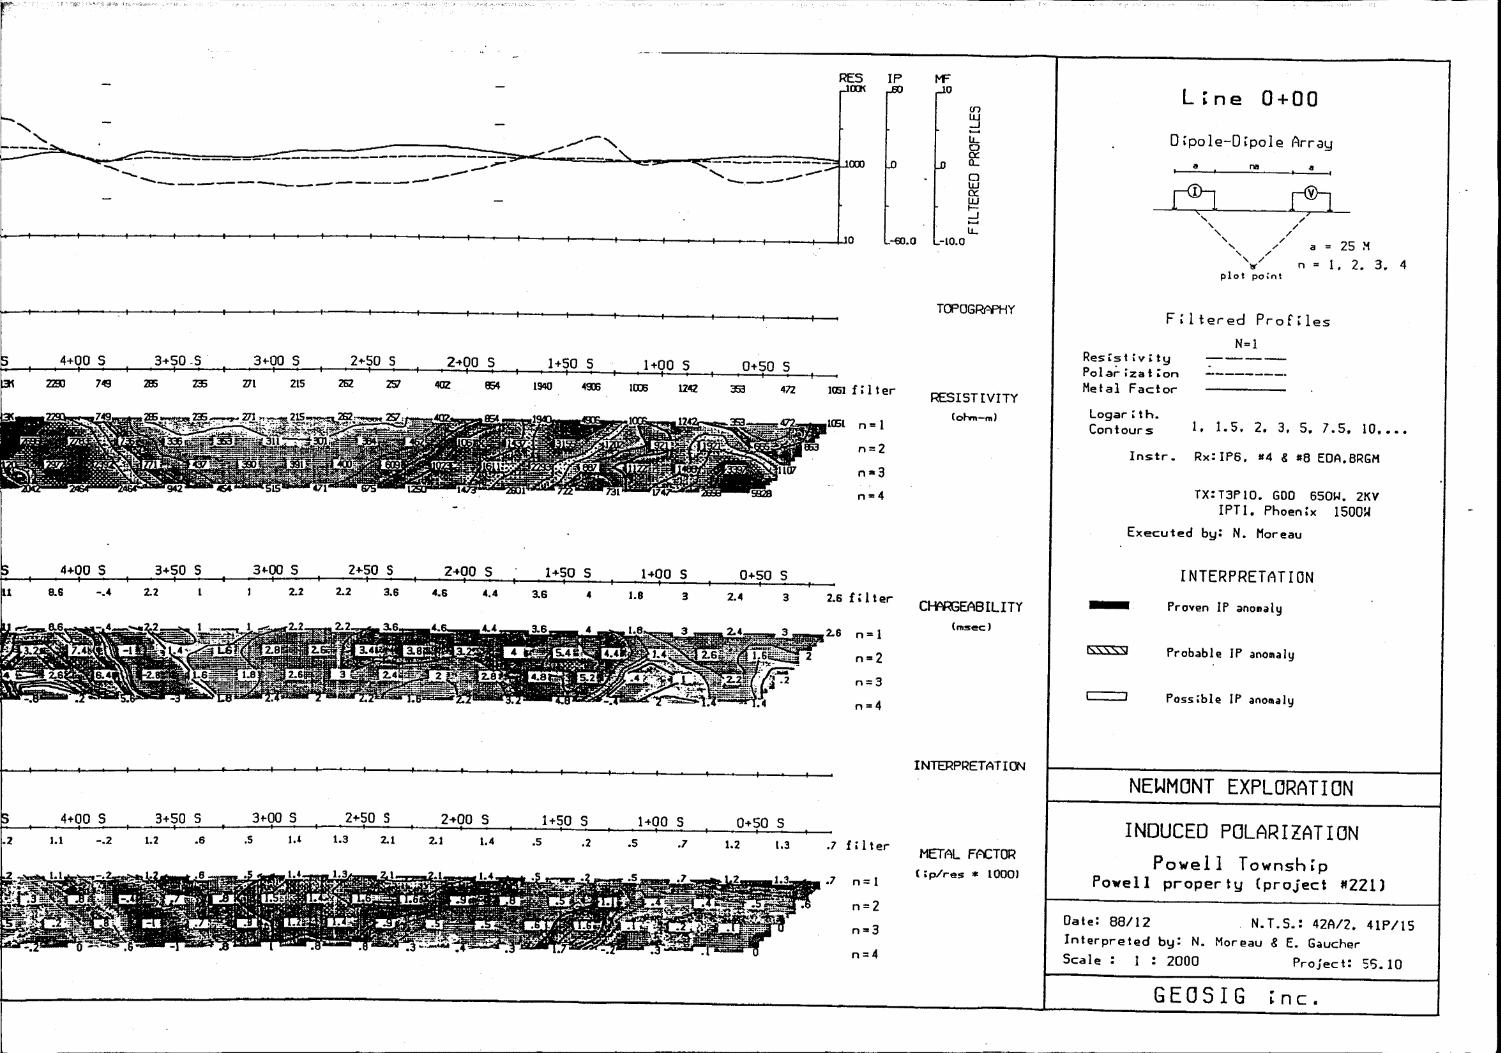
The plans are all at a scale of 1:2000. The results are shown as profiles of the first separation on plan #4321. The resistivity, the chargeability and the normalized chargeability, also at the first separation, have been contoured and they respectively appear on plans #4322, 4323 and 4324. The four separations are presented as contoured pseudo-sections at the same scale as the profiles. The interpretation of the I.P. survey is based on the pseudo-sections which was then transferred on the profiles. In this area, the overburden is thin and the results of the first separation are the most diagnostic.
4.3 Usefulness of the Normalized Chargeability
An I.P. survey consists in measuring the apparent resistivity and chargeability between four electrodes in order to predict the distribution of sulfides and other polarizable materials such as graphite. From those two parameters, we calculate the Normalized Chargeability (NC) using the formulas mentioned above. In areas of variable overburden conductivity, the application of the NC filter compensates for the high background chargeability observed in areas of high resistivity (outcrops or outcrops covered by very thin overburden) or the extremely low background chargeability observed in areas of swamps and conductive overburden.
The purpose of the exercise is to refine the NC so that a given mass of sulfides is represented by an anomaly of at least very approximately the same amplitude, whatever the nature and depth of the surface overburden. Occasionally, the NC filter creates false responses, but we feel it is still an improvement. The "raw" chargeability maps are also interpreted.
5 . PROBABILITY OF ANOMALIES AND PREDICTION OF THE QUANTITY OF SULFIDES
In an attempt to improve the clarity of our reports, we now add two new parameters to the description of each anomaly. In geophysics, we may express the probability that a bedrock source for an anomaly exists, but we can also, under certain conditions, predict if a given anomaly corresponds to a large or a small quantity of sulfides. Here are explanations of the two parameters we will use to better describe the anomalies of our surveys.
5.1 Probability
A 0,9 probability indicates that the anomaly is actually present in the bedrock and that it will be intersected in more than nine out of ten attempted drill holes. A miss on such an anomaly means that there is either a mistake in chaining, or that the drill hole crossed the anomaly through a dyke, a faulted offset, or a local "barren" hole. Anyone with experience in a mine will testify that such occurrences can occasionally happen.
A 0,5 probability means that the signature of the anomaly is somewhat doubtful, the signal-to-noise is less man 3, either because the overburden is deep or because of the interference of an adjacent stronger anomaly. The probability that the anomaly corresponds to a target is therefore lowered to a point where only one in two of such drill holes will hit a target. For example, if a target is small but of cylindrical shape, a drill hole collared too far away may completely miss the anomaly if the cylinder has a lateral rake. Any target having a 0,5 probability must be drilled if the local geology is favourable or if the targets are few or far between. Out of the thousands of drill
GEOJIG Inc.

holes that we have recommended up to now, only six have resulted in mining operations. For three out of these six mines, the first drill hole was spotted on a doubtful anomaly where the probability was less than 0,5 or, in other words, there was only one chance out of two to explain the anomaly by a bedrock source. And yet, most of our D.D.H. recommendations are made on anomalies that have a probability of 0,9.
A 0,2 probability means that on the average only one drill hole in five will intersect a sulfide concentration important enough to explain the anomaly. Often this is much better to drill weak IP anomalies if the geology is favourable than to select diamond drill targets at random, or even to select magnetic anomalies or VLF targets. When comparing targets for example, we believe that the probability is much less than 0,1, that an "average" magnetic anomaly will correspond to sulfides or graphite and, if we consider VLF anomalies in clay areas, the probability is lower than 0,05, or hardly better than luck. However, VLF anomalies in clay areas or where the overburden is resistive may be just as reliable as MaxMin or Pulse surveys in outcrop areas, or where the overburden is non conductive.
5.2 Quantity of sulfldes
Once the geophysicist has expressed the probability of an anomaly, he may add the second parameter, that is the estimation of the content of sulfides (or graphite) that we may expect to find by diamond drilling.*
MaxMin, VLF and Pulse surveys do not allow to predict how much sulfides will be found as the same excellent conductor may be due tp a 2-cm thick pyrrhotine bed or to a 20-m chalcopyrite lense containing 109& copper. Our compilations and studies have actually shown that there is no correlation between either the quantity of sulfides or their economic content and the conductivity of EM conductors. On the other hand, I.P. surveys can semi-quantitatively predict the amount of sulfides or graphite that drilling will intersect. To this end, we have to take into account the width and the amplitude of the anomaly in mhosec, but also make our decisions according to the nature, thickness and conductivity of overburden covering the bedrock. Gravity surveys also allow such estimates.
6 . DESCRIPTION OF THE I.P. SURVEY
6.1 Resistivity
The resistivity map (#4322) shows that the bedrock is near the surface over most of the area with resistivity readings abovelOOO Q-m. Because the overburden is sandy in many parts of the grid, it could occasionally show higher resistivity areas even with deeper bedrock. South of 7+OOS, values over 10 000 Q-m reflect the presence of a mountain and of shallow overburden. Two small lakes (or swamps) showing low resistivity ^ 1000 Sl-m) are present on the north and east sections of the grid . Finally, in the northwest corner of the grid, the resistivity map reveals a wet area, probably covered by deeper overburden, with values under 500 ft-m.
* Reference: Gaucher Edwin, "Estimation of Sulfide Content of a Potential Orebody front Surface Observations and its Role in Optimising Exploration Programmes" in Developments in Geophysical Exploration Methods, published by Applied Science Publishers Ltd., England, 1984.
GEOIIG Inc.

6.2 Chargeability
The background chargeability on map 4323 is around 5 to 8 msec over most of the suboutcrop area, but it averages 25-35 msec over a highly resistive mountain at the south. This is likely to represent a high chargeability formation extending across the grid south of a line joining lines 12+OOE/850S and 0/600S. We interpreted anomalies in this formation only when the chargeability rose above 50 msec.
6.3 Normalized chargeability
The contoured normalized chargeability (map #4324) shows quite evidently the two major horizons containing sulfide or graphite concentrations. The background NC oscillates below 0,6 mhosec. In high resistivy areas, the compensation formula is less effective and the background is around 1,0 mhosec. The anomalies generally rise from l to 6 mhosec and sometimes reach 10 to 18 mhosec.
6.4 Description of IP anomalies
By this survey, we have been able to localize and describe five anomalies. Three of them are long and continuous I.P. axes in an E-W direction. The interpretation is largely based on the NC filter.
Anomalous readings, not supported by more than one reading, have not been considered. Another kind of "false anomalies" are the ones caused by a high between two low resistivity overburden zones (swamps, lakes). A good example of this is on line 100E, under station 112S where there is a 30-m wide high just before the lake. This high resistivity barrier has caused a core of low resistivity readings at the last separations and, consequently, a rise in the NC. This is one of the ambushes of a multiseparation I.P. survey, and more generally of any resistivity survey.
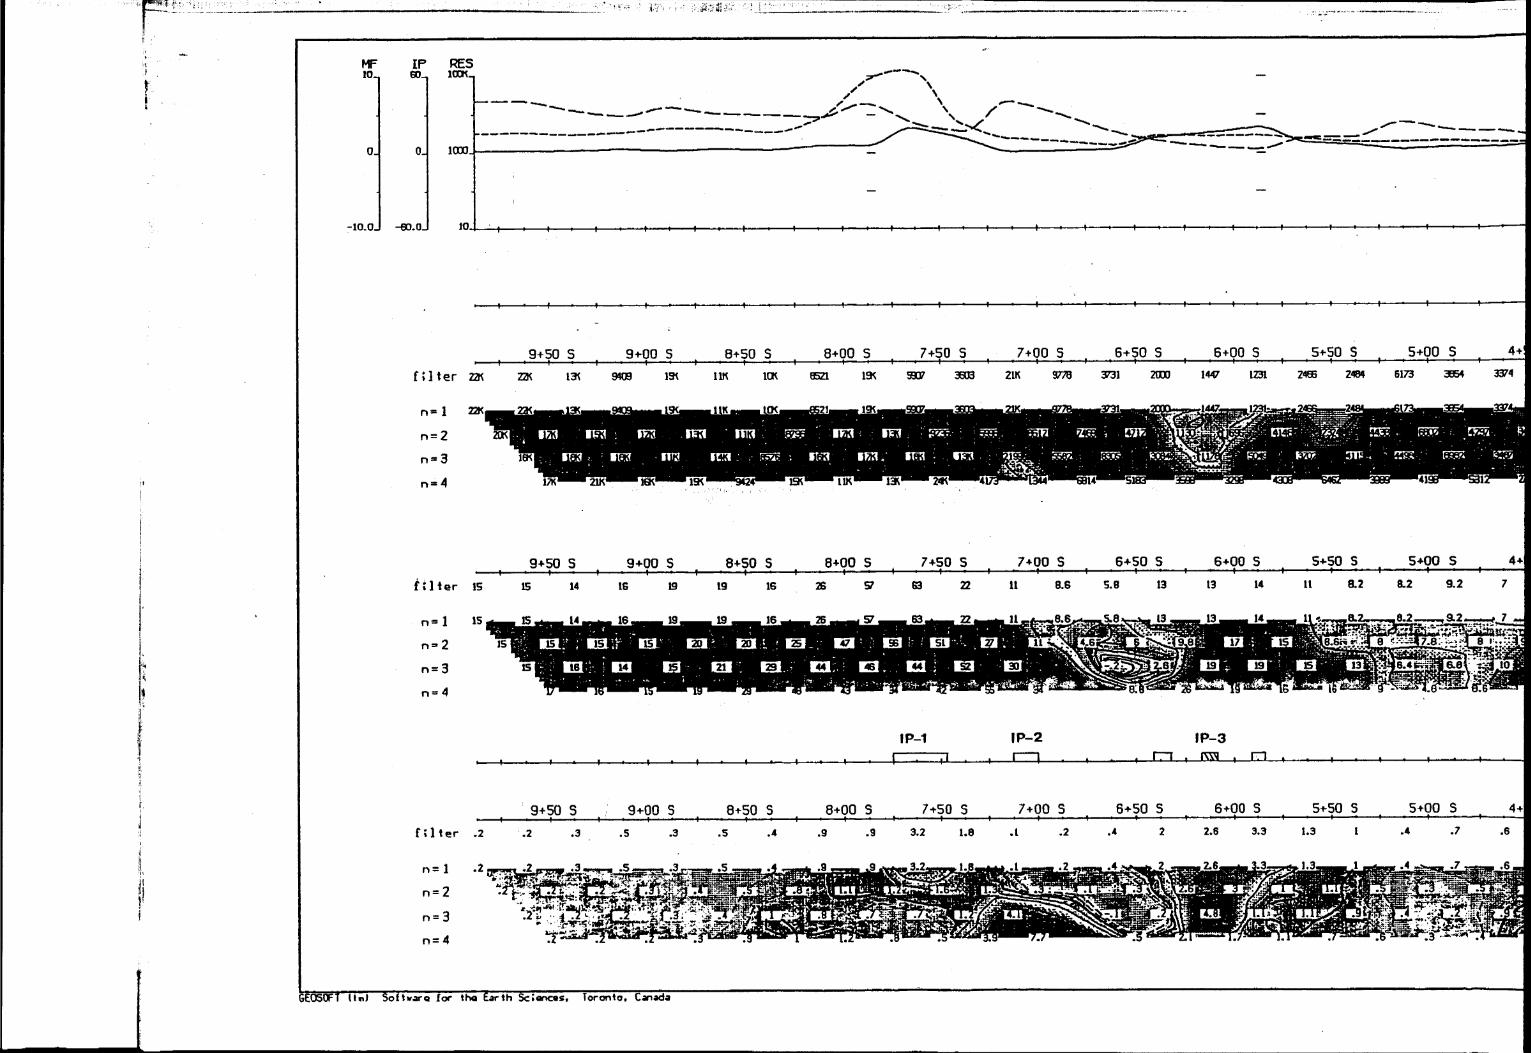
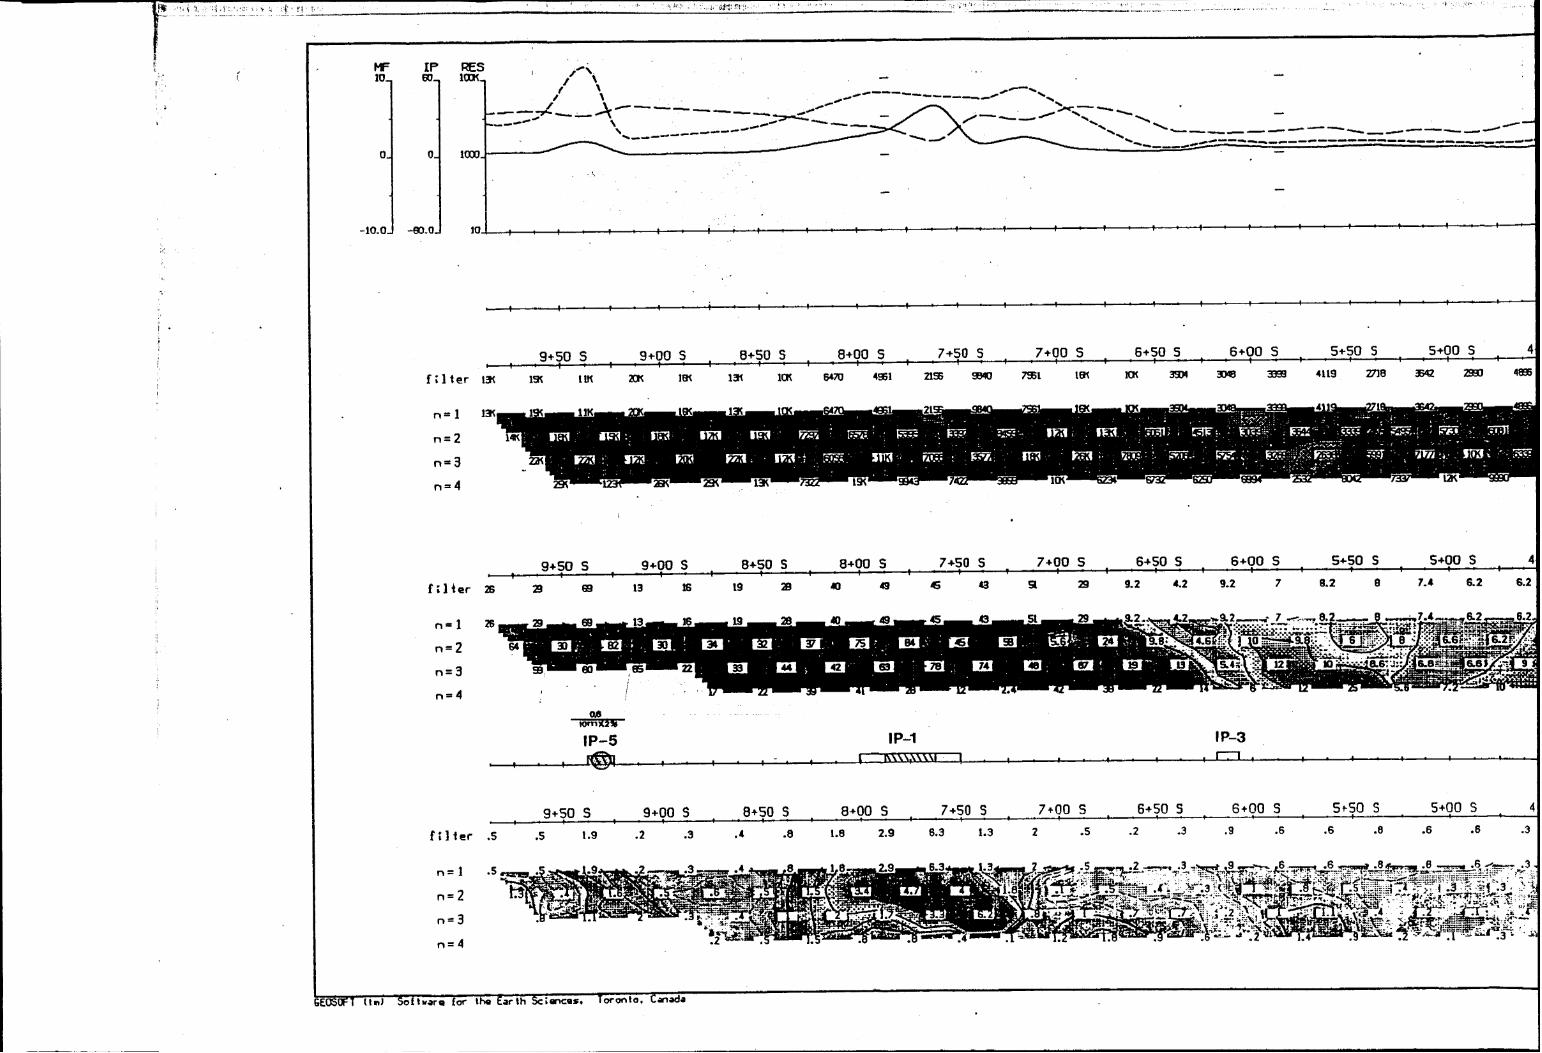
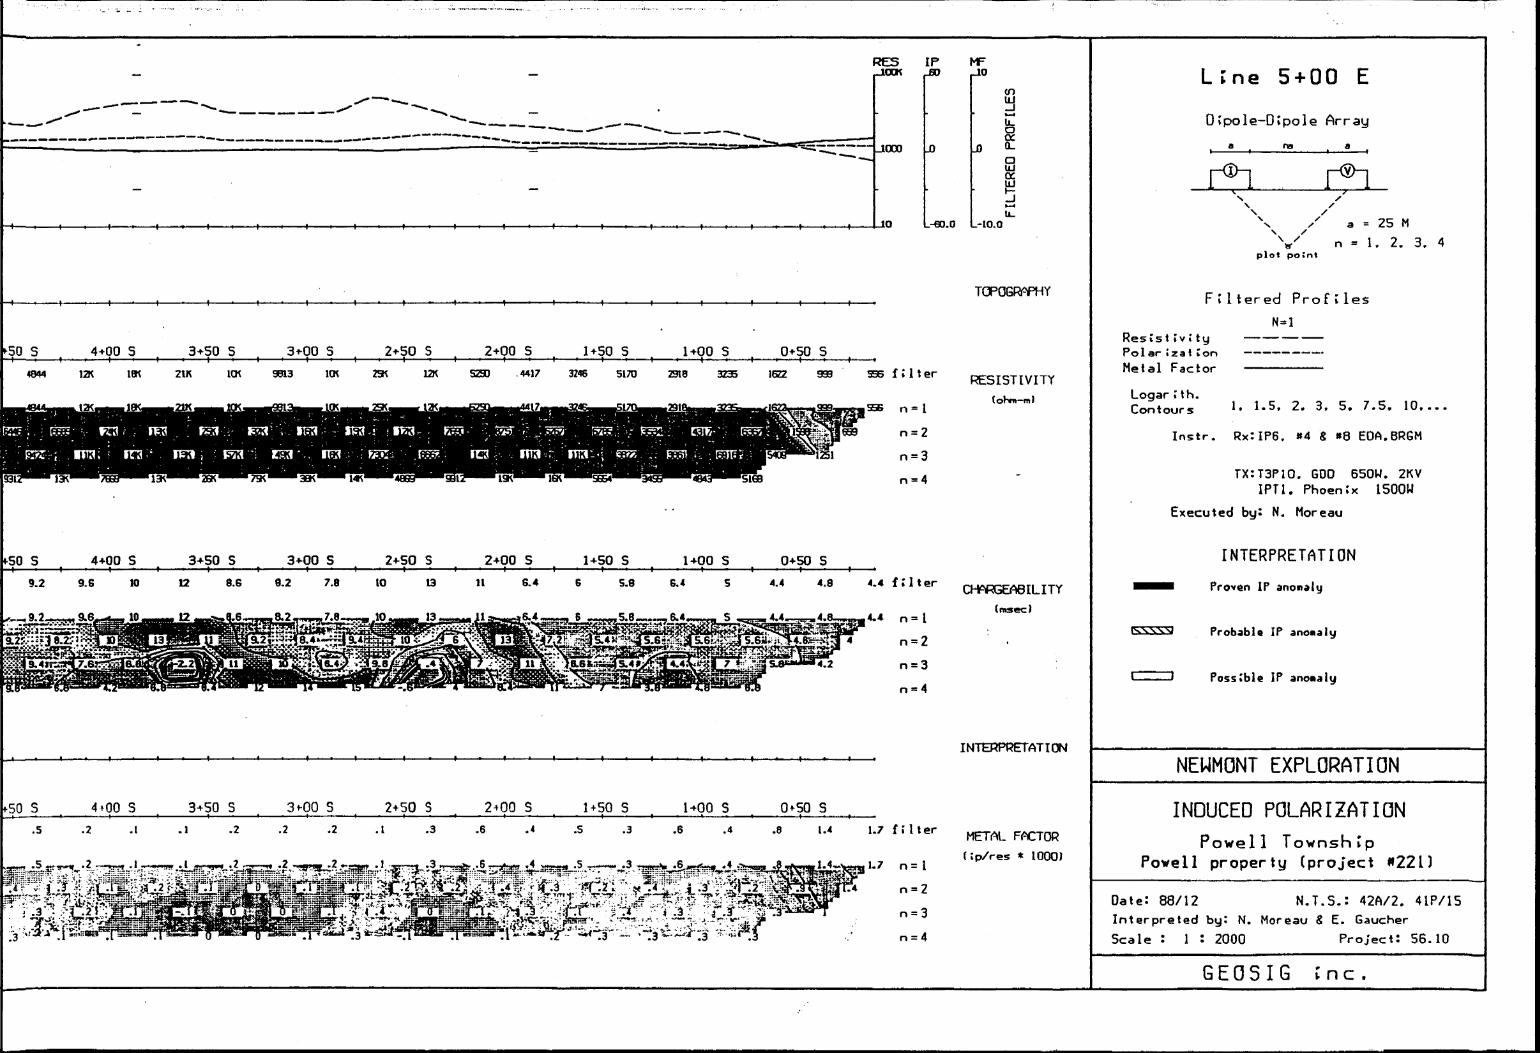
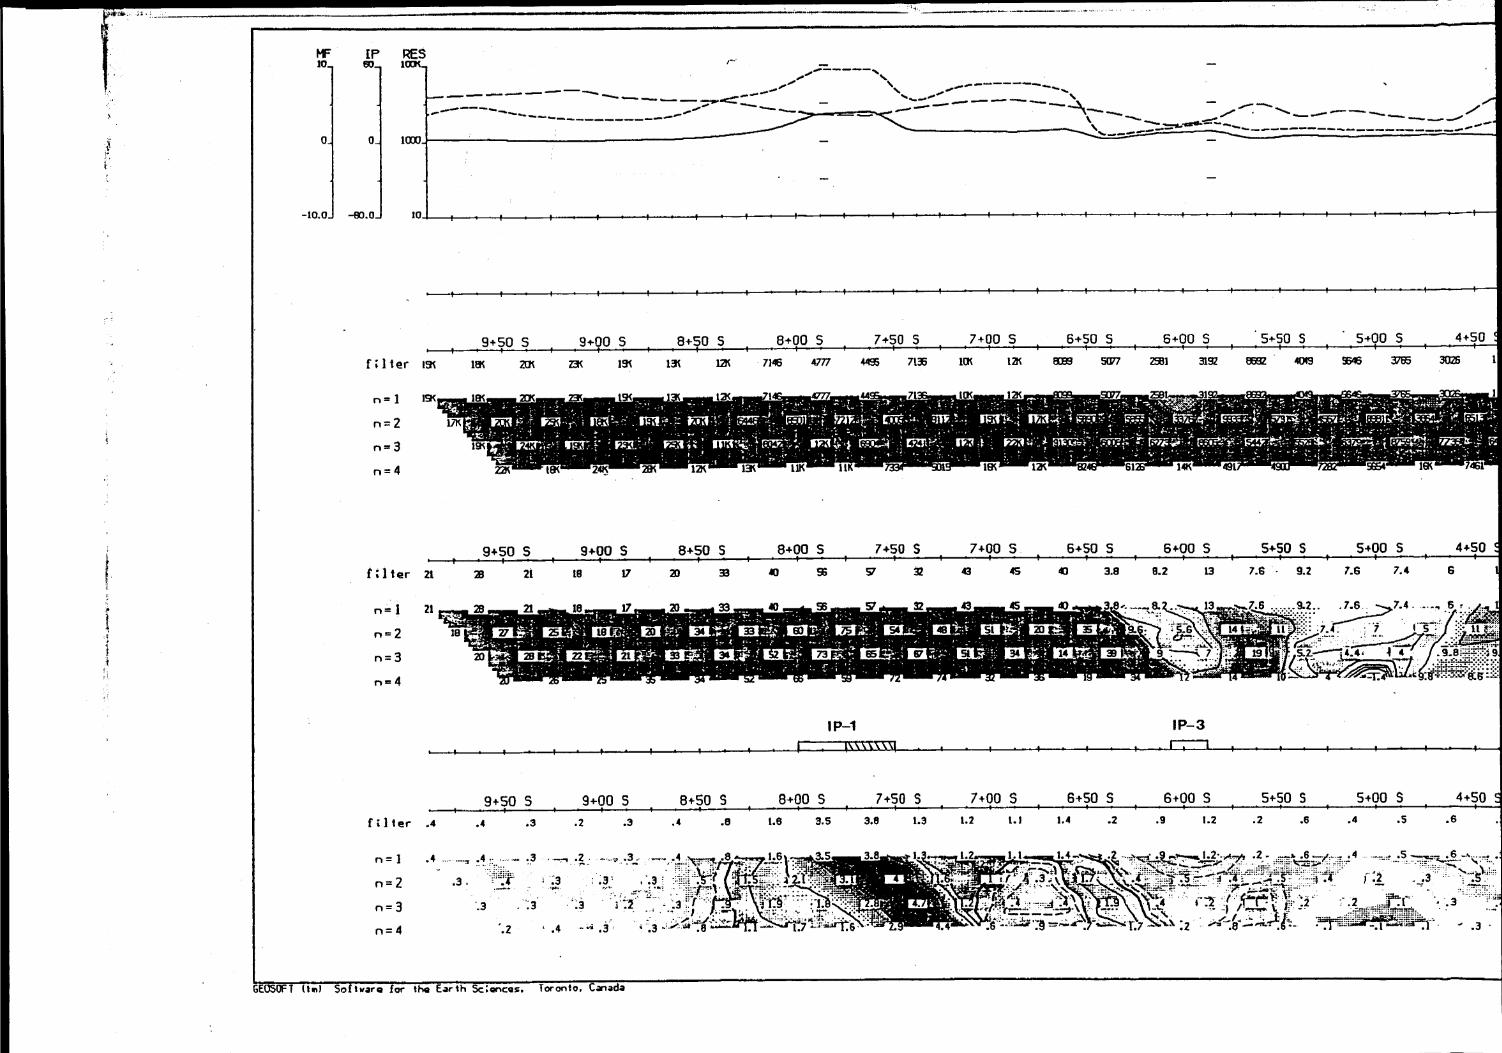
Anomaly IP-1
This 800-m long E-W anomaly occurs south of the grid, around station 800S. It extends from line 0/775S to line 800E/787S. The NC reaches 6 mhosec on line 100E/762S, or eight times the background. The resistivity drops to 4000 Q-m from a background of 8000 Q-m. The anomaly is generally wide (30-50 meters) and marked by a rising chargeability of over 50 msec in a formation showing high chargeabilities. The resistivity remains high.
A diamond drill hole under line 100E/762S has a probability of 0,6 to explain the anomaly. We estimate that it would intersect a 30-meter wide layer containing Wo of sulfides or graphite, this quantity being a "nominal" minimum layer which could be perceived under a conductive overburden of 100 Q-meter). Another DDH under line 600E/775S has a probability of 0,6 to find a 40-m wide layer containing 296 of sulfides or graphite.
Anomaly IP-2
This 300-m long E-W anomaly occurs southwest of the grid. It extends from line 0/775S to line 300E/705S. The NC reaches 15 mhosec at the second separation on line 0/725S, or 20 times the background. The resistivity drops to 1350 fl-m from a background of 5000 ft-m. The anomaly is clearer on the NC filter than it is in reality. IP-2 has the same pattern all along the horizon: the chargeability remains stable in formational high values, but the resistivity drops at
GEO5IG Inc.
separations 2, 3 and 4, causing high NC values. This non-standard pattern explains the low probability that we gave to IP-2.
A diamond drill hole under line 0/725S has a probability of 0,4 to explain the anomaly. We estimate that it would intersect a 5-meter wide layer containing 59c of sulfides or graphite.
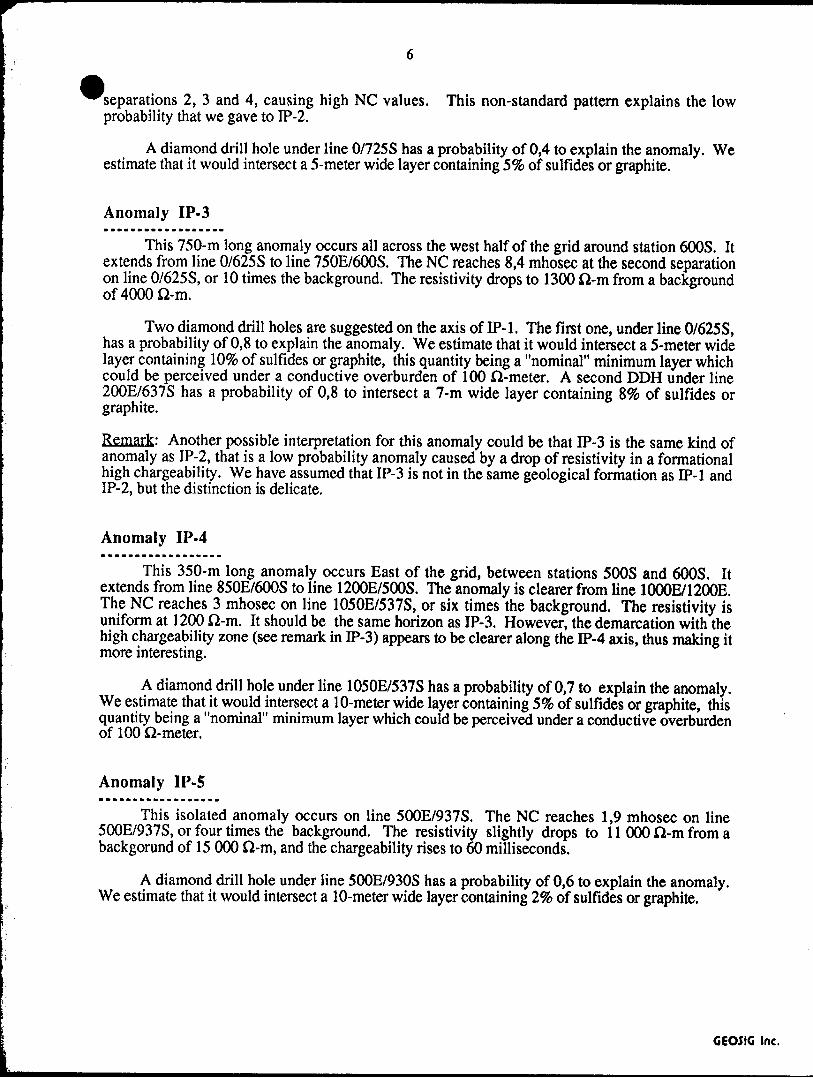
Anomaly IP-3
This 750-m long anomaly occurs all across the west half of the grid around station 600S. It extends from line 0/625S to line 750E/600S. The NC reaches 8,4 mhosec at the second separation on line 0/625S, or 10 times the background. The resistivity drops to 1300 ft-m from a background of4000fl-m.
Two diamond drill holes are suggested on the axis of IP-1. The first one, under line 0/625S, has a probability of 0,8 to explain the anomaly. We estimate that it would intersect a 5-meter wide layer containing 1096 of sulfides or graphite, this quantity being a "nominal" minimum layer which could be perceived under a conductive overburden of 100 Q-meter. A second DDH under line 200E/637S has a probability of 0,8 to intersect a 7-m wide layer containing 8% of sulfides or graphite.
Remark: Another possible interpretation for this anomaly could be that IP-3 is the same kind of anomaly as IP-2, that is a low probability anomaly caused by a drop of resistivity in a foraiational high chargeability. We have assumed that IP-3 is not in the same geological formation as IP-1 and IP-2, but the distinction is delicate.
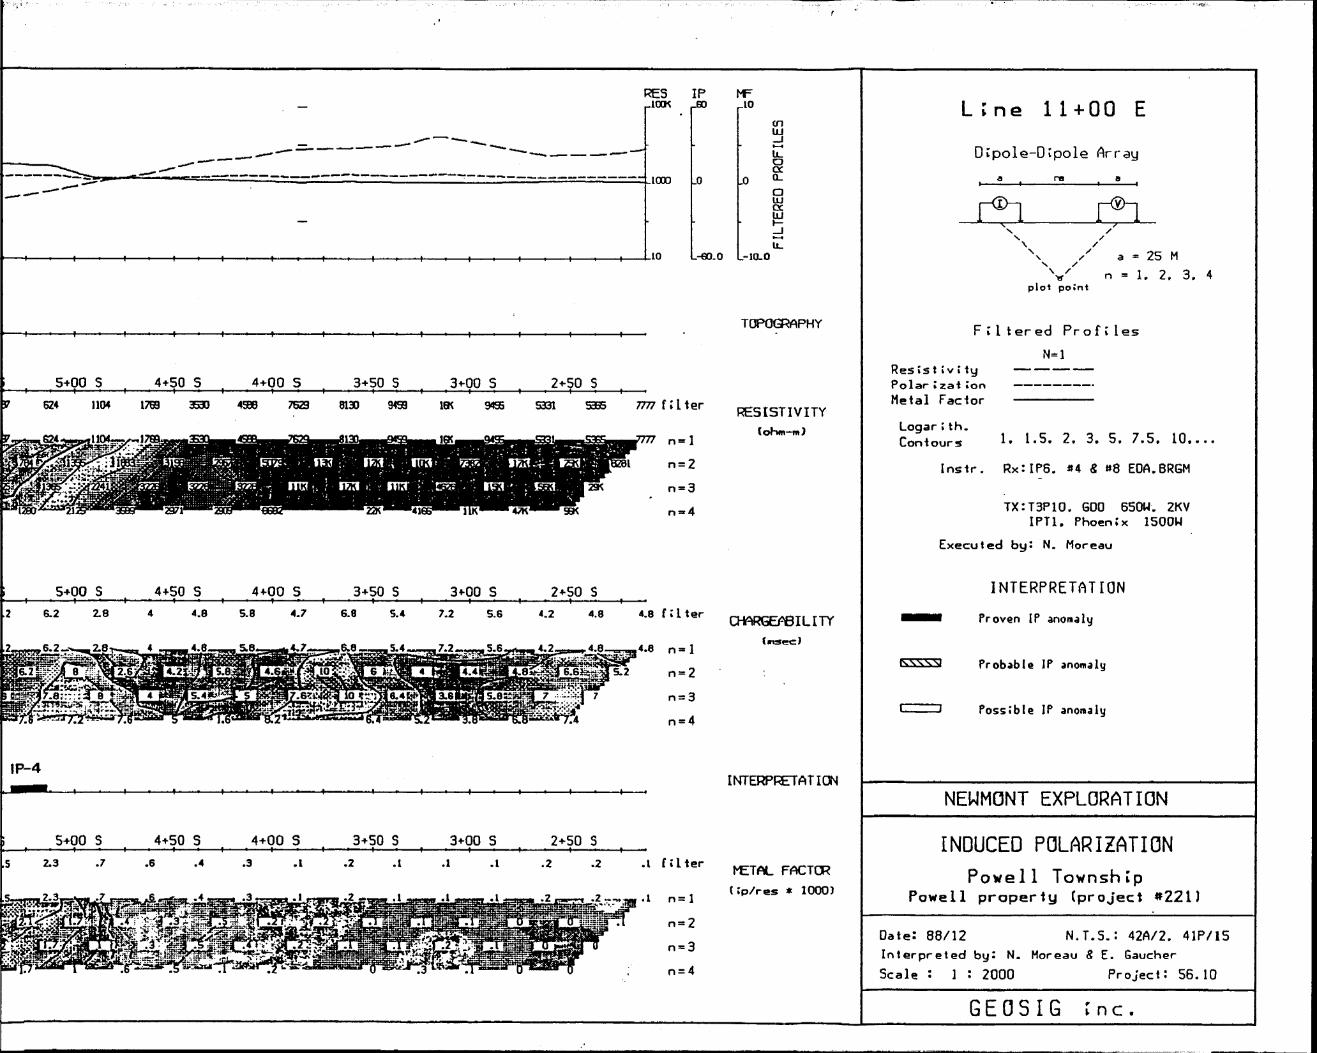
Anomaly IP-4
This 350-m long anomaly occurs East of the grid, between stations 500S and 600S. It extends from line 850E/600S to line 1200E/500S. The anomaly is clearer from line 1000E/1200E. The NC reaches 3 mhosec on line 1050E/537S, or six times the background. The resistivity is uniform at 1200 Q-m. It should be the same horizon as IP-3. However, the demarcation with the high chargeability zone (see remark in IP-3) appears to be clearer along the IP-4 axis, thus making it more interesting.
A diamond drill hole under line 1050E/537S has a probability of 0,7 to explain the anomaly. We estimate that it would intersect a 10-meter wide layer containing 59k of sulfides or graphite, this quantity being a "nominal" minimum layer which could be perceived under a conductive overburden of 100 Q-meter.
Anomaly IP-S
This isolated anomaly occurs on line 500E/937S. The NC reaches 1,9 mhosec on line 500E/937S, or four times the background. The resistivity slightly drops to 11 000 Q-m from a backgorund of 15 000 Q-m, and the chargeability rises to 60 milliseconds.
A diamond drill hole under line 500E/930S has a probability of 0,6 to explain the anomaly. We estimate that it would intersect a 10-meter wide layer containing 29fc of sulfides or graphite.
GEOJIG Inc.

'CONCLUSION
The I.P. survey allowed us to define five anomalies, four of which are continuous axes situated on both sides of a known gold showing. A diamond drill hole campaign has been executed in January 1989 on the basis of primary results of our survey. A more complete interpretation has been done and it should be correlated with drilling results. This exercice will reveal the pertinence of continuing the drilling program on the Powell property. Because of the shallow overburden, several of the anomalies could be sampled by trenching or with small pits, blasted in the bedrock, and then drilled only if gold or other values are encountered.
RECOMMENDED TARGETS
Anomaly
IP-1
ff-1
IP-2
IP-3
IP-3
IP-4
IP-5
Line
100E
600E
000
000
200E
1050E
500E
Station
762S
775S
725S
625S
6375
5375
930S
Resistivity
(Q-m)
3952
3320
1356
1292
1401
1196
11000
Normalized Chargeability
(mhosec)
6,0
6,3
15,0
8,4
3,8
3,0
1,9
Probability
0,6
0,6
0,4
0,8
0,8
0,8
0,6
Quantity ofsulfides
30 m x \ *k
40 m x 296
5mx7%
5 m x 1096
7mx8#.
10 m x 596
10 m x 296
GEO5IG Inc.

epeu?*) -oiuojoi 'SKXJO'.Xjoj ajc*jjog im) XJQS039
T'9-I 'S S'EZ- 6-E Z't /'Ze-o rOS+fr S 00+S S OS+S S 00+9S OS+9S 00+ZS 00*8S OS+8S 00+6 S OS+6
ei EIBlfS8"6 9'Z8319ZE8-1
OS+fr - S 00+Ss os+sS 00+9 S OS+9s-oo+zS 00+8S OS+8S 00+6 S OS+6
fr.U
iCE iClGEOIr OS* ttfrZ OK B^HZ QSZ ZfaS bZZS BITS /GS9 69S^ H91 ittl VEl SE99 iflZ SZEI Z16Z! J
S 00+SS OS+SS 00+9S OS+9S 00+ZS OS+ZS 00+8S OS+8S 00+6S OS+6
•oooi
"MCDI '"CaS3b di
01 ~0*09~ "D*OI~
01
^^ji^^r^l-;^^^^^ Mi Uiilt-^ .^f-'i.lj ^••i-^ .^-Ste ^
RES IP.JOCK J30
———————~2 jooo JJ
L-60.0
CD UJ
U-o oe o.oUJ QC UJ
u.
4-t-OO 5 • 3-T0 -S . 3+00 S 2+50 S 2+00 S 1+50 S 1+00 S 0+50 S854 1940 4906 1005 1242 353 472 1051 filter
4+00 S 3+50 S 3+00 S 2+50 S 2+00 S 1+50 S 1+00 S 0+50 Su 8.6 -.4 2.2 l 2.2 2.2 3.6 4.6 4.4 3.6 1.8 2.4 2.6 filter
4+00 S 3+50 S 3+00 S 2+50 5 2+00 S 1+50 S 1+00 S 0+50 S.2 1.1 -.2 1.2 .6 1.3 2.1 2.1 1.4 .5 .2 .5 .7 1.2 t.3 .7 filter
L-10.0
TOPOGRAPHY
RESISTIVITY(ohm—m)
CHARGEABILITY(nisec)
INTERPRETATION
METAL FfCTORCp/res * 1000)
Line 0+00
Dlpole-Di'pole Array
plot point
a - 25 M
n = l, 2. 3, 4
Filtered Profiles
N^Resistivity ———— — —— Polarization —————————- Metal Factor —————————
Logar11h.Contours ** 1-5. 2. 3, 5, 7.5. 10.
Instr. Rx:IP6. *4 S *8 EOA.BRGM
TXIT3P10. GOO 650W. 2KV IPT1. Phoenix 150054
Executed by: N. Moreau
INTERPRETATION
Proven IP anomaly
Probable IP anomaly
Possible IP anomaly
NEWMONT EXPLORATION
INDUCED POLARIZATIONPowell Township
Powell property (project *22U
Date: 88/12 N.T.S.: 42A/2. 41P/15Interpreted by: N. Moreau S E. GaucherScale : l : 2000 Project: 55.10
GEOSIG I nc.

33
33
\ l) i r
1
t 1 '
y 1, 1 li • ' 1
t\ !\ J l \ \i'
\ \ \
| \ 1
1 J
•-- i '
;
i. i .

333
II II
IIOJ
M
i-
s)
en
H-
O
O en en
a CO ea -t o o CO lv? en
o CO N)
O o CO en
o CO o
o en O en
o CO
]
fei
lcl
IB!
J O
)
IS"
m T
3
3 3
II II
IICO
NJ
*-
m
bi ffi r* K)
o
o in CO 8 CO CO en M en
o CO rv) o
o w ui
a CO o
a CO o 4- en
o CO
o T
3333
II II
II II
-tk.
CO
M
i-
•o
o en eu en
a en eo o
o en rsi
en
o en a
o en en
o en o
a en O 4- en
a en
x1
T/ t
\ \ \ //x
V f
1 i •" J
ro
o Fl Q
CO
i Q
FILT
ERED
PR
OFI
LES
.1
en
rn
Q CO i—i
CD D n
co
k-,
a(1
30)
-i •O
CO
00i—
(O
~
Q
. tv
) • *
crNJ
u:
o "
o
o z o T
ID c m
7
' "
O O
ui
en o .j: en
-o O ro
O
T)
* a^*
x CO
N)
Z a
c
n
m
o "O a TD i — i
M g 2
rn
zz
3: a m
x Q
X3 :o
-o
o in ut cr *M
*
(O tt 1C*
o cr o- m -5
b O 9 (C*
i T)
n
O 10 •s Q 9
tt
m 73
-X3 XI m -H
m x n n c n a. cr
x1C •-
t-. —
t"O
CO
2-1-0
O rv
Ql
-o T e
n o
a
ra a
x'
en
en
o
o O
N)
x: z
*.
3 in 73 x -o O) tt CO m
o CO
X)
CD
n r
o o
3 10
rf- ti
O
1
o n
"- w
li
ri
l. W
w 3~
n
— '*
en NJ en en
o o
-i 3
m Q. i o (B
I/I
•o x
a ^
K
3 N\
3 tt
MM
CO •* *k
CD
* l
(^
l O
3 f i—
"fO T
fr ~1
OJ
1C
D fD O •f
CJ1
D m
:i l -i -f l 3

3333
It II
II II
-t*.
CO
N)
f" w*
.-•••/
i
J3
,'d*
"-'
"\
m
S S
l
"lil * ^
o CO CO 00 en
O)
oo •t- o CO en
2 S r ro
o
o CO O) en
o CO o o
o eo en en
o CO en 4 O
O eo en
o eo 4-
O
]7 o

00 01 w N M Ci)
UI
CO CO
^ lw CO
3 II
i0
OJ
333
II II
II CO
N
J i—
en
o en CO •t- fs) en
O N) •*- O o CO en
O CO o
o en o en
o CO
ft
S(D
3 II co
3 II
en CO CO S en M t en
a -t- o
o CO en
o CO •f o
o CO en
o CO
\
o
o
a
a
xi
3 ili
o" I-H
"
Q
CDFI
LTER
ED P
ROFI
LES
CD m Q
CO l—l
en T* *
D n
co
"-i a
n 3
t*eu
~ ~
i~
io n
(B -l
..T
)• *
T
CD
ID
00
—
X
•—
IB
t—
Q.
fsj
• a
CT
N)
1CO
• '
O o
z z
o -l ID
0) Po m
O CD
c.
, i,
ID
Cn
nw
* T
""
ID Ten O
)
co N) :D
x en
-Q
Q * (D 25 •a
fDro
^-i
n i—
.v*
* c ^
^, o
X)
*
O IA
'
"Tm
•J n
-*
^ -o
N)
N)
D n
m a "D a N Q
m 3Z 2
Q m
x T3 f
Q
73 Q
o in ut 3
O
9
tl
cr )-i
ie 3
O 9
l O ID 3 s o
rn l m
m
x 2 n a. cr
1C o ra ai
"D u- e
no
ara
a3 x
en
en
o
o
a
z:
o r
-o
o3 I
D^.
^
O
li-i
C
-.3
T —
Ift W
T
T)
O)
00 CO ni
o CD
01 N)
CO en en
2 "
O 33
m o
n"
—
WO
l li
ri
•—
T
W-n
N'
Zt01
01
^
n —
—r*
- *-
* rf
O
O
1C
m T ro Q.
"D m w
o /
x•o
*.Q
\
IX)
V O)
-Cx
N) en
o *- ^
TD
O m i o •o' o IB -i
i
Qj
1C
D fD O
O m

ffi
m Si l/l
o
i p
Q
* o ? i" T tf u a
u
3333
u n
H n
4*.
cu
N)
t- lIM
IRS
fr&
li-S
fa-:^
! i.J
.'-;\H
ts K
It T
33
II
II CO
M
3 U
(d
(O •* en
o en CD GO U)
GO CO en o U)
O
O U)
O)
Ul o U)
CD o
o CO en
g CO en a
o eo
El
IB! Iftl
lwl C
o l l c l
ID T s w
33
33
II
II II
II -U
O
) M
k—
M
K
fi K) P
O)
^
(O S CO (O o a en 09 en a en 03 i CO -st en en a
o en en S en O) g
en en g
en en S en
I i
eo -h
-en
a en LO
•f a
a en aa en a en GO fi en •si
- en vi •t- a
a en O) en
a en O) t O o
en en en
o eo en a
a en
4

RESJOCK
IP
Uooo
MFr-10
L-eo.o
in UJ
IJLo exQ-oUJsu.
L 50 S 4+00 S 3+50 S 3+00 S 2+50 S 2+00 S 1+50 S 1+00 S 0+50 S1957 Z30Z 753 1700 795 325 2D3 262 290 631 1073 2475 12* 42K 187 635 282
6283
424 filter
42* 0=1
0 = 3
0 = 4
50 S 4+00 S 3+50 S 3+00 S 2+50 S 2+00 S 1+50 S 1+00 S 0+50 S
3.4 3.6
.3.4
2.6 5.2 5.6 4.6 3.2 2.6 2.8 4.6 6.8 8.2 li 4.8 2.8 filter
2.6 0=1
0=2
0 = 3
0 = 4
50 S 4+00 S 3+50 S 3+00 S 2+50 S 2+00 S 1+50 S 1+00 S 0+50 S
.5 .4 .9 .9 1.9 2.4 2.1 1.5 1.8 '1.2 .8 .2 .7 1.S 2.2 1.3 f Slier
.4
L-IO.O
TOPOGRAPHY
RESISTIVITY(oKm—m)
CHARGEABILITY (msec)
INTERPRETATION
METAL FACTOR (Cp/res * 1000)
Line 1+50 E
D Ipole-Dfpole Arraya ra*--—
x
/' a = 25 M
n ~ 1 . 2. 3. 4plot point
Filtered ProfilesN-l
Resistivity ————— Polarization —————————— Metal Factor ————————
Logar:th.Contours l* 1-5. 2. 3. 5, 7.5, 10,
Instr. Rx:IP6. *4 5 *8 EDA.BRGM
.TX:T3P10. GDD 650H. 2KV IPT1, Phoenix 1500U
Executed by: N. Moreau
INTERPRETATION
Proven IP anonaly
Probable IP anomaly
Possible IP anomaly
NEWMONT EXPLORATION
INDUCED POLARIZATIONPowell Township
Powell property (project *22l)
Date: 88/12 N.T.S.: 42A/2. 41P/15Interpreted by: N. Moreau 4 E. GaucherScale : l : 2000 Project: 56.10
6EOSIG I nc.

'•)tKfr- t{W***ilf*l*!f:^n;i*rt"- -'W*"**.^-^ " •v: " J . ••-^v.^f^rr-'i-.ii^i-^'1^|fr'T*;"f:p*'*:*
MF 10-,
0.
IP RES 60., 100K-,
0.
-10.0J -eo-oJ 10.
1000-
-I—————I--I————————t-
9+50 S 9+00 5 S-t-50 5 8+00 S 7+50 S 7+00 S 6+50 5 6+00 5 5+50 S t 5+00 S t ,4+SO 5filter ISK
0=1 19K
0 = 2
0 = 4
18K UK 85Z9 5834 13K 14K 3481 UK 13t 47* 320 1401 1346 3834 4628 5B95 253 2445 4442 19
9+50 S 9*00 S 8+50 S 8+00 S 7+50 S 7+00 S 6+50 S 6+00 S 5+50 S S+00 S 4+50 Sfiller 15 16 20 19 19 21 3D 10 St 48 22 8.8 4.2 7.4 IS 17 12 6.S 7.4 6.8
0=1
0 = 2
0=3
0 = 4
15
17
os
IP-1 IP-2 IP-3
9+50 S 9+00 S 8+50 S 8+00 S 7+50 S 7+00 S 6+50 S 6+00 S 5+50 S 5+00 S 4+50 Sfilter .2
0=1 .2. 0=2
0=3
0=4
.5 .8 l .4 .3 1.4 1.2 .4 .1 .2 2.3 3.8 3.9 .9 .4 .3 .8 .7
GEOSOFI lUl Soflwaro for Ih* Earth Sclcocas. Toronto.

RES IP MrJOCK ,-fiO ^10
JUXD
--60.0
U.ga. a
lIL
4+00 S 3+50 S 3+00 S 2+50 S 2+00 S 1+50 S 1+00 S 0+50 SO 1314 657 989 425 415 420 720 1052 1518 4285 7491 3796 595 206 733 912 filter
4+00 S 3+50 S 3+00 S 2+50 S 2+00 S 1+50 S 1+00 S 0+50 S5.4 4.4 6.4 5.8 4.8 3.6 4.2 2.4 3.4 8 6 4.6
B
4.2 3.8 filter
A 1 1 A ~. ~ 1• •^*WP™^'*O n—i
n = 4
4+00 S 3+50 S 3+00 S 2+50 S 2+00 S 1+50 S 1+00 S 0+50 S1.2 1.6 1.9 2.6 2.2 1.6 1.7 1.1 .4 .2 .1 .2 1.8 3.3 1.4 1.2 ftlter
--10.0
TC3POGRAPHY
RESISTIVITY(ohm—m)
CHARGEABILITY(msec)
INTERPRETATION
METAL FACTOR Cp/res * 1000)
Line 2 +00 E
Dlpole-DCpole Array
\x /' a = 25 M XVX n - 1. 2. 3, 4
plot point
Filtered Profiles
Resistivity ——————PolarizatCon ————————-Metal Factor ————————
Logan lth.Contours * •l*''' *-* 31 b . /.b, lu....
Instr. Rx:lP6. *4 S, n8 EDA.BRGM
TXIT3P10. 600 650H. 2KV IPT1. Phoenix 1500U
Executed by: N . Moreau
INTERPRETATION
••^ Proven IP anomaly
rv\\\M Probable IP anomaly
l l Possible IP anomaly
NEWMONT EXPLORATION
INDUCED POLARIZATIONPowell Township
Powell property (project *22l)
Date! 88/12 N.T.S.: 42A/2. 41P/15 Interpreted by: N. Moreau 8 E. GaucherScale : l : 2000 Project: 56.10
GEOSIG inc.

^g^K^^^i^^j.J^,,^^;;,^^^^^-^:!,:^. ;xj.,^.i H?*** -'~ ' ' '-' - '1--S i- - ' ' : " "' ' -..___,, ,.. j - —--
MF
o.
IP RES60., 1CCK
-10-oJ -eo.oJ 10
1000.
filter UK
0=1
0 = 2
0 = 3 o-4
14K
filter 12
0=1
0=2
0=3
0 = 4
12
filter .2
0=1 .2
0=2
0=3
0=4
H———i———t- -I——l——I-
-1—————t- H————————t-
9+50 S 9*00 S 8*50 S 8+00 S 7+00 S 6+SO S 6+00 S 5+50 S 5+00 S 4+50 S 4+00 S 3+50
19K 6711 8823 16K 12K 7235 14K MK 5191 1935 1931 1009 2080 2385 3493 2417 3820 6070 3992 2245 1730 813
UK" •UK* 1 14K' 'ISK
9+50 S 9+00 S 8+50 S 8+00 S 7+50 S 7+00 S 6+SO S 6+00 S 5+50 S S+00 S 4+50 S 4+00 S 3+50
13 13 16 16 27 33 32 20 7.8 3.2 4.8 12 18
13
20
IP-1 IP-2 IP-3. I\VV4
9+50 S 9+00 S 8+50 S 8+00 S 7+50 S 7+00 S 6+50 S 6+00 S 5+50 S 5+00 S 4+50 S 4+00 S 3+50
.2 .7 .5 .4 .8 1.3 l .5 .1 .t 1.7 5.4 2.2 .7 .5 .7 .5 .3 .e 1.4 1.2 2.2
ri^r
btOSUM (Inl Software for t ha Earth ScJcnc**, Toronto. Canada

RES IPJOCK
MF
H————i———l———i———t- -I———i————t- -l———i———t-
L1000
jo L-eo.o L-io.0
(n ID
be
— —— i —
5335
3+00 S 2+50 S 2+00 S 1+50 S——— i ———— t —— , —— i ———— i —— i —— i —— , —— i ———— i —— i —— i534 1525 3WO 13K 6035 5914 1^ 1775
1+00 S 0+50 S1617 415 332 738 IS
3*00 S 2*50 S 2+00 S 1+SO S 1400 S 0+50 S
5.8 2.6 4.2 , 9.2 4.8 5. B 4.2 4.8 4.4 4.8 filter
3+00 S 2+50 S 2+00 S 1+50 S 1+00 S 0+50 S
2.3 .8 .6 .1 .3 .1 .8 1.9 2.3 1.5 .8 filter
TOPOGRi*PHY
RESISTIVITY(ohm—m)
CrWRGEABILITY(msec)
INTERPRETATION
METAL FCCTOR
(Cp/res * 1000)
Lvne 2+50 E
Dtpole-Dipole Array
plot point
a ' 25 M n " 1. 2. 3. 4
Filtered Profiles
\\~\ Resistivity ——— — —Polarization — — — - — -— — — Metal Factor —————————
Logan I th.Contours '* l'^* i * 3 ( o. /.b. lU t
Instr. RxIIPS, *4 S *8 EDA.BRGM
TX:T3P10. GOO 650W. 2KV IPT1. Phoenix 1500H
Executed by! N . Moreau
INTERPRETATION
•••i Proven IP snonaly
Probable IP anomaly
Possible IP anomaly
NEWMONT EXPLORATION
INDUCED POLARIZATIONPowell Township
Powell property (project *22U
Date: 88/12 N.T.S.: 42A/2. 41P/15
Interpreted by! N. Moreau 8 E. GaucherScale : l : 2000 Project: 56.10
GEOSIG n c .
MF 10.,
0.
IP RES60-. 100K-.
-10.0. -60.0- 10.
1000.
-l——i——t-
1 9^-50 5 9+00 S 8+SO S 8+00 5 7+50 5 7+00 S 6+50 S 6+00 S 5+50 S 5-t-OO S
niter 22K
o — l 22K|
0=2 ZCK|
0 = 3
0=4
9W9 11K 10K 8521 1SK 5307 3603 21K ST78 3731 2000 1*17 1231 2166 218* 6173 3354 3371
•15K
9+50 S 9-1-00 S 8+50 S 8+00 S 7+50 S 7+00 S 6+50 S 6+00 S S+SO S 5+00 S
filter 15
0=1
0=2
0 = 3
0 = 4
15
16 19 19 16 26 63 22 11 8.6 S. 8 13 13 14
IP-1 IP-2 IP-3
9+50 S 9+00 S 8+50 S 8+00 S 7+50 S 7+00 S 6+50 S 6+00 S 5+50 S 5+00 S
filter .2 .2 .3 .3 .5 .4 .9 .9 3.2 1.8 .1 .2 2.6 3.3 1.3 l .4 .7 .6
bc05uri lin) So H vara far tha tarth Sctancas, Toronto. Canada

RESJOCK
IP
uiooo
MF-10
JD
.-eo.o
en
glo *
UJ
t—tU-
.9
-l—————t-
4+00 S 3+50 S 3+00 S 2+50 S 2+00 S 1+50 S 1+00 S 0+50 SBM filter
3 filter
4+00 S 3+50 S 3+00 S 2+50 S 2+00 S 1+50 S 1+00 S 0+50 S1.6 -.2 t .7 .4 .2 .2 .2 .9 1.6 1.6 2.4 1.1 filter
L-10.0
TCFOGfVPHY
RESISTIVITY(ohm—m)
CHANGEABILITY(msec)
INTERPRETATION
METAL RECTOR Up/res * 1000)
Line 3+00 E
DJpole-Ovpole Array
a naa
f a = 25 Mn - 1. 2. 3. 4
plot po I n t
Fi Itered Profiles
Resistivity —————-Polarization ——————-Metal Factor ——————
Logar 1 1 h. Contours ^* ^*^' ^. 3, 5. 7.5, 10,
Instr. Rx:lP6. n4 S *8 EDA.BRGH
TX:T3P10. GOD 650H. 2KV IPT1. Phoenix 1500W
Executed by! N. Moreau
INTERPRETATION
H Proven IP anoaaly
Probable IP anomaly
Possible IP anomaly
NEWMONT EXPLORATION
INDUCED POLARIZATIONPowell Township
Powell property (project *221)
Date: 88/12 N.T.S.: 42A/2. 41P/15Interpreted by: N. Moreau 8 E. GaucherScale : l : 2000 Project: 55.10
GEOSIG I nc.

-stope;:-;JQJ
^-^*:f"-^-^k-y^&icvT**X*3*x,fc -iti U-'-v . :..:3llBsa:! *v : •'K.isiSigljSi'*;.- ,-.-; ••""rrr-asarnrrpv-s^fi'T^ "•yT'e-"--!^ ; , :^^|^|^.^^g^J|;^
S'cyr\ S7 ri z'i9-z-r9-CIS'i ri9-S1e-E'Z'
s oo^-ss os-^sS 00+9S OS+9S 00 + /S 00*-9S 05+8S 00+6S OS+6
e-di
:ii^5Tnp^5 '•^r. jasi^iirfr-J'^raCSo 91 r: nz-sb^ia S :
/R —^^B M ^••BB CI B^^^ T7 ,
El
8'6Zl.11
S 00+SS 00+9S OS+9
69ZECE91Zl
'Zl
Zl
'SI
SI
S OS+/S 00+8S OS+8S 00+6S OS+6
*9K CESS 691E 1/1Z 1SS1 /I6I 669Z SS9E 83UXQl CB1B 9IEEIBlHil
S OO+SS OS+SS 00+9S OS+9S 00+/S OS+ZS 00+8S OS+8'S 00+6S OS+6
E=U
01 "0"09- "0*01-
0001
MQOldi
01
,- Mi*.-

RES JOCK
IP JBO
-1000
.10
MF JO
.-60.0 .-IQ.O
(T)
dtnoOUJ Cf. UJ
4+00 S 3+50 S 3+00 S 2+50 S 2+00 S 1+50 S 1+00 S 0+50 S
1604 1310 630 659 624 1310 39W 7353 7716 4623 Z797 1181 IW3 692 333 391 724 f 11t er
ea?
4+00 S 3+50 S 3+00 S 2+50 S 2+00 S 1+50 S 1+00 S 0+50 S
5.4 4.4 4.6 2.8 7.2 6.4 10 13 12 5.6 3.4 4.6 4.8 5.4 4.4 4.8 f: her
"^ ;JF-" - - c c l , * A t K . * a •xc--S.4 x.—^4.4-,——m 4 -^.-4.8 0=1!®^^^^B|^^V \"V. :"-:V*;.- ; "TV;.- ; , ^~^ ^—^^^ ^^~^^'--'^'~ 'yf*^^^H^-y4*-5;': '''".ffi-'^:i^l : ' ilfi- : • ;Ctii::vi '5:^ ':. -^ n " 2
^•^^ \.^Ss4i:i^^^^i^; /TT?"
= 20 = 3
0 = 4
4+00 S 3+50 S 3+00 S——i————*- 2+50 S 2+00 S'——i——-——i- 1+50 S 1+00 S 0*50 S
t.7 .9 2.6 l.i .7 .5 .4 .3 .3
^ :3 /T; -' ' ,. -,' -V:,K\\^A l y-- - ^..,.., ;: . . :,^^^ir -----".4 " •••".2'---^^:^\3-^^:2-'-''-'^- •tfs6-- - .4-^^
l.l 1.3 1.9 2.3
.2 0 = 4
RESISTIVITY
CHPflGEABILITY (msec)
INTERPRETATION
METAL RECTOR (tp/res * 1000)
LJne 3+50 E
DIpole-Dipole Array
plot point
a = 25 M
n - 1. 2. 3. 4
F C l tered Profiles
N-lResistivity Pol ar !za t ton Metal Factor
Logar 1 1 h. Contours 1. 1.5. 2. 3. 5. 7.5. 10.
Instr. Rx:iP6. *4 S *8EDA.BRGM
TX:T3P10. 600 650W. 2KV IPT1. Phoenix 1500H
Executed by! N. Moreau
INTERPRETATION
B Proven IP anomaly
Probable IP anomaly
Possible IP anomaly
NEWMONT EXPLORATION
INDUCED POLARIZATIONPowell Township
Powell property (project **22l)
Date: 88/12 N.T.S.: -2A/2. 41P/15Interpreted by: N. Moreau S E. GaucherScale : l : 2000 Project: 56.10
GEOSIG Inc.

MF IP RES 10- SJ-, 100K-.
0- 0.
-10.0, -60.0. JO
1000.
-l——l——l-
-*———'———(r -1————'———h-
9+50 S 9+00 S 8*50 S 8+00 S 7+50 S 6+50 S 6+00 S 5+50 S 5+00 S 4+5filter UK
0=1 I4K
0 = 2
0 = 3
0 = 4
Z3K 13K MK 12K 7661 8217 9301 14K 9661 4453 2199 1B14 1*37 2733 3227 SBU 5593 5133
9+50 S 9+00 S 8+50 S 8+00 S 7+50 S 7+00 S 6+50 S 6+00 S 5+50 S 5+00 S 4+5filter 20
0=1 20, 0=2
0 = 3 oM
17
17,
17
17.
17 13
131
13 39
39,
61 69 6.8 4.2 7.6 14 12 10 7.4 10 8.2
EI ti j Ka'-
IP-1 IP-3-i——i——i——i——(——-——t- -4———.———l-
9+50 S 9+00 S 8+50 S 8+00 S 7+50 S 7+00 S 6+50 S 6+00 S 5+50 S 5+00 S 4+5Ifilter .4 .2
0=1
0 = 2
o-3
0=4
.3 .4 .2 .5 .9 2.3 2.5 1.1 .5 .2 .2 2.3 3.2 1.2 .9 .5 .4
GEOSOFlftiO Sol t vara for t ha Earth Sclancas. Toronto.

RES IP MFJOCK J60
JCOO
JO L-eo.o
en
H————————I- -t————————I- H————————t-
4+00 S 3+50 S 3+00 S 2+50 S 2+00 S 1+50 S 1+00 S 0+50 SJ672 2953 1987 3780 19BS 1452 212) 3875 5430 5073 1445 785 581 558 344 557 1167 f liter
U67 0=1
3312
4+00 S 3+50 S 3+00 S 2+50 S 2+00 S 1+50 S 1+00 S 0+50 S6.2 5.6 8 S.2 S.4 7.6 7.2 8.4 5.2 4.6 4.4 2.8 2.8 filter
4+00 S 3+50 S 3+00 S 2+50 S 2+00 S 1+50 S 1+00 S 0+50 SLI .4 .8 .2 .4 .4 .6 .7 .5 .4 .5 l 1.7 1.8 1.7 1.1 .7 filter
JD 0. Olljcc
L-io.o
TOPOGRAPHY
RESISTIVITY(ohm-m)
CHARGEABILITY(msec)
INTERPRETATION
METAL FACTOR Cp/res * 1000)
Line 4+00 E
Dlpole-DCpole Array
a = 25 M
0=1. 2. 3. 4plot po C n t
Filtered Profiles N-I
Resistivity Polarization Metal Factor
Logan ; t h. Contours 1. 1.5. 2. 3, 5. 7.5. 10.
Instr. Rx:iP6. *4 8 *8 EOA.6R6M
TX:T3P10. GOD 650W. 2KV IPT1. Phoenix 1500W
Executed by: N. Moreau
INTERPRETATION
B Proven IP anomaly
Probable IP anomaly
Possible IP anomaly
NEWMONT EXPLORATION
INDUCED POLARIZATIONPowell Township
Powell property (project *221)
Date: 88/12 - N.T.S.: 42A/2. 41P/15Interpreted by: N. Moreau & E . GaucherScale : l : 2000 Project: 56.10
GEOSIG J ne

p b
33
33
II
II II
II .C
* CO
N
) "—
3 II3
33
II
II II
CU
NJ
i—
33
33
II II
II II
*
O)
M
i-*
J
"O
N*
Ul
*
' r-
"
— '
' ;
Li
'kl
;
;ui
td
CU
U
J
:
OJ
- M
CO •8 UJ CO -t- o
o CO GO en
o CO 00 o o CO en
a CO •f O
O CO en •f en
o CO O
) -f o
o CO en •f en
o CO en o o eo
7 CO
M
H
H
ICnl
mlif
ll
155 J
a
(O a CO (O o
o CO 00 en
o CO CO o
o CO XI en o CO
s 10 vi O)
a-J
W
o
o en en •t- en
o en en O o en en en
o to en 8 CO
CO
g en CO •f o CO GO -t- CO GO O
O en 4-
O
CO o
o en en en
o en en -f o
o en en
t en
o CO en o
o en
i/ li

RES IP MF — — 100K .J60 JO
enUJ
•--^ _ .—- -""" ~ — — — — ^ ^,— --— " — -^ u.— — ~~— -~- .^-""^ ""-.^ o
——— . ———————————————— -a. ——————————————————————————————————————————————————————— ~ ^u ' •"- ' " ——— 3fc ——— *Sf-— i-r-a —————— - ——— - —— lli-is*— ** JOOO JD JO a-
sce
-11 — 1 LL
-1 ——— , ——— 1 ——— , — -H ——— , ——— t-: —— i ——— | ——— , ——— , ——— i ——— ( ——— , ——— 1 ——— , —— H ——— i ——— 1 ——— , ——— , ——— , ——— | ——— i ——— | ——— i ——— , ——— , ——— , ——— , ——— , ——— , ——— , ——— , ——— , ——— JO .-60.0 .-10.0
TOPOGRAPHY-t ——————— | ———— . ———— | ———————— ( ———— i ——— | ———————— 1 ———————— | ———————— | —————— H ———— i ———— | ———————— l ———————— 1 ——— . ———— | ———————— 1 ———— , ———— | ——— , ———— ( ———————— , ———————— i ——— ,
t-50 S 4+00 S 3+50 S 3+00 S 2+50 S 2+00 S 1+50 S 1+00 S 0+50 S— i —— i —— i ————— i —— i —— i —— i —— i —— i —— i —— i —— i ———— i —— i —— i ———— i ———— i —— i —— i —— i —— i —— i —— i —— i —— i ———— i —— i —— i —— i —— i —— i3334 4799 9770 1W 12V 8655 B7G5 8354 83B8 62D8 9544 2776 1447 2035 4643 7852 4417 1193 f l i t er RESISTIVITY
-w—, jfvtn ' ,-___ f o("*it—fln )
^"B^ffiiraBill^i^^^ BffiPJiS'C 'i^^&^^i^^^^^i^^SP^iE^^^j^^fflJ^I^^P^^r^l^T^l n = 2^jjii^ ^gJ^SBi^f^^^^p^S n sa
^50 S 4+00 S . 3+SO S 3+00 S 2+50 S 2+00 S 1+50 S 1+00 S 0+50 S
6 10 U 12 8.2 9.4 8.2 10 11 7.4 5.4 3.8 4 4.6 S.2 S.4 5.2 4.4 filter CHARGEABILITY
(msec ) fi tf\ tt 1 ^ -^ ft *y Q. 4 fl ^ 1ft 11 ^ 74 *\4 ^fl A. A K ^ ") ^ 4 CO A M. 1 **"^^— T— r
7.4^-. 9^^^S^^^^^^^^^^W^^MW^^y.^^2^ '^•^•^^"•'^f^^^Tfy!^^ is&^f \jfi n*7
^^^pr^Oi1^' -."^i lifli^^y^Ts^^-^^^iiK;^^"^ n s3
INTERPRETATION-i —— ' —— i —— - —— i —— - —— i ———— i —— i —— i —— . —— i —— . —— i —— . —— i —— . —— i —— i —— i —— . —— i —— i —— i —— i —— i —— , —— i —— , —— i —— i —— i —— . —— i —— ,
50 S 4+00 S 3+50 S 3+00 S 2+50 S 2+00 S 1+50 S 1+00 S 0+50 S.4 .6 .3 .3 .2 .3 .2 .3 .4 .3 .2 .4 .S .6 .3 .2 .3 1.1 filter Ue-ivu irAj—rnn METflL rrCTOR
..4 ^.6^— ..3- -,.3 -.2 -...3 --.2 ~,.3. -.4 .3 --, .2 . .4 . -^. .8 - ___ .6.-,.-, .3 .2 ,.~, .3 - 1.1 n*l ' : p7res * 1 000)
.4- J |.^x .3 .2 ^rip ..3 .3 -7T ;: . .3 .2 .3 \Q|/^ ' '.J N^ __ . C-C W - ,' 3 X j^ 0=2
LCne 4+50 E
0 Ipole-Dvpole Array
i a i ^ i a t
j-CPq j-(y)-|x xx s
\ s \ / ^^ S , - 2 "5 M
^v'' n - 1. 2. 3. 4plot point
Fi 1 tered Prof C les
N-l Resistivity — — — ——
Metal Factor ————————
Logar 1 1 h. Contours ^- 1-5. 2, 3, 5, 7.5. 10,...
Instr. Rx:lP6. *4 8 *8 EDA.BRGM
TX:T3P10. GOO 650W. 2KVIPT1. Phoenix 1500W
Executed by: N. Moreau
INTERPRETATION
••••i Proven IP ano*aly
Cv^OO^ Probable IP anonaly
t 1 Possible IP anomaly
NEWMONT EXPLORATION
INDUCED POLARIZATIONPowell Township
Powell property (project "221)
Date: 88/12 N.T.S.: 42A/2. 41P/15 Interpreted by: N. Moreau S E. Gauche-^ Scale : 1 : 2000 Project: 56.10
G E 0 S I G Inc.
~: r, - ; ^Us-^jn.-aiia-s-SE'g-^!?.—.33^!T,iia.* • - ^uv -r;::J.'v'^^^:——;ii-^WSt^^-vMVS-^it^.-V "XC";;^;,. g- ^.--aa^ Q* n-"^-1 g* ThrfJttiJTg- -^-^i.-^ .
4'~r ~s#IKP'Si^'Tv-.^
ft,^v
L* e
9'z-E'9 6'ZZ' BMS'
S 00+S S OS+S S 00+9 S OS+9S 00*8S OS+8 S 00+6S OS+6
-t——.——l ivvvVvvvM" le-diS-dl
90
EJ : o
Z'Se z'Bz ~e61 91G9
'9Z
9Z
S 00+S S OS+S S 00+9 S OS+9S 00+8 S OS+8 S 00+6 S OS+6
CG6Z aae euz en* BEEE aoc wseU91196VJOt METMil
S 00+SS OS+SS 00+9 S OS+9S 00+8 S OS+8 S 00+6 S OS+6
1=
oi
oooi
MQOIsaa
oi
Itj
RES IP -JOCK J30
LJOOO
MF -JO
L-eo.o
en
S
4-1-00 S 3+50 S 3+00 S 2+50 S 2+00 S 1+50 S 1+00 S 0+50 S
4844 12K IflK 21K KK 9613 1CK 2SK 12K SZ5D .4417 3246 5170 2918 3235 16ZZ 993 S3S f I 11 er
io:; - -.- ma •••r ma*.n = 4
4+00 S 3+50 S 3+00 S 2+50 S 2+00 S 1+50 S 1+00 S 0+50 S9.2 9.6 10 12 8.6 9.2 7.8 10 13 It 6.4 S.8 6.4 4.4 4.8 4.4 filter
4+00 S 3+50 S 3fOO S 2+50 S 2*00 S 1+50 S 1+00 S 0+50 S.5 .2 1.7 f 111 er
•^#•3*33^*^^
L-io.o
TOPOGRAPHY
RESISTIVITY
CHARGEABILITY (msec)
INTERPRETATION
METAL FACTOR Cp/res * 1000)
Line 5+00 E
OIpole-Dlpole Array
a nsa
plot point
a * 25 M n - 1. 2. 3. 4
Filtered Profiles
Resistivity ———— — ——Polarization ————————Metal Factor ————————
Logar11h.Contours '* 1*5. 2. 3 ( 5. 7.5. 10,
Instr. Rx:iP6, *4 8 *8 EOA.BRGM
TX:T3P10. GOO 650W. 2KV IPT1. Phoenix 1500W
Executed by: N. Moreau
INTERPRETATION
•^™ Proven IP anonaly
Probable IP anonaly
Possible IP anomaly
NEWMONT EXPLORATION
INDUCED POLARIZATIONPowell Township
Powell property (project *22l)
Date: 88/12 N.T.S.: 42A/2. 41P/15Interpreted by: N. Moreau S E . Gaucher
Scale : l : 2000 Project: 56.10
GEOSIG I nc.
\\Vt
l 11 1; i '
ii\/iV
'\ 1
"\l\11j s
ft
1 1
i 1!l1\ \\ \\1
/Viiii'i '\ \M1 l iI \\ijii iii ii j!/1h1 \
,
i ii
-
0in-*•^renooineno
in-ineno
o4- (Dtnoin•i-totnoo^tn0intnoo00tn oin4-CDtnoo
tntnoinen
-
1iWffiffiiBSiiisBKgK
UJ51JBr
^s5fig^,RsfiW
o r^L
o
in-enoo-H-insiinen8l(Otn oIT)'tCOtn oO
'
CO
o
inenCDo
in*00eno
oO)
eno
inen
i.' liUiliu
f r-t
li!!|-*
^ "
ti:;ill l
i l~
;!!ij*
wflisa•t,
, - :iii!3
?vfi,V-l!
V
fH
(M
C
O
IB"^
II II
II II
C C
C
C
nfiogbUJlboii
o d••4
l
Oin

RES IPJOCK JBO
MF
-1000
JO L-60.0 .-10.0
COuuU-o o:jo a- oUJcc
4+00 S 3+50 S 3+00 S 2+50 S 2+00 S 1+50 S 1+00 S 0+50 S
1801 f 111 er
4+00 S 3+50 S 3+00 S 2+50 S 2+00 S 1+50 S 1+00 S 0+50 S3 17 16 12 11 9.8 6.4 8.4 8.6 7.8 7.2 12 9.2 8.6 11 9.2 5.4
12 —-r:.9.2..... .8.6...../KJ1-~S: ^i±j53i; ^; ::*x; :Mr~ vv~"~- --——-^ •••"^S'To";?9.2
6 f i 11 er
6 0=1
0 = 2
0 = 3
4+00 S 3+50 S 3+00 S 2+50 S 2+00 S 1+50 S 1+00 S 0+50 S.2 .1 .1 .1 .1 .1 .7 .8 .5 .1 .1 .7 3.1 2.9 2.5 l f i 11 er
TOPOGRAPHY
RESISTIVITY(ohm—m)
CHFRGEA5ILITY(msec)
INTERPRETATION
METAL FACTOR Up/res * 1000J
Line 5+50 E
Dlpole-Oipole Array
\\ s \ splot point
a * 25 M
n - 1. 2. 3. 4
Filtered ProfilesN-l
Resistivity ———— —— —— Polarization —————————— Metal Factor ————————
Logar .' t h.Contours l- 1*5. 2. 3. 5. 7.5. 10,
Instr. Rx:IP6. *4 S *8 EDA.BRGM
TX:T3P10. GOD 650W. 2KV IPT1. Phoenix 1500W
Executed by: N. Horeau
INTERPRETATION
Proven IP anonaly
Probable IP anomaly
Possible IP anomaly
NEWMONT EXPLORATION
INDUCED POLARIZATIONPowell Township
Powell property (project *22l)
Date: 88/12 N.T.S.: 42A/2. 41P/15Interpreted by: N. Moreau 8 E. GaucherScale : l : 2000 Project: 56.10
GE05IG n c .

MF 10-,
IP RES60., lOOK-
-10.0. -eo.o. 10
1000.
-1————————H
9+50 SH———,————l———,- 9+00 S 8+50 S 8+00 S 7+50 S 7+00 6+50 S 6+00 S 5+50 S 5+00 5 4+5
filler 22K 14K 14K 16K 11K 14K 15K 4322 9039 3320 7196 1826 1403 13K 19* 4089 6624 4254 UK 5433 4439 5194
0=1 22K
0=2
0 = 4
9+50 S 9+00 S 8+50 S 8+00 S 7+SO Si——i————i————i——.——i——i——f——-- 7+00 S 6+50 S-——i————i————i——- 6+00 S 5+50 S S+00 S 4+5
f I Her 23 21 21 6.8 14
0 = 2
0 = 3 o-4
14 60 70 26 19 21
BM/- " 13
lA^Mrf 34 - " — i c* i mi,, ™
70
35 BH^ St
35^^^ 6S^^^" IB
23 13
O ~ BO J; 13
12 12 8.2 7.4 8.2
EI E3 EI
J2 *——— 12-^5^.8.2
ummwm^^mV •J40HH li;:: ^fs.2
.8.2.
8 f u:
IP-1
9+50 S 9+00 S 8+50 S 8+00 S 7+50 S 7+00 S 6+50 S 6+00 S 5+50 S 5+00 S 4+5
filter .3 .4
0=1
n*2 0=30=4
.4 .3 .2 .6 4.2 6.3 l 3.1 4.S .9 .4 .9 1.2 .8 .3 .4 .S .4
.2
6EOSOFT tlnl Softwara for IK* Earlh Sclanc**. Toronto,

RES JCOK
IP
JOOO
.10
MF JO
L-eo.o L-10.0
JO
enyt—4
U- Occ.0-0 tuCf.
0 S 4-cOO S 3-t-SO S 3^-00 S 2+50 S 2*00 S l f 50 S 1+00 S 0*50 Si m Z5K 53K S8K 51K 2ZK 8694 1954 1279 2026 8963 1ft 6195 1133 533 615 649 f liter
649 0=1
0 = 2
3 S 4+00 S 3+50 S 3+00 S 2+50 S 2+00 S 1+50 S 1+00 S 0+50 S8.8 14 13 19 13 7.4 6.9 6.2 14 14 14 U 5.6 5.2 4.4
4.4,
4.4 filler
.4.4 0=1
0 = 2
0 = 3 n-4
-l——l——I-
) S 4+00 S 3+50 S 3+00 S 2+50 S 2+00 S 1+50 S 1+00 S 0+50 S.2 .1 .1 1.6 1.6 filter
TCPOGRAPHY
RESISTIVITY(ohm—mJ
CHARGEreiLlTY(msec)
INTERPRETATION
FACTOR Cp/res * 1000)
Line 6+00 E
Dipole-Dvpole Array
s S a s 25 M \r'' o - 1. 2. 3. 4
plot point
Filtered Profiles
Resistivity —— — — ——Polarization —————————-Metal Factor —————————
Logari th.Cootours * **5. 2 , 3 . 5, 7.5, 10....
Instr. Rx:IP6. *4 8 *8 EDA.BRGM
TX:T3P10. 600 650W. 2KV IPT1. Phoenix 1500W
Executed bg- N . Moreau
INTERPRETATION
^••B Proven IP anomaly
N^S.SSl Probable IP anomaly
l l Possible IP anonaly
NEWMONT EXPLORATION
INDUCED POLARIZATIONPowell TownshIp
Powell property (project *221)
Date: 88/12 N.T.S.: 42A/2. 41P/15Interpreted by: N. Moreau S E. GaucherScale : l : 2000 Project: 56.10
GE05IG I nc.

i 3 ** a
33
33
II
H II
I I *fc
U
) M
*-
ti.jy.a
w w (O
tat
en
M
KI
10 in 10 10 aj in
o o
o in
o o
o 01 en in o in 05 * a
o in in •s
3 U333
II H
II U
) M
i— to
M ifl P M
(O a
a in O} en
o in OD o
o 10 VI in O
O CO en in in
o
3333
II II
II II
-c*
co
rsi
*- K
Z
isa 3 3 a- a 3 H
*
* ffl S 3 OB
UT i 3i 8 CO i M 5; *
1 g
i i
10 in o in LO •t S in OD * Ln in GO o o in VI in a in VJ
O a in en •* in a in 01 g in in in
o
1
11
|
t I 1 1 l l j \ \ \\ i ( \ l
\1
\ \ \\
\ \ \ )l
ff
h'1'
A f,' \ \ \
/' 1)' \II |l P I/
'
f'\ f !
\t
\
'. y -T i ^; ,; f 1 j i i ,

RES IPlOCK J30
\
\.1000
MF.ID
L-eo.o L-IO.O
..o OL a
5+00 S 4+50 Si——i——i——t- 4+00 S 3+50 S 3+QO S 2+50 S7122 9D61 4844 10K 27K 29t 63K 1379 3994 795 1WS 1376 f li ter
rl376
s+oo s 4+50 S 4+00 S 3+50 S 3+00 S 2+50 S.2 G.8 4.6 12 17 13 4.8 1.6 1 4.6 3.6 5.6 5.8 filter
s+oo s 4+50 S 4+00 S 3+50 S 3+00 S 2+50 S.2 .3 .3 .1 .1 .3
.3
1.2 1.6
.2r.r.Mt 1.6*
1.2 filter
l.Z n = l
n = 3
TOPOGRAPHY
RESISTIVITY
CHc*RGEis6ILlY
INTERPRETATION
( ip/res * 1 000)
Line 6+50 E
DCpole-Dlpole Array
a na a
x xx s\ s^ s a s 25 M \/' n - I. 2. 3. 4
plot point
Fl{ tered Prof Cles
Resistivity —————Polarization —————————-Metal Factor ————————
LogarIth.Contours ^' 1-5. 2. 3. 5, 7.5. 10..
Instr. Rx:lP6. *4 S *8 EDA.8RGM
TX:T3P10. 600 650W. 2KV IPT1. Phoenix 1500U
Executed by: N. Moreau
INTERPRETATION
••B Proven (P anomaly
Probable IP anomaly
Possible IP anomaly
NEWMONT EXPLORATION
INDUCED POLARIZATIONPowell Township
Powell property (project #221 J
Date: 88/12 N.T.S.: 42A/2. 41P/15Interpreted by: N. Moreau 8 E. GaucherScale : l : 2000 Project: 56. 10
G E 0 S I G I nc.

MF IP RESIO-, 60., lOOK-
0.
-10.0- -eo.o- lo.
1000-
filter
filler
7 -''
8+00 S 7+75 5 7+50 S 7+25 S 7+00 S 6+75 S 6+50 S 6+25 S 6+00 5 5+75 S 5+50 S 5+25 S
66Z5 6CE7 7193 UK 372) 5639 4873 ' 2571 598 7205 3391 14K 5048 3348 1583 2962 2800 1244 1571 3089 6239 4328 3255 306
8+00 S 7+75 S 7+50 S 7+25 S 7+00 S 6+75 S 6+50 S 6+2S S 6+00 S 5+75 S 5+50 S 5+25 S
51 33 32 30 22 12 1.8 14 26 33 31 12 5.6 21 13 5.6 4.6 9.6 4.6
IP-1 IP-3
8+00 S 7+75 S 7*50 S 7+25 5 7+00 S 6+75 S 6+50 S 6+25 S 6+00 S 5+75 S 5+50 S 5+25 S
filter
0=1
0=2
0=3 1.8!."n . 4 ,. 4nSi^ir^
2.5 1.3 .9 2.4 .7 .2 .5 .8 .7 1.8 1.1 t 2.8 2.4 3.2 1 .4 .4
yilfflii^ajHV : rrxv^vi.-.f^rl?--//- ^K - -' '\ - ft\ fXi^- V^rrfV*
.4 .4
.4.
rnifcf i. 5 ^i? ru^r
BEOSOF l (t m J Software for th* Earth Scljncas. Toronto,

IP -60
10
J3
L-eo.o .-10.0
CD
u. o ocO LUo:
t 3310 f 111 er
10 0 =1
0 = 2
0 = 3
0 = 4
5+00 S-*——'4.8 filter
— J
0 = 2
5+00 S—4,———-*
.4 filter
t ~ 1
3 0 = 2
0 = 3
0 = 4
TOPOGRAPHY
RESISTIVITY(ohm—m)
(msec)
FACTOR
Cp/res * 1CX)OJ
Line 6+50 E
Drpole-Otpole Array
X S. a = 12,5 M \/ n - 1. 2. 3. 4
plot point
Filtered Profiles
Resistivity —— ———————Polar IzaiIon ——————————Metal Factor ————————
Logarlth.Coniours ^ - 1 -5. 2. 3. 5. 7.5, LO.
Ins "lr - Rx:IP6. "*8 EDA. 8RGM
Tx:IPT1. Phoenix 1500 W
Executed by: N. Moreau
INTERPRETATION
•••B- Proven IP anonaly
Probable IP anomaly
Possible IP anomaly
NEWMONT EXPLORATION
INDUCED POLARIZATIONPowell Township
Powell property (project *221)
Dale: 88/12 N.T.S.: 42A/2. 41P/15Interpreted by: N. Moreau 3 E. GaucherScale : l : 1000 Project: 56.10
GEOS I G Inc.J

*
ijj1\\\V111
, l1 1 11l\1
\ \\\\/rf
1
(i1y/\/,l
'
\ \\ \
\\\\^li\iii7111 11;lV) '
'gg
1 ll
1 S
-
in0oininoin4-inin0OtoinDinIDin O0Kinoin0o00ino
in•4-00in0oCDinoinon y•MggIQffiR
ffiin8
BfiDKS
(Mfi5^s™~*^1sfisS—*L.Ql
IDO
O
'
in
aoO
'•f
ID
inO
in
K
O
O'
4tno
inN.in
in S
o
otn S5
oU)
in W
gmi
W
•f
ltaj 22|
col Isl
l ex l
f&i
lvl
[Q.
ino
oininO
IT)'
eno
O *
IDinO
in4-10enoo•*- IXinoID
'
ino
oCOino
in4- (Oeno
oO)
•-" (M
fO
V
li n
n i
C C
C C
L.
01^
CM m
T
11 n
ii n
C C
C C
•-i IN
m
TT
n ii
11 n
c c
c c
!fesro d

RESJOCK
IP MF
.1000
..-60.0
tnUJ
or o.Q UJ GC
4+50 S 4+00 S 3-1-50 S 3+00 S 2+50 S 2+00 S 1+50 S 1+00 S 0+50 S15K 3IK 25K 2742 2021 1474 3852 Z403 SBB4 3534 1608 85B 557 415 365 304 f J l t er
4+50 S 4+00 S 3+50 S 3+00 S 2+50 S 2+00 S 1+50 S 1+00 S 0+SO S12 IS 13 10 8.8 3.2 3.2 3.4 4.8 4.2 7.2 5.2 4.4 3.* 4.2 3.6 3 filter
4+50 S 4+00 S 3+50 S 3+00 S 2+50 S 2+00 S 1+50 S 1+00 S 0+50 S.2 .1 .1 .1
.1
.1
3
a
.3
.—, .3
.4 .6
r ~::::I ~ :"3—P-:™ ? i5:in3"":*..ii ~: *. ** •t1*-'?--'--^?*^ ""
.3 , .2 .2J .2 -..j-^pliSSgff^fllillliS^g^sL.-.:— : iiu^-^'v-. 0=4
L-io.0
TOPOGRAPHY
RESISTIVITYn—m)
CHARGEABILITY (msec)
INTERPRETATION
METAL FACTOR lip/res * 1000)
LCne 7+00 E
D t'pole-DCpole Array
\ xxx a = 25 M^v'' n = 1. 2. 3. 4
plot po C n t
Filtered Profil es
Resistivity Polarization Metal Factor
Logar i t h. Contours '- l-5t 2, 3. 5. 7.5, 10,
Instr. RxIIPS. **4 fi *8 EDA.BRGM
TX:T3P10. GOO 650W. 2KV IPT1. Phoenix 1500W
Executed by! N. Moreau
INTERPRETATION
Proven IP anonaly
Probable IP anomaly
Possible I P anomaly
NEWMONT EXPLORATION
INDUCED POLARIZATIONPowell Township
Powell property (project 8221)
Date: 88/12 N.T.S.: 42A/2. 41P/I5Interpreted by: N. Moreau S E. GaucherScale : l : 2000 Project: 56.10
G E O S I G : n c .

rMF IP RES10., 60., 1COK-.
0.
-10.0- -60.0- 10
1000-
9+50 S 9+00 S 8+50 S 8+00 S 7+50 S 7+00 S 6+50 5 6+00 S 5+50
filter was eras 3990 7ire 7735 3320 905*
0=1 64
0=2
0=4
307i UK UK IOK razz 3ZZ4 2516
9+50 S 9+00 S 8+50 S 8+00 5 7+50 S 7+00 S 6+50 S 6+00 5 5+50
filter 19
0=1 19,
0 = 2**
0 = 4
23 23 17 21 26 49 27 8.6 19 IS 14 7.8
r-7.8,
IP-1
EI'-':. ELI .
IP-3
9+50 S 9+00 S 8+50 S 8+00 S 7+50 S 7+00 S 6+50 S 6+00 S 5+50
filter .0 1.3 1.9 .7 .8 .8
0=1
0=2
0=3
0=4
.8 1.4 1.6 .9 .5 .1 .2 .3 .3 1.3 1.6 .3
GEOSOFT ( In) Sol t war a for t Vw Earth Scianeac. Toronto, Canada

RES
N
IP-60
MF
.1000
.10
JO
L-eo.o
.o
en uu
.o ex o.oUJcc.
u.
H————————t-
S+00 S 4+50 S 4+QO 5 3+50 S 3+00 S 2+50 S
31K UK UK 486Z 2B3B BD43 UK 4054 659 filter
9 0=1
0 = 2
0 = 3
5+00 S 4+50 S 4+00 S 3+50 S 3+00 S 2+50 S
14 6.2 6.4 12 15 8.8 4.8 4.4 6.4 S.6 6.4 8.8 filter
5+00 S 4*50 S 4+00 S 3+50 S 3+00 S 2+50 S
.3 .1 .1 .1 .2 .3 .1 .2 .S .3 .1 .4 3.2 filter
0 = 4
L-io.o
TOPOGF5APHY
RESISTIVITYC oHm—m)
(msec)
INTERPP5ETATION
rtTAL FACTOR (ip/res * 1000)
Line 7+50 E
Dlpole-Dipole Array
a ra a
s a — 25 M
o - 1. 2. 3. 4plot point
Filtered Profiles
N-lResistivity — — — —— Polarization —————————— Metal Faclor ————————
Logar i th.Contours l* 1-5. 2 . 3 . 5, 7.5, 10,,
lostr. Rx:lP6. *4 S **8 EDA.BR6M
TX:T3P10. GOO 650H. 2KV IPT1. Phoeoix 1500W
Executed by: N. Moreau
INTERPRETATION
Proven IP anomaly
Probable IP anomaly
Possible IP anomaly
NEWMONT EXPLORATION
INDUCED POLARIZATIONPowell Township
Powell properly (project *221)
Date: 88/12 N.T.S.: 42A/2, 41P/15Interpreted by: N. Moreau S E. Gaucher
Scale : l : 2000 Project: 56.10
GEOSIG n c .

MF 'O-,
IP RES60., 1COK.,
-lO.o. -eo.o. 10
1000,
-H————i-
9+50 S 9+00 S 8+50 S 8+00 S 7+50 S /+00 S 6+50 S 6+00 S 5+50 S 5+00 S
filler 3944 5039 4493 4091 7257 5153 8468 6462 6133 KK UK 7978 7735 10K 3358 2045 5398 12K 6343 16K 9372
9+50 S 9+00 S 8+50 S 8+00 S 7+50 S 7+00 S 6+SO S 6+00 S 5+50 S 5+00 Sfilter 20
IP-1
9+50 S 9+00 S 8+50 S 8+00 S 7+50 S 7+00 S 6+50 S 6+00 S 5+50 S 5+00 S 4+filter 1.5 l 1.4 1.1 .7 .7 .9 1.3 2.3 .8 .3 .1 .1 .5 1.3 .6 .2 .1 .1
i&Hp&nsztG r'trjfiwPf*iR^l^i1psf* -vi^cr* ^viv *^^4*8^-
.2
.2-
bEOSOFT (tml Sollwjre for th* E arth ScIanCBS, Toronto, Canada

RES-10CK
IP
^1000
.10
MF.10
JD
L-60.0 L-io.o
J)
en uu
U-o o: OL
UJ
H————————t- ^————————(-
2400 S 1+50 S 1+00 S 0+50 S
313 niter
0 = 2
50 S 4+00 S 3+50 S 3+00 S 2+50 S 2+00 S 1+50 S 1+00 S 0+50 S9.4 IS 4.4 4.2 3.2 4 .2 4.4 S.4 5.3 4.2 4.8
S ..__5.4,-.. ,,5.9..-.1—,4.2,
3.6 4.8 3.6 ftlter
0=1
0 = 3
-i———.——t- -l——.——i- ~4————'————I-
50 S 4+00 S 3+50 5 3+00 S 2+50 S 2+00 S 1+50 S 1+00 S 0+50 S.1 .3 .1 .4 .4 .4 .3 .4 .8 1.2 .1 1.1 .7 1.1 t.S 1.8 2.1 1.9 filter
. .
J... .i . * .-(t --r ' .rr*"*?*fc. - -'* * i -?m " T
i-l 11 — i*pf -7 ~ ^r^l.l— a^-j 1.5*-.—*. 1 .8. .-t*- f 2A^ ..-T'vj"' — p^?v" -- m..^-j"ijjtftiT l'-;-\V!-^.:--:-- *.i' \ ^- .^ ;1--3 ., V'^. rf ^L^' /i'-'y.vj. ' -;'J' ^-iL.rr*"*?*fc. - -''-. 'y j^"r— j* - - — *!^'* :. *** ;VJ"* *;-( •'V'' " \- "^l
" ^ - ' :'-i
0 = 3
TCFOGRAPHY
RESISTIVITY(ohm—m)
CHARGEABILITY (msec)
INTERPRETATION
METAL FACTOR
Cp/res * 1000)
Line 8 +00 E
DIpole-Oipole Array
a ra ar®-.x s
N S
Nx s ' a = 25 M
N\rxX n - 1. 2. 3. 4plot po*nt
F t l tered Prof C les
Polarization Metal Factor
Logar ; t h. Cooiours '- 1-5. 2. 3. S. 7.5. 10.
Instr. Rx:lP6. "*4 ,? 1*8 EDA.BRGM
TX:T3P10. GOO 650W. 2KV IPT1. PhoenCx 1500U
Executed by- N. Moreau
INTERPRETATION
Proven IP anomaly
Probable IP anomaly
Possible IP anomaly
NEWMONT EXPLORATION
INDUCED POLARIZATIONPowell Township
Powell property (project &221)
Date: 88/12 ' N.T.S.: 42A/2. 41P/15 loterpreted by: N. Moreau Si E. Gaucher Scale : l : 2000 Project: 56.10
GE05IG ;nc.

MF10
OJ
-10.0.
IP60
oj
-eo.oJ
RES10DK
icooJ
10.
9+50 S 9+00 S 8+50 S 8+00 S 7+50 S 7+00 S 6+50 S 6+00 S 5+5C
fi Her 1SKJ 3F1 5783 4990 7409 4530 906S 3342 8345
0=1
0=3
13* 14K 83W 4335 4339 1443 1S72 3136 19K
9+50 S 9-t-OO S 8+50 S 8+00 S 7+50 S 7+QO S 6+50 S 6+00 S 5+501
filter 7
0=1 7
0=2
0 = 3
0=4
11 13 9.8 M 20 28 18 5.4 3.6 4.6 3.4 e.2 13 12
7.
6.6
IP-4
9+50 S 9+00 S 8+50 S 8+00 S 7+50 S 7+00 S 6+50 S 6+00 S s+sq1.2 .2
(lin) Sol t-ara for Iha Earth Scfoocss. f or on l o. Cauda

RES IP MF.100K JSJ ..10
LlOOO
.10
JO
L-eo.o
JO
en ULI
QC 0-aUJocUJ
L-io.o
TOPOGRAPHY
RESISTIVITY, (ohm—m)
CHARGEABILITY (msec)
INTERPOLATION
rtTAL FACTOR Cp/res * 1000)
Line 8+50 E
D'pole-D'pole Array
a rea
f/ a = 25 Mn " 1. 2. 3. 4
plot point
PCItered Prof lles N-l
Polarization —————————— Metal Factor ————————
LogarIth.Contours l* 1-5. 2. 3. 5, 7.5, 10,.
Instr. RxrlPB. *4 S **8 EOA.BRGM
TX:T3P10. SOD 650W. 2KV IPT1. Phoenix 1500U
Executed by: N. Moreau
INTERPRETATION
•••B Proven IP anomaly
IS-\\N.N Probable IP anomaly
Possible IP anomaly
NEWMONT EXPLORATION
INDUCED POLARIZATIONPowell Township
Powell property (project *221)
Date: 88/12 N.T.S.: 42A/2. 41P/15Interpreted by* N. Moreau S E. GaucherScale : l : 2000 Project: 56.10
GEOSI G I nc.

MF10-,
o.
IP RES60..
-io.oJ -eo.oJ 10,
1000.
9+50 3 9+00 S 8+50 S 8+0.0 S 7+50 S 7+00 S 6+50 S 6+00 S 5+50filter 5732 8243 9848 1CK 7612 6253 9686 6324 9313 7916 23K 5123 2464 687 882 933 4186 19K
9+50 S 9+00 S 8+SO S 8+00 S 7+50 S 7+00 S 6+50 S 6+00 S 5+50filler IS
0=1
0=2
0 = 3
0=4
IP-4
9+50 Si——i————(- 9+00 Si——i——t——i- 8+50 S 8+00 S 7+50 S 7+00 S 6+50 S 6+00 S 5+50f ilter .8 .4
0=1
0 = 2
0=4
.5 .7 1.3 .9 1.2 .6
•r— .8.
.1 .2 .2 .4 1.9 1.2 .2
!*S f ;!^rf v^R "^PP^fTrH-\ t^/^^-SS^iilipI-^.'7- -•-^9'—r^/xTJSS&x'Tp;;.*vM*S* ,- J b*cA.^UI . T x^X*i::^r
' ^^ -- , '?-'-:':,-- \-' .2 - J .2 ^^:7''---*'*"*.6-
GECSCFT (In) Softxare for thg Ear th ScUncas. Toronto, Canada

RES IP MF 60
.1000
.10
.0
L-eo-0
en
.o o-o uu cc
U-L-10.0
S . 5+00 S 4+50 5 4+00 S 3+50 5 3+00 S 2+50 S———i——i——i——i——i——i——i——i——i——i——i————i——i——i——i——i——.——i——i——i——i——i——i——i——i12K 2ZK 6214 8237 9355 EK 24K 6307 1B57 1963 2878 12K 7791 8425 f 11 ter
3+00 S 2+SO S7.6 5.4 f ; 1 ter
5+00 S 4+50 S 4+00 S 3+50 S 3+00 S 2+50 S.1 0 .2 .2 .3 .2 .2 .7 .4 ,., .2 .1 filter
'"Ssipii;H;;;!;!piip *T .1 n-vaasf -l~S;:r:i:.H;;;s;::S7:;-T:. -V:,2
.3
.2——. .2 . ..,.
•i~:2 .3
.....:i -:r:y:
TOPOGRAPHY
RESISTIVITY
(ohm— m)
nj/vnrirAOTi rrv LHHKbcrlDlH 1 Y
INTERPRETATION
^TALFACTOR
( ;pXres * 1000)
Line 9+00 E
DCpole-DCpole Array
/ sf/ a = 25 M
n = 1. 2. 3. 4plot point
Filtered ProfilesN-l
Resistivity —— — — ——- Polarization ————————— Metal Factor —————————
Logar ~\ th.Coo t our s l*jt c. * o* Q* /*o* ivJvi
Instr. Rx:IP6. *4 8 1*8 EDA.BRGM
TX:T3P10. GOO 650U. 2KV IPT1. Phoenix 1500W
Executed by: N . Moreau
INTERPRETATION
Proven {P anomaly
Probable IP anomaly
Possible IP anomaly
NEWMONT EXPLORATION
INDUCED POLARIZATIONPowell Township
Powell properly (project *221)
Date: 88/12 N.T.S.: 42A/2. 41P/15Interpreted by: N. Moreau S E. GaucherScale : 1 : 2000 Project: 56.10
GEOSIG Inc.

MF10-,
IP RES60-, ICON.,
-10.0- -60.0- 10
1000.
-l——l——l——l——l——l——I-
9*50 S 9+00 S 8*50 S
filter 17K 13K 12K 6312 8135-1——'——l-
782B 8288 7992
8*00 S 7+50 S 7*00 S 6+50 S 6+00 S 5+50 S
3188 3783 1879 1332 1419 881 1385 1871 6375 11
0=1
0=2
0=3
0=4
17K
lin lu\ k llK UK
9+50 S 9+00 S 8+50 S 8+00 S 7+50 S 7+00 S 6+50 S 6+00 S 5+50 S
f Ci ter 21
0=1 210=2
0=3
33 31
31,
29
t 291
26 41 29 14 3.4 1.4 1.2 4.6 9.4 17
26
E3 i Q El ! ; EH..
IP-4
9+50 S 9+00 S 8+50 S 8+00 S 7+50 S 7+00 S 6+50 S 6+00 S 5+50 J
filter .3
0=1
0 = 2
0 = 3
0 = 4
GEOSCrl ( In) Software for t ha Earth ScIoocaSt loronlo,

RES IP MF-lOCK ..60 ..ID
/
.1000
.10 .-eo.o --JO.O
LO
enILI
oUJescUJ
5+00 S 4+50 S 4+00 S 3+50 S 3+00 S 2+50 S
t* 89BZ 6883 5314 8128 4304 HX5 1476 UK 13K 13K 3068 filter
0=1
0 = 2
0 = 3
0 = 412K
5+00 S 4+50 S 4+00 S 3+50 S 3+00 S 2+50 S6.4
.6.4.
5.4 5.4 8 11 4.8 3.4 8.8 8.2 6.4 5.6 filter
.1 filter
TOPOGRAPHY
RESISTIVITY
CHANGEABILITY(msec)
INTERPRETATION
METAL FACTOR Up/res * 1000)
Line 9+50 E
Dipole-Dipole Array
\ • a = 25 M
\' n - 1. 2. 3. 4 plot poCnt
Filtered Prof Cles
N-lResistivity — — — —— Polarization —————————— Metal Factor ————————
LogarIth.Contours l ' i ' 5 ' 2- 3' 5- 7' 5 ' l 0 '
lostr. Rx:IP6. *4 S 1*8 EDA.BR6M
TX:T3P10. GOO 650W. 2KV IPT1. Phoenix 1500H
Executed by! N. Moreau
INTERPRETATION
•••B Proven IP anomaly
N\S.SM Probable IP anomaly
l l Possible IP anomaly
NEWMONT EXPLORATION
INDUCED POLARIZATIONPowell Township
Powell property (project #221)
Date: 88/12 N.T.S.: 42A/2. 41P/15 Interpreted by: N. Moreau S E. Gaucher Scale : l : 2000. Project: 56.10
GEOSIG inc.

epcuej 'M]
riOS+SS 00+9S OS+9S 00+/S OS+ZS 00*8S QS+8S 00+6S OS+6
fr-dl
os+ss 00*9s os+9s 00+2:S 00*8S OS+8S 00+6S OS+6
66IZ SZ91 099 GEDE 8ZWE0199SIEWE I
OS+SS 00+9S OS+9S OS+/S 00+8S OS+8S 00+6S OS+6
01 ro"os- ro'oi-
•oooi
MOOT 09S3b di
01

RES IP tooK
.1000 LO
-t——i——i- -i——'——*- -I————————H
5*00 S 4*50 S 4*00 S 3*50 S 3*00 S 2*50 S
3121 32D1 S537 3337 4419 1784 2804 1737 3714 SZB4 12K 21K 33K 22K, f ilter
\ZK n ~l
n-4
5+00 S 4*50 S 4*00 S 3*50 S 3*00 S 2*50 S
5.2 5.8 8.4 5.6 3.2 4.8 6.2
— -a.4.8 —— -.6.2
7.6 8.4
7.6 ^ 8.4-.
7 filter
7 — l
0 = 2
r^=3
0 = 4
5*00 S 4*50 S 4*00 S 3*50 S 3*00 S 2*50 S
MF io
aLUtx
L-io.o
TOPOGRAPHY
RESISTIVITY
(ohm— m)
QHARGQ5BILtTY
INTERPRETATION
FACTQR
* 1000)
Line 10+00 E
Dlpole-Dlpole Array
N /' a = 25 M \/' n - 1. 2. 3. 4
plot point
FCltered Profiles
Resistivity —— — — ——Polarization —————————Metal Factor ————————
Logar i th.Contours l ' l ' 5 ' 2' 3* 5' 7' 5 ' 1 0 '
Instr. Rx:lP6. *4 S t*8 EOA.BRGM
TX:T3P10. GOO 650W. 2KV IPT1. Phoenix 1500W
Executed by! N. Moreau
INTERPRETATION
mmmmmM Proven IP anomaly
NSVsM Probable IP anomaly
Possible IP anomaly
NEWMONT EXPLORATION
INDUCED POLARIZATIONPowell Township
Powell property (project *221)
Date: 88/12 N.T.S.: 42A/2. 41P/15Interpreted by: N. Moreau S E . GaucherScale : l : 2000 Project: 56.10

1/V-
ll\\\ i lX
^ tH
8
o
o l
enen
rt (M
fT)
tl II
IIC
C C
IIC
eno
o(Cino inIDinoo
(O(OCDo!
tninin
gCOino in4 COen4 O
)
tnS4- O
)
OD Km
m
L.
01

RES,-lOCK
IP rf
/1000 Lo
10 L-eo.o L-io.o
Lo
en
U. O
ex.
5+00 S 4+50 S 4+00 S 3+50 S 3+00 S 2+50 S
1136 1115 2133 1864 3*54 1121 2101 29D1 1*36 12K 11K 1CK 2SK f ilter
5+00 S 4+50 S 4+00 S 3+50 S 3+00 S 2+50 S
12 6.8 2.8 4.4 4.6 2.4 4.6 1.2 6J6 (.8 9.2 filter
S 5+00 S 4+50 S 4+00 S 3+50 S 3+00 S 2+50 S
1.8 .3 .4 .6 .6 .5 .2 .1 .2 .1 filter
TOPOGRAPHY
RESISTIVITY(ohm-m)
CHARGEABILITY
INTERPRETATION
FACTOR Cp/rcs * 1000)
Line 10+50 E
Dlpole-Dlpole Array
plot point
a * 25 M
n - 1. 2. 3. 4
Ffi tered Prof C LesN-l
Resistivity —— — —— —— PolarIzatIon —————————— Metal Factor ————————
LogarIth.Contours ** 1-5*. ^-. 3 * b r /.b. lU.
Instr. Rx:IP6. *4 8 *8 EOA.BRfiM
TX:T3P10. GOO 650H. 2KV IPT1. Phoen.'x 1500W
Executed by! N. Moreau
INTERPRETATION
Probable IP anomaly
Possible IP anomaly
NEWMONT EXPLORATION
INDUCED POLARIZATIONPowell Township
Powell property (project *221)
Date: 88/12 N.T.S.: 42A/2. 41P/15Interpreted by: N. Moreau S E. GaucherScale : l : 2000 Project: 56.10
GEOSIG Inc.

/ll
l
f\\ll/l!
siin10tno
in10ino
o•4-
ino
inIN.
ino
oooin00ino
oO)
ino
inen
S Hi
Is
r-l CM
II II
C C
toIIc
•ti llc
StLOinO
O•f LOino
m•fU
)
O
o4CO
OinenO
o•t00in00inO)
in01
CO(OU)(Col
"J®!
itId
—**i.
f
ftsiiif!
o!!
Iwl
S! S
]•-i (M
m
^*H
n n
liC
C C
C
sLOino
o*IDino
inCDinoO'
eno
inenootno
inooinSCOino
in-4-cn
M
CDC
*!j
H:*
K"ir
i'fO
to i;
•-t (M
(O
'V
II II
II II
C C
C C
o dT
RES IP
.1000
.10
.0
L-eo.o
(Dujo. o ccOL
UJ
H———'———t- -H————————H
5+00 S 4+QO 5'——i——-——t- 3+50 5——i——i——t- ,3+OQ 5 2+50 S624 1104 1769 3530 4508 76Z3 8130 9O9 16K 945S 5331 5355 7777 f 11 ter
l IK"
5+00 S 4+50 S 4+00 S 3+50 S 3*00 S 2+50 S——i——.——i-6.2 2.8 4.8 5.8 4.7 6.8 5.4 7.2 5.6 4.2 4.8 4.8 filter
IP-4
5+00 S 4+50 S 4+00 S 3+50 S 3+00 S 2+50 S2.3 .7 .4 .3 .1 .2 .1 .t .2 .2 .1 filter
L-IO-0
TOPOGRAPHY
RESISTIVITY
CHARGB'BILITY(msec)
INTERPRETATION
FACTCR
Cp/res * 1000)
Line l 1+00 E
Dlpole-Dlpole Array
\ s\ s
plot point
a - 25 M
n - 1. 2. 3. 4
F I l tered Prof Cles
Resistivity — Polar Czai Ion Metal Factor
Logar 1 1 h. Contours l* 1-5- 2. 3. 5. 7.5. 10.,
Instr. Rx:IP6. *4 S **8 EOA.BRGM
TX:T3P10. GDO 650H. ZKV IPT1. Phoeolx 1500W
Executed by! N . Moreau
INTERPRETATION
B Proven [P anomaly
Probable IP anomaly
Possible IP anomaly
NEWMONT EXPLORATION
INDUCED POLARIZATIONPowell Township
Powell property (project *221)
Date: 88/12 N.T.5.: 42A/2. 41P/15Interpreted bg- N . Moreau S E . GaucherScale : l : 2000 Project: 56.10
GEOSIG I nc.

P Q
33
33
II
M II
II -b
. CO
N
J *-
-
3333
II .
II II
D •to
. CO
NJ
i-*
l,*'
- "
".
.'3
o -f o
o ui CO Ul o tn 10 g
tn 00 tn aa o
o U)
Col
Itil
IS
IS
tn
o ui •f o
o m ui
o ui en S
O) O)
IS)
O
O en (O •h O
O t/) en 00 o
o xn
o en en en •h
Ul
O en en S
i
a
a ui ea * tn
o en eo O
a CO GO tn
o en O)
o
o tn tn
a tn en * en
a en m

RES IPJ90
-1000
.10
MFr-10
JO
.-ea. o .-iao
inUJ
sU) a. oUJD: tu
u.
-I———-———I- -I———————I-
5+50 S 5+00 S 4+00 S 3+50 S 3+00 S 2+50 S909 1716 3232 1718 6153 13K S3) 4636 2214 2265 3498 2243 649B 6401 3853 f Ci ter
0=1
0 = 2
0 = 3
251
5+50 S 5+00 S 4+50 S 4+00 S 3+50 S 3+00 S 2+50 S
3.2 18 11 17 6.8 5.8
.5.8.
3.6 4.4
,4.4.
3.8
.3.8.
5.4 S. 4 5.4 fei ter
5.4 0=1
[478 0 = 2
14.4 0 = 3
IP-4
5+50 S 5+00 S 4+50 S 4+00 S 3+50 S 3+00 S 2+50 S.6 .5 1.6 2.3 .5 .3 .3 .7 .4 .5 .2 .2 .4 filter
TOPOGRAPHY
RESISTIVITY(ohm—m)
CHARGEABILITY(msec)
INTERPRETATION
METAL FACTOR Cp/res * 1CMM3)
Line 12+00 E
Dlpole-Dlpole Array
a ma
plot point
a - 25 H n - 1. 2. 3. 4
Fil tered Prof I les N-l
Resistivity Polar Izat Ion Metal Factor
Logar C th. Contours i * l*d* C. 9 \)* O * /*Of jlVj*
Instr. Rx:IP6. *4 8 *8 EDA.BRGM
TX:T3P10. GOO 650U. 2KV IPT1. Phoenix 1500M
Executed by! N. Moreau
INTERPRETATION
H Proven IP anonaly
Probable IP anomaly
Possible IP anomaly
NEWMONT EXPLORATION
INDUCED POLARIZATIONPowell Township
Powell property (project #221)
Date: 88/12 N.T.S.: 42A/2. 41P/15 Interpreted by: N. Moreau 8 E. Gaucher Scale : l : 2000 Project: 56.10
GEOSIG Inc.

42A02SW83M 2 .12447 POWELL900
Mining Lands Section 880 Bay Street, 3rd Floor Toronto, Ontario M5S 1Z8
Telephone: (416) 965-4888
Your File: H8908-137 Our File: 2.12447
September 7, 1989
liining Recorderliitiistry of Northern Development and Mines4 Government Road LastKirkland Lake, OntarioP2N 1A2
Dear Sir:
Re: Notice of Intent dated July 31, 1989 Geophysical (Induced Polarization) Survey submitted on Mining Claims L 971909 et al in Powell Township.
The asscsstiorit work credits, as listed with the above-mentioned Notice of Intent, have been approved as of l ho above date.
Please inform the recorded holder of these mining claims and so Indicate on your records.
Yours sincerely,
W. R. CowanProvincial Manager, [lining LandsIlines S Minerals Division
LS:eb Enclosure
cc: Mr. G.H. FergusonMining and Lands Commissioner Toronto, Ontario
Ncwnont Exploration of Canada Ltd.Toronto, Ontario
Geosig Inc. Ste-Foy, Quebec
ONTARIO OEOLOQICAL SURVEY ' ASSESSMENT FILES
OFFICE
SEP O 8 1989
RECEIVED
Resident Geologist Kirkland Lake, Ontario
Peter Hood Timnins, Ontario
© Minisiryoi technical Assessment FH* Northern Development ,.,.~.. n 1 1 A At .^Mi^, Work Credits 2.12447Onlario
1
o*l* . Mlnlno Recorder* R*port o(July 31, 1989 0W08-137
Recorded Holder
NEWMONT EXPLORATION OF CANADA LTD.Township or Area
POWELL TOWNSHIP.Type of survey and number of
Assessment days credit per claimGeophysical
on
Section 77 (19) See "Mining Claims Assessed" column
fipningi'ral day!
fiprwhemiral . dayi
Man days Q Airborne Q
Special provision JJ3 Ground fj^
Q Credits have been reduced because of partial coverage of claims.
PI Credits have been reduced because of corrections 10 work dales and figures of applicant.
Mining Claims Assessed
L 971909 971910 979108 to 111 incl.
i
Special credits under section 77 (16) for the following mining claims
15 days L 971907-08
10 days L 979107, 979112
5 days L 971911
No credits have been allowed for the following mining daimiffi not sufficiently covered by the survey [~1 insufficient technical data filed
L 971906
The Mining Recorder may reduce Ihe above credits if necessary in order that the total number of approved assessment days recorded on each claim does not exceed the maximum allowed as follows: Geophyskal-80; Geologocel - 40; Ceochemie*! - 40; Section 77(19)'60.
*Z* (BVi 2)

gport of WorkVjGeopfiysica!, Geological,
- Geochemical and Expenditures)
DOCUMENTW8908*
Mining Act
Ltions: — Please type or print. -*"" ' fl —If number e-1 m ining claims traversedl exceeds space on tt.'.s form, attach t l ist'Note: - Only days credits calculated in the
"Expenditures" section may be entered m the "Expend. Days Cr." columns.
- Do not use (haded a reas below.Type of Surveylsl
Induced "PolarizationClaim Holder(s)
Township or Area
Ppwell^Twp.__ ''"[Prospector'* Licence No.
Newmont Exploration of /6nadaAddress
33 Yonge St. Ste 370, Toronto,. Ontario .M5E;J.T2 . ,Survey Company [bate of Survey (from A to)
Geosig Inc. . . . ^. ..Name and Address of Author (of Geo-Techmcal report)
A37767
16 ,12 88 j 23 01 89Day J Mo. ! Vr. j Day J Mo. | Vr.
2406 Quartre-Bourgeois Ste 200, Ste-Fov. Quebec G1V 1W5____
Total MilH 01 l ine Cut
Credits Requested per Each Claim in Columns at rightSpecial Provisions
For first survey:
Enter 40 days. (This includes line cutting)
For each additional survey: ^^^^ using the same grid:
Enter 20 days (for each) ' " ' * - P ' 2 0i Geological
Geophys.cal
- Electromagnetic
- Magnetometer
- Radiometric
- Other
! D?vs Per . claim
i Geochemical1
Man Days
Complete reverse Side and enter
1 D8VS oe- Claim
Note: Special orovis'ons Eit-ctromagnet'C cr-afiits do not app ; y '.o Ai'DO'ne Surveys Vjgne-o-ieter
Mining Claims Traversed (List in numerical sequence)
Expenditures (excludes powet st: pivng)Type o' W orK
Per f c
Calculation o'
To;ai E*ai
Days C^ec.'s
Total Days Crea'(S rr.ay :)ti jChO'Ce. C'-ter n u o-t-, fl r 01 l.V,
Mining ClaimPrefix - N umber
- 9 7 ;19J)J,.—2.7.1101. ..-9719.0JL.
L-91l909
-9J7JLlIJ.,
9.7.3 LO 1..9.79108.-9.7.9.105.-.9JL9A1Q.
9.79111..9.79.112.
M1V.1HG
Expend. Days Cr.
•SECTl
Total n^mhe-- o* -rt.nmg c'aims cove'ea t y : h*s ••ecorr of .vo'*-.
Date
Certification Venfying R eport o f Work
1 hereby certify that 1 have a persona, and intimate knowledge o' tie iacts set *orth m the Report of Work annexed hereto, having performed the wo r k o r witnessed same dormg anci o- vie' is complctiCfi .^nn the annexed fepo't :s tru*?
Name and Postal Address of Person
Peter Wood 637 Algonquin Blvd. E., P.O. Box 1430 Timmins, Ontario P4N 7N2Date Certified
April 26/89tg na l u r*

Ontario
Ministry of Natural Resources
GEOPHYSICAL - GEOLOGICAL - GEOCHEMICAL TECHNICAL DATA STATEMENT
File.
TO BE ATTACHED AS AN APPENDIX TO TECHNICAL REPORTFACTS SHOWN HERE NEED NOT BE REPEATED IN REPORT
TECHNICAL REPORT MUST CONTAIN INTERPRETATION, CONCLUSIONS ETC.
l
Type of Survey(s) Induced Polarization Township or Area Powell Township———-Claim Holder(s) Newmont Exploration of Canada Ltd.
33 Yonge St. Suite 370, Tnr MRP IT?Survey Company fipnsig T no, .——^^...^——^..—^^^
Author of Report N. and E. chste 2 00 Ste-Foy, Quebec
Covering Dates of Survey-
Total Miles of Line Cut —
1QRR - Ja(linccutting to office)
n.ffic
1989
SPECIAL PROVISIONS CREDITS REQUESTED
ENTER 40 days {includes line cutting) for first survey.ENTER 20 days for each additional survey using same grid.
DAYS per claim.Geophysical
—Electromagnetic—————Magnetometer-————.—Radiometric——————
IP 20
Geological.Geochemical.
AIRBORNE CREDITS (Special provision credits do not apply to airborne surveys)
Magnetometer. .Electromagnetic. . Radiometric(enter days per claim)
T1ATF.- April 26.19R9Sir.NATITRF. !Author of Report or Agent
Res. Geol.. .Qualifications.Previous Surveys
File No. Type Date Claim Holder
MINING CLAIMS TRAVERSED List numerically
(prefix) (number)
,....,..........,.3.7.AJ9.Q.7..........
.2.7.L9.Q&,.
.9.7.1910............**f *l*v* r* *v* *V*** ** * * * ** t *
i
D J1
TOTAL CLAIMS__12.
837 (6/79)

GEOPHYSICAL TECHNICAL DATA
GROUND SURVEYS - If more than one survey, specify data for each type of survey
Number of Stations ——^—————————^^.——————Number of Readings - Station interval —————^———--——————^^—————————Line spacing —————. Profile scale ———————————————————————————————————————————Contour interval.
r. Instrument.
ttZ
o
DQ
Accuracy — Scale constant. Diurnal correction method.Base Station check-in interval (hours). Base Station location and value -——
ELECTROMAGNETIC
Instrument
Coil configurationCoil separation .AccuracyMethod: Frequency
D Fixed transmitter D Shoot back D In line d Parallel line
(specify V.L.F. station)Parameters measured.
InstrumentScale constant.Corrections made.
lBase station value and location .
Receiver; IP-6 built by EDA-BrGM S/N 4 and 8———.——— Transmitters: T3P10(65W)2 kw built by Instrumentation
GDD Inc. Instrument _____________________TPTT ( 1 SHOW) built, by Phoenix———————————Method C3 Time Domain D Frequency DomainParameters - On time 2 seconds________________ Frequency ——————^^.^^——.
- Off time ? sp.nnnds_________________ Range.- Delay time 2 mseconds^^___________- Integration time 240 mseconds_________
Power l. 5 and 2 kwElectrode array dipole-dipoleElectrode spacing , 25, metre————————————————————— Type of electrode steel and stainless steel pins
SELF POTENTIALInstrument_______________________________________ Range.Survey Method ————-——^—^———————————-——-—————————..—.
Corrections made.
RADIOMETRICInstrument.Values measured.Energy windows (levels).————————————————^—-^—-——————..—————Height of instrument———^——^—^-———^^—-^^———————Background Count.Size of detector—————-—-——-———^^^^——————.———^-————-————.^—Overburden ———.-—————.———^————^——-^.—..—.—.—^.—————-———
(type, depth — include outcrop map)
OTHERS (SEISMIC, DRILL WELL LOGGING ETC.) Type of survey——————^^^^—^^^———————Instrument —————————-^—.———————.Accuracy.—-—————————————^——————
Parameters measured.
Additional information (for understanding results).
AIRBORNE SURVEYS Type of survey(s)——— Instrument(s) —————
(specify for each type of survey)
Accuracy(specify for each type of survey)
Aircraft used————————.-.——.-—————-^——.^^-—.——.
Sensor altitude.Navigation and flight path recovery method.
Aircraft altitude_________________________________Line Sparing Miles flown over total area———————————————————^.——Over claims only.

GEOCHEMICAL SURVEY - PROCEDURE RECORD
Numbers of claims from which samples taken.
Total Number of Samples- Type of Sample.
(Nature of Material)
Average Sample Weight———————
Method of Collection————————
Soil Horizon Sampled. Horizon Development. Sample Depth———— Terrain________
Drainage Development———————————— Estimated Range of Overburden Thickness.
ANALYTICAL METHODSValues expressed in: per cent
p. p. m. p. p. b.
n n a
Cu, Pb,
Others_
Zn, Ni, Co, Ag, Mo, As.-(circle)
Field Analysis (.Extraction Method. Analytical Method- Reagents Used ——
Field Laboratory AnalysisNo. ——————^——
SAMPLE PREPARATION(Includes drying, screening, crushing, ashing)
Mesh size of fraction used for analysis ———
Extraction Method. Analytical Method . Reagents Used ——.
Commercial Laboratory (- Name of Laboratory— Extraction Method—— Analytical Method ——
Reagents Used————
.tests)
.tests)
-tests)
GeneraL General.

N O Q
33 m >
en -l
X
D
33
> Z en -D O C/9 3 o z
m m 3
m z
o
rn CO
Ban
nock
burn
Tw
p.
tB
Q -^
"^
O H
-a
r —
f.—
rT-
DD Q Q.
O) 13 H
-o
Cairo
Twp
.
m
CD 3) c OD
W
CD
CO
O
C 3
CD
W
.E;
CO
03
-
? ?
'a
H s r
l
to o
o o i en
CO -o
o C/3 C/3
-t m Z
O
li o 33 S c m
O
- O
en C CD O
-n
Z
C
O 3!
m P" Z
m
2 O
3) O O s -p o to
5 O O
O
z
O
m
m >
S
C zg;
-p
r-
yi^
> O
CZ
3)
-H
35
O X
D o
en Cr-
-t
3?
O
O <
-(
S "i
y z
-c
—
en m
5xo
^
O
OD
mO
O
X3
5S
x3)
S
D
Z
en
O 31 O C
^
l
en ^
m
•o (
fi-
/Tl
m m H n f
m
O
m
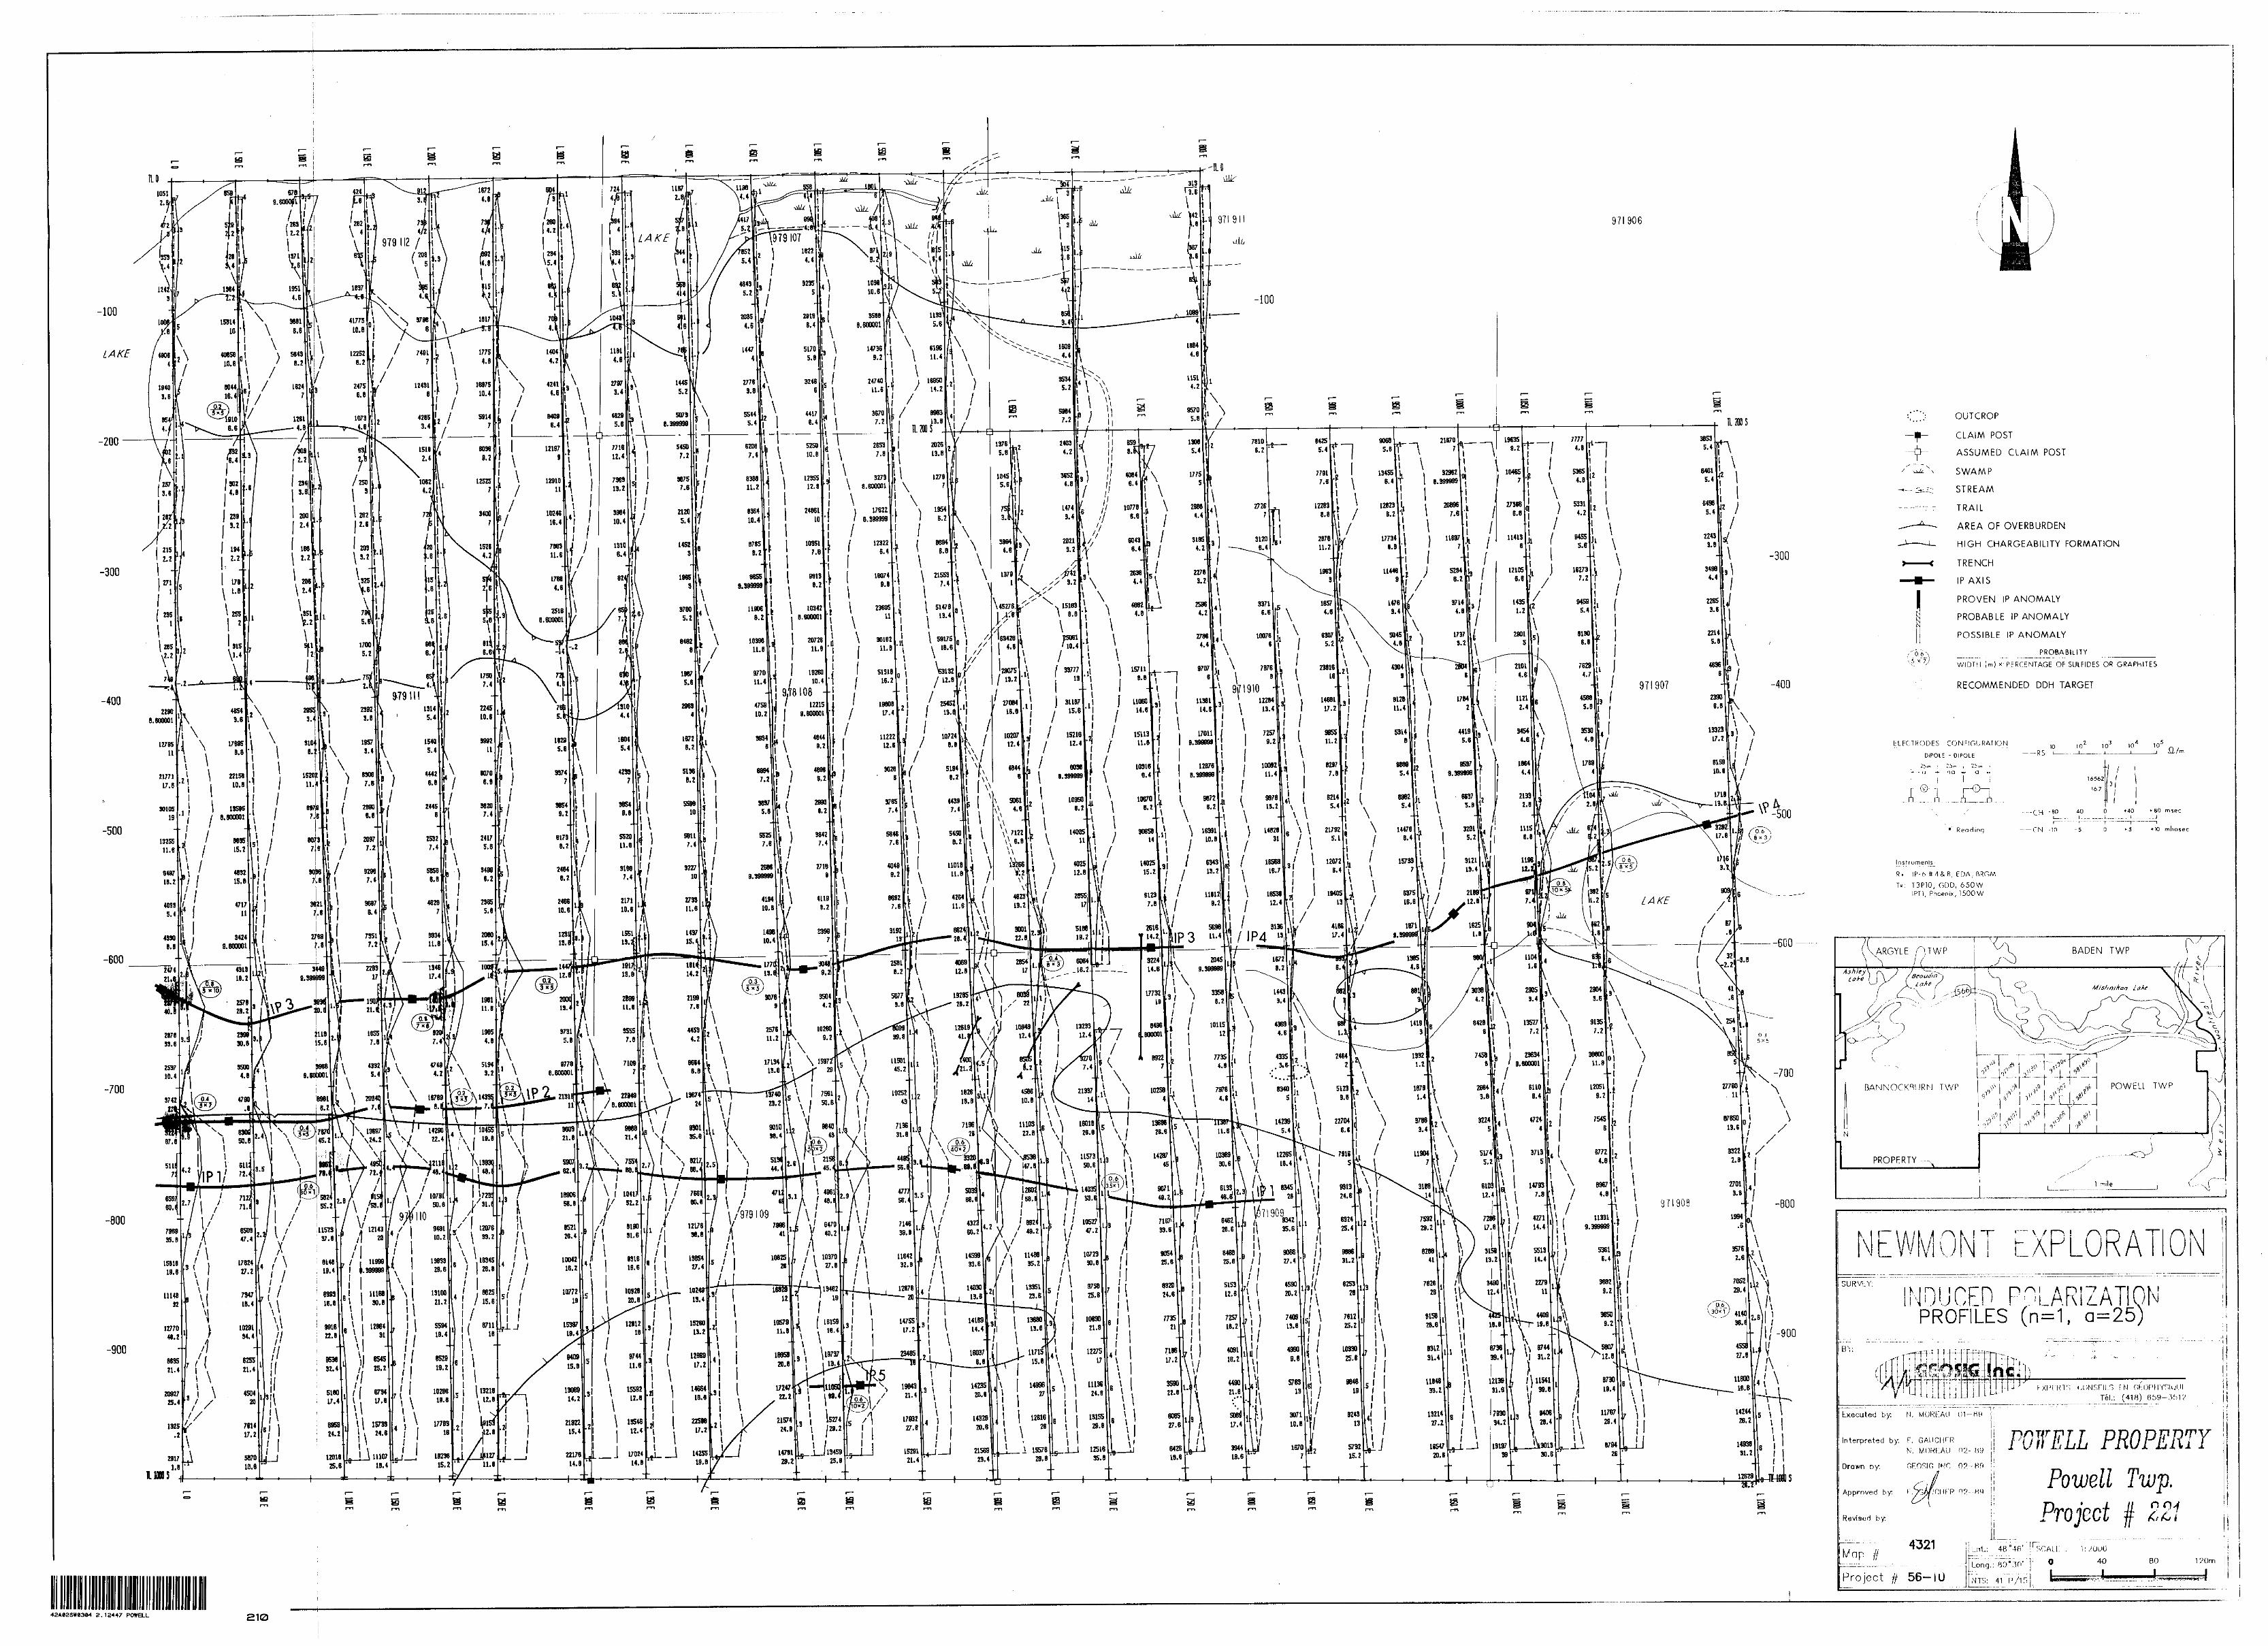
971906
112005
-300
-400
1L10005 -tf
OUTCROP
CLAIM POST
ASSUMED CLAIM POST
SWAMP
STREAM
TRAIL
AREA OF OVERBURDEN
HIGH CHARGEABILITY FORMATION
TRENCH
IP AXIS
PROVEN IP ANOMALY
PROBABLE IP ANOMALY
POSSIBLE IP ANOMALY
PROBABILITY
WIDTH (m) x- PERCENTAGE OF SUIFIDES OR GRAPHITES
RECOMMENDED DDH TARGET
L: LK.1RODES CONFIGURATION
DIPOIE - DIPOLE10
--RS10 10'
Ji/n
25 r- - 1 1
16562 f l
l167
l
Reading
Instrumenlsj
R. IP-6 1M& R, EDA, RRGM
Tx T3P10, GDD, 650W IPT1, Phoenix, 1500W
-CH -80r—
-CN -in -5
*40""•"T"
*5
* 80 msec.*J
*X) mhosec
-A \ POWELL TWPBANNOCKBURN TWF
\ ON
EJ'i:
;iJRVLY; rPROFILES (n^ f 0=25
Tel.: (418) 659-3H1V
Executed b y. N . MOKKAU (11-H9
Interpreted b y. F .N. MORI:AU n?.- 89
Drawn by:
Approved by:
Revised by:
GFOSIG INC
O?- -H9
PROPERTYPowell Twp.
Project j 221Lnt: 48"4fi' hsCALK . 'n^OuO
J T"-: ."r^"--, ri '"li o 40
Project # 56- 1 ULong.: B
NTS: 41
80 120m
42*828*183*4 2.124-47 POWELL 210

-100
LAKE
-200
-300
-600
-700
-800
971906
las
-300
-4QO
^___——osfi
lions
OUTCROP
CLAIM POST
ASSUMED CLAIM POST
SWAMP
STREAM
TRAIL
AREA OF OVERBURDEN
HIGH CHARGEABILITY FORMATION
TRENCH
IP AXIS
PROVEN IP ANOMALY
PROBABLE IP ANOMALY
POSSIBLE IP ANOMALY
______________PROBABILITY^^———^^——
WIDTH {ml x PERCENTAGE OF 5ULF1DES OR GRAPHITES
RECOMMENDED DDH TARGET
ELECTRODES CONFIGURATIONDIPOLE - DIPOLE
25m i 25m i 25™ i a — — no— ••— a — i
—— RS102 103 10
k— a — f—
\ y
16-7
B l i•CH -W -40 O +40 *-80 mwc
Rtoding —— CN -10 -5 O *t) mhot*c
InstrurnenH
R, IP-6 #44 8, EDA, BROWTx: T3P10, GOD, 650W
tPTl, Pho*™, 1500W
.ARGYLE ATWP
BANNOCKBURN TWPy ff
l
l PROPERTY-
^IV
l* 1 .Vi- fl\ B ll' p^y l
.^ l a(p
l mile
NEWMONT EXPLORATIONSURVEY:
INDUCED POLARIZATIONRESISTIVITY CONTOURS (n^, 0=25)
BY:
EXPERTS-CONSOLS EN GEOPHYS1QUE Tel.: (418) 659-3512
Executed by: N. MOREAU 01-89
Interpreted by: E. GAUCHERN. MOREAU 02-89
Drawn by: GEOSIG INC 02-89
Approved by: E. G
Revised by:
02-89
POWELL PROPERTYPowell Twp.
Project f 221Map # 4322
Project # 56-10
Lot.: 48 '46'
Long.: 80*30'
NTS; 41 P/15
SCALE O
1:2000
40 l
80 120m
2 12447

TIB
-100
LAKE
-400
-500
-600
-900
971906
ins
-30Q
-400
lions
OUTCROP
CLAIM POST
ASSUMED CLAIM POST
SWAMP
STREAM
TRAIL
AREA OF OVERBURDEN
HIGH CHARGEABILITY FORMATION
TRENCH
IP AXIS
PROVEN IP ANOMALY
PROBABLE IP ANOMALY
POSSIBLE IP ANOMALY
_______________PROBABILITY-^————————
WIDTH (m) x PERCENTAGE OF SULFIDE5 OR GRAPHITES
RECOMMENDED DON TARGET
ELECTRODES CONFIGURATIONtMPO L E - DlfOLE
5m i 25m i 25m ji —i— no-4— a —*
——— RSn io
1*7
••O -40 O **0 *K MM-
-K) -S O *3
Ri: IP-644&8, EDA, MOWTx: T3P10, GDD, 6 50W
IPT1, Pho*oi*, 150OW
f\ARGYLE ATWP
BANNOCKBURN TWP
NEWMONT EXPLORATIONSURVEY:
INDUCED POLARIZATIONCHARGEABILITY CONTOURS (n^, 0=25)
BY:
EXPERTS-CONSHLS EN GEOPHYS1QUE Tel.; (418) 659-3512
Executed by: N. MOREAU 01-89
Interpreted by: E. GAUCHERN. MOREAU 02-89
Drawn by: GEOSIG INC 02-89
Approved by: E.
Revised by:
iER 02-89
POWELL PROPERTYPowell Twp.
Project # 221Map # 4323
Project # 56-10
Lat.: 46 '46'
Long.: 80'3D'
NTS: 41 P/15
SCALE
O
:2000
40l
80l
120ml
42A*2S*e384 2.12447 POWELL 230

971906
-100
LAKE
-200
-900
IL2H5
300
--————f————
IMS
OUTCROP
CLAIM POST
ASSUMED CLAIM POST
SWAMP
STREAM
TRAIL
AREA OF OVERBURDEN
HIGH CHARGEABILITY FORMATION
TRENCH
IP AXIS
PROVEN IP ANOMALY
PROBABLE IP ANOMALY
POSSIBLE IP ANOMALY
_______________PROBABILITY-^^—--——-——
WIDTH (m) x PERCENTAGE OF SUIF1DES OR GRAPHITES
RECOMMENDED DDH TARGET
ELECTRODES CONFIGURATIONDIPOLE - DIPOLE
4 5
——— RS10 10 10 10
fl/nj ii/m
25m i 25f - no ~- a
Reading
Instruments:
Rx: IP-6 #448, EDA, BRGM
Tx: T3P10, GDD, 650W IPT1, Phoenix, 1500W
i 1656211 l
"80 -40 O **0 + &0 msec
—— CN -10 -5 O *5 +10 mhosec
BANNOCKBURN TWP
NEWMONT EXPLORATIONSURVEY:
INDUCED POLARIZATIONNORMAUZED CHARGEABIUTY CONTOURS (11=1, 0=25)
BY:
EXPERTS-CONSE1LS EN GEOPHYS1QUE j Tel.: (418) 659-3512 i
Executed by. N . MOREAU 01-89
Interpreted by E. GAUCHERN. MOREAU 02-89
Drawn by GEOSIG INC 02-89
Approved by: E. GA'U^ER 02-89
Revised b y.
POWELL PROPERTYPowell Twp.
Project j 221Map #
"4324"
Project # 56-10
Lot: 46 *46'
Long.: 80*30'
NTS: 41 P/15
SCALE : 1:2000 O 40 80
l120m __l
42A02S**384 2.12447 POWELL 240