news release - angloamerican.com/media/files/a/anglo-american-plc-v... · (4) anglo american...
TRANSCRIPT
NEWS RELEASE
24 April 2018
Anglo American plc
20 Carlton House Terrace London SW1Y 5AN United Kingdom
Registered office as above. Incorporated in England and Wales under the Companies Act 1985.
Registered Number: 3564138 Legal Entity Identifier: 549300S9XF92D1X8ME43
Anglo American plc Production Report for the first quarter ended 31 March 2018 Anglo American reports a 4% increase in total production on a copper equivalent basis in the first quarter of 2018, compared to the same period of 2017(1).
Mark Cutifani, Chief Executive of Anglo American, said: “Our operations have made a solid start to 2018, delivering a 4% increase in total production. This reflects our consistent focus on driving efficiency across our portfolio and continuing our strong performance of Q4 2017 despite the suspension of operations at Minas-Rio.”
Highlights De Beers production increased by 15% reflecting a ramp-up in production in response to sustained
healthy trading conditions and the inclusion of production from Gahcho Kué.
Copper production increased by 9% to 154,900 tonnes with strong operational performance and higher
grade at Los Bronces and improved plant performance at Collahuasi.
Platinum production increased by 7% and palladium by 9% due to improved operational performances
across the portfolio. The sale of Union mine was completed on 1 February 2018.
Kumba Iron Ore production increased by 4% to 10.9 million tonnes driven by improved productivity at
Kolomela.
Minas-Rio production decreased by 30% to 3.0 million tonnes primarily as a result of the suspension
of the operation following a leak in the pipeline that carries iron ore slurry from the mine to the port.
Metallurgical coal production increased by 6% due to performance improvements at Moranbah and
the continued ramp-up of Grosvenor.
Production Summary
Q1 2018 Q1 2017 % vs. Q1 2017
Diamonds (Mct)(2) 8.5 7.4 15%
Copper (kt)(3) 155 143 9%
Platinum (koz)(4) 614 572 7%
Palladium (koz)(4) 407 373 9%
Iron ore – Kumba (Mt) 10.9 10.5 4%
Iron ore – Minas-Rio (Mt)(5) 3.0 4.3 (30)%
Metallurgical coal (Mt) 5.5 5.2 6%
Thermal coal (Mt)(6) 6.8 7.5 (10)%
Nickel (kt)(7) 8.6 9.9 (13)%
Manganese ore (kt) 881 823 7%
(1) Copper equivalent production is normalised for Bokoni being placed on care and maintenance in 2017. (2) De Beers production is on a 100% basis, except for the Gahcho Kué joint venture which is on an attributable 51% basis. (3) Contained metal basis. Reflects copper production from the Copper business unit only (excludes copper production from the Platinum business unit). (4) Produced ounces. Reflects own mine production and purchases of metal in concentrate. (5) Wet basis. (6) Reflects export production from South Africa and Colombia. (7) Reflects nickel production from the Nickel business unit only (excludes nickel production from the Platinum business unit).
2
DE BEERS
De Beers(1) Q1
2018 Q1
2017
Q1 2018 vs.
Q1 2017
Q4 2017
Q1 2018 vs.
Q4 2017
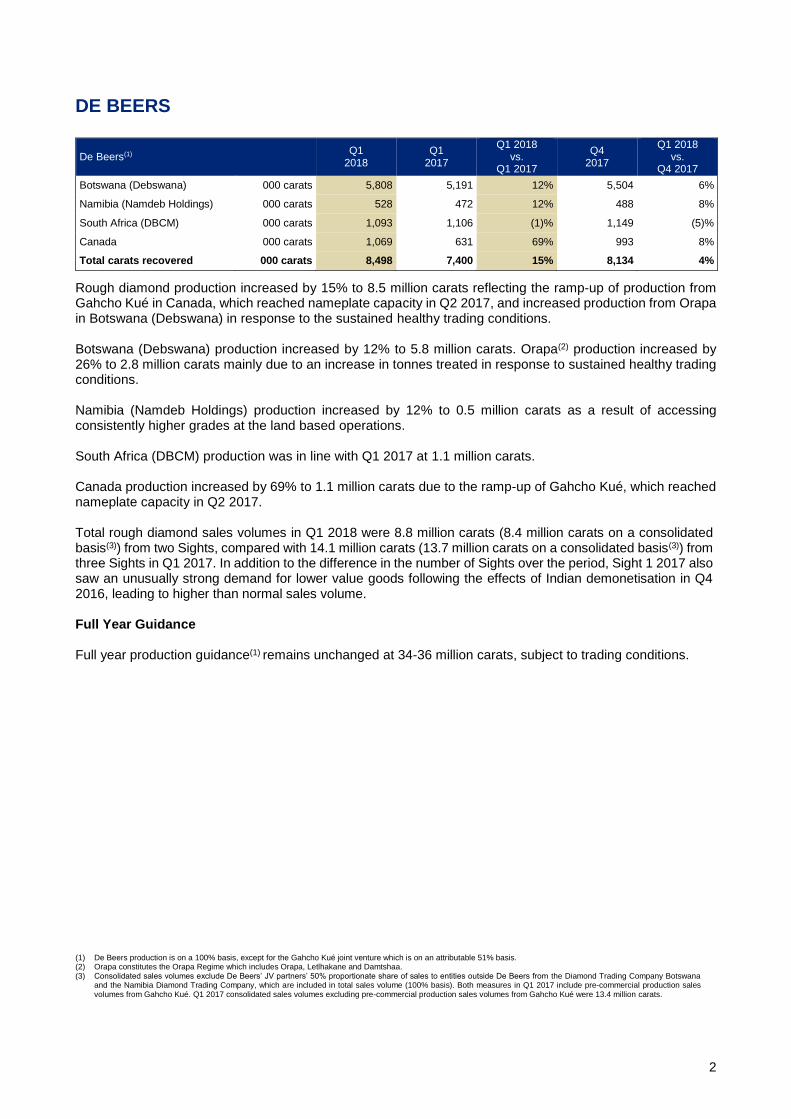
Botswana (Debswana) 000 carats 5,808 5,191 12% 5,504 6%
Namibia (Namdeb Holdings) 000 carats 528 472 12% 488 8%
South Africa (DBCM) 000 carats 1,093 1,106 (1)% 1,149 (5)%
Canada 000 carats 1,069 631 69% 993 8%
Total carats recovered 000 carats 8,498 7,400 15% 8,134 4%
Rough diamond production increased by 15% to 8.5 million carats reflecting the ramp-up of production from Gahcho Kué in Canada, which reached nameplate capacity in Q2 2017, and increased production from Orapa in Botswana (Debswana) in response to the sustained healthy trading conditions. Botswana (Debswana) production increased by 12% to 5.8 million carats. Orapa(2) production increased by 26% to 2.8 million carats mainly due to an increase in tonnes treated in response to sustained healthy trading conditions. Namibia (Namdeb Holdings) production increased by 12% to 0.5 million carats as a result of accessing consistently higher grades at the land based operations. South Africa (DBCM) production was in line with Q1 2017 at 1.1 million carats. Canada production increased by 69% to 1.1 million carats due to the ramp-up of Gahcho Kué, which reached nameplate capacity in Q2 2017. Total rough diamond sales volumes in Q1 2018 were 8.8 million carats (8.4 million carats on a consolidated basis(3)) from two Sights, compared with 14.1 million carats (13.7 million carats on a consolidated basis(3)) from three Sights in Q1 2017. In addition to the difference in the number of Sights over the period, Sight 1 2017 also saw an unusually strong demand for lower value goods following the effects of Indian demonetisation in Q4 2016, leading to higher than normal sales volume. Full Year Guidance Full year production guidance(1) remains unchanged at 34-36 million carats, subject to trading conditions.
(1) De Beers production is on a 100% basis, except for the Gahcho Kué joint venture which is on an attributable 51% basis. (2) Orapa constitutes the Orapa Regime which includes Orapa, Letlhakane and Damtshaa. (3) Consolidated sales volumes exclude De Beers’ JV partners’ 50% proportionate share of sales to entities outside De Beers from the Diamond Trading Company Botswana
and the Namibia Diamond Trading Company, which are included in total sales volume (100% basis). Both measures in Q1 2017 include pre-commercial production sales volumes from Gahcho Kué. Q1 2017 consolidated sales volumes excluding pre-commercial production sales volumes from Gahcho Kué were 13.4 million carats.
3
De Beers Q1 2018 Q4 2017 Q3 2017 Q2 2017 Q1 2017 Q1 2018
vs. Q1 2017
Q1 2018 vs.
Q4 2017
Carats recovered (000 carats)
100% basis (unless otherwise stated)
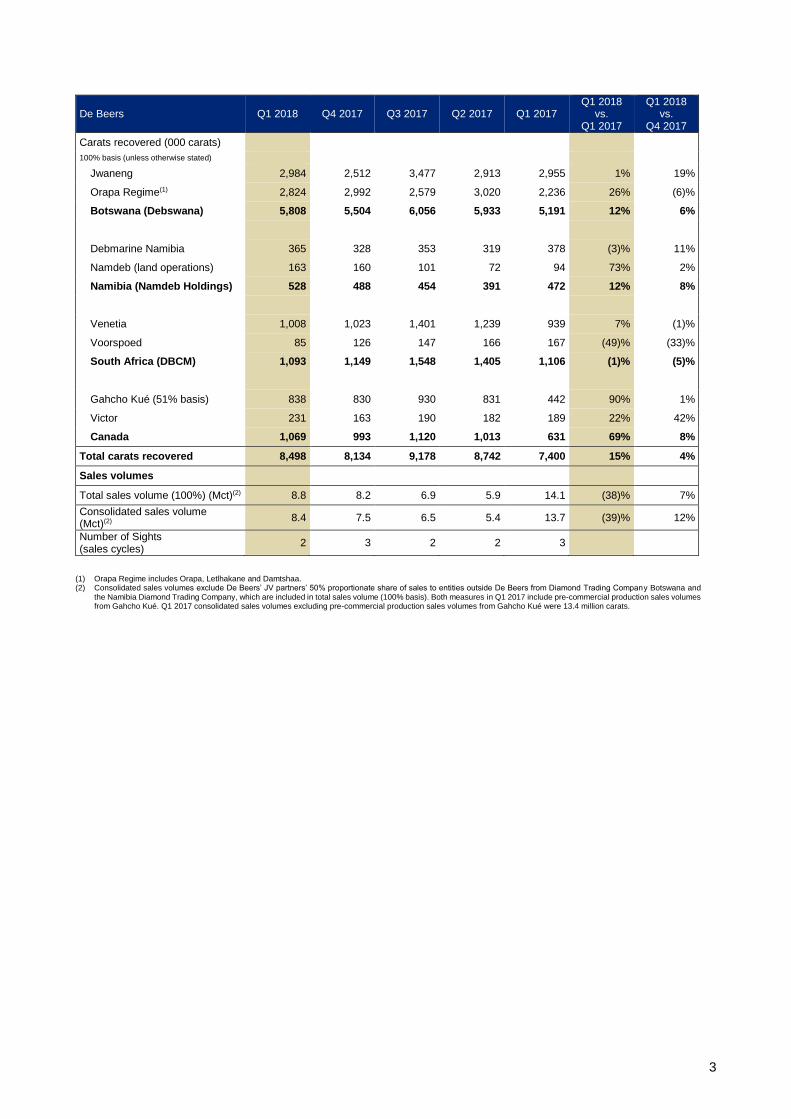
Jwaneng 2,984 2,512 3,477 2,913 2,955 1% 19%
Orapa Regime(1) 2,824 2,992 2,579 3,020 2,236 26% (6)%
Botswana (Debswana) 5,808 5,504 6,056 5,933 5,191 12% 6%
Debmarine Namibia 365 328 353 319 378 (3)% 11%
Namdeb (land operations) 163 160 101 72 94 73% 2%
Namibia (Namdeb Holdings) 528 488 454 391 472 12% 8%
Venetia 1,008 1,023 1,401 1,239 939 7% (1)%
Voorspoed 85 126 147 166 167 (49)% (33)%
South Africa (DBCM) 1,093 1,149 1,548 1,405 1,106 (1)% (5)%
Gahcho Kué (51% basis) 838 830 930 831 442 90% 1%
Victor 231 163 190 182 189 22% 42%
Canada 1,069 993 1,120 1,013 631 69% 8%
Total carats recovered 8,498 8,134 9,178 8,742 7,400 15% 4%
Sales volumes
Total sales volume (100%) (Mct)(2) 8.8 8.2 6.9 5.9 14.1 (38)% 7%
Consolidated sales volume (Mct)(2)
8.4 7.5 6.5 5.4 13.7 (39)% 12%
Number of Sights (sales cycles)
2 3 2 2 3
(1) Orapa Regime includes Orapa, Letlhakane and Damtshaa. (2) Consolidated sales volumes exclude De Beers’ JV partners’ 50% proportionate share of sales to entities outside De Beers from Diamond Trading Company Botswana and
the Namibia Diamond Trading Company, which are included in total sales volume (100% basis). Both measures in Q1 2017 include pre-commercial production sales volumes from Gahcho Kué. Q1 2017 consolidated sales volumes excluding pre-commercial production sales volumes from Gahcho Kué were 13.4 million carats.

4
COPPER
Copper(1) Q1
2018 Q1
2017
Q1 2018 vs.
Q1 2017
Q4 2017
Q1 2018 vs.
Q4 2017
Los Bronces t 85,000 75,800 12% 75,400 13%
Collahuasi (44% share) t 60,600 57,700 5% 63,500 (5)%
El Soldado t 9,300 9,100 2% 9,700 (4)%
Total Copper t 154,900 142,600 9% 148,600 4%
(1) Copper production shown on a contained metal basis.
Production increased to 154,900 tonnes with strong operational performances at both Los Bronces and Collahuasi. Production from Los Bronces increased by 12% to 85,000 tonnes due to a combination of strong mine and plant performance and an increase in ore grade (0.71% vs. 0.69%). At Collahuasi attributable production increased by 5% to 60,600 tonnes, underpinned by initiatives to improve plant performance. The planned three month major maintenance of Line 3 (responsible for around 60% of plant throughput), to replace the stator motor on one of the two ball mills, started on 12 March. El Soldado production increased by 2% to 9,300 tonnes. Full Year Guidance Full year production guidance remains unchanged at 630,000 – 660,000 tonnes.

5
Copper(1) Q1 2018 Q4 2017 Q3 2017 Q2 2017 Q1 2017 Q1 2018
vs. Q1 2017
Q1 2018 vs.
Q4 2017
Collahuasi 100% basis
(Anglo American share 44%)
Ore mined 11,859,300 17,478,300 18,467,800 14,984,100 13,803,300 (14)% (32)%
Ore processed - Sulphide 12,894,200 13,658,400 13,084,900 10,807,100 12,336,400 5% (6)%
Ore grade processed - Sulphide (% TCu)(2) 1.24 1.28 1.24 1.27 1.24 0% (3)%
Production - Copper cathode - - - - 100 (100)% -
Production - Copper in concentrate 137,600 144,400 132,600 115,900 131,000 5% (5)%
Total copper production for Collahuasi 137,600 144,400 132,600 115,900 131,100 5% (5)%
Anglo American’s share of copper production for Collahuasi(3)
60,600 63,500 58,300 51,000 57,700 5% (5)%
Los Bronces(4) 85,000 75,400 78,100 79,000 75,800 12% 13%
Ore mined 15,675,300 11,553,900 12,707,100 11,630,200 13,448,400 17% 36%
Ore processed – Sulphide 12,477,100 10,610,600 11,675,700 11,876,300 11,877,400 5% 18%
Ore grade processed - Sulphide (% TCu) 0.71 0.76 0.69 0.70 0.69 3% (7)%
Production - Copper cathode 8,500 9,800 9,800 9,800 8,900 (4)% (13)%
Production - Copper in concentrate 76,600 65,600 68,300 69,200 66,900 14% 16%
El Soldado(4) 9,300 9,700 10,900 10,800 9,100 2% (4)%
Ore mined 2,112,500 1,698,500 1,462,200 1,272,200 905,500 133% 24%
Ore processed - Sulphide 1,785,600 1,846,600 1,851,700 1,899,200 1,797,600 (1)% (3)%
Ore grade processed - Sulphide (% TCu) 0.67 0.65 0.73 0.72 0.65 3% 3%
Production - Copper in concentrate 9,300 9,700 10,900 10,800 9,100 2% (4)%
Chagres Smelter(4)
Ore smelted 34,700 35,600 35,400 31,500 31,300 11% (3)%
Production 33,800 34,700 34,400 30,600 30,300 12% (3)%
Total copper production(5) 154,900 148,600 147,300 140,800 142,600 9% 4%
Total payable copper production 149,100 143,100 141,900 135,800 137,500 8% 4%
Total sales volumes 131,600 156,400 163,900 144,100 115,300 14% (16)%
Total payable sales volumes 126,700 150,600 158,000 138,900 111,200 14% (16)%
Third party sales(6) 30,800 40,500 33,700 27,400 9,800 214% (24)%
(1) Excludes Anglo American Platinum’s copper production. (2) TCu = total copper. (3) Anglo American’s share of Collahuasi production is 44%. (4) Anglo American ownership interest of Anglo American Sur is 50.1%. Production is stated at 100% as Anglo American consolidates Anglo American Sur. (5) Total copper production includes Anglo American’s 44% interest in Collahuasi. (6) Relates to sales of copper not produced by Anglo American operations.

6
PLATINUM
Q1
2018 Q1
2017
Q1 2018 vs.
Q1 2017
Q4 2017
Q1 2018 vs.
Q4 2017
Platinum
Produced M&C ounces 000 oz 613.8 572.0 7% 587.0 5%
Own mined(1) 000 oz 343.0 322.7 6% 349.8 (2)%
Purchase of concentrate(2)
000 oz 270.8 249.3 9% 237.2 14%
Palladium
Produced M&C ounces 000 oz 407.4 372.7 9% 374.9 9%
Own mined(1) 000 oz 267.7 239.3 12% 251.5 6%
Purchase of concentrate(2)
000 oz 139.7 133.4 5% 123.4 13%
Refined production
Platinum 000 oz 502.6 576.9 (13)% 722.2 (30)%
Palladium 000 oz 319.8 353.4 (10)% 491.4 (35)%
Rhodium 000 oz 62.5 73.7 (15)% 87.4 (28)%
Gold 000 oz 22.9 24.7 (7)% 30.3 (24)%
Nickel t 5,100 5,100 0% 7,800 (35)%
Copper t 3,200 3,200 0% 4,700 (32)%
(1) Includes managed operations and 50% of joint venture production. (2) Purchase of concentrate includes 50% of joint venture production, and the purchase of concentrate from associates (Bokoni and BRPM) and third parties.
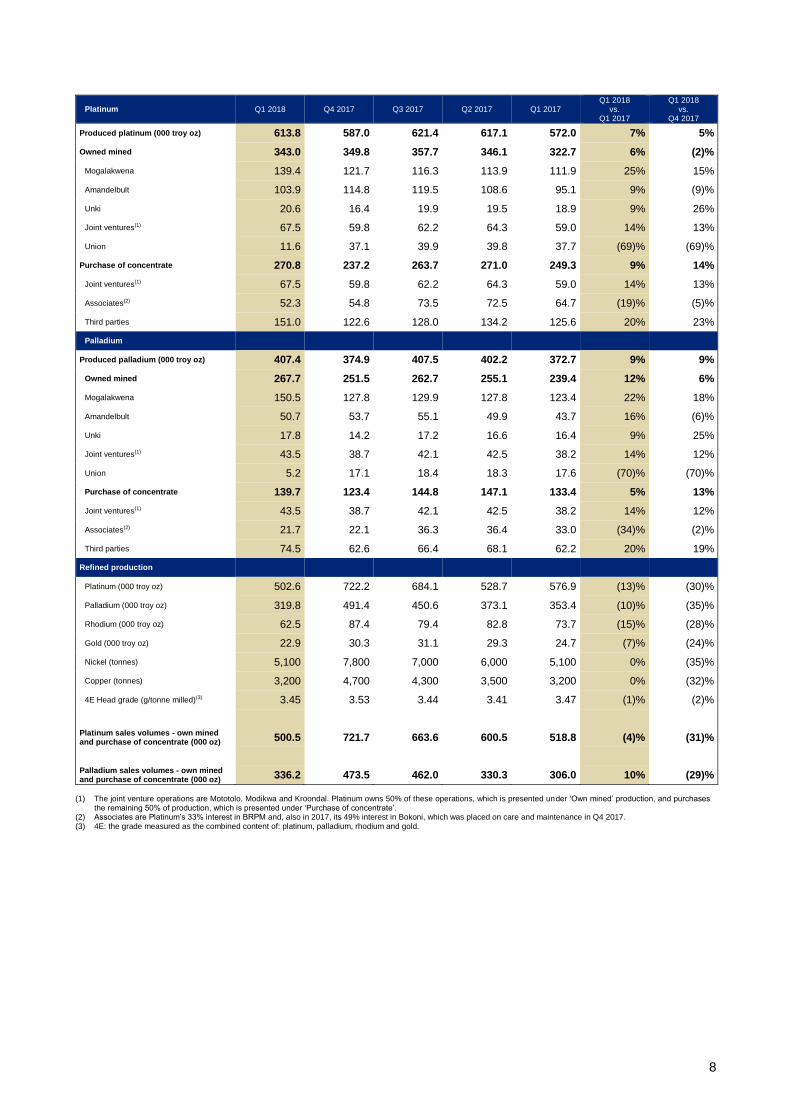
Platinum production increased by 7% to 613,800 ounces and palladium production increased by 9% to 407,400 ounces, due to improved operational performances across the portfolio. Own mined production Own mined platinum production increased by 6% to 343,000 ounces and palladium production increased by
12% to 267,700 ounces, due to a strong operational performance from Mogalakwena, supported by increases
at all other operations, and despite the sale of Union mine.
Mogalakwena platinum production increased by 25% to 139,400 ounces and palladium production increased by 22% to 150,500 ounces. The increases were as a result of continued strong performance with higher concentrator throughput and recoveries, and better than expected grade. Amandelbult had a stronger start to the year with platinum production increasing by 9% to 103,900 ounces and palladium production increasing by 16% to 50,700 ounces. The increases were as a result of continuing efficiency improvement and therefore fewer stoppages. Unki platinum production increased by 9% to 20,600 ounces and palladium production by 9% to 17,800 ounces due to increased concentrator throughput, higher grade and increased concentrator recoveries. Union mine was sold to Siyanda Resources on 1 February 2018, after which Union production was treated as third party purchase of concentrate and, as a result, mined platinum production decreased by 69% to 11,600 ounces and mined palladium production reduced by 70% to 5,200 ounces.
Joint venture platinum production from the three operations (Mototolo, Modikwa and Kroondal) increased by 14% to 135,000 ounces (of which 67,500 ounces is own mined production and 67,500 ounces is purchased concentrate). Palladium production also increased by 14% to 86,900 ounces (of which 43,500 ounces is own mined production and 43,500 ounces is purchased concentrate). This was driven by a strong production performance across the portfolio supplemented by additional processing of ore stockpiles built up at Mototolo following the temporary closure of the concentrator in Q3 2017.
7
Purchase of concentrate Purchase of concentrate from joint ventures increased by 14% for both platinum and palladium due to increased production as outlined above. Purchase of concentrate from associates decreased by 19% for platinum and 34% for palladium due to the removal of unprofitable ounces from Bokoni which was placed on care and maintenance in Q3 2017. Purchase of concentrate from third parties increased by 20% for both platinum and palladium due to production purchased from Union mine following the sale to a subsidiary of Siyanda Resources. Refined production and sales volumes Refined platinum production decreased by 13% to 502,600 ounces and refined palladium production decreased by 10% to 319,800 ounces, primarily due to a Section 54 stoppage affecting the smelters in December 2017, following a fatal incident, which constrained refined production into January 2018. In addition, planned scheduled maintenance caused downtime of 16 days in Q1 2018. In Q1 2017, refined volumes were unusually high due to the recovery from the Waterval Smelter run-out in 2016.
Platinum sales volumes decreased by 4% to 500,500 ounces, in line with refined production, while palladium sales volumes increased by 10% to 336,200 ounces as refined palladium inventory was sold down to normal levels. Full Year Guidance Full year production guidance remains at 2.3 – 2.4 million ounces of platinum and 1.5 – 1.6 million ounces of palladium.
8
Platinum Q1 2018 Q4 2017 Q3 2017 Q2 2017 Q1 2017 Q1 2018
vs. Q1 2017
Q1 2018 vs.
Q4 2017
Produced platinum (000 troy oz) 613.8 587.0 621.4 617.1 572.0 7% 5%
Owned mined 343.0 349.8 357.7 346.1 322.7 6% (2)%
Mogalakwena 139.4 121.7 116.3 113.9 111.9 25% 15%
Amandelbult 103.9 114.8 119.5 108.6 95.1 9% (9)%
Unki 20.6 16.4 19.9 19.5 18.9 9% 26%
Joint ventures(1) 67.5 59.8 62.2 64.3 59.0 14% 13%
Union 11.6 37.1 39.9 39.8 37.7 (69)% (69)%
Purchase of concentrate 270.8 237.2 263.7 271.0 249.3 9% 14%
Joint ventures(1) 67.5 59.8 62.2 64.3 59.0 14% 13%
Associates(2) 52.3 54.8 73.5 72.5 64.7 (19)% (5)%
Third parties 151.0 122.6 128.0 134.2 125.6 20% 23%
Palladium
Produced palladium (000 troy oz) 407.4 374.9 407.5 402.2 372.7 9% 9%
Owned mined 267.7 251.5 262.7 255.1 239.4 12% 6%
Mogalakwena 150.5 127.8 129.9 127.8 123.4 22% 18%
Amandelbult 50.7 53.7 55.1 49.9 43.7 16% (6)%
Unki 17.8 14.2 17.2 16.6 16.4 9% 25%
Joint ventures(1) 43.5 38.7 42.1 42.5 38.2 14% 12%
Union 5.2 17.1 18.4 18.3 17.6 (70)% (70)%
Purchase of concentrate 139.7 123.4 144.8 147.1 133.4 5% 13%
Joint ventures(1) 43.5 38.7 42.1 42.5 38.2 14% 12%
Associates(2) 21.7 22.1 36.3 36.4 33.0 (34)% (2)%
Third parties 74.5 62.6 66.4 68.1 62.2 20% 19%
Refined production
Platinum (000 troy oz) 502.6 722.2 684.1 528.7 576.9 (13)% (30)%
Palladium (000 troy oz) 319.8 491.4 450.6 373.1 353.4 (10)% (35)%
Rhodium (000 troy oz) 62.5 87.4 79.4 82.8 73.7 (15)% (28)%
Gold (000 troy oz) 22.9 30.3 31.1 29.3 24.7 (7)% (24)%
Nickel (tonnes) 5,100 7,800 7,000 6,000 5,100 0% (35)%
Copper (tonnes) 3,200 4,700 4,300 3,500 3,200 0% (32)%
4E Head grade (g/tonne milled)(3) 3.45 3.53 3.44 3.41 3.47 (1)% (2)%
Platinum sales volumes - own mined and purchase of concentrate (000 oz) 500.5 721.7 663.6 600.5 518.8 (4)% (31)%
Palladium sales volumes - own mined and purchase of concentrate (000 oz) 336.2 473.5 462.0 330.3 306.0 10% (29)%
(1) The joint venture operations are Mototolo, Modikwa and Kroondal. Platinum owns 50% of these operations, which is presented under ‘Own mined’ production, and purchases
the remaining 50% of production, which is presented under ‘Purchase of concentrate’. (2) Associates are Platinum’s 33% interest in BRPM and, also in 2017, its 49% interest in Bokoni, which was placed on care and maintenance in Q4 2017. (3) 4E: the grade measured as the combined content of: platinum, palladium, rhodium and gold.

9
IRON ORE
Iron Ore Q1
2018 Q1
2017
Q1 2018 vs.
Q1 2017
Q4 2017
Q1 2018 vs.
Q4 2017
Kumba 000 t 10,855 10,473 4% 11,643 (7)%
Minas-Rio(1) 000 t 3,049 4,342 (30)% 3,950 (23)%
(1) Wet basis.
Kumba – Iron ore production increased by 4% to 10.9 million tonnes.
Sishen production decreased by 5% to 7.3 million tonnes. This was primarily driven by lower DMS plant production due to planned short-term mining feedstock constraints partially offset by higher yields from the JIG plant. Waste stripping increased by 24% to 42.2 million tonnes as a result of continued improvement in efficiencies.
Kolomela production increased by 26% to 3.5 million tonnes, driven by higher plant throughput and the full ramp-up of the DMS modular plant. Waste stripping increased by 32% to 13.4 million tonnes due to improved efficiencies.
Export sales of 9.9 million tonnes were similar to Q1 2017. However, relative to Q4 2017, this was a 12% decrease as a result of a number of derailments impacting export sales by 1.1 million tonnes. Kumba is working closely with Transnet to mitigate derailments over the remainder of the year. Total finished product stock is 4.6 million tonnes, compared with 4.3 million tonnes at 31 December 2017.
Minas-Rio – Production from Minas-Rio decreased by 30% to 3.0 million tonnes, due to a combination of the planned progression into harder ore impacting plant throughput and the suspension of the operation from 12 March following the two leaks in the pipeline that carries iron ore, in slurry form, from the mine to the port. Operations remain suspended and no material production is expected for the remainder of the year, as inspection, remediation and restart activities are progressed.
Full Year Guidance
Full year production guidance for Kumba remains unchanged at 44 – 45 million tonnes. Full year waste guidance also remains unchanged at 170 – 180 million tonnes for Sishen and 55 – 57 million tonnes for Kolomela.
Full year production guidance for Minas-Rio has been revised down to 3 million tonnes reflecting production delivered to date (previously 13 – 15 million tonnes).
Iron Ore (tonnes) Q1 2018 Q4 2017 Q3 2017 Q2 2017 Q1 2017 Q1 2018
vs. Q1 2017
Q1 2018 vs.
Q4 2017
Kumba production 10,855,100 11,642,600 11,485,700 11,381,600 10,472,600 4% (7)%
Lump 7,243,500 7,719,100 7,609,200 7,504,200 6,978,800 4% (6)%
Fines 3,611,600 3,923,500 3,876,500 3,877,400 3,493,800 3% (8)%
By mine:
Sishen 7,324,600 7,782,300 7,786,100 7,871,900 7,678,900 (5)% (6)%
Kolomela 3,530,500 3,860,300 3,699,600 3,509,700 2,793,700 26% (9)%
Kumba sales volumes
Export iron ore 9,945,700 11,354,800 10,783,200 9,423,600 10,053,000 (1)% (12)%
Domestic iron ore 885,400 875,700 644,100 924,600 832,700 6% 1%
Minas-Rio production
Pellet feed (wet basis) 3,049,400 3,949,900 4,171,500 4,324,100 4,341,700 (30)% (23)%
Minas-Rio sales volumes
Export – pellet feed (wet basis) 2,896,100 4,140,700 3,739,800 4,371,000 4,256,500 (32)% (30)%
10
COAL
Coal Q1
2018 Q1
2017
Q1 2018 vs.
Q1 2017
Q4 2017
Q1 2018 vs.
Q4 2017
Metallurgical Coal (Australia) 000 t 5,539 5,242 6% 4,924 12%
Export Thermal Coal (Australia) 000 t 209 479 (56)% 409 (49)%
Export Thermal Coal (South Africa)(1) 000 t 4,328 4,752 (9)% 4,648 (7)%
Export Thermal Coal (Colombia) 000 t 2,444 2,782 (12)% 2,914 (16)%
Domestic Thermal Coal (South Africa) 000 t 4,970 7,555 (34)% 7,203 (31)%
(1) Includes export primary production, and secondary production sold into export markets. Comparatives have been restated to align with current presentation.
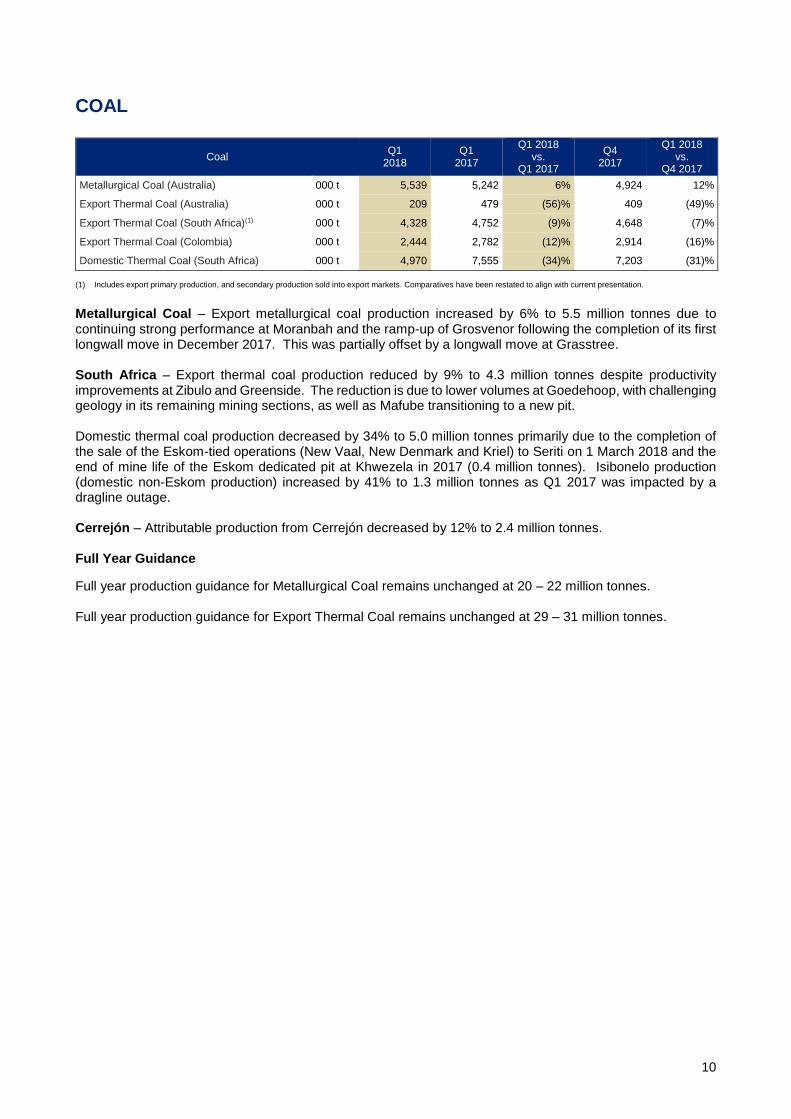
Metallurgical Coal – Export metallurgical coal production increased by 6% to 5.5 million tonnes due to continuing strong performance at Moranbah and the ramp-up of Grosvenor following the completion of its first longwall move in December 2017. This was partially offset by a longwall move at Grasstree. South Africa – Export thermal coal production reduced by 9% to 4.3 million tonnes despite productivity improvements at Zibulo and Greenside. The reduction is due to lower volumes at Goedehoop, with challenging geology in its remaining mining sections, as well as Mafube transitioning to a new pit. Domestic thermal coal production decreased by 34% to 5.0 million tonnes primarily due to the completion of the sale of the Eskom-tied operations (New Vaal, New Denmark and Kriel) to Seriti on 1 March 2018 and the end of mine life of the Eskom dedicated pit at Khwezela in 2017 (0.4 million tonnes). Isibonelo production (domestic non-Eskom production) increased by 41% to 1.3 million tonnes as Q1 2017 was impacted by a dragline outage. Cerrejón – Attributable production from Cerrejón decreased by 12% to 2.4 million tonnes. Full Year Guidance
Full year production guidance for Metallurgical Coal remains unchanged at 20 – 22 million tonnes. Full year production guidance for Export Thermal Coal remains unchanged at 29 – 31 million tonnes.

11
Coal, by product (tonnes) Q1 2018 Q4 2017 Q3 2017 Q2 2017 Q1 2017 Q1 2018
vs. Q1 2017
Q1 2018 vs.
Q4 2017
Metallurgical Coal (Australia) 5,539,100 4,923,900 5,531,500 3,963,500 5,242,400 6% 12%
Hard Coking Coal 4,853,200 4,300,300 4,696,200 3,237,000 4,747,300 2% 13%
PCI / SSCC 685,900 623,600 835,300 726,500 495,100 39% 10%
Thermal Coal 11,950,300 15,172,700 15,637,100 15,782,500 15,568,000 (23)% (21)%
Export (Australia) 208,700 408,600 421,400 304,700 479,000 (56)% (49)%
Export (South Africa)(1) 4,327,500 4,647,800 4,352,000 4,840,800 4,751,900 (9)% (7)%
Export (Colombia) 2,444,300 2,913,600 2,496,700 2,449,600 2,781,700 (12)% (16)%
Domestic (South Africa) 4,969,800 7,202,700 8,367,000 8,187,400 7,555,300 (34)% (31)%
Total coal production 17,489,400 20,096,600 21,168,600 19,746,000 20,810,400 (16)% (13)%
Sales volumes
Metallurgical Coal (Australia) 5,632,900 5,323,600 5,341,700 4,155,000 4,947,400 14% 6%
Hard Coking Coal 4,885,500 4,653,000 4,707,600 3,649,700 4,477,200 9% 5%
PCI / SSCC 747,400 670,600 634,100 505,300 470,200 59% 11%
Thermal Coal
Export (Australia) 293,800 466,900 468,500 422,800 473,200 (38)% (37)%
Export (South Africa)(1) 4,615,700 4,843,500 4,921,200 4,150,800 4,693,300 (2)% (5)%
Export (Colombia) 2,480,200 2,619,400 2,517,500 2,770,500 2,646,300 (6)% (5)%
Domestic (South Africa) 4,711,000 7,370,300 8,549,300 8,385,400 7,718,100 (39)% (36)%
Third party purchases 2,127,100 1,779,400 2,436,100 1,835,400 1,567,800 36% 20%
(1) Includes export primary production, and secondary production sold into export markets. Comparatives have been restated to align with current presentation.
Coal, by operation (tonnes) Q1 2018 Q4 2017 Q3 2017 Q2 2017 Q1 2017 Q1 2018
vs. Q1 2017
Q1 2018 vs.
Q4 2017
Metallurgical Coal (Australia) 5,539,100 4,923,900 5,531,500 3,963,500 5,242,400 6% 12%
Capcoal (incl. Grasstree) 1,396,000 1,604,900 1,712,100 1,467,400 1,702,000 (18)% (13)%
Dawson 534,500 319,700 670,300 787,500 705,100 (24)% 67%
Grosvenor 825,600 161,300 1,012,500 183,600 709,800 16% 412%
Jellinbah 846,300 858,200 819,800 836,400 709,400 19% (1)%
Moranbah North 1,936,700 1,979,800 1,316,800 688,600 1,416,100 37% (2)%
Thermal Coal (Australia) 208,700 408,600 421,400 304,700 479,000 (56)% (49)%
Capcoal (incl. Grasstree) 65,500 95,400 62,000 41,500 83,400 (21)% (31)%
Dawson 114,500 310,800 342,500 259,300 387,000 (70)% (63)%
Jellinbah 28,700 2,400 16,900 3,900 8,600 234% 1096%
Total Australia production 5,747,800 5,332,500 5,952,900 4,268,200 5,721,400 0% 8%
Thermal (South Africa)(1)
Goedehoop 1,138,000 1,114,300 1,085,400 1,230,800 1,222,100 (7)% 2%
Greenside 1,043,600 1,041,200 906,700 877,700 1,004,800 4% 0%
Zibulo 1,673,100 1,587,900 1,534,600 1,672,900 1,439,400 16% 5%
Khwezela 1,244,000 1,371,300 1,265,300 1,475,000 1,596,100 (22)% (9)%
Mafube 105,600 350,900 361,200 407,600 441,400 (76)% (70)%
New Vaal(2) 1,560,500 3,218,500 4,354,300 4,121,900 3,414,300 (54)% (52)%
New Denmark(2) 560,100 963,300 673,700 769,600 954,400 (41)% (42)%
Kriel(2) 704,900 1,237,400 1,392,700 1,420,300 1,338,500 (47)% (43)%
Isibonelo 1,267,500 965,700 1,145,100 1,052,400 896,300 41% 31%
Total South Africa production 9,297,300 11,850,500 12,719,000 13,028,200 12,307,300 (24)% (22)%
Colombia (Cerrejón) 2,444,300 2,913,600 2,496,700 2,449,600 2,781,700 (12)% (16)%
Total Coal production 17,489,400 20,096,600 21,168,600 19,746,000 20,810,400 (16)% (13)%
(1) Export and domestic production; New Vaal, New Denmark, Kriel and Isibonelo produce exclusively domestic volumes. (2) The sale of the Eskom-tied operations was completed at the start of March 2018.
12
NICKEL
Nickel Q1
2018 Q1
2017
Q1 2018 vs.
Q1 2017
Q4 2017
Q1 2018 vs.
Q4 2017
Nickel t 8,600 9,900 (13)% 11,400 (25)%
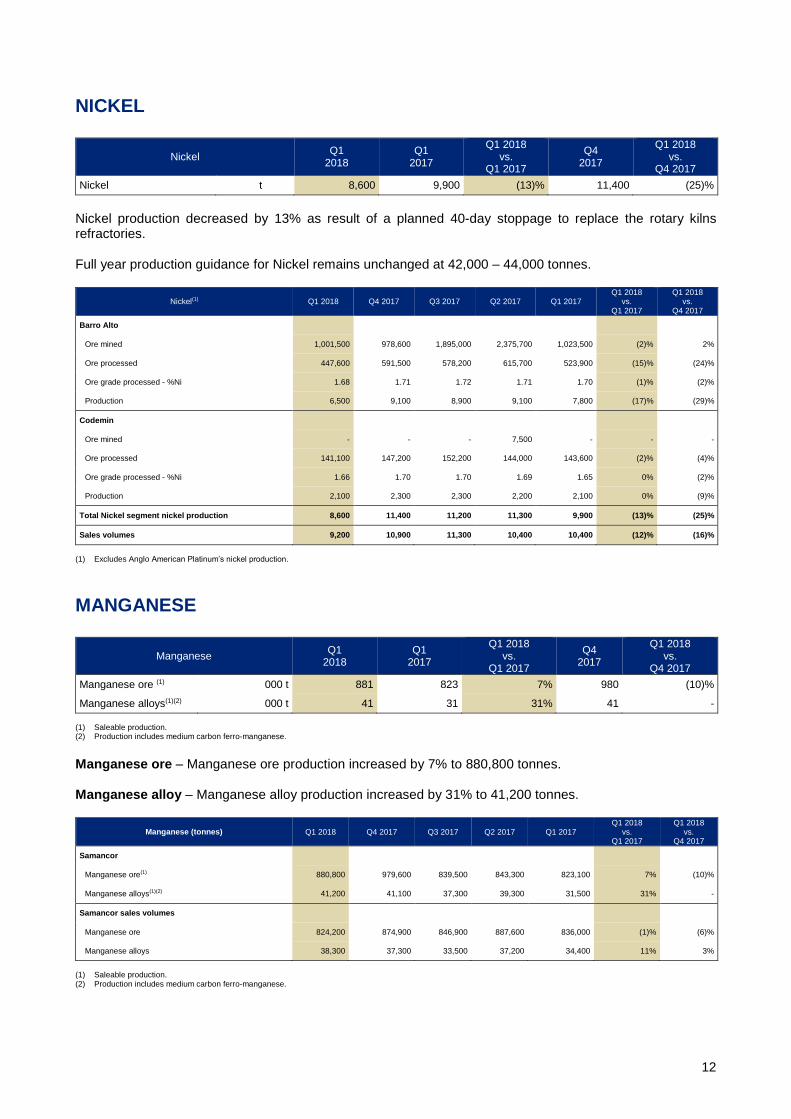
Nickel production decreased by 13% as result of a planned 40-day stoppage to replace the rotary kilns refractories. Full year production guidance for Nickel remains unchanged at 42,000 – 44,000 tonnes.
Nickel(1) Q1 2018 Q4 2017 Q3 2017 Q2 2017 Q1 2017 Q1 2018
vs. Q1 2017
Q1 2018 vs.
Q4 2017
Barro Alto
Ore mined 1,001,500 978,600 1,895,000 2,375,700 1,023,500 (2)% 2%
Ore processed 447,600 591,500 578,200 615,700 523,900 (15)% (24)%
Ore grade processed - %Ni 1.68 1.71 1.72 1.71 1.70 (1)% (2)%
Production 6,500 9,100 8,900 9,100 7,800 (17)% (29)%
Codemin
Ore mined - - - 7,500 - - -
Ore processed 141,100 147,200 152,200 144,000 143,600 (2)% (4)%
Ore grade processed - %Ni 1.66 1.70 1.70 1.69 1.65 0% (2)%
Production 2,100 2,300 2,300 2,200 2,100 0% (9)%
Total Nickel segment nickel production 8,600 11,400 11,200 11,300 9,900 (13)% (25)%
Sales volumes 9,200 10,900 11,300 10,400 10,400 (12)% (16)%
(1) Excludes Anglo American Platinum’s nickel production.
MANGANESE
Manganese Q1
2018 Q1
2017
Q1 2018 vs.
Q1 2017
Q4 2017
Q1 2018 vs.
Q4 2017
Manganese ore (1) 000 t 881 823 7% 980 (10)%
Manganese alloys(1)(2) 000 t 41 31 31% 41 -
(1) Saleable production. (2) Production includes medium carbon ferro-manganese.
Manganese ore – Manganese ore production increased by 7% to 880,800 tonnes. Manganese alloy – Manganese alloy production increased by 31% to 41,200 tonnes.
Manganese (tonnes) Q1 2018 Q4 2017 Q3 2017 Q2 2017 Q1 2017 Q1 2018
vs. Q1 2017
Q1 2018 vs.
Q4 2017
Samancor
Manganese ore(1) 880,800 979,600 839,500 843,300 823,100 7% (10)%
Manganese alloys(1)(2) 41,200 41,100 37,300 39,300 31,500 31% -
Samancor sales volumes
Manganese ore 824,200 874,900 846,900 887,600 836,000 (1)% (6)%
Manganese alloys 38,300 37,300 33,500 37,200 34,400 11% 3%
(1) Saleable production. (2) Production includes medium carbon ferro-manganese.
13
EXPLORATION AND EVALUATION
Exploration and Evaluation expenditure for the quarter increased by 16% to $58 million. Exploration expenditure for the quarter was in line with the first quarter of 2017 at $20 million. Evaluation expenditure for the quarter increased by 27% to $38 million.
NOTES
This Production Report for the first quarter ended 31 March 2018 is unaudited.
Production figures are sometimes more precise than the rounded numbers shown in the commentary of this report. The percentage change will reflect the percentage change using the production figures shown in the Production Summary of this report.
Copper equivalent production shows changes in underlying production volume. It is calculated by expressing each commodity’s volume as revenue, subsequently converting the revenue into copper equivalent units by dividing by the copper price (per tonne). Long-term forecast prices (and foreign exchange rates where appropriate) are used, in order that period-on-period comparisons exclude any impact for movements in price.
Forward-looking statements:
This contains certain forward-looking statements which involve risk and uncertainty because they relate to events and depend on circumstances that may occur in the future. There are a number of factors that could cause actual results or developments to differ materially from those expressed or implied by these forward-looking statements.
For further information, please contact: Media Investors UK James Wyatt-Tilby [email protected] Tel: +44 (0)20 7968 8759 Marcelo Esquivel [email protected] Tel: +44 (0)20 7968 8891 South Africa Pranill Ramchander [email protected] Tel: +27 (0)11 638 2592 Ann Farndell [email protected] Tel: +27 (0)11 638 2786
UK Paul Galloway [email protected] Tel: +44 (0)20 7968 8718 Robert Greenberg [email protected] Tel: +44 (0)20 7968 2124 Sheena Jethwa [email protected] Tel: +44 (0)20 7968 8680
Notes to editors: Anglo American is a global diversified mining business and our products are the essential ingredients in almost every aspect of modern life. Our portfolio of world-class competitive mining operations and undeveloped resources provides the metals and minerals to meet the growing consumer-driven demands of the world’s developed and maturing economies. With our people at the heart of our business, we use innovative practices and the latest technologies to discover new resources and mine, process, move and market our products to our customers around the world. As a responsible miner – of diamonds (through De Beers), copper, platinum and other precious metals, iron ore, coal and nickel – we are the custodians of what are precious natural resources. We work together with our key partners and stakeholders to unlock the sustainable value that those resources represent for our shareholders, the communities and countries in which we operate and for society at large. Anglo American is re-imagining mining to improve people’s lives. www.angloamerican.com