news release – tsx: edv all amounts in us$ … reports strong q4 results; full year guidance...
TRANSCRIPT

1
NEWS RELEASE – TSX: EDV All amounts in US$
ENDEAVOUR REPORTS STRONG Q4 RESULTS;
FULL YEAR GUIDANCE ACHIEVED Q4 HIGHLIGHTS • Successful Houndé mine start-up lifted group production by 38% over Q3-2017 to 204koz and decreased
group AISC by 13% to circa $784/oz
• Group All-in Sustaining Margin increased by nearly 70% over Q3-2017 to $83m and the All-in Margin also increased by nearly 70% to $57m
FY-2017 HIGHLIGHTS • Production up 14% over the prior year to 663koz, attaining the top half of 630 - 675koz guidance
• AISC down $15/oz over the prior year to circa $869/oz, well within guidance range of $850 - 895/oz
• Net Debt increased from $221m to $233m since the previous quarter-end due to growth project spend
2018 OUTLOOK • Production expected to increase to 670 - 720koz and AISC to decline to $840 - 890/oz
• Continued strong focus on internal growth:
› Ity CIL construction progressing on-budget and on-time; first gold pour expected in mid-2019
› Kalana intensive exploration program and updated feasibility study underway to prepare for next project after Ity CIL
› Significant exploration investment of $40 - 45m, of which 40% dedicated to greenfield opportunities
George Town, January 23, 2018 – Endeavour Mining (TSX:EDV) (OTCQX:EDVMF) is pleased to announce its preliminary financial and operating results for the fourth quarter and full year 2017, with highlights provided in the table below.
Table 1: Preliminary Key Operational and Financial Highlights
QUARTER ENDED YEAR ENDED Dec. 31,
2017 Sept 30,
2017 Dec. 31,
2016 Dec. 31,
2017 Dec. 31,
2016 Δ
Gold Production, oz 204 148 175 663 584 +14%
Realized Gold Price1, $/oz 1,222 1,235 1,205 1,221 1,240 (1%)
All-in Sustaining Cost, $/oz 784 906 855 869 884 (2%)
All-in Sustaining Margin2, $/oz ~438 329 350 ~352 356 (1%)
All-in Sustaining Margin3, $m ~83 49 55 ~231 191 +21%
All-in Margin4, $m ~57 34 42 ~160 142 +13%
Net Debt At Period End, $m 233 221 25 233 25 n.a. 1Realized Gold Price inclusive of Karma stream; 2Realized Gold Price less AISC per ounce; 3Net revenue less All-in Sustaining Cost; 4Net revenue less All-in Sustaining Costs and Non-Sustaining capital
Sébastien de Montessus, President & CEO, stated: "Our strong performance in Q4 was driven by the successful start-up of Houndé which decreased our all-in sustaining costs below $800 for the first time in Endeavour’s history. In 2017, we continued to deliver against our broader objectives as our strong operational performance helped us achieve key guidance metrics for annual gold production, AISC and free cash flow generation.
Our project development team successfully completed the Houndé mine on time and on budget, two months ahead of schedule, allowing the team to seamlessly transition to the Ity CIL project which remains on track for first gold pour in mid-2019. Organic growth was further enhanced through our reinvigorated exploration program which is on track to delivering the ambitious 5-year discovery target set in 2016.

2
Looking ahead, we expect the investment in Houndé and optimization work at our Karma mine to position us well to compensate for expected declines in production at Agbaou, which is transitioning to harder ore, thereby enabling us to increase guidance for 2018. We will also continue to invest for longer-term growth and repositioning of the company. Our priorities will be the continued construction of the Ity CIL project, and exploration work to support an updated feasibility study at Kalana, with a project investment decision expected in advance of Ity’s first gold pour. Exploration investment will remain a key focus with 40% of the budget allocated to high-potential greenfield exploration activities in support of our goal of generating our next large scale project through organic investment. Finally, we will continue to actively manage our portfolio of mines to focus management efforts on high quality assets.
The hard work of our entire team, with the full support of our board of directors, has positioned Endeavour well to achieve its long term target of annual gold production of 800koz at below $800/oz AISC in 2019.”
STRONG Q4 PERFORMANCE; FULL YEAR GUIDANCE ACHIEVED › Q4-2017 group production increased by 38% over the previous quarter to 204koz and AISC declined by 13% to circa
$784/oz due to the successful start-up and out-performance of Houndé while the other mines performed in-line with expectations.
› Full-year 2017 group production increased by 14% over the prior year to 663koz, attaining the top half of its 630 - 675koz guidance while AISC decreased by $15/oz to circa $869/oz ending well within the guidance range of $850 - 895/oz
› The Nzema sale closed on December 29, 2017, and will be deconsolidated in the year-end financial statements.
Table 2: Group Production, koz
(All amounts in koz, on a 100% basis)
QUARTER ENDED YEAR ENDED 2017 FULL-YEAR
GUIDANCE Dec. 31, 2017
Sept. 31, 2017
Dec. 31, 2016
Dec. 31, 2017
Dec. 31, 2016
Agbaou 43 46 57 177 196 175 - 180
Tabakoto 28 32 48 144 163 150 - 160
Ity 17 12 17 59 76 75 - 80 Karma 21 21 29 98 62 100 - 110 Houndé 69 - - 69 - 30 - 35
PRODUCTION FROM CONTINUING OPERATIONS 179 111 151 547 496 530 - 565 Nzema (divested in December 2017) 25 37 24 116 88 100 - 110 TOTAL PRODUCTION 204 148 175 663 584* 630 - 675 *Excluding 8koz of Youga mine production which was sold in March 2016
Table 3: Group All-In Sustaining Costs, US$/oz
(All amounts in US$/oz)
QUARTER ENDED YEAR ENDED 2017 FULL-YEAR GUIDANCE
Dec. 31, 2017
Sept. 31, 2017
Dec. 31, 2016
Dec. 31, 2017
Dec. 31, 2016
Agbaou ~665 638 532 ~641 534 660 - 700 Tabakoto ~1,282 1,278 927 ~1,127 1,027 950 - 990 Ity ~947 1,141 827 ~927 756 740 - 780
Karma ~922 973 738 ~835 738 750 - 800 Houndé ~373 - - ~373 - 550 - 600 MINE-LEVEL AISC FOR CONTINUING OPERATIONS ~720 937 728 ~808 755 780 - 825 Corporate G&A ~40 28 59 ~41 55 39 - 39
Sustaining Exploration ~15 11 29 ~22 21 26 - 26
GROUP AISC FOR CONTINUING OPERATIONS ~775 976 816 ~872 831 845 - 890 Nzema (divested in December 2017) ~850 705 1,118 ~858 1,167 895 - 940
GROUP AISC ~784 906 855 ~869 884 850 - 895

3
HOUNDE MINE
Construction Insights › No Lost-Time-Injury occurred over the 7-million
man hours worked during the construction period. › Construction completed ahead of schedule and $15
million below the initial capital budget of $328 million. As construction was tracking ahead of schedule and below budget, Endeavour decided, in addition to the initial planned works, to spend an additional circa $21 million (mainly for the addition of a 26MW back up power station & fuel farm and to build a second tailings storage facility), bringing the total investment to circa $334 million.
› Houndé achieved its first gold pour on October 18, 2017.
› Nameplate capacity was achieved within weeks following the introduction of ore, by the end of October.
› Following the rapid ramp-up period, commercial production was declared on November 1, more than two months ahead of schedule.
Q4 Insights › Production totalled 69koz since the start of mining
operations (all considered commercial); significantly surpassing the upper end of the 30-35koz guidance, due to better than expected mill availability, throughput, grades, and recovery rates.
› AISC amounted to circa $373/oz, significantly below the lower end of the $550-600/oz forecast due to the aforementioned greater than expected production, and lower mining costs.
› Unit costs compare very favourably to metrics presented in the optimized feasibility study.
Table 4: Houndé Performance Indicators
For The Quarter/Year Ended Q4-2017 FY-2017
Tonnes ore mined, kt 447 1,026 Strip ratio (incl. waste cap) 14.59 16.48 Tonnes milled, kt 813 813 Grade, g/t 2.75 2.75 Recovery rate, % 95% 95% PRODUCTION, KOZ 69 69 AISC/OZ (Preliminary) ~373 ~373
2018 Outlook › Houndé is expected to produce between 250 -
260koz in 2018 at an AISC of $580-630/oz. › Mining activities are expected to continue to ramp-
up to achieve a mining rate of 40Mtpa, up from 18Mtpa in 2017.
› Mining and processing of fresh ore began in the latter portion of Q4-2017. Activities are expected to progressively transition from mainly oxides in early 2018 to mainly fresh ore by the end of 2018.
› Nearly $23 million of non-sustaining expenditure is planned for 2018, mainly for waste capitalization and resettlement for the Bouere and Dohoun deposits.
› Out of the initial total project spend of $334 million, $10 million (related mainly to billing timing and the second tailings storage facility) is expected to be spent in 2018. As shown in Table 18 of the guidance section below, this amount is classified as Growth Capital.

4
AGBAOU MINE
Q4 vs Q3-2017 Insights › Production decreased slightly, in line with guidance,
mainly due to a lower grade and slightly lower tonnage milled. - Ore extraction continued to perform well, with
tonnage flat over the previous quarter. - Mill throughput decreased slightly but
remained at a high level as the proportion of fresh ore processed increased from 15% to 25%.
- Processed grades decreased due to the mining sequence.
- Recovery rates remained constant despite a greater proportion of fresh ore.
› All-in sustaining costs increased in line with
guidance as operations continued to transition towards mining and processing a greater proportion of fresh ore.
Full Year 2017 Insights › Total production in 2017 was 177koz, achieving the
mid-range of the 175-180koz guidance. As expected, production decreased over the record 2016 performance of 196koz as the mine began to transition to harder material.
› AISC for 2017 amounted to circa $641/oz, well below the guided $660-700/oz, as less fresh and transitional ore was processed than planned. In addition, lower than anticipated sustaining capital was incurred as planned waste capitalization was pushed into 2018.
Table 5: Agbaou Quarterly Performance Indicators For The Quarter Ended Q4-2017 Q3-2017 Q4-2016
Tonnes ore mined, kt 826 824 674 Strip ratio (incl. waste cap) 7.92 8.19 8.67 Tonnes milled, kt 760 770 721 Grade, g/t 1.85 1.96 2.46 Recovery rate, % 93% 93% 97% PRODUCTION, KOZ 43 46 57 AISC/OZ (Preliminary) ~665 638 532
Table 6: Agbaou Yearly Performance Indicators
For The Year Ended 2017 2016
Tonnes ore mined, kt 2,983 2,797 Strip ratio (incl. waste cap) 8.47 8.07 Tonnes milled, kt 2,906 2,827 Grade, g/t 2.02 2.27 Recovery rate, % 94% 97% PRODUCTION, KOZ 177 196 AISC/OZ (Preliminary) ~641 534
2018 Outlook › 2018 is expected to be a transition year for Agbaou
with a large focus on waste capitalization activities (including the pre-strip on the West pit) which is expected to give access to higher grade areas afterwards.
› Agbaou’s 2018 production is therefore expected to decrease to 140 - 150koz as low-grade stockpile feed is expected to supplement mine feed to allow waste capitalization activities to progress more quickly.
› The ore process blend is expected to average 50% oxide and 50% fresh and transitional ore throughout the year.
› AISC is expected to increase to $860 - $900/oz as a result of increased mining costs (deeper pits, longer haul distances, and increased drill and blast activities related to hard ore) and higher processing costs (lower throughput and higher consumption ratios linked to the mineralogy of the ore). In addition, the sustaining cost is expected to increase due to the greater waste capitalization.

5
KARMA MINE
Q4 vs Q3-2017 Insights › Production remained flat as higher stacking
capacity and grades were offset by the anticipated lower recovery rate. - Ore tonnage extraction significantly increased
due to the end of the rainy season, a lower strip ratio, and in response to greater stacking capabilities.
- Stacking increased following the successful commissioning of the new front-end and ADR plant, while Q3 was impacted by downtime associated with commissioning the upgraded crushing circuit and decommissioning the original circuit.
- Higher-grade transitional ore from Rambo was strategically mined and stacked once the plant optimization was completed to benefit from greater stacking capacity to offset its lower recovery rate. The Rambo pit was mined out during the quarter.
- Stacked grade increased due to high-grade ore from the Rambo deposit, while low grade stockpiles supplemented feed in Q3.
- Recovery rates decreased as anticipated due to the stacking of greater amounts of transitional ore from the Rambo deposit.
› AISC decreased as a result of the aforementioned higher grades, lower strip ratio, and lower stacking unit costs which offset the higher mining unit costs associated with extracting Rambo transitional ore and the impact of lower recovery rates. Following the completion of the optimization project in November, AISC decreased below $850/oz in December and are expected to trend lower.
Full Year 2017 Insights › Production totalled 98koz in 2017, near the lower-
end of the 100-110koz guidance. › Production increased over 2016, benefitting from a
full year of production. › AISC for 2017 amounted to circa $835/oz, above the
guided $750-800/oz, mainly due to lower than expected production.
Table 7: Karma Quarterly Performance Indicators
For The Quarter Ended Q4-2017 Q3-2017 Q4-2016
Tonnes ore mined, kt 1,185 593 783 Strip ratio (incl. waste cap) 2.14 5.13 4.14 Tonnes stacked, kt 1,026 720 853 Grade, g/t 1.06 0.91 1.14 Recovery rate, % 77% 87% 90% PRODUCTION, KOZ 21 21 29 AISC/OZ (Preliminary) ~922 973 738
Table 8: Karma Yearly Performance Indicators
For The Year Ended Dec 31, 2017
Dec 31, 2016
Tonnes ore mined, kt 3,862 1,879 Strip ratio (incl. waste cap) 2.96 3.66 Tonnes milled, kt 3,552 2,089 Grade, g/t 1.07 1.16 Recovery rate, % 83% 90% PRODUCTION, KOZ 98 62 AISC/OZ (Preliminary) ~835 738
2018 Outlook › Plant optimization work was successfully carried
out during 2017. The newly installed front-end and ADR plant are expected to boost stacking capacity beyond the initial design capacity of 4Mtpa.
› Production in 2018 is expected to increase to 105-115koz and AISC is expected to decrease to $780-830/oz as a result of the plant optimization work done in 2017.
› Mining activities are expected to focus on the GG2 and Kao deposits. The remaining ore from the GG2 deposit is mainly transitional material as the deposit is expected to be mined out in Q2 2018. Mining at the Kao deposit is scheduled to start in Q1 2018 with oxide ore mined throughout the year. In the latter portion of the year, pre-stripping is expected to be done at the North Kao deposit.
› In aggregate, roughly 15% of the 2018 ore feed is expected to be transitional material from GG2. As such recovery rates are expected to be lower in the first half and then increase in the second half as mining activities are expected to be focus on mainly oxide ore from the Kao deposit.
› Nearly $23 million of non-sustaining capital is planned for 2018, mainly for the Kao resettlement, pre-striping at Kao and North Kao and a heap leach lift.
6
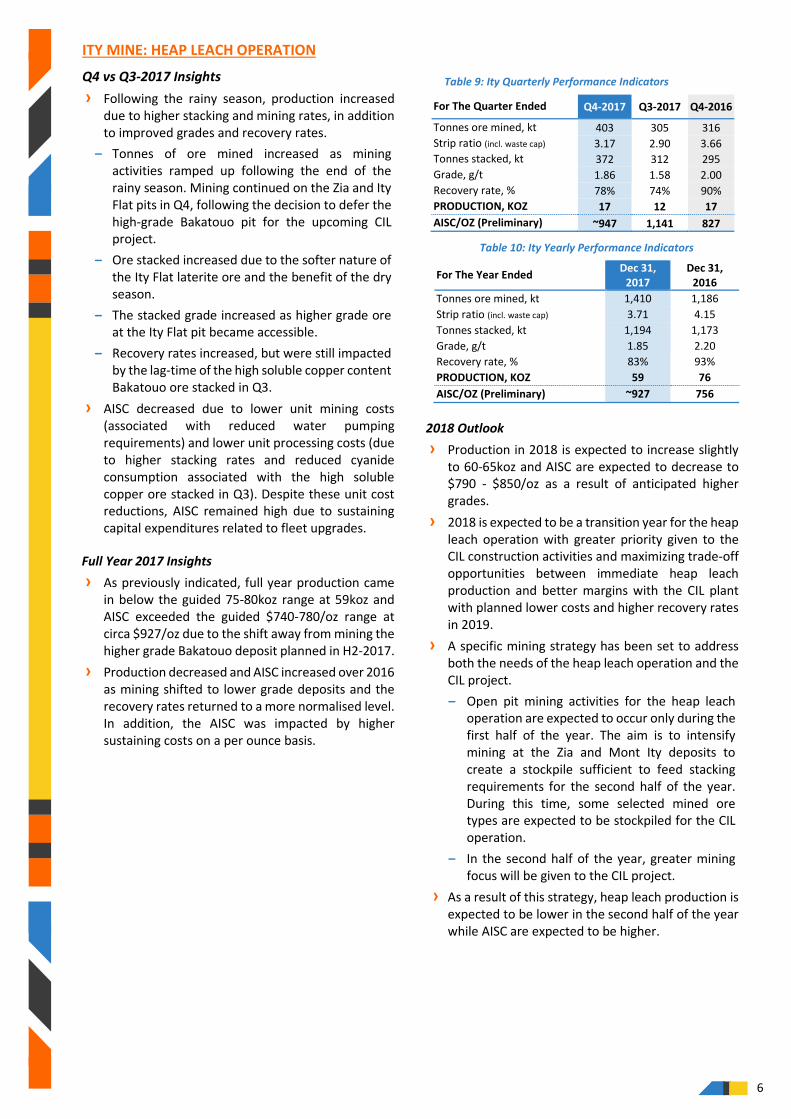
ITY MINE: HEAP LEACH OPERATION
Q4 vs Q3-2017 Insights › Following the rainy season, production increased
due to higher stacking and mining rates, in addition to improved grades and recovery rates.
- Tonnes of ore mined increased as mining activities ramped up following the end of the rainy season. Mining continued on the Zia and Ity Flat pits in Q4, following the decision to defer the high-grade Bakatouo pit for the upcoming CIL project.
- Ore stacked increased due to the softer nature of the Ity Flat laterite ore and the benefit of the dry season.
- The stacked grade increased as higher grade ore at the Ity Flat pit became accessible.
- Recovery rates increased, but were still impacted by the lag-time of the high soluble copper content Bakatouo ore stacked in Q3.
› AISC decreased due to lower unit mining costs (associated with reduced water pumping requirements) and lower unit processing costs (due to higher stacking rates and reduced cyanide consumption associated with the high soluble copper ore stacked in Q3). Despite these unit cost reductions, AISC remained high due to sustaining capital expenditures related to fleet upgrades.
Full Year 2017 Insights › As previously indicated, full year production came
in below the guided 75-80koz range at 59koz and AISC exceeded the guided $740-780/oz range at circa $927/oz due to the shift away from mining the higher grade Bakatouo deposit planned in H2-2017.
› Production decreased and AISC increased over 2016 as mining shifted to lower grade deposits and the recovery rates returned to a more normalised level. In addition, the AISC was impacted by higher sustaining costs on a per ounce basis.
Table 9: Ity Quarterly Performance Indicators
Table 10: Ity Yearly Performance Indicators
For The Year Ended Dec 31, 2017
Dec 31, 2016
Tonnes ore mined, kt 1,410 1,186 Strip ratio (incl. waste cap) 3.71 4.15 Tonnes stacked, kt 1,194 1,173 Grade, g/t 1.85 2.20 Recovery rate, % 83% 93% PRODUCTION, KOZ 59 76 AISC/OZ (Preliminary) ~927 756
2018 Outlook › Production in 2018 is expected to increase slightly
to 60-65koz and AISC are expected to decrease to $790 - $850/oz as a result of anticipated higher grades.
› 2018 is expected to be a transition year for the heap leach operation with greater priority given to the CIL construction activities and maximizing trade-off opportunities between immediate heap leach production and better margins with the CIL plant with planned lower costs and higher recovery rates in 2019.
› A specific mining strategy has been set to address both the needs of the heap leach operation and the CIL project. - Open pit mining activities for the heap leach
operation are expected to occur only during the first half of the year. The aim is to intensify mining at the Zia and Mont Ity deposits to create a stockpile sufficient to feed stacking requirements for the second half of the year. During this time, some selected mined ore types are expected to be stockpiled for the CIL operation.
- In the second half of the year, greater mining focus will be given to the CIL project.
› As a result of this strategy, heap leach production is expected to be lower in the second half of the year while AISC are expected to be higher.
For The Quarter Ended Q4-2017 Q3-2017 Q4-2016
Tonnes ore mined, kt 403 305 316 Strip ratio (incl. waste cap) 3.17 2.90 3.66 Tonnes stacked, kt 372 312 295 Grade, g/t 1.86 1.58 2.00 Recovery rate, % 78% 74% 90% PRODUCTION, KOZ 17 12 17 AISC/OZ (Preliminary) ~947 1,141 827

7
TABAKOTO MINE
Q4 vs Q3-2017 Insights › Production decreased mainly due to lower average
head grades, in spite of overall improved mining operations. - Open pit production at Kofi B and Tabakoto
North was significantly increased following the end of the rainy season; however at a lower grade as the higher-grade Kofi C deposit was depleted in Q3.
- Underground tonnes mined increased as the previous quarter was impacted by heavy rains which limited stope access and due to the national strike.
- Processing activities continued to perform well, with throughput increased to partially offset lower grades.
- The overall average grade decreased mainly due to lower open pit grades and the use of lower grade stockpiles.
- The recovery rate slightly decreased due to lower grades milled and the compromise to increase the throughput rate.
› AISC remained stable despite decreases across all unit costs per tonne (open pit and underground mining, processing, and G&A), which were offset by higher sustaining costs and lower grades.
Full-Year 2017 Insights › Production totalled 144koz in 2017, below the lower-
end of the 150-160koz guidance and, as previously guided, the AISC finished above the $950-990/oz guidance at circa $1,127/oz. This under-performance is mainly attributable to sub-optimal underground equipment availability and several national strikes.
› Production decreased over 2016 mainly due to lower open pit grade following the depletion of the high grade Kofi C deposit.
Table 11: Tabakoto Quarterly Performance Indicators
For The Quarter Ended Q4-2017 Q3-2017 Q4-2016
OP tonnes ore mined, kt 165 108 195 OP strip ratio (incl. waste cap) 10.32 9.13 7.17 UG tonnes ore mined, kt 157 179 253 Tonnes milled, kt 435 392 402 Grade, g/t 2.20 2.64 3.93 Recovery rate, % 92% 93% 95% PRODUCTION, KOZ 28 32 48 AISC/OZ (Preliminary) ~1,282 1,278 927
Table 12: Tabakoto Yearly Performance Indicators
2018 Outlook › Tabakoto production is expected to decrease to 115
– 130koz from both the underground mines (Segala and Tabakoto) and open pits (Kofi B, Tabakoto North and Baboto) mainly due to a decline in average grade.
› AISC are forecast to increase to $1,200-$1,250/oz due to the aforementioned lower grade and a circa 75% increase in sustaining capital expenditures to $35 million for the replacement of mining equipment, plant maintenance and underground capital development.
› In line with Endeavour’s portfolio management strategy, a strategic assessment is expected to be made on Tabakoto during the course of the year.
For The Year Ended Dec 31, 2017 Dec 31, 2016
OP tonnes ore mined, kt 647 649 OP strip ratio (incl. waste cap) 8.89 9.94 UG tonnes ore mined, kt 756 944 Tonnes milled, kt 1,640 1,588 Grade, g/t 2.90 3.36 Recovery rate, % 94% 95% PRODUCTION, KOZ 144 163 AISC/OZ (Preliminary) ~1,127 1,027

8
NZEMA MINE
Nzema Sale Insights › On December 29, 2017, Endeavour completed the
sale of its 90% interest in its non-core Nzema Mine in Ghana to BCM International Ltd (“BCM”).
› Endeavour received a payment of $38.5 million upon closing, corresponding to the first two payments less adjustments. Additional deferred payments of up to $25 million are expected to be received over the course of 2018 and 2019, based upon the attainment of certain agreed milestones related to mine free cash flow generation.
Q4 vs Q3-2017 Insights › Production decreased as expected due to lower
processed grades for both mined and purchased ore. - As expected, tonnes of ore mined increased
following the end of the rainy season. - Purchased ore grades decreased to a more
normal level after a peak in Q3. - Mill throughput continued to increase as the
first half of the year was impacted by a higher proportion of fresh ore processed.
- The head grade decreased for both Endeavour’s own mined ore (following a peak immediately after completing the cut-back in Q3) and purchased ores.
- Recovery rates remained constant. › AISC increased mainly due to lower grades and
subsequent decreased production, which was partially offset by decreased mining and processing costs per tonne.
Full Year 2017 Insights › Production totalled 116koz in 2017, surpassing the
upper-end of the 100-110koz guidance and AISC amounted to $858/oz finishing lower than the bottom-end of the guided $895-940/oz range due to strong efforts to reduce costs and better purchased ore quality.
› As expected, the production and AISC profile significantly improved over 2016 due to the benefit of completing the push-back which gave access to higher-grade material ore. In addition, the grades of purchased ore improved in 2017 following quality control procedures implemented.
Table 13: Nzema Quarterly Performance Indicators
For The Quarter Ended Q4-2017 Q3-2017 Q4-2016
Tonnes ore mined, kt 369 310 288 Strip ratio (incl. waste cap) 2.88 3.30 9.02 Total Tonnes milled, kt 377 368 428 Grade, g/t 2.13 3.39 2.20 Recovery rate, % 92% 92% 82% PRODUCTION, KOZ 25 37 24 AISC/OZ (Preliminary) ~850 705 1,118
Table 14: Nzema Yearly Performance Indicators
For The Year Ended Dec 31, 2017
Dec 31, 2016
Tonnes ore mined, kt 1,427 1,000 Strip ratio (incl. waste cap) 3.81 8.30 Tonnes milled, kt 1,499 1,761 Grade, g/t 2.58 1.87 Recovery rate, % 92% 83% PRODUCTION, KOZ 116 88 AISC/OZ (Preliminary) ~858 1,167

9
ITY CIL PROJECT: CONSTRUCTION UPDATE
› Construction was launched in September 2017 and remains on time and on budget with first gold pour expected in mid-2019.
› No LTI with nearly 400,000 man-hours already worked.
› Long-lead items have been ordered and nearly 50% of the total capital cost of $412 million has already been committed.
› 6 CIL ring beams out of 8 have already been poured and SAG and Ball mill foundation work has started.
› EPCM design is progressing well with more than 20% already completed.
› Bulk earthworks, camp construction, and other activities are also progressing according to schedule.
KALANA PROJECT UPDATE › Following the close of the transaction in late Q3-
2017, Endeavour completed the integration of Avnel and initiated pre-development activities to optimize the Kalana Project, which include:
- Ceasing the current small-scale operations and clearing the underground workings and existing infrastructure to allow for the development of future open pits, as well as to establish access for exploration.
- Resuming exploration activities on both the Kalana deposit and nearby targets including Kalanako.
- Launching a revised Feasibility Study with the goal of increasing the current plant design capacity to lift the average annual production and shorten the mine life based on current reserves, integrating the exploration results from the upcoming drilling campaign, and leveraging Endeavour’s construction expertise and realized operating synergies.
- Dedicated Kalana Project Community Relations and HSE teams were created to validate the census and stakeholder mapping, with the aim of defining a resettlement action plan before relocation activities commence.
BALANCE SHEET, FINANCING & LIQUIDITY SOURCES
› Net debt marginally increased from $221 million to $233 million since September 31, 2017 mainly due to:
- Capital spending on growth projects (Hounde, Ity CIL, and Kalana)
- Increase in equipment finance leasing related to the backup power generators at Houndé
- Net cash impact from Nzema disposal ($38.5 million received on closing less deconsolidation of $30 million Nzema cash position)
› Net debt year over year increased from $26 million to $221 million mainly due to the drawdown of $160 million on the Revolving Credit Facility (“RCF”) for the construction of the Houndé project.
› Endeavour is well positioned to fund its growth as its available sources of financing and liquidity totaled $322 million which include its $122 million cash position and $200 million undrawn on the revolving credit facility, in addition to its strong cash flow generation, upcoming equipment financing of approximately $60 million for its Ity CIL Project, and remaining proceeds from the Nzema sale.
Table 15: Net Debt Position
(in $m)
DEC. 31, 2017 (PRELIMINARY)
SEPT. 30, 2017
DEC. 31, 2016
Cash 122 125 124
Less: Equipment finance lease (55) (46) (10)
Less: Drawn portion of $500 million RCF (300) (300) (140)
NET DEBT POSITION (233) (221) (26)

10
2018 OUTLOOK › Production from continuing operations is expected to increase to 670-720koz in 2018 and AISC is expected to
decrease to $840-890/oz due to the full year benefit of Houndé and improvements at Karma and Ity which are expected to more than offset declines at Agbaou and Tabakoto. More details on individual mine guidance have been provided in the above sections.
› In line with Endeavour’s portfolio management strategy, a strategic assessment is expected to be made on Tabakoto during the course of the year. As shown in the below tables, 2018 production excluding Tabakoto is expected to range between 555-590koz at an AISC of $760-810/oz.
Table 16: Production Guidance, koz
(All amounts in koz, on a 100% basis) 2017 ACTUALS * 2018 FULL-YEAR
GUIDANCE Agbaou 177 140 - 150 Ity 59 60 - 65 Karma 98 105 - 115 Tabakoto 144 115 - 130 Houndé 69 250 - 260 PRODUCTION FROM CONTINUING OPERATIONS 547 670 - 720 PRODUCTION FROM CONTINUING OPERATIONS EXCLUDING TABAKOTO 403 555 - 590 *Nzema has been deconsolidated
Table 17: AISC Guidance, $/oz
(All amounts in koz, on a 100% basis)
2017 ACTUALS * PRELIMINARY
2018 FULL-YEAR GUIDANCE
Agbaou ~641 860 - 900 Ity ~927 790 - 850 Karma ~835 780 - 830 Houndé ~373 580 630 Tabakoto ~1,127 1,200 - 1,250 Corporate G&A ~56 30 - 30 Sustaining exploration ~31 10 - 10 GROUP AISC FROM CONTINUING OPERATIONS ~872 840 - 890 GROUP AISC FROM CONTINUING OPERATIONS EXCLUDING TABAKOTO ~777 760 - 810 * Nzema has been deconsolidated
› As detailed in the table below, sustaining and non-sustaining capital allocations for 2018 amount to $68 million and $84 million respectively. Growth projects amount to $200 million, mainly for the Ity CIL project construction.
Table 18: Capital Expenditure Guidance, $m
(in $m)
SUSTAINING CAPITAL
NON-SUSTAINING CAPITAL
GROWTH PROJECTS
Agbaou 17 2 - Tabakoto 37 - - Ity 2 - 180 Karma 2 23 - Houndé 3 23 10 Kalana - - 10 Exploration 7 29 - Corporate (Group IT system) - 7 -
TOTAL 68 84 200

11
› Exploration will continue to be a strong focus in 2018 with a company-wide exploration program of between $40-45 million (approximately 15% expensed, 15% sustaining, 70% non-sustaining), compared to circa $44 million in 2017. - Approximately 40% of the budget will be dedicated to greenfield opportunities, in line with the overall
strategy of sourcing Endeavour’s next mine organically. - A strong focus will continue at Houndé to support the ramp-up of mining operations and to follow-up on 2017
success. - There will be a continued focus at the Ity mine and greenfield targets along its 100km trend. - An intensive Kalana exploration campaign is planned for H1-2018 with the aim of integrating the results into
the updated feasibility study.
Table 19: Exploration Guidance, $m
(on a 100% basis) EXPLORATION
SPEND ALLOCATION Agbaou 8%
Tabakoto and greenfield Kofi areas 15%
Ity and greenfield areas on the 100km Ity trend 18%
Karma 4%
Kalana 13%
Houndé 21%
Other greenfield properties 22%
TOTAL EXPLORATION EXPENDITURES* $40-45m *Includes expensed, sustaining, and non-sustaining exploration expenditures
› Endeavour’s objective is to fund as much as possible of the Ity CIL construction costs using the free cash flow generated over the construction period, rather than accessing its Revolving Credit Facility (“RCF”). To support this funding approach it has put in place a short-term Gold Revenue Protection Strategy consisting of Gold Option Contracts, in line with the strategy employed during the Houndé construction. - A deferred premium collar strategy using written call options and bought put options has been put in place
beginning on February, 1, 2018 and ending on April 30, 2019 with a floor price of $1,300/oz and a ceiling price of $1,500/oz. The program covers a total of 400,000 ounces, representing approximately 40% of Endeavour’s total estimated gold production for the period. The total premium payable for entering into this program was $8.7 million, which is deferred and settled as monthly contracts mature.
- The advantages of the Gold Option Contacts during the construction period include: ~40% of production will be protected if the gold price falls below $1,300/oz 100% of production will benefit from gold price upswings between $1,300 and $1,500/oz ~60% of production benefits from gold price upswings beyond $1,500/oz
- Once the Gold Option Contracts program ends, Endeavour will return to a position where its gold production is fully exposed to spot gold prices.

12
CONFERENCE CALL AND LIVE WEBCAST Management will host a conference call and live webcast on Tuesday March 13th at 9:00am Toronto time (EST) to discuss the Company's financial results. The conference call and live webcast are scheduled today at: 6:00am in Vancouver 9:00am in Toronto and New York 1:00pm in London 9:00pm in Hong Kong and Perth The live webcast can be accessed through the following link: https://edge.media-server.com/m6/p/28mjqk9u Analysts and interested investors are also invited to participate and ask questions using the dial-in numbers below: International: +1 646 828 8156 North American toll-free: 800 281 7973 UK toll-free: 0800 358 6377 Confirmation code: 5038363 The conference call and webcast will be available for playback on Endeavour's website. Click here to add Webcast reminder to Outlook Calendar
Access the live and On-Demand version of the webcast from mobile devices running iOS and Android:

13
QUALIFIED PERSONS Jeremy Langford, Endeavour’s Chief Operating Officer - Fellow of the Australasian Institute of Mining and Metallurgy – FAusIMM, is a Qualified Person under NI 43-101, and has reviewed and approved the technical information in this news release.
CONTACT INFORMATION
Martino De Ciccio VP – Strategy & Investor Relations +44 203 640 8665 [email protected]
DFH Public Affairs in Toronto John Vincic, Senior Advisor (416) 206-0118 x.224 [email protected] Brunswick Group LLP in London Carole Cable, Partner +44 7974 982 458 [email protected]
ABOUT ENDEAVOUR MINING CORPORATION
Endeavour Mining is a TSX listed intermediate African gold producer with a solid track record of operational excellence, project development and exploration in the highly prospective Birimian greenstone belt in West Africa. Endeavour is focused on offering both near-term and long-term growth opportunities with its project pipeline and its exploration strategy, while generating immediate cash flow from its operations.
Endeavour operates 5 mines across Côte d’Ivoire (Agbaou and Ity), Burkina Faso (Houndé, Karma), and Mali (Tabakoto) which are expected to produce 670-720koz in 2018 at an AISC of $840-890/oz. Endeavour’s high-quality development projects (recently commissioned Houndé, Ity CIL and Kalana) have the combined potential to deliver an additional 600koz per year at an AISC well below $700/oz between 2018 and 2020. In addition, its exploration program aims to discover 10-15Moz of gold by 2021 which represents more than twice the reserve depletion during the period.
For more information, please visit www.endeavourmining.com.
CAUTIONARY STATEMENTS REGARDING 2017 PRODUCTION AND AISC Endeavour cautions that, whether or not expressly stated, all figures contained in this press release including production and AISC levels are preliminary, and reflect our expected 2017 results as of the date of this press release. Actual reported fourth quarter and 2017 results are subject to management’s final review, as well as audit by the Company’s independent accounting firm, and may vary significantly from those expectations because of a number of factors, including, without limitation, additional or revised information, and changes in accounting standards or policies, or in how those standards are applied. Endeavour will provide additional discussion and analysis and other important information about its 2017 production and AISC levels when it reports actual results.
CAUTIONARY STATEMENT ON FORWARD-LOOKING INFORMATION This news release contains "forward-looking statements" including but not limited to, statements with respect to Endeavour's plans and operating performance, the estimation of mineral reserves and resources, the timing and amount of estimated future production, costs of future production, future capital expenditures, and the success of exploration activities. Generally, these forward-looking statements can be identified by the use of forward-looking terminology such as "expects", "expected", "budgeted", "forecasts", and "anticipates". Forward-looking statements, while based on management's best estimates and assumptions, are subject to risks and uncertainties that may cause actual results to be materially different from those expressed or implied by such forward-looking statements, including but not limited to: risks related to the successful integration of acquisitions; risks related to international operations; risks related to general economic conditions and credit availability, actual results of current exploration activities, unanticipated reclamation expenses; changes in project parameters as plans continue to be refined; fluctuations in prices of metals including gold; fluctuations in foreign currency exchange rates, increases in market prices of mining consumables, possible variations in ore reserves, grade or recovery rates; failure of plant, equipment or processes to operate as anticipated; accidents, labour disputes, title disputes, claims and limitations on insurance coverage and other risks of the mining industry; delays in the completion of development or construction activities, changes in national and local government regulation of mining operations, tax rules and regulations, and political and economic developments in countries in which Endeavour operates. Although Endeavour has attempted to identify important factors that could cause actual results to differ materially from those contained in forward-looking statements, there may be other factors that cause results not to be as anticipated, estimated or intended. There can be no assurance that such

14
statements will prove to be accurate, as actual results and future events could differ materially from those anticipated in such statements. Accordingly, readers should not place undue reliance on forward-looking statements. Please refer to Endeavour's most recent Annual Information Form filed under its profile at www.sedar.com for further information respecting the risks affecting Endeavour and its business. AISC, all-in sustaining costs at the mine level, cash costs, operating EBITDA, all-in sustaining margin, free cash flow, net free cash flow, free cash flow per share, net debt, and adjusted earnings are non-GAAP financial performance measures with no standard meaning under IFRS, further discussed in the section Non-GAAP Measures in the most recently filed Management Discussion and Analysis.
Corporate Office: 5 Young St, Kensington, London W8 5EH, UK

15
Appendix 1: Production and AISC by Mine ON A QUARTERLY BASIS
(on a 100% basis) AGBAOU NZEMA TABAKOTO ITY KARMA HOUNDE
Unit Q4-2017 Q3-2017 Q4-2016 Q4-2017 Q3-2017 Q4-2016 Q4-2017 Q3-2017 Q4-2016 Q4-2017 Q3-2017 Q4-2016 Q4-2017 Q3-2017 Q4-2016 Q4-2017
Physicals
Total tonnes mined – OP1 000t 7,216 7,576 6,518 1,431 1,333 2,885 1,863 1,098 1,593 1,680 1,191 1,472 3,717 3,637 4,023 6,973
Total ore tonnes – OP 000t 826 824 674 369 310 288 165 108 195 403 305 316 1,185 593 783 447
Open pit strip ratio1 W:t ore 7.92 8.19 8.67 2.88 3.30 9.02 10.32 9.13 7.17 3.17 2.90 3.66 2.14 5.13 4.14 14.59
Total tonnes mined – UG 000t - - - - - - 207 226 324 - - - - - - -
Total ore tonnes – UG 000t - - - - - - 157 179 253 - - - - - - -
Total tonnes milled 000t 760 770 721 377 368 428 435 392 402 372 312 295 1,026 720 853 813
Average gold grade milled g/t 1.85 1.96 2.46 2.13 3.39 2.20 2.20 2.64 3.93 1.86 1.58 2.00 1.06 0.91 1.14 2.75
Recovery rate % 93% 93% 97% 92% 92% 82% 92% 93% 95% 78% 74% 90% 77% 87% 90% 95%
Gold produced oz 43,439 46,326 57,061 24,846 37,440 23,874 28,117 31,602 47,884 17,287 11,727 17,480 21,102 21,005 29,112 68,754
Gold sold oz 41,490 46,675 56,936 23,366 38,570 22,033 27,740 31,693 47,053 16,316 11,799 15,038 20,574 20,622 28,743 60,990
Mine-level AISC Per Ounce Sold $/oz ~665 638 532 ~850 705 1,118 ~1,282 1,278 927 ~947 1,141 827 ~922 973 738 ~373 1) Includes waste capitalized
ON A FULL YEAR BASIS
(on a 100% basis) AGBAOU NZEMA TABAKOTO ITY KARMA HOUNDE
Unit Dec 31, 2017
Dec 31, 2016
Dec 31, 2017
Dec 31, 2016
Dec 31, 2017
Dec 31, 2016
Dec 31, 2017
Dec 31, 2016
Dec 31, 2017
Dec 31, 2016
Dec 31, 2017
Physicals
Total tonnes mined – OP1 000t 28,101 25,382 6,873 9,295 6,400 7,098 6,647 6,102 15,313 8,753 17,933
Total ore tonnes – OP 000t 2,983 2,797 1,427 1,000 647 649 1,410 1,186 3,862 1,879 1,026
Open pit strip ratio1 W:t ore 8.47 8.07 3.81 8.30 8.89 9.94 3.71 4.15 2.96 3.66 16.48
Total tonnes mined – UG 000t - - - 997 1,301 - - - - -
Total ore tonnes – UG 000t - - - 756 944 - - - - -
Total tonnes milled 000t 2,906 2,827 1,499 1,761 1,640 1,588 1,194 1,173 3,552 2,089 813
Average gold grade milled g/t 2.02 2.27 2.58 1.87 2.90 3.36 1.85 2.20 1.07 1.16 2.75
Recovery rate % 94% 97% 92% 83% 94% 95% 83% 93% 83% 90% 95%
Gold produced oz 177,191 195,505 115,621 87,710 143,995 162,817 59,026 75,867 97,982 61,813 68,754
Gold sold oz 174,868 196,316 117,242 85,495 144,636 161,803 59,688 73,332 96,935 28,743 60,990
Mine-level AISC Per Ounce Sold $/oz ~641 534 ~858 1,167 ~1,127 1,027 ~927 756 ~835 738 ~373 1) Includes waste capitalized