news release - vodafone · continued enhancement of enterprise capabilities, with return to growth...
TRANSCRIPT

Vodafone Group Plc Vodafone House, The Connection, Newbury, Berkshire RG14 2FN, England
vodafone.com Investor Relations Media Relations
Telephone: +44 7919 990230 www.vodafone.com/media/contact
Registered Office: Vodafone House, The Connection, Newbury, Berkshire RG14 2FN, England. Registered in England No. 1833679
news release Vodafone announces results for the year ended 31 March 2015 19 May 2015
Highlights
Group revenue up 10.1% to £42.2 billion; full year organic service revenue declined 1.6%*
Return to growth in Q4: organic service revenue up 0.1%*; Europe -2.4%*, AMAP 6.0%*
EBITDA down 6.9%* at £11.9 billion; H2 EBITDA down 3.6%*
EBITDA on a guidance basis £11.7 billion, in line with £11.6 - £11.9 billion guidance range
Free cash flow £1.1 billion; capital expenditure £9.2 billion, up 45.7% year-on-year
£5.5 billion deferred tax assets recognised and reported in H1
Net debt of £22.3 billion, or £18.7 billion including $5.2 billion Verizon loan notes
Final dividend per share of 7.62 pence, up 2.0%, giving total dividends per share of 11.22 pence
Year ended Change
31 March 2015 Reported Organic*
£m % %
Group revenue 42,227 +10.1 (0.8)
Group service revenue 38,497 +9.4 (1.6)
Europe 25,972 +15.0 (4.7)
Africa, Middle East and Asia Pacific ('AMAP') 12,035 (0.8) +5.8
EBITDA 11,915 +7.5 (6.9)
Adjusted operating profit 3,507 (18.6) (24.1)
Operating profit 1,967 (150.3)
Free cash flow1 1,088 (75.2)
Profit for the financial year from continuing operations2 5,860 (48.2)
Basic earnings per share2 21.75p (90.3)
Adjusted earnings per share from continuing operations3 5.55p (27.8)
Total dividends per share 11.22p +2.0
Strong progress on Project Spring: 63% through mobile build, European 4G coverage 72%; 28 million homes
reached with next generation network; significant development of Enterprise products and services
20.2 million 4G customers in 18 markets; data volumes up 81% year-on-year in Q4
Continued take-up of data in emerging markets: 115.5 million data customers in AMAP, 3G coverage in India now
at 90% of target urban areas
Further strong progress on unified communications strategy: 12.0 million broadband customers, improving
revenue trend, fixed line now 25.2% of European service revenue
Integration of KDG and Ono on track, synergies in line with expectations
Continued enhancement of Enterprise capabilities, with return to growth in Q4: acquisition of Cobra Automotive,
international expansion of IP-VPN to 62 countries, good momentum in machine-to-machine revenue (+24.7%*)

2
Guidance for the 2016 financial year4
Organic EBITDA growth: EBITDA in the range of £11.5 billion to £12.0 billion
Positive free cash flow after all capex, before M&A, spectrum and restructuring costs
Capex of £8.5 billion to £9.0 billion, reflecting the second year of Project Spring investment
Intention to grow dividends per share annually, demonstrating confidence in future cash flow generation
Vittorio Colao, Group Chief Executive, commented:
“It has been a year of continued progress, culminating with a return to organic growth in Q4. We have seen increasing
signs of stabilisation in many of our European markets, supported by improvements in our commercial execution and
very strong demand for data. In fixed line, revenue trends are improving supported by accelerating customer growth,
and our recent cable acquisitions provide a strong platform for further growth. In emerging markets, our good growth
trend has continued, driven by rising data penetration and leading network quality and distribution.
“Our Project Spring investment programme is on plan, delivering a significantly improved experience to customers. In
Europe, 4G coverage now extends to over 70% of our footprint, and voice quality and reliability have improved
noticeably. We now reach 28 million homes with our own, next generation cable and fibre networks. In India, our 3G
footprint now reaches 90% of target areas, with 3G data revenue up 125% year-on-year in Q4.
“We have significant opportunities ahead of us, with only 13% of our European mobile customers using 4G, and our
market share in fixed services only a fraction of our share in mobile. In addition, businesses around the world are
increasingly looking to put mobility at the centre of their own strategies. With the assets and skills we have today,
further enhanced by the completion of Project Spring, we will be strongly positioned to provide ever improving
services to customers and seize these opportunities.”
Note:
* All amounts in this document marked with an “*” represent organic growth which presents performance on a comparable basis, both in terms
of merger and acquisition activity and movements in foreign exchange rates. See page 28 for “Use of non-GAAP financial information”.
1 Free cash flow for the year ended 31 March 2015 excludes £336 million of restructuring costs (2014: £210 million), a £365 million UK
pensions contribution payment, £359 million of Verizon Wireless tax distributions received after the completion of the disposal, £328 million
of interest paid on the settlement of the Piramal option, £116 million of KDG incentive scheme payments in respect of liabilities assumed on
acquisition and a £100 million (2014: £100 million) payment in respect of the Group’s historical UK tax settlement.
2 Year ended 31 March 2015 includes the recognition of £5,468 million of deferred tax assets in respect of tax losses in Luxembourg. Year
ended 31 March 2014 included the recognition of a deferred tax asset in respect of tax losses in Germany (£1,916 million) and Luxembourg
(£17,402 million) and the tax liability related to the rationalisation and reorganisation of our non-US assets prior to the disposal of our stake in
Verizon Wireless (£2,210 million). Basic earnings per share for the year ended 31 March 2014 also includes the gain on disposal, results and
related tax charge of the Group’s former investment in Verizon Wireless.
3 Adjusted earnings per share from continuing operations excludes the gain on disposal, results and related tax charge of the Group’s former
investment in Verizon Wireless in the prior year and the recognition of deferred tax assets in both years.
4 See “Guidance” on page 8.

REVIEW OF THE YEAR
3
Financial review of the year
It has been a year of continued strong growth in most of our emerging markets, and signs of stabilisation in many
European ones. A slight easing of aggressive price competition in some countries, combined with a clear inflection
point in the growth of data usage, has underpinned our performance. In addition, the increased commercial
investments which we began to make in the prior year have translated into an improved performance relative to our
competitors in Europe, with revenue trends improving in each of the last three quarters.
Across our markets we have witnessed an acceleration in consolidation both within the mobile sector and between
fixed and mobile, as operators look to gain scale and position themselves to seize the opportunity to deliver
customers an enhanced experience as demand for high speed data takes off. This mirrors our own important
strategic moves with the acquisitions of Kabel Deutschland (‘KDG’) and Grupo Corporativo Ono, S.A. (‘Ono’), and our
continued fixed infrastructure build in a number of markets. In our core European markets, we are increasingly
positioning Vodafone as a top tier, fully integrated provider of high speed fixed and mobile communications to
consumers and businesses.
We have continued to make good progress with our strategic priorities:
We have completed 63% of the mobile network element of Project Spring, with 72% 4G coverage in Europe and
90% 3G coverage in target areas of India;
We now have 20.2 million 4G customers across the Group, who are on average using twice the data of 3G
customers;
We have significantly strengthened our unified communications capabilities, with extended fibre builds in
several European markets, and the ongoing integrations of KDG and Ono;
We continue to invest in key growth areas in Enterprise, with machine-to-machine (‘M2M’) revenue growing
24.7% and our proposition enhanced by the acquisition of Cobra Automotive, and our IP-VPN footprint expanded
to 62 countries;
We have consolidated our position as an industry leader in mobile financial services, with 19.9 million M-Pesa
customers; and
We continue to grow the dividend per share and maintain a strong balance sheet.
Group
Group revenue for the year increased by 10.1% to £42.2 billion, with Group organic service revenue down 1.6%*
(down 0.8% excluding the impact of regulated mobile termination rate (‘MTR’) cuts). The Group returned to organic
service revenue growth in Q4 at +0.1%* (+0.9% excluding MTRs), reflecting a steady recovery in Europe and
continued good growth in Africa, Middle East and Asia Pacific (‘AMAP’).
Group EBITDA rose 7.5% to £11.9 billion, with organic EBITDA down 6.9%*, mainly affected by revenue declines in
Europe. The Group EBITDA margin fell 0.7 percentage points to 28.2%, or 1.8* percentage points on an organic basis.
This reflects ongoing revenue declines in Europe and the growth in operating expenses as a result of Project Spring,
partially offset by operating efficiencies. H2 EBITDA fell 3.6%*, with the improved trend supported by the better
revenue performance and continued good cost control.
Adjusted operating profit fell by 18.6% to £3.5 billion as the increase in reported EBITDA year-on-year was offset by
the increase in depreciation and amortisation resulting from the acquisitions of KDG and Ono.
The adjusted effective tax rate for the year was 29.4%, including the impact of foreign exchange losses. Excluding this
impact, the adjusted effective tax rate was 27.2%. We recognised an additional deferred tax asset of £5.5 billion in the
first half of the financial year taking our total deferred tax assets to £23.8 billion.
Adjusted earnings per share1 from continuing operations fell 27.8% to 5.55 pence, mainly reflecting the decline in
adjusted operating profit.
Free cash flow2 was £1.1 billion (2014: £4.4 billion), this decline reflecting higher reported EBITDA offset by the
increase in capital expenditure under the Project Spring programme. Total capital expenditure was £9.2 billion (2014:
£6.3 billion).
Net debt as at 31 March 2015 was £22.3 billion (March 2014: £13.7 billion), or £18.7 billion taking into account the
$5.2 billion Verizon loan notes. Net debt includes the impact of the acquisitions of Ono in July 2014 for £5.8 billion
and Cobra Automotive in August 2014 for £0.2 billion. In addition, we renewed or acquired spectrum in India, Italy,
Greece, Hungary and New Zealand, for a cash cost in the year of £0.4 billion. The remaining liability of £2.7 billion
relating to the March 2015 India spectrum auction is expected to be recognised in the 2016 financial year.

REVIEW OF THE YEAR
4
The Board is recommending a final dividend per share of 7.62 pence, up 2.0% year-on-year, in line with our intention
to increase the full year dividend per share annually.
Europe
Organic service revenue in Europe declined 4.7%* year-on-year, reflecting ongoing pressures from competition,
regulation and the macroeconomic environment. Excluding the impact of MTR cuts, service revenue fell 4.1%*.
Performance in H2 began to stabilise in most markets.
Mobile service revenue declined 5.5%*, with a better trend in H2 (Q3 -3.9%*, Q4 -3.4%*). The main factors supporting
this recovery were consistent growth in the contract customer base in a number of markets, some evidence of ARPU
stability, and accelerating demand for data stimulated by the roll-out of 4G coverage. The UK, Netherlands and the
Czech Republic all returned to growth in H2, while Germany, Italy, Spain, Greece and Romania all reduced their rate
of decline in H2. Hungary grew strongly throughout the year.
Fixed service revenue declined 0.7%*, but also showed an improving trend in H2 (Q3 +2.3%*, Q4 +1.6%*). Growth in
Spain, Italy and Portugal was offset by continued declines in Germany and the UK. KDG continued to grow strongly
with service revenue up 7.1%3 on a local GAAP basis in Q4. Broadband net additions for the year, including KDG, were
0.9 million, taking the European base to 11.3 million.
Organic EBITDA fell 12.3%* to £7.9 billion, and the EBITDA margin was flat at 28.2%, or a decline of 2.4* percentage
points on an organic basis. This reflects the decline in revenue and the growth in operating expenses as a result of
Project Spring, partially offset by operating efficiencies. The trend in H2 was better, with organic EBITDA down 7.6%
and the margin down 1.8* percentage points.
AMAP
Organic service revenue in AMAP was up 5.8%* year-on-year (or 7.1%* excluding the impact of MTR cuts), with
continued good growth in most major markets. India, Turkey and Egypt achieved service revenue growth of 12.6%*,
9.4%* and 2.8%* respectively. Performance at Vodacom (-1.0%*) was affected by price competition and a significant
MTR cut in South Africa, but the trend improved in Q4 (-0.2%*).
The region continues to benefit from strong customer growth, increased usage of voice and data services, and
effective marketing and distribution. During the year the mobile customer base grew 6.6% to 323.7 million, driven by
strong momentum in India. Voice and data usage were up 8% and 106% respectively, and there are now 115.5
million data users in the region.
Organic EBITDA rose 5.8%* and the EBITDA margin was 30.4%. The EBITDA margin fell 0.4* percentage points on an
organic basis, as increased operating costs from Project Spring and inflationary pressures in some markets offset the
scale benefits of revenue growth.
Strategic progress
Project Spring
First communicated in detail in November 2013, Project Spring is our two-year, £19 billion investment programme
designed to place Vodafone at the forefront of the growth in mobile data and the increasing trend towards the
convergence of fixed and mobile services. The key elements of the Spring infrastructure build are:
Building 4G to 90% of the population in our European markets and 3G to up to 95% of targeted areas of India;
Modernising our mobile network, with high speed backhaul giving us the capacity to provide a consistently good
network experience to our customers;
Making calls more reliable – still the number one priority for most customers;
Upgrading our retail presence, to offer customers modern shops focused on service as well as sales;
Increasing our next-generation fixed line infrastructure in Spain, Italy and Portugal; and
Enhancing our suite of Enterprise products and services, and taking them into new geographical areas.
We have made significant progress on all of these elements during the year, and are on track to hit our key March
2016 targets. Highlights of our progress include:
Extending our European 4G footprint to 72% population coverage, up from 32% in September 2013;
Adding a further 33,000 2G and 42,000 3G sites, to deepen our existing coverage and improve voice reliability;
Reaching 90% of targeted urban areas with 3G in India; and
Covering an additional 3.9 million homes across Europe with our own fibre.

REVIEW OF THE YEAR
5
These investments have already seen the customer experience improve significantly, with 88% of customers’ data
sessions in Europe now at 3 Mbps or better (the level required to watch uninterrupted high-definition video), and
dropped call rates in Europe falling by 34%.
Data
We have witnessed exceptional demand for data this year, whether 4G in Europe or 3G in emerging markets, with data
growth totalling 80% for the full year, and accelerating every quarter in Europe. As video and music services
proliferate, and data coverage widens and becomes more consistent, customers are increasingly using their
smartphones and tablets for entertainment, work and social interaction.
We now provide 4G services in 18 countries, with a further four countries launched during the year. Our 4G customer
base has quadrupled to 20.2 million. While progress has been rapid, still only 13% of our European customer base is
on 4G, providing us with a very substantial opportunity for future growth.
With quicker network response times, better in-building penetration and higher peak speeds, 4G is stimulating
significant growth in data, with usage typically doubling when customers migrate from 3G to 4G. In addition, our
successful commercial approach of bundling content packages with 4G in a number of European markets is boosting
data consumption further, and enabling us to introduce larger data bundles to customers. Our ability to translate this
strong data demand into revenue growth will be a key driver of our financial performance in the years ahead.
In emerging markets, the data story is equally positive. In India, for example, we already have 19 million 3G
customers (up from 7 million a year ago), smartphone penetration in urban areas is already 44%, and 3G data usage
per customer is at similar levels to Europe. For many, their first experience of the internet will be on mobile, given the
lack of fixed line infrastructure. Our rapid roll-out of 3G networks this year is generating a rapid payback, with 3G
browsing revenues growing at 140% during the year.
Unified communications
We are well on the way to becoming a full service, integrated operator in our main markets. Through organic
investment and acquisition, we now cover 28 million households (and thousands of businesses) across Europe with
our own fibre or cable infrastructure. In addition, we can reach a further 21 million households by accessing the
incumbent operators’ networks. In the 2015 financial year, 25% of our service revenue in Europe came from fixed
line, compared to just 10% five years ago. We now have 11.3 million broadband customers and 9.1 million TV
customers in Europe.
During the year we completed the acquisition of Ono, Spain’s number one cable operator covering 7 million homes.
We made strong progress on the integration of both Ono and KDG in Germany, combining our fixed and mobile
networks and beginning to migrate Vodafone broadband customers to our new infrastructure.
We are also demonstrating strong commercial momentum. We increased our European broadband customer base by
over 850,000 (excluding acquisitions) during the year, with revenue trends improving through the year. In the coming
weeks, we will launch our consumer broadband proposition in the UK, with TV to follow later in 2015, and as a result
will be offering integrated fixed and mobile services in all of our major European markets.
Enterprise
Services to business comprise around 27% of our Group service revenue, and 32% in Europe. Vodafone has a strong
position in mobile enterprise, leveraging our trusted brand and network reliability. We are increasingly using this
strong platform to win more international business and move more deeply into fixed line, which is a rapidly growing
trend within Enterprise as well. Half of all new proposal requests in Vodafone Global Enterprise (‘VGE’) ask for
converged solutions, and fixed is now 25% of Enterprise service revenue. At the same time, through Project Spring,
we are investing in strategic growth areas such as Cloud & Hosting and M2M, which promise to be significant growth
drivers in the future.
VGE, which provides services to our biggest international customers, achieved revenue growth of 1.8%*, as multi-
national corporations continued their trend of seeking a single provider of services across borders. In M2M, we
increased the number of connections to 21.5 million from 16.1 million last year, and acquired Cobra Automotive, a
provider of value-added security and telematics services to the automotive industry. M2M revenue grew 24.7%*.
Unified communications continues to be a rapidly growing trend within Enterprise. Vodafone One Net, our cloud-
based integrated fixed/mobile service, now has 3.9 million users across 11 markets – up 13% year-on-year.

REVIEW OF THE YEAR
6
Prospects for the 2016 financial year4
The coming year will be another very important one for execution, as we complete the Project Spring build
programme and continue the integration of KDG and Ono. At the same time, we will take further measures to
stabilise ARPU as usage continues to grow strongly.
Our priority is to ensure that we give customers – whether individuals or businesses, mobile or fixed – the best
possible service. This is not just about providing the best coverage and connectivity, but also about making
everything about being a Vodafone customer easier, clearer and more reliable. Signing a contract, adding more
services, understanding or challenging a bill, seeking help and advice online, over the phone or in one of our shops:
we aim to improve every aspect of the customer relationship with Vodafone.
By the end of the coming financial year we expect that the clear improvements in network performance delivered by
Project Spring, combined with a more consistent customer service experience, will begin to be reflected in stronger
customer satisfaction. This in turn should reduce churn and, combined with continued strong growth in data usage,
stabilise average revenue per user (‘ARPU’). Although cash flow will continue to be depressed in the coming year
given the high levels of investment, our intention to continue to grow dividends per share annually demonstrates our
confidence in strong future cash flow generation.
We expect EBITDA to be in the range of £11.5 billion to £12.0 billion for the 2016 financial year, and free cash flow to
be positive, after all capex, before M&A, spectrum and restructuring costs.
Notes:
* All amounts in this document marked with an “*” represent organic growth which presents performance on a comparable basis, both in terms
of merger and acquisition activity and movements in foreign exchange rates. See page 28 for “Use of non-GAAP financial information”.
1 Adjusted earnings per share from continuing operations excludes the results and related tax charge of the Group’s former investment in
Verizon Wireless in the prior year and the recognition of deferred tax assets in both years.
2 Free cash flow for the year ended 31 March 2015 excludes £336 million of restructuring costs (2014: £210 million), a £365 million UK
pensions contribution payment, £359 million of Verizon Wireless tax distributions received after the completion of the disposal, £328 million
of interest paid on the settlement of the Piramal option, £116 million of KDG incentive scheme payments in respect of liabilities assumed on
acquisition and a £100 million (2014: £100 million) payment in respect of the Group’s historical UK tax settlement.
3 Revenue growth for KDG is reported using local GAAP, not Vodafone IFRS accounting policies, and is therefore not directly comparable to
Vodafone’s revenue growth.
4 See “Guidance” on page 8.

GROUP FINANCIAL HIGHLIGHTS
7
Change
2015 2014 Reported Organic*
Page £m £m % %
Statutory basis1
Group revenue 23, 29 42,227 38,346 10.1 (0.8)
Operating profit/(loss) 23 1,967 (3,913) (150.3)
Profit/(loss) before taxation 23 1,095 (5,270) (120.8)
Profit for the financial year from continuing
operations2 23 5,860 11,312 (48.2)
Basic earnings per share2 23 21.75p 223.84p (90.3)
Net cash flow from operating activities 26 9,715 6,227 56.0
Adjusted statutory basis3
Group service revenue 9 38,497 35,190 9.4 (1.6)
EBITDA 9 11,915 11,084 7.5 (6.9)
EBITDA margin 9, 29 28.2% 28.9% (0.7pp) (1.8pp)
Adjusted operating profit 9, 29 3,507 4,310 (18.6) (24.1)
Adjusted profit before tax
11 2,217 3,180 (30.3)
Adjusted effective tax rate4 11 29.4% 32.9%
Adjusted profit attributable to owners of the parent 12 1,471 2,035 (27.7)
Adjusted earnings per share from continuing
operations5 12 5.55p 7.69p (27.8)
Capital expenditure
19, 29 9,197 6,313 45.7
Free cash flow6 19 1,088 4,393 (75.2)
Net debt 19, 20 (22,271) (13,700) 62.6
Notes:
* All amounts in this document marked with an “*” represent organic growth which presents performance on a comparable basis, both in terms
of merger and acquisition activity and movements in foreign exchange rates. See page 28 for “Use of non-GAAP financial information”.
1 Statutory basis prepared in accordance with IFRS accounting principles, including the results of the Group’s joint ventures using the equity
accounting basis and the profit contribution from Verizon Wireless to 2 September 2013 and gain on disposal as discontinued operations.
2 Year ended 31 March 2015 includes the recognition of £5,468 million of deferred tax assets in respect of tax losses in Luxembourg. Year
ended 31 March 2014 included the recognition of a deferred tax asset in respect of tax losses in Germany (£1,916 million) and Luxembourg
(£17,402 million) and the tax liability related to the rationalisation and reorganisation of our non-US assets prior to the disposal of our stake in
Verizon Wireless (£2,210 million). Basic earnings per share for the year ended 31 March 2014 also includes the gain on disposal, results and
related tax charge of the Group’s former investment in Verizon Wireless.
3 See page 28 for “Use of non-GAAP financial information” and page 35 for “Definitions of terms”.
4 The adjusted effective tax rate for the year ended 31 March 2014 has been restated to exclude results and related tax expense of Verizon
Wireless and to show the adjusted tax rate as calculated on the same basis as the current year.
5 Adjusted earnings per share from continuing operations excludes the gain on disposal, results and related tax charge of the Group’s former
investment in Verizon Wireless in the prior year and the recognition of deferred tax assets in both years.
6 Free cash flow for the year ended 31 March 2015 excludes £336 million of restructuring costs (2014: £210 million), a £365 million UK
pensions contribution payment, £359 million of Verizon Wireless tax distributions received after the completion of the disposal, £328 million
of interest paid on the settlement of the Piramal option, £116 million of KDG incentive scheme payments in respect of liabilities assumed on
acquisition and a £100 million (2014: £100 million) payment in respect of the Group’s historical UK tax settlement.

GUIDANCE
8
Please see page 28 for “Non-GAAP financial information”, page 35 for “Definitions of terms” and page 36 for
“Forward-looking statements”.
Performance against 2015 financial year guidance
Based on guidance foreign exchange rates, EBITDA for the 2015 financial year was £11.7 billion, in line with the £11.6
billion to £11.9 billion range set in November 2014. On the same basis our free cash flow was £1.3 billion, in line with
our positive free cash flow guidance.
2016 financial year guidance
EBITDA
£bn
Free cash flow
£bn
2016 financial year guidance 11.5 – 12.0 Positive
We expect EBITDA to be in the range of £11.5 billion to £12.0 billion. We expect free cash flow to be positive after all
capex, before the impact of M&A, spectrum purchases and restructuring costs. Total capex is expected to be around
£8.5 billion to £9.0 billion (including Ono). In the following year, we anticipate capital intensity normalising to a level
of 13-14% of annual revenue.
Dividend policy
The Board intends to grow dividends per share annually.
Assumptions
We have based guidance for the 2016 financial year on our current assessment of the global macroeconomic
outlook and assume foreign exchange rates of £1:€ 1.37, £1:INR 95.2 and £1:ZAR 18.1. It excludes the impact of
licences and spectrum purchases, material one-off tax-related payments, restructuring costs and any fundamental
structural change to the Eurozone. It also assumes no material change to the current structure of the Group.
Actual foreign exchange rates may vary from the foreign exchange rate assumptions used. A 1% change in the euro
to sterling exchange rate would impact EBITDA by £60 million and free cash flow by £10 million. A 1% change in the
Indian rupee to sterling exchange rate would impact EBITDA by £10 million and would have no impact on free cash
flow. A 1% change in the South African rand to sterling exchange rate would impact EBITDA by £15 million and free
cash flow by £5 million.
CONTENTS
9
Page
Financial results 9
Liquidity and capital resources 19
Other significant developments 21
Consolidated financial statements 23
Use of non-GAAP financial information 28
Additional information 29
Other information (including forward-looking statements) 34
FINANCIAL RESULTS
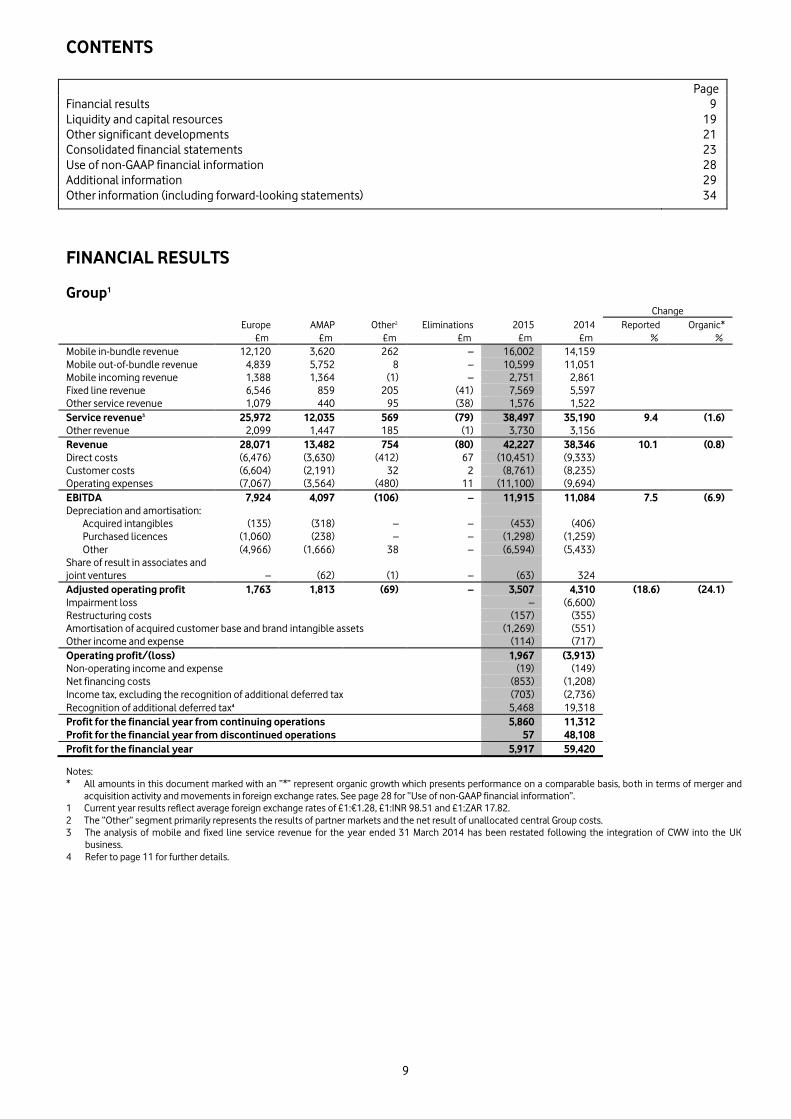
Group1 Change
Europe AMAP Other2 Eliminations 2015 2014 Reported Organic*
£m £m £m £m £m £m % %
Mobile in-bundle revenue 12,120 3,620 262 – 16,002 14,159
Mobile out-of-bundle revenue 4,839 5,752 8 – 10,599 11,051
Mobile incoming revenue 1,388 1,364 (1) – 2,751 2,861
Fixed line revenue 6,546 859 205 (41) 7,569 5,597
Other service revenue 1,079 440 95 (38) 1,576 1,522
Service revenue3 25,972 12,035 569 (79) 38,497 35,190 9.4 (1.6)
Other revenue 2,099 1,447 185 (1) 3,730 3,156
Revenue 28,071 13,482 754 (80) 42,227 38,346 10.1 (0.8)
Direct costs (6,476) (3,630) (412) 67 (10,451) (9,333)
Customer costs (6,604) (2,191) 32 2 (8,761) (8,235)
Operating expenses (7,067) (3,564) (480) 11 (11,100) (9,694)
EBITDA 7,924 4,097 (106) – 11,915 11,084 7.5 (6.9)
Depreciation and amortisation:
Acquired intangibles (135) (318) – – (453) (406)
Purchased licences (1,060) (238) – – (1,298) (1,259)
Other (4,966) (1,666) 38 – (6,594) (5,433)
Share of result in associates and
joint ventures – (62) (1) – (63) 324
Adjusted operating profit 1,763 1,813 (69) – 3,507 4,310 (18.6) (24.1)
Impairment loss – (6,600)
Restructuring costs (157) (355)
Amortisation of acquired customer base and brand intangible assets (1,269) (551)
Other income and expense (114) (717)
Operating profit/(loss) 1,967 (3,913)
Non-operating income and expense (19) (149)
Net financing costs (853) (1,208)
Income tax, excluding the recognition of additional deferred tax (703) (2,736)
Recognition of additional deferred tax4 5,468 19,318
Profit for the financial year from continuing operations 5,860 11,312
Profit for the financial year from discontinued operations 57 48,108
Profit for the financial year 5,917 59,420
Notes:
* All amounts in this document marked with an “*” represent organic growth which presents performance on a comparable basis, both in terms of merger and
acquisition activity and movements in foreign exchange rates. See page 28 for “Use of non-GAAP financial information”.
1 Current year results reflect average foreign exchange rates of £1:€1.28, £1:INR 98.51 and £1:ZAR 17.82.
2 The “Other” segment primarily represents the results of partner markets and the net result of unallocated central Group costs.
3 The analysis of mobile and fixed line service revenue for the year ended 31 March 2014 has been restated following the integration of CWW into the UK
business.
4 Refer to page 11 for further details.

FINANCIAL RESULTS
10
Revenue
Group revenue increased by 10.1% to £42.2 billion and service revenue increased 9.4% to £38.5 billion. Reported
growth rates reflect the acquisitions of KDG in October 2013 and of Ono in July 2014, as well as the consolidation of
Italy after we increased our ownership to 100% in February 2014.
In Europe, organic service revenue declined by 4.7%* as growing demand for 4G and data services continues to be
offset by challenging competitive and macroeconomic pressures and the impact of MTR cuts.
In AMAP, organic service revenue increased by 5.8%* driven by continued growth in India, Turkey, Ghana, Qatar and
Egypt, partially offset by declines in Vodacom and New Zealand.
EBITDA and operating profit
Group EBITDA increased 7.5% to £11.9 billion primarily reflecting the acquisitions of KDG and Ono. On an organic
basis, EBITDA fell 6.9%* and the Group’s EBITDA margin fell 0.7 percentage points to 28.2% (or 1.8* percentage
points on an organic basis), reflecting ongoing revenue declines in Europe and the growth in operating expenses as a
result of the Project Spring programme, offset by operating efficiencies.
Operating profit increased to £2.0 billion from a £3.9 billion operating loss in the prior year primarily as a result of the
£6.6 billion impairment charge in the year ended 31 March 2014.
Discontinued operations
On 2 September 2013 the Group announced it had reached an agreement with Verizon Communications Inc. to
dispose of its US group whose principal asset was its 45% interest in Verizon Wireless. The Group ceased recognising
its share of results in Verizon Wireless on 2 September 2013, and classified its investment as a held for sale asset and
the results as a discontinued operation. The transaction completed on 21 February 2014.
Net financing costs
2015 2014
£m £m
Investment income 883 346
Financing costs (1,736) (1,554)
Net financing costs (853) (1,208)
Analysed as:
Net financing costs before interest on settlement of tax issues (1,160) (1,273)
Interest expense arising on settlement of outstanding tax issues 4 15
Income from investments – 10
(1,156) (1,248)
Mark to market (losses)/gains (134) 118
Loss on US bond redemption – (99)
Foreign exchange1 437
21
(853) (1,208)
Note:
1 Comprises foreign exchange rate differences reflected in the income statement in relation to certain intercompany balances.
Net financing costs includes £437 million of foreign exchange gains (2014: £21 million gain), £134 million of mark to
market losses (2014: £118 million gain) and in the prior year, a £99 million loss on US bond redemption. Excluding
these items, net financing costs decreased by 7.4% primarily due to the impact of lower average net debt levels
following the disposal of the Group’s investment in Verizon Wireless and the acquisition of Ono.

FINANCIAL RESULTS
11
Taxation
2015 2014
£m £m
Income tax expense:
- Continuing operations before recognition of deferred tax 703 2,736
- Recognition of additional deferred tax - continuing operations (5,468) (19,318)
Total tax credit - continuing items (4,765) (16,582)
Tax on adjustments to derive adjusted profit before tax 305 290
Recognition of deferred tax asset for losses in Germany and Luxembourg 3,341 19,318
Deferred tax recognised on additional losses in Luxembourg 2,127 –
Tax liability on US rationalisation and reorganisation – (2,210)
Deferred tax on use of Luxembourg losses in the year (439) 113
Adjusted income tax expense 569 929
Share of associates’ and joint ventures’ tax 117 173
Adjusted income tax expense for calculating adjusted tax rate 686 1,102
Profit/(loss) before tax:
Total profit/(loss) before tax - continuing operations 1,095 (5,270)
Adjustments to derive adjusted profit before tax1 1,122 8,450
Adjusted profit before tax 2,217 3,180
Share of associates’ and joint ventures’ tax and non-controlling interest 117 173
Adjusted profit before tax for calculating adjusted effective tax rate 2,334 3,353
Adjusted effective tax rate 29.4% 32.9%
Note:
1 See “Earnings per share” on page 12.
The adjusted effective tax rate for the year ended 31 March 2015 was 29.4%. The rate is in line with our expectation of
a high twenties tax rate. The adjusted effective tax rate includes a £185 million impact from foreign exchange losses
for which we are unable to take a tax deduction. Excluding this impact the adjusted effective tax rate would be 27.2%.
The adjusted effective tax rate is expected to remain in the high twenties over the medium term.
This tax rate does not include the impact of the recognition of an additional £3,341 million deferred tax asset in
respect of the Group’s historical tax losses in Luxembourg. The losses have been recognised as a consequence of the
financing arrangements for the acquisition of Ono. The rate also excludes the deferred tax impact of the use of
Luxembourg losses in the year (£439 million) and an additional asset in the year of £2,127 million arising from the
revaluation of investments based upon the local GAAP financial statements.
The adjusted effective tax rate for the year ended 31 March 2014 has been restated to exclude the results and related
tax expense of Verizon Wireless and to show the adjusted tax rate as calculated on the same basis as the current year.
The rate excludes the recognition of an additional deferred tax asset in respect of the Group’s historical tax losses in
Germany of £1,916 million and Luxembourg of £17,402 million, the US tax liability of £2,210 million relating to the
rationalisation and reorganisation of our non-US assets prior to the disposal of our interest in Verizon Wireless and
excludes the deferred tax impact of the use of Luxembourg losses in the year (£113 million).

FINANCIAL RESULTS
12
Earnings per share
Adjusted earnings per share from continuing operations, which excludes the results and related tax charge of the
Group’s former investment in Verizon Wireless in the prior year and the recognition of deferred tax assets in both
years, was 5.55 pence, a decrease of 27.8% year-on-year, reflecting the Group’s lower adjusted operating profit.
Basic earnings per share decreased to 21.75 pence (2014: 223.84 pence) due to the prior year impact of the disposal
of the Group’s investment in Verizon Wireless and the recognition of a higher deferred tax assets in the prior year
compared to the current year, as described above.
2015 2014
£m £m
Profit attributable to owners of the parent 5,761 59,254
Adjustments:
Impairment loss – 6,600
Amortisation of acquired customer base and brand intangible assets 1,269 551
Restructuring costs 157 355
Other income and expense 114 717
Non-operating income and expense 19 149
Investment income and financing costs (437) 78
1,122 8,450
Taxation1 (5,334) (17,511)
Discontinued operations2 (57) (48,108)
Non-controlling interests (21) (50)
Adjusted profit attributable to owners of the parent 1,471 2,035
Million Million
Weighted average number of shares outstanding – basic 26,489 26,472
Weighted average number of shares outstanding – diluted 26,629 26,682
Earnings per share
Pence Pence
Basic earnings per share 21.75p 223.84p
Adjusted earnings per share from continuing operations 5.55p 7.69p
Notes:
1 Year ended 31 March 2015 includes the recognition of £5,468 million of deferred tax assets in respect of tax losses in Luxembourg. Year
ended 31 March 2014 included the recognition of a deferred tax asset in respect of tax losses in Germany (£1,916 million) and Luxembourg
(£17,402 million) and the estimated tax liability related to the rationalisation and reorganisation of our non-US assets prior to the disposal of
our stake in Verizon Wireless (£2,210 million).
2 Discontinued operations represent the gain on disposal, results, related tax charge and dividends received subsequent to the disposal of our
US group whose principal asset was its 45% interest in Verizon Wireless, the disposal of which was announced on 2 September 2013 and
completed on 21 February 2014.

FINANCIAL RESULTS
13
Europe
Germany Italy UK Spain
Other
Europe Eliminations Europe % change
£m £m £m £m £m £m £m £ Organic
31 March 2015
Mobile in-bundle revenue 3,376 1,960 2,570 1,763 2,451 – 12,120
Mobile out-of-bundle revenue 877 997 1,244 506 1,215 – 4,839
Mobile incoming revenue 248 284 357 111 397 (9) 1,388
Fixed line revenue 2,990 694 1,637 851 415 (41) 6,546
Other service revenue 338 181 301 140 186 (67) 1,079
Service revenue 7,829 4,116 6,109 3,371 4,664 (117) 25,972 15.0 (4.7)
Other revenue 638 525 305 293 343 (5) 2,099
Revenue 8,467 4,641 6,414 3,664 5,007 (122) 28,071 15.9 (4.2)
Direct costs (2,007) (1,016) (1,617) (853) (1,100) 117 (6,476)
Customer costs (1,879) (979) (1,644) (1,092) (1,015) 5 (6,604)
Operating expenses (1,911) (1,109) (1,793) (936) (1,318) – (7,067)
EBITDA 2,670 1,537 1,360 783 1,574 – 7,924 16.2 (12.3)
Depreciation and amortisation:
Acquired intangibles – (131) – – (4) – (135)
Purchased licences (472) (6) (374) (18) (190) – (1,060)
Other (1,659) (753) (940) (762) (852) – (4,966)
Share of result in associates and joint
ventures 2 – (5) – 3 – –
Adjusted operating profit 541 647 41 3 531 – 1,763 (24.4) (40.2)
EBITDA margin 31.5% 33.1% 21.2% 21.4% 31.4% 28.2%
31 March 2014
Mobile in-bundle revenue 3,644 210 2,478 1,908 2,519 – 10,759
Mobile out-of-bundle revenue 1,091 129 1,295 679 1,565 – 4,759
Mobile incoming revenue 296 33 380 141 471 – 1,321
Fixed line revenue 2,359 70 1,649 325 337 (1) 4,739
Other service revenue 349 23 293 177 211 (39) 1,014
Service revenue 7,739 465 6,095 3,230 5,103 (40) 22,592
Other revenue 533 57 332 288 423 (3) 1,630
Revenue 8,272 522 6,427 3,518 5,526 (43) 24,222
Direct costs (1,823) (104) (1,688) (715) (1,167) 40 (5,457)
Customer costs (1,961) (128) (1,642) (1,197) (1,192) 3 (6,117)
Operating expenses (1,790) (108) (1,679) (819) (1,431) – (5,827)
EBITDA 2,698 182 1,418 787 1,736 – 6,821
Depreciation and amortisation:
Acquired intangibles – (14) – – (6) – (20)
Purchased licences (507) – (357) (11) (191) – (1,066)
Other (1,274) (97) (859) (595) (865) – (3,690)
Share of result in associates and joint
ventures 1 300 (15) – 2 – 288
Adjusted operating profit 918 371 187 181 676 – 2,333
EBITDA margin 32.6% 34.9% 22.1% 22.4% 31.4% 28.2%
Change at constant exchange rates
%
% % % %
Mobile in-bundle revenue (0.5) 968.5 3.7 (0.8) 5.0
Mobile out-of-bundle revenue (13.8) 783.1 (4.0) (20.1) (16.2)
Mobile incoming revenue (10.2) 880.6 (6.1) (16.3) (8.6)
Fixed line revenue 36.6 1,026.5 (0.7) 181.2 32.3
Other service revenue 4.3 799.8 2.3 (15.1) (3.9)
Service revenue 8.7 911.3 0.2 12.0 (1.3)
Other revenue 28.5 949.2 (7.7) 8.9 (13.5)
Revenue 10.0 915.4 (0.2) 11.7 (2.3)
Direct costs (18.4) (1,006.5) 4.2 (27.9) (1.8)
Customer costs (3.0) (772.9) (0.1) 2.1 8.2
Operating expenses (14.9) (1,076.2) (6.7) (22.6) 0.5
EBITDA 6.3 868.0 (4.1) 6.8 (2.3)
Depreciation and amortisation:
Acquired intangibles – (956.2) – – 13.0
Purchased licences – – (5.0) (1.7) (6.5)
Other (40.6) (791.9) (9.4) (39.3) (6.7)
Share of result in associates and joint
ventures 167.7 (100.0) 69.1 – (6.7)
Adjusted operating profit (37.2) 84.0 (78.0) (98.1) (16.1)
EBITDA margin movement (pps) (1.1) (1.6) (0.9) (1.0) (0.1)

FINANCIAL RESULTS
14
Revenue increased 15.9%. M&A activity, including KDG, Ono and the consolidation of Vodafone Italy, contributed a 26.6
percentage point positive impact, while foreign exchange movements contributed a 6.5 percentage point negative impact.
On an organic basis, service revenue declined 4.7%*, driven primarily by price competition and the impact of MTR cuts.
EBITDA increased 16.2%, including a 35.5 percentage point positive impact from M&A activity and a 7.0 percentage point
negative impact from foreign exchange movements. On an organic basis EBITDA declined 12.3%*, reflecting the weak
organic revenue trend.
Organic* Other Foreign Reported
change activity exchange change
% pps pps %
Europe revenue (4.2) 26.6 (6.5) 15.9
Service revenue
Germany (3.2) 11.9 (7.5) 1.2
Italy (9.7) 921.0 (126.1) 785.2
UK (1.2) 1.4 – 0.2
Spain (10.5) 22.5 (7.6) 4.4
Other Europe (2.1) 0.8 (7.3) (8.6)
Europe service revenue (4.7) 26.1 (6.4) 15.0
EBITDA
Germany (10.9) 17.2 (7.3) (1.0)
Italy (15.2) 883.2 (123.5) 744.5
UK (12.5) 8.4 – (4.1)
Spain (29.5) 36.3 (7.3) (0.5)
Other Europe (2.8) 0.5 (7.0) (9.3)
Europe EBITDA (12.3) 35.5 (7.0) 16.2
Europe adjusted operating profit (40.2) 20.4 (4.6) (24.4)
Note:
* All amounts in this document marked with an “*” represent organic growth which presents performance on a comparable basis, both in terms of
merger and acquisition activity and movements in foreign exchange rates. See page 28 for “Use of non-GAAP financial information”.
Germany
Service revenue decreased 3.2%* excluding KDG. Q4 service revenue was down 3.1%* and KDG service revenue grew 7.1%1
in Q4 on a local GAAP basis.
Mobile service revenue fell 3.5%*, mainly as a result of price reductions in the prior year continuing to penetrate the
consumer customer base. The contract customer base grew, supported by a stronger commercial performance as we look
to increase our focus on direct, branded channels, falling churn and the ongoing substantial investment in network
infrastructure. We increased our 4G coverage to 77% of the population and significantly improved voice coverage and
reliability, as evidenced in independent tests. At the end of the period we had 5.0 million 4G customers.
Fixed service revenue excluding KDG fell 2.1%*, reflecting ongoing declines in our Vodafone DSL customer base, in part from
migrations to KDG cable infrastructure. The rate of decline eased during the year (H1 -2.9%*; H2 -1.2%*), with an improving
rate of gross customer additions and increasing demand for high speed broadband (‘VDSL’), as well as stronger growth in
carrier services. KDG maintained its strong rate of growth, contributing £1,492 million to service revenue and £676 million to
EBITDA, and adding 0.4 million broadband customers (excluding migrations from Vodafone DSL) during the year. The
integration of KDG has continued, including the launch of a combined fixed/mobile proposition in H2.
EBITDA declined 10.9%*, with a 3.1* percentage point decline in EBITDA margin, driven by lower service revenue and a
higher level of customer investment year-on-year, partially compensated by a year-on-year reduction in operating expenses.
Italy
Service revenue declined 9.7%*. Trends in both mobile and fixed line improved in H2, and Q4 service revenue declined
3.7%*.
Mobile service revenue fell 12.1%* as a result of a decline in the prepaid customer base and lower ARPU following last year’s
price cuts. We took a number of measures to stabilise ARPU during the year, and in Q4, consumer prepaid ARPU was up 6%
year-on-year. We also began to take a more active stance on stabilising the customer base in the second half of the year, in
what remains a very competitive market. Enterprise performed strongly, returning to growth in H2. We now have 4G
coverage of 84%, and 2.8 million 4G customers at March 2015.
Fixed service revenue was up 4.5%*. Broadband revenue continued to grow and we added 134,000 broadband customers
over the year, but overall growth was partially offset by an ongoing decline in fixed voice usage. We accelerated our fibre roll-
out plans in H2, and by March 2015 we had installed more than 5,000 cabinets.

FINANCIAL RESULTS
15
EBITDA declined 15.2%*, with a 2.6* percentage point decline in EBITDA margin. The decline in service revenue was partially
offset by continued strong cost control, with operating expenses down 3.1%* and customer investment down 3.0%*.
UK
Service revenue fell 1.2%* as a good performance in consumer mobile was offset by a decline in fixed line. The UK returned
to service revenue growth in H2. Q4 service revenue was up 0.6%*.
Mobile service revenue grew 0.5%*. Consumer contract service revenue grew strongly, supported by customer growth and a
successful commercial strategy bundling content with 4G. Enterprise mobile revenue returned to growth in H2, as a result of
growing data demand. During the year we acquired 139 stores from the administrator of Phones 4U, taking our total
portfolio to over 500 and accelerating our direct distribution strategy. 4G coverage reached 63% at March 2015 (or 71%
based on the OFCOM definition), and we had 3.0 million 4G customers at the year end.
Fixed service revenue declined 5.8%*, excluding the one-off benefit of a settlement with another network operator in Q4.
Underlying performance improved from -10.4%* in H1 to -1.3%* in H2, driven by a strong pick-up in carrier services revenue
and improving enterprise pipeline conversion. We plan to launch our consumer fibre broadband proposition in the coming
weeks.
EBITDA declined 12.5%*, with a 2.5* percentage point decline in EBITDA margin due mainly to a reclassification of some
central costs to the UK business. Reported EBITDA benefited from one-off settlements with two network operators.
Spain
Service revenue declined 10.5%* excluding Ono, as growth in fixed line continued to be offset by price pressure in mobile
and converged services. Q4 service revenue growth was -7.8%*. Ono Q4 local currency revenue growth was -1.9% excluding
wholesale.
Mobile service revenue fell 12.7%*, although there was some improvement in H2 with the contract customer base
stabilising year-on-year. However, ARPU continued to be under pressure throughout the year as a result of aggressive
convergence offers. During H2, we saw an increase in the take-up of handset financing arrangements as a result of a change
in the commercial model. We reduced handset subsidies in Q4 and introduced bigger data allowances at slightly higher
price points. Our 4G network roll-out has now reached 75% population coverage, and we had 2.9 million 4G customers at
March 2015. We continue to lead the market in net promoter scores (‘NPS’) in both consumer and enterprise.
Fixed service revenue rose 8.7%* excluding Ono, supported by consistently strong broadband net additions. Since its
acquisition in July 2014, Ono contributed £698 million to service revenue and £267 million to EBITDA. Including our joint
fibre network build with Orange, we now reach 8.5 million premises with fibre. We have made good progress with the
integration of Ono, and launched in April 2015 a fully converged service, “Vodafone One”, a new ultra high-speed fixed
broadband service with Ono Fibre, home landline, 4G mobile telephony and Vodafone TV.
EBITDA declined 29.5%* year-on-year, with a 5.0* percentage point decline in EBITDA margin. The margin was impacted by
falling mobile service revenue and growth in lower margin fixed line revenue, partially offset by lower direct costs and
operating expenses, and the change in the commercial model described above.
Other Europe
Service revenue declined 2.1%* due to price competition, the generally weak macroeconomic environment and MTR cuts.
Again, we saw a recovery in H2, with Q3 service revenue -1.0%* and Q4 service revenue -0.8%*. Hungary grew by 8.6%* for
the full year, the Netherlands and Czech Republic returned to growth in H2, and Greece and Ireland showed a clear
improvement in trends over the year.
In the Netherlands, we have nationwide 4G coverage, and the return to growth has been driven by continued contract
customer growth, stabilising ARPU and growth in fixed revenue. In Portugal, we continue to see a decline in mobile service
revenue driven by convergence pricing pressure reflecting a prolonged period of intense competition, partially offset by
strong fixed revenue growth. We now reach 1.6 million homes with fibre, including our network sharing deal with Portugal
Telecom. In Ireland, 4G coverage has reached 87%, and we have begun trials on our FTTH roll-out, with a commercial launch
planned for later in 2015. In Greece, the steady recovery in revenue trends through the year stalled in Q4 as a result of the
worsening macroeconomic conditions. The integration of Hellas Online is continuing in line with expectations.
EBITDA declined 2.8%*, with a 0.1* percentage point increase in EBITDA margin, as the impact of lower service revenue was
largely offset by strong cost control.
Note:
1 Revenue growth for KDG is reported using local GAAP, not Vodafone IFRS accounting policies, and is therefore not directly comparable to Vodafone’s
revenue growth.
FINANCIAL RESULTS
16
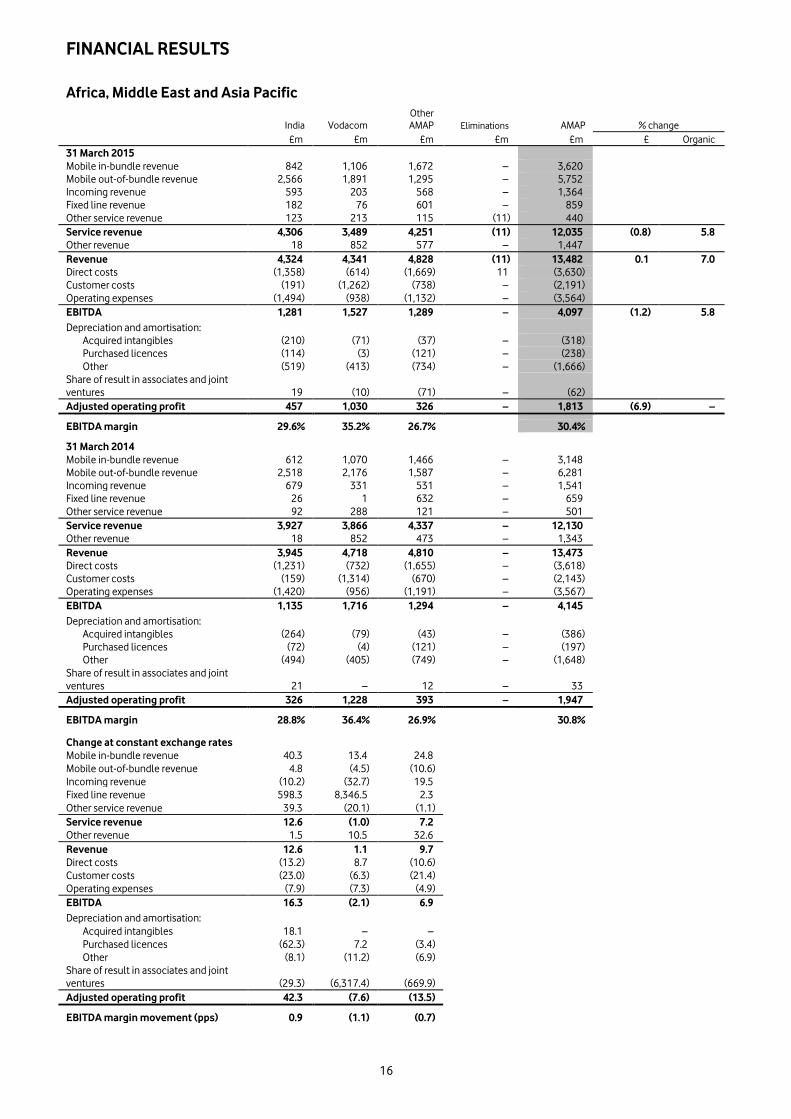
Africa, Middle East and Asia Pacific
India Vodacom
Other
AMAP Eliminations AMAP % change
£m £m £m £m £m £ Organic
31 March 2015
Mobile in-bundle revenue 842 1,106 1,672 – 3,620
Mobile out-of-bundle revenue 2,566 1,891 1,295 – 5,752
Incoming revenue 593 203 568 – 1,364
Fixed line revenue 182 76 601 – 859
Other service revenue 123 213 115 (11) 440
Service revenue 4,306 3,489 4,251 (11) 12,035 (0.8) 5.8
Other revenue 18 852 577 – 1,447
Revenue 4,324 4,341 4,828 (11) 13,482 0.1 7.0
Direct costs (1,358) (614) (1,669) 11 (3,630)
Customer costs (191) (1,262) (738) – (2,191)
Operating expenses (1,494) (938) (1,132) – (3,564)
EBITDA 1,281 1,527 1,289 – 4,097 (1.2) 5.8
Depreciation and amortisation:
Acquired intangibles (210) (71) (37) – (318)
Purchased licences (114) (3) (121) – (238)
Other (519) (413) (734) – (1,666)
Share of result in associates and joint
ventures 19 (10) (71) – (62)
Adjusted operating profit 457 1,030 326 – 1,813 (6.9) –
EBITDA margin 29.6% 35.2% 26.7% 30.4%
31 March 2014
Mobile in-bundle revenue 612 1,070 1,466 – 3,148
Mobile out-of-bundle revenue 2,518 2,176 1,587 – 6,281
Incoming revenue 679 331 531 – 1,541
Fixed line revenue 26 1 632 – 659
Other service revenue 92 288 121 – 501
Service revenue 3,927 3,866 4,337 – 12,130
Other revenue 18 852 473 – 1,343
Revenue 3,945 4,718 4,810 – 13,473
Direct costs (1,231) (732) (1,655) – (3,618)
Customer costs (159) (1,314) (670) – (2,143)
Operating expenses (1,420) (956) (1,191) – (3,567)
EBITDA 1,135 1,716 1,294 – 4,145
Depreciation and amortisation:
Acquired intangibles (264) (79) (43) – (386)
Purchased licences (72) (4) (121) – (197)
Other (494) (405) (749) – (1,648)
Share of result in associates and joint
ventures 21 – 12 – 33
Adjusted operating profit 326 1,228 393 – 1,947
EBITDA margin 28.8% 36.4% 26.9% 30.8%
Change at constant exchange rates
Mobile in-bundle revenue 40.3 13.4 24.8
Mobile out-of-bundle revenue 4.8 (4.5) (10.6)
Incoming revenue (10.2) (32.7) 19.5
Fixed line revenue 598.3 8,346.5 2.3
Other service revenue 39.3 (20.1) (1.1)
Service revenue 12.6 (1.0) 7.2
Other revenue 1.5 10.5 32.6
Revenue 12.6 1.1 9.7
Direct costs (13.2) 8.7 (10.6)
Customer costs (23.0) (6.3) (21.4)
Operating expenses (7.9) (7.3) (4.9)
EBITDA 16.3 (2.1) 6.9
Depreciation and amortisation:
Acquired intangibles 18.1 – –
Purchased licences (62.3) 7.2 (3.4)
Other (8.1) (11.2) (6.9)
Share of result in associates and joint
ventures (29.3) (6,317.4) (669.9)
Adjusted operating profit 42.3 (7.6) (13.5)
EBITDA margin movement (pps) 0.9 (1.1) (0.7)

FINANCIAL RESULTS
17
Revenue grew 0.1% as a result of a 7.4 percentage point adverse impact from foreign exchange movements, particularly
with regards to the Indian rupee, South African rand and the Turkish lira. On an organic basis service revenue was up 5.8%*
driven by a growth in the customer base, increased voice usage, strong demand for data and continued good commercial
execution. Overall growth was offset by MTR cuts, particularly in South Africa. Excluding MTRs, organic growth was 7.1%.
EBITDA declined 1.2%, including a 7.1 percentage point adverse impact from foreign exchange movements. On an organic
basis, EBITDA grew 5.8%* driven by growth in India, Turkey, Qatar and Egypt, offset by Vodacom and New Zealand.
Organic* Other Foreign Reported
change activity exchange change
% pps pps %
AMAP revenue 7.0 0.5 (7.4) 0.1
Service revenue
India 12.6 - (2.9) 9.7
Vodacom (1.0) - (8.8) (9.8)
Other AMAP 5.5 1.7 (9.2) (2.0)
AMAP service revenue 5.8 0.6 (7.2) (0.8)
EBITDA
India 16.3 - (3.4) 12.9
Vodacom (2.1) - (8.9) (11.0)
Other AMAP 6.6 0.3 (7.3) (0.4)
AMAP EBITDA 5.8 0.1 (7.1) (1.2)
AMAP adjusted operating profit - - (6.9) (6.9)
Note:
* All amounts in this document marked with an “*” represent organic growth which presents performance on a comparable basis, both in terms of
merger and acquisition activity and movements in foreign exchange rates. See page 28 for “Use of non-GAAP financial information”.
India
Service revenue increased 12.6%*, driven by continued customer base growth, an acceleration in 3G data uptake and stable
voice pricing. Q4 service revenue grew 12.1%*.
We added 17.2 million mobile customers during the year, taking the total to 183.8 million. Voice yields were relatively flat
after a period of improvement, but we saw a decline in average minutes of use in H2 as competition increased in some
circles.
Customer demand for data services has been very strong. Total data usage grew 86% year-on-year, with the active data
customer base increasing 23% to 64 million. Within this, the 3G customer base increased to over 19 million, reflecting the
significant investment in our 3G network build. During the year we added 12,585 new 3G sites, taking the total to over
35,000 and our coverage of target urban areas to 90%. 3G internet revenue rose 140%.
In March 2015 we successfully bid for spectrum in 12 telecom circles for a total cost of INR 258.1 billion (£2.78 billion). This
included spectrum in all six of our 900 MHz circles due for extension in December 2015. We also successfully bid for new 3G
spectrum in seven circles, allowing us to address 88% of our revenue base with 3G services.
We have continued to expand our M-Pesa mobile money transfer service, and now have 89,000 agents, with a nationwide
presence. At March 2015 we had 3.1 million registered customers and 378,000 active users. Our strategy is to focus on
building scale on specific migratory corridors.
EBITDA grew 16.3%*, with a 0.9* percentage point improvement in EBITDA margin as economies of scale from growing
service revenue were partly offset by the increase in operating costs related to the Project Spring network build and higher
acquisition costs.
Vodacom
Vodacom Group service revenue declined 1.0%*, as the negative impact of MTR cuts and a more competitive environment
in South Africa offset growth in Vodacom’s operations outside South Africa. Q4 service revenue was -0.2%*, reflecting some
easing of competition in South Africa.
In South Africa, organic service revenue declined -2.7%*. Excluding the impact of MTR cuts, service revenue grew 1.4%*.
Strong growth in smartphone penetration and data adoption drove 23.4% growth in local currency data revenue, although
this was offset by aggressive voice price competition. We have increased our 3G footprint to 96% population coverage and
4G to 35% coverage as part of the Project Spring programme, with 81% of sites now connected to high capacity backhaul.
During the year we began to trial our first fibre to the business services, and fibre to the home. The regulatory authorities
continue to review our proposed acquisition of Neotel, a fibre-based fixed line operator.

FINANCIAL RESULTS
18
Service revenue growth in Vodacom’s operations outside South Africa was 4.8%*, driven by customer base growth, data
take-up and M-Pesa. Active M-Pesa customers totalled 5.6 million, with M-Pesa now representing 23% of service revenue in
Tanzania.
Vodacom Group EBITDA fell 2.1%*, with a 1.1* percentage point decline in EBITDA margin. The significant negative impact of
MTR cuts on the EBITDA margin was substantially offset by good cost control.
Other AMAP
Service revenue increased 5.5%*, with growth in Turkey, Egypt, Qatar and Ghana partially offset by a decline in New Zealand.
Service revenue in Turkey was up 9.4%*, reflecting continued strong growth in consumer contract and enterprise revenue,
including higher ARPU and data usage, partly offset by a 1.8 percentage point negative impact from voice and SMS MTR
cuts. In Egypt, service revenue grew 2.8%* as a result of an increase in data and voice usage and a more stable economic
environment. In New Zealand, service revenue was down 2.6%* as a result of aggressive competition, but the contract
mobile base grew 4.6% year-on-year and the fixed base benefited from continued uptake of VDSL, TV and unlimited
broadband. Service revenue in Ghana grew 18.9%* driven by growth in customers, voice bundles and data. Total revenue
growth in Qatar was 16.0%*, but slowed in H2 due to significantly increased price competition.
EBITDA grew 6.6%* with a 0.4* percentage point decline in EBITDA margin.
Associates
Vodafone Hutchison Australia (‘VHA’), in which Vodafone owns a 50% stake, continued its good recovery, returning to local
currency service revenue growth in Q4 as a result of improving trends in both customer numbers and ARPU, supported by
significant network enhancements.
Safaricom, Vodafone’s 40% associate which is the number one mobile operator in Kenya, saw local currency service revenue
growth of 12.9% for the year, with local currency EBITDA up 16.8%. The total value of deposits, customer transfers,
withdrawals and other payments handled through the M-Pesa system grew 26% to KES 4,181 billion in the 2015 financial
year.
Indus Towers, the Indian towers company in which Vodafone has a 42% interest, achieved local currency revenue growth of
4.3%. Indus owns 116,000 towers, with a tenancy ratio of 2.19x. Our share of Indus Towers’ EBITDA and adjusted operating
profit was £285 million and £19 million respectively.

LIQUIDITY AND CAPITAL RESOURCES
19
Cash flows and funding
2015 2014
£m £m
EBITDA 11,915 11,084
Working capital (883) 1,181
Other 88 92
Cash generated by operations (excluding restructuring and other costs)1 11,120 12,357
Cash capital expenditure2 (8,435) (5,857)
Capital expenditure (9,197) (6,313)
Working capital movement in respect of capital expenditure 762 456
Disposal of property, plant and equipment 178 79
Operating free cash flow1 2,863 6,579
Taxation (758) (3,449)
Dividends received from associates and investments 224 2,842
Tax distribution from VZW – 2,763
Other 224 79
Dividends paid to non-controlling shareholders in subsidiaries (247) (264)
Interest received and paid (994) (1,315)
Free cash flow 1 1,088 4,393
Licence and spectrum payments (443) (862)
Acquisitions and disposals3 (7,040) 27,372
Equity dividends paid (2,927) (5,076)
Special dividend – (14,291)
Purchase of treasury shares – (1,033)
Foreign exchange 895 2,423
Income dividend from VZW – 2,065
Other4 (144) (3,337)
Net debt (increase)/decrease (8,571) 11,654
Opening net debt (13,700) (25,354)
Closing net debt (22,271) (13,700)
Notes:
1 Cash generated by operations, operating free cash flow and free cash flow have been redefined to exclude restructuring costs for the year ended 31
March 2015 of £336 million (2014: £210 million). Cash generated by operations for the year ended 31 March 2015 also excludes £387 million of other
movements including a £365 million UK pensions contribution payment and £116 million of KDG incentive scheme payments in respect of liabilities
assumed on acquisition. See also note 4 below.
2 Cash capital expenditure comprises the purchase of property, plant and equipment and intangible assets, other than licence and spectrum payments,
during the year.
3 Acquisitions and disposals for the year ended 31 March 2015 primarily includes a £2,945 million payment in relation to the acquisition of the entire
share capital of Ono plus £2,858 million of associated net debt acquired, a £563 million payment in relation to the acquisition of the remaining
10.97% equity interest in Vodafone India, a £131 million payment in relation to acquisition of the entire share capital of Cobra Automotive plus £40
million of associated debt acquired and a £70 million payment in relation to the acquisition of a 72.7% of the share capital of Hellas Online plus £115
million of associated debt. The year ended 31 March 2014 includes £35,231 million received on the disposal of our US group whose principal asset
was its 45% interest in Verizon Wireless plus £999 million from the assumption by Verizon of Vodafone’s net liabilities relating to its US group, a
£4,855 million payment in relation to the acquisition of 76.57% of the share capital of KDG plus £2,148 million of associated debt acquired and £1,447
million recognised in respect of the remaining non-controlling interests.
4 Other amounts for the year ended 31 March 2015 include £336 million of restructuring costs (2014: £210 million), a £365 million UK pensions
contribution payment, £359 million of Verizon Wireless tax distributions received after the completion of the disposal, £328 million of interest paid on
the settlement of the Piramal option, £116 million of KDG incentive scheme payments in respect of liabilities assumed on acquisition, £176 million
tax refund (2014: £2,372 tax payment) relating to the rationalisation and reorganisation of our non-US assets prior to the disposal of our stake in
Verizon Wireless and a £100 million (2014: £100 million) payment in respect of the Group’s historical UK tax settlement. Other amounts for the year
ended 31 March 2014 also includes a £1,387 million outflow relating to payment obligations in connection with the purchase of licences and
spectrum, principally in India
Cash generated by operations excluding restructuring and other costs decreased 10.0% to £11.1 billion, primarily driven by
working capital movements which more than offset the higher EBITDA.
Free cash flow decreased to £1.1 billion compared to £4.4 billion in the prior year as lower payments for taxation were offset
by higher cash capital expenditure and lower dividends received from associates and investments.
Capital expenditure increased £2.9 billion to £9.2 billion primarily driven by investments in the Group’s networks as a result
of Project Spring.
Payments for taxation decreased 78.0% to £0.8 billion and dividends received from associates and investments decreased
by £2.6 billion to £0.2 billion primarily as a result of the Group’s disposal of its 45% interest in Verizon Wireless.
A foreign exchange gain of £0.9 billion was recognised on net debt due to favourable exchange rate movements resulting
primarily from the weakening of the euro and the Indian rupee against pounds sterling.

LIQUIDITY AND CAPITAL RESOURCES
20
Analysis of net debt:
2015 2014
£m £m
Cash and cash equivalents 6,882 10,134
Short-term borrowings
Bonds (1,786) (1,783)
Commercial paper1 (5,077) (950)
Put options over non-controlling interests (1,307) (2,330)
Bank loans (1,876) (1,263)
Other short-term borrowings2 (2,577) (1,421)
(12,623) (7,747)
Long-term borrowings
Put options over non-controlling interests (7) (6)
Bonds, loans and other long-term borrowings (22,428) (21,448)
(22,435) (21,454)
Other financial instruments3 5,905 5,367
Net debt (22,271) (13,700)
Notes:
1 At 31 March 2015 US$3,321 million (2014: US$578 million) was drawn under the US commercial paper programme and €3,928 million (2014:€731
million) was drawn under the euro commercial paper programme.
2 At 31 March 2015 the amount includes £2,542 million (2014: £1,185 million) in relation to cash received under collateral support agreements.
3 Comprises mark to market adjustments on derivative financial instruments which are included as a component of trade and other receivables (2015:
£4,005 million; 2014: £2,443 million) and trade and other payables (2015: £984 million; 2014: £881 million) and short-term investments primarily in
index linked government bonds and a managed investment fund included as a component of other investments (2015: £2,884 million, 2014: £3,805
million).
Dividends
The Directors have announced a final dividend per share of 7.62 pence, representing a 2.0% increase over the prior financial
year’s final dividend. The ex-dividend date for the final dividend is 11 June 2015 for ordinary shareholders, the record date is
12 June 2015 and the dividend is payable on 5 August 2015. Dividend payments on ordinary shares will be paid directly into
a nominated bank or building society account.

OTHER SIGNIFICANT DEVELOPMENTS
21
Telecom Egypt Arbitration
In October 2009, Telecom Egypt commenced arbitration against Vodafone Egypt in Cairo alleging breach of non-
discrimination provisions in an interconnection agreement as a result of lower interconnection rates paid to Vodafone Egypt
by Mobinil. Telecom Egypt also sought to join Vodafone International Holdings BV (‘VIHBV’), Vodafone Europe BV (‘VEBV’)
and Vodafone Group Plc to the arbitration. In January 2015, the arbitral tribunal issued its decision. It held unanimously that
it had no jurisdiction to arbitrate the claim against VIHBV, VEBV and Vodafone Group Plc. The tribunal also held by a 3 to 2
majority that Telecom Egypt had failed to establish any liability on the part of Vodafone Egypt. Telecom Egypt has applied to
the Egyptian court to set aside the decision.
India tax case
In August 2007 and September 2007, Vodafone India Limited (‘VIL’) and VIHBV respectively received notices from the Indian
tax authority alleging potential liability in connection with an alleged failure by VIHBV to deduct withholding tax from
consideration paid to the Hutchison Telecommunications International Limited group (‘HTIL’) in respect of HTIL’s gain on its
disposal to VIHBV of its interests in a wholly-owned subsidiary that indirectly holds interests in VIL. In January 2012 the
Indian Supreme Court handed down its judgement, holding that VIHBV’s interpretation of the Income Tax Act 1961 was
correct, that the HTIL transaction in 2007 was not taxable in India, and that consequently, VIHBV had no obligation to
withhold tax from consideration paid to HTIL in respect of the transaction. The Indian Supreme Court quashed the relevant
notices and demands issued to VIHBV in respect of withholding tax and interest. On 20 March 2012, the Indian Government
returned VIHBV’s deposit of INR 25 billion and released the guarantee for INR 85 billion, which was based on the demand for
payment issued by the Indian tax authority in October 2010, for tax of INR 79 billion plus interest.
On 28 May 2012 the Finance Act 2012 became law. The Finance Act 2012 is intended to tax any gain on transfer of shares in
a non-Indian company, which derives substantial value from underlying Indian assets, such as VIHBV’s transaction with HTIL
in 2007. Further it seeks to subject a purchaser, such as VIHBV, to a retrospective obligation to withhold tax.
VIHBV has not received any formal demand for taxation in respect of the HTIL transaction following the effective date of the
Finance Act 2012, but it did receive a letter on 3 January 2013 reminding it of the tax demand raised prior to the Indian
Supreme Court’s judgement and purporting to update the interest element of that demand to a total amount of INR 142
billion. The separate proceedings taken against VIHBV to seek to treat it as an agent of HTIL in respect of its alleged tax on
the same transaction, as well as penalties of up to 100% of the assessed withholding tax for the alleged failure to have
withheld such taxes, remain pending despite the issue having been ruled upon by the Indian Supreme Court. Should a
further demand for taxation be received by VIHBV or any member of the Group as a result of the new retrospective
legislation, we believe it is probable that we will be able to make a successful claim under the Dutch-India Bilateral
Investment Treaty (‘Dutch BIT’). On 17 January 2014, VIHBV served an amended trigger notice on the Indian Government
under the Dutch BIT, supplementing a trigger notice filed on 17 April 2012, immediately prior to the Finance Act 2012
becoming effective, to add claims relating to an attempt by the Indian Government to tax aspects of the transaction with
HTIL under transfer pricing rules.
On 17 April 2014, VIHBV served its notice of arbitration under the Dutch BIT, formally commencing the Dutch BIT arbitration
proceedings. An arbitrator has been appointed by VIHBV. The Indian Government appointed an arbitrator but he resigned in
May 2015. The third arbitrator, who will act as chairman of the tribunal, had been agreed by the two party-appointed
arbitrators (prior to the Government’s arbitrator’s resignation) but declined to accept the appointment. There is now likely to
be a delay in appointing the chairman pending the Indian Government appointing a replacement for its party-appointed
arbitrator. If there is no subsequent agreement on appointment of a chairman, the International Court of Justice will appoint
the third arbitrator.
We did not carry a provision for this litigation or in respect of the retrospective legislation at 31 March 2015, or at previous
reporting dates.
British Telecom (Italy) v Vodafone Italy
The Italian Competition Authority concluded an investigation in 2007 when Vodafone Italy gave certain undertakings in
relation to allegations that it had abused its dominant position in the wholesale market for mobile termination. In 2010,
British Telecom (Italy) brought a civil damages claim against Vodafone Italy on the basis of the Competition Authority’s
investigation and Vodafone Italy’s undertakings. British Telecom (Italy) seeks damages in the amount of €280 million for
abuse of dominant position by Vodafone Italy in the wholesale fixed to mobile termination market for the period from 1999
to 2007. A court appointed expert delivered an opinion to the Court that the range of damages in the case should be in the
region of €10 million to €25 million which was reduced in a further supplemental report published in September 2014 to a
range of €8 million to €11 million. The expert’s report will be considered by the Court before it passes judgment on the case.

OTHER SIGNIFICANT DEVELOPMENTS
22
FASTWEB v Vodafone Italy
The Italian Competition Authority concluded an investigation in 2007 when Vodafone Italy gave certain undertakings in
relation to allegations it had abused its dominant position in the wholesale market for mobile termination. In 2010,
FASTWEB brought a civil damages claim against Vodafone Italy on the basis of the Competition Authority’s investigation and
Vodafone Italy’s undertakings. FASTWEB sought damages in the amount of €360 million for abuse of dominant position by
Vodafone Italy in the wholesale fixed to mobile termination market. A court appointed expert delivered an opinion to the
Court that the range of damages in the case should be in the region of €0.5 million to €2.3 million. On 15 October 2014, the
Court decided to reject FASTWEB’s damages claim in its entirety.
Board changes
On 10 December 2014, the Group announced that Omid Kordestani had notified the Board of his intention to stand down as
a Non-Executive Director of the Company with effect from 31 December 2014 in order to focus full-time on his executive
responsibilities with Google, Inc. in the United States.
On 15 January 2015, the Group announced that its Chief Technology Officer Steve Pusey would stand down from the Board
following the Company's Annual General Meeting on 28 July 2015.
On 30 March 2015, the Group announced the appointment of Dr Mathias Döpfner as a Non-Executive Director with effect
from 1 April 2015. Dr Döpfner is Chairman and CEO of the German media group Axel Springer SE in Berlin. Dr Döpfner has
been with Axel Springer SE since 1998, initially as editor-in-chief of Die Welt and since 2000 as a member of the
Management Board.
On 30 March 2015, the Group also announced that Luc Vandevelde will stand down from the Board with effect from the
Company's Annual General Meeting on 28 July 2015. Luc Vandevelde joined the Board in September 2003 and became the
Senior Independent Director in July 2012. Philip Yea will be appointed as Senior Independent Director with effect from the
Annual General Meeting.

CONSOLIDATED FINANCIAL STATEMENTS
23
Consolidated income statement
2015 2014
£m £m
Continuing operations
Revenue 42,227 38,346
Cost of sales (30,882) (27,942)
Gross profit 11,345 10,404
Selling and distribution expenses (3,455) (3,033)
Administrative expenses (5,746) (4,245)
Share of result of equity accounted associates and joint ventures (63) 278
Impairment losses – (6,600)
Other income and expense (114) (717)
Operating profit/(loss) 1,967 (3,913)
Non-operating income and expense (19) (149)
Investment income 883 346
Financing costs (1,736) (1,554)
Profit/(loss) before taxation 1,095 (5,270)
Income tax credit 4,765 16,582
Profit for the financial year from continuing operations 5,860 11,312
Profit for the financial year from discontinued operations 57 48,108
Profit for the financial year 5,917 59,420
Attributable to:
– Owners of the parent 5,761 59,254
– Non-controlling interests 156 166
Profit for the financial year 5,917 59,420
Earnings per share
From continuing operations:
– Basic 21.53p 42.10p
– Diluted 21.42p 41.77p
Total Group:
– Basic 21.75p 223.84p
– Diluted 21.63p 222.07p
Consolidated statement of comprehensive income
2015 2014
£m £m
Profit for the financial year 5,917 59,420
Other comprehensive income:
Items that may be reclassified to profit or loss in subsequent years
Gains/(losses) on revaluation of available-for-sale investments, net of tax 4 (119)
Foreign exchange translation differences, net of tax (6,516) (4,104)
Foreign exchange (gains)/losses transferred to the income statement (1) 1,493
Fair value gains transferred to the income statement (9) (25)
Other, net of tax 7 –
Total items that may be classified to profit or loss in subsequent years (6,515) (2,755)
Items that will not be reclassified to profit or loss in subsequent years
Net actuarial (losses)/gains on defined benefit pension schemes, net of tax (212) 37
Total items will not be classified to profit or loss in subsequent years (212) 37
Other comprehensive expense (6,727) (2,718)
Total comprehensive (expense)/income for the financial year (810) 56,702
Attributable to:
– Owners of the parent (1,076) 56,711
– Non-controlling interests 266 (9)
(810) 56,702

CONSOLIDATED FINANCIAL STATEMENTS
24
Consolidated statement of financial position
2015 2014
£m £m
Non-current assets
Goodwill 22,537 23,315
Other intangible assets 20,953 23,373
Property, plant and equipment 26,603 22,851
Investments in associates and joint ventures (3) 114
Other investments 3,757 3,553
Deferred tax assets 23,845 20,607
Post employment benefits 169 35
Trade and other receivables 4,865 3,270
102,726 97,118
Current assets
Inventory 482 441
Taxation recoverable 575 808
Trade and other receivables 8,053 8,886
Other investments 3,855 4,419
Cash and cash equivalents 6,882 10,134
Assets held for sale – 34
19,847 24,722
Total assets 122,573 121,840
Equity
Called up share capital 3,792 3,792
Additional paid-in capital 117,054 116,973
Treasury shares (7,045) (7,187)
Accumulated losses (49,471) (51,428)
Accumulated other comprehensive income 1,815 8,652
Total equity attributable to owners of the parent 66,145 70,802
Non-controlling interests 1,595 1,733
Put options over non-controlling interests (7) (754)
Total non-controlling interests 1,588 979
Total equity 67,733 71,781
Non-current liabilities
Long-term borrowings 22,435 21,454
Taxation liabilities – 50
Deferred tax liabilities 595 747
Post employment benefits 567 584
Provisions 1,082 846
Trade and other payables 1,264 1,339
25,943 25,020
Current liabilities
Short-term borrowings 12,623 7,747
Taxation liabilities 599 873
Provisions 767 963
Trade and other payables 14,908 15,456
28,897 25,039
Total equity and liabilities 122,573 121,840

CONSOLIDATED FINANCIAL STATEMENTS
25
Consolidated statement of changes in equity
Share
capital
Additional
paid-in
capital1
Treasury
shares
Accumulated
comprehensive
income2
Equity
attributable
to the owners
Non-
controlling
interests Total equity
£m £m £m £m £m £m £m
1 April 2013 3,866 154,279 (9,029) (77,639) 71,477 1,011 72,488
Issue or reissue of shares – 2 194 (173) 23 – 23
Redemption or cancellation of
shares (74) 74 1,648 (1,648) – – –
Capital reduction and creation
of B and C shares 16,613 (37,470) – 20,857 – – –
Cancellation of B shares (16,613) – – 1,115 (15,498) – (15,498)
Share-based payments – 883 – – 88 – 88
Transactions with non-
controlling interests in
subsidiaries – – – (1,451) (1,451) 260 (1,191)
Comprehensive income – – – 56,711 56,711 (9) 56,702
Dividends – – – (40,566) (40,566) (284) (40,850)
Other – – – 18 18 1 19
31 March 2014 3,792 116,973 (7,187) (42,776) 70,802 979 71,781
Issue or reissue of shares – 2 142 (126) 18 – 18
Share-based payments – 953 – – 95 – 95
Transactions with non-
controlling interests in
subsidiaries – – – (756) (756) 605 (151)
Comprehensive income – – – (1,076) (1,076) 266 (810)
Dividends – – – (2,930) (2,930) (262) (3,192)
Other – (16) – 8 (8) – (8)
31 March 2015 3,792 117,054 (7,045) (47,656) 66,145 1,588 67,733
Notes:
1 Includes share premium, capital redemption reserve and merger reserve. The merger reserve was derived from acquisitions made prior to 31
March 2004 and subsequently allocated to additional paid-in capital on adoption of IFRS.
2 Includes accumulated losses and accumulated other comprehensive income.
3 Includes £7 million tax credit (2014: £12 million tax charge).

CONSOLIDATED FINANCIAL STATEMENTS
26
Consolidated statement of cash flows
2015 2014
£m £m
Net cash flow from operating activities 9,715 6,227
Cash flows from investing activities
Purchase of interests in subsidiaries, net of cash acquired (3,093) (4,279)
Purchase of interests in associates and joint ventures (85) (11)
Purchase of intangible assets (2,315) (2,327)
Purchase of property, plant and equipment (6,568) (4,396)
Purchase of investments (207) (214)
Disposal of interests in associates and joint ventures 27 34,919
Disposal of property, plant and equipment 178 79
Disposal of investments 899 1,483
Dividends received from associates and joint ventures 583 4,897
Dividends received from investments – 10
Interest received 254 582
Net cash flow from investing activities (10,327) 30,743
Cash flows from financing activities
Issue of ordinary share capital and reissue of treasury shares 18 38
Net movement in short-term borrowings 4,722 (2,887)
Proceeds from issue of long-term borrowings 2,432 1,060
Repayment of borrowings (4,070) (9,788)
Purchase of treasury shares – (1,033)
B and C share payments – (14,291)
Equity dividends paid (2,927) (5,076)
Dividends paid to non-controlling shareholders in subsidiaries (247) (264)
Other transactions with non-controlling interests in subsidiaries (718) (111)
Other movements in loans with associates and joint ventures (52) –
Interest paid (1,576) (1,897)
Net cash flow used in financing activities (2,418) (34,249)
Net cash flow (3,030) 2,721
Cash and cash equivalents at beginning of the financial year 10,112 7,506
Exchange loss on cash and cash equivalents (221) (115)
Cash and cash equivalents at end of the financial year 6,861 10,112

CONSOLIDATED FINANCIAL STATEMENTS
27
1 Basis of preparation
The preliminary results for the year ended 31 March 2015 are an abridged statement of the full annual report which
was approved by the Board of Directors on 19 May 2015. The consolidated financial statements within the full annual
report are prepared in accordance with International Financial Reporting Standards (‘IFRS’) as issued by the
International Accounting Standards Board. They are also prepared in accordance with IFRS as adopted by the
European Union (‘EU’), the Companies Act 2006 and Article 4 of the EU IAS Regulations.
The auditor’s report on those consolidated financial statements was unqualified, did not draw attention to any
matters by way of emphasis without qualifying their report, and did not contain statements under section 498(2) or
498(3) of the Companies Act 2006. The preliminary results do not comprise statutory accounts within the meaning
of section 434(3) of the Companies Act 2006. The annual report for the year ended 31 March 2015 will be delivered
to the Registrar of Companies following the Company’s annual general meeting to be held on 28 July 2015.
The financial information included in this preliminary announcement does not itself contain sufficient information to
comply with IFRS. The Company will publish full financial statements that comply with IFRS in June 2015.
The preparation of the preliminary results requires management to make estimates and assumptions that affect the
reported amounts of assets and liabilities, disclosure of contingent assets and liabilities at the end of the reporting
period and the reported amounts of revenue and expenses during the reporting period. Actual results could vary from
these estimates. The estimates and underlying assumptions are reviewed on an on-going basis. Revisions to
accounting estimates are recognised in the period in which the estimate is revised if the revision affects only that
period or in the period of the revision and future periods if the revision affects both current and future periods.
On 1 April 2014, the Group adopted certain new accounting policies where necessary to comply with amendments to
IFRS, none of which had a material impact on the consolidated results, financial position or cash flows of the Group;
further details are provided in the Group’s annual report for the year ended 31 March 2014.
2 Equity dividends
2015 2014
£m £m
Declared during the financial year:
Final dividend for the year ended 31 March 2014: 7.47 pence per share (2013:
6.92 pence) 1,975 3,365
Interim dividend for the year ended 31 March 2015: 3.60 pence per share (2014:
3.53 pence) 955 1,711
Special dividend for the year ended 31 March 2015: nil (2014: 172.94 US cents
per share) – 35,490
2,930 40,566
Proposed after the end of the reporting period and not recognised as a liability:
Final dividend for the year ended 31 March 2015: 7.62 pence per share (2014:
7.47 pence) 2,020 1,975

USE OF NON-GAAP FINANCIAL INFORMATION
28
In the discussion of the Group’s reported financial position, operating results and cash flows, information is presented
to provide readers with additional financial information that is regularly reviewed by management. However, this
additional information presented is not uniformly defined by all companies including those in the Group’s industry.
Accordingly, it may not be comparable with similarly titled measures and disclosures by other companies.
Additionally, certain information presented is derived from amounts calculated in accordance with IFRS but is not
itself an expressly permitted GAAP measure. Such non-GAAP measures should not be viewed in isolation or as an
alternative to the equivalent GAAP measure.
Organic growth
All amounts in this document marked with an “*” represent “organic growth” which presents performance on a
comparable basis in terms of merger and acquisition activity and foreign exchange rates. While “organic growth” is
neither intended to be a substitute for reported growth, nor is it superior to reported growth, we believe that the
measure provides useful and necessary information to investors and other interested parties for the following
reasons:
it provides additional information on underlying growth of the business without the effect of certain factors
unrelated to its operating performance;
it is used for internal performance analysis; and
it facilitates comparability of underlying growth with other companies (although the term “organic” is not a
defined term under IFRS and may not, therefore, be comparable with similarly titled measures reported by other
companies).
For the 2015 financial year, the Group’s organic service revenue growth rate has been adjusted to exclude the
beneficial impact of a settlement of an historical interconnect rate dispute in the UK, the beneficial impact of an
upward revision to interconnect revenue in Egypt from a re-estimation by management of the appropriate historical
mobile interconnection rate, and the adverse impact of an adjustment to intercompany revenue. The adjustments in
relation to Vodafone UK and Vodafone Egypt also impact the disclosed organic growth rates for those countries.
A summary of certain non-GAAP measures included in this results announcement, together with details of where
additional information and reconciliation to the nearest equivalent GAAP measure can be found, is shown below.
Non-GAAP measure
Closest equivalent
GAAP measure
Location in this results
announcement of reconciliation
and further information
EBITDA Operating profit Group results on page 9
Adjusted operating profit Operating profit Group results on page 9
Adjusted profit before tax Profit before taxation Taxation on page 11
Adjusted effective tax rate Income tax expense as a percentage
of profit before taxation
Taxation on page 11
Adjusted income tax expense Income tax expense Taxation on page 11
Adjusted profit attributable to
owners of the parent
Profit attributable to owners of the
parent
Earnings per share on page 12
Adjusted earnings per share (from
continuing operations)
Basic earnings per share Earnings per share on page 12 and
Reconciliation of adjusted earnings
on page 31
Operating free cash flow Cash generated by operations Cash flows and funding beginning on
page 19
Free cash flow Cash generated by operations Cash flows and funding beginning on
page 19
Cash generated by operations
(excluding restructuring costs)
Cash generated by operations Cash flows and funding beginning on
page 19
See page 31 for a reconciliation of adjusted earnings to reported earnings.

ADDITIONAL INFORMATION
29
Regional results for the year ended 31 March
Revenue EBITDA Adjusted operating
profit Capital expenditure Operating free cash
flow1 2015 2014 2015 2014 2015 2014 2015 2014 2015 2014
£m £m £m £m £m £m £m £m £m £m
Europe
Germany2 8,467 8,272 2,670 2,698 541 918 2,003 1,312 1,002 1,706
Italy3 4,641 522 1,537 182 647 372 1,105 180 544 251
UK 6,414 6,427 1,360 1,418 41 187 980 932 200 621
Spain4 3,664 3,518 783 787 3 181 858 511 (29) 255
Other Europe
Netherlands 1,482 1,608 507 548 157 220 303 230 218 338
Portugal 771 889 289 309 108 140 273 157 41 163
Greece 576 597 158 165 54 54 76 70 70 117
Other 2,185 2,436 620 714 212 262 431 342 214 362
Eliminations (7) (5) – – – – – – – –
Other
Europe 5,007 5,525 1,574 1,736 531 676 1,083 799 543 980
Eliminations (122) (42) – – – – – – – –
Europe 28,071 24,222 7,924 6,821 1,763 2,334 6,029 3,734 2,260 3,813
AMAP
India 4,324 3,945 1,281 1,135 457 326 882 633 332 812
Vodacom 4,341 4,718 1,527 1,716 1,030 1,228 745 663 762 1,174
Other AMAP
Turkey 2,079 2,017 376 358 87 61 343 252 39 84
Egypt 1,190 1,163 522 517 285 271 314 218 256 342
Other 1,560 1,633 391 419 (46) 61 262 241 114 193
Eliminations (1) (3) – – – – – – – –
Other
AMAP 4,828 4,810 1,289 1,294 326 393 919 711 409 619
Eliminations (11) – – – – – – – – –
AMAP 13,482 13,473 4,097 4,145 1,813 1,947 2,546 2,007 1,503 2,605
Other 754 686 (106) 118 (69) 29 622 572 (900) 161
Eliminations (80) (35) – – – – – – – –
Group 42,227 38,346 11,915 11,084 3,507 4,310 9,197 6,313 2,863 6,579
Notes:
1 Free cash flow for the year ended 31 March 2015 excludes £336 million of restructuring costs (2014: £210 million), a £365 million UK
pensions contribution payment, £359 million of Verizon Wireless tax distributions received after the completion of the disposal, £328 million
of interest paid on the settlement of the Piramal option, £116 million of KDG incentive scheme payments in respect of liabilities assumed on
acquisition and a £100 million (2014: £100 million) payment in respect of the Group’s historical UK tax settlement.
2 On 14 October 2013 the Group acquired 76.57% of the share capital of KDG and the results of KDG have been fully consolidated into the
results of Germany from that date.
3 On 21 February 2014 the Group acquired the remaining 23.1% equity interest in Vodafone Italy.
4 On 23 July 2014 the Group acquired 100% of the share capital of Ono and the results of Ono have been fully consolidated into the results of
Spain from that date.

ADDITIONAL INFORMATION
30
Service revenue – quarter ended 31 March1, 2
Group and Regions
Group Europe AMAP
2015 2014 2015 2014 2015 2014
£m £m £m £m £m £m
Mobile in-bundle 4,030 3,693 2,929 2,806 986 822
Mobile out-of-bundle 2,448 2,520 1,037 1,150 1,416 1,366
Mobile incoming 713 685 321 333 393 354
Fixed line 2,003 1,653 1,728 1,441 253 158
Other 375 395 248 263 94 123
Service revenue 9,569 8,946 6,263 5,993 3,142 2,823
Change
Group Europe AMAP
Reported Organic Reported Organic Reported Organic
% % % % % %
Mobile in-bundle 9.1 5.4 4.4 2.2 20.0 18.1
Mobile out-of-bundle (2.9) (7.7) (9.8) (15.7) 3.7 (0.3)
Mobile incoming 4.1 (9.9) (3.6) (8.0) 11.0 (11.7)
Fixed line 21.2 8.7 19.9 1.6 60.1 64.5
Other (5.1) (7.2) (5.7) (0.3) (23.6) (23.0)
Service revenue 7.0 0.1 4.5 (2.4) 11.3 6.0
Operating Companies
Germany Italy UK3 2015 2014 2015 2014 2015 2014
£m £m £m £m £m £m
Mobile in-bundle 797 898 466 210 657 626
Mobile out-of-bundle 183 232 202 129 289 300
Mobile incoming 56 67 65 33 88 91
Fixed line 705 776 167 70 504 423
Other 79 86 40 23 76 79
Service revenue 1,820 2,059 940 465 1,614 1,519
Change
Germany Italy UK
Reported Organic Reported Organic Reported Organic
% % % % % %
Service revenue (11.6) (3.1) 102.2 (3.7) 6.3 0.6
Spain India Vodacom
2015 2014 2015 2014 2015 2014
£m £m £m £m £m £m
Mobile in-bundle 411 452 244 162 296 294
Mobile out-of-bundle 117 151 670 597 449 425
Mobile incoming 27 26 148 163 49 75
Fixed line 267 82 53 7 41 –
Other 29 37 41 23 43 74
Service revenue 851 748 1,156 952 878 868
Change
Spain India Vodacom
Reported Organic Reported Organic Reported Organic
Service revenue 13.8 (7.8) 21.4 12.1 1.2 (0.2)
Notes:
1 The sum of the regional amounts may not be equal to Group totals due to Non-Controlled Interests and Common Functions, and
intercompany eliminations.
2 Organic growth presents performance on a comparable basis in terms of merger and acquisition activity and foreign exchange.
3 The analysis of UK mobile and fixed line service revenue for the year ended 31 March 2014 has been restated following the integration of
CWW into the UK business.
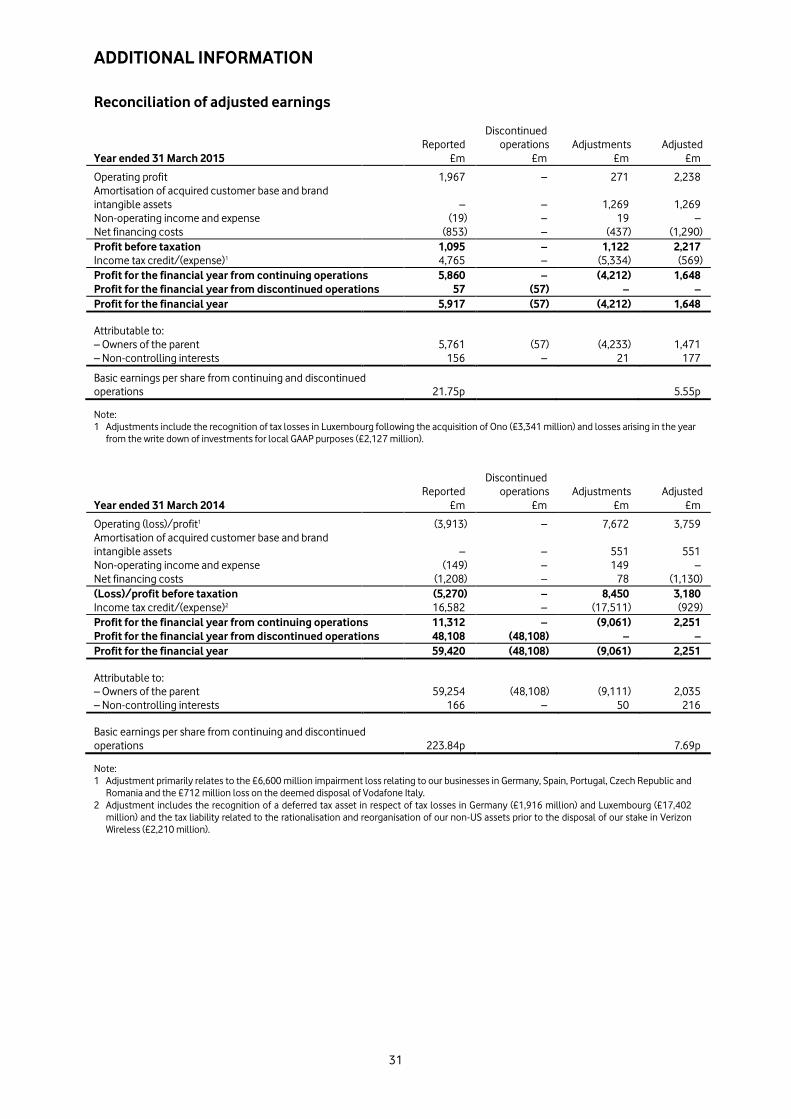
ADDITIONAL INFORMATION
31
Reconciliation of adjusted earnings
Reported
Discontinued
operations Adjustments Adjusted
Year ended 31 March 2015 £m £m £m £m
Operating profit 1,967 – 271 2,238
Amortisation of acquired customer base and brand
intangible assets – – 1,269 1,269
Non-operating income and expense (19) – 19 –
Net financing costs (853) – (437) (1,290)
Profit before taxation 1,095 – 1,122 2,217
Income tax credit/(expense)1 4,765 – (5,334) (569)
Profit for the financial year from continuing operations 5,860 – (4,212) 1,648
Profit for the financial year from discontinued operations 57 (57) – –
Profit for the financial year 5,917 (57) (4,212) 1,648
Attributable to:
– Owners of the parent 5,761 (57) (4,233) 1,471
– Non-controlling interests 156 – 21 177
Basic earnings per share from continuing and discontinued
operations 21.75p 5.55p
Note:
1 Adjustments include the recognition of tax losses in Luxembourg following the acquisition of Ono (£3,341 million) and losses arising in the year
from the write down of investments for local GAAP purposes (£2,127 million).
Reported
Discontinued
operations Adjustments Adjusted
Year ended 31 March 2014 £m £m £m £m
Operating (loss)/profit1 (3,913) – 7,672 3,759
Amortisation of acquired customer base and brand
intangible assets – – 551 551
Non-operating income and expense (149) – 149 –
Net financing costs (1,208) – 78 (1,130)
(Loss)/profit before taxation (5,270) – 8,450 3,180
Income tax credit/(expense)2 16,582 – (17,511) (929)
Profit for the financial year from continuing operations 11,312 – (9,061) 2,251
Profit for the financial year from discontinued operations 48,108 (48,108) – –
Profit for the financial year 59,420 (48,108) (9,061) 2,251
Attributable to:
– Owners of the parent 59,254 (48,108) (9,111) 2,035
– Non-controlling interests 166 – 50 216
Basic earnings per share from continuing and discontinued
operations 223.84p 7.69p
Note:
1 Adjustment primarily relates to the £6,600 million impairment loss relating to our businesses in Germany, Spain, Portugal, Czech Republic and
Romania and the £712 million loss on the deemed disposal of Vodafone Italy.
2 Adjustment includes the recognition of a deferred tax asset in respect of tax losses in Germany (£1,916 million) and Luxembourg (£17,402
million) and the tax liability related to the rationalisation and reorganisation of our non-US assets prior to the disposal of our stake in Verizon
Wireless (£2,210 million).

ADDITIONAL INFORMATION
32
Mobile customers - quarter ended 31 March 2015
(in thousands)
Country 1 January 2015
Net
additions/
(disconnections)
Other
movements 31 March 2015 Prepaid
Europe
Germany 31,515 (572) – 30,943 47.5%
Italy 25,507 (337) – 25,170 81.6%
UK1 19,853 262 (1,700) 18,415 35.2%
Spain2 14,811 (32) (600) 14,179 22.9%
91,686 (679) (2,300) 88,707 50.7%
Other Europe
Netherlands 5,180 (20) – 5,160 24.8%
Ireland 2,048 (37) – 2,011 53.0%
Portugal 5,207 (164) – 5,043 68.6%
Romania 8,016 40 – 8,056 58.1%
Greece 5,050 68 – 5,118 68.6%
Czech Republic 3,238 29 – 3,267 35.6%
Hungary3 2,670 5 66 2,741 44.7%
Albania4 1,968 (30) (238) 1,700 94.8%
Malta 309 2 – 311 81.0%
33,686 (107) (172) 33,407 54.6%
Europe 125,372 (786) (2,472) 122,114 51.8%
AMAP
India 178,676 5,127 – 183,803 93.3%
Vodacom5 68,953 (445) – 68,508 92.5%
247,629 4,682 – 252,311 93.1%
Other AMAP
Turkey 20,547 200 – 20,747 58.6%
Egypt 39,209 508 – 39,717 93.8%
New Zealand 2,330 32 – 2,362 63.5%
Qatar 1,414 30 – 1,444 88.9%
Ghana 7,051 90 – 7,141 99.7%
70,551 860 – 71,411 83.1%
AMAP 318,180 5,542 – 323,722 90.9%
Group 443,552 4,756 (2,472) 445,836 80.2%
Notes:
1 Other movements in the UK reflect the restatement of the customer base.
2 Other movements in Spain reflect the restatement of the customer base.
3 Other movements in Hungary reflect the acquisition of a local MVNO.
4 Other movements in Albania reflect the restatement of the customer base.
5 Vodacom refers to the Group’s interests in Vodacom Group Limited and its subsidiaries, including those located outside of South Africa.

ADDITIONAL INFORMATION
33
Fixed broadband customers - quarter ended 31 March 2015
(in thousands)
Country 1 January 2015
Net
additions/
(disconnections)
Other
movements 31 March 2015
Europe
Germany 5,357 93 – 5,450
Italy 1,756 46 – 1,802
UK 64 2 – 66
Spain 2,776 34 – 2,810
9,953 175 – 10,128
Other Europe
Netherlands1 56 11 (18) 49
Ireland 215 7 – 222
Portugal 299 31 – 330
Romania 40 3 – 43
Greece 475 18 – 493
Czech Republic 12 1 – 13
Hungary – – – –
Albania – – – –
Malta 2 (1) – 1
1,099 70 (18) 1,151
Europe 11,052 245 (18) 11,279
AMAP
India 4 1 – 5
Vodacom2 – – – –
4 1 – 5
Other AMAP
Turkey 67 30 – 97
Egypt 210 14 – 224
New Zealand3 424 (1) (14) 409
Qatar 7 – – 7
Ghana 28 – – 28
736 43 (14) 765
AMAP 740 44 (14) 770
Group 11,792 289 (32) 12,049
Notes:
1 Other movements in the Netherlands reflect the restatement of the customer base.
2 Vodacom refers to the Group’s interests in Vodacom Group Limited and its subsidiaries, including those located outside of South Africa.
3 Other movements in New Zealand reflect the restatement of the customer base.

OTHER INFORMATION
34
Definitions of terms
Term Definition
ARPU Average revenue per user, defined as mobile customer revenue and
mobile incoming revenue divided by average customers.
EBITDA Operating profit excluding share of results in associates, depreciation and
amortisation, gains/losses on the disposal of fixed assets, impairment
losses, restructuring costs and other operating income and expense. The
Group’s definition of EBITDA may not be comparable with similarly titled
measures and disclosures by other companies.
Adjusted operating profit Group adjusted operating profit excludes non-operating income from
associates, impairment losses, restructuring costs, amortisation of
customer bases and brand intangible assets and other income and
expense.
Mobile in-bundle revenue Represents revenue from bundles that include a specified number of
minutes, messages or megabytes of data that can be used for no
additional charge, with some expectation of recurrence. Includes
revenue from all contract bundles and add-ons lasting 30 days or more
as well as revenue from prepay bundles lasting seven days or more.
Mobile out-of-bundle Revenue from minutes, messages or megabytes of data which are in
excess of the amount included in customer bundles.
Mobile incoming revenue Comprises revenue from termination rates for voice and messaging to
Vodafone customers.
Operating free cash flow Cash generated from operations after cash payments for capital
expenditure (excludes capital licence and spectrum payments) and cash
receipts from the disposal of intangible assets and property, plant and
equipment, but before restructuring costs.
For the years ended 31 March 2015 and 2014 other items excluded
special one-off UK pensions contribution payments and KDG incentive
scheme payments.
Free cash flow Operating free cash flow after cash flows in relation to taxation, interest,
dividends received from associates and investments and dividends paid
to non-controlling shareholders in subsidiaries, but before restructuring
costs and licence and spectrum payments.
For the years ended 31 March 2015 and 2014 other items excluded
income dividends received from Verizon Wireless, Verizon Wireless tax
distributions received after the completion of the disposal, special UK
pensions contribution payments, interest paid on the settlement of the
Piramal option, KDG incentive scheme payments and payments in
respect of the Group’s historical UK tax settlement.
For definitions of other terms please refer to pages 211 to 212 of the Group’s annual report for the year ended 31
March 2014.

OTHER INFORMATION
35
1) Copies of this document are available from the Company’s registered office at Vodafone House, The Connection,
Newbury, Berkshire, RG14 2FN.
2) The preliminary results will be available on the Vodafone Group Plc website, vodafone.com/investor, from 19
May 2015.
Notes:
1. Vodafone, the Vodafone Portrait, the Vodafone Speechmark, Vodacom, M-Pesa and Vodafone One Net are
trademarks of the Vodafone Group. The Vodafone Rhombus is a registered design of the Vodafone Group. Other
product and company names mentioned herein may be the trademarks of their respective owners.
2. All growth rates reflect a comparison to the year ended 31 March 2015 unless otherwise stated.
3. References to “Q4” are to the quarter ended 31 March 2015 unless otherwise stated. References to the “second
half of the year” or “H2” are to the six months ended 31 March 2015 unless otherwise stated. References to the
“year” or “financial year” are to the financial year ended 31 March 2015 and references to the “prior financial
year” are to the financial year ended 31 March 2014 unless otherwise stated.
4. All amounts marked with an “*” represent “organic growth”, which presents performance on a comparable basis,
both in terms of merger and acquisition activity as well as in terms of movements in foreign exchange rates. For
the 2015 financial year, the Group’s organic service revenue growth rate has been adjusted to exclude the
beneficial impact of a settlement of an historical interconnect rate dispute in the UK, the beneficial impact of an
upward revision to interconnect revenue in Egypt from a re-estimation by management of the appropriate
historical mobile interconnection rate, and the adverse impact of an adjustment to intercompany revenue. The
adjustments in relation to Vodafone UK and Vodafone Egypt also impact the disclosed organic growth rates for
those countries.
5. Reported growth is based on amounts in pounds sterling as determined under IFRS.
6. Vodacom refers to the Group’s interest in Vodacom Group Limited (‘Vodacom’) in South Africa as well as its
subsidiaries, including its operations in the DRC, Lesotho, Mozambique and Tanzania.
7. Quarterly historical information, including information for service revenue, mobile customers, churn, voice usage,
messaging volumes, data volumes, ARPU, smartphones and fixed broadband customers, is provided in a
spreadsheet available at vodafone.com/investor. Copyright © Vodafone Group 2015

OTHER INFORMATION
36
Forward-looking statements
This report contains “forward-looking statements” within the meaning of the US Private Securities Litigation Reform Act of 1995 with respect to
the Group’s financial condition, results of operations and businesses and certain of the Group’s plans and objectives.
In particular, such forward-looking statements include, but are not limited to: statements with respect to: expectations regarding the Group’s
financial condition or results of operations, including the Group Chief Executive’s statement and Review of the year on pages 1 to 7 of this report
and the guidance for EBITDA and free cash flow for the 2016 financial year (and the related underlying assumptions) on page 8; expectations for
the Group’s future performance generally, including EBITDA growth and capital expenditure; statements relating to the Group’s Project Spring
investment programme; expectations regarding the operating environment and market conditions and trends, including customer usage,
competitive and macroeconomic pressures, price trends and opportunities in specific geographic markets; intentions and expectations regarding
the development, launch and expansion of products, services and technologies, either introduced by Vodafone or by Vodafone in conjunction with
third parties or by third parties independently, including Vodafone One Net, M-Pesa, and the launch of a number of additional features; growth in
customers and usage; expectations regarding spectrum licence acquisitions, including anticipated new 3G and 4G availability and the customer
uptake associated therewith; expectations regarding adjusted operating profit, EBITDA margins, capital expenditure, free cash flow, and foreign
exchange rate movements; expectations regarding the integration or performance of current and future investments, associates, joint ventures,
non-controlled interests and newly acquired businesses, including KDG, Ono and Neotel; and the outcome and impact of regulatory and legal
proceedings involving Vodafone and of scheduled or potential regulatory changes.
Forward-looking statements are sometimes, but not always, identified by their use of a date in the future or such words as “will”, “anticipates”,
“aims”, “could”, “may”, “should”, “expects”, “believes”, “intends”, “plans” or “targets” (including in their negative form). By their nature, forward-
looking statements are inherently predictive, speculative and involve risk and uncertainty because they relate to events and depend on
circumstances that may or may not occur in the future. There are a number of factors that could cause actual results and developments to differ
materially from those expressed or implied by these forward-looking statements. These factors include, but are not limited to, the following:
changes in economic or political conditions in markets served by operations of the Group that would adversely affect the level of demand for its
mobile services; greater than anticipated competitive activity, from both existing competitors and new market entrants, which could require
changes to the Group’s pricing models, lead to customer churn, affect the relative appeal of the Group’s products and services as compared to
those of its competitors or make it more difficult for the Group to acquire new customers; the impact of investment in network capacity and the
deployment of new technologies, or the rapid obsolescence of existing technology; higher than expected costs or capital expenditures; slower
than expected customer growth and reduced customer retention; changes in the spending patterns of new and existing customers and the
possibility that new products and services offered by the Group will not be commercially accepted or do not perform according to expectations;
the Group’s ability to expand its spectrum position or renew or obtain necessary licences, including for spectrum; the Group’s ability to achieve
cost savings; the Group’s ability to execute its strategy in fibre deployment, network expansion, new product and service roll-outs, mobile data,
enterprise and broadband and in emerging markets; changes in foreign exchange rates, including, in particular, changes in the exchange rate of
pounds sterling, the currency in which the Group prepares its financial statements, to the euro, the US dollar and other currencies in which the
Group generates its revenue, as well as changes in interest rates; the Group’s ability to realise benefits from entering into partnerships or joint
ventures and entering into service franchising and brand licensing; unfavourable consequences to the Group of making and integrating
acquisitions or disposals; changes to the regulatory framework in which the Group operates, including possible action by regulators in markets in
which the Group operates or by the EU to regulate rates the Group is permitted to charge; the impact of legal or other proceedings against the
Group or other companies in the mobile telecommunications industry; loss of suppliers or disruption of supply chains; developments in the
Group’s financial condition, earnings and distributable funds and other factors that the Board takes into account when determining levels of
dividends; the Group’s ability to satisfy working capital and other requirements through access to bank facilities, funding in the capital markets and
its operations; changes in statutory tax rates or profit mix which might impact the Group’s weighted average tax rate; and/or changes in tax
legislation or final resolution of open tax issues which might impact the Group’s tax payments or effective tax rate.
Furthermore, a review of the reasons why actual results and developments may differ materially from the expectations disclosed or implied within
forward-looking statements can be found under “Forward-looking statements” and “Principal risk factors and uncertainties” in the Group’s annual
report for the year ended 31 March 2014. The annual report can be found on the Group’s website (vodafone.com/investor). All subsequent written
or oral forward-looking statements attributable to the Company, to any member of the Group or to any persons acting on their behalf are expressly
qualified in their entirety by the factors referred to above. No assurances can be given that the forward-looking statements in this document will be
realised. Subject to compliance with applicable law and regulations, Vodafone does not intend to update these forward-looking statements and
does not undertake any obligation to do so.
For further information:
Vodafone Group Plc
Investor Relations Media Relations
Telephone: +44 7919 990 230 www.vodafone.com/media/contact
Copyright © Vodafone Group 2015
-ends-