newtable of content vol.i - nigerianstat.gov.ng
TRANSCRIPT

Federal Republic of Nigeria
National Bureau of
Statistics
Central Bank of Nigeria
2006 ANNUAL COLLABORATIVE SURVEY OF SOCIO-ECONOMIC
ACTIVITIES IN NIGERIA
JULY 2007
Collaboration between National Bureau of Statistics/Central Bank of Nigeria/Nigerian Communications Commission
FINAL STATISTICAL REPORT
VOLUME I

ii
TABLE OF CONTENTS
PAGE Table of Content …. …. …. ii-vii List of Table … …. …. viii-xiv List of Figure …. …. …. xv Goodwill Message …. …. …. xvi-xvii Foreword …. …. …. xviii Acknowledgement …. …. …. xx Preface …. …. …. xxi Executive Summary …. …. …. xxii-xxxi CHAPTER ONE 1.0 SURVEY DESIGN …. …. …. 1 1.1 Introduction …. …. …. 1 1.2 Objectives of the Survey …. …. 2 1.3 Scope and Coverage …. …. 2 National Integrated Survey of Household …. …. 2 National Integrated Survey of Establishment …. 2 System of Administrative Statistics …. 2 1.4 SURVEY INSTRUMENTS …. …. 3 National Integrated Survey of Household …. …. 3 National Integrated Survey of Establishment ….. 3 System of Administrative Statistics …. …. 3 1.5 SAMPLE DESIGN …. …. 4 NISH Sample Design …. …. 4 NISE Sample Design …. …. 4 SAS Sample Design …. …. 4 1.6 TRAINING …. …. …. 5 1.7 DATA COLLECTION ARRANGEMENT …. …. 5 1.8 QUALITY CONTROL AND RETRIEVAL OF RECORDS …. 5 1.9 DATA PROCESSING/ANALYSIS PLAN …. …. 6 1.10 REPORT WRITING ARRANGEMENT …. …. 6 1.11 WORK PROGRAMME …. …. 6 CHAPTER TWO 2.0 NATIONAL INTEGRATED SURVEY OF HOUSEHOLDS …. 7 2.1 General Household Survey: …. …. 7 2.1.1 Population Composition …. …. 7 2.1.2 Household Characteristics …. …. 7
Distribution of Population by Age Group and Gender …. 7 Distribution of Household by Headship and Household Size …. 8 Marital Status …. …. 9
2.1.3 WATER AND SANITATION: …. ….
Safe and Unsafe Drinking Water …. …. 9 Distribution of Household by Distance to Source of Water …. 11
Distribution of Household by Type of Refuse Disposal …. 11 Distribution of Household by Toilet Facilities …. 12 Distribution of Household by Distance of Toilet Facilities to Dwelling 13 Distribution of Household by Type of Housing Unit …. 14

iii
Distribution of Household by Source of Fuel …. 14 Distribution of Household by Electricity Supply …. 14 Distribution of Household by Tenure Pattern …. 14 2.1.4 HOUSEHOLD INCOME AND EXPENDITURE 15
Distribution of Household Income …. …. 15 Distribution of Household Expenditure …. …. 15
2.1.5 EDUCATION
Youth Literacy Rate …. …. 16 Adult Literacy Rate …. …. 16
2.1.6 EMPLOYMENT …. …. …. 16
Unemployment Rate …. …. …. 16 Distribution of Employment Persons by Hours of Work …. 17
Distribution of Employed Persons by Industry …. 17 Distribution of Persons Engaged in Voluntary or Social work …. 17 2.1.7 FEMALE CONTRACEPTIVE 18
Distribution of Pregnant Women by Clinic Registration and Anti-Tetanus 18 Reception …. …. …. 18 Distribution of Women by Family Planning Method …. 18
2.1.8 HEALTH Birth in the last 12 months …. …. 18
Birth Weight of Children …. …. 19 Children Immunization …. …. 19 Children Breastfeeding …. …. 19 Death in the Last 12 Months …. …. 20
2.1.9 HOUSING PROJECT 20 Building Project Embark upon …. …. 20 Stage of Completion of Building …. …. 20
2.1.10 INFORMATION AND COMMUNICATION TECHNOLOGY
Distribution of ICT (Radio) by Household…. …. 20 Distribution of ICT (Television) by Household …. 21 Distribution of ICT (Fixed Telephone) by Household …. 21 Distribution of ICT (Mobile Telephone) by Household …. 21 Distribution of ICT (Personal Computer) by Household …. 22 Distribution of ICT (Internet Service) by Household …. 22 Distribution of ICT (Radio) by Persons …. …. 23 Distribution of ICT (Television) by Persons …. …. 23 Distribution of ICT (Fixed Telephone) by Persons …. 23 Distribution of ICT (Mobile Telephone) by Persons …. 24 Distribution of ICT (Personal Computer by Persons …. 24 Distribution of ICT (Internet Service) by Persons …. 24 Distribution of Television Viewers by Station of First Preference …. 25 Distribution of Television viewers by most preferred station 25 Distribution of ICT Equipments Owned …. 26 Distribution of owners of ICT Equipments by number owned and state 26 Distribution of persons who had Access to ICT Equipments by source 27 Distribution of Daily Income Generated by ICT umbrella and Business centre of Access 27

iv
2.2 PRIVATE FARMERS …. …. 27 2.2.1.1 Number of persons Engaged in Agriculture 27 2.2.2.2 Area and Production Major crops …. …. …. 2.2.2.3 Farm gate prices (Major Crops) …. …. …. 29 2.2.2.4 Distribution (absolute) of crop farmers by market channel 29
and state 2006 2.2.2.5 Distribution (absolute) of crop farmers by problems encountered
during savage and by state (2006) …. …. …. 29 2.2.2.6 Distribution (absolute) of crop farmers by problems encountered during production process and state 2006 30 2.2.2.7(a) Distribution of crop farm by access to any ICT facility by state 2006 30 2.2.2.7(b) Distribution of crop farmers by possession of any ICT facility by state, 2006 30
CHAPTER THREE .... …. ….
3.0 NATIONAL INTEGRATED SURVEY OF ESTABLISHMENTS ….
3.1 Wholesale and Retail Trade …. …. 79 Number of Person Engaged …. …. 80 Emolument of employees …. …. 80
Cost of goods sold …. …. 80 Value of Sales …. …. 80 Gross Margin …. …. 80 Cost of operations …. …. 80 Total Working Capital …. …. 80
3.2 Hotel and Restaurants …. …. 81
Employment …. …. 82 Emolument …. …. 82
Income from Accommodation: Nigerian Guests. …. 82 Income from Accommodation: Non-Nigerian Guests …. 82 Capacity Utilization …. …. 82 Number of Lodger Nights …. …. 82 Number of Lodger Rooms … …. 82 Number of Lodger Beds …. …. 82 Number of Lodger Tourists …. …. 82 3.3 Building and Construction …. …. 83 Number of Persons Engaged …. …. 84 Emolument of Employees …. …. 84 Value of Work Done …. …. 84 Total Working Capital …. …. 84
3.4 Manufacturing Industry …. …. 85 Employment …. …. 86 Emolument of Employees …. …. 86 Value of Sales …. …. 86 Operating Cost …. …. 86 Capital Expenditure …. …. 86 Capacity Utilization …. …. 86

v
3.5 Mining and Quarrying …. …. 87 Employment …. …. 88 Operatives …. …. 88 Emolument of Employees …. …. 88 Mineral Production …. …. 88 Cost of Production …. …. 88 3.6 Private Professional Services …. …. 89 Employment …. …. 90 Emolument of Employees …. …. 90 Operating Expenses …. …. 90 Total receipts …. …. 90 Total Working Capital …. …. 90
3.7 Organized Road Transport Operators Employment …. …. 91 Emolument …. …. 92 Gross Addition to Fixed Assets …. …. 92 Operating Cost …. …. 92 Total Receipts …. …. 92
Total Fleet …. …. 92 3.8 Balance of Payments …. …. 93
Total Receipts and Payments …. …. 93 3.9 Corporate Non-Financial …. 94 Agriculture, Minning and Quarrying …. …. 95 Building and Construction …. …. 95 Manufacturing and Processing …. …. 95 Trading and Business Services …. …. 95 Transport and Communication …. …. 95 3.10 Modern Agricultural Holdings …. …. 96
Area and Production of Crops …. …. 96 Number of Livestock by Type and Sex …. …. 97
3.11 Information and Communication Technology (ICT) …. 98 Manufacturing Sector …. …. …. 98 Building and Construction …. …. 98 Organised Road Transport Operations …. …. 98 Private Professional Services …. …. 98 Wholesale and Retail Trade …. …. 98 CHAPTER FOUR …. …. …. 99
4.0 SYSTEM OF ADMINISTRATIVE STATISTICS …. 99
4.1 Water Board Statistics …. …. …. 99 Total Volume of Available Water by Use …. 99 Tariffs and State Government Allocations to Water Board …. 100 4.2 Water Resources …. …. …. 100 Local Government …. …. …. 100 Tax Revenue …. …. …. 100 Statutory Allocations …. …. …. 100
vi
Recurrent Expenditure …. …. …. 100 Capital Expenditure …. …. …. 101 4.3 Fiscal Operation of Sub-National Governments …. 101 A. State Governments …. …. 101 Internally-Generated Revenue …. …. 101 Statutory Allocations …. …. 101 Capital Expenditure …. …. 102 Recurrent Expenditure …. …. 102 Summary of Recurrent Expenditure …. …. 102 4.4 Cooperative Societies …. …. 103 Types and Numbers of Agricultural Cooperatives …. 103
Internally Generated Fund 4.5 Housing Statistics …. …. 103 Housing Statistics
Land Allocation by purpose sex …. …. 103 4.6 Health Statistics …. …. 104 4.6.1 Number of Hospitals by Type …. …. 104 4.6.2 Beds by Hospital Type …. …. 105 4.6.3 Patient by Hospital Type …. …. 105 4.6.4 Health Personnel by sex …. …. 105 4.7. Education Statistics …. …. 4.7.1 Education Institutions by ownership 106 4.7.2 Teaching Staff in Educational Institutions 106 4.7.3 Pupils/Students in Public and Private Schools 106 4.8 Vehicle Registration …. …. 106 4.8.1 Vehicle Registration by ownership …. …. 107 4.8.2 Vehicle Registration by Type …. …. 107 4.8.2.1 Commercial vehicle …. …. 107 4.8.2.2 Private vehicles 107 4.8.2.3 Government vehicles …. … 107 4.8.3 Access and Use of Information and Communication (ICT) Facilities 108
4.10 Unemployment Statistics Professionals and Executives …. …. 108 Lower Grade …. …. 108 Trade Dispute …. …. 109 Unemployment (Cost of operations) …. …. 109 Unemployment (ICT) 109 4.11 Research Institute 109
Sources of Fund …. …. 109 Employment …. …. 109 Information and Communication Technology …. 110

vii
4.12 National Directorate of Employment New Beneficiaries …. …. 110 Amount spent on Loan Loan Recovery …. …. 110 CHAPTER FIVE …. …. 5.0 TRADE …. …. 112 Merchandise Trade …. …. 112 Balance of Trade …. …. 112 IMPORT …. …. 112 5.3 EXPORT …. …. 5.4 DIRECTION OF CRUDE OIL EXPORTS …. …. 5.6 TERMS OF TRADE INDEX …. …. 112 All Commodity Index …. …. 113
CHAPTER SIX …. …. 6.0 PRODUCER PRICE INDEX …. …. 114 Producer Price Index Concepts …. …. 114
Product Weight …. …. 115 Classification Adopted …. …. 115
Problem of Calculation …. …. 115 January to December 2006 Survey …. …. 115 Comparing the Price changes in the PPI and CPI …. 116 CHAPTER SEVEN 7.0 NATIONAL ACCOUNTS …. …. 118 Quarterly Gross Domestic Product (GDP) …. 118
Sources of Data …. …. 118 Producing the Estimate …. …. 119 Quarterly GDP Estimates at both Current and Constant (1990) Prices
CHAPTER EIGHT 8.1 Overall Assessment …. …. 123
APPENDICES Appendix I: Statistical Tables …. …. 124 Appendix II NISH Sample Design …. …. 381 Appendix III: NISE Sample Design …. …. 383 Appendix IV: NISH Definition and Concepts` …. …. 386 Appendix V: NISE Definition and Concepts …. ….

viii
LIST OF TABLES
TABLE TITLE PAGES CHAPTER I: SURVEY DESIGN 1.1 List of Questionnaire by Type and Reference Number………………….. 124 1.2 Stratification of FHUs into Crop Farming C), Livestock Keeping (L) And Fishing (F) Housing Units ………………………………………………. 125 1.3 2006 Status Returns on Economic Surveys Summary …………………… 126 1.4 Status Returns of Economic Survey …………………………………… 127-132 1.5 Status of Returns on System of Administrative Statistics (SAS) ………. 133-135 1.6 Retrieval Status of GHS Records …………………………………………. 137 1.7 Retrieval Status of Agricultural Survey of Private Farmers………….. 138 1.8 Status of Returns on System of Administrative Statistics as at May 2007 139 1.9 Work Programme: NBS/CBN/NCC Collaborative Surveys…………….. 140 CHAPTER II: SOCIO-DEMOGRAPHIC STATISTICS 2.1.2.1 Percentage Distribution of Persons by State, Gender and Age Group (June 2006)……………………………………………………………….. .. 141 2.1.2.2 Percentage Distribution of Household Head by State, Gender and Household Size, (June 2006)………………………………………………. 142 2.1.2.3 Percentage Distribution of Persons by Marital Status, State, Sector and Gender, (June 2006) …………………………………………….. 143 2.1.3.1 Percentage Distribution of Households by Major Source of Water for Drinking and Cooking, State and Sector, (June 2006)…………………….. 144 2.1.3.2 Percentage Distribution of Households by Distance to Source of Water,
State and Sector, (June 2006)…………………………………………….. 145 2.1.3.3 Percentage Distribution of Households by Type of Refuse Disposal, State
and Sector, (June 2006)……………………………………………………. 146 2.1.3.4 Percentage Distribution of Households by Type of toilet Facilities to
and State (June 2006)……………………………………………….. 147 2.1.3.5 Percentage Distribution of Households by Distance of Toilet Facilities to Dwelling and State (June 2006)………………………………………………… 148 2.1.3.6 Percentage Distribution of Households by Type of Housing Unit, State and
Sector (June 2006)………………………………………………………………. 149 2.1.3.7 Percentage Distribution of Households by Type of Fuel used for cooking,
State and Sector (June 2006)……………………………………………….. 150 2.1.3.8 Percentage Distribution of Households by Electricity Supply, State and
Sector (June 2006) ………………………………………………………….. 151

ix
2.1.3.9 Percentage Distribution of Households by Type of Housing Tenure, State and Sector (June 2006)…………………………………………… 152
2.1.4.1 Percentage Distribution of Households by Income/Allowances, State and Sector (June 2006)…………………………………………… 153
2.1.4.2 Percentage Distribution of Households by Item and Expenditure (June 2006) 154 2.1.5.1 Youth Literacy Rate in Any Language by state, sector and Gender for
persons 15-24 years (June 2006)………………………………………… 155
2.1.5.2 Adult Literacy Rate in any Language by state, sector and Gender for persons 15-24 years (June 2006)……………………………………………… . 156
2.1.6.1 Unemployment Rates by State (June 2006)………………………………….. 157 2.1.6.2 Distribution of Employed Persons by Hours of work by Sector and
Gender (June 2006)…………………………………………………………….. 158 2.1.6.3 Distribution of Employed Persons by Industry, Sector and Gender (June 2006) ………………………………………………………………… 159 2.1.6.4 Distribution of Employed Persons by Engagement in Voluntary on
Social Work, Hours of Work, Sector and Gender (June 2006)………… 160
2.1.7.1 Percentage Distribution of Pregnant Women by State, Registration with Clinic, Received Anti-tetanus and Number of monthly Visit
to Clinic (June 2006) …………………………………………… 161
2.1.7.2 Percentage Distribution of Women aged 15-49 year by Method of Family Planning used and sector (June 2006)………………………………… 162 2.1.8.1. Percentage Distribution of Births in the last 12 months by state, sector
and Gender (June 2006)………………………………………………… 163
2.1.8.2 Percentage Distribution of Births by state, zone, weight and Gender
in Kg (June 2006)………………………………………………………… 164 2.1.8.3 Percentage Distribution of Children (one year or less) by State and
Immunization status and Gender (June 2006)………………………… 165 2.1.8.4 Percentage Distribution of Children (less than 1 year) by State and Reason
for not getting Colostrums (first yellow milk) (June 2006)…………… 166
2.1.8.5 Percentage Distribution of Deat6hs in the last 12 month’s by state, sector and Gender/2006 ……………………………………………………… 167
2.1.9.1 Percentage Distribution of Persons by Type of Building embarked upon, State and Sectors (June 2006)…………………………………………… 168
2.1.9.2 Percentage Distribution of Persons by stage of completion of building, state as sector June 2006 169

x
2.1.10.1 Percentage Distribution of Household Ownership and Access to ICT (Radio) by State and Sector (June 2006)……………………………… 170
2.1.10.2 Percentage Distribution of Household Ownership and Access to ICT
(Television) by State and Sector (June 2006)…………………………… 171 2.1.10.3 Percentage Distribution of Household Ownership and Access to ICT
(Fixed Telephone) by State and Sector (June 2006)……………………….. 172 2.1.10.4 Percentage Distribution of Household Ownership and
Access to ICT (Telephone) Mobile by State and Sector (June 2006)……. 173 2.1.10.5 Percentage Distribution of Household Ownership and Access to ICT
(Personal Computer) by State and Sector (June 2006)………………… 174 2.1.10.6 Percentage Distribution of Household Ownership and Access to ICT
(Internet Service) by State and Sector (June 2006)……………………… 175 2.1.10.7 Distribution of Individual Ownership and Access to ICT (Radio) by
State and Sector (June 2006)………………………………………………… 176 2.1.10.8 Distribution of Individual Ownership and Access to ICT (Television)
by State and Sector (June 2006)…………………………………………… 177 2.1.10.9 Distribution of Individual Ownership and Access to ICT
(Fixed Telephone) by State and Sector (June 2006)……………………… 178 2.1.10.10 Distribution of Individual Ownership and Access to ICT
(Mobile Telephone) by State and Sector (June 2006)……………………… 179 2.1.10.11 Distribution of Individual Ownership and Access to ICT
(Personal Computer) by State and Sector (June 2006)……………………. 180 2.1.10.12 Percentage Distribution of Individual Ownership and Access to ICT
(Internet) by State and Sector (June 2006)……………………………………. 181 2.1.10.13 Distribution of Television Viewers by First Preference Station…………….. 182 2.1.10.14 Distribution of Television Viewers by most Preferred Station………………. 183 2.1.10.15 Distribution of Persons by Type of ICT Equipments Owned
and State (June 2006)…………………………………………………… 184 2.1.10.16 Percentage Distribution of ICT Equipments by Number Owned
(June 2006)…………………………………………………………… 185 2.1.10.17 Percentage Distribution of Persons by Source of Access to ICT
Equipments (June 2006)…………………………………………………… 186
2.2.1.1 Number of Persons Engaged in Crop Farming by Type and Sex
(in thousand) 2006…………………………………………………………. 187 2.2.1.3 Farm gate prices in Naira per kilogram 188

xi
2.2.1.4 Distribution of crop farmers by market channel and state 2006 189 2.2.1.5 Distribution (absolute) of crop farmers by problems encountered during
storage and by state 2006 190 2.2.1.6. Distribution (absolute) of crop farmers by problems encountered
during production process and by state, 2006 191 2.2.1.7a Distribution (absolute) of crop farmers by access to any ICT facility by State 2006 192-194 2.2.1.7b Distribution (absolute) of crop farmers by possession of any ICT facility
by state by State 2006 195-197
2.2..1.8a Area Planted of Major Crops by State 2006 198 2.2.1.8b Production of Major Crops by State 199 2.2.2..1 Distribution of livestock farmers by source and type of input, 2006 200 2.2.2.2 Number of persons Engaged in Livestock farming by sex 2006 201-202 2.2.2.3 Stocks and changes in stocks of Livestock by type 2006 203 2.2.2.4 Diary product: Quantity and value by type 2006 203 2.2.2.5 Prices of livestock, product by type 2006 204 2.2.2.6 Funds committed to livestock farming by source 2006 205 2.2.2.7 Number of livestock processing facilities by type and capacity 2006 206 2.2.2.8 Distribution of Livestock Farmers by Market Channel, 2006 206 2.2.2.9 Comparison of Livestock Farming Season between 2006 and 2005 207 2.2.2.10 Livestock Farmers Expectations for 2007 Season by factor 207 2.2.2.11 Distribution of Livestock Farmers by “Problems Encountered in Purchasing Livestock inputs………………………………………………. 208 2.2.2.12 Distribution of Livestock farmers by “government assistance required”2006 209 2.2.2.13 Distribution of Livestock farmers by ways that can improve livestock Activities, 2006……………………………………………………………….. 209 2.2.2.14 Distribution of livestock farmers by problem encountered during marketing 209 2.2.2.15a Distribution of Livestock Farmers by Possession of any Information And Communication Technology Facility………………………………… 210 2.2.2.15b Distribution of Livestock Farmers by Possession of any Information
and Communication Technology Facility………………………………… 212

xii
2.2.3.1 Distribution of Households by Type of fishing sites 214 2.2.3.2 Number of Persons Engaged in fish farming by sex, 2006………………… 215 2.2.3.3 Distribution of Household by Pond Capacity 2006…………………………. 215 2.2.3.4 Quarterly Fish Production by Type, 2006……………………………………. 216 2.2.3.5 Distribution of Fish Holdings by Source of Input, 2006…………………… 216 2.2.3.6 Quantity of Fish sold by Type and Quarters, 2006………………………. 217 2.2.3.7 Expenditure by Type Quantity and Value, 2006……………………………. 217 2.2.3.8 Available funds by source, 2006……………………………………………… 218 2.2.3.9 Fish Processing Facilities by Capacity, 2006……………………………… 218 2.2.3.10 Fish Storage Facilities by Capacity, 2006………………………………… 218 2.2.3.11 Distribution of fish farmers by market channel, 2006…………………… 218 2.2.3.12 Comparison of 2005 Fishing season with 2006……………………… 219 2.2.3.13 Fish Farmers expectation in 2006 fishing season……………….. 219 2.2.3.14 Distribution of Fish farmers by “desired government assistance”, 2006 219 2.2.3.15 Distribution of Fish Farmers by Problems Encountered when
Purchasing Fishing Tools, 2006…………………………………………. 220 2.2.3.16 Distribution of Holders by Problems Encountered During
Production Process, 2006………………………………………………. 220 2.2.3.17 Distribution of Holders by Problems Encountered During Storage
Process, 2006…………………………………………………………….. 220 2.2.3.18 Distribution of Holders by Problems Encountered During
Marketing, 2006…………………………………………………………... 221 2.2.3.19a Distribution of Holders by Access to Information and Communication
Technology Facility, 2006……………………………………………... 222 2.2.3.19b Distribution of Household by Possession of Information and
Communication Technology Facility, 2006…………………………... 224-227 2.2.3.20 Summary of Data on ICT Access and Ownership…………………. 228 CHAPTER III: NISE 3.1.1 Whole sale and Retails Trade……………………………………………….. 229 3.2.1 Hotels and Restaurants………………………………………………………. 230 3.3.1 Building and Construction……………………………………………………. 231 3.4.1 Manufacturing ………………………………………………………………… 232

xiii
3.4.2 Capacity Utilization……………………………………………………………. 233 3.5.1 Mining and Quarrying………………………………………………………… 234 3.6.1 Private Professional Services………………………………………………. 235 3.7.1 Organized Private Road Transport Operators……………………………. 236 3.8.1 Petroleum Sector (Oil and Gas)……………………………………………. 237 3.9.1 Corporate non-financial Sector (Non-Oil)………………………………… 238 3.9.2 Corporate non-financial Sector (Foreign Private)………………………… 239 3.10.1 Area Cultivated and Production by Crop………………………………….. 240 3.10.2 Livestock by Type of Modern Agricultural Holding………………………. 241 3.11.1 ICT Indicator (NISE)………………………………………………………… 242 CHAPTER IV: SAS 4.1.1. Volume of water available for domestic industrial and other purpose. 243 4.1.2. Water board tariffs 246 4.1.3. State govt. allocation to water board 247 4.1.4. Employment 248 4.1.5. Cost of operation 249-257 4.1.6. State water board (ICT) 258-259 4.2.1 Value of contracts by project 260-268 4.2.2 Amount spent on projects by type 265-268 4.2.3 Percentage of completion by project type 269-272 4.2.4 Employment size 273 4.2.5 Capital expenditure by type 274 4.2.6 Water resources (ICT) 276 4.3.1 Opening/Closing balances 277 4.3.1 Internally generated revenue by source 278-280 4.4.1 Type and membership of cooperative societies 281 4.4.2 Sources of fund 282-288 4.4.3 Fund utilization 2289-
290 4.4.4 ICT 291 4.4.5 ICT 292 4.5.1 Number of applications/approval (Private Individuals) 293 4.5.2 Number of applications/approval (Corporate bodies) 295 4.5.3 Number of applications/approval (Government) 296 4.5.4 ICT of applications/approval (NGO) 297 4.5.5 Number of applications/approval (Residential) 298 4.5.6 Number of applications/approval (Commercial) 299 4.5.7 Number of applications/approval (Industrial) 301 4.6.1 Number of hospitals by type 306 4.6.2 Number of hospital beds by type of hospital 308 4.6.3 Number of patients by type 311 4.6.4 Health personnel by type & sex 315 4.6.5 Health training institutions by type 322 4.6.6 Children immunization by type 324

xiv
4.6.7 Finances 326 4.6.8 Compensation of employees 329 4.6.9 Capital expenditure by type 330 4.6.10 ICT 333 4.7.1 Educational institutions, public/private 335 4.7.2 Number of teachers by type of institution 336 4.7.3 Number of pupil by type of institution 337 4.7.4 Sources of fund 339 4.7.5 Cost of operation 341 4.7.6 Capital expenditure 342 4.7.7. ICT 343 4.8.1 Vehicle Registration by type & purpose 344 4.8.2 ICT 345 CHAPTER V: TRADE 5.1 Summary of Foreign Trade (N’000)……………………………………….. 346 CHAPTER VI: PRICES 6.1 Producer Price Index (Base June 2004) 362 6.2 Producer Price Index (Grouping of Commodities at 4-digit Level of ISIC 364 6.3 Producer Price Index(June 2004 = 100) Commodity Group at 4-digit Level 365
Month to Month Percent Change CHAPTER VII: NATIONAL ACCOUNTS 7.4.1 Gross Domestic Product at Current Basic Prices (N’ Million) …………… 366 7.4.2 Gross Domestic Product at 1990 Constant Basic Prices (N Million)’ ………… 367 7.4.3 Implicit Price Deflators…………………………………………………………….. 368 7.4.4 Gross Domestic Product at Current Basic Prices Percentage Distribution 370 7.4.5 Gross Domestic Product at 1990 Basic Prices Percentage Distribution 371 7.4.6 Further Analysis of Gross Domestic Product at Current Basic Prices………. 372 7.4.7 First and Second Quarter GDP Estimate for 2006……………………… …… 374

xv
LIST OF FIGURES FIGURES TITLE PAGE CHAPTER II: SOCIO-DEMOGRAPHIC STATISTICS 2.1.2.1 Percentage Distribution of Person by Age Group and Gender 8 2.1.3.1 Percentage Distribution of Households by Safe Water 10 2.1.3.2 Percentage Distribution of Households by Unsafe Water 10 2.1.3.3 Percentage Distribution of Household by Satisfactory Refuse 12 Disposal System 2.1.3.4 Percentage Distribution of Household by Unsatisfactory Refuse 12 Disposal System 2.1.3.5 Percentage Distribution of Household by Type of Toilet (Conventional) 13 2.1.3.6 Percentage Distribution of Household by Type of Toilet (Unconventional) 13 2.1.3.7 Percentage Distribution of Television Viewers by First Preference Station 25 2.1.3.8 Percentage Distribution of Television Viewers by Most Preferred Station 26
CHAPTER IV: SAS 4.1 Volume of Water Available by Quarters 99 4.2 Local Government Tax Revenue 2006 100 4.3. Capital Expenditure of the Local 101 4.4 Percentage Distribution of Internal Generated Revenue of State Government 101 4.5 Capital and Recurrent Expenditures of the State Governments (2006) 102 4.6 Summary of Recurrent Expenditures of the State Government (2006) 4.7 Land allocation by approval by purpose and sex 104 4.8 Hospital Beds by Type of Hospital 105 4.8.1 Vehicle registration by ownership 107 CHAPTER V: TRADE 5.1 Merchandise Trade 5.2 Balance of Trade CHAPTER VI: PRICES 6.1 Producer Price Index 117 CHAPTER VII: NATIONAL ACCOUNTS 7.4.1 Level of Quarterly GDP at Current Prices 2004-2005 121 7.4.2 Level of Quarterly GDP at 1990 Constant Prices 121 7.4.3 Growth in Corresponding Quarter of GDP at 1990 Constant Prices 2005 over Corresponding Quarters of 2004 122 7.4.4 Growth in Oil and Non-oil Sectors of GDP at 1990 Constant 122
Prices, 2005

xvi
GOODWILL MESSAGE

xvii

xviii
FOREWORD I am happy with the consistence and sustenance of the Statistical Report of the annual collaborative survey of Socio-Economic Activities. It is now institutionalized as one of the key modular surveys of National Bureau of Statistics and providing quarterly and annual main indicators of the socio-economic characteristics of Nigeria. These array of indicators produced annually through collaboration had been able to address the weaknesses in provision of indicators and statistics for policy formulation, monitoring and evaluation of government programmes and policies at both national and sub-national level. The 2006 Annual collaborative survey of Socio-Economic Activities Report in Nigeria is the third edition consequent on the collaboration between three key agencies: National Bureau of Statistics (NBS), Central Bank of Nigeria (CBN) and the Nigerian Communications Commission (NCC). The collaboration had enhanced production of credible, quality and useable data because of high level of professionalism involved, good statistical practices and integrated statistical outputs so generated for public and private use. The National Bureau of Statistics, is already building confidence on the quality and credibility of her products and already making plans to raise the bar or standard higher. A lot of improvements had been incorporated into survey instruments in terms of converting them into scannable formats to enhance quick data processing and analysis. The standard of ICT had improved tremendously in the system which further helped data processing and report writing capability, documentation and archiving of statistical and outputs. The findings and results of the survey are presented based on the three survey infrastructures of NBS namely, National Integrated Survey of Establishments (NISE) and System of Administrative Statistics (SAS). The presentation is however organized into eight (8) chapters while the executive summary discussed the commentary of key findings. I wish to appreciate the strengthening of the collaborative relationship of the three agencies and hopefully in future it will be extended to other Ministries, Departments and Agencies (MDAs) for the good of the Nigerian Statistical System. I profusely thank the Governor, Professor Charles Soludo of Central Bank of Nigeria for his continued support in advancing the cause of better statistics in Nigeria in terms of technical and funding support. I also want to recognize the Director of Research and Statistics (Mr. Mordi), Messrs C. M. Anayanwu and C. M. Okafor all of Central Bank of Nigeria. The management of Nigerian Communications Commission and her team officers are also commended. The following key officers who are my members of my staff are also appreciated for the able way they managed the project: Messrs G. O. Adewoye (Director, Censuses and Surveys) G. C. Nweze (Director, Social and Economic Analysis), F. B. Ladejobi (Deputy Director, Field Services and Methodology) and Mrs. A. N. Adewinmbi (Deputy Director, Computer Management and Information Services).

xix
The report presented two volumes provide more enriching information for better analysis of the economy and also address the weaknesses in the previous two reports. Your comments for further enrichment of future surveys will be highly appreciated. Dr. V. O. Akinyosoye, Director-General/Chief Executive Officer National Bureau of Statistics, Abuja. July, 2007

xx
ACKNOWLEDGEMENTS

xxi
PREFACE

xxii
EXECUTIVE SUMMARY
1.0 INTRODUCTION
The 2006 annual collaborative Survey of Socio-Economic Activities in Nigeria is a follow-up of the 2005. The survey was a further improvement over the previous round in that the scope was enlarged to meet more mandates of the three agencies. The survey was jointly implemented by the National Bureau of Statistics, the Central Bank of Nigeria and the Nigerian Communication Commissions between February to June 2007. The survey which cut across the three survey infrastructures of NBS had enabled the three collaborating agencies fulfilled their key mandates in the production of current, timely and credible statistics to monitor and evaluate the current status of the economy and various government programmes, such as the National Economic Empowerment and Development Strategy (NEEDS) and the Millennium Development Goals (MDGs). The project produced series of socio-economic data through households and establishments, and also through the compilation of administrative data sets from public and private institutions. The results and findings from the survey were adequate, credible and current for meaningful monitoring and evaluation of programmes and policies and also for policy formulation at national and sub-national levels.
1.1 Socio-Demographic Statistics
The General Household Survey was designed to provide Statistical Information on socio-demographic conditions of the members of households in Nigeria. The results revealed, the following key findings on distribution and disparity patterns of the surveyed households. Household Population Composition and Demography: The weighted population of households covered was 30,542,246. The Characteristics of household respondent showed that male headed households constituted 83.5 percent, while female heads 16.5 percent. Population Distribution: Persons aged 5-14 years had the highest population of 28.2 percent. Economically active persons in age group 15-59 years constituted 52.1 percent. Elders in age group 60 years and above constituted 6.5 percent of the national figure. Average persons per household was 4.6
Marital Status: The results indicated that 63.4 percent of the4 covered populations were married while 29.2 percent were never married.

xxiii
Water and Sanitation Major source of Water for Drinking and Cooking: The study showed that 46.4 percent of the covered households had access to safe water. Refuse Disposal: The results showed that 6.5 percent of all households had access to satisfactory refuse Disposal System. Toilet Facility About 47.0 percent of the households used conventional toilets, while unconventional toilets constituted 53.1 percent. Type of fuel used for cooking: Eighty two percent of the households used firewood for cooking, while 0.5 percent used gas cooker and kerosene (15.0 percent) Type of Electricity Supply: Only 42 percent of the households had access to electricity supply by Power Holding Commission of Nigeria (PHCN). Household ownership and Access to Information and Communications Technology (ICT). The results showed that 77.1 percent of the households in Nigeria owned ratio set, while 84.0 percent had only access to radio. Twenty seven percent of the households owned Television, while 40.0 percent only had access to it. About 1.0 percent owned fixed Telephone, while 4.9 percent had access to the facility. The results also showed that 24.9 percent of the households owned Mobile Telephone, while 18.9 percent had access to it. About 1.0 percent of the households owned personal Computer, while 5.2 percent had just access to it. Only 0.1 percent owned Internet Service, while 4.0 percent had access to it.
1.2 AGRICULTURAL STATISTICS Private farmers are farmers who employ traditional methods in their farming activities. They are grouped into three mainly: Crop, Livestock and fishing. Private farmers are household based and differ from modern agricultural holders who are registered with the Corporate Affairs Commission, keep records and use modern agricultural equipment.

xxiv
CROP FARMING: Maize had the highest land area cultivated among the major crops grown in Nigeria with a figure of 4,670 thousand hectares. This was closely followed by Guinea Corn 4,578 thousand hectares and Millet 4,270 thousand hectares. Cassava had the highest crop production in 2006, with production figures of 38,041 thousand tonnes, yam 28,280 thousand tonnes and melon had the least figure of 357 thousand tonnes. Thirty seven percent of the total persons engaged in farming activities are female. 23 percent are working proprietors, 47 percent unpaid family member 28 percent paid employee and a mere 2 percent were apprentices. About 99,138 thousand tonnes was the total production of eleven major crops in 2006. Cassava constituted 38.37 percent, Yam 28.53 percent and least was melon 0.40 percent. Farmgate prices were available for the eleven major crops. Average price per kilogram was highest for Melon N39.68 and cotton N33,44 while Rice was N25.84. Most farmers solo their product through open market. The major problems confronting crop farmers are lack of funds, better infrastructure such as roads, seedling (improved) and good weather. LIVESTOCK FARMING: A total of thirty Seven million (67.15 percent) were males engaged in livestock farming as against Eighteen million females (32.85 percent). Total livestock population increased from 64 million to 83 million. Goats constituted about 56.31 percent increase, followed by sheep N5,205. A crate of egg solo for N362 and chicken price was N700.00 Funds available for livestock farming in 2006 to totaled N79 billion “Own Funds” constituted the highest proportion of 90.46 percent. Most farmers solo their livestock in the open market only a few animals were sent direct to Industry 0.8 percent. FISH FARMING: Of the total fish farmers in Nigeria, 92,562 farmers fished in ponds, 1,038,042 or 47 percent fished in Rivers while 126,135 (13 percent) fished in the Ocean. Quarterly fish production rose from 4 million kilogram in the first quarter to 25 million kilogram at the end of the fourth quarter of 2006. Total value of fish sold rose from N373 million in the 1st quarter to N458 million in the third quarter. The total amount of funds from all sources was N39.19 Billion “Own funds” accounted for the highest with N28 billion and other sources accounted for N648 million.

xxv
1.3 ECONOMIC STATISTICS
The summary below reflects the key findings in the establishment based component of the survey across the various economic sectors covered in the country. Wholesale and Retail Trade In the wholesale and Retail Trade sector a total of 1,939,076 persons were engaged in the first – half of 2006 which later increased to 1,981,389. This reflected an increase of 2.2 percent. On emolument, N9.4 billion was paid in the first half of the year; which rose to N9.6 billion in the second half showing an increase of 2.1 percent during the year. The gross margin in the first half was N89.9 million against N83.7 billion in the second half. On the other hand, the total working capital in the first half was N29.8 billion whereas in the second half it was N29.2 billion. However, the cost of operation rose from N88.1 billion in the first half to N93 billion in the second half. Hotels and Restaurant On employment the number of people engaged in the Hotels and Restaurant Sector rose from 61468 in the first half of 2006 to 67,874 in the second half; yielding an increase of 10.42 percent. The emolument figures similarly rose from N4.7 billion to N5.6 billion in the first and second halves respectively; giving an increase of 18.82 percent. Receipt from accommodation were N30.4 billion in the first half while in the second half it was N32.5 billion, also increasing by 6.9 percent. On capacity utilization, no changes were observed for both first and second halves as the value remained constant at 59 percent. However, on lodger nights the first half value 4,035,844 which later rose to 4,066,614 in the second half of the year. The number of lodger rooms increases from 6,801,737 to 6,864,201 in the first and second halves respectively. Building and Construction The number of persons engaged in the year 2006 in this sector was 766,866 for the first half which later decreased to 746,210 in the second half; a fall of 2.7 percent. The total emolument for the paid for the first half was N119.6 billion for the first half of 2006 while in the second half if fell to N117.2 billion; a decrease of 19.85 percent. Manufacturing Industry Our findings in the manufacturing sector shows that the number of persons engaged in the first half of 2006 were 382,717 and 387,964 in the second half.

xxvi
The total emolument paid in the first half was N253 billion rising to N266.8 billion in the second half of the year. Cost of operation in the sector for the first half was N771.0 billion while in the second half it rose to N914.4 billion; a rise of 18.59 percent. The sales value in the first half of 2006 was N1081.7 billion while in the second half it was N1,954.8 billion giving a rise of 8.5 percent. The installed capacity utilized in the first half was 54 percent. This later rose to 55 percent in the second half (one percent). The capital investment on capital formation in the first half was N730.26 billion against N761.2 billion in the second half; a rise of 4.2 percent. Mining and Quarry Workers engaged in this sector decreased from 11,152 in the first half of the year 2006 to 10,762 percent. The total emolument paid to workers for the first half of the year was N736.5 billion rising to N36.55 billion in the second half a minor increase of 0.19 percent. However, the volume of mineral produced was 1,602,548 metric tones and 1,563,013 metric tones in the first and second halves of the year respectively. Private Professional Service This sector had a total employment of 14,573 in the first half of the year against 16,041 in the second half; having 10.07 percent increase. Receipts from services recorded N22.4 billion in the first half of 2006 increasing 6.9 percent to N24 billion approximately. Organised Road Transport Our findings showed total employment in this sector of 61,386 persons in the first half of the year while 65,602 were engaged in the second half; an increase of 6.87 percent. The fleet of vehicles recorded in the first half was 19,146 against 19,364 in the second half; a slight increase of 1.04 percent. Balance of Payments A total of $5.73 billion was received in the financial sector in the first half of 2006 while a total of $4.98 billion was received while $4.26 billion was paid out giving a surplus of $0.72 billion. Corporate Non-Financial The total value of assets internally was N6.7 billion and N521 million in foreign private investment. The highest internal in asset base was in the Manufacturing Sector but least in Agriculture, Mining and Quarrying of N34 million. Manufacturing also had the highest in foreign private invest of N8.1 billion.

xxvii
1.4 SYSTEM OF ADMINISTRATIVE STATISTICS
Water Board: Total volume of water available for various activities in 2006 was 40.3billion cubic liters About half of the total water utilization was on domestic issues while the rest was on industrial and other activities in 2006. LGA Statistics Tax Revenue - the aggregate tax revenue by the local government was N4.12billion over half of these tariffs were accrued from the community. Non-Tax Revenue The total amount of money accrued from the Local Government as non-tax revenue was N19.96billion. Statutory Allocations In 2006, the total statutory allocation to the Local Governments was about N563billion. 87 percent of this came from the Federation Accounts Recurrent Expenditure The total amount disbursed as recurrent expenditure to the Local Governments in 2006 was N492billion. Capital Expenditure In 2006, the total capital expenditure released to the Local Governments was N135.9billion. General administration had the highest share with 14.6 percent from the total. Fiscal Operation of State Government State Governments: in the year 2006 a total sum of N122.7billion was generated as revenue by the State Governments. Statutory Allocations: in 2006, a total sum of N189.8billion was allocated to the State Governments. Capital Expenditure: The amount expended in the economic sector was the highest as compared to other sectors, 43.6 percent in 2006. Recurrent Expenditure Administrative sector accounted for 44.3 percent with the sum of N166.5billion from the total disbursement as compound with other sectors.

xxviii
Co-operative Societies Type and membership of cooperative societies: Among the membership of registered and unregistered cooperative societies, 106297 farmers multipurpose while 3,027,781 were unregistered in between 2005 and 2006. Other societies with fewer members were livestock, credit and thrift as well as informal sectors. Internally Generated Fund The total internally generated fund in co-operative society increased as quarter rolled by with highest fund in the fourth quarter standing at N17.3billon. The paid-up shares had uniform pattern in 2006. Housing Statistics Land Allocation by purpose and sex: The number of applications for residential was 11,418, as the highest representing (86.1 percent) compared with that of commercial, industrial and other purposes. See table 4.5.1 in Appendix. Building by Ownership Application, Approvals and actual allocations were more for private owners than for corporate, government NGO, and other unclassified bodies. Health Statistics Hospital Type The table revealed health care facilities established by type in the states, with particular reference to Ebonyi state which increased on maternity hospitals from 25 to 39 between third and fourth quarters in 2006. Beds by Hospital by Type The number of hospital beds rose between quarters in the General Hospitals with 8.06 percent while the maternity had an increase of 12.6 percent in the year 2006. Patients by Hospital Type In-Patients: There was unsteady movement of both in-patient and out-patient in the General Hospitals between first to the last quarters we had the same pattern in the Maternity Hospitals. Health Personnel by Sex It was reported that health manpower personnel cut across all the medical profession and by sex. On the average about 71 percent of the manpower personnel comprises of medical Doctors and environmental health staff were males in 2006. Education Statistics The public schools institutions and teachers ahead of private ones despite the proliferation of private schools between 2005 and 2006. Pupils/Students in Public and Private Schools.
xxix
The report shows that the population of primary school pupils was higher in 2006 as compared to the previous year. Vehicle Registration The total number of vehicles registration was 5,091459. While the private vehicles topped with 68.3 Percent among others in 2006. Communication Access and use of Information and Communication (ICT) Facilities It was revealed that access to internet facilities was as low as 12.6 percent coverage within the states Inland Revenue Agencies. In 2006, 283 computers were in use while Lagos State topped the list with 91 from 29 establishments that had access to these facilities. Unemployment Statistics Unemployment (Professional/ Executives) The total of 150 vacancies was declared across the Nation in 2006, apart from 47,872 as old registration, 1,296 were registered as fresh unemployed, out of which 6311 were males. Unemployment (Low Grades) The total number of vacancies declared in 2006, was 517 while 272 was on placements made up of 161 males and 111 females. Unemployment (Trade Disputes) In 2006, a total number of 46 disputes were recorded resulting to 112 work stoppages involving 85,342 workers and 2,446,085 man-day lost. Unemployment (Cost of Operation) More than six times the amount on other benefits stood at (N73.6million) or 76.37% percent was spent on wages and salaries. Unemployment (ICT) The website and Local Area Network (LAN) recorded 5.6 percent in 2006. Research Institutes (2006) Source of Fund: The Federal Government topped the list of sources of fund with N4.957billion among others. Employment The employment of Nigerians out- numbered the non-Nigerians in the research institutes. Information and Communication Technology On access to information technology, website topped the list with 81.8 percent.

xxx
National Directorate of Employment (2006) New Beneficiaries The total non- graduate beneficiaries were higher than their graduate counterparts. Amount Spent on Loan The amount disbursed as loan from capital was (N7, 988) for females and (N7, 397) for males in 2006. Loan Recovery The total amount of loan granted was N209.6million while N22.3million was recovered. Reported Road Accident (2006) A total number of 9114 cases were reported in 2006. Serious cases topped with 5,556 representing 60.9 percent of the total. Value of Properties Lost About N165.6million worth of properties were reported lost due to road accident.
1.5 PRICES AND TRADE
The Foreign Trade Price Indices were computed with January 2005 as the price reference month while the weighting system was based on the trade values for the year 2005. The import Price Index recorded changes between 1.89 percent and 12.3 percent when compared with the price reference month over the period under consideration. Similarly, the Export price Index showed changes of – 18 percent and 0 percent over the same period.
The year-on-year rate of change in the Producer Price Index (PPI) was 3.1 percent in January 2006. A rate of 4.9 percent was recorded in February but went down to 3.1 percent in March 2006. It did not exceed 5 percent throughout the year 2006 except for the month of September that was 5.2 percent.
The level of the PPI in October 2006 was 5.0 percent above the corresponding level in October 2005. Thereafter, the year-on-year rate showed increase of 2.9 and 3.2 percent above the corresponding levels in November and December 2005 respectively.
1.6 NATIONAL ACCOUNTS ESTIMATION OF QUARTERLY
GROSS DOMESTIC PRODUCT (GDP)
INTRODUCTION: Quarterly estimates of GDP offer short and high frequency indicators thereby yielding timely information about the current economic situation as well as changes within any economy on short-term bases. The procedures used for quarterly estimation of GDP for 2006 is based on the production approach to

xxxi
estimation of GDP which internationally is guided by the blue print of the United Nations’ 1993 System of National Accounts (SNA ’93).
Gross Domestic Product At Current Prices The economy in 2006 recorded an overall GDP growth at current prices of 27.40 percent as against 27.70 percent recorded in 2005. The quarterly GDP estimates at current basic prices rose from a level of N3,169.6 billion, N3,399.4 billion N3,924.8 billion, N4,078.5 billion, in 2005 to N3,986.3 billion, N4,426.1 billion, N4,986.5 billion, and N5,165.7 billion, respectively in 2006 representing quarterly growth rate of 25.77 percent, 30.20 percent, 27.05 percent and 26.66 percent respectively for the four quarters in 2006. Gross Domestic Product At Constant (1990) Prices The GDP constant at (1990) Prices increased from a level of N561.9 billion in 2005 to N595.8 billion in 2006 showing an annual growth rate of 6.03 percent as against 6.51 percent recorded in 2005. The quarterly GDP estimates at constant prices rose from the levels of N120.0 billion, N128.8 billion N153.9 billion, and N159.2 billion, in 2005 to N128.6 billion, N135.4 billion, N162.5 billion, and N169.3 billion, respectively in 2006 representing a quarterly growth of 7.11 percent, 5.19 percent, 5.56 percent and 6.35 percent respectively in 2006. Crude Petroleum and Natural Gas (Real) The Crude Petroleum and Natural Gas sector fell slightly from a level of N136.3 billion in 2005 to N130.2 billion in 2006 representing an annual growth of -4.51 percent in 2006 against 0.50 percent recorded in 2005. This sector accounted for 24.26 percent of the GDP at Constant prices in 2005 and 21.85 percent in 2006.
Non-Oil Sector (Real & Nominal) The non-oil GDP in nominal terms increased from a level of N8,907.4 billion in 2005 to N11,581.7 billion in 2006 representing a growth of 30.02 percent in 2006 as against 24.35 percent in 2005. Its contribution to the overall GDP in 2005 and 2006 stood at 61.13 percent and 62.39 percent respectively.
The real GDP rose from a level of N425.6 billion in 2005 to N465.6 billion in 2006 representing a growth rate of 9.41 percent as against 8.59 percent recorded in 2005.

1
Chapter One
SURVEY DESIGN
1.0 INTRODUCTION
The National Bureau of Statistics (NBS) in collaboration with the Central Bank of Nigeria (CBN) and the Nigerian Communications Commission (NCC) in 2006 carried out a survey on the socio-economic activities in Nigeria for the year 2006. The main reason for conducting the survey was to enable the collaborating agencies fulfill their mandates in the production of current and credible statistics to monitor and evaluate the status of the economy and the various government programmes such as the National Economic Empowerment and Development Strategy (NEEDS) and the Millennium Development Goals (MDGs). The National Bureau of Statistics and Central Bank of Nigeria had often collaborated effectively to conduct surveys geared towards the production of external trade statistics; rebasing of consumer price index; Decomposition of Annual Gross Domestic Product (GDP) into quarterly GDP series; the Survey of Informal Sector, 2004 National Export Commodities Survey in Nigeria and the 2005 Collaborative Survey on Socio-economic Activities in Nigeria.
The present survey was implemented between 25th February and 30th June, 2007 by a combination of staff of NBS, CBN and NCC as well as outsourced personnels from the qualified members of the public who were screened and tested before final selection.
The NBS and CBN collaborative surveys had always enjoy enhanced technical coordination through adherence to professionalism, ethical and international standards which also allowed for optimal use of scarce resources the same is applicable in the current exercise. Since it was not the first time that the three agencies came together to jointly conduct a multipurpose survey, the 2006 collaborative survey unlike the previous one had been improved in terms of innovation and scope. As such, the total requirements of these agencies were met. The broaden of the scope of the collaborative survey cuts across the production of socio-economic data series through the households, the production of economic data series through the establishments and compilation of administrative data series obtained from the public and private institutions. This collaborative survey also assured the elimination of conflicts in data generated by the different agencies and ensured a reliable, authentic national statistics for the country.

2
1.2 OBJECTIVES OF THE SURVEY The key objectives of the survey include:
i. Collection of relevant statistics to facilitate the production of GDP.
ii. Production of data to aid economic analysis on non-oil outputs such as Manufacturing, Agriculture and Services.
iii. Production of State and Local Government Finance Statistics,
Producer Price Index (PPI), Oil Sector Statistics and Flow of Funds,
iv. Collection of current socio-economic statistics in Nigeria to assist in policy formulation and aid the monitoring and evaluation of various government programmes at National and sub-national levels.
1.3 COVERAGE AND SCOPE Coverage
The survey covers all the 36 states of the federation including the Federal Capital Territory (FCT), Abuja. The target population canvassed includes Households, Private Establishments and Public Establishments/ Agencies/Parastatals at federal, state and local government levels. Scope
(i) National Integrated Survey of Households (NISH) The scope covered under the National Integrated Survey of Households include topics and subjects like: Household Composition; Household Amenities, Health, Education, Employment, Female Contraceptive Prevalence, Births and Deaths in last 12 months, Child Immunization and Child Malnutrition, Ownership and Access to Information and Communication Technology (ICT), Voluntary or social work (Non-profit Institutions), operation of ICT business outfit, Housing project, Crop Production, Livestock Production, Poultry Keeping, Farming Inputs and Processing and Storage Facilities.
(ii) National Integrated Survey of Establishments (NISE)
Ten (10) sectors and sub-sectors were covered under the National Integrated Survey of Establishments. These were Agriculture including Hunting and Forestry, Fishing, Mining and Quarrying, Manufacturing, Building & Construction, Wholesale and Retail Trade, Hotel and Restaurant, Organized Road Transport, Financial Intermediation and Private Professional Services. Subject areas covered include kind of activity; legal form of ownership, persons engaged, paid employees, wages and salaries, description of products, installed production capacity, production and cost of production/operation etc.
3
(iii) System of Administrative Statistics (SAS) The System of Administrative Statistics covered subjects and topics which cut across many sectors in establishments and institutions in such areas as Education, Health, Housing, Utilities and finance sub-sectors.
1.4 SURVEY INSTRUMENTS
The main instruments developed for the collaborative survey were the questionnaires and the manuals. The instruction manuals were developed to facilitate the completion of the questionnaires. The questionnaires were designed in line with the set objectives of the various surveys implemented under the NBS three Survey Systems, namely, the National Integrated Survey of Households (NISH), the National Integrated Survey of Establishments (NISE) and the System of Administrative Statistics (SAS) (Table 1.1).
The National Integrated Survey of Households (NISH)
Four types of questionnaires were developed including the General Household Survey (GHS) questionnaire, Crop Farmers, Livestock and Fishery questionnaires. All the questionnaires under the NISH module made used of Scannable questionnaires.
The National Integrated Survey of Establishment (NISE)
Twelve types of questionnaires were designed to capture the relevant information canvassed from the 10 sectors of the economy, namely, Agriculture including Hunting and Forestry, Fishing, Mining and Quarrying, Manufacturing, Building & Construction, Wholesale and Retail Trade, Hotel and Restaurant, Organized Road Transport, Financial Intermediations, and Private Professional Services. Scannable questionnaires were used for collecting data on all the sectors in the NISE module.
The System of Administrative Statistics (SAS) Twenty-six types of questionnaires were designed to collect information through administrative records from institutions and establishments in social and economic sectors covering; Education, Health, Housing, Utilities and finance sub-sectors. Analogue questionnaires were used for all the sectors and sub-sectors.
1.5 SAMPLE DESIGN The multi-subject socio-economic survey employed the National Bureau of Statistics (NBS) NISH and NISE Sample designs.
1.5.1 National Integrated Survey of Household Sample Design
The General Household Survey and the National Agricultural Sample Survey designs derived from NBS 2005/07 NISH sample design. The 2005/07 NISH sample design is a 2-stage, replicated and rotated cluster sample design with Enumeration Areas (E.As) as first stage sampling units or Primary Sampling Units (PSUs) while Housing Units constituted the second stage units

4
(secondary sampling units). The housing units were the Ultimate Sampling Units for the multi-subject survey.
Generally, the NISH Master Sample in each state is made up of 120 EAs drawn in 12 replicates. A replicate consists of 10 E.As. Subsets of the Master Sample are studied for modules of the NISH. General Household Survey The GHS was implemented as a NISH module. Six replicates were studied per state while three replicates were studied in the FCT, Abuja. With a fixed-take of 10 HUs systematically selected per EA, 600 HUs thus were selected for interview per state and 300 for FCT, Abuja. Hence, nationally, a total of 21,900 HUs drawn from the 2,190 EAs were selected for interview for the GHS. The selected EAs (and hence the HUs) cut across the rural and urban sectors. Private Farmers Survey Total sample sizes of 32,850 Farming Housing Units (FHUs) were drawn from 2,190 EAs. In each state, 900 FHUs drawn from 60 EAs were studied. Four hundred and fifty (450) FHUs from 30 EAs were studied in (FCT), Abuja. The listings of housing units in the selected EAs were updated before they were stratified into farming and non-farming housing units. The farming housing units were further stratified into Crop Farming Housing Units (CFHU), Livestock Farming Housing Units (LFHU) and Fishing Farming Housing Units (FFHUs). In each EA, 5 FHUs were studied for crop farming, 5 FHUs were covered for livestock and 5 FHUs for fishery. At each level of selection, housing units were systematically selected using different random start. Table 1.2 reflects the stratification procedure prior to selection within each sub-population. All households in the HUs that qualified as farming households were served with relevant private farmers questionnaires.
1.5.2 National Integrated Survey of Establishments Sample Design
A national frame of 15,556 establishments employing 10 persons and above was used for the survey. Table 1.3 showed the breakdown by type of establishments as well as sample size allocated for each sector. A combination of parameters was factored into the selection and allocation of establishments to the sectors and states. The parameters were contribution of each sector to the GDP, number of establishments in each employment band by sector and purposive or a-priori knowledge of performance of the sectors to the economy. Table 1.4 showed the number of establishments by state and by sector.
1.5.3 System of Administrative Statistics Design The design for the SAS involved complete coverage of the listed institutions and establishments. The questionnaires for the SAS operations covered all relevant agencies/ institutions at the National, State and Local Government
5
Area Levels. Table 1.5 depicted the retrieval position on system of Administrative Statistics.
1.6 TRAINING
The training for the survey was conducted at two levels. The first level was the Training of Trainers (TOT) which included senior officers from NBS, CBN and NCC. The training at this level lasted for 5 days. The second level training was for the field personnel comprising the Enumerators, Supervisors, State Officers and Zonal Controllers from NBS and CBN. The training took place at the state offices and lasted for 5 days. The trainers were the trainees at the first level. The training sessions included classroom teaching, demonstration, mock interviews, role playing, field practices and home exercises. The two level trainings were comprehensive and were designed to ensure collection of good quality data.
1.7 FIELDWORK ARRANGEMENT The field work arrangement for the survey followed two approaches as contained in the NISH and NISE survey systems that is: NISH for household based and NISE/SAS for establishments/institutions/agencies based respectively. Household Component In each state, 3 teams were used comprising 3 supervisors and 12 enumerators. A team was made up of one supervisor and four enumerators. Each team covered 20 Enumeration Areas for a period of 22 days. A pair of enumerators in a team covered 10 EAs. This translated to covering an Enumeration Area for an average of 4 days for the different statistical operations. Each team moved in a roving manner.
Establishment Component: The second approach involved lodgment and retrieval of NISE and SAS questionnaires. The number of staff per state varied in line with the total establishments studied. On the average, two officers covered the operation in each state. A combination of NBS and CBN officers covered the operation in each state for a period of 26 days.
1.8 QUALITY CONTROL AND RETRIEVAL OF RECORD
The Quality Control measures were carried out during the survey, essentially to ensure quality of data. There were three levels of supervision involving the supervisors at the first level, CBN staff, NBS State Officers and Zonal Controllers at second level and finally the NBS/NCC Headquarter staff constituting the third level supervision. Field monitoring and quality check exercises were also carried out during the period of data collection as part of the quality control measures.

6
Retrieval of records was carried out in two stages. The first stage retrieval was implemented by CBN Headquarter Staff during the monitoring visit to the states and zones. The second retrieval was done during the monitoring visit of NBS Headquarter staff. A mop-up exercise was carried out by the NBS state officers and Zonal controllers for 10 days after the scheduled period for data collection and sent to NBS headquarters. Table 1.6 showed the retrieval status of GHS records while Table 1.7 depicted the retrieval position of Private farmers survey. Table 1.8 showed the status returns on PPI questionnaires.
1.9 DATA PROCESSING/ANALYSIS
The data processing analysis involved six main stages: development of data entry program; training of data processing staff; manual editing and coding; data entry and scanning; computer editing, verification and conversion and table generation. Integrated Microcomputer Processing Systems (IMPS) was one of the specialized Statistical packages used to develop the data entry program. The Disk Operating System (DOS) version of the software can support multiple screens required to capture data from the various survey instruments. With the introduction of scannable questionnaires for General Household and Modern Agricultural Holding, another new software package called Teleform was used. The indicators on household surveys were obtained using the Statistical Package for Social Scientists (SPSS) while the indicators on establishment surveys were obtained using MS-ACCESS and MS-EXCEL. Others indicators on Prices, Trade, National Accounts and Agricultural Survey made use of MS-Office (Access and Excel). The tabulation and analysis of the three survey systems were implemented by diligent and capable staff of the collaborative agencies.
1.10 REPORT WRITING
A core team of senior officers from the subject matter divisions in the NBS and CBN worked together to produce the draft report for finalization. The report was presented in two volumes. Volume I in the Statistical Report with an executive summary. Volume II contained the detailed Statistical Tables.
1.11 WORK PROGRAMME
A joint Time-line or Work Programme detailing the scheduling of the activities was developed (Table 1.9). The Time-line served as a monitoring guide for the survey. It also helped in programme discipline at each level of activity and was flexible enough to accommodate delays in the retrieval of completed records in the field. The survey was well managed by the three collaborating agencies in order to ensure effective statistical delivery.

7
Chapter Two 2.0 NATIONAL INTERGRATED SURVEY OF HOUSEHOLDS (NISH) 2.1 General Household Survey
This section deals with the characteristics of the socio-economic data of Nigerian population, such as demography, education, employment, health, housing condition, fertility, mortality etc. Demographic factors are both determinants and consequences of economic and social development. It has been shown that the study of demographic variables yield important information on the inventories of human resources that are needed for effective development planning.
2.1.1 Population Composition
Dependency ratio is defined as the number of household members aged 0-14 years as well as those who are 65 years and above to the number of members aged 15-64 years. The result showed dependency ratio of 1.2, indicating that one person was dependent on each economically active person. The weighted total number of households covered in the survey is 30,542,246. (See Table 2.1.3.1 in the Apopendix).
2.1.2 Household Characteristics
The impact of demographic variables is usually reflected in the size, rate of growth, age structure, headship and geographical zones distribution of a population. These could be influenced by socio-economic development through health, education, economic and welfare programmes.
2.1.2.1 Distribution of Population by Age Group and Gender
At the national level, 28.2 per cent of the persons aged 5-14 years accounted for the highest population. This was followed by persons aged 15.29 years which made up 24.6 per cent of the population. Elders in age group 50-64 years as well as those that are 65 years and above recorded 2.4 per cent and 4.1 per cent respectively. Gender disaggregation showed that among the male population, those in age group 5-14 years, similar to the previous surveys, recorded the highest figure of 29.9 per cent, while the older age group (60-64 years) recorded the lowest (2.8 per cent). The same pattern of distribution was recorded for the female population (See Table 1 and Table 2.1.2.1 in the appendix).

8
Table 1: Percentage Distribution of Persons by Age Group and Gender (National)
Age Group Male Female Both Sexes
0-4 13.4 12.8 13.1 5-14 29.9 26.5 28.2
15-29 22.7 26.6 24.6 30-44 15.5 18.9 17.1 45-59 11.0 9.8 10.4 60-64 2.8 1.9 2.4 65+ 4.7 3.5 4.1
Percentage Distribution of Persons by Age Group and Gender
0
5
10
15
20
25
30
35
0 - 4 5 - 14 15 - 29 30 - 44 45 - 59 60 - 64 65+
Age Group
Perc
enta
ge
Male
Female
Bothe Sexes
2.1.2.2 Distribution of Household by Headship and Household Size
At the national level, the households headed by males constituted 83.5 per cent, while the female heads constituted 16.5 per cent. All the states showed similar pattern of distribution. Average household size in Nigeria was 4.6 persons. Kano states recorded the highest household size (6.4 persons), while Ogun had the lowest household size (2.6 persons). (See Table 2.1.2.2 in the Appendix).

9
2.1.2.3 Marital Status
At the national level, more people that were never married during the last survey have been now married, indicating that 63.4 percent are married, while those that were never married dropped from 40.9 per cent to 29.2 per cent. The result also showed that 1.7 per cent of the people were separated and 0.9 per cent divorced.
Distribution of the widow to states showed that Enugu had the highest figure of 17.6 per cent, followed by Ogun (14.8 per cent), Abia (14.0 per cent) and Anambra (11.2 per cent). The states with lowest widow cases include Kano (0.9 per cent) and Zamfara (1.0 per cent). In all the states, over 44 per cent were married. Highest numbers of married population were recorded in Zamfara (83.4 per cent), Kebbi (80.9 per cent) and Sokoto (80.0 per cent).
Sector-wise, it was shown that more people in the rural areas were married (65.4 per cent) than those in the urban areas (56.1 per cent). Cases of widowhood (5.1 per cent). Separation (2.3 per cent) and divource (1.0 per cent) were more in the urban areas than in the rural areas (see Table 2 and Table 2.1.2.3 in the appendix.
Table 2 Percentage Distribution of Persons by Marital Status
and Sector (National)
Marital Status Urban Rural Total Married 56.1 65.4 63.4 Divorced 1.0 0.9 0.9 Separated 2.3 1.6 1.7 Widowed 5.1 4.7 4.8 Never married 35.5 27.4 29.2
2.1.3.0 Water and Sanitation 2.1.3.1 Safe and Unsafe Drinking Water
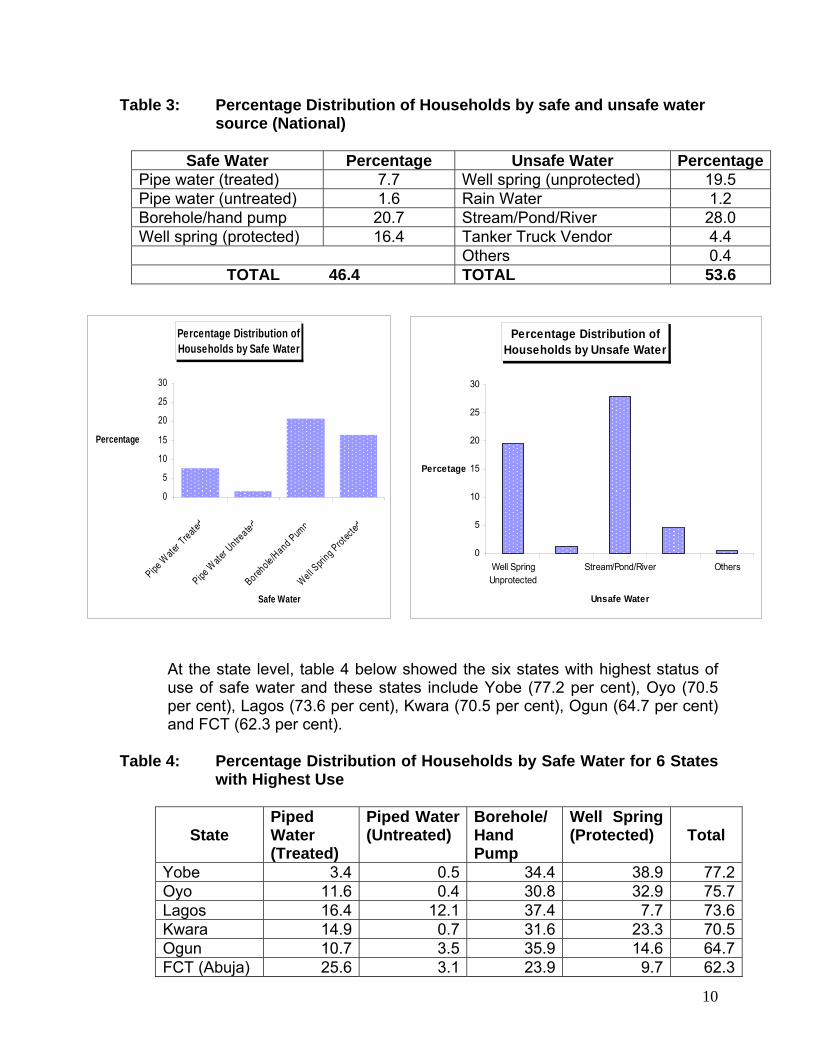
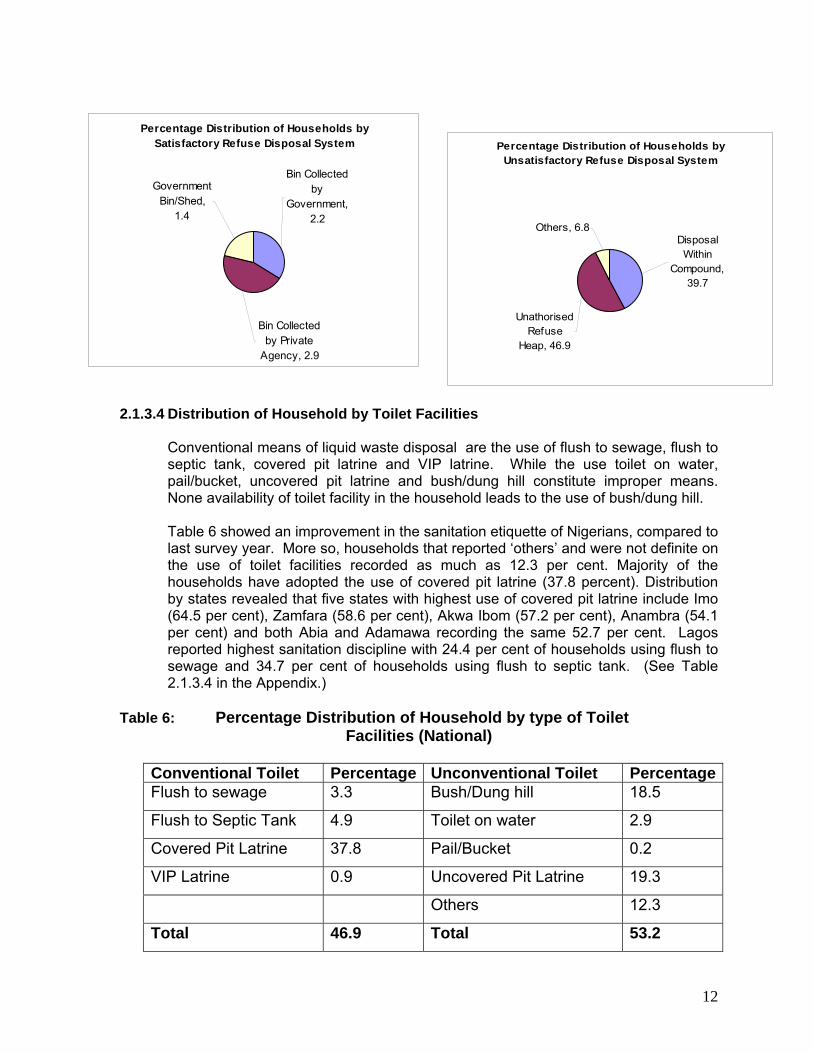
Safe or unpolluted drinking water is a basic necessity of good health, while unsafe or polluted water is a veritable source of water borne diseases, such as diarrhea, cholera, typhoid, guinea worm and schistosomiasis . The population of persons who use safe water is constituted by those who use piped treated water, piped untreated water, borehole with hand pump and well/spring protected water. The results in Table 3 revealed that majority of households (53.6 per cent) were still using unsafe water for cooking and drinking.
10
Table 3: Percentage Distribution of Households by safe and unsafe water source (National)
Safe Water Percentage Unsafe Water Percentage
Pipe water (treated) 7.7 Well spring (unprotected) 19.5 Pipe water (untreated) 1.6 Rain Water 1.2 Borehole/hand pump 20.7 Stream/Pond/River 28.0 Well spring (protected) 16.4 Tanker Truck Vendor 4.4
Others 0.4 TOTAL 46.4 TOTAL 53.6
At the state level, table 4 below showed the six states with highest status of use of safe water and these states include Yobe (77.2 per cent), Oyo (70.5 per cent), Lagos (73.6 per cent), Kwara (70.5 per cent), Ogun (64.7 per cent) and FCT (62.3 per cent).
Table 4: Percentage Distribution of Households by Safe Water for 6 States
with Highest Use
State
Piped Water (Treated)
Piped Water (Untreated)
Borehole/ Hand Pump
Well Spring (Protected)
Total
Yobe 3.4 0.5 34.4 38.9 77.2Oyo 11.6 0.4 30.8 32.9 75.7Lagos 16.4 12.1 37.4 7.7 73.6Kwara 14.9 0.7 31.6 23.3 70.5Ogun 10.7 3.5 35.9 14.6 64.7FCT (Abuja) 25.6 3.1 23.9 9.7 62.3
Percentage Distribution of Households by Safe Water
0
5
10
15
20
25
30
Pipe W
ater T
reated
Pipe W
ater U
ntreated
Borehole/Hand P
ump
Well Sprin
g Prot
ected
Safe Water
Percentage
Percentage Distribution of Households by Unsafe Water
0
5
10
15
20
25
30
Well SpringUnprotected
Stream/Pond/River Others
Unsafe Water
Percetage

11
On the other hand, the six states with lowest safe water status include Taraba (10.4 per cent), Bauchi (19.6 per cent), Enugu (21.8 per cent), Nassarawa (23.4 per cent), Bayelsa (23.7 per cent) and Benue (28.9 per cent). (See Table 2.1.3.1. in the Appendix).
2.1.3.2 Distribution of Household by Distance to source of water
More than five in every ten households (53.6 per cent) got water within 500 meters from the household, while it took 6.3 per cent of households 1 km or more to get water.
Disaggregating to states showed that in most of the states, more than half of the households fetched water within 500m from the household. States with highest percentage of households that had access to water within the dwelling include Kaduna (58.5 per cent), Zamfara (48.6 per cent), Kano (42.5 per cent), Katsina (38.0 per cent) and FCT (31.6 per cent). (See Table 2.1.3.2 in the Appendix).
2.1.3.3 Distribution of Household by type of Refuse Disposal
Improper disposal of refuse generated by the households, apart from being aesthetically displeasing, can constitute health risks to human life which is in other words referred to as unsafe sanitation. Table 5 showed that 6.5 per cent of households used satisfactory refuse disposal method, while majority of the households (93.4 per cent) adopted unsatisfactory system to dispose their refuse.
Disaggregating to states showed that the six states that indicated highest use of household bin collected by government include Lagos (22.5 per cent),Cross River (14.5 per cent), FCT (9.9 per cent), Enugu (8.6 per cent), Sokoto ( 6.2. per cent) and Rivers (5.4 per cent). The five states that indicated highest use of unauthorized refuse heap include Ekiti (79.6 per cent), Niger (79.1 per cent), Adamawa (75.6 per cent), Taraba (73.8 per cent) and Osun (71.8 per cent). The five states that recorded highest disposal of solid waste within compound include Enugu (74.5 per cent), Katsina (73.5 per cent), Kebbi (72.7 per cent), Zamfara (68.8 per cent) and Sokoto (65.7 per cent) (See Table 2.1.3.3 in the Appendix).
Table 5: Percentage Distribution of Refuse Disposal Method (National)
Satisfactory Refuse Disposal System
Percentage
Unsatisfactory Refuse Disposal System
Percentage
Bin collected by government
2.2
Disposal Within compound
39.7
Bin collected by private agency
2.9
Unauthorized Refuse heap
46.9
Government bin/shed 1.4 Others 6.8 Total 6.5 Total 93.4
12
2.1.3.4 Distribution of Household by Toilet Facilities
Conventional means of liquid waste disposal are the use of flush to sewage, flush to septic tank, covered pit latrine and VIP latrine. While the use toilet on water, pail/bucket, uncovered pit latrine and bush/dung hill constitute improper means. None availability of toilet facility in the household leads to the use of bush/dung hill. Table 6 showed an improvement in the sanitation etiquette of Nigerians, compared to last survey year. More so, households that reported ‘others’ and were not definite on the use of toilet facilities recorded as much as 12.3 per cent. Majority of the households have adopted the use of covered pit latrine (37.8 percent). Distribution by states revealed that five states with highest use of covered pit latrine include Imo (64.5 per cent), Zamfara (58.6 per cent), Akwa Ibom (57.2 per cent), Anambra (54.1 per cent) and both Abia and Adamawa recording the same 52.7 per cent. Lagos reported highest sanitation discipline with 24.4 per cent of households using flush to sewage and 34.7 per cent of households using flush to septic tank. (See Table 2.1.3.4 in the Appendix.)
Table 6: Percentage Distribution of Household by type of Toilet
Facilities (National)
Conventional Toilet Percentage Unconventional Toilet PercentageFlush to sewage 3.3 Bush/Dung hill 18.5
Flush to Septic Tank 4.9 Toilet on water 2.9
Covered Pit Latrine 37.8 Pail/Bucket 0.2
VIP Latrine 0.9 Uncovered Pit Latrine 19.3
Others 12.3
Total 46.9 Total 53.2
Percentage Distribution of Households by Satisfactory Refuse Disposal System
Bin Collected by Private
Agency, 2.9
Bin Collected by
Government, 2.2
Government Bin/Shed,
1.4
Percentage Distribution of Households by Unsatisfactory Refuse Disposal System
Disposal Within
Compound, 39.7
Others, 6.8
Unathorised Refuse
Heap, 46.9

13
2.1.3.5 Distribution of Household by Distance of Toilet Facilities to
Dwelling
At the national level, majority of the households (40.9 per cent) still need to move within 500 metres before they could access toilet facilities and 37.4 per cent of the households reported that their toilet facilities were situated within dwelling.
Disaggregating to states showed that, states with highest percentage of access to toilet facilities in their place of dwelling were Kano (77.1 per cent), Katsina (83.3 per cent) Lagos (86.9 per cent), Kebbi (69.6 per cent), Niger (62.8 per cent) Anambra (56.6 per cent) and Imo (51.4 per cent). Five highest states with access to toilet facilities within 500 meters include Edo (85.5 per cent), Bayelsa (82.0 per cent), Akwa Ibom (81.3 per cent), Ebonyi (75.3 per cent) and Abia (70.6 per cent. Similarly, five highest states with households that moved as far as between 500m – 1km to access toilet facilities include Bauchi (69.7 per cent), Zamfara (62.7 per cent), Sokoto (62.3.per cent), Taraba (51.1 percent) and Kaduna (49.5 per cent). Benue state had the highest households (4.7 per cent) that needed to travel more than 1km before they could access toilet facilities. (See Table 2.1.3.5) in the Appendix).
0 5 10 15 20 25 30 35 40
Percentage
Flush to Sew age
Flush to SepticTank
Covered Pit Latrine
VIP Latrine
Type of Toilet Facilities
Percentage Distribution of Households by Type of Toilet Facilities(Conventional)
0 5 10 15 20 25 30 35 40
Percentage
Bush/Dung Hill
Toilet On Water
Pail/Bucket
Uncovered Pit Latrine
Others
Type of Toilet Facilities
Percentage Distribution of Households by Type of Toilet Facilities(Unconventional)

14
2.1.3.6 Distribution of Household by Type of Housing Unit
At the national level, majority of households (70.0 per cent) reported similar situation with that of last survey year that they live in single room. Twenty four per cent of households claimed to be living in whole building and only 0.4 per cent reported that they lived in duplex.
Disaggregating to states showed that the five highest states with households living in single room include Kebbi (97.5 per cent), Katsina (96.9 per cent), Plateau (93.3 per cent), Osun (89.9 per cent) and Kaduna (89.1 per cent). The states that reported highest residence in flat include FCT (23.4 per cent), Delta (16.0 per cent) and Lagos (15.9 per cent). On the households living in whole building, the five highest states include Ebonyi (79.6 per cent), Imo (77.6 per cent), Zamfara (70.6 per cent), Enugu (68.0 per cent) and Akwa Ibom (58.3 per cent). (See Table 2.1.3.6 in the Appendix).
2.1.3.7 Distribution of Household By Source of Fuel
Fuel for cooking has an impact on environment with regards to pollution and a forestation. Table 2.1.3.7 revealed that more than four in every five households (82.3 per cent) resorted to the use of firewood for cooking at the national level, indicating similar pattern as with the last survey year. Almost fifteen per cent of households were using kerosene, while 0.5 per cent reported the use of gas cooker.
States disaggregation showed similar pattern of distribution, that the households in all the states were depending majorly on firewood for cooking, with the exception of Lagos that recorded the highest use of kerosene (88.6 per cent). Sector wise, similar pattern of use of gas cooker, kerosene and firewood were recorded for both rural and urban areas.
2.1.3.8 Distribution of Household Electricity Supply.
Effective and efficient energy is the bedrock of economic and industrial development. Hence, government pays a lot of premium on its improvement. At the national level, 41.5 per cent of the households were using only electricity supplied by PHCN, 2.7 per cent were combining the use to energy supplied by PHCN with the use of generator. The state with highest use of combination of rural electrification and generator was Bayelsa. (See Table 2.1.3.8 in the Appendix).
2.1.3.9 Distribution of Household by Tenure Pattern
At the national level, Table 2.1.3.9 revealed that at the majority of the households (41.2 per cent) lived in rented accommodation, followed by those who were residing in their own houses (38.8 per cent), while 13.7 per cent were living in their houses free of charge.
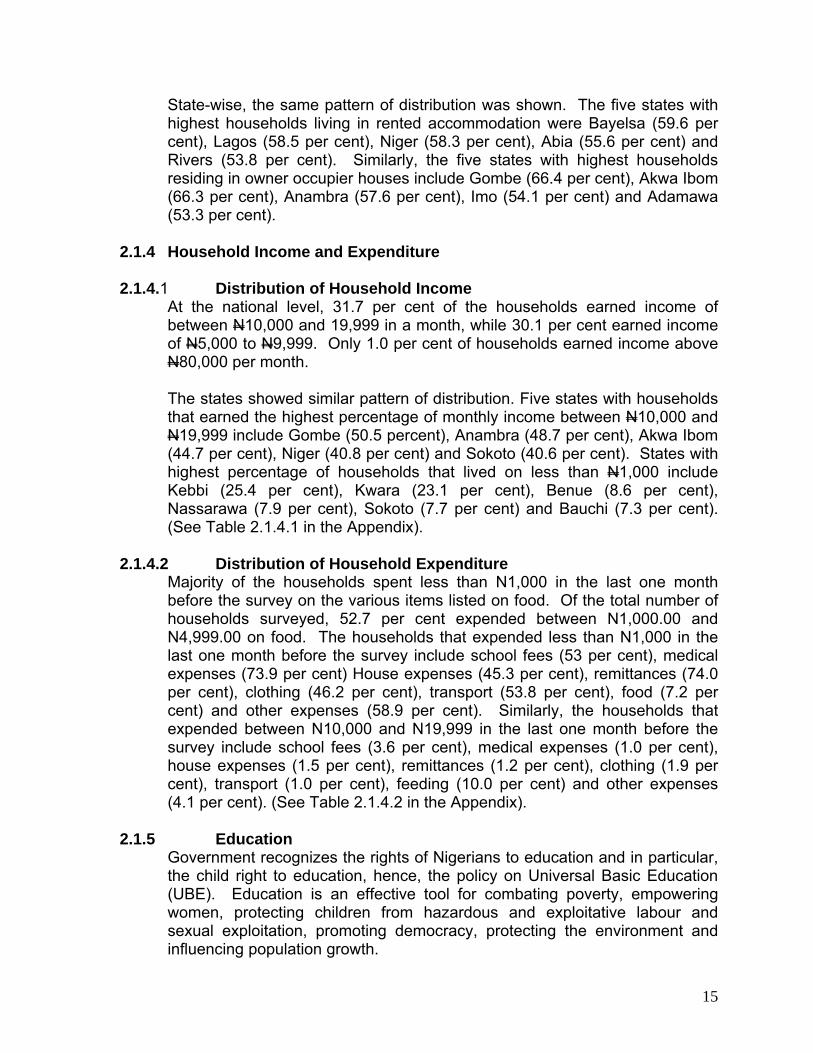
15
State-wise, the same pattern of distribution was shown. The five states with highest households living in rented accommodation were Bayelsa (59.6 per cent), Lagos (58.5 per cent), Niger (58.3 per cent), Abia (55.6 per cent) and Rivers (53.8 per cent). Similarly, the five states with highest households residing in owner occupier houses include Gombe (66.4 per cent), Akwa Ibom (66.3 per cent), Anambra (57.6 per cent), Imo (54.1 per cent) and Adamawa (53.3 per cent).
2.1.4 Household Income and Expenditure 2.1.4.1 Distribution of Household Income
At the national level, 31.7 per cent of the households earned income of between N10,000 and 19,999 in a month, while 30.1 per cent earned income of N5,000 to N9,999. Only 1.0 per cent of households earned income above N80,000 per month.
The states showed similar pattern of distribution. Five states with households that earned the highest percentage of monthly income between N10,000 and N19,999 include Gombe (50.5 percent), Anambra (48.7 per cent), Akwa Ibom (44.7 per cent), Niger (40.8 per cent) and Sokoto (40.6 per cent). States with highest percentage of households that lived on less than N1,000 include Kebbi (25.4 per cent), Kwara (23.1 per cent), Benue (8.6 per cent), Nassarawa (7.9 per cent), Sokoto (7.7 per cent) and Bauchi (7.3 per cent). (See Table 2.1.4.1 in the Appendix).
2.1.4.2 Distribution of Household Expenditure
Majority of the households spent less than N1,000 in the last one month before the survey on the various items listed on food. Of the total number of households surveyed, 52.7 per cent expended between N1,000.00 and N4,999.00 on food. The households that expended less than N1,000 in the last one month before the survey include school fees (53 per cent), medical expenses (73.9 per cent) House expenses (45.3 per cent), remittances (74.0 per cent), clothing (46.2 per cent), transport (53.8 per cent), food (7.2 per cent) and other expenses (58.9 per cent). Similarly, the households that expended between N10,000 and N19,999 in the last one month before the survey include school fees (3.6 per cent), medical expenses (1.0 per cent), house expenses (1.5 per cent), remittances (1.2 per cent), clothing (1.9 per cent), transport (1.0 per cent), feeding (10.0 per cent) and other expenses (4.1 per cent). (See Table 2.1.4.2 in the Appendix).
2.1.5 Education Government recognizes the rights of Nigerians to education and in particular, the child right to education, hence, the policy on Universal Basic Education (UBE). Education is an effective tool for combating poverty, empowering women, protecting children from hazardous and exploitative labour and sexual exploitation, promoting democracy, protecting the environment and influencing population growth.
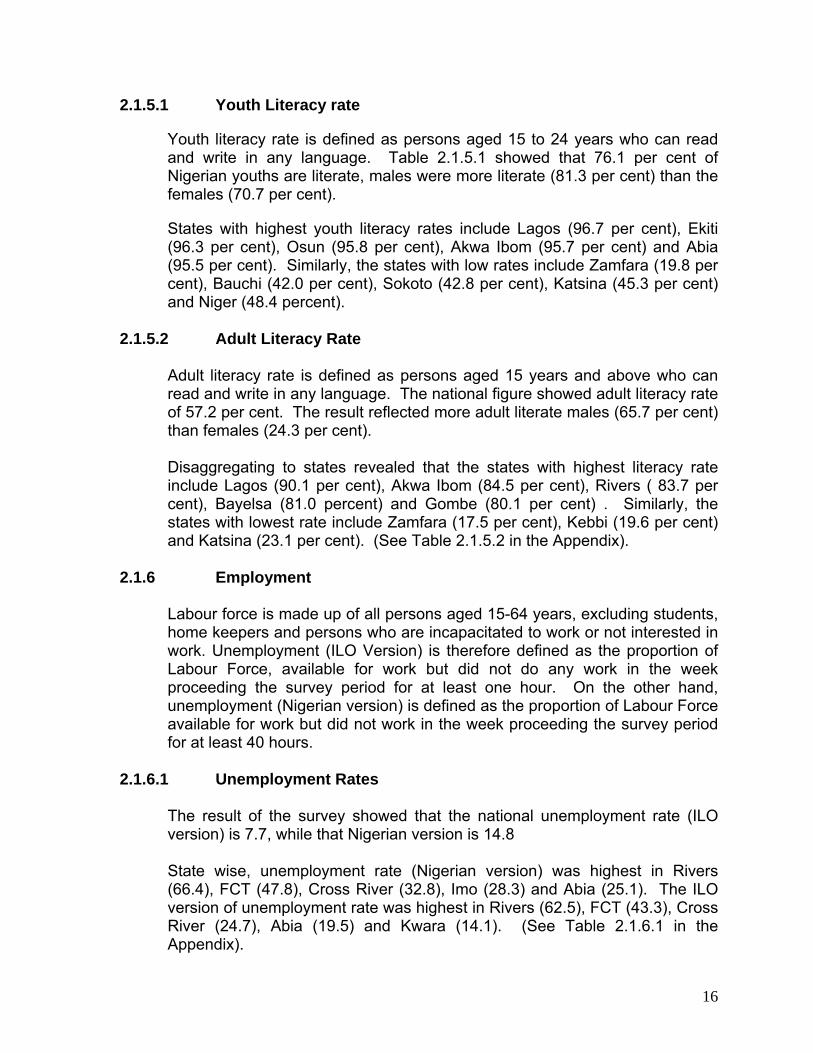
16
2.1.5.1 Youth Literacy rate
Youth literacy rate is defined as persons aged 15 to 24 years who can read and write in any language. Table 2.1.5.1 showed that 76.1 per cent of Nigerian youths are literate, males were more literate (81.3 per cent) than the females (70.7 per cent).
States with highest youth literacy rates include Lagos (96.7 per cent), Ekiti (96.3 per cent), Osun (95.8 per cent), Akwa Ibom (95.7 per cent) and Abia (95.5 per cent). Similarly, the states with low rates include Zamfara (19.8 per cent), Bauchi (42.0 per cent), Sokoto (42.8 per cent), Katsina (45.3 per cent) and Niger (48.4 percent).
2.1.5.2 Adult Literacy Rate
Adult literacy rate is defined as persons aged 15 years and above who can read and write in any language. The national figure showed adult literacy rate of 57.2 per cent. The result reflected more adult literate males (65.7 per cent) than females (24.3 per cent).
Disaggregating to states revealed that the states with highest literacy rate include Lagos (90.1 per cent), Akwa Ibom (84.5 per cent), Rivers ( 83.7 per cent), Bayelsa (81.0 percent) and Gombe (80.1 per cent) . Similarly, the states with lowest rate include Zamfara (17.5 per cent), Kebbi (19.6 per cent) and Katsina (23.1 per cent). (See Table 2.1.5.2 in the Appendix).
2.1.6 Employment
Labour force is made up of all persons aged 15-64 years, excluding students, home keepers and persons who are incapacitated to work or not interested in work. Unemployment (ILO Version) is therefore defined as the proportion of Labour Force, available for work but did not do any work in the week proceeding the survey period for at least one hour. On the other hand, unemployment (Nigerian version) is defined as the proportion of Labour Force available for work but did not work in the week proceeding the survey period for at least 40 hours.
2.1.6.1 Unemployment Rates
The result of the survey showed that the national unemployment rate (ILO version) is 7.7, while that Nigerian version is 14.8
State wise, unemployment rate (Nigerian version) was highest in Rivers (66.4), FCT (47.8), Cross River (32.8), Imo (28.3) and Abia (25.1). The ILO version of unemployment rate was highest in Rivers (62.5), FCT (43.3), Cross River (24.7), Abia (19.5) and Kwara (14.1). (See Table 2.1.6.1 in the Appendix).

17
2.1.6.2 Distribution of Employed Persons by Hours of Work
At the national level, table 2.1.6.2 showed that over 3 million out of the employed persons work for more than 56 hours per week, while more than 1 million persons work for between 48 and 56 hours in a week.
Sector wise, similar pattern was shown for both urban and rural areas. In the urban areas, 449,392 working persons put in above 56 hours per week, while 4,967 persons worked for 1- 15 hours per week. Rural areas showed similar features of distribution.
2.1.6.3 Distribution of Employed Persons by Industry, Sector and Gender
The result of the survey showed that 5,586,397 persons were employed. Employment was highest in Agriculture, hunting and forestry (3,310,679 persons), followed by Wholesale and Retail trade (726,322 persons) while manufacturing had the least employment (3,418 persons).
Disaggregating to sector, employment in the rural areas were more (4,968,204 persons) as compared to the urban areas (618,194 persons).
Distributing to gender, more males (4,049,616 persons) were employed, while females employed were (1,536,782 persons). (See table 2.1.6.3 in the Appendix)
2.1.6.4 Distribution of Employed Persons in Voluntary or Social Work
The result of the survey showed that 4,457, 690 persons were engaged in voluntary or social work which is in other words called Non-profit Institution. Engagement was highest in Religious Social work (1,666,390 persons), followed by those engaged in Development and Housing (1,069,553 persons). International Voluntary work engaged the least (1,596) number of persons.
Distributing to place of residence revealed that voluntary or social workers were engaged more in the rural areas (3,652,407 persons) than in the urban areas (805,283 persons).
Disaggregating to gender, more males (104,601 persons) were engaged in non-profit institution than females (21,536 persons).
Distributing to hours of work, highest number of voluntary workers (2,613,516 persons) put in below 15 Hours, followed by those who work for between 15 to 39 Hours (676,887 persons). (See able 2.1.6.4 in the Appendix).
.

18
2.1.7. Female Contraceptive
Effort of the government is geared toward the attainment of the millennium development goals (MDG), one of which is the reduction of female mortality rate.
2.1.7.1 Distribution of Pregnant Women by Clinic Registration and Anti-
Tetanus Reception
At the national level, 43.2 per cent of the pregnant women were registered at the clinic and 52.2 per cent of them received anti-tetanus injection. Apart from that, 12.5 per cent of the pregnant women that were registered did not visit the clinic in a month, while 37.4 per cent visited the clinic twice in a month.
Distribution to states showed that Kogi had the highest record of pregnant women (96.2 per cent) that were registered at the clinic. Among the registered pregnant women, Ekiti had the highest figure (85.7 per cent) of those that received anti-tetanus injection. (See Table 2.1.7.1 in the Appendix).
2.1.7.2 Distribution of Women by Family Planning Method
Table 2.1.7.2 showed that among the women who were in their productive age (15-49 years) that claimed to be currently using family planning, condom is the most popular method used. In the urban areas, 1.3 per cent of the women were using pill, while 2.6 per cent abstained from sexual intercourse to plan their family. Similarly, in the rural areas, 0.5 per cent of the women used withdrawal method to plan their family, while 2.1 per cent abstained from sexual intercourse. Gender distributions also follow the same pattern, but males were more than females using pill, while 2.6 per cent abstained from sexual intercourse to plan their family. Similarly, in the rural areas, 0.5 per cent of the women used withdrawal method to plan their family, while 2.1 per cent abstained from sexual intercourse
2.1.8 Health
2.1.8.1 Birth in the last 12 months
During the last 12 months in Nigeria, distribution of birth showed that more male children were born (52.7 per cent) than female (47.3 per cent), indicating a similar pattern with last year’s distribution.
State disaggregation showed that the five states that reported highest percentage of male live birth include Delta (80.1 per cent), Cross River (75.0 per cent), Jigawa (68.6 per cent), Gombe (68.2 per cent) and Taraba (65.7 per cent). On the other hand, the states which reported highest per centage of female live birth include Bayelsa (72.1 per cent), Kebbi (69.8 per cent), Ondo

19
(64.6 per cent), Benue (60.9 per cent) and Yobe (59.8 per cent). See Table 2.1.8.1 in the Appendix.
2.1.8.2 Birth Weight of Children
Weight at birth of a child is a function of diet and nutrition of the mother. Table 8 showed that at the national level, among the live birth, children that weighed between 3kg and 3.99kg were highest (53.5 per cent), followed by those that weighed between 2kg and 2.99kg at birth (22.2 per cent).
State distribution showed similar pattern, except for a few. The states with more children weighing 1kg – 1.99 kg include Adamawa (56.9 per cent), Bauchi (56.7 per cent), Borno (44.4 per cent), Imo (69.8 per cent), Katsina (58.8 per cent), Niger (69.1 per cent), and Rivers (61.2 per cent).
Disaggregation of weight at birth to zones showed that in North Central, Children that weighed between 2kg and 2.99kg were more (40.1 per cent). Children that weighed between 1kg and 1.99kg were more in the North East (41.1 per cent), while in North West, South East, South-South and South West, the children that weighed between 3kg and 3.99kg recorded highest figures. (See Table 2.1.8.2 in the Appendix).
2.1.8.3 Children Immunization
The immunization status showed that at the national level,35.1 per cent of the children aged one year or less received Measles vaccination and 13.6 per cent of the children received BCG Vaccination. The result revealed that 6.0 per cent of the children had received at least one of the DPT Vaccinations and 13.1 per cent of the children had received at least one of the OPV Vaccinations. Children that had yellow fever vaccination recorded 2.3 per cent, 1.5 per cent had received MMR and 28.3 per cent of the children had received Vitamin A supplement.
Gender distribution showed similar pattern. (See Table 2.1.8.3 in the Appendix).
2.1.8.4 Children Breast feeding
Table 2.1.8.4 revealed that among Nigerian children who are less than one year old that had ever been breast fed, 31.4 per cent did not get colostrums (first yellow milk) because of the belief that the milk is bad, 34.2 per cent of the children did not get the milk because of the illness or weakness of the mothers, 0.3 per cent of the denial was due to the nipple or breast problem which the mothers had and 0.4 per cent was due to the fact that the mothers did not produce milk.

20
Disaggregation to states showed that large percentage of the children that did not received colostrums attributed the reasons to bad milk, mother illness or weakness and child illness or weakness.
2.1.8.5 Death in the last 12 Months
During the last 12 months in Nigeria, the result showed more male death (57.9 per cent) than female death (42.1 per cent).
Distributing to states, the result showed similar pattern of distribution for both males and females. (see Table 2.1.8.5 in the Appendix).
2.1.9 Housing Project
2.1.9.1 Building Project Embark Upon
At the national level, 96.3 per cent of the building projects started during last year (2006) were residential buildings, 1.7 per cent of the projects were for commercial purposes, while 1.9 per cent were for other purposes.
The same pattern of distribution was shown for the states. (See Table 2.1.9.1 in the Appendix).
2.1.9.2 Distribution of persons by stage of completion of Building
At the national level, highest figure of persons who started building projects reported the projects had reached window level (32.3 per cent), followed by lintel level (30.4 per cent), and foundation level (29.7 per cent). The result showed that 3.6 per cent of the people had completed the projects by the end of the year, while 4.0 per cent claimed that the projects had reached roofing level.
Distributing to states, the pattern of distribution was similar. The highest state with completion of projects includes plateau (42.0 per cent), Kebbi (38.5 per cent), Gombe (35.2 per cent), Kaduna (32.6 per cent) and Benue (30.1 per cent).
Disaggregating to place of residence revealed similar pattern of distribution for both urban and rural areas. (see Table 2.1.9.2 in the Appendix)
2.1.10 Information and Communication Technology
Information and communication technology play powerful and vital role in socio-economic development. Hence, the government policy on improved communication to further drive the privatization programmes.

21
2.1.10.1 Distribution of ICT (Radio) by Household
About 84.0 per cent of the households in Nigeria had access to radio among the households, 77.1 per cent had access through ownership, while 15.5 per cent of the households had no access at all.
Distributing to states revealed that households in Anambra had highest access to radio (92,5 per cent) and the states with next higher access include Niger (90.6 per cent), Gombe (88.7 per cent), Kebbi (88.2 per cent), Kaduna (87.1 per cent) and Bayelsa (86.5 per cent).
Sector disaggregation showed that urban households had higher access to radio (89.3 per cent) than those in the rural areas (83.0 per cent). Similar pattern of distribution was shown for ownership only and access only. (see Table 2.1.10.1 in the Appendix).
2.1.10.2 Distribution of ICT (Television) by Household
About 40.0 per cent of households in Nigeria had access to television, out of which 13.2 per cent only had access without necessarily owning them, while 27.2 actually owned the facilities.
State distribution showed that the five states that had highest household access to television include Lagos (90.2 per cent), Anambra (85.0 per cent), Bayelsa (79.4 per cent). Oyo (61.8) per cent) and FCT (75.3 per cent). Sector-wise, it was revealed that urban households had higher access to television (73.6 per cent) than those in the rural areas (30.3 per cent). The same pattern of distribution was shown for both ownership and access only (see Table 2.1.10.2 in the Appendix).
2.1.10.3 Distribution of ICT (Fixed Telephone) by Household
At the national level, 94.3 per cent of the households neither owned nor had access to fixed telephone, while 5.6 per cent had access. Among the households which had access, 4.9 per cent only had access without necessarily owning the facilities, while 0.7 actually owned them.
State distribution showed that Lagos had the highest access (59.5 per cent), followed by Anambra (23.4 per cent). FCT (23.1 per cent), Edo (17.0 per cent), Cross River (13.9 per cent) and Delta (13.5 per cent).
Sector disaggregation reveled that Urban households had higher access (16.6 per cent) than the rural households (2.4 per cent). The same feature was shown for ownership only and access only, indicating similar pattern with the previous year. (See Table 2.1.10.3 in the Appendix).
22
2.1.10.4 Distribution of ICT (Mobile Telephone) by Household
At the national level the result showed that 43.8 per cent of the households had access to mobile telephone. Among the households, 18.9 only had access to the facilities without necessarily owning them, while 24.9 per cent actually owned them.
State-wise, it was revealed, that Lagos had the highest access (91.8 per cent) to mobile telephone. The states which also had higher access include Anambra (90.3 per cent), FCT (73.2 per cent), Osun (75.5 per cent), Ekiti (72.6 per cent) and Bayelsa (69.8 per cent).
Sector distribution showed that the urban households had higher access (74.9 per cent) than their rural counterparts (34.4 per cent). Similar pattern of distribution was shown for ownership only and households which only had access without necessarily owning the equipments. (See Table 2.1.10.4 in the Appendix).
2.1.10.5 Distribution of ICT (Personal Computer) by Household
Nine in every ten households in Nigeria neither owned nor had access to personal computer, while 5.2 per cent had access. Among the households which had access, 4.6 per cent only had access without necessarily owning the equipments, while 0.6 actually owned them.
Disaggregating to states, FCT reported the highest access (30.7 per cent), followed by Lagos (30.6 per cent), Anambra (23.8 per cent), Cross River (17.6 per cent), Edo (14.1 per cent) and Delta (11.0 per cent).
Distributing to sector showed that urban households had higher access (14.7 per cent) to the equipments than rural households (2.4 per cent). Similar pattern of distribution was show for ownership only and access only. (See Table 2.1.10.5 in the Appendix).
2.1.10.6 Distribution of ICT (Internet Service) by Household
At the national level, 95.9 per cent of the households in Nigeria neither owned nor had access to internet services, while 4.0 per cent had access. Among the households which had access, 0.1 per cent actually owned the facilities, while 3.9 per cent only had access without necessarily owing them.
State-wise, Lagos had the highest access (23.1 per cent) to internet services, followed by Anambra (19.4 per cent), FCT (16.9 per cent), Cross River (16.3 per cent), Edo (14.1 per cent) and Delta (10.0 per cent).
Disaggregating to sector showed that urban households had higher access (12,1 per cent) than the rural households (1.6 per cent). Similar feature was shown for the household which only owned the facilities and those which has

23
access only without necessarily owning them. (See Table 2.1.10.6 in the Appendix).
2.1.10.7 Distribution of ICT (Radio) by persons
Nine in every ten persons (92.0 per cent) in Nigeria had access to radio, while 8.0 per cent neither had access nor owned the equipments. Among the population who had the access, 55.8 per cent actually owned, while 36.2 only had the access to the equipments without owning them.
Disaggregating to states showed that at least eight in every ten persons had access to radio. The states with the highest access include Lagos (98.1 per cent), Kaduna (97.9 per cent), Anambra (97.8 per cent), FCT (97.3 per cent) and Bayelsa (96.7 per cent).
Sector – wise, the result showed that the urban population had higher access (95.5 per cent) than those in the rural areas (91.1 per cent). Similar pattern was shown for those who actually owned radio. But among the population who only had access to the equipments without necessarily owning them, the rural residents had higher access (36.6 per cent) than those in the urban areas (34.7 per cent). (See Table 2.1.10.7 in the Appendix).
2.1.10.8 Distribution of ICT (Television) by Persons
In Nigeria 71.6 per cent of the persons had access to television, while 28.4 per cent do not have access or own them. Among the population who had access to television, 57.3 actually owned them, while 14.3 only had access but do not own them.
Distributing to states, it was shown that Lagos residents had access most (96.7 per cent) to television, followed by Anambra (94.9 per cent), Rivers (91.4 per cent), FCT (88.7 per cent) and Kaduna (88.5 per cent).
Disaggregating to place of resident showed that the urban population had higher access (88.5 per cent). Similar feature was shown for those who only had access but did not necessarily own the equipments and those who actually owned them. (See Table 2.1.10.8 in the Appendix).
2.1.10.9 Distribution of ICT (Fixed Telephone) by persons
Five in every ten Nigerians had access to fixed telephone. Among the population which had access, 18.1 per cent of the people actually owned the equipments, while 34.6 per cent only had access without necessarily owing them.
States disaggregation showed that Rivers residents had access mot (87.1 per cent) to fixed telephone. The states with the next higher access include Katsina (81.0 per cent), Kaduna (79.2 per cent), Lagos (75.0 per cent), Ebonyi (72.5 per cent) and Zamfara (68.9 per cent).

24
Sector – wise, the result showed that the urban residents had higher access (55.6 per cent). Than those in the rural areas (52.0 per cent). Similar feature was shown for the population which actually owned the equipments and those who had access but do not really own them. (See Table 2.1.10.9 in the Appendix).
2.1.10.10 Distribution of ICT (Mobile Telephone) by persons
At least, seven persons in every ten Nigerians had access to mobile telephone. Among the population which had access, 50.1 per cent actually owned the equipments, while 22.0 only had access but do not really own them.
Distributing to states revealed showed that Lagos residents had access most to mobile telephone, followed by Anambra (95.2 per cent), Rivers (91.7 per cent), Osun (89.4 per cent), Kaduna (88.4 per cent) and Edo (88.2 per cent).
Disaggregation to place of resident showed that the urban residents had higher access (87.9 per cent) to mobile telephone than those in the rural areas (68.1 per cent). Similar feature was shown for those who had access without necessarily owning the equipments, while for those who actually own them, rural residents had higher access (50.8 per cent) than those in the urban areas (47.6 per cent). (See Table 2.1.10.11 in the Appendix).
2.1.10.11 Distribution of ICT (Personal Computer) by persons
At the notional level, 52.5 per cent of Nigerians had access to Personal Computers, while 47.5 per cent neither owned nor had access to them. Among the population that had access, 35.7 per cent do not necessarily own them, while 16.8 per cent actually owned the equipments.
Disaggregating to states. Abuja residents had the highest access (61.7 per cent) to personal computer, followed by Lagos (55.9 per cent), Anambra (54.7 per cent), Plateau (53.8 per cent), Gombe (53.2 per cent) and Benue (52.3 per cent).
Distributing to place of residence, urban residents had higher access to personal computers (54.3 per cent) than those in the rural areas, (52.0 per cent). Similar pattern of distribution was shown for those who had access but do not necessarily own the equipment. Rural residents had higher access through ownership (17.0 per cent) than those in the urban areas (15.9 per cent). (See Table 2.1.10.11) in the Appendix.
2.1.10.12 Distribution of ICT (Internet Service) by Persons
At the national level, 98.1 per cent of persons neither own nor had access to internet service, which 1.9 per cent of persons had access. Among the population which had access, 0.9 only had access without necessary owning them, while 1.0 per cent actually owned them.

25
Distributing to states, the states which had highest access include Lagos (15.0 per cent), Anambra (11.7 per cent), Delta (7.9 per cent) Edo (8.2 per cent) and Osun and |FCT (Abuja) which both recorded 5.1 per cent.
2.1.10.13 Distribution of Television Viewers by First Preference Station
The result of the survey showed that at the national level, National Television Authority (NTA) was the highest first preferred station to the television views (48.9 per cent), followed by the state TV (22.4 per cent), AIT (7.5 per cent) and the other private stations.
Disaggregating to place of residence showed similar pattern of distribution for both urban and rural areas. Among the viewers who chose NTA as their first preferred station, the result showed that there were more viewers in the rural areas than those in the urban areas. Similar scenario was shown for the various State TV, and for those who viewed other stations not categorized. However, television viewers who watch the private own stations were more in the urban areas than in the rural areas. (See Table 2.1.10.13 in the Appendix).
Distribution of Television Viewers by Most Preferred Station
The result of the survey showed that at the national level, television viewers preferred the state TV stations most (47.29 per cent), followed by other stations (20.57 per cent), foreign stations (11.89 per cent), AIT (5.6 per cent) and NTA (5.58 per cent)
Percentage Distribution of Television Viewers by First Preference Station
0
10
20
30
40
50
60
NTA
Sta
te T
V
AIT
Cha
nnel
s
Silv
er B
ird
Gal
axy
Fore
ign
Min
aj
MIT
V
Oth
er
DB
N
1st Prefered T.V. Station
Perc
enta
ge
UrbanRural

26
Disaggregating to gender showed similar pattern of distribution. The most preferred television station by both male and female viewers was state TV, followed by others and foreign. (See Table 2.1.10.14 in the Appendix).
2.1.10.14 Distribution of Number of ICT Equipments Owned
At the national level, the estimated numbers of ICT equipments owned by Nigerians were radio (9,666,207), Television (12,448,076), mobile telephone (799,130), fixed telephone (786,852), personal computer (627,934) and Internet-service (92,131).
Distribution to states, ownership of radio was highest in Lagos (1,402,642). Similar highest ownership in Lagos was recorded for television (2,625,424), mobile phone (123,523), fixed telephone (91,858), personal computer (27,577) and Internet service (5,465).
2.1.10.15 Distribution of Owners of ICT Equipments by Number Owned and State.
At the national level, the estimated number of persons who owned ICT equipments were Radio (15,109,054), Television (12,448,076), Mobile phone (10,002,710), fixed phone (7.86,852), Personal Computer (627,934) and Internet Service (92,131). Majority of the owners of he equipments owned only are: Radio (97.5 per cent), Television (96.2 per cent), Mobile Phone
Percentage Distribution of Television Viewers by Most Prefered Station and Gender (June 2007)
0
10
20
30
40
50
60
State TV
Foreign AIT
NTA
Silver B
Gallax
yMITV
Minaj
Channe
lsDBN
Others
Stations
Per
cent
age
MaleFemaleBoth Sexes

27
(94.7 per cent), fixed Phone (92.9 per cent), Personal Computer (87.6 per cent) and Internet Service (93.7 per cent). Lagos recorded the highest distribution to states, ownership of virtually all the equipments, followed by Oyo State. (See Tables 2.1.10.15 and 2.1.10.16) in the Appendix).
2.1.10.16 Distribution of Persons who had Access to ICT Equipments by Source of Access
The result of the survey showed the distribution of persons that had access radio (42,725,292), television (31,485,209), Mobile Phone (30,786,519), Fixed Phone (9,722,973), Personal Computer (5,336,858) and Internet Service (4,939,630). Access to Radio showed that majority of the persons (62.9 per cent) and (53.8 per cent) had access to radio and television respectively through family member of friend or neigbbour. Access was highest to mobile telephone (32.5 per cent) through ownership and fixed telephone (23.3 per cent) through umbrella center. (See Table 2.1.10.17 in the Appendix).
2.2 PRIVATE FARMERS
Private farmers are peasant farmers who use traditional methods in agricultural production. They are grouped into three namely: Crop, Livestock and Fish Farmers.
2.2.1.1.1 Number of Persons Engaged in Agriculture
Expectedly table 1 revealed that more persons are involved in farming activities during the second quarter of the year than any other quarter. Less farming activities took place in the fourth quarter. In the first quarter of the year, about 37 per cent of the total persons engaged in farming activities are female, and they worked on the average of five days while their male counterpart who constituted 73 per cent worked for 6 days.. Of the total persons engaged in farming activities in this quarter, 23 per cent are working proprietors. 47 per cent are unpaid family members, a mere 2 per cent are apprentices while the remaining 28 percent are paid employees.
In the second quarter the percentage of female participation in agricultural l abour force dropped to 28 percent of the total persons engaged in agricultural activities.. The average number of days worked was five days for both male and female. The working proprietors in this quarter constituted 24 percent of

28
the total workforce. Unpaid family members were 39 percent while apprentice and paid employee constituted 4 and 33 percent respectively.
The trend in the third quarter is not radically different when compared with the immediate past quarter. The table recorded 32 percent of the workforce in the third quarter to be female, and the average number of days worked was five days for both male and female. The table also revealed that 23.8 percent are working proprietor, 42 percent are unpaid family workers, about 3 percent are apprentice while 31 percent constitute paid employee.
The fourth quarter result showed that 33 percent of the entire workforce in agricultural sector was female. The remaining 73 percent who are male, worked for seven days on the average during this period while their female counterpart worked for 5 days on the average. The working proprietors constituted 26 percent of the total work force in agricultural sector,49 per cent are unpaid family members and 3 percent are apprentices Paid employees were 22percent.. On the whole, table 1 revealed that unpaid family member constituted the largest portion of agricultural workforce while very little number were apprentice.
2.2.1.2: Area and Production of Major Crops
The following crops are classified as major crops grown in Nigeria; Maize, Cassava, Rice, Melon, Cocoyam, Millet, Guinea Corn, Groundnut, Beans, Yam and Cotton.
Table 2.2.1.2 depicts that out of the major crops grown in Nigeria, maize had the largest land area cultivated with a figure of 4,670 thousand hectares followed by Guinea Corn 4,578 thousand hectares and Millet 4,270 thousand hectares while land area cultivated for Cotton 222 thousand hectares and Melon 200 thousand hectares.
In terms of production, Cassava topped with 38,041 metric tons next was Yam 28,280 metric tons while Melon was at the bottom of the ladder with 371 metric tons and Cotton 516 metric tons. Table 2.2.1.2: Area and Production of Major Crops (National) 2006
Area (‘000’ hectare)
Production (‘000’ tonnes)
Crop
2006 2006 Millet 4,270 5,940 Guinea Corn 4,578 6,474 Ground Nut 1,666 3,062

29
Beans 3,098 3,770 Yam 1,696 28,280 Cotton 222 516 Maize 4,670 7,023 Cassava 2,659 38,041 Rice 1,526 3,333 Melon 200 371 Cocoyam 513 2,220
Table 2.2.1.3 Farm gate prices (Major crops).
Table 2.2.1.3 showed the farm gate prices of major crop grown in the country for 2006/2007 survey year. It revealed that Beans stood at N22.26 per kg, Cassava (N 20.01per kg), Cocoyam (N 16.71 per kg), Ground nut at N 24.09 per kg and Millet at N 19.79 per kg.
NOTE Table 2.2.1.2: Area and Production of Major Crops (National) 2006 and Table 2.2.1.3 Farm gate prices (Major crops) were not generated from the survey result. 2.2.1.4: Distribution (absolute) of Crop farmers by Market channel and state 2006.
The survey result indicated that most crop farmers disposed their farm products (produces) through open market with a total figure of 6,964,721holders, followed by “On the farm” (1,196,269) and “direct to industry” accounted for 112,513holders. For open market, Kano state (622,456) topped the list, followed by Benue state (432,736) and Bayelsa state (28,949) was the least number.
2.2.1.5: Distribution (absolute) of Crop farmers by Problems encountered during storage and by state, 2006.
It was shown that 5,220,611holders indicated termites and insects as the problem encountered during storage; lack of modern method of storage was 5,191,883 holders, 3,880,591 holders indicated inadequate storage facilities and 2,553,568 holders mentioned stealing as a problem. For lack of modern method of storage, Kano state accounted for 441,136 holders, followed by Bauchi state (325,316) and Lagos state (3,091) was the least figure.
2.2.1.6: Distribution (absolute) of Crop farmers by Problems encountered during production process and by state, 2006.
Table 2.2.1.6 showed that five problems in production process were commonly enumerated by crop farmers: lack of funds (7,014,060 holders); lack of credit facilities (6,191,704); lack of encouragement from government

30
(5,735,857); lack of modern methods/equipment (5,699,853) and lack of infrastructure (5,119,706). For lack of funds, Kano state (593,217 holders) led the list, followed by Kastina state (428,856), Bunue state (411,478) and Bayelsa state (29,393) was the lowest.
2.2.1.7(a): Distribution of crop farm by access to any ICT facility
by state, 2006. In this era of IT awareness crop farmers are not left behind in the quest for use of this laudable technology. The table showed that many farmers have access to the use of most of the covered IT equipment from radio to even the use of website. The table revealed that 7,893,248 (58.82%) of Nigerian farmers had access to radio, followed by farmers that had access to telephone (mobile) with 2,702,264 (20%). The total of 2,373,273 (17.69%) had access to television. Farmers that had access to personal computer were 140,391 (1.0%). Those that had access to internet were 95,095 (0.7 %).
2.2.1.7(b): Distribution of crop farmers by possession of any ICT facility by
State, 2006. The table showed that 7,353,507 (72.71 %) of crop farmers possessed their own radio. Also 1,454,247 (14.38 %) of crop farmers had Television. It showed that 1,130,928 (11.2 %) of crop farmers had Telephone (mobile). Only 66,020 (0.7 %) had fixed Telephone. Farmers who possessed personal computers were 52,274 (0.52 %).
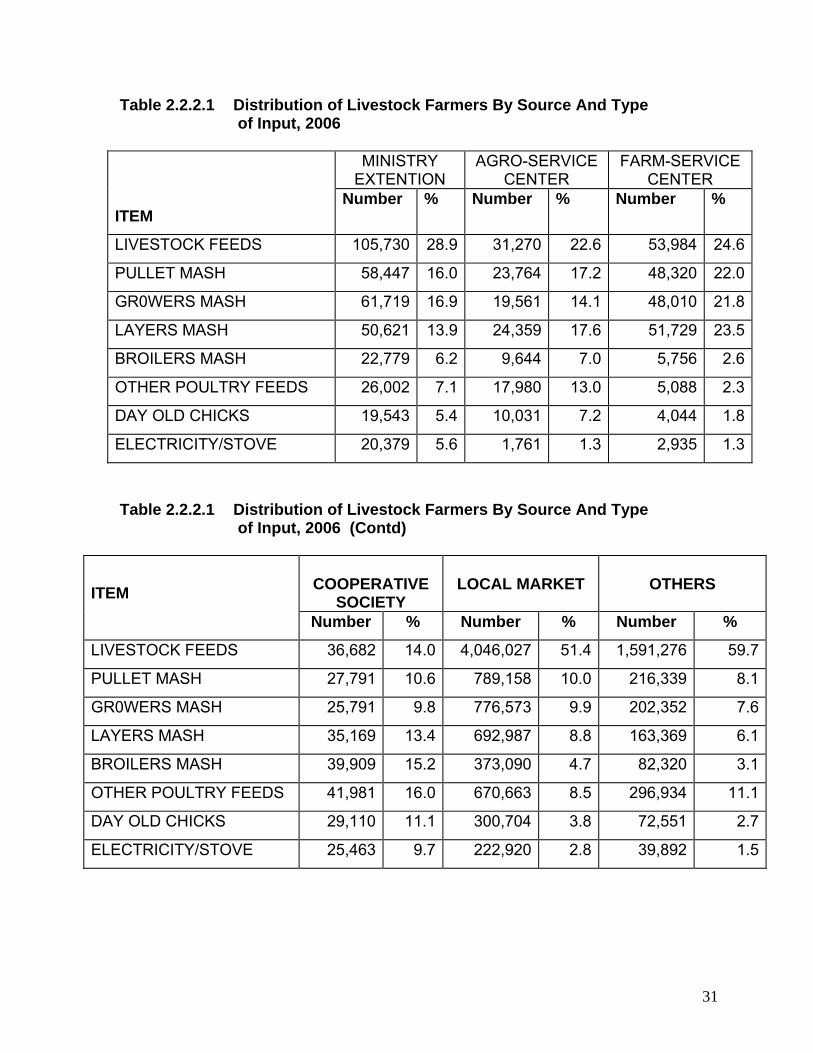
31
Table 2.2.2.1 Distribution of Livestock Farmers By Source And Type of Input, 2006
MINISTRY
EXTENTION AGRO-SERVICE
CENTER FARM-SERVICE
CENTER ITEM
Number % Number % Number %
LIVESTOCK FEEDS 105,730 28.9 31,270 22.6 53,984 24.6
PULLET MASH 58,447 16.0 23,764 17.2 48,320 22.0
GR0WERS MASH 61,719 16.9 19,561 14.1 48,010 21.8
LAYERS MASH 50,621 13.9 24,359 17.6 51,729 23.5
BROILERS MASH 22,779 6.2 9,644 7.0 5,756 2.6
OTHER POULTRY FEEDS 26,002 7.1 17,980 13.0 5,088 2.3
DAY OLD CHICKS 19,543 5.4 10,031 7.2 4,044 1.8
ELECTRICITY/STOVE 20,379 5.6 1,761 1.3 2,935 1.3
Table 2.2.2.1 Distribution of Livestock Farmers By Source And Type
of Input, 2006 (Contd)
ITEM
COOPERATIVE
SOCIETY
LOCAL MARKET
OTHERS
Number % Number % Number %
LIVESTOCK FEEDS 36,682 14.0 4,046,027 51.4 1,591,276 59.7
PULLET MASH 27,791 10.6 789,158 10.0 216,339 8.1
GR0WERS MASH 25,791 9.8 776,573 9.9 202,352 7.6
LAYERS MASH 35,169 13.4 692,987 8.8 163,369 6.1
BROILERS MASH 39,909 15.2 373,090 4.7 82,320 3.1
OTHER POULTRY FEEDS 41,981 16.0 670,663 8.5 296,934 11.1
DAY OLD CHICKS 29,110 11.1 300,704 3.8 72,551 2.7
ELECTRICITY/STOVE 25,463 9.7 222,920 2.8 39,892 1.5
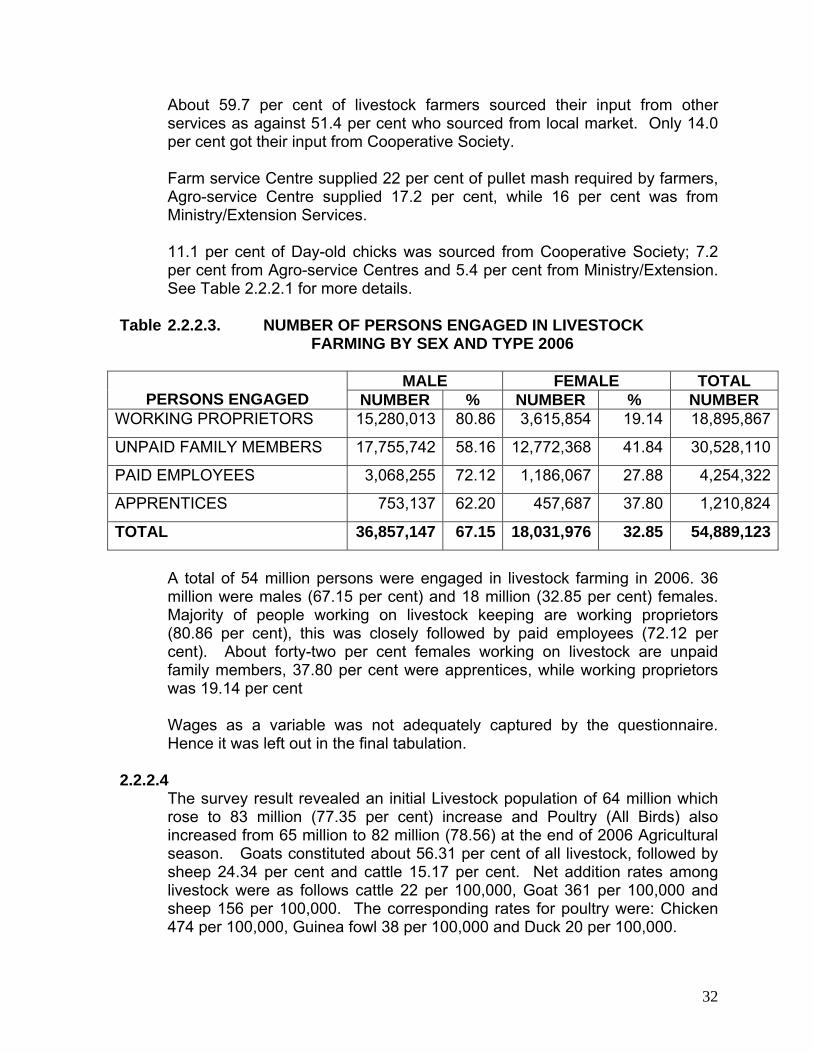
32
About 59.7 per cent of livestock farmers sourced their input from other services as against 51.4 per cent who sourced from local market. Only 14.0 per cent got their input from Cooperative Society.
Farm service Centre supplied 22 per cent of pullet mash required by farmers, Agro-service Centre supplied 17.2 per cent, while 16 per cent was from Ministry/Extension Services.
11.1 per cent of Day-old chicks was sourced from Cooperative Society; 7.2 per cent from Agro-service Centres and 5.4 per cent from Ministry/Extension. See Table 2.2.2.1 for more details.
Table 2.2.2.3. NUMBER OF PERSONS ENGAGED IN LIVESTOCK FARMING BY SEX AND TYPE 2006
MALE FEMALE TOTAL PERSONS ENGAGED NUMBER % NUMBER % NUMBER
WORKING PROPRIETORS 15,280,013 80.86 3,615,854 19.14 18,895,867
UNPAID FAMILY MEMBERS 17,755,742 58.16 12,772,368 41.84 30,528,110
PAID EMPLOYEES 3,068,255 72.12 1,186,067 27.88 4,254,322
APPRENTICES 753,137 62.20 457,687 37.80 1,210,824
TOTAL 36,857,147 67.15 18,031,976 32.85 54,889,123
A total of 54 million persons were engaged in livestock farming in 2006. 36 million were males (67.15 per cent) and 18 million (32.85 per cent) females. Majority of people working on livestock keeping are working proprietors (80.86 per cent), this was closely followed by paid employees (72.12 per cent). About forty-two per cent females working on livestock are unpaid family members, 37.80 per cent were apprentices, while working proprietors was 19.14 per cent
Wages as a variable was not adequately captured by the questionnaire. Hence it was left out in the final tabulation.
2.2.2.4
The survey result revealed an initial Livestock population of 64 million which rose to 83 million (77.35 per cent) increase and Poultry (All Birds) also increased from 65 million to 82 million (78.56) at the end of 2006 Agricultural season. Goats constituted about 56.31 per cent of all livestock, followed by sheep 24.34 per cent and cattle 15.17 per cent. Net addition rates among livestock were as follows cattle 22 per 100,000, Goat 361 per 100,000 and sheep 156 per 100,000. The corresponding rates for poultry were: Chicken 474 per 100,000, Guinea fowl 38 per 100,000 and Duck 20 per 100,000.

33
Table 2.2.2.4 Stocks and changes in stocks of livestock by type, 2006
LIVESTOCK/POULTRY DESRCIPTION
Initial population
Number born
Number bought
Number slaughtered
Number dead
Number sold BALANCE
CATTLE 10,069,448 2,236,399 1,106,247 190,963 200,935 1,121,774 11,898,422
GOAT 36,115,821 18,440,368 3,747,405 2,855,106 1,679,762 6,376,792 47,391,934
SHEEP 15,613,179 7,944,082 2,253,944 1,597,283 540,290 3,189,763 20,483,869
PIG 1,122,809 1,318,395 88,394 77,824 175,552 327,637 1,948,585
CAMEL 71,164 43,612 12,907 2,947 3,277 13,270 108,189
DONKEY 492,597 92,201 55,308 50,294 31,987 51,352 506,473
HORSE 116,951 40,787 15,309 33,300 1,708 4,316 133,722
OTHER ANIMALS 536,845 116,752 42,693 81,655 80,196 90,194 444,246
TOTAL ALL ANIMALS 64,138,814 30,232,596 7,322,207 4,889,373 2,713,706 11,175,098 82,915,440
CHICKEN 55,392,884 47,498,455 8,075,741 11,927,186 11,708,754 16,333,182 70,997,959
GUINEA FOWL 6,522,836 3,842,228 978,220 1,148,213 474,918 2,282,582 7,437,571
DUCK 2,087,153 2,134,494 177,187 278,938 460,991 850,757 2,808,147
TURKEY 466,217 77,241 847,133 62,175 36,313 389,404 902,700
OTHER BIRDS 347,965 189,837 31,636 68,461 54,076 91,967 354,935
TOTAL ALL BIRDS 64,817,056 53,742,255 10,109,917 13,484,973 12,735,0511 19,947,892 82,501,312

34
Table 2.2.2.5 Dairy Products: Quantity and Value by type 2006
DAIRY PRODUCTS QUANTITY PRODUCED VALUE OF PRODUCT NEGGS (CRATES) 10,694,534 3,071,171,681 MILK (LITRES) 8,068,053 437,157,468 CHEESE (KG) 516,671 226,159,127 BUTTER (KG) 1,633,750 97,931,885 OTHER DAIRIES 14,947 1,186,265 TOTAL 3,833,606,426
Output of eggs for the 2006 Agricultural year was 10,694,534 crates valued at N3,071,171,681. The corresponding figures for other product were milk (Litres) 8,068,053, Butter (kg) 1,633,750 with N437,157,468 and N97,931,885 as values respectively. The total value of all Dairy product was N3,833,606,426.
Table 2.2.2.6. Prices of Livestock by Type 2006 APRIL –
JUNE 2006 1ST QUARTER N ‘000
JULY – SEPT 2006 2ND QUARTER N ‘000
OCT-DEC 2006 3RD QUARTER N ‘000
JAN-DEC 2007 4TH QUARTER N ‘000
Cattle (No) 35,172.29 33,063.53 38,364.56 36,164.77Goat (No) 4,210.50 4,247.75 4,684.41 4,706.13Sheep (No) 5,205.35 5,499,96 5,783.87 5,617.30Pig (No) 6,087.17 6,712.02 6,993,61 5,806.09Camel (No) 15,670.58 13,977.80 18,503.62 21,889.75Other Animals 1,969.34 846.56 1,403.30 2,335.97Chicken (No) 700.94 636.52 810.23 723.53Guinea Fowl (No) 908.85 897.03 1,255.78 1,126.31Duck (No) 1,022.37 1,496.02 1,488.44 1,582.17Turkey (No) 7,152.68 5,812.94 4,152.08 2,080.87Other Birds (No) 554.55 332.05 350.00Eggs (crate) 362.82 342.25 369.34 405.24Milk (Litre) 424.27 389.66 370.80 438.61Cheese (Kg) 337.80 422.69 371.03 252.71Butter (Kg) 390.25 266.51 361.87 388.19Other Dairies 312.22 248.73 460.63
The table 2.2.2.6 shows that an average cattle was sold for N35,000 in the first quarter which dropped to N33,000 in the second quarter and rose to N38,364 in the third quarter and drop to N36,000 in the fourth quarter prices of Goat for the four quarters was N4,210, N4,247, N4,684 and N4,706 respectively.
A chicken sold for N700, N636, N810 and N723 respectively for the four quarters. For more details (See table 2.2.2.6.)

35
Table 2.2.2.7 Funds Committed to Livestock Farming by Source 2006
Source Amount %
Own Funds 79,485,964,111 90.46
Retained Profit 4,804,717,516 5.47
Short Term Private Loan 261,338,403 0.30
NACRDB 365,285,044 0.42
Banks 196,737,531 0.22
Others 2,753,821,249 3.13
Total Funds 87,867,763,854 100
About N79 billion was committed to Livestock Keeping, this represents 90.46 per cent of the total funds. Kano State topped the list of Livestock Keepers who committed their own funds to Livestock Keeping N18.5billion. Funds from all sources for Livestock Keeping in 2006 was N87.9 billion. (See Appendix for more details.
Table 2.2.2. 8 Number Of Livestock Processing Facilities By
Type And Capacity,2006 AVAILABLE CAPACITY
UTILIZED CAPACITY
536527.2682 439937.9194
Refrigerators 102711.9534 89835.52168
Smoking kiln 211333.7716 155867.2832
Dairies 32205.84938 23598.52857
Others 112731.0665 89044.87152
Total 995509.9091 798284.1244
The total number of livestock processing facilities was 9.9 million of which Abattoirs Refrigerators, Smoking Kiln, Dairies and others represent 53.9, 10.3, 21.2, 3.2 and 11.3 per cent respectively. Based on the available capacity and utilized capacity figures of the various livestock processing facilities, refrigerators recorded the highest capacity utilization rate of 82.0 per cent followed by abattoirs (82.0 per cent). While dairies recorded the lowest of 73.3 per cent. The average capacity utilization rate for all the livestock processing facilities stood at 79.1 per cent.

36
Table 2.2.2.9 Distribution Of Livestock Farmers By Market Channel, 2006
WHERE DO YOU SELL YOUR LIVESTOCK PRODUCE %
In the farm 558,090 6.8
In the neighbourh00d 1,667,083 20.4
In the 0pen market 5,518,488 67.4
In the cooperative s0ciety 113,797 1.4
Direct t0 the industry 68,352 0.8
0thers 262,049 3.2
Total 8,187,859 100
Table 2.2.2.9 showed that out of the total farmers surveyed 67.4 per cent of the farmers sold their livestock products in the open market while 20.4, 6.8, 1.4, 0.8 and 3.2 per cent sold in the neighborhood, farm, cooperative society, to the industry and others, respectively. The corresponding figures for the market channels are 558,090 (Farm), neighborhood (1,667,083) 5,518,488 (Open Market), 113, 797 (cooperative Society) 68,352 (Industry) and 262,049 (others).
Table 2.2.2.12: Distribution of Livestock Farmers by Problems Encountered in
Purchasing livestock inputs, 2006
PROBLEMS NUMER %
Too costly/High cost 3,582,431 23.0
Lack of Fund (Money) 4,443,854 28.5
Don’t know where to obtain 1,320,429 8.5
Not available 1,209,240 7.7
Scarce 816,467 5.2
Lack of Transport 1,596,891 10.2
Bad road 1,809,512 11.6
Others 828,374 5.3
Lack of funds (money) constituted 28.5 per cent of the major problem of livestock farmers in purchasing livestock input. This was closely followed by high cost of inputs 23.0 per cent and bad road 11.6 per cent. Lack of transport also constituted problems faced by livestock farmers.

37
Table 2.2.2.13: Distribution of Livestock Farmers By Government Assistance
Required 2006
ASSISTANCE REQUIRED NUMBER %
Credit 6,693,335 31.8
Grazing Land 3,329,218 15.4
Input 4,279,866 20.4
Infrastructure 4,359,084 20.7
Others 2,452,841 11.7
Total 21,024,345 100
A total of 6 million farmers (31.8 per cent) required Credit (Loan) from Government to assist them in livestock farming, 20.7 per cent or 4.4 million required Infrastructure such as roads, water, transport and equipment while 20.4 per cent or 4.3 million required Government to assist them in livestock input. A sum of N21million was the total assistance needed by livestock farmers from Government.
Table 2.2.2.14: Distribution of Livestock Farmers by Ways that can Improve
Livestock Activities 2006
SUGGESTION NUMBER %
Improved Credit facilities 3,373,351 25.9
Improved Storage facilities 2,340,911 18.0
Improved Processing facilities 2,505,748 19.3
Good price policy 2,540,327 19.5
Damming 1,297,182 10.0
Others 958,837 7.4
Total 13,016,357 100
To further improve livestock farming activities, 25.9 per cent or 3.3 million farmers suggested improved credit facilities, 19.5 per cent or 2.54 million wanted good price polity while 19.3 per cent or 2.5 million would like improved processing facilities. A total of 13 million farmers responded.
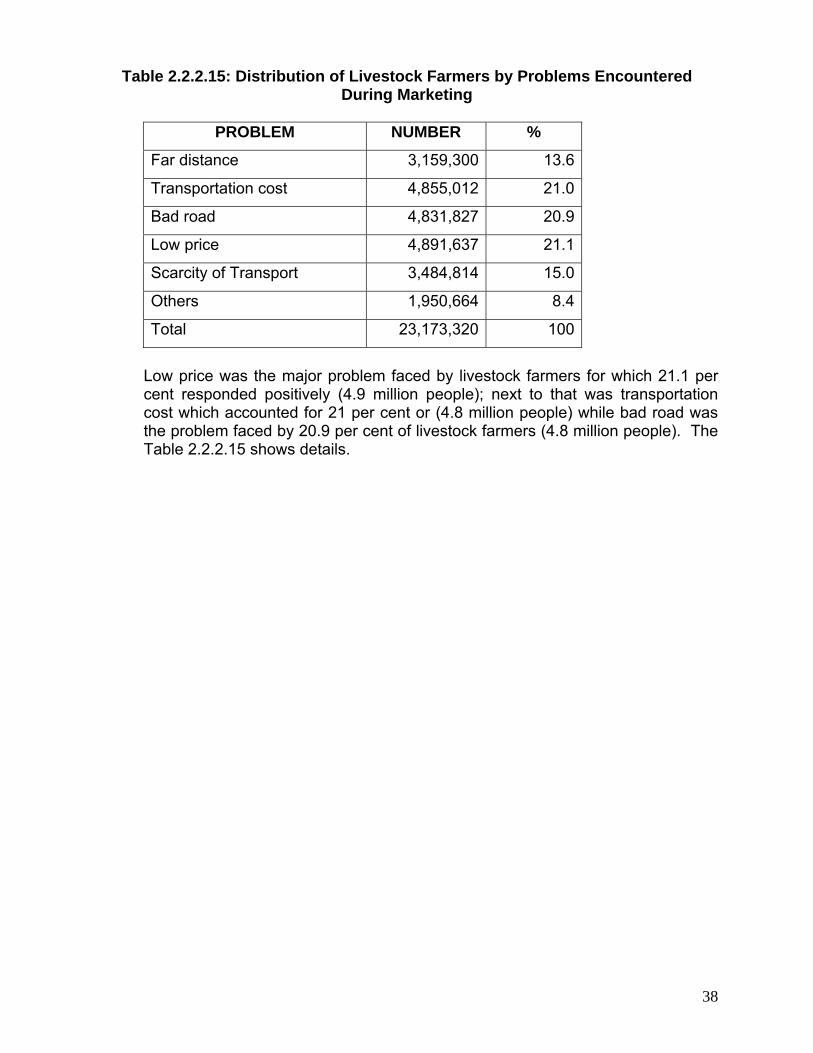
38
Table 2.2.2.15: Distribution of Livestock Farmers by Problems Encountered During Marketing
PROBLEM NUMBER %
Far distance 3,159,300 13.6
Transportation cost 4,855,012 21.0
Bad road 4,831,827 20.9
Low price 4,891,637 21.1
Scarcity of Transport 3,484,814 15.0
Others 1,950,664 8.4
Total 23,173,320 100
Low price was the major problem faced by livestock farmers for which 21.1 per cent responded positively (4.9 million people); next to that was transportation cost which accounted for 21 per cent or (4.8 million people) while bad road was the problem faced by 20.9 per cent of livestock farmers (4.8 million people). The Table 2.2.2.15 shows details.

39
Table 2.2.2.16a Distribution of Livestock Farmers by Access and Ownership of Information and Communication Technology Facilities
ACCESS TO RADIO
STATE ACCESS
OWNER SHIP
TOTAL
NO ACCESS
NO OWNERSHIP
TOTAL
Abia 133,783 130,358 264,140 9,435 12,860 22,294Adamawa 157,245 150,840 308,085 15,210 21,614 36,825Akwa ibom 168,543 149,969 318,512 17,902 36,475 54,377Anambra 152,831 140,694 293,525 743 12,880 13,624Bauchi 305,418 331,990 637,408 113,510 86,938 200,448Benue 321,312 304,983 626,295 51,775 68,104 119,879Borno 243,855 238,769 482,624 83,814 88,900 172,714Cross_rivers 56,974 51,926 108,899 12,220 17,269 29,489Delta 0 0 0 6,569 6,569 13,138Ebonyi 150,151 167,904 318,055 42,392 24,639 67,031Edo 46,123 46,547 92,669 27,356 26,932 54,288Enugu 149,300 140,393 289,693 54,172 63,080 117,252Imo 4,300 4,300 8,601 0 0 0Jigawa 309,731 296,316 606,047 42,797 56,212 99,009Kaduna 348,824 383,041 731,864 131,641 97,424 229,064Kano 1,013,902 887,388 1,901,290 125,884 252,398 378,282Katsina 362,375 285,820 648,195 88,396 164,951 253,347Kebbi 149,153 144,282 293,436 15,399 20,270 35,668Kogi 106,136 92,730 198,866 15,017 28,424 43,440Kwara 83,452 79,827 163,280 10,532 14,157 24,690Nassarawa 144,921 142,532 287,453 14,770 17,159 31,929Niger 185,436 183,486 368,922 4,957 6,906 11,863Ogun 36,901 25,397 62,298 0 11,505 11,505Ondo 58,259 55,974 114,233 7,708 9,994 17,702Osun 18,127 15,892 34,019 5,813 8,049 13,862Oyo 160,143 148,452 308,595 40,722 52,414 93,136Plateau 179,999 162,564 342,562 49,205 66,641 115,846Rivers 84,445 68,736 153,181 27,516 43,224 70,740Sokoto 274,840 258,737 533,577 15,691 31,794 47,486Taraba 100,371 96,628 197,000 26,281 30,024 56,304Yobe 129,845 116,803 246,648 20,331 33,373 53,704Zamfara 186,890 173,178 360,068 3,033 16,745 19,778FCT 7,812 7,560 15,372 1,260 1,512 2,772Total 5,831,397 5,484,016 11,315,413 1,082,052 1,429,434 2,511,486

40
Table 2.2.2.16a Distribution of Livestock Farmers by Access and Ownership of Information and Communication Technology Facilities (Contd)
TELEVISION
STATE ACCESS TO
TELEVISION OWNERSHIP
TOTAL ACCESS
NO ACCESS
NO OWNERSHIP
TOTAL NO ACCESS
Abia 77,677.5 75,427.9 153,105.5 65,539.9 67,789.5 133,329.3
Adamawa 37,120.6 32,017.2 69,137.7 135,334.3 140,437.7 275,772.1
Akwa ibom 102,685.7 56,588.3 159,273.9 83,759.0 129,856.4 213,615.5
Anambra 132,519.5 63,246.1 195,765.6 21,054.5 90,327.9 111,382.4
Bauchi 146,182.4 40,815.2 186,997.5 272,745.7 378,112.9 650,858.7
Benue 52,890.2 36,070.7 88,960.9 320,196.7 337,016.3 657,213.0
Borno 22,414.9 8,393.2 30,808.1 305,254.2 319,275.9 624,530.1
Cross_rivers 34,690.9 13,766.0 48,456.9 34,503.3 55,428.1 89,931.4
Delta 0.0 0.0 0.0 6,569.0 6,569.0 13,138.0
Ebonyi 45,974.2 28,864.4 74,838.6 146,568.5 163,678.3 310,246.9
Edo 36,724.1 34,063.2 70,787.4 36,754.5 39,415.4 76,169.9
Enugu 26,377.2 13,601.8 39,979.0 177,095.6 189,871.1 366,966.6
Imo 4,300.3 4,300.3 8,600.6 0.0 0.0 0.0
Jigawa 88,143.1 11,617.4 99,760.5 264,384.9 340,910.6 605,295.5
Kaduna 114,921.4 77,219.8 192,141.2 365,542.8 403,244.5 768,787.3
Kano 181,040.9 119,004.8 300,045.7 958,745.1 1,020,781.2 1,979,526.4
Katsina 31,169.4 11,636.9 42,806.2 419,601.9 439,134.4 858,736.3
Kebbi 19,477.4 24,584.7 44,062.2 145,074.6 139,967.2 285,041.8
Kogi 32,646.0 13,258.8 45,904.8 88,507.3 107,894.4 196,401.7
Kwara 31,910.0 27,688.1 59,598.1 62,074.6 66,296.4 128,371.0
Nassarawa 35,376.8 26,916.7 62,293.5 124,314.4 132,774.5 257,088.9
Niger 79,902.3 35,445.3 115,347.6 110,490.3 154,947.3 265,437.6
Ogun 10,853.3 6,946.1 17,799.5 26,048.0 29,955.2 56,003.2
Ondo 40,008.5 26,295.1 66,303.6 25,959.0 39,672.3 65,631.3
Osun 19,468.7 8,641.9 28,110.6 4,471.5 15,298.3 19,769.8
Oyo 43,263.4 39,864.1 83,127.5 157,602.2 161,001.5 318,603.7
Plateau 37,927.5 7,425.4 45,352.9 191,276.8 221,778.8 413,055.6
Rivers 53,304.4 42,226.7 95,531.1 58,656.2 69,733.8 128,390.0
Sokoto 84,163.7 32,255.7 116,419.4 206,367.6 258,275.7 464,643.3
Taraba 16,327.9 18,259.3 34,587.2 110,324.2 108,392.7 218,716.9
Yobe 20,639.5 10,136.1 30,775.6 129,536.4 140,039.8 269,576.2
Zamfara 0.0 0.0 0.0 189,923.0 189,923.0 379,846.0
FCT 2,772.0 1,722.0 4,494.0 6,300.0 7,350.0 13,650.0
Total 1,662,873.5 948,299.3 2,611,172.8 5,250,576.0 5,965,150.2 11,215,726.2
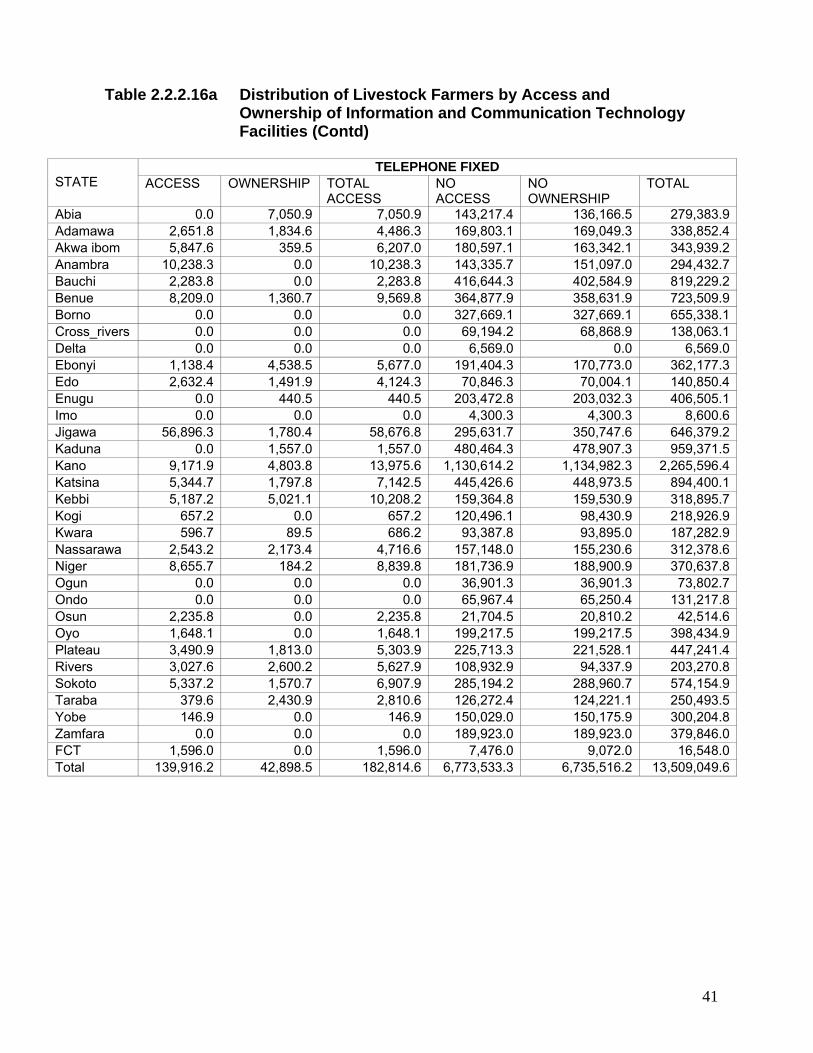
41
Table 2.2.2.16a Distribution of Livestock Farmers by Access and Ownership of Information and Communication Technology Facilities (Contd)
TELEPHONE FIXED STATE ACCESS OWNERSHIP TOTAL
ACCESS NO ACCESS
NO OWNERSHIP
TOTAL
Abia 0.0 7,050.9 7,050.9 143,217.4 136,166.5 279,383.9Adamawa 2,651.8 1,834.6 4,486.3 169,803.1 169,049.3 338,852.4Akwa ibom 5,847.6 359.5 6,207.0 180,597.1 163,342.1 343,939.2Anambra 10,238.3 0.0 10,238.3 143,335.7 151,097.0 294,432.7Bauchi 2,283.8 0.0 2,283.8 416,644.3 402,584.9 819,229.2Benue 8,209.0 1,360.7 9,569.8 364,877.9 358,631.9 723,509.9Borno 0.0 0.0 0.0 327,669.1 327,669.1 655,338.1Cross_rivers 0.0 0.0 0.0 69,194.2 68,868.9 138,063.1Delta 0.0 0.0 0.0 6,569.0 0.0 6,569.0Ebonyi 1,138.4 4,538.5 5,677.0 191,404.3 170,773.0 362,177.3Edo 2,632.4 1,491.9 4,124.3 70,846.3 70,004.1 140,850.4Enugu 0.0 440.5 440.5 203,472.8 203,032.3 406,505.1Imo 0.0 0.0 0.0 4,300.3 4,300.3 8,600.6Jigawa 56,896.3 1,780.4 58,676.8 295,631.7 350,747.6 646,379.2Kaduna 0.0 1,557.0 1,557.0 480,464.3 478,907.3 959,371.5Kano 9,171.9 4,803.8 13,975.6 1,130,614.2 1,134,982.3 2,265,596.4Katsina 5,344.7 1,797.8 7,142.5 445,426.6 448,973.5 894,400.1Kebbi 5,187.2 5,021.1 10,208.2 159,364.8 159,530.9 318,895.7Kogi 657.2 0.0 657.2 120,496.1 98,430.9 218,926.9Kwara 596.7 89.5 686.2 93,387.8 93,895.0 187,282.9Nassarawa 2,543.2 2,173.4 4,716.6 157,148.0 155,230.6 312,378.6Niger 8,655.7 184.2 8,839.8 181,736.9 188,900.9 370,637.8Ogun 0.0 0.0 0.0 36,901.3 36,901.3 73,802.7Ondo 0.0 0.0 0.0 65,967.4 65,250.4 131,217.8Osun 2,235.8 0.0 2,235.8 21,704.5 20,810.2 42,514.6Oyo 1,648.1 0.0 1,648.1 199,217.5 199,217.5 398,434.9Plateau 3,490.9 1,813.0 5,303.9 225,713.3 221,528.1 447,241.4Rivers 3,027.6 2,600.2 5,627.9 108,932.9 94,337.9 203,270.8Sokoto 5,337.2 1,570.7 6,907.9 285,194.2 288,960.7 574,154.9Taraba 379.6 2,430.9 2,810.6 126,272.4 124,221.1 250,493.5Yobe 146.9 0.0 146.9 150,029.0 150,175.9 300,204.8Zamfara 0.0 0.0 0.0 189,923.0 189,923.0 379,846.0FCT 1,596.0 0.0 1,596.0 7,476.0 9,072.0 16,548.0Total 139,916.2 42,898.5 182,814.6 6,773,533.3 6,735,516.2 13,509,049.6
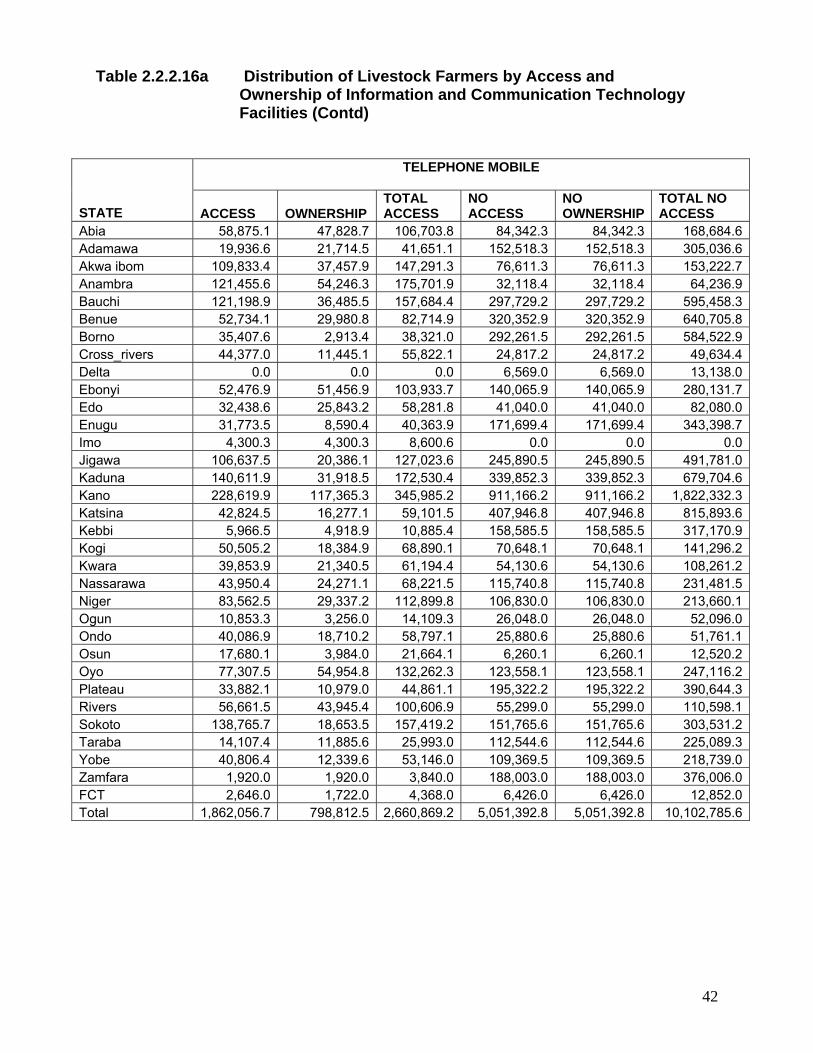
42
Table 2.2.2.16a Distribution of Livestock Farmers by Access and Ownership of Information and Communication Technology Facilities (Contd)
TELEPHONE MOBILE
STATE ACCESS OWNERSHIP TOTAL ACCESS
NO ACCESS
NO OWNERSHIP
TOTAL NO ACCESS
Abia 58,875.1 47,828.7 106,703.8 84,342.3 84,342.3 168,684.6Adamawa 19,936.6 21,714.5 41,651.1 152,518.3 152,518.3 305,036.6Akwa ibom 109,833.4 37,457.9 147,291.3 76,611.3 76,611.3 153,222.7Anambra 121,455.6 54,246.3 175,701.9 32,118.4 32,118.4 64,236.9Bauchi 121,198.9 36,485.5 157,684.4 297,729.2 297,729.2 595,458.3Benue 52,734.1 29,980.8 82,714.9 320,352.9 320,352.9 640,705.8Borno 35,407.6 2,913.4 38,321.0 292,261.5 292,261.5 584,522.9Cross_rivers 44,377.0 11,445.1 55,822.1 24,817.2 24,817.2 49,634.4Delta 0.0 0.0 0.0 6,569.0 6,569.0 13,138.0Ebonyi 52,476.9 51,456.9 103,933.7 140,065.9 140,065.9 280,131.7Edo 32,438.6 25,843.2 58,281.8 41,040.0 41,040.0 82,080.0Enugu 31,773.5 8,590.4 40,363.9 171,699.4 171,699.4 343,398.7Imo 4,300.3 4,300.3 8,600.6 0.0 0.0 0.0Jigawa 106,637.5 20,386.1 127,023.6 245,890.5 245,890.5 491,781.0Kaduna 140,611.9 31,918.5 172,530.4 339,852.3 339,852.3 679,704.6Kano 228,619.9 117,365.3 345,985.2 911,166.2 911,166.2 1,822,332.3Katsina 42,824.5 16,277.1 59,101.5 407,946.8 407,946.8 815,893.6Kebbi 5,966.5 4,918.9 10,885.4 158,585.5 158,585.5 317,170.9Kogi 50,505.2 18,384.9 68,890.1 70,648.1 70,648.1 141,296.2Kwara 39,853.9 21,340.5 61,194.4 54,130.6 54,130.6 108,261.2Nassarawa 43,950.4 24,271.1 68,221.5 115,740.8 115,740.8 231,481.5Niger 83,562.5 29,337.2 112,899.8 106,830.0 106,830.0 213,660.1Ogun 10,853.3 3,256.0 14,109.3 26,048.0 26,048.0 52,096.0Ondo 40,086.9 18,710.2 58,797.1 25,880.6 25,880.6 51,761.1Osun 17,680.1 3,984.0 21,664.1 6,260.1 6,260.1 12,520.2Oyo 77,307.5 54,954.8 132,262.3 123,558.1 123,558.1 247,116.2Plateau 33,882.1 10,979.0 44,861.1 195,322.2 195,322.2 390,644.3Rivers 56,661.5 43,945.4 100,606.9 55,299.0 55,299.0 110,598.1Sokoto 138,765.7 18,653.5 157,419.2 151,765.6 151,765.6 303,531.2Taraba 14,107.4 11,885.6 25,993.0 112,544.6 112,544.6 225,089.3Yobe 40,806.4 12,339.6 53,146.0 109,369.5 109,369.5 218,739.0Zamfara 1,920.0 1,920.0 3,840.0 188,003.0 188,003.0 376,006.0FCT 2,646.0 1,722.0 4,368.0 6,426.0 6,426.0 12,852.0Total 1,862,056.7 798,812.5 2,660,869.2 5,051,392.8 5,051,392.8 10,102,785.6

43
Table 2.2.2.16a Distribution of Livestock Farmers by Access and Ownership of Information and Communication Technology Facilities (Contd)
PERSONAL COMPUTERS
STATE
ACCESS OWNERSHIP
TOTAL ACCESS
NO ACCESS
NO OWNER SHIP
TOTAL NO ACCESS
Abia 873.0 335.8 1,208.7 142,344.4 142,881.6 285,226.1Adamawa 520.3 1,954.6 2,475.0 171,934.5 170,500.3 342,434.8Akwa ibom 5,733.7 359.5 6,093.2 180,711.0 186,085.2 366,796.2Anambra 1,651.3 0.0 1,651.3 151,922.7 153,574.0 305,496.7Bauchi 0.0 0.0 0.0 418,928.1 418,928.1 837,856.2Benue 2,074.6 0.0 2,074.6 371,012.4 373,087.0 744,099.4Borno 743.9 0.0 743.9 326,925.2 327,669.1 654,594.3Cross_rivers 3,439.1 0.0 3,439.1 65,755.1 69,194.2 134,949.2Delta 0.0 0.0 0.0 6,569.0 6,569.0 13,138.0Ebonyi 1,138.4 6,296.3 7,434.7 191,404.3 186,246.5 377,650.8Edo 409.4 0.0 409.4 73,069.3 73,478.6 146,547.9Enugu 0.0 0.0 0.0 203,472.8 203,472.8 406,945.6Imo 4,300.3 2,150.1 6,450.4 0.0 2,150.1 2,150.1Jigawa 59,299.9 890.2 60,190.2 293,228.1 351,637.8 644,865.9Kaduna 4,671.0 0.0 4,671.0 475,793.3 480,464.3 956,257.5Kano 6,053.4 4,585.9 10,639.3 1,133,732.6 1,135,200.1 2,268,932.7Katsina 5,344.7 2,720.9 8,065.6 445,426.6 448,050.3 893,476.9Kebbi 230.0 1,648.1 1,878.1 164,322.0 162,903.8 327,225.9Kogi 0.0 0.0 0.0 121,153.3 121,153.3 242,306.5Kwara 1,163.6 179.0 1,342.6 92,820.9 93,805.5 186,626.5Nassarawa 1,496.3 0.0 1,496.3 158,194.8 159,691.2 317,886.0Niger 5,377.6 184.2 5,561.7 185,015.0 190,208.4 375,223.4Ogun 0.0 0.0 0.0 36,901.3 36,901.3 73,802.7Ondo 0.0 0.0 0.0 65,967.4 65,967.4 131,934.9Osun 470.7 0.0 470.7 23,469.5 23,940.2 47,409.7Oyo 0.0 0.0 0.0 200,865.6 200,865.6 401,731.2Plateau 848.6 1,813.0 2,661.6 228,355.6 227,391.3 455,746.9Rivers 11,077.6 3,027.6 14,105.3 100,882.9 108,932.9 209,815.8Sokoto 9,835.7 0.0 9,835.7 280,695.7 290,531.4 571,227.1Taraba 1,198.8 0.0 1,198.8 125,453.2 126,652.0 252,105.3Yobe 146.9 0.0 146.9 150,029.0 150,175.9 300,204.8Zamfara 0.0 0.0 0.0 189,923.0 189,923.0 379,846.0FCT 798.0 0.0 798.0 8,274.0 9,072.0 17,346.0Total 128,896.8 26,145.3 155,042.1 6,784,552.7 6,887,304.2 13,671,856.
9
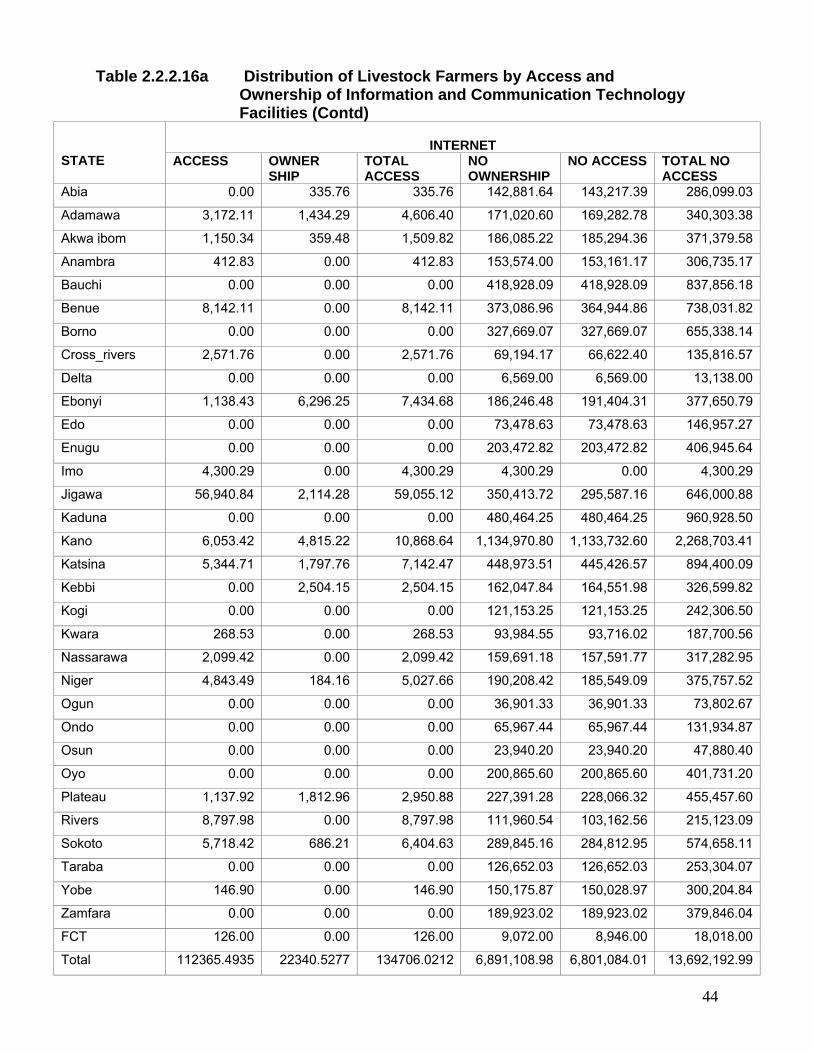
44
Table 2.2.2.16a Distribution of Livestock Farmers by Access and Ownership of Information and Communication Technology Facilities (Contd)
INTERNET
STATE ACCESS OWNER
SHIP TOTAL ACCESS
NO OWNERSHIP
NO ACCESS TOTAL NO ACCESS
Abia 0.00 335.76 335.76 142,881.64 143,217.39 286,099.03
Adamawa 3,172.11 1,434.29 4,606.40 171,020.60 169,282.78 340,303.38
Akwa ibom 1,150.34 359.48 1,509.82 186,085.22 185,294.36 371,379.58
Anambra 412.83 0.00 412.83 153,574.00 153,161.17 306,735.17
Bauchi 0.00 0.00 0.00 418,928.09 418,928.09 837,856.18
Benue 8,142.11 0.00 8,142.11 373,086.96 364,944.86 738,031.82
Borno 0.00 0.00 0.00 327,669.07 327,669.07 655,338.14
Cross_rivers 2,571.76 0.00 2,571.76 69,194.17 66,622.40 135,816.57
Delta 0.00 0.00 0.00 6,569.00 6,569.00 13,138.00
Ebonyi 1,138.43 6,296.25 7,434.68 186,246.48 191,404.31 377,650.79
Edo 0.00 0.00 0.00 73,478.63 73,478.63 146,957.27
Enugu 0.00 0.00 0.00 203,472.82 203,472.82 406,945.64
Imo 4,300.29 0.00 4,300.29 4,300.29 0.00 4,300.29
Jigawa 56,940.84 2,114.28 59,055.12 350,413.72 295,587.16 646,000.88
Kaduna 0.00 0.00 0.00 480,464.25 480,464.25 960,928.50
Kano 6,053.42 4,815.22 10,868.64 1,134,970.80 1,133,732.60 2,268,703.41
Katsina 5,344.71 1,797.76 7,142.47 448,973.51 445,426.57 894,400.09
Kebbi 0.00 2,504.15 2,504.15 162,047.84 164,551.98 326,599.82
Kogi 0.00 0.00 0.00 121,153.25 121,153.25 242,306.50
Kwara 268.53 0.00 268.53 93,984.55 93,716.02 187,700.56
Nassarawa 2,099.42 0.00 2,099.42 159,691.18 157,591.77 317,282.95
Niger 4,843.49 184.16 5,027.66 190,208.42 185,549.09 375,757.52
Ogun 0.00 0.00 0.00 36,901.33 36,901.33 73,802.67
Ondo 0.00 0.00 0.00 65,967.44 65,967.44 131,934.87
Osun 0.00 0.00 0.00 23,940.20 23,940.20 47,880.40
Oyo 0.00 0.00 0.00 200,865.60 200,865.60 401,731.20
Plateau 1,137.92 1,812.96 2,950.88 227,391.28 228,066.32 455,457.60
Rivers 8,797.98 0.00 8,797.98 111,960.54 103,162.56 215,123.09
Sokoto 5,718.42 686.21 6,404.63 289,845.16 284,812.95 574,658.11
Taraba 0.00 0.00 0.00 126,652.03 126,652.03 253,304.07
Yobe 146.90 0.00 146.90 150,175.87 150,028.97 300,204.84
Zamfara 0.00 0.00 0.00 189,923.02 189,923.02 379,846.04
FCT 126.00 0.00 126.00 9,072.00 8,946.00 18,018.00
Total 112365.4935 22340.5277 134706.0212 6,891,108.98 6,801,084.01 13,692,192.99

45
Table 2.2.2.16a Distribution of Livestock Farmers by Access and Ownership of Information and Communication Technology Facilities (Contd)
STATE
WEBSITE
ACCESS OWNERSHIP TOTAL ACCESS
NO ACCESS NO OWNERSHIP
TOTAL NO ACCESS
Abia 0 2350.30303 2350.30303 143217.3939 140867.0909 284084.4848 Adamawa 520.3466667 1434.288889 1954.635556 171934.5467 171020.6044 342955.1511 Akwa ibom 0 359.4807692 359.4807692 186444.701 186085.2202 372529.9211 Anambra 412.8333333 0 412.8333333 153161.1667 153574 306735.1667 Bauchi 0 0 0 418928.0882 418928.0882 837856.1765 Benue 0 0 0 373086.9643 373086.9643 746173.9286 Borno 0 0 0 327669.0714 327669.0714 655338.1429 Cross_rivers 1460.468 0 1460.468 67733.69881 69194.16681 136927.8656 Delta 0 0 0 6569 6569 13138 Ebonyi 1138.425926 6296.254321 7434.680247 191404.3099 186246.4815 377650.7913 Edo 0 0 0 73478.63439 73478.63439 146957.2688 Enugu 0 0 0 203472.8183 203472.8183 406945.6367 Imo 0 0 0 4300.285714 4300.285714 8600.571428 Jigawa 3672.166667 1502.25 5174.416667 348855.8333 351025.75 699881.5833 Kaduna 0 0 0 480464.25 480464.25 960928.5 Kano 6053.422222 4081.474074 10134.8963 1133732.603 1135704.551 2269437.155 Katsina 5344.705883 1797.764706 7142.470589 445426.5735 448973.5147 894400.0882 Kebbi 536.6033898 3168.515254 3705.118644 164015.3814 161383.4695 325398.8509 Kogi 0 0 0 121153.2511 121153.2511 242306.5021 Kwara 179.0181818 0 179.0181818 93805.52763 93984.54581 187790.0734 Nassarawa 989.9684211 0 989.9684211 158701.2126 159691.181 318392.3936 Niger 3130.77551 184.1632653 3314.938775 187261.8122 190208.4245 377470.2367 Ogun 0 0 0 36901.33333 36901.33333 73802.66666 Ondo 0 0 0 65967.43582 65967.43582 131934.8716 Osun 0 0 0 23940.20113 23940.20113 47880.40226 Oyo 0 0 0 200865.6 200865.6 401731.2 Plateau 0 1812.958491 1812.958491 229204.2415 227391.283 456595.5245 Rivers 427.4322581 0 427.4322581 111533.1048 111960.5371 223493.6419 Sokoto 1448.666667 0 1448.666667 289082.7041 290531.3708 579614.0749 Taraba 0 0 0 126652.0338 126652.0338 253304.0677 Yobe 146.9 0 146.9 150028.97 150175.87 300204.84 Zamfara 0 0 0 189923.0214 189923.0214 379846.0429 FCT 126 0 126 8946 9072 18018 Total 25587.73312 22987.4528 48575.18592 6887861.77 6890462.051 13778323.82

46
Table 2.2.2.16b Percentage Distribution of Livestock Farmers by Access and Ownership of Information and Communication Technology Facilities
RADIO STATE
TOTAL ACCESS
TOTAL NO
ACCESS
TOTAL
% ACCESS
% NO ACCESS
Abia 264,140 22,294 286,435 92.2 7.8Adamawa 308,085 36,825 344,910 89.3 10.7Akwa ibom 318,512 54,377 372,889 85.4 14.6Anambra 293,525 13,624 307,148 95.6 4.4Bauchi 637,408 200,448 837,856 76.1 23.9Benue 626,295 119,879 746,174 83.9 16.1Borno 482,624 172,714 655,338 73.6 26.4Cross_rivers 108,899 29,489 138,388 78.7 21.3Delta 0 13,138 13,138 0.0 100.0Ebonyi 318,055 67,031 385,085 82.6 17.4Edo 92,669 54,288 146,957 63.1 36.9Enugu 289,693 117,252 406,946 71.2 28.8Imo 8,601 0 8,601 100.0 0.0Jigawa 606,047 99,009 705,056 86.0 14.0Kaduna 731,864 229,064 960,929 76.2 23.8Kano 1,901,290 378,282 2,279,572 83.4 16.6Katsina 648,195 253,347 901,543 71.9 28.1Kebbi 293,436 35,668 329,104 89.2 10.8Kogi 198,866 43,440 242,307 82.1 17.9Kwara 163,280 24,690 187,969 86.9 13.1Nassarawa 287,453 31,929 319,382 90.0 10.0Niger 368,922 11,863 380,785 96.9 3.1Ogun 62,298 11,505 73,803 84.4 15.6Ondo 114,233 17,702 131,935 86.6 13.4Osun 34,019 13,862 47,880 71.0 29.0Oyo 308,595 93,136 401,731 76.8 23.2Plateau 342,562 115,846 458,408 74.7 25.3Rivers 153,181 70,740 223,921 68.4 31.6Sokoto 533,577 47,486 581,063 91.8 8.2Taraba 197,000 56,304 253,304 77.8 22.2Yobe 246,648 53,704 300,352 82.1 17.9Zamfara 360,068 19,778 379,846 94.8 5.2FCT 15,372 2,772 18,144 84.7 15.3Total 11,315,413 2,511,486 13,826,899 81.8 18.2

47
Table 2.2.2.16b Percentage Distribution of Livestock Farmers by Access and Ownership of Information and Communication Technology Facilities (Contd)
TELEVISION
STATE TOTAL ACCESS
TOTAL NO ACCESS
TOTAL %ACCESS % NO ACCESS
Abia 153,105.45 133,329.33 286,434.79 53.5 46.5Adamawa 69,137.73 275,772.06 344,909.79 20.0 80.0Akwa ibom 159,273.95 213,615.46 372,889.40 42.7 57.3Anambra 195,765.57 111,382.43 307,148.00 63.7 36.3Bauchi 186,997.51 650,858.67 837,856.18 22.3 77.7Benue 88,960.89 657,213.04 746,173.93 11.9 88.1Borno 30,808.08 624,530.06 655,338.14 4.7 95.3Cross_rivers 48,456.94 89,931.40 138,388.33 35.0 65.0Delta 0.00 13,138.00 13,138.00 0.0 100.0Ebonyi 74,838.60 310,246.87 385,085.47 19.4 80.6Edo 70,787.38 76,169.89 146,957.27 48.2 51.8Enugu 39,978.99 366,966.64 406,945.64 9.8 90.2Imo 8,600.57 0.00 8,600.57 100.0 0.0Jigawa 99,760.53 605,295.47 705,056.00 14.1 85.9Kaduna 192,141.21 768,787.29 960,928.50 20.0 80.0Kano 300,045.67 1,979,526.38 2,279,572.05 13.2 86.8Katsina 42,806.24 858,736.32 901,542.56 4.7 95.3Kebbi 44,062.17 285,041.80 329,103.97 13.4 86.6Kogi 45,904.83 196,401.68 242,306.50 18.9 81.1Kwara 59,598.14 128,370.96 187,969.09 31.7 68.3Nassarawa 62,293.47 257,088.89 319,382.36 19.5 80.5Niger 115,347.59 265,437.58 380,785.18 30.3 69.7Ogun 17,799.47 56,003.20 73,802.67 24.1 75.9Ondo 66,303.58 65,631.30 131,934.87 50.3 49.7Osun 28,110.65 19,769.76 47,880.40 58.7 41.3Oyo 83,127.46 318,603.74 401,731.20 20.7 79.3Plateau 45,352.89 413,055.59 458,408.48 9.9 90.1Rivers 95,531.11 128,389.96 223,921.07 42.7 57.3Sokoto 116,419.43 464,643.31 581,062.74 20.0 80.0Taraba 34,587.17 218,716.90 253,304.07 13.7 86.3Yobe 30,775.55 269,576.19 300,351.74 10.2 89.8Zamfara 0.00 379,846.04 379,846.04 0.0 100.0FCT 4,494.00 13,650.00 18,144.00 24.8 75.2Total 2,611,172.78 11,215,726.22 13,826,899.01 18.9 81.1

48
Table 2.2.2.16b Percentage Distribution of Livestock Farmers by Access and Ownership of Information and Communication Technology Facilities (Contd)
TELEPHONE (FIXED)
STATE TOTAL ACCESS
TOTAL NO ACCESS
TOTAL %ACCESS % NO ACCESS
Abia 7,050.9 279,383.9 286,434.8 2.5 97.5 Adamawa 4,486.3 338,852.4 343,338.7 1.3 98.7 Akwa ibom 6,207.0 343,939.2 350,146.3 1.8 98.2 Anambra 10,238.3 294,432.7 304,671.0 3.4 96.6 Bauchi 2,283.8 819,229.2 821,513.0 0.3 99.7 Benue 9,569.8 723,509.9 733,079.6 1.3 98.7 Borno 0.0 655,338.1 655,338.1 0.0 100.0 Cross_rivers 0.0 138,063.1 138,063.1 0.0 100.0 Delta 0.0 6,569.0 6,569.0 0.0 100.0 Ebonyi 5,677.0 362,177.3 367,854.3 1.5 98.5 Edo 4,124.3 140,850.4 144,974.6 2.8 97.2 Enugu 440.5 406,505.1 406,945.6 0.1 99.9 Imo 0.0 8,600.6 8,600.6 0.0 100.0 Jigawa 58,676.8 646,379.2 705,056.0 8.3 91.7 Kaduna 1,557.0 959,371.5 960,928.5 0.2 99.8 Kano 13,975.6 2,265,596.4 2,279,572.1 0.6 99.4 Katsina 7,142.5 894,400.1 901,542.6 0.8 99.2 Kebbi 10,208.2 318,895.7 329,104.0 3.1 96.9 Kogi 657.2 218,926.9 219,584.1 0.3 99.7 Kwara 686.2 187,282.9 187,969.1 0.4 99.6 Nassarawa 4,716.6 312,378.6 317,095.2 1.5 98.5 Niger 8,839.8 370,637.8 379,477.6 2.3 97.7 Ogun 0.0 73,802.7 73,802.7 0.0 100.0 Ondo 0.0 131,217.8 131,217.8 0.0 100.0 Osun 2,235.8 42,514.6 44,750.4 5.0 95.0 Oyo 1,648.1 398,434.9 400,083.1 0.4 99.6 Plateau 5,303.9 447,241.4 452,545.3 1.2 98.8 Rivers 5,627.9 203,270.8 208,898.6 2.7 97.3 Sokoto 6,907.9 574,154.9 581,062.7 1.2 98.8 Taraba 2,810.6 250,493.5 253,304.1 1.1 98.9 Yobe 146.9 300,204.8 300,351.7 0.0 100.0 Zamfara 0.0 379,846.0 379,846.0 0.0 100.0 FCT 1,596.0 16,548.0 18,144.0 8.8 91.2 Total 182,814.6 13,509,049.6 13,691,864.2 1.3 98.7

49
Table 2.2.2.16b Percentage Distribution of Livestock Farmers by Access and Ownership of Information and Communication Technology Facilities (Contd)
TELEPHONE MOBILE
STATE TOTAL
ACCESS TOTAL NO ACCESS
TOTAL
% ACCESS
%NO ACCESS
Abia 106,703.8 106,703.8 213,407.5 50 50 Adamawa 41,651.1 41,651.1 83,302.2 50 50 Akwa ibom 147,291.3 147,291.3 294,582.5 50 50 Anambra 175,701.9 175,701.9 351,403.7 50 50 Bauchi 157,684.4 157,684.4 315,368.9 50 50 Benue 82,714.9 82,714.9 165,429.8 50 50 Borno 38,321.0 38,321.0 76,642.1 50 50 Cross_rivers 55,822.1 55,822.1 111,644.2 50 50 Delta 0.0 0.0 0.0 0 0 Ebonyi 103,933.7 103,933.7 207,867.5 50 50 Edo 58,281.8 58,281.8 116,563.6 50 50 Enugu 40,363.9 40,363.9 80,727.7 50 50 Imo 8,600.6 8,600.6 17,201.1 50 50 Jigawa 127,023.6 127,023.6 254,047.2 50 50 Kaduna 172,530.4 172,530.4 345,060.9 50 50 Kano 345,985.2 345,985.2 691,970.4 50 50 Katsina 59,101.5 59,101.5 118,203.0 50 50 Kebbi 10,885.4 10,885.4 21,770.8 50 50 Kogi 68,890.1 68,890.1 137,780.2 50 50 Kwara 61,194.4 61,194.4 122,388.8 50 50 Nassarawa 68,221.5 68,221.5 136,443.0 50 50 Niger 112,899.8 112,899.8 225,799.5 50 50 Ogun 14,109.3 14,109.3 28,218.7 50 50 Ondo 58,797.1 58,797.1 117,594.2 50 50 Osun 21,664.1 21,664.1 43,328.2 50 50 Oyo 132,262.3 132,262.3 264,524.5 50 50 Plateau 44,861.1 44,861.1 89,722.2 50 50 Rivers 100,606.9 100,606.9 201,213.7 50 50 Sokoto 157,419.2 157,419.2 314,838.5 50 50 Taraba 25,993.0 25,993.0 51,986.0 50 50 Yobe 53,146.0 53,146.0 106,291.9 50 50 Zamfara 3,840.0 3,840.0 7,680.0 50 50 FCT 4,368.0 4,368.0 8,736.0 50 50 Total 2,660,869.2 2,660,869.2 5,321,738.4 50 50

50
Table 2.2.2.16b Percentage Distribution of Livestock Farmers by Access and Ownership of Information and Communication Technology Facilities (Contd) STATE
PERSONAL COMPUTER
TOTAL ACCESS
TOTAL NO ACCESS
TOTAL
%ACCESS
%NO ACCESS
Abia 1,208.7 285,226.1 286,434.8 0.4 99.6Adamawa 2,475.0 342,434.8 344,909.8 0.7 99.3Akwa ibom 6,093.2 366,796.2 372,889.4 1.6 98.4Anambra 1,651.3 305,496.7 307,148.0 0.5 99.5Bauchi 0.0 837,856.2 837,856.2 0.0 100.0Benue 2,074.6 744,099.4 746,173.9 0.3 99.7Borno 743.9 654,594.3 655,338.1 0.1 99.9Cross_rivers 3,439.1 134,949.2 138,388.3 2.5 97.5Delta 0.0 13,138.0 13,138.0 0.0 100.0Ebonyi 7,434.7 377,650.8 385,085.5 1.9 98.1Edo 409.4 146,547.9 146,957.3 0.3 99.7Enugu 0.0 406,945.6 406,945.6 0.0 100.0Imo 6,450.4 2,150.1 8,600.6 75.0 25.0Jigawa 60,190.2 644,865.9 705,056.0 8.5 91.5Kaduna 4,671.0 956,257.5 960,928.5 0.5 99.5Kano 10,639.3 2,268,932.7 2,279,572.1 0.5 99.5Katsina 8,065.6 893,476.9 901,542.6 0.9 99.1Kebbi 1,878.1 327,225.9 329,104.0 0.6 99.4Kogi 0.0 242,306.5 242,306.5 0.0 100.0Kwara 1,342.6 186,626.5 187,969.1 0.7 99.3Nassarawa 1,496.3 317,886.0 319,382.4 0.5 99.5Niger 5,561.7 375,223.4 380,785.2 1.5 98.5Ogun 0.0 73,802.7 73,802.7 0.0 100.0Ondo 0.0 131,934.9 131,934.9 0.0 100.0Osun 470.7 47,409.7 47,880.4 1.0 99.0Oyo 0.0 401,731.2 401,731.2 0.0 100.0Plateau 2,661.6 455,746.9 458,408.5 0.6 99.4Rivers 14,105.3 209,815.8 223,921.1 6.3 93.7Sokoto 9,835.7 571,227.1 581,062.7 1.7 98.3Taraba 1,198.8 252,105.3 253,304.1 0.5 99.5Yobe 146.9 300,204.8 300,351.7 0.0 100.0Zamfara 0.0 379,846.0 379,846.0 0.0 100.0FCT 798.0 17,346.0 18,144.0 4.4 95.6Total 155,042.1 13,671,856.9 13,826,899.0 1.1 98.9

51
Table 2.2.2.16b Percentage Distribution of Livestock Farmers by Access and Ownership of Information and Communication Technology Facilities (Contd)
STATE
INTERNET
TOTAL ACCESS
TOTAL NO ACCESS
TOTAL %ACCESS %NO ACCESS
Abia 335.76 286,099.03 286,434.79 0.1 99.9Adamawa 4,606.40 340,303.38 344,909.79 1.3 98.7Akwa ibom 1,509.82 371,379.58 372,889.40 0.4 99.6Anambra 412.83 306,735.17 307,148.00 0.1 99.9Bauchi 0.00 837,856.18 837,856.18 0.0 100.0Benue 8,142.11 738,031.82 746,173.93 1.1 98.9Borno 0.00 655,338.14 655,338.14 0.0 100.0Cross_rivers 2,571.76 135,816.57 138,388.33 1.9 98.1Delta 0.00 13,138.00 13,138.00 0.0 100.0Ebonyi 7,434.68 377,650.79 385,085.47 1.9 98.1Edo 0.00 146,957.27 146,957.27 0.0 100.0Enugu 0.00 406,945.64 406,945.64 0.0 100.0Imo 4,300.29 4,300.29 8,600.57 50.0 50.0Jigawa 59,055.12 646,000.88 705,056.00 8.4 91.6Kaduna 0.00 960,928.50 960,928.50 0.0 100.0Kano 10,868.64 2,268,703.41 2,279,572.05 0.5 99.5Katsina 7,142.47 894,400.09 901,542.56 0.8 99.2Kebbi 2,504.15 326,599.82 329,103.97 0.8 99.2Kogi 0.00 242,306.50 242,306.50 0.0 100.0Kwara 268.53 187,700.56 187,969.09 0.1 99.9Nassarawa 2,099.42 317,282.95 319,382.36 0.7 99.3Niger 5,027.66 375,757.52 380,785.18 1.3 98.7Ogun 0.00 73,802.67 73,802.67 0.0 100.0Ondo 0.00 131,934.87 131,934.87 0.0 100.0Osun 0.00 47,880.40 47,880.40 0.0 100.0Oyo 0.00 401,731.20 401,731.20 0.0 100.0Plateau 2,950.88 455,457.60 458,408.48 0.6 99.4Rivers 8,797.98 215,123.09 223,921.07 3.9 96.1Sokoto 6,404.63 574,658.11 581,062.74 1.1 98.9Taraba 0.00 253,304.07 253,304.07 0.0 100.0Yobe 146.90 300,204.84 300,351.74 0.0 100.0Zamfara 0.00 379,846.04 379,846.04 0.0 100.0FCT 126.00 18,018.00 18,144.00 0.7 99.3Total 13,692,192.99 13,692,192.99 0.0 100.0

52
Table 2.2.2.16b Percentage Distribution of Livestock Farmers by Access and Ownership of Information and Communication Technology Facilities (Contd)
STATE
WEBSITE
TOTAL ACCESS
TOTAL NO ACCESS
TOTAL % ACCESS
%NO ACCESS
Abia 2,350.3 284,084.5 286,434.8 0.8 99.2Adamawa 1,954.6 342,955.2 344,909.8 0.6 99.4Akwa ibom 359.5 372,529.9 372,889.4 0.1 99.9Anambra 412.8 306,735.2 307,148.0 0.1 99.9Bauchi 0.0 837,856.2 837,856.2 0.0 100.0Benue 0.0 746,173.9 746,173.9 0.0 100.0Borno 0.0 655,338.1 655,338.1 0.0 100.0Cross_rivers 1,460.5 136,927.9 138,388.3 1.1 98.9Delta 0.0 13,138.0 13,138.0 0.0 100.0Ebonyi 7,434.7 377,650.8 385,085.5 1.9 98.1Edo 0.0 146,957.3 146,957.3 0.0 100.0Enugu 0.0 406,945.6 406,945.6 0.0 100.0Imo 0.0 8,600.6 8,600.6 0.0 100.0Jigawa 5,174.4 699,881.6 705,056.0 0.7 99.3Kaduna 0.0 960,928.5 960,928.5 0.0 100.0Kano 10,134.9 2,269,437.2 2,279,572.1 0.4 99.6Katsina 7,142.5 894,400.1 901,542.6 0.8 99.2Kebbi 3,705.1 325,398.9 329,104.0 1.1 98.9Kogi 0.0 242,306.5 242,306.5 0.0 100.0Kwara 179.0 187,790.1 187,969.1 0.1 99.9Nassarawa 990.0 318,392.4 319,382.4 0.3 99.7Niger 3,314.9 377,470.2 380,785.2 0.9 99.1Ogun 0.0 73,802.7 73,802.7 0.0 100.0Ondo 0.0 131,934.9 131,934.9 0.0 100.0Osun 0.0 47,880.4 47,880.4 0.0 100.0Oyo 0.0 401,731.2 401,731.2 0.0 100.0Plateau 1,813.0 456,595.5 458,408.5 0.4 99.6Rivers 427.4 223,493.6 223,921.1 0.2 99.8Sokoto 1,448.7 579,614.1 581,062.7 0.2 99.8Taraba 0.0 253,304.1 253,304.1 0.0 100.0Yobe 146.9 300,204.8 300,351.7 0.0 100.0Zamfara 0.0 379,846.0 379,846.0 0.0 100.0FCT 126.0 18,018.0 18,144.0 0.7 99.3Total 48,575.2 13,778,323.8 13,826,899.0 0.4 99.6

53
2.2.3: FISH FARMERS 2.2.3.1 Summary Table :
Fishing site
Number
%
Pond
92562 6
Stream 347279 27 River 1038042 47 Lake 259376 5 Ocean 126135 13 Others 4,342 3 Total
1,867,736
100.00
Table 2.2.3.1: Distribution of Fish Farmers by Fishing Site, 2006
POND STREAM RIVER STATE NUMBERS % NUMBERS % NUMBER %
Akwa ibom 1869 2.0 42282 12.2 120614 11.6Anambra 0 0 0 0 33440 3.2Bayelsa 2083 2.3 12610 3.6 26892 2.6Borno 0 0 0 0 0 0Cross_rivers 0 0 0 0 31306 3.0Delta 0 0 191596 55.2 247432 23.8Edo 0 0 27790 8.0 27790 2.7Gombe 0 0 0 0 11336 1.1Jigawa 9614 10.4 0 0 57086 5.5Katsina 0 0 6195 1.8 12390 1.2Kebbi 1256 1.4 0 0 48494. 4.7Kogi 0 0 0 0 64286 6.2Lagos 0 0 0 0 0 0Niger 0 0 0 0 99264 9.6Ogun 6512 7.0 0 0 53724 5.2Ondo 37268 40.3 12100 3.5 60500 5.8Rivers 0 0 0 0 55624 5.4Taraba 2278 2.5 10098 2.9 25432 2.5Yobe 31681 34.2 44609 12.8 62432 6.0Total 92562 100 347279 100 1038042 100

54
Table 2.2.3.1: Distribution of Fish Farmers by Fishing Site, 2006 Contd
STATE LAKE OCEAN OTHER
NUMBER % NUMBER % NUMBER % Akwa ibom 65158 25.1 60886 48.3 0 0Anambra 0 0 0 0 0 0Bayelsa 2630 1.0 3864 3.1 4342 100Borno 41656 16.1 0 0 0 0Cross_rivers 0 0 0 0 0 0Delta 56931 21.9 0 0 0 0Edo 0 0 0 0 0 0Gombe 0 0 0 0 0 0Jigawa 0 0 0 0 0 0Katsina 0 0 0 0 0 0Kebbi 0 0 0 0 0 0Kogi 68533 26.4 0 0 0 0Lagos 0 0 12365 9.8 0 0Niger 0 0 0 0 0 0Ogun 0 0 35816 28.4 0 0Ondo 0 0 12100 9.6 0 0Rivers 2070 0.8 1104 .9 0 0Taraba 13437 5.2 0 0 0 0Yobe 8961 3.5 0 0 0 0Total 259376 100 126135 100 4342 100
No of Fish Farmers: 92,562 or 4.96% No of Fish Hunters: 1,775,174 or 95.04%
There are two categories of fishermen, the fish farmers and the fish hunters. The fish farmers are those who cultivate fish in ponds, tanks etc. They spend their resources in fish cultivation. The survey revealed that out of a total of 1,867,736 fishermen interviewed, 92,562 or 4.96 per cent practiced fish cultivation while 1, 775,174 or 95.04 per cent are fish hunters. These are fishermen who hunt for fish in the stream, River, Lake, Ocean or others.
Fish cultivation is more prevalence in Ondo State with a total of 37,268(40.26 per cent) fish cultivators, closely followed by Yobe State 31,661 (34.23 per cent) and Jigawa State 9614 (10.39 per cent).
Edo State hunts fish more in stream, 191,596 (55.2 per cent) and River State 247,432 (23.8 per cent) as against Akwa-Ibom State who does fishing in the ocean 60,886 (48.3 per cent). Kogi State had interest in fishing in the Lake 68533 (26.4 per cent)

55
2.2.3.2: Number of Persons Engaged in Fish Farming by Sex, 2006 The number of Males engaged in fish farming in 2006, showed a quarterly increase from 443,857 to 507,457 in the second quarter with a drop to 451,285 in the third quarter and rose to 490,519 in the fourth quarter.
The same pattern featured in the number of women engaged in fish farming, from 99,013 in the first quarter to 123,709 in the second quarter and a slight drop to 122,830 in the third quarter with a steady growth to 141,046 in the fourth quarter.
Table 2.2.3.2a: Number of Persons Engaged in Fish Farming by
Sex, 2006 (1st quarter), 2006 STATE
WORKING PROPRIETOR MALE
WORKING PROPRIETOR FEMALE
UNPAID FAMILY WORKER MALE
UNPAID FAMILY WORKER FEMALE
Abia . . . . Adamawa . . . . Akwa ibom 69,876 445 32,312 445 Anambra . . . . Bauchi . . . . Bayelsa 25,388 5,763 20,710 26,102 Benue . . . . Borno 16,662 . 8,331 . Cross_rivers 31,306 0 34,152 34,152 Delta 220,062 77,186 143,971 172,984 Ebonyi . . . . Edo 16,674 0 11,116 11,116 Ekiti . . . . Enugu . . . . Gombe . . 3,779 . Imo . . . . Jigawa 37,857 0 0 0 Kaduna . . . . Kano . . . . Katsina 9,293 0 3,098 0 Kebbi 88,195 28,142 120,105 1,256 Kogi 77,413 965 165,637 94,788 Kwara . . . . Lagos . . . . Nassarawa . . . . Niger 263,501 . 2,256 0 Ogun . . . . Ondo . . . . Osun . . . . Oyo . . . . Plateau . . . . Rivers 32,436 16,839 2,070 6,349 Sokoto . . . . Taraba 16,853 0 68,400 4,556 Yobe 37,019 . 205,905 . Zamfara . . . . FCT . . . . TOTAL 942,533 129,340 821,841 351,747

56
Table 2.2.3.2a Number of people engaged in fish farming by sex(1st quarter), 2006 (Contd)
STATE
APPRENTICE MALE
APPRENTICE FEMALE
PAID EMPLOYEE MALE
PAID EMPLOYEE FEMALE
Abia . . . . Adamawa . . . . Akwa ibom 18,604 . 193,161 . Anambra . . . . Bauchi . . . . Bayelsa 0 88 11,329 507 Benue . . . . Borno . . . . Cross_rivers 2,846 0 4,269 0 Delta 70,069 0 . 22,444 Ebonyi . . . . Edo 0 0 . . Ekiti . . . . Enugu . . . . Gombe . . . . Imo . . . . Jigawa 0 0 0 0 Kaduna . . . . Kano . . . . Katsina . . . . Kebbi . . . . Kogi 0 0 120,270 76,062 Kwara . . . . Lagos . . . . Nassarawa . . . . Niger . . . . Ogun . . . . Ondo . . . . Osun . . . . Oyo . . . . Plateau . . . . Rivers 7,867 0 11,594 0 Sokoto . . . . Taraba 2,278 0 42,515 0 Yobe 15,914 . 60,719 0 Zamfara . . . . FCT . . . . TOTAL 117,579 88 443,857 99,013
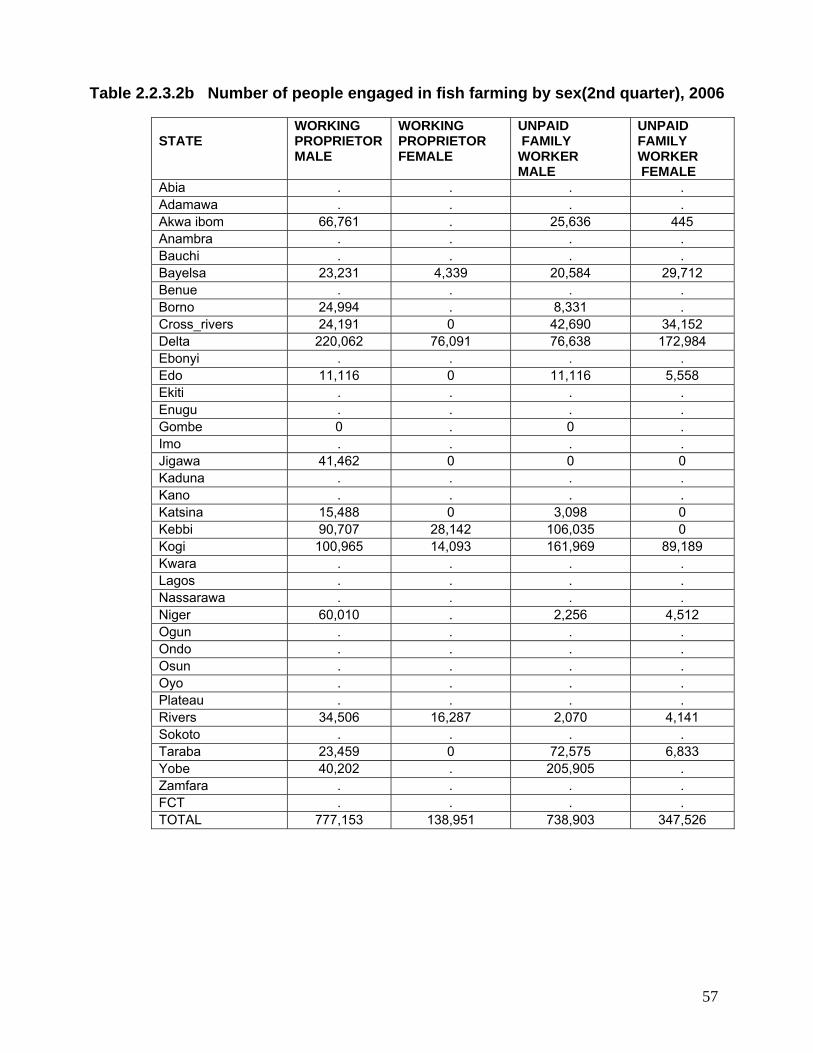
57
Table 2.2.3.2b Number of people engaged in fish farming by sex(2nd quarter), 2006
STATE
WORKING PROPRIETOR MALE
WORKING PROPRIETOR FEMALE
UNPAID FAMILY WORKER MALE
UNPAID FAMILY WORKER FEMALE
Abia . . . . Adamawa . . . . Akwa ibom 66,761 . 25,636 445 Anambra . . . . Bauchi . . . . Bayelsa 23,231 4,339 20,584 29,712 Benue . . . . Borno 24,994 . 8,331 . Cross_rivers 24,191 0 42,690 34,152 Delta 220,062 76,091 76,638 172,984 Ebonyi . . . . Edo 11,116 0 11,116 5,558 Ekiti . . . . Enugu . . . . Gombe 0 . 0 . Imo . . . . Jigawa 41,462 0 0 0 Kaduna . . . . Kano . . . . Katsina 15,488 0 3,098 0 Kebbi 90,707 28,142 106,035 0 Kogi 100,965 14,093 161,969 89,189 Kwara . . . . Lagos . . . . Nassarawa . . . . Niger 60,010 . 2,256 4,512 Ogun . . . . Ondo . . . . Osun . . . . Oyo . . . . Plateau . . . . Rivers 34,506 16,287 2,070 4,141 Sokoto . . . . Taraba 23,459 0 72,575 6,833 Yobe 40,202 . 205,905 . Zamfara . . . . FCT . . . . TOTAL 777,153 138,951 738,903 347,526

58
Table 2.2.3.2b Number Of People Engaged In Fish Farming By Sex (2nd Quarter), 2006 (Contd)
STATE
APPRENTICE MALE
APPRENTICE FEMALE
PAID EMPLOYEE MALE
PAID EMPLOYEE FEMALE
Abia . . . . Adamawa . . . . Akwa ibom 16,824 . 219,865 . Anambra . . . . Bauchi . . . . Bayelsa 0 88 6,420 0 Benue . . . . Borno . . . . Cross_rivers 0 0 0 0 Delta 44,888 33,392 . 22,444 Ebonyi . . . . Edo 0 0 . . Ekiti . . . . Enugu . . . . Gombe . . . . Imo . . . . Jigawa 9,614 0 0 0 Kaduna . . . . Kano . . . . Katsina . . . . Kebbi . . . . Kogi 0 0 185,521 101,351 Kwara . . . . Lagos . . . . Nassarawa . . . . Niger . . . . Ogun . . . . Ondo . . . . Osun . . . . Oyo . . . . Plateau . . . . Rivers 7,729 0 11,594 0 Sokoto . . . . Taraba 2,278 0 39,251 0 Yobe 15,914 . 44,805 . Zamfara . . . . FCT . . . . TOTAL 97,248 33,480 507,457 123,795
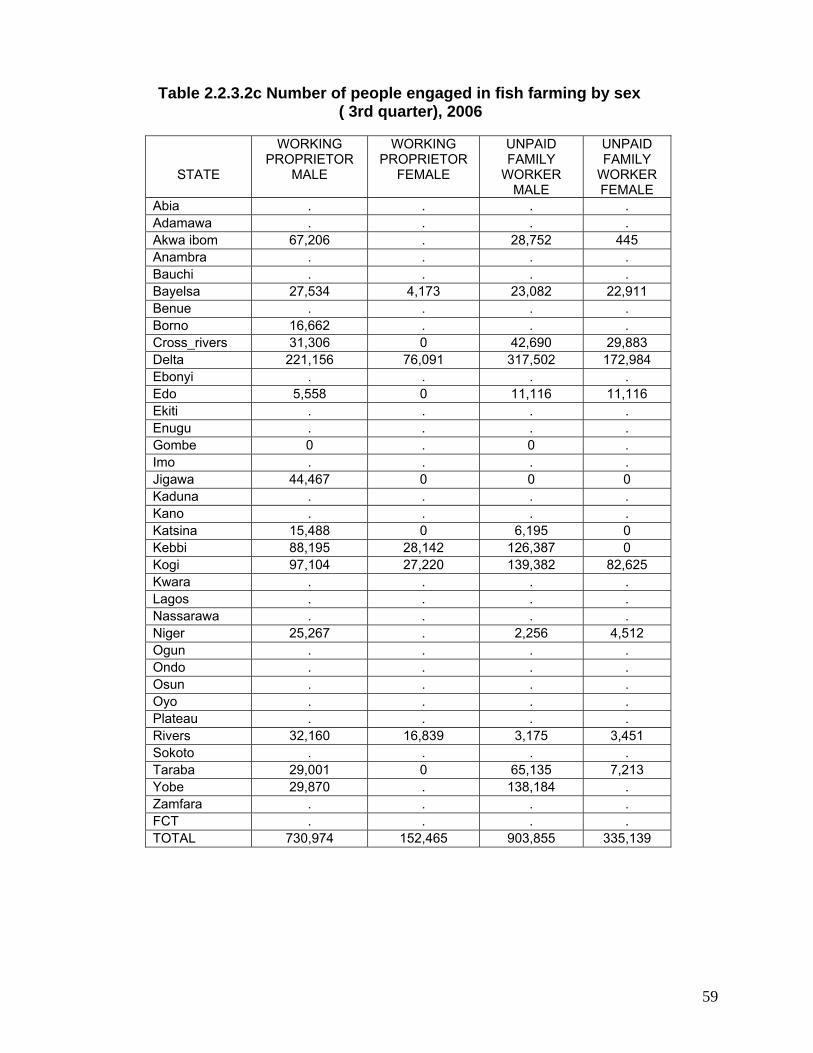
59
Table 2.2.3.2c Number of people engaged in fish farming by sex
( 3rd quarter), 2006
STATE
WORKING PROPRIETOR
MALE
WORKING PROPRIETOR
FEMALE
UNPAID FAMILY
WORKER MALE
UNPAID FAMILY
WORKER FEMALE
Abia . . . . Adamawa . . . . Akwa ibom 67,206 . 28,752 445 Anambra . . . . Bauchi . . . . Bayelsa 27,534 4,173 23,082 22,911 Benue . . . . Borno 16,662 . . . Cross_rivers 31,306 0 42,690 29,883 Delta 221,156 76,091 317,502 172,984 Ebonyi . . . . Edo 5,558 0 11,116 11,116 Ekiti . . . . Enugu . . . . Gombe 0 . 0 . Imo . . . . Jigawa 44,467 0 0 0 Kaduna . . . . Kano . . . . Katsina 15,488 0 6,195 0 Kebbi 88,195 28,142 126,387 0 Kogi 97,104 27,220 139,382 82,625 Kwara . . . . Lagos . . . . Nassarawa . . . . Niger 25,267 . 2,256 4,512 Ogun . . . . Ondo . . . . Osun . . . . Oyo . . . . Plateau . . . . Rivers 32,160 16,839 3,175 3,451 Sokoto . . . . Taraba 29,001 0 65,135 7,213 Yobe 29,870 . 138,184 . Zamfara . . . . FCT . . . . TOTAL 730,974 152,465 903,855 335,139

60
Table 2.2.3.2c Number of people engaged in fish farming by sex ( 3rd quarter), 2006 (Contd)
STATE
APPRENTICE MALE
APPRENTICE FEMALE
PAID EMPLOYEE MALE
PAID EMPLOYEE FEMALE
Abia . . . . Adamawa . . . . Akwa ibom 16,824 . 189,155 . Anambra . . . . Bauchi . . . . Bayelsa 0 88 10,294 0 Benue . . . . Borno . . . . Cross_rivers 4,269 0 8,538 0 Delta 78,281 0 . 22,444 Ebonyi . . . . Edo 0 0 . . Ekiti . . . . Enugu . . . . Gombe . . . . Imo . . . . Jigawa 0 0 0 0 Kaduna . . . . Kano . . . . Katsina . . . . Kebbi . . . . Kogi 0 0 149,421 100,386 Kwara . . . . Lagos . . . . Nassarawa . . . . Niger . . . . Ogun . . . . Ondo . . . . Osun . . . . Oyo . . . . Plateau . . . . Rivers 8,420 0 18,357 0 Sokoto . . . . Taraba 2,278 0 32,723 0 Yobe . . 42,797 0 Zamfara . . . . FCT . . . . TOTAL 110,071 88 451,285 122,830

61
Table 2.2.3.2d Number of People Engaged in Fish Farming by Sex(4th Quarter), 2006
STATE
WORKING PROPRIETOR MALE
WORKING PROPRIETOR FEMALE
UNPAID FAMILY WORKER MALE
UNPAID FAMILY WORKER FEMALE
APPRENTICE MALE
APPRENTICE FEMALE
PAID EMPLOYEE MALE
PAID EMPLOYEE FEMALE
Abia . . . . . . . . Adamawa . . . . . . . . Akwa ibom 102,722 0 47,000 445 16,824 . 192,716 . Anambra . . . . . . . . Bauchi . . . . . . . . Bayelsa 33,008 4,173 33,386 25,272 0 88 12,012 107 Benue . . . . . . . . Borno 8,331 . . . . . . . Cross_rivers 31,306 0 42,690 29,883 1,423 0 0 0 Delta 198,712 50,910 166,415 172,984 44,888 33,392 . 22,444 Ebonyi . . . . . . . . Edo 11,116 0 11,116 11,116 0 0 . . Ekiti . . . . . . . . Enugu . . . . . . . . Gombe . . . . . . . . Imo . . . . . . . . Jigawa 47,471 0 0 0 0 0 0 9,614 Kaduna . . . . . . . . Kano . . . . . . . . Katsina 15,488 0 0 . . . . . Kebbi 90,707 28,142 120,105 0 . . . . Kogi 70,849 7,529 138,417 88,224 0 0 173,938 108,880 Kwara . . . . . . . . Lagos . . . . . . . . Nassarawa . . . . . . . . Niger 43,766 . 2,256 4,512 . . . . Ogun . . . . . . . . Ondo . . . . . . . . Osun . . . . . . . . Oyo . . . . . . . . Plateau . . . . . . . . Rivers 31,608 16,839 2,070 3,451 4,831 -690 16,287 0 Sokoto . . . . . . . . Taraba 21,486 0 70,905 7,593 2,278 0 34,848 0 Yobe 47,791 . 142,885 . . . 60,719 0 Zamfara . . . . . . . . FCT . . . . . . . . TOTAL 754,363 107,593 777,244 343,479 70,243 32,790 490,519 141,046

62
2.2.3.3 Distribution of Household by POND Capacity 2006 The figures showed a decline from 53,244,937 to 35,442,617 (66.56%) and others from 654,751 to 486,256 (74.26%).
Table 2.2.3.3 Distribution of Household by POND Capacity 2006
ITEM
AVAILABLE CAPACITY
UTILIZED CAPACITY
Fresh Fish Shrimps Other
53244937
0
654751
35442617
0
486256 2.2.3.4 Quarterly Fish Production by Type
Inland Rivers and Lakes were the major source of fish production that was popular. They accounted for 257,386,211 in the first quarter, 211,628,506 in the second quarter, 195,332,184 in the third quarter with a higher production of 548,025,669 in the fourth quarter. This was closely followed by Coastal and Brackish water.
Table 2.2.3.4 Quarterly fish production by type
ITEM Qtr1 Qtr2 Qtr3 Qtr4
ARTISANAL 0 878 1,703,684 809,300
COASTAL & BRAKISH WATER 18,286,022 46,992,423 80104,319 59,858,439
INLAND RIVERS & LAKES 257,386,211 211,628,506 195,332,184 548,025,669
IN SHORES 128,854 122,106 1,068,398 438,141
FISH FARMS/PONDS 7806 4,757 124,019 308,983
DISTANT WATERS 75,115,268 54,157,938 10,685,258 14,252,777
SHRIMPS 16,126,896 10,840,404 9,963,334 7,700,848
CRABS 207,465 183,048 165,630 124,223
PERIWINCLES 487,918 539,402 302,551 289,162
OTHERS 4,447,886 61,329,889 34,424,554 25,407,367
2.2.3.5: Distribution of Fish Holdings by Source of Input
Majority of fish cultivators collect their input from Ministry and extension services 21780 (50.0 per cent) and Local Markets 107068 (25.8 per cent). Fish feeds are also sourced from Ministry and Extension Services 21780 (50.0 per cent) and others 47,131(45.6 per cent).
Fertilizer were sought from service centre 14,0761 (80.5 per cent) while water treatment chemical and poultry droppings are from the Local Market 3256 (8 per cent) respectively.

63
Table 2.2.3.5: Distribution of Fish Holdings by Source of Input
MINISTRY/EXTENTIO
N
AGROCENTRE
SERVICE CENTER
ITEM NUMBER % NUMBER % NUMBER % FINGERLINGS 21780 50 0 0 0 0 FERTILIZER 0 0 0 0 14071 80.5 FISH FEED 21780 50 1220 100.0 3419 19.5 POULTRY DROPPINGS 0 0 0 0 0 0 WATER TREATMENT CHEMICAL 0 0 0 0 0 0 OTHERS 0 0 0 0 0 0
Table 2.2.3.5: Distribution of Fish Holdings by Source of Input (Contd)
COOPERATIVELOCAL
MARKET OTHERS
ITEM NUMEBER % NUMBER % NUMBER %
FINGERLINGS 0 0 107068 25.8 9389 9.1 FERTILIZER 0 0 18348 4.4 18499 17.9 FISH FEED 0 0 108424 26.2 47131 45.6 POULTRY DROPPINGS 0 0 3256 8 3256 3.2 WATER TREATMENT CHEMICAL 0 0 3256 8 0 0 OTHERS 0 0 174171 42.0 25072 24.3 2.2.3.6 Quantity of Fish Sold by Type and Quarters With Value
Fresh fish accounted for the highest sale of fish produced in 2006. The quantity increased from the first to fourth quarter, while value also increased marginally except for the second quarter when the value decreased from N12,843,476,097 to N11,118,417,766. See table for details.
Table 2.2.3.6. Quantity of Fish Sold by Type and Quarters with Value
1ST QUARTER 2ND QUARTER
Quantity Value N Quantity Value N FRESH FISH 1,670,723,418 12,843,476,097 2,596,409,235 11,118,417,766DRY/ SM0KED FISH 39,9042,700 4,481,965,634 479,356,640 4,472,491,744CANNED FISH 18,584,713 114,124,606 11,999,846 102,386,242SHRIMPS 300,470,136 864,035,279 25,580,358 779,528,498CRABS 48,799,333 330,845,925 37,054,475 311,660,450PERIWINCLES 21,258,245 232,434,100 15,536,450 136,165,803OTHERS 93,003,941 373,263,720 140,577,817 604,025,740

64
Table 2.2.3.6 Quantity of Fish Sold by Type and Quarters with Value (Contd.)
3RD QUARTER 4TH QUARTER Quantity Value N Quantity Value N
FRESH FISH 730,621,612 12,955,614,952 6,395,837,000 15,228,187,601DRY/SM0KED FISH 331,428,408 3,877,645,967 379,158,683 3,620,534,664CANNED FISH 16,412 89,048,896 20,784 113,363,515SHRIMPS 9,328,817 800,182,943 5,284,188 749,047,048CRABS 190,060 141,061,550 271,081 112,076,300PERIWINCLES 259,073 266,091,496 231,606 253,476,011OTHERS 96,430,926 458,364,219 69,327,036 362,158,802
Table 2.2.3.7 Expenditure by Type Quantity & Value
ITEM
QUANTITY
COST N
Outboard Engine 143,738 14,026,981,998 Nets 30,566,956 71,341,402,478 Fishing Hooks 12,494,362 3,516,929,351 Indicator Buoy 368,565 301,239,400 Plastic Floats 15,185,149 1,723,719,826 Twine & Ropes 13,481,992 24,035,855,267 Lead Sheets 6,439,206 11,267,863,613 Fibre Glass Boats 16,216 7,466,762 Canoes 3,601,155 159,547,009,370 Others 532,922 613,166,994
*Quantity is in number unless otherwise stated.
Table 2.2.3.7 shows the total expenditure on each item of fish production and their quantity. Fishing net accounted for N71, 341,402,478 which was the highest. A total sum of N14, 026,981,998 was expended on outboard engines as against N11, 267,863,613 spent on purchase of lead sheets. The survey result also showed that N159, 547,009,370 was the amount of canoes bought (3,601,155).
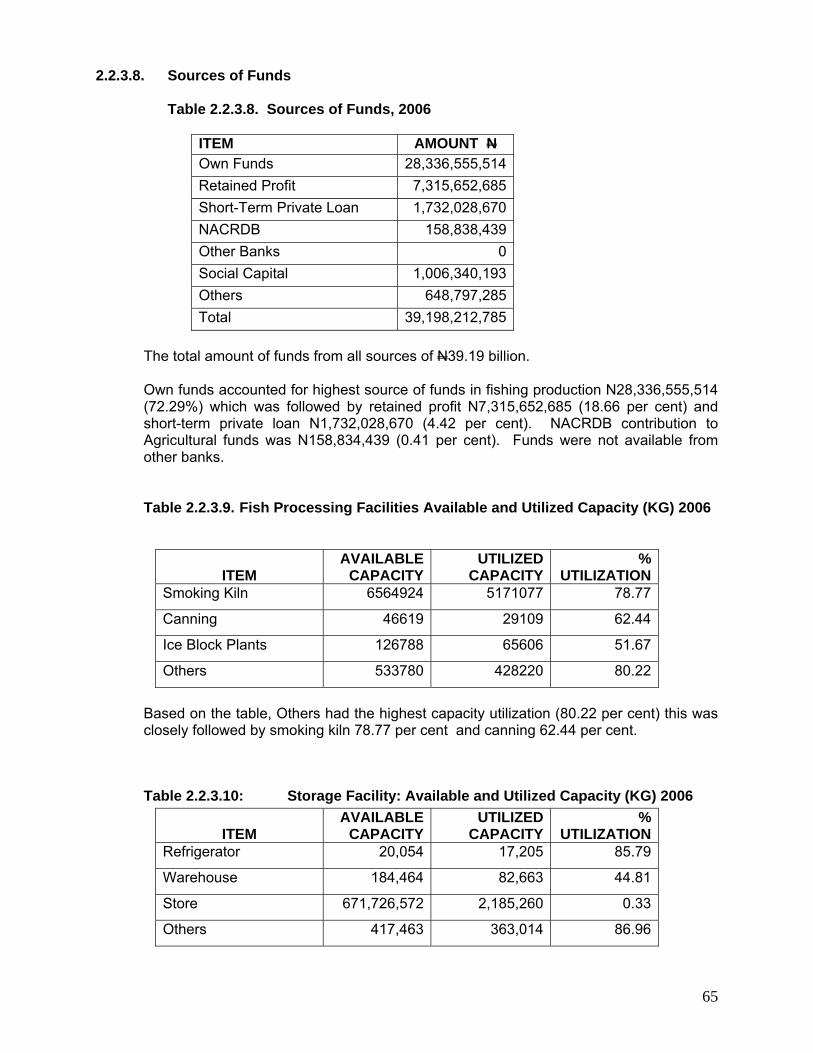
65
2.2.3.8. Sources of Funds
Table 2.2.3.8. Sources of Funds, 2006
ITEM AMOUNT N Own Funds 28,336,555,514Retained Profit 7,315,652,685Short-Term Private Loan 1,732,028,670NACRDB 158,838,439Other Banks 0Social Capital 1,006,340,193Others 648,797,285Total 39,198,212,785
The total amount of funds from all sources of N39.19 billion.
Own funds accounted for highest source of funds in fishing production N28,336,555,514 (72.29%) which was followed by retained profit N7,315,652,685 (18.66 per cent) and short-term private loan N1,732,028,670 (4.42 per cent). NACRDB contribution to Agricultural funds was N158,834,439 (0.41 per cent). Funds were not available from other banks.
Table 2.2.3.9. Fish Processing Facilities Available and Utilized Capacity (KG) 2006
ITEM
AVAILABLE CAPACITY
UTILIZED CAPACITY
% UTILIZATION
Smoking Kiln 6564924 5171077 78.77
Canning 46619 29109 62.44
Ice Block Plants 126788 65606 51.67
Others 533780 428220 80.22
Based on the table, Others had the highest capacity utilization (80.22 per cent) this was closely followed by smoking kiln 78.77 per cent and canning 62.44 per cent.
Table 2.2.3.10: Storage Facility: Available and Utilized Capacity (KG) 2006
ITEM AVAILABLE
CAPACITYUTILIZED
CAPACITY%
UTILIZATION Refrigerator 20,054 17,205 85.79
Warehouse 184,464 82,663 44.81
Store 671,726,572 2,185,260 0.33
Others 417,463 363,014 86.96

66
Refrigerators were highly used for fish storage 85.79 per cent. Capacity utilization was also high for others storage facilities 86.96% as warehouse utilization was 44.81 per cent.
Table 2.2.3.11 Distribution of Fish Farmers by Market Channel 2006
NUMBER
% At the Fish sites 1,238,902 19.9
In the open Market 1,248,475 20.0%
In the Cooperative Society 1,248,475 20.0%
Direct to the Industry 1,256,807 20.1%
Others 1,248,475 20.0%
Fish are usually sold direct to industry (20.1 per cent). It was observed that sale of fish in the open market, to cooperative society and others are relatively stable at 20.0 per cent respectively.
Table 2.2.3.12 Comparison of 2006 and 2005 Fishing Seasons, 2006
ITEM BETTER SAME WORST DON’T KNOW
Weather 750,118 246,681 56,635 230,315
Production/Output 791,856 193,631 101,648 196,311
Income 727,145 335,742 148,399 83,929
Price 685,551 435,968 69,612 42,884
The survey showed that production/output was better in 2006 than 2005. Also the weather was favourable for Agricultural production In 2006.
Table 2.2.3.13: Expectation for the Next Fishing Season, 2006
ITEM BETTER SAME WORST DON’T KNOW
Weather 930669 70,455 6,402 724,064
Production/Output 978812 96,045 4,326 678,063
Income 996782 225,451 63,328 478,863
Price 977951 219,654 47,144 524,411

67
Farmers are expecting increase in income and production in the next season. They also anticipate a rise in the prices of their commodity with a favourable weather.
Table 2.2.3.14: Distribution of Household by Way of Suggestion to Improve Fishing Activities in the Country, 2006
ITEM NUMBER
% Credit 1,214,269 40.6
Input 636,102 21.3
Infrastructure 845,796 28.3
Others 292,297 9.8
About 40.6 per cent households on fish farming requires credits to improve fishing activities, 28.3 per cent wants better infrastructure while 21.3 per cent wants input.
Table 2.2.3.15: Distribution of Problems Encountered when
Purchasing Fishing Tools, 2006
ITEM NUMBER
%
High Cost 930,912 37.6
Scarcity 281,740 11.4
Lack of Transportation 411,134 16.6
Far Distance 630,042 25.5
Others 221,458 8.9
From the table, it is obvious that fishermen had problem of high cost of fishing tools in 2006, this is closely followed by distance 25.5 per cent and lack of transportation (16.6 per cent)).
Table 2.2.3.15a: Distribution of Households by Problems Encountered During Production Process 2006.
ITEM NUMBER
%
Lack of Transport 581,178 21.4
Needs on the Sea 728,989 26.9
Too much Rain 443,944 16.4
Distance to Site 619,490 22.9
Others 335,854 12.4
About twenty seven per cent Households encountered weeds on the sea as problems in 2006 during production process. Distance to site, lack of transport and rain affected production process.

68
Table 2.2.3.16 Distribution of Household by Problems Encountered During storage Process 2006
Item Number %
Obsolete Equipment 508,907 21.3
Lack of Electricity 648,266 27.1
Lack of Funds 893,565 37.4
PESTS 164,276 6.9
Others 173,754 7.3
Lack of funds (37.4 per cent), electricity (27.1 per cent) and obsolete equipment (21.3 per cent) are the problems encountered during storage process in 2006.
Table 2.2.3.17 Distribution of Household by Problems Encountered During Marketing 2006
Item Number %
Distance to Market 609,244 17.2
Poor road Network 664,435 18.8
High Cost of Transport 798,986 22.6
Poor Pricing Policy 535,629 15.1
No Government Support 662,139 18.7
Others 269,035 7.6
High cost of transport (22.6 per cent), no Government support (18.7 per cent) and poor road network (18.8 per cent) were problems encountered by households when marketing Agricultural produce.

69
Table 2.2.3.18a Distribution of Fish Farmers by Access and Ownership of
Information and Communication Technology Facility 2006
TELEPHONE (FIXED) STATE ACCESS OWNERSHIP TOTAL
ACCCESSNO ACCESS
NO OWNERSHIP
TOTAL NO ACCESS
Akwa ibom 445.1 7,566.2 8,011.3 122,839.7 115,718.6 238,558.3
Anambra 0.0 0.0 0.0 33,439.5 33,439.5 66,879.0
Bayelsa 107.3 0.0 107.3 28,980.0 29,087.3 58,067.3
Borno 0.0 0.0 0.0 41,656.0 41,656.0 83,312.0
Cross_rivers 8,538.0 0.0 8,538.0 22,768.0 31,306.0 54,074.0
Delta 0.0 0.0 0.0 275,898.0 275,898.0 551,796.0
Edo 0.0 0.0 0.0 27,790.0 27,790.0 55,580.0
Gombe 0.0 0.0 0.0 11,335.5 11,335.5 22,671.0
Jigawa 0.0 0.0 0.0 57,085.5 57,085.5 114,171.0
Katsina 0.0 0.0 0.0 15,487.5 15,487.5 30,975.0
Kebbi 0.0 0.0 0.0 76,636.3 76,636.3 153,272.6
Kogi 0.0 0.0 0.0 87,837.8 87,837.8 175,675.5
Lagos 0.0 0.0 0.0 12,365.0 12,365.0 24,730.0
Niger 18,499.2 18,499.2 36,998.4 80,764.8 80,764.8 161,529.6
Ogun 0.0 0.0 0.0 78,144.0 78,144.0 156,288.0
Ondo 0.0 0.0 0.0 102,850.0 102,850.0 205,700.0
Rivers 0.0 0.0 0.0 61,421.1 61,421.1 122,842.3
Taraba 0.0 0.0 0.0 33,024.8 33,024.8 66,049.5
Yobe 0.0 0.0 0.0 85,936.5 85,936.5 171,873.0
TOTAL 27,589.6 26,065.4 53,655.0 1,256,260.0 1,257,784.1 2,514,044.1

70
Table 2.2.3.18a Distribution of Fish Farmers by Access and Ownership of
Information and Communication Technology Facility 2006
TELEPHONE MOBILE
STATE
ACCESS OWN TELE PHONE MOBILE
TOTALACCESS
NO ACCCESS
NO OWNERSHIP
TOTAL NO ACCESS
Akwa ibom 103,345.59 45,486.30 148,831.89 19,939.20 77,798.49 97,737.69
Anambra 33,439.50 33,439.50 66,879.00 0.00 0.00 0.00
Bayelsa 16,025.19 2,592.26 18,617.45 13,062.14 26,495.07 39,557.21
Borno 0.00 0.00 0.00 41,656.00 41,656.00 83,312.00
Cross rivers 21,345.00 21,345.00 42,690.00 9,961.00 9,961.00 19,922.00
Delta 56,931.34 0.00 56,931.34 218,966.67 275,898.01 494,864.67
Edo 22,232.00 0.00 22,232.00 5,558.00 27,790.00 33,348.00
Gombe 0.00 0.00 0.00 11,335.50 11,335.50 22,671.00
Jigawa 0.00 0.00 0.00 57,085.50 57,085.50 114,171.00
Katsina 0.00 0.00 0.00 15,487.50 15,487.50 30,975.00
Kebbi 0.00 0.00 0.00 76,636.32 76,636.32 153,272.63
Kogi 25,868.70 25,868.70 51,737.40 61,969.05 61,969.05 123,938.10
Lagos 12,365.00 12,365.00 24,730.00 0.00 0.00 0.00
Niger 18,499.20 18,499.20 36,998.40 80,764.80 80,764.80 161,529.60
Ogun 6,512.00 6,512.00 13,024.00 71,632.00 71,632.00 143,264.00
Ondo 55,660.00 36,300.00 91,960.00 47,190.00 66,550.00 113,740.00
Rivers 37,818.85 11,456.08 49,274.93 23,602.28 49,965.05 73,567.33
Taraba 5,542.00 1,518.50 7,060.50 27,482.75 31,506.25 58,989.00
Yobe 55,185.43 15,375.53 70,560.97 30,751.07 70,560.97 101,312.03
TOTAL 470,769.80 15,375.53 486,145.33 813,079.76 1,053,091.49 1,866,171.26
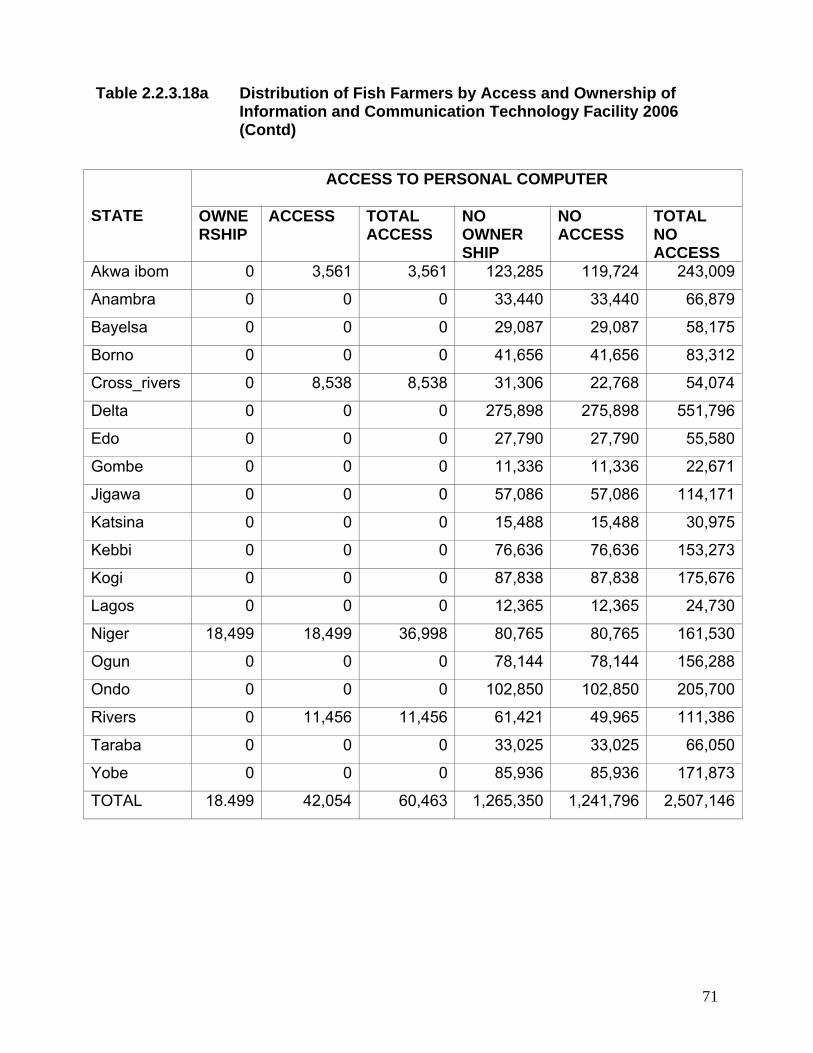
71
Table 2.2.3.18a Distribution of Fish Farmers by Access and Ownership of
Information and Communication Technology Facility 2006 (Contd)
ACCESS TO PERSONAL COMPUTER
STATE OWNE
RSHIP ACCESS TOTAL
ACCESS NO OWNER SHIP
NO ACCESS
TOTAL NO ACCESS
Akwa ibom 0 3,561 3,561 123,285 119,724 243,009
Anambra 0 0 0 33,440 33,440 66,879
Bayelsa 0 0 0 29,087 29,087 58,175
Borno 0 0 0 41,656 41,656 83,312
Cross_rivers 0 8,538 8,538 31,306 22,768 54,074
Delta 0 0 0 275,898 275,898 551,796
Edo 0 0 0 27,790 27,790 55,580
Gombe 0 0 0 11,336 11,336 22,671
Jigawa 0 0 0 57,086 57,086 114,171
Katsina 0 0 0 15,488 15,488 30,975
Kebbi 0 0 0 76,636 76,636 153,273
Kogi 0 0 0 87,838 87,838 175,676
Lagos 0 0 0 12,365 12,365 24,730
Niger 18,499 18,499 36,998 80,765 80,765 161,530
Ogun 0 0 0 78,144 78,144 156,288
Ondo 0 0 0 102,850 102,850 205,700
Rivers 0 11,456 11,456 61,421 49,965 111,386
Taraba 0 0 0 33,025 33,025 66,050
Yobe 0 0 0 85,936 85,936 171,873
TOTAL 18.499 42,054 60,463 1,265,350 1,241,796 2,507,146

72
Table 2.2.3.18a Distribution of Fish Farmers by Access and Ownership of
Information and Communication Technology Facility 2006 (Contd)
STATE
ACCESS TO INTERNET
OWNERSHIP ACCESS TO
INTERNET TOTAL ACCESS
NO OWNER SHIP
NO ACCESS
TOTAL NO ACCESS
Akwa ibom 0 3,560.6 3,561 123,285 119724.2143 243,009
Anambra 0 0.0 0 33,440 33439.5 66,879
Bayelsa 0 0.0 0 29,087 29087.33333 58,175
Borno 0 0.0 0 41,656 41656 83,312
Cross_rivers 0 0.0 0 31,306 31306 62,612
Delta 0 0.0 0 275,898 275898.006 551,796
Edo 0 0.0 0 27,790 27790 55,580
Gombe 0 0.0 0 11,336 11335.5 22,671
Jigawa 0 0.0 0 57,086 57085.5 114,171
Katsina 0 0.0 0 15,488 15487.5 30,975
Kebbi 0 0.0 0 76,636 76636.315 153,273
Kogi 0 0.0 0 87,838 87837.75 175,676
Lagos 0 0.0 0 12,365 12365 24,730
Niger 18,499 18,499.2 36,998 80,765 80764.8 161,530
Ogun 0 0.0 0 78,144 78144 156,288
Ondo 0 0.0 0 102,850 102850 205,700
Rivers 0 0.0 0 61,421 61421.125 122,842
Taraba 0 0.0 0 33,025 33024.75 66,050
Yobe 0 0.0 0 85,936 85936.499 171,873
TOTAL 22,059.8 22,060 1,265,350 1261789.793 2,527,140

73
Table 2.2.3.18a Distribution of Fish Farmers by Access and Ownership of Information and Communication Technology Facility 2006 (Contd)
ACCESS TO WEBSITE STATE OWNER
SHIP ACCESS TO WEBSITE
TOTAL ACCESS
NO ACCESS
NO OWNERSHIP
TOTAL NO ACCESS
Akwa ibom 0.0 0.0 0.0 123,284.8 123,284.8 246,569.6
Anambra 0.0 0.0 0.0 33,439.5 33,439.5 66,879.0
Bayelsa 0.0 0.0 0.0 29,087.3 29,087.3 58,174.7
Borno 0.0 0.0 0.0 41,656.0 41,656.0 83,312.0
Cross_rivers 0.0 0.0 0.0 31,306.0 31,306.0 62,612.0
Delta 0.0 0.0 0.0 275,898.0 275,898.0 551,796.0
Edo 0.0 0.0 0.0 27,790.0 27,790.0 55,580.0
Gombe 0.0 0.0 0.0 11,335.5 11,335.5 22,671.0
Jigawa 0.0 0.0 0.0 57,085.5 57,085.5 114,171.0
Katsina 0.0 0.0 0.0 15,487.5 15,487.5 30,975.0
Kebbi 0.0 0.0 0.0 76,636.3 76,636.3 153,272.6
Kogi 0.0 0.0 0.0 87,837.8 87,837.8 175,675.5
Lagos 0.0 0.0 0.0 12,365.0 12,365.0 24,730.0
Niger 18,499.2 18,499.2 36,998.4 80,764.8 80,764.8 161,529.6
Ogun 0.0 0.0 0.0 78,144.0 78,144.0 156,288.0
Ondo 0.0 0.0 0.0 102,850.0 102,850.0 205,700.0
Rivers 0.0 0.0 0.0 61,421.1 61,421.1 122,842.3
Taraba 0.0 0.0 0.0 33,024.8 33,024.8 66,049.5
Yobe 0.0 0.0 0.0 85,936.5 85,936.5 171,873.0
TOTAL 18,499.2 18,499.2 36,998.4 1,265,350.4 1,265,350.4 2,530,700.7

74
Table 2.2.3.18b Percentage Distribution of Fish Farmers by Access and Ownership of Information and Communication Technology Facility 2006
TELEPHONE (FIXED)
STATE
TOTAL ACCCESS
TOTAL NO ACCESS
TOTAL
% ACCESS
% NO ACCESS
Akwa ibom 8,011.3 238,558.3 246,569.6 3.2 96.8
Anambra 0.0 66,879.0 66,879.0 0.0 100.0
Bayelsa 107.3 58,067.3 58,174.7 0.2 99.8
Borno 0.0 83,312.0 83,312.0 0.0 100.0
Cross_rivers 8,538.0 54,074.0 62,612.0 13.6 86.4
Delta 0.0 551,796.0 551,796.0 0.0 100.0
Edo 0.0 55,580.0 55,580.0 0.0 100.0
Gombe 0.0 22,671.0 22,671.0 0.0 100.0
Jigawa 0.0 114,171.0 114,171.0 0.0 100.0
Katsina 0.0 30,975.0 30,975.0 0.0 100.0
Kebbi 0.0 153,272.6 153,272.6 0.0 100.0
Kogi 0.0 175,675.5 175,675.5 0.0 100.0
Lagos 0.0 24,730.0 24,730.0 0.0 100.0
Niger 36,998.4 161,529.6 198,528.0 18.6 81.4
Ogun 0.0 156,288.0 156,288.0 0.0 100.0
Ondo 0.0 205,700.0 205,700.0 0.0 100.0
Rivers 0.0 122,842.3 122,842.3 0.0 100.0
Taraba 0.0 66,049.5 66,049.5 0.0 100.0
Yobe 0.0 171,873.0 171,873.0 0.0 100.0
TOTAL 53,655.0 2,514,044.1 2,567,699.1 2.1 97.9

75
Table 2.2.3.18b Percentage Distribution of Fish Farmers by Access and
Ownership of Information and Communication Technology Facility 2006 (Contd)
STATE
TELEPHONE MOPBILE
TOTALACCESS
TOTAL NO ACCESS
TOTAL % ACCESS
% NO ACCESS
Akwa ibom 148,831.9 97,737.7 246,569.6 60.4 39.6
Anambra 66,879.0 0.0 66,879.0 100.0 0.0
Bayelsa 18,617.5 39,557.2 58,174.7 32.0 68.0
Borno 0.0 83,312.0 83,312.0 0.0 100.0
Cross rivers 42,690.0 19,922.0 62,612.0 68.2 31.8
Delta 56,931.3 494,864.7 551,796.0 10.3 89.7
Edo 22,232.0 33,348.0 55,580.0 40.0 60.0
Gombe 0.0 22,671.0 22,671.0 0.0 100.0
Jigawa 0.0 114,171.0 114,171.0 0.0 100.0
Katsina 0.0 30,975.0 30,975.0 0.0 100.0
Kebbi 0.0 153,272.6 153,272.6 0.0 100.0
Kogi 51,737.4 123,938.1 175,675.5 29.5 70.5
Lagos 24,730.0 0.0 24,730.0 100.0 0.0
Niger 36,998.4 161,529.6 198,528.0 18.6 81.4
Ogun 13,024.0 143,264.0 156,288.0 8.3 91.7
Ondo 91,960.0 113,740.0 205,700.0 44.7 55.3
Rivers 49,274.9 73,567.3 122,842.3 40.1 59.9
Taraba 7,060.5 58,989.0 66,049.5 10.7 89.3
Yobe 70,561.0 101,312.0 171,873.0 41.1 58.9
TOTAL 486,145.3 1,866,171.3 2,352,316.6 20.7 79.3

76
Table 2.2.3.18b Percentage Distribution of Fish Farmers by Access and
Ownership of Information and Communication Technology Facility 2006 (Contd)
PERSONAL COMPUTERS
STATE TOTAL ACCESS
TOTAL NO ACCESS
TOTAL % ACCESS
%NO ACCESS
Akwa ibom 3,561 243,009 246,570 1.4 98.6
Anambra 0 66,879 66,879 0.0 100.0
Bayelsa 0 58,175 58,175 0.0 100.0
Borno 0 83,312 83,312 0.0 100.0
Cross_rivers 8,538 54,074 62,612 13.6 86.4
Delta 0 551,796 551,796 0.0 100.0
Edo 0 55,580 55,580 0.0 100.0
Gombe 0 22,671 22,671 0.0 100.0
Jigawa 0 114,171 114,171 0.0 100.0
Katsina 0 30,975 30,975 0.0 100.0
Kebbi 0 153,273 153,273 0.0 100.0
Kogi 0 175,676 175,676 0.0 100.0
Lagos 0 24,730 24,730 0.0 100.0
Niger 36,998 161,530 198,528 18.6 81.4
Ogun 0 156,288 156,288 0.0 100.0
Ondo 0 205,700 205,700 0.0 100.0
Rivers 11,456 111,386 122,842 9.3 90.7
Taraba 0 66,050 66,050 0.0 100.0
Yobe 0 171,873 171,873 0.0 100.0
TOTAL 60,463 2,507,146 2,549,200 1.6 98.4

77
Table 2.2.3.18b Percentage Distribution of Fish Farmers by Access and Ownership of Information and Communication Technology Facility 2006 (Contd)
INTERNET
STATE TOTAL NO ACCESS
TOTAL % ACCESS
%NO ACCESS
Akwa ibom 243,009.0 246,569.57 1.4 98.6
Anambra 66,879.0 66,879.00 0.0 100.0
Bayelsa 58,174.7 58,174.67 0.0 100.0
Borno 83,312.0 83,312.00 0.0 100.0
Cross_rivers 62,612.0 62,612.00 0.0 100.0
Delta 551,796.0 551,796.01 0.0 100.0
Edo 55,580.0 55,580.00 0.0 100.0
Gombe 22,671.0 22,671.00 0.0 100.0
Jigawa 114,171.0 114,171.00 0.0 100.0
Katsina 30,975.0 30,975.00 0.0 100.0
Kebbi 153,272.6 153,272.63 0.0 100.0
Kogi 175,675.5 175,675.50 0.0 100.0
Lagos 24,730.0 24,730.00 0.0 100.0
Niger 161,529.6 198,528.00 22.9 81.4
Ogun 156,288.0 156,288.00 0.0 100.0
Ondo 205,700.0 205,700.00 0.0 100.0
Rivers 122,842.3 122,842.25 0.0 100.0
Taraba 66,049.5 66,049.50 0.0 100.0
Yobe 171,873.0 171,873.00 0.0 100.0
TOTAL 2,527,140.2 2,549,199.93 0.9 99.1

78
Table 2.2.3.18b Percentage Distribution of Fish Farmers by Access and Ownership of Information and Communication Technology Facility 2006 (Contd)
WEBSITE
STATE TOTAL
ACCESSTOTAL NO ACCESS
TOTAL
%ACCESS
Akwa ibom 0.0 246,569.6 246,569.6 0.0
Anambra 0.0 66,879.0 66,879.0 0.0
Bay`elsa 0.0 58,174.7 58,174.7 0.0
Borno 0.0 83,312.0 83,312.0 0.0
Cross_rivers 0.0 62,612.0 62,612.0 0.0
Delta 0.0 551,796.0 551,796.0 0.0
Edo 0.0 55,580.0 55,580.0 0.0
Gombe 0.0 22,671.0 22,671.0 0.0
Jigawa 0.0 114,171.0 114,171.0 0.0
Katsina 0.0 30,975.0 30,975.0 0.0
Kebbi 0.0 153,272.6 153,272.6 0.0
Kogi 0.0 175,675.5 175,675.5 0.0
Lagos 0.0 24,730.0 24,730.0 0.0
Niger 36,998.4 161,529.6 198,528.0 18.6
Ogun 0.0 156,288.0 156,288.0 0.0
Ondo 0.0 205,700.0 205,700.0 0.0
Rivers 0.0 122,842.3 122,842.3 0.0
Taraba 0.0 66,049.5 66,049.5 0.0
Yobe 0.0 171,873.0 171,873.0 0.0
TOTAL 18499.2 1,265,350.4 1,283,849.6 1.4
The table shows that 76.8 per cent of those interviewed had access to Radio with majority of the farmers having access to ICT. It was observed that a new trend of people using ICT facilities has increased tremendously, this is a welcome development.
Only in Niger State that we had positive response of those who have access to Intranet and Website. Many of those interviewed owned one form of ICT or more. The degree of ownership of ICT facilities has improved greatly among the People. Ownership of Intranet, Website and Personal Computers were reported in Niger State only. For further details see appendix.

79
Chapter Three
NATIONAL INTEGRATED SURVEY OF ESTABLISHMENTS 3.1 WHOLESALE AND RETAIL TRADE
Table 3.1 Wholesale and Retail Trade
Item 1st Half 2006
2nd Half 2006
No. of Persons Engaged 1,939,076 1,981,389
No. of Operatives 17,389 18,162
Emolument of Employees (N’000) 9,412,065 9,609840
Cost of Goods Sold (N’000) 85,231,031 108,434,029
Value of Sales (N’000) 175,146,003 194,099,680
Gross Margin (N‘000) 89,914,972 85,665,660
Cost of Operation (N’000) 88,114,172 93,020,435
Total Working Capital (N’000) 29,823,335 29,176,783
020,000,00040,000,00060,000,00080,000,000
100,000,000120,000,000140,000,000160,000,000180,000,000200,000,000
NAIRA
1st Half 2006 2nd Half 2006
MONETARY ITEMS ON WHOLESALE AND RETAIL TRADE
Emolument of Employees(N'000)
Cost of Goods Sold(N'000)
Value of Sales (N'000)
Gross Margin (N'000)
Cost of Operation (N'000)
Total Working Capital(N'000)
Figure 3.1
80
3.1.1 Number of Persons Engaged
Table 3.1 shows that the number of persons engaged (1,939,076) in first half 2006 increased marginally by 2.18 per cent in the second half 2006, to 1,981,389 persons. The number of operatives also recorded a marginal increase of 4.45 per cent from 17,389 in the first half 2006 to 18,162 operatives in the second half of the same year.
3.1.2 Emolument of Employees
A total amount of about N9.41 billion for first half 2006 as against N9.61 billion for second half of the same year was paid to employees. This indicates that there was 2.13 per cent increase in the emolument of employees from first half to the second half of the same year.
3.1.3 Cost of Goods Sold
In Table 3.1 above, the cost of good sold in the first half of 2006 was about N85.23 billion while that of the Second half 2006 was about N108.43 billion, indicating an increase of about 27.22 per cent in the same year.
3.1.4 Value of Sales
The value of sales in the first half and Second half of 2006 were N175.14 billion and N194.10 billion respectively. This indicates an increase of 10.83 per cent.
3.1.5 Gross Margin
In Table 3.1 above N89.9 billion was recorded in the first half of 2006 as gross margin while that of Second half 2006 was N85.67 billion. This indicates a decrease of 4.72 per cent.
3.1.6 Cost of Operation
The cost of operation was N88.11 billion for first half of 2006 and N93.02 billion for the second half of the same year. This indicates a percentage increase of 5.57 per cent.
3.1.7 Total Working Capital
The working capital decreased, marginally from N29.82 billion in the first half to N29.18 billion in the second half of the same year. This shows a percentage decrease of 2.15 per cent.
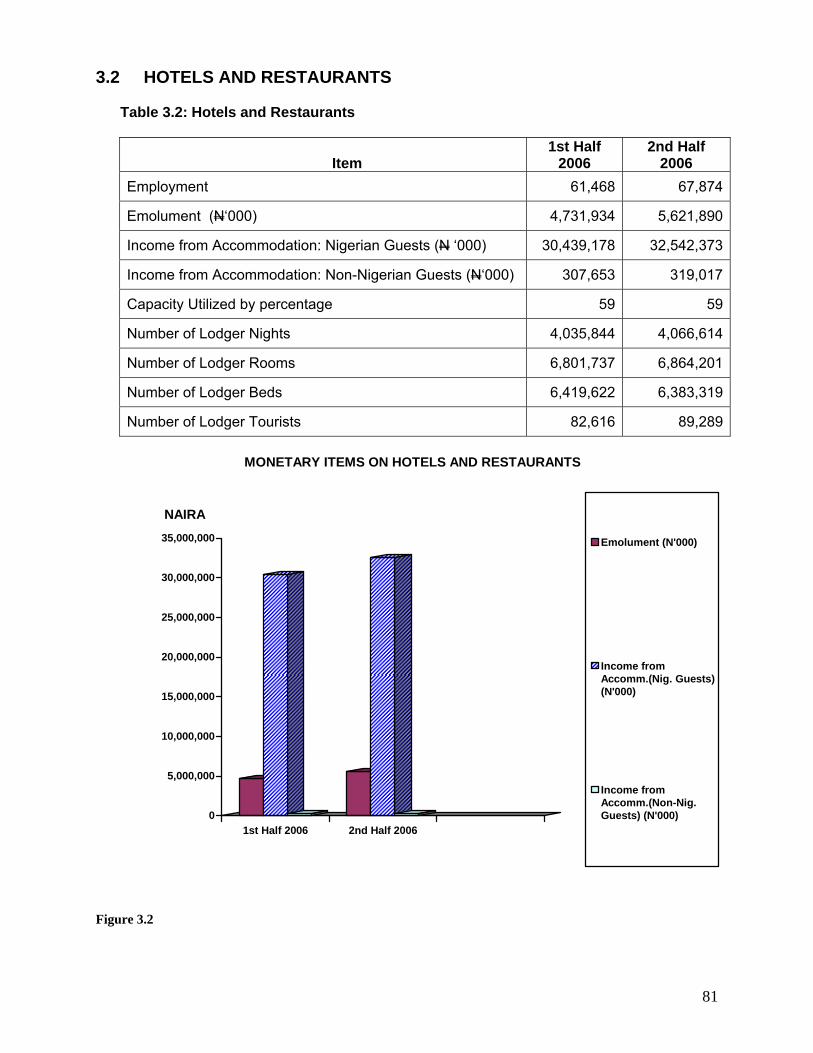
81
3.2 HOTELS AND RESTAURANTS Table 3.2: Hotels and Restaurants
Item
1st Half 2006
2nd Half 2006
Employment 61,468 67,874
Emolument (N‘000) 4,731,934 5,621,890
Income from Accommodation: Nigerian Guests (N ‘000) 30,439,178 32,542,373
Income from Accommodation: Non-Nigerian Guests (N‘000) 307,653 319,017
Capacity Utilized by percentage 59 59
Number of Lodger Nights 4,035,844 4,066,614
Number of Lodger Rooms 6,801,737 6,864,201
Number of Lodger Beds 6,419,622 6,383,319
Number of Lodger Tourists 82,616 89,289
0
5,000,000
10,000,000
15,000,000
20,000,000
25,000,000
30,000,000
35,000,000
NAIRA
1st Half 2006 2nd Half 2006
MONETARY ITEMS ON HOTELS AND RESTAURANTS
Emolument (N'000)
Income fromAccomm.(Nig. Guests)(N'000)
Income fromAccomm.(Non-Nig.Guests) (N'000)
Figure 3.2

82
3.2.1 Employment
With reference to Table 3.2, the number of persons employed in the Hotels and Restaurants Industry rose from 61468 in first half 2006 to 67,874 in second half of the same year, indicating an increase of 10.42 per cent.
3.2.2 Emolument
About N4.73 billion and N5.62 billion for first half and second half of 2006 respectively were paid to workers as emolument. This shows an increase of 18.82 per cent.
3.2.3 Income from Accommodation: Nigerian Guests
The total income from Nigerian Guests on Accommodation in the first half 2006 was about N30.44 billion while that of the second half of the same year was about N32.54 billion. This indicates an increase of 6.90 per cent.
3.2.4 Income from Accommodation: Non Nigerian Guests The total income on accommodation from Non-Nigerian Guests rose from about
N307.65 million in the first half 2006 to about N319.11 million in the Second half 2006, indicating an increase of 3.73 per cent.
3.2.5 Capacity Utilized by Percentage
The capacity utilized by the Hotels and Restaurants Industry remained constant at 59 per cent for first half and second half of year 2006.
3.2.6 No. of Lodger Nights
The number of lodger nights increased marginally from 4,035,844 in the first half of the year to 4,066,614 in the second half of the same year. This shows a marginal increase of 0.8 per cent.
3.2.7 No. of Lodger Rooms
The number of lodger rooms increased from 6,801,737 in the first half to 6,864,201 in the second half of the year 2006 indicating a marginal increase of 0.9 percent.
3.2.8 No. of Lodger Beds
The number of lodger beds decreased by 0.56 per cent (36,703), from 6,419,622 in the first half to 6,383,319 lodger beds in the second half of the year.
3.2.9 No. of Lodger Tourists
The number of lodger tourists increased by 8.1 per cent from 82,616 in the first half to 89,289 in the second half of the year 2006.
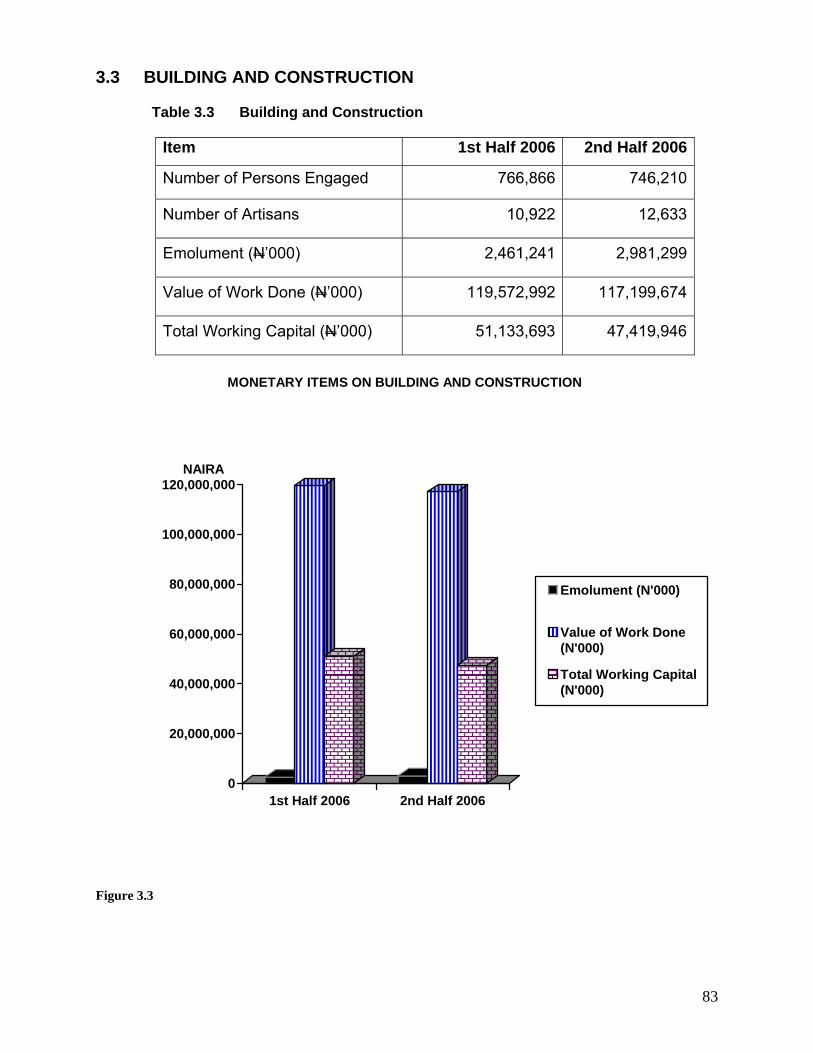
83
3.3 BUILDING AND CONSTRUCTION Table 3.3 Building and Construction
Item 1st Half 2006 2nd Half 2006
Number of Persons Engaged 766,866 746,210
Number of Artisans 10,922 12,633
Emolument (N’000) 2,461,241 2,981,299
Value of Work Done (N’000) 119,572,992 117,199,674
Total Working Capital (N’000) 51,133,693 47,419,946
0
20,000,000
40,000,000
60,000,000
80,000,000
100,000,000
120,000,000NAIRA
1st Half 2006 2nd Half 2006
MONETARY ITEMS ON BUILDING AND CONSTRUCTION
Emolument (N'000)
Value of Work Done(N'000)
Total Working Capital(N'000)
Figure 3.3

84
3.3.1 Number of Persons Engaged
In table 3.3 above, the number of persons engaged in building and construction industry in the first half of 2006, was 766, 866 and it decreased to 746, 210 in the second half of the same year. The fall represents 2.70 per cent. Of the number of persons engaged in the first half of year 2006; 10,922 persons were Artisans. The number rose to 12,633 in the second half of the same year, in spite of the drop in the number of persons engaged in the second half.
3.3.2 Emolument
The total emolument paid to workers in the sector was N2.46 billion in the first half of 2006. It increased by 21.13 per cent to N2.98 billion in the second half of the same year. This might have been as a result of engaging more professionals in that sector, who earned robust salaries and other benefits.
3.3.3. Value of work done
The value of work done in the first half of 2006 was N119.57 billion, while in the second half of the same year, the value of work done dropped to N117.20 billion with 19.85 per cent fall.
3.3.4 Total Working Capital
The total working capital for the first half of 2006 was N 51.13 billion, while the second half of the same year was N47.42 billion. This shows a drop of N3.71 billion (representing 7.26 percent).

85
3.4 MANUFACTURING INDUSTRY Table 3.4 Manufacturing Industry
ITEM 1st Half 2006 2nd Half 2006
Number of Persons Engaged 382,717 387,964
Number of Paid Employees 287,176 289,239
Emolument of Employees (N’000) 253,033,359 266,746,977
Value of Sales (N’000) 1,801,739,912 1,954,766,423
Operating Cost (N’000) 771,032,543 914,395,282
Total Capital Expenditure (N’000) 730,264,448 761,185,490
Capacity Utilization (%) 54 55
0200,000,000400,000,000600,000,000800,000,000
1,000,000,0001,200,000,0001,400,000,0001,600,000,0001,800,000,0002,000,000,000
NAIRA
1st Half 2006 2nd Half 2006
MONETARY ITEMS ON MANUFACTURING
Emolument of Employees (N'000)
Value of Sales (N'000)
Operating Cost (N'000)
Total Capital Expenditure (N'000)
Figure 3.4

86
3.4.1 Number of Persons Engaged:
In manufacturing sector, 382,717 persons were engaged in the first half of 2006, while 387,964 persons were engaged in the second half of the same year. This shows an increase of 1.37 per cent. Of the number of persons engaged in the first half of year 2006, 287,176 persons were paid employees. The number of paid employees for the second half was 289,239, showing an increase of 0.72 per cent.
3.4.2 Emolument of Employees
A total of N253.03 billion was paid to employees in the first half of year 2006, while in the second half of the same year; N266.75 billion was paid to workers. This shows an increase of N13.72 billion (representing 5.42 per cent).
3.4.3 Value of Sales
The total value of sales in the first half of the year 2006 was N1,801.74 billion, while the value of sales for the second half of the same year was N1,954.77 billion, showing a rise of 8.49 per cent.
3.4.4 Operating Cost
The manufacturing industry spent N771.03 billion on running cost in the first half of 2006 and approximately N914.40 billion in the second half of the same year. The rise on running cost represents 18.59 per cent.
3.4.5 Total Capital Expenditure
The sector invested N730.26 billion on capital formation in the first half of 2006, while N761.19 billion was expended in the second half of the same year. This shows a rise of 4.24 per cent.
3.4.6 Capacity Utilization The installed capacity utilized by the sector was 54 per cent in the first half of 2006 and it increased to 55 per cent in the second half of the same year, showing one percentage point increase.
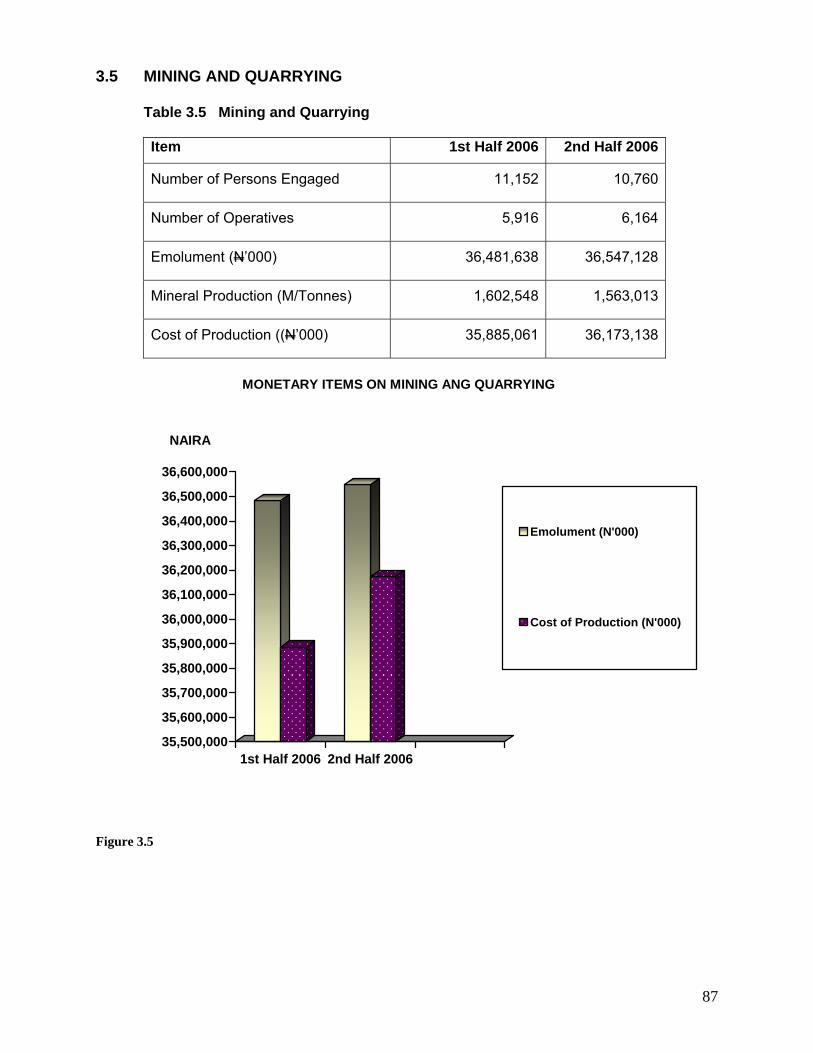
87
3.5 MINING AND QUARRYING Table 3.5 Mining and Quarrying
Item 1st Half 2006 2nd Half 2006
Number of Persons Engaged 11,152 10,760
Number of Operatives 5,916 6,164
Emolument (N’000) 36,481,638 36,547,128
Mineral Production (M/Tonnes) 1,602,548 1,563,013
Cost of Production ((N’000) 35,885,061 36,173,138
35,500,000
35,600,000
35,700,000
35,800,000
35,900,000
36,000,000
36,100,000
36,200,000
36,300,000
36,400,000
36,500,000
36,600,000
NAIRA
1st Half 2006 2nd Half 2006
MONETARY ITEMS ON MINING ANG QUARRYING
Emolument (N'000)
Cost of Production (N'000)
Figure 3.5

88
3.5.1 Number of Persons Engaged Table 3.5 above shows that, the number of persons engaged decreased from 11,152 in first half 2006 to 10,760 workers in the second half of the same year, showing a decrease of 3.52 per cent.
3.5.2 Number of Operatives
The number of operatives which was 5,916 in first half rose to 6,164 in the second year of 2006, showing a percentage increase of 4.20 (248 operatives).
3.5.3 Emolument
A total emolument of about N36.48 billion was paid to workers in the first half 2006. While that of the second half of the same year was about N36.55 billion, indicating a slight increase of 0.19 per cent.
3.5.4 Mineral Production The volume of mineral produced in the first half of 2006 was 1,602,548 Metric Tonnes while that of the Second half 2006 was 1,563,013 Metric Tonnes. This represents a decrease of about 2.5 per cent (39 535 Metric Tonnes)
3.5.5 Cost of Production
The cost of production (N36.17 billion) as shown in Table 3.5 above for second half 2006, indicates a marginal increase of 0.80 percent over that of the first half 2006 which was N35.89 billion.

89
3.6 PRIVATE PROFESSIONAL SERVICES Table 3.6: Private Professional Services
ITEM First Half 2006 Second Half 2006
Employment 14,573 16,041
Emolument (N’000) 1,979,515 2,447,635
Operating Expenses (N’000) 3,771,459 4,543,756
Total Receipt (N’000) 22,440,449 23,992,712
Total Working Capital (N’000) 21,271,471 22,064,087
0
5,000,000
10,000,000
15,000,000
20,000,000
25,000,000NAIRA
First Half 2006 Second Half 2006
MONETARY ITEMS ON PRIVATE PROFESSIONAL SERVICES
Emolument (N'000)
Operating Expenses(N'000)
Total Receipt (N'000)
Total Working Capital(N'000)
Figure 3.6

90
3.6.1 Employment In Table 3.6 above, the total number of persons employed in the first half of 2006 was 14,573 while that of the second half of the same year was 16,041 workers, indicating an increase of 10.07 per cent (1,468 workers).
3.6.2 Emolument
With reference to Table 3.6, the total wages and salaries and supplementary benefits earned by workers in the first half of 2006, was about N1.98 billion while that of the second half was about N2.45 billion, representing an increase of about 23.65 per cent.
3.6.3 Operating Expenses
The total operating expenses in the first half of 2006, was N3.77 billion and this increased by 20.42 per cent to N4.54 billion in the second half of the same year.
3.6.4 Total Receipt
The total receipt in Table 3.6 was N22.44 billion recorded for first half 2006, while about N23.99 billion accrued to the sector in the second half of the same year, indicating an increase of about 6.91 per cent.
3.6.5 Total Working Capital
A total working capital of N21.27 billion was recorded in the first half of 2006 and increased by 3.71 per cent to N22.06 billion in the second half of the same year.

91
3.7 ORGANISED ROAD TRANSPORT OPERATORS
Table 3.7 Organized Road Transport Operators
ITEM First Half 2006 Second Half 2006
Number of Persons Engaged 61,386 65,602
Number of Operatives 34,646 32,929
Emolument (N’000) 5,743,544 6,938,341
Gross Addition to Fixed Assets (N’000) 3,517,331 3,311,193
Operating Cost (N’000) 7,272,441 8,030,557
Total Receipts (N’000) 38,009,963 41,750,616
Total Fleet 19,164 19,364
05,000,000
10,000,00015,000,00020,000,00025,000,00030,000,00035,000,00040,000,00045,000,000
NAIRA
First Half 2006 Second Half2006
MONETARY ITEMS ON ORGANISED ROAD TRANSPORT OPERATORS
Emolument (N'000)
Gross Addition toFixed Assets (N'000)
Operating Cost (N'000)
Total Receipts (N'000)
Figure 3.7
92
3.7.1 Number of Persons Engaged
The organized road transport operators in the first half of 2006 engaged 61,386 persons. Of which 34,646 (56.44 percent) persons were operatives. While 65,602 persons were engaged in the second half of the same year; showing an increase of 6.87 per cent. 32,929 operatives were engaged in the second half of year 2006.
3.7.2 Emolument
A total emolument of N5.74 billion was paid to workers in the first half of 2006, while N6.93 billion was paid to employees in second half of the same year; showing an increase of N1.19 billion, representing 20.73 percent.
3.7.3 Gross Addition to Fixed Assets
The organized road transport operators invested N3.52 billion on fixed assets in the first half of 2006, while N3.31 billion was expended in second half of the same year.
3.7.4 Operating Cost
A total of N7.27 billion was spent on running cost of the sector in the first half of 2006, while the operating cost increased by 10.45 per cent in second half of the year.
3.7.5 Total Receipts A total income of N38.01 billion was generated in the first half of 2006, while the revenue accrued to the sector in second half of the year amounted to N45.75 billion. This result shows an increase of N7.74 billion, representing 20.36 percent.
3.7.6 Total Fleet:
The number of vehicles in the fleet was 19,164 in the first half of 2006. In the second half of the year, the number of vehicles was 19,364, showing slight increase of 1.04 per cent.

93
3.8 BALANCE OF PAYMENTS
Table 3.8 Balance of Payments
Item First Half 2006 Second Half 2006
Total Receipts ($’000) 5,734,810 4,979,966
Total Payments ($’000) 4,265,451 4,258,429
0
1,000,000
2,000,000
3,000,000
4,000,000
5,000,000
6,000,000DOLLAR
First Half2006
Second Half2006
MONETARY ITEMS ON BALANCE OF PAYMENTS
Total Receipts ($'000)Total Payments ($ '000)
Figure 3.8
3.8.1 Total Receipts and Payments A total of $5.73 billion was received by the financial sector in the first half of 2006. While a total of $4.27 billon was paid in the same first half of the year. This indicates a surplus of $1.46 billion, representing 25.48 percent. Similarly, $4.98 billion was received in the second half of 2006 and a total of $4.26 was paid in the same second half of the year, leaving a surplus of $0.72 billion. In overall assessment, balance of payments was not in deficits in banking and finance sector of the economy in the year 2006.
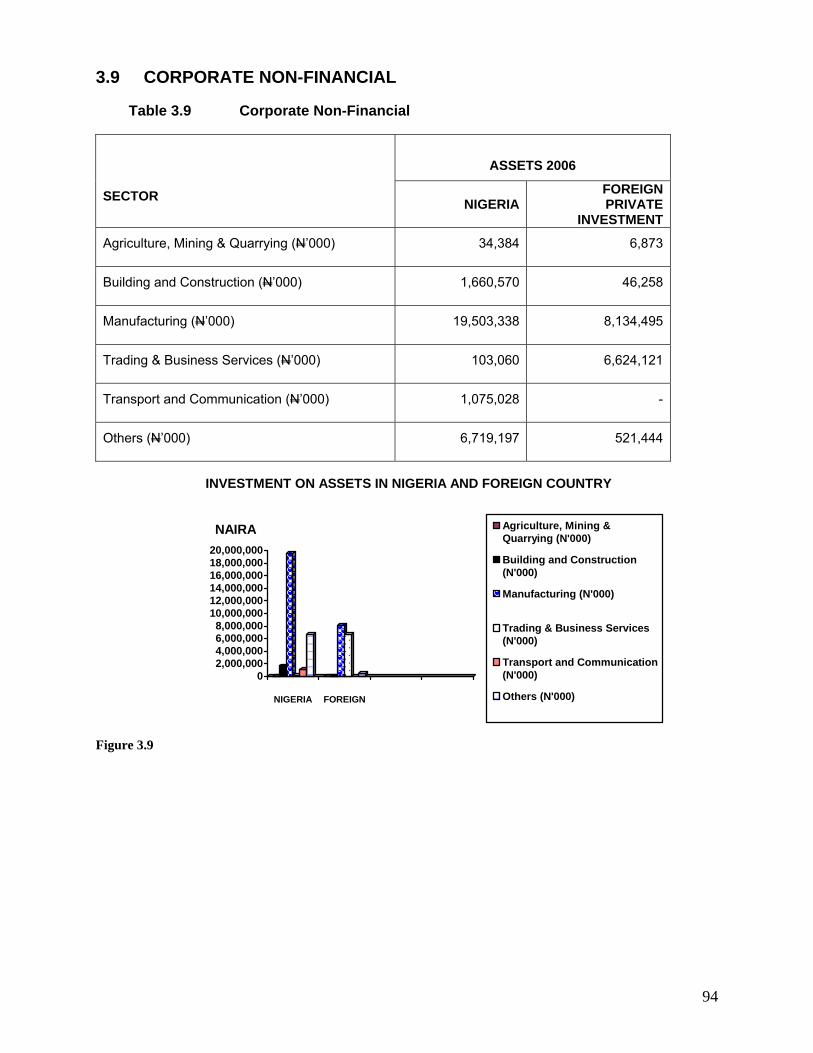
94
3.9 CORPORATE NON-FINANCIAL
Table 3.9 Corporate Non-Financial
ASSETS 2006
SECTOR NIGERIA
FOREIGN PRIVATE
INVESTMENT
Agriculture, Mining & Quarrying (N’000) 34,384 6,873
Building and Construction (N’000) 1,660,570 46,258
Manufacturing (N’000) 19,503,338 8,134,495
Trading & Business Services (N’000) 103,060 6,624,121
Transport and Communication (N’000) 1,075,028 -
Others (N’000) 6,719,197 521,444
02,000,0004,000,0006,000,0008,000,000
10,000,00012,000,00014,000,00016,000,00018,000,00020,000,000
NAIRA
NIGERIA
FOREIGN
INVESTMENT ON ASSETS IN NIGERIA AND FOREIGN COUNTRY
Agriculture, Mining &Quarrying (N'000)
Building and Construction(N'000)
Manufacturing (N'000)
Trading & Business Services(N'000)
Transport and Communication(N'000)
Others (N'000)
Figure 3.9

95
3.9.1 Agriculture, Mining and Quarrying:
The total value of assets of Agriculture, Mining and Quarrying in Nigeria was N34.38 million as at 31st December 2006. While foreign private investment in the sector in the same period was N6.87 million.
3.9.2 Building and Construction:
The total assets value of building and construction sector in Nigeria was N1.66 billion as at 31st December 2006; while foreign private investment in the industry in the same period was N46.26 million.
3.9.3 Manufacturing and Processing:
The total assets value in manufacturing sector in Nigeria was N19.50 billion as at 31st December 2006. Similarly, in the same period, the foreign private investment in the industry was N8.13 billion.
3.9.4 Trading and Business Services:
The total assets value in Trading and Business Services in Nigeria was N103.06 million as at 31st December 2006, while foreign private investment assets was N6.62 billion in the same year.
3.9.5 Transport and Communication:
The total assets value of transport and communication in Nigeria was N1.08 billion as at 31st December 2006. While total value of other assets in Nigeria was N6.72 billion as at 31st December 2006 and similarly, other foreign private investment assets over the same period was N521.44 million.
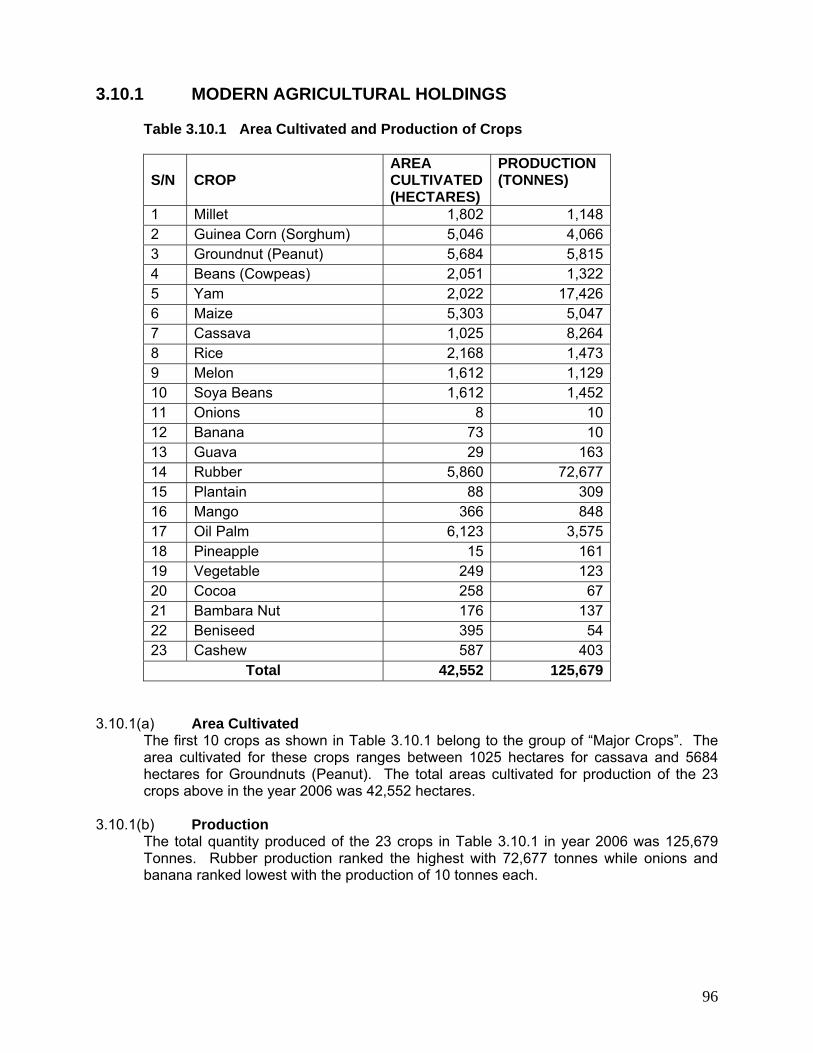
96
3.10.1 MODERN AGRICULTURAL HOLDINGS
Table 3.10.1 Area Cultivated and Production of Crops S/N
CROP
AREA CULTIVATED (HECTARES)
PRODUCTION (TONNES)
1 Millet 1,802 1,148 2 Guinea Corn (Sorghum) 5,046 4,066 3 Groundnut (Peanut) 5,684 5,815 4 Beans (Cowpeas) 2,051 1,322 5 Yam 2,022 17,426 6 Maize 5,303 5,047 7 Cassava 1,025 8,264 8 Rice 2,168 1,473 9 Melon 1,612 1,129 10 Soya Beans 1,612 1,452 11 Onions 8 10 12 Banana 73 10 13 Guava 29 163 14 Rubber 5,860 72,677 15 Plantain 88 309 16 Mango 366 848 17 Oil Palm 6,123 3,575 18 Pineapple 15 161 19 Vegetable 249 123 20 Cocoa 258 67 21 Bambara Nut 176 137 22 Beniseed 395 54 23 Cashew 587 403
Total 42,552 125,679
3.10.1(a) Area Cultivated
The first 10 crops as shown in Table 3.10.1 belong to the group of “Major Crops”. The area cultivated for these crops ranges between 1025 hectares for cassava and 5684 hectares for Groundnuts (Peanut). The total areas cultivated for production of the 23 crops above in the year 2006 was 42,552 hectares.
3.10.1(b) Production The total quantity produced of the 23 crops in Table 3.10.1 in year 2006 was 125,679 Tonnes. Rubber production ranked the highest with 72,677 tonnes while onions and banana ranked lowest with the production of 10 tonnes each.

97
Table 3.10.2 Number of Livestock by Type and Sex
Number of Livestock
Number of Females
Type of Livestock
Total
Male
Female
Producing Milk
Not Producing Milk
Cattle 22966 5453 17514 2836 14678 Sheep 3113 799 2314 0 0 Goat 5233 771 4461 0 0 Camel 0 0 0 0 0 Donkey 0 0 0 0 0 Pigs 1323 551 771 0 0 Others 385 165 220 0 0
TOTAL 33019 7739 25,280 2836 14,678 3.10.2(a) Number of Livestock
The total male livestock in year 2006 was 7,739 (23.44 per cent) while that of the female was 25,280 (76.56 per cent) of the total livestock of 33019. The livestock with highest number was cattle with 22966 (69.55 per cent) and the lowest was “Others” (i.e. livestock not named) which constitutes 1.17 per cent of the total livestock
3.10.2(b) Number of Female Livestock Producing/Not Producing Milk
The total number of female livestock producing milk in year 2006 was 2836 while 14678 livestock were not producing milk in the same year.

98
3.11 INFORMATION AND COMMUNICATION TECHNOLOGY (ICT) IN ESTABLISHMENTS
Table 3.11: Information and Communication Technology (ICT) in Establishments
SECTOR Amount invested in ICT (n’000)
Number of Employees using pc
Number of Employees having access to internet
Manufacturing 4,392,983 154,452 56,715
Wholesale and Retail Trade 9,105 9,950 217,174
Organised Road Transport Operators 159,005 1,228 8,270
Hotels and Restaurants 25,041 5,921 6,867
Mining and Quarrying 496 562 1,946
Private Professional Services 530 39,069 7,276
Building and Construction 367,849 2,555 41,795
Total 4,955,000 213,737 340,033
3.11.1 The manufacturing sector was ranked highest investor (about N4.39 billion, representing
88.60 per cent) in Information and Communication Technology (ICT) in 2006, with corresponding number 154,452 employees (representing 72.26 per cent) using Personal Computers (PCs). Although, the sector was ranked third in the series of employees having access to internet (precisely 56,715 employees, representing 16.68 per cent).
3.11.2 Building and Construction Industry ranked second with N367.84 million, (representing
7.42 per cent) invested on information and Communication Technology (ICT); ranked fifth with 2,555 employees (representing 1.20 per cent) using personal computers and ranked third with 41,795 employees (representing 12.29 percent), having access to internet.
3.11.3 Organized road transport operators ranked third with N159.01 million (representing 3.21
percent) invested in Information and Communication Technology (ICT), ranked sixth with 1,228 employees (representing 3.21 per cent) using personal computers and ranked fourth with 8,270 employees (representing 2.43 per cent) having access to internet.
3.11.4 Private Professional Services ranked second with 39,069 employees (representing
11.49 per cent) using personal computers (PCs); and ranked fifth with 7,276 employees (representing 2.14 percent) having access to internet and invested N530million in Information and Communication Technology (ICT) in 2006.
3.11.5 Wholesale and Retail Trade ranked highest with 217,164 employees (representing 63.87
percent) having access to internet; ranked third with 9,950 employees (representing 4.66 per cent) using Personal Computers (PCs) and ranked fifth investor with N9.11 million in information and communication technology (ICT) in 2006.

99
0.0
2.5
5.0
7.5
1st 2nd 3rd 4th
QUARTER
Volume (Billion ltr)
DomesticIndustrialOthers
20.1
9.7 10.5
0.0
8.0
16.0
24.0
Volume (Billion ltr)
Domestic Industrial Others
PURPOSE
Chapter Four
SYSTEM OF ADMINISTRATIVE STATISTICS 4.1 Water Board Statistics 4.1.1 Total Volume of Available Water by Use
The State Governments embarked on various water projects, which are handled or co-ordinated by the Water Board. The aims and objective are to make water available for the various activities which include domestic, industrial, agricultural and other purposes. Data on the activities of the States Water Board were obtained from 30 administrative units of government, which include 29 states and the Federal Capital Territory. Hence all tables in this section are with respect to the states and FCT.
Fig. 4.1.1 Volume of Water Available by Purpose (2006) Table 4.1.1 shows that the total volume of water available in 2006 was 40.3 billion cubic litres. About half of the total volume of water available (20.1 billion litres) was used for domestic purpose while 24.1 percent (9.7 billion litres) was used for industrial purposes. The balance of 10.5 billion litres which represent 26 percent of the total volume was used for all other purposes.
Fig. 4.1.2
Trend of Volume of Water Available by Quarter (2006)
The pattern was the same in terms of the downward trend of water availability by quarter. In all cases, water was more available in the first quarter while the downward trend is observed towards the fourth quarter. (See table 4.1.1 in Appendix)

100
0.0
0.5
1.0
1.5
2.0
2.5
Billions
COM TAX PROP TAX POOL TAX OTHERS
B. LOCAL GOVERNMENT 4.2.1 Tax Revenue
The aggregate tax revenue by of the Local Governments in year 2006 was N4.12 billion. Community tax topped the sources with N2.16 billion, representing 52.4% of all tax revenue. Pool Tax followed with 1.0 billion naira representing 4.3% of the total. Property and Others taxes contributed the balance of 23.3%. (See Table 4.1.4 in Appendix).
Fig. 4.2 Local Government Tax Revenue (2006)
4.2.2 Non-Tax Revenue
The amount of money that came to the Local Governments as non-tax revenue in year 2006 was higher than the tax revenue. The total non-tax revenue was N19.96 billion. Interest Repayment and Dividend contributed the highest amount to the tune of N7.4 billion. Licences and Earnings from Sales contributed N3.1 billion each. Rent on Local Government Property contributed the smallest amount of N1.4 billion. (See Table 4.1.4 in Appendix).
4.2.3 Statutory Allocations
The total statutory allocation to the Local Governments was about N563 billion in year 2006. This includes N492 billion from the Federation Account, N55.8 billion from Value Added Tax and N15.2 billion from Stabilization Fund and General Ecology. The allocation from the federation account constitutes about 87% of the total statutory allocation. The allocation from value added tax and stabilization fund respectively constitutes about 10% and 3% of the total statutory allocation. (See Table 4.1.4 in Appendix).
4.2.4 Recurrent Expenditure The Local Governments’ recurrent expenditure totalled N294.4 billion in the year 2006. Of this amount N162.0 billion (55.0%) was personnel cost while N113.8 (38.7%) was overhead cost. Pension and gratuity gulped N8.3 billion (2.8%), interest on loan N0.3 billion. N9.9 billion, which represents 3.4% of the total recurrent, was spent under other recurrent sub-heads.
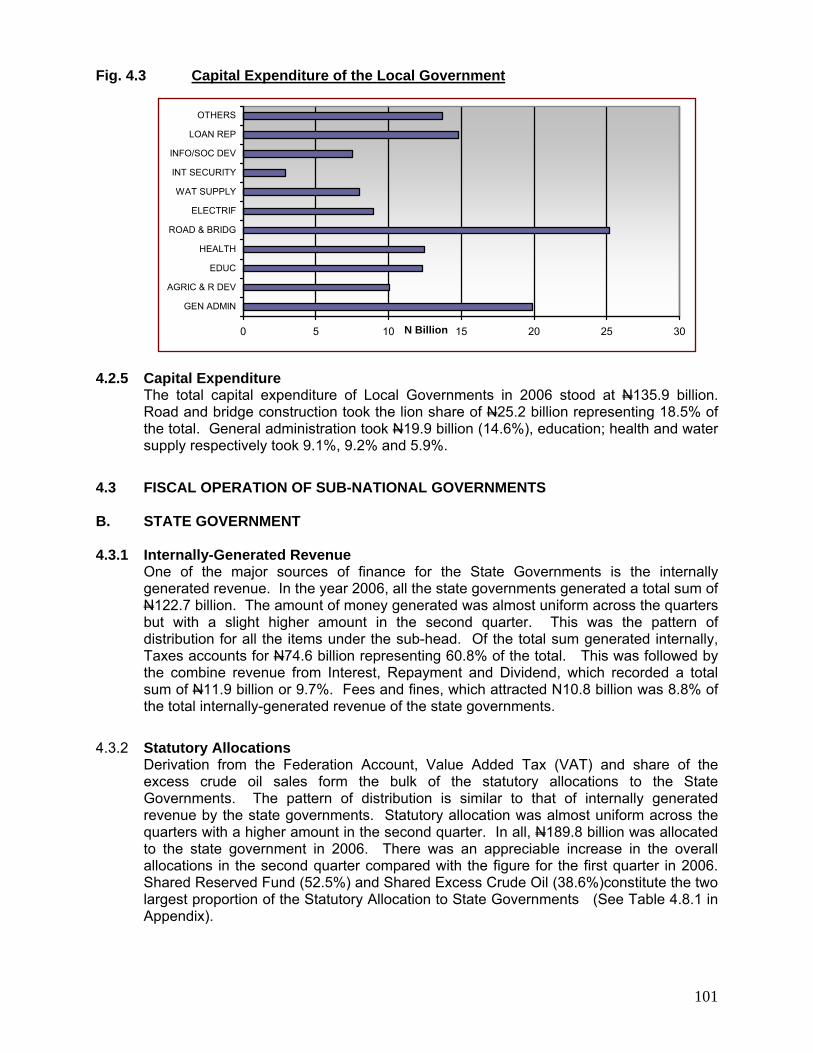
101
Fig. 4.3 Capital Expenditure of the Local Government
4.2.5 Capital Expenditure
The total capital expenditure of Local Governments in 2006 stood at N135.9 billion. Road and bridge construction took the lion share of N25.2 billion representing 18.5% of the total. General administration took N19.9 billion (14.6%), education; health and water supply respectively took 9.1%, 9.2% and 5.9%.
4.3 FISCAL OPERATION OF SUB-NATIONAL GOVERNMENTS B. STATE GOVERNMENT
4.3.1 Internally-Generated Revenue
One of the major sources of finance for the State Governments is the internally generated revenue. In the year 2006, all the state governments generated a total sum of N122.7 billion. The amount of money generated was almost uniform across the quarters but with a slight higher amount in the second quarter. This was the pattern of distribution for all the items under the sub-head. Of the total sum generated internally, Taxes accounts for N74.6 billion representing 60.8% of the total. This was followed by the combine revenue from Interest, Repayment and Dividend, which recorded a total sum of N11.9 billion or 9.7%. Fees and fines, which attracted N10.8 billion was 8.8% of the total internally-generated revenue of the state governments.
4.3.2 Statutory Allocations
Derivation from the Federation Account, Value Added Tax (VAT) and share of the excess crude oil sales form the bulk of the statutory allocations to the State Governments. The pattern of distribution is similar to that of internally generated revenue by the state governments. Statutory allocation was almost uniform across the quarters with a higher amount in the second quarter. In all, N189.8 billion was allocated to the state government in 2006. There was an appreciable increase in the overall allocations in the second quarter compared with the figure for the first quarter in 2006. Shared Reserved Fund (52.5%) and Shared Excess Crude Oil (38.6%)constitute the two largest proportion of the Statutory Allocation to State Governments (See Table 4.8.1 in Appendix).
0 5 10 15 20 25 30
GEN ADMIN
AGRIC & R DEV
EDUC
HEALTH
ROAD & BRIDG
ELECTRIF
WAT SUPPLY
INT SECURITY
INFO/SOC DEV
LOAN REP
OTHERS
N Billion

102
4.3.3 Capital Expenditure Capital expenditure of the state governments is captured under four major sub-heads. These are Administration, Economic Sector, Social Services and Transfers. In 2006, the sum of N105.4 billion was spent under Administration and represents 20% of the total capital expenditure in 2006. More than double the amount on Administration (N228.9 billion) or 43.6% was spent on the Economic Sector. The trend of the capital expenditure under Economic Sector was upwards from first quarter to the fourth quarter in 2005. Expenditure under Social Services was N127.7 billion or 24.3%. About 12.1% or N63.7 billion was spent on Transfers, which include Public Debt, Pension and Gratuity, and Other Transfers (See table 4.8.3 in the Appendix).
Fig. 4.5 Capital and Recurrent Expenditures of the State Governments (2005)
4.3.4 Recurrent Expenditure
The recurrent expenditure of the state governments is captured under the same sub-heads like the capital expenditure except ‘Transfers’, which is not an item under recurrent expenditure. The breakdown of the total expenditure shows that 2006, Administration gulped 44.3% with the sum of N166.5 billion. Expenditure under Economic Sector was N91.9 billion or 24.5% of the total. The expenditure on Social Services was N117.3 billion or 31.2% (See table 4.8.4 in the Appendix)
4.3.5 Summary of Recurrent Expenditure The summary of recurrent expenditure captures such items as Personnel Cost, Overhead Cost, CRF Charges, Grants, Transfers, Debt Charges, Pensions and other unclassified recurrent expenditures. Table 4.8.5 in Appendix shows that the bulk of recurrent expenditure was made on Personnel 29.2% and Overhead 28.7%. The amount expended under the two items was N183 billion and N179.4 billion, respectively. Recurrent Grants gulped N93.6 billion or 15.0% while CRF Charges and Transfer to other Funds gulped N59.7 and N58.2 billion, respectively.
40
140
240
N Billions
Transfe
rs
Social
Serv
ices
Econo
mic Sec
tor
Admini
strati
on
CapitalRecurrent

103
4.4. COOPERATIVE SOCIETIES 4.4.1 Type and Membership of Cooperative Societies
In assessing the progress made, it is reasonable to reckon with number and membership of registered and unregistered Cooperative Societies. Even though the number of various registered societies almost remained constant when compared with previous years, membership was very much on the increase across the various types of cooperative societies. For farmer’s multipurpose cooperative societies, 106,297 registered and unregistered societies produced 3,027,781 members. This translates to about 28 members per cooperative society. There was a downward trend in the number of cooperative societies like Livestock, Credit and Thrift, as well as Informal Sector.
NUMBER REGISTERED UNREGISTERED MEMBERSHIP
TYPE OF AGRIC COOPERATIVES 2005 2006 2005 2006 2005 2006 Farmers Multipurpose 150719 100444 7337 5853 1695444 3027781 Group Farming 91498 12702 1956 1640 326970 308611 Farm Settlements 25803 4011 23 5 61679 22895 Fishery 15030 6496 1926 118 67505 108093 Livestock 29149 14373 151 1086 36838 98218 Credit and Thrift 35970 45195 107 579 270491 2834485 Informal Sector 26185 23119 358 136 87326 113641 Others 30753 17165 211 118 392968 560242
4.4.2 Internally Generated Fund In the table, we observed that the total internally generated fund in Cooperative Society increases as the quarter progresses. This was confirmed in the fourth quarter of the year as the increase became obvious with N17.3 billion for the quarter compared to N14.6 billion in the third quarter. Again, we also observed that savings and deposit of fund decreases in the first quarter of the year, and this could be ascribed to season preceded the quarter and many people had spent their money for celebration. In the same table, the paid-up shares had uniform pattern for the whole quarters of the year. This could be as a result of the cooperative having uniform pattern of profit for the year, 2006.
HOUSING STATISTICS
4.5 Housing Statistics:
Housing statistics plays a very significant role in measuring the standard of living of people. They also give clear comparisons of the levels of development among the countries of the world. They constitute some of the inputs for GDP computation.
4.5.1 Land Allocation by Purpose and by Sex:
Table 4.5.1 shows allocation of land by purpose for which they were used. The table also indicates the number of applications made as compared to number of applications approved. In all cases, applications coming from the male persons out-numbered those of their female counterpart. In the year 2006, the number of applications for residential purpose was 11,418 representing 86.1 percent of all applications for land. Total number of applications received for commercial purposes (899) constitutes 6.8 percent. Number of applications for land for industrial use (168) was comparatively too low. However, there were a reasonable number of applications for other purposes (773). See table 4.5.1 in Appendix.

104
LAND ALLOCATION AND APPROVAL BY PURPOSE AND SEX
NUMBER OF APPLICATION
NUMBER OF APPOVAL Type of
Allocation Number % Number % RESIDDENTIAL 11418 86.12 5334 80.22 COMMERCIAL 899 6.78 679 10.21 INDUSTRIAL 168 1.27 67 1.01 OTHERS 773 5.83 569 8.56 Total 13258 100 6649 100
0102030405060708090
RESIDDENTIAL COMMERCIAL INDUSTRIAL OTHERS
LAND APPLICATION AND APPROVAL
In all, about half of all applications received were approved. However, the rate of approval of applications differed for various purposes. Whereas about 75 percent of application for land for commercial purpose received approval, it was below 50 percent for residential and industrial purpose respectively.
4.3.2 Building by Ownership:
Table 4.5.2 shows the distribution of building by ownership. It indicates the number of applications made to acquire buildings; number of approvals and allocations made by various owners (individuals, corporate organizations, governments and NGOs and other unclassified bodies). Application, approvals and actual allocations were more for private owners than for corporate, government and NGOs. Analysis by time series shows that a greater number of applications were received during the first and second quarters than the two other quarters. Table 4.5.2 also gives the breakdown of the applications, approval and allocation by state.
4.6 HEALTH STATISTICS 4.6.1 HOSPITAL TYPE
This table shows the number of hospitals by type General Hospital, Maternity for Women, Maternity for Children, Infectious diseases, Orthopedic and others across the nation in 2006. Apart from maternity hospitals, which showed a slight increase in fourth quarter (1,070) compared with 1,054 maternity hospitals in the third quarter, there was little or no increase in number of hospitals from first quarter to the fourth quarter. This increase was actually noticed in Ebonyi State which rose from 25 maternity hospitals in third quarter to 39 in the forth quarter.

105
4.6.2 BEDS BY HOSPITAL TYPE
Though, hospital beds in various types of hospitals remained the same from one quarter to another, Maternity and General Hospitals showed little increases from the third to fourth. General Hospitals rose from 43,351 beds in the third quarter to 46,848 beds in fourth quarter. Beds in Maternity Hospital also increased from 7,295 in the third quarter to 8,215 in fourth quarters.
HOSPITAL BY TYPE
TYPE BEDS General Hospital 46848 Maternity 8215 Children 105 Infectious Diseases 819 Orthopaedic 0 Psychiatric 1699 Specialist 5872 Teaching 4378 Community Health Centre 34999
4.6.3 PATIENTS BY HOSPITAL TYPE
This shows the figures of in-patients and out-patients by type of hospital in 2006. In general hospital in-patients rose from 29,588 in the first quarter to 139,082 patients in second quarter but declined both in third (116,699) and fourth quarters (909,415). Same flow was observed with maternity hospitals, which rose to 5,804 patients in second quarter from 5,087 patients in first quarter and declined thereafter to 5,469 patients in fourth quarter.
4.6.4 HEALTH PERSONNEL BY SEX
This table gives the data of health personnel by professionalism and gender. Males were more predominant as medical doctors, dentists, pharmacists and environmental health officers; it was the other way round for nurses and midwives for which most personnel were females. Sixty one percent of the nurses were females. Equal
BEDS BY HOSPITAL TYPES
05000
100001500020000250003000035000400004500050000
Gen
eral
Hos
pita
l
Mat
erni
ty
Chi
ldre
n
Infe
ctio
usD
isea
ses
Orth
opae
dic
Psy
chia
tric
Spe
cial
ist
Teac
hing
Com
mun
ityH
eath
Bed

106
distribution between both sexes was observed with pharmacy staffs. On the average, for medical doctors and environmental health staff, male recorded about 71% leaving 29% for female.
4.7 EDUCATION STATISTICS
Education plays a very important role in the development of a nation. The improvement in the education sector could be measured by input and output from such educational institutions.
In Nigeria, educational institution can be owned by public, private for commercial or private for other purposes like religion or foundation. The ownership is classified into two broad categories; public and private. The presentations in this section compare educational institutions owned by the public with those privately owned.
4.7.1 Educational Institutions by Ownership: Table 4.7.1 shows number of educational institutions classified by ownership comparing years 2005 and 2006. The table shows that even though there was an upward trend in the number of private schools, the public institutions are still ahead of the in terms of numbers. And for both public and private, the number of institutions was on the increase from year 2005 to year 2005.
4.7.1 Teaching Staff in Educational Institutions:
Table 4.7.2 gives the data on number of teachers in both public and privately owned schools in various types of educational institutions, comparing year 2005 with 2006. The table also shows that the public institutions are still ahead of private ones in terms of number of primary school teachers. In both public and private owned schools, the number of teachers increased in 2006. Some level of increase was also noticed for teachers in publicly owned technical and vocational schools.
4.7.3 Pupils/Students in Public and Private Schools
Table 4.7.3 shows the number of pupils/students in public and private schools, comparing 2005 and 2006. The analysis by year shows that the population of primary school pupils was higher in 2006 than in year 2005 in both public and private schools. The same increase was still noticeable with respect to students’ population in higher institutions. However the growth rate was higher for private secondary vocational schools.
4.8 VEHICLE REGISTRATION:
Official l registration is compulsory for all vehicles to be used in the country for various purposes. The statutory power for the registration of vehicles is vested on States Inland Revenue in State Ministry of Finance and Economic Development. Registration is categorized by type of vehicle under various ownership; Government, Private and Commercial.
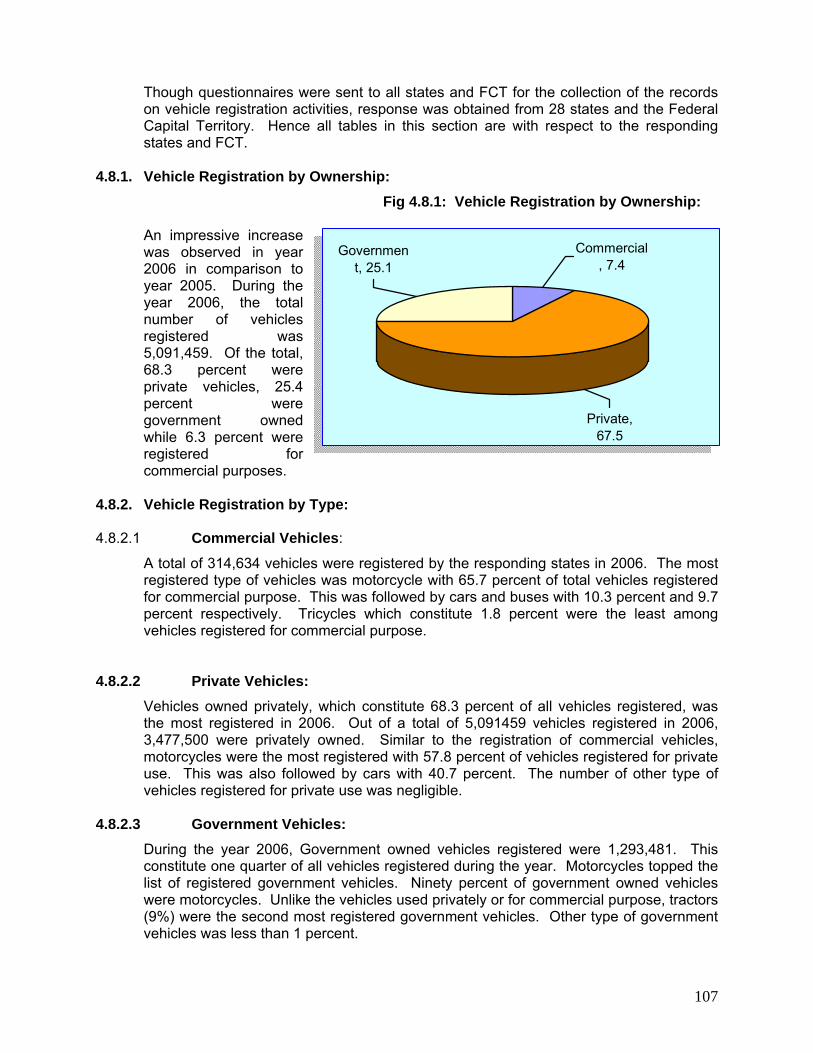
107
Though questionnaires were sent to all states and FCT for the collection of the records on vehicle registration activities, response was obtained from 28 states and the Federal Capital Territory. Hence all tables in this section are with respect to the responding states and FCT.
4.8.1. Vehicle Registration by Ownership:
Fig 4.8.1: Vehicle Registration by Ownership:
An impressive increase was observed in year 2006 in comparison to year 2005. During the year 2006, the total number of vehicles registered was 5,091,459. Of the total, 68.3 percent were private vehicles, 25.4 percent were government owned while 6.3 percent were registered for commercial purposes.
4.8.2. Vehicle Registration by Type: 4.8.2.1 Commercial Vehicles:
A total of 314,634 vehicles were registered by the responding states in 2006. The most registered type of vehicles was motorcycle with 65.7 percent of total vehicles registered for commercial purpose. This was followed by cars and buses with 10.3 percent and 9.7 percent respectively. Tricycles which constitute 1.8 percent were the least among vehicles registered for commercial purpose.
4.8.2.2 Private Vehicles:
Vehicles owned privately, which constitute 68.3 percent of all vehicles registered, was the most registered in 2006. Out of a total of 5,091459 vehicles registered in 2006, 3,477,500 were privately owned. Similar to the registration of commercial vehicles, motorcycles were the most registered with 57.8 percent of vehicles registered for private use. This was also followed by cars with 40.7 percent. The number of other type of vehicles registered for private use was negligible.
4.8.2.3 Government Vehicles:
During the year 2006, Government owned vehicles registered were 1,293,481. This constitute one quarter of all vehicles registered during the year. Motorcycles topped the list of registered government vehicles. Ninety percent of government owned vehicles were motorcycles. Unlike the vehicles used privately or for commercial purpose, tractors (9%) were the second most registered government vehicles. Other type of government vehicles was less than 1 percent.
Government, 25.1
Commercial, 7.4
Private, 67.5

108
Percentage Distribution of Registered Vehicles by Type (2006)
TYPE OF VEHICLE COMMERCIAL PRIVATE GOVERNMENT
MOTOR CYCLES 65.71 57.84 90.28
CARS 10.25 40.66 0.53
BUSES 9.69 0.68 0.09
PICK UP VANS 4.36 0.38 0.07
LORRIES 3.96 0.35 0.03
TIPPERS 2.39 0.02 0.01
TRI CYCLES 1.82 0.04 0.00
TRAILERS 1.21 0.03 0.01
TRACTORS 0.61 0.01 8.98
TOTAL 100.0 100.0 100.0
4.8.3. Access and Use of Information and Communication (ICT) Facilities:
Access and utilization of internet facilities was still low within the states Inland Revenue agencies. However, when compared to other similar government agencies, the states Inland Revenue had better access. As at December 2006, 12.9 percent of the establishments owned internet facilities, and those having website and Local Area Networks (LAN) were 9.7 percent respectively.
In the 29 establishments, 283 computers were available for use, resulting to an average of 10 computers per establishment. Analysis of computer availability by state shows that Lagos State topped the list with 91 computers while Ogun State followed with 44. Nasarawa and Ebonyi States had one computer each. Eleven out of the states Inland Revenue did not own computer in 2006.
4.10 UNEMPLOYMENT STATISTICS 4.10.1 Unemployment (Professional/Executives)
The total of 150 vacancies was declared across the nation in 2006, out which male recorded 90 vacancies and female 60 vacancies. For old registration, 47,872 registrations were made, with male registering 34,308 (71.7%) and the remaining 28.3% for Female. 1,296 Fresh registrations were made in 2006, out of which male representing 63.11% of the total. Re-registration had toal of 330 registrations, Oyo State representing 54.85 per cent (male 64 and female 117 Re-registrations).
4.10.2 Unemployment (Lower Grades)
In 2006, old registrations were 160, 837, with male representing 81.8%, leaving the remaining 18.2% for female (29,259). Fresh registration had a total of 26,733 registrations, with the first quarter representing 96.96% (male 71.36% and female 28.64%). The total number of vacancies declared for 2006 stood at 517 (64.22%
109
for male and 35.78% for female), from which 272 placements were made for 161 males and 111 females.
4.10.3. Unemployment (Trade Disputes)
This table gives Trade dispute statistics by quarters. A total of 46 disputes was recorded in 2006 which resulted in 112 work stoppages and 85,342 workers being involved with 2,446,085 man-day lost. The second quarter topped the trade dispute list with 39.13 per cent (18), resulting in 25.89 per cent (29) work stoppages which involved 54.05 per cent (46,130) workers and 55.89 per cent (1,367,119) man-day lost.
4.10.4. Unemployment (Cost of Operation)
Cost of operation is captured under six major sub-heads. These are Electricity, Repairs and maintenance, Consumables, Wages and Salaries, other benefits and other costs. In 2006 the sum of N10.6 million was spent on other benefits and represents 11.01% of the total cost of operation in 2006. More than six times the amount on other benefits (73.6 million) or 76.37 per cent was spent on wages and salaries. Cost of repairs and maintenance was N1.40 million or 1.45 per cent, while 0.79 per cent or N0.76 million was spent on electricity supply.
4.10.5. Unemployment (ICT)
Establishments having website and Local Area Network (LAN) facilities recoded 5.6 per cent each. The total number of computers in organisations was 48 computers in 2006, out of which Ekiti State represents 52.08 per cent (25 computers).
4.11 RESEARCH INSTITUTES (2006) 4.11.1 Sources of Fund
This table shows various sources of fund for research institutes such as Federal Government, State Government, World Bank, DFID and Internal Generated Funds. Among the various sources of fund for research institutes between the year 2005 and 2006 topped on the list of donors was federal government with N4.957 billion and N4.259 billion for 2005 and 2006 respectively. This was followed by state government donation with N141.3 million and N157.4 million for 2005 and 2006 respectively while the least was World Bank with nothing in year 2005 while 2006 was N10 million.
4.11.2 Employment
This table shows total number of employment by sex for both Nigerians and non-Nigerians in Research Institutes. Some research institutes did not provide information on number of employment and it was associated with non-response. Expectedly the analysis showed that employment of Nigerians very much out numbered non-Nigerians. It should be appreciate, however, that this sector employed more non-Nigerians than other sectors.

110
4.11.3 Information and Communications Technology This table shows the percentage number of Establishment using information technology. In the table there was uniform pattern of Establishment with access to information technology topped on the list was Establishment having Website with 81.8 per cent and followed by Establishment owning internet facilities, Establishment receiving orders through the internet and Establishment having internets with 63.6 per cent each, while the least was Establishments having local Area Networks (LAN) with 36.4 per cent. In the same table also, analysis showed that the acquisition and access to information technology was evenly distributed in almost all the research institutes (see table 4.11.3 in the Appendix).
4.12 NATIONAL DIRECTORATE OF EMPLOYMENT (2006) 4.12.1 NEW BENEFICIARIES
This table shows total number of graduates and non-graduates beneficiaries on loans granted as well as the amount of loan spent for both sexes. However, some states did not have information and this was ascribed to non-response during the survey year. For both graduates and non-graduates, there were more male beneficiaries than female ones. It was also observed from the table that the total number non-graduates new beneficiaries were higher than their graduate counterparts.
4.12.2. AMOUNT SPENT ON LOAN
Even though, the amount spent on loan for male (N53.3 million) was higher in value than that which as spent for females (N29.4 million), the amount spent on loan per capital for females (N7, 988) was higher than that for males (N7, 397).
4.12.2. LOAN RECOVERY
This table shows the total number of beneficiaries on loan, total amount granted and total amount recovered. In the table, the total amount granted was N209.6 million while the total amount recovered was N22.3 million representing 10.6% of the amount granted.
LOAN GRANTED VERSUS LOAN RECOVERED
SEX
LOAN GRANTED
LOAN RECOVERED
MALE 127,500,689 15,132,582 FEMALE 82,127,347 7,134,992 TOTAL 209,628,036 22,267,574

111
4.13 REPORTED ROAD ACCIDENT (2006)
The reported road accident statistics captures data on reported cases of road accidents by type of accident, resultant effects and total value of property lost due to accident.
4.13.1 Reported Cases: This table shows the distribution of reported cases of road accidents such as fatal, serious and minor for all the states of the federation including FCT. In all, a total of 9,114 cases were topped in 2006. In the table, serious cases topped the list with 5,550 representing 60.9% and followed by fatal cases with 2,600 representing 28.5 % while minor cases of accident reported were 964 representing 10.6%. At the state level, Lagos state with 2,806 recorded the highest number of road accidents, while Ondo State followed with 1,102. The least number of accidents was recorded for Anambra State with 40 cases in year 2006.
4.13.2 Value of Property Lost:
Only eleven out of 36 states provided total value of properly lost due to accident. About N165.6 million worth of properties were reported lost due to road accidents in from the responding eleven states.
0
50,000
100,000
150,000
Thousands
MALE FEMALE
SEX
LOAN GRANTED AND LOAN RECOVERED BY SEX
LOAN GRANTED
LOAN RECOVERED

112
Chapter Five
5.0 TRADE
5.1 TRADE PRICE INDICES:
It should be noted that because of very low response rate recorded during the survey index figures were constructed from trade data for the year 2006. The weights derived from the 2005 survey were maintained. Indices were computed at two digits level (section) with their respective weights. Exports data were combination of trade data base and that of Cobalt International were integrated. The following Laspayers Index formula was adopted: INDEX CALCULATION :
Li = (100*∑QoPi /∑QoPo)
Where: Po is the Import(CIF) or Export(FOB) values
Pi is the current unit price Qo is the base year Quantities Po is the base year Unit prices
5.1.1 Imports:
Trade Indices was computed with January 2005 as base month (see the attached tables). One of the ways of calculating trade price indices is the use of Laspeyes Index formula on the section code which is two digits, viz 01, 02,------ 21 and 22. All sections products for imports fluctuated between 98.11 per cents and 112.29 per cents through the months of January, 2005 to December, 2006, (see table 5.1.1)
5.1.2 Exports:
The export trade indices also fluctuated between 82.0 per cent and 100 per cent during the same period, (see table 5.1.2)
5.2 Terms of Trade:
Terms of Trade are just a ratio. It is the rate at which Exports exchange for imports. If the prices of a country’s exports go up suddenly more than the prices of imports, the terms of trade has worsened. This means that imports have become relatively dearer than exports and if the country maintains the same levels of exports and imports, its real income will fall. NB The larger the number, the more “favourable” terms of Trade.
Mathematically by the following formula: Index of export prices X 100 Index of import prices 1 5.3 All commodity Index:

113
This implies the general Price movement across all the commodities. The out put indicated in the tables 5.1.3 and 5.1.4 respectively.
5.4 Year on Year: Import year on year indicated positive percentages unlike export values. Exports recorded a minimum of 16.9 per cent in the month of March 2006, while imports with a maximum of 7.7 per cent in the month of may 2006. See tables 5.1.3 and 5.1.4.

114
Chapter Six
PRODUCER PRICE INDEX
6.0 PRODUCER PRICE INDEX CONCEPTS
The PPI measures the change over time in the prices received by domestic producers of goods and services. It is the inflation indicator for the business sector of the economy. Its coverage encompasses all marketed goods and services produced by business enterprises.
It is therefore one of the nation’s most important economic indicators. The Consumer Price Index and the Producer Price Index form the core price movement information on which many business and government policies are based. Besides supporting business and governmental decision making, PPI data are critical inputs into the development of other sensitive economic indicators, including estimates of Gross Domestic Product (GDP), industrial productivity and wages.
The output based price index measures the average price change of all covered goods and services produced in the economy and sold in the domestic and export markets. In constructing a family of output PPI, export prices are usually collected from a separate source to produce a separate export price index. The prices are actual transaction prices, which are directly recorded. Inter-company transfer prices should not be used. The price should be recorded at the time when the transaction occurs (moment of contract), rather than when the goods are dispatched, which in certain cases can be significantly later.
Input price index measures the change in the prices of all intermediate inputs used in
production by a specified sector of the economy. Intermediate inputs are inputs into the production process of an establishment that are produced elsewhere in the economy or are imported. Thus an input PPI measures changes in the cost of the basket of purchases required as inputs into the production process, but these inputs must not be primary inputs like land, labour or capital. Producer input prices should exclude deductible taxes on products (that is, VAT) but include the retail or wholesale margins of the supplier, since they measure the actual cost of the good or service to the producer. In constructing a family of input PPI, import prices are usually collected from a separate source to produce a separate import price index.
The PPI can be produced on two different weighting concepts – gross or net of inter-
sector sales. The concept can be more clearly explained by an example. The aggregate weight for gross sector output of the motor vehicles industry would include both the sales of the parts and the sales of the finished cars, even though the value of the parts are included in the value of the finished cars. The net sector output of the motor vehicles industry would measure only the sales of motor vehicles to other sectors of the economy and would exclude the sales of parts. It is desirable to produce aggregated PPI on a net sector basis. When using gross sector indices, there is a problem with multiple counting of price change as products flow through the different production processes. This occurs where the output of one industry is used as an input into another industry
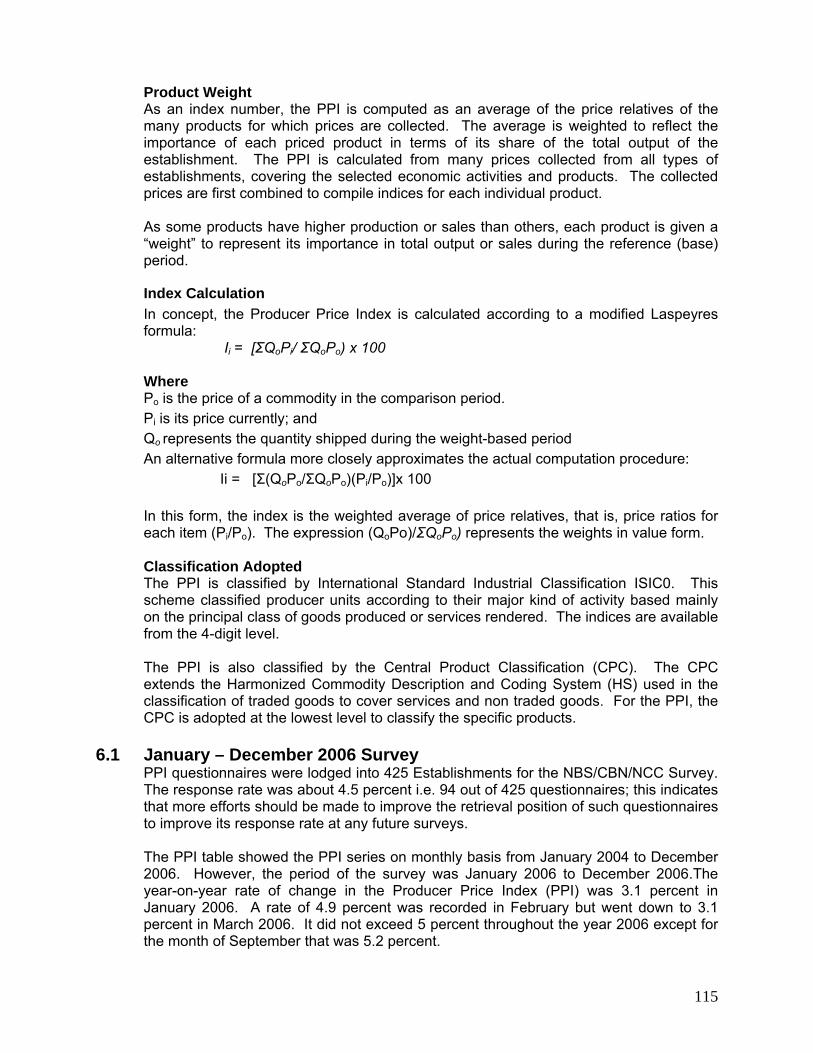
115
Product Weight As an index number, the PPI is computed as an average of the price relatives of the many products for which prices are collected. The average is weighted to reflect the importance of each priced product in terms of its share of the total output of the establishment. The PPI is calculated from many prices collected from all types of establishments, covering the selected economic activities and products. The collected prices are first combined to compile indices for each individual product.
As some products have higher production or sales than others, each product is given a “weight” to represent its importance in total output or sales during the reference (base) period.
Index Calculation In concept, the Producer Price Index is calculated according to a modified Laspeyres formula:
Ii = [ΣQoPi/ ΣQoPo) x 100
Where Po is the price of a commodity in the comparison period. Pi is its price currently; and
Qo represents the quantity shipped during the weight-based period An alternative formula more closely approximates the actual computation procedure:
Ii = [Σ(QoPo/ΣQoPo)(Pi/Po)]x 100 In this form, the index is the weighted average of price relatives, that is, price ratios for each item (Pi/Po). The expression (QoPo)/ΣQoPo) represents the weights in value form.
Classification Adopted The PPI is classified by International Standard Industrial Classification ISIC0. This scheme classified producer units according to their major kind of activity based mainly on the principal class of goods produced or services rendered. The indices are available from the 4-digit level.
The PPI is also classified by the Central Product Classification (CPC). The CPC extends the Harmonized Commodity Description and Coding System (HS) used in the classification of traded goods to cover services and non traded goods. For the PPI, the CPC is adopted at the lowest level to classify the specific products.
6.1 January – December 2006 Survey
PPI questionnaires were lodged into 425 Establishments for the NBS/CBN/NCC Survey. The response rate was about 4.5 percent i.e. 94 out of 425 questionnaires; this indicates that more efforts should be made to improve the retrieval position of such questionnaires to improve its response rate at any future surveys. The PPI table showed the PPI series on monthly basis from January 2004 to December 2006. However, the period of the survey was January 2006 to December 2006.The year-on-year rate of change in the Producer Price Index (PPI) was 3.1 percent in January 2006. A rate of 4.9 percent was recorded in February but went down to 3.1 percent in March 2006. It did not exceed 5 percent throughout the year 2006 except for the month of September that was 5.2 percent.

116
The level of the PPI in October 2006 was 5.0 percent above the corresponding level in October 2005. Thereafter, the year – on – year rate showed increase and rates of 2.9 and 3.2 percent above the corresponding levels in November and December 2005 respectively. The highest increase in the year – on – year change of 5.2 percent occurred in September 2006.
6.2 Comparing the Price Changes in the PPI and The CPI
CPI is based on the baskets of goods and services consumed by the households called consumer goods and services while the PPI on the other hand comprises of goods at farm gate prices or Ex-factory. Most of the goods if not all at this level pass through the middle men called the distributors and wholesalers before the retailers from whom the households make direct purchases. That is to say, that there is a lag that exists between the price changes as indicated by the PPI and also the change shown by the CPI.
For the period under review (year 2006), the year-on-year change recorded by the CPI was 8.5 percent while the corresponding change for the PPI was 3.3, that is, at the month that ends each year (December).
The average price changes for CPI and PPI in 2006 were 8.4 and 3.95 percent, respectively.

117
PRODUCER PRICE INDEX
92
94
96
98
100
102
104
106
108
110
JAN
FEB
MAR
APR
MAY JU
N
JUL
AU
G
SEP
OC
T
NO
V
DEC JA
N
FEB
MAR
APR
MAY JU
N
JUL
AU
G
SEP
OC
T
NO
V
DEC JA
N
FEB
MAR
APR
MAY JU
N
JUL
AU
G
SEP
OC
T
NO
V
DEC
2004 2005 2006
Jan 2004 TO Dec 2006
IND
EX

118
Chapter Seven
7.0 NATIONAL ACCOUNTS ESTIMATION OF QUARTERLY GROSS DOMESTIC PRODUCT (GDP)
7.1 Introduction:
Quarterly GDP estimates are the basic components of quarterly national accounts. In Principle, the accounts covers the full set of integrated economic accounts and balanced sheet as stated in the United Nation’s system of National Accounts (SNA 93). Quarterly estimates of GDP offer short and high frequency indicators thereby yielding timely information about the current economic situation as well as changes within any economy on short-term bases. The procedures used for quarterly estimation of GDP for 2006 is based on the production approach to estimation of GDP which internationally is guided by the blue print of the United Nations’ 1993 System of National Accounts (SNA ’93). This full set of accounts is subdivided into two parts. These are;
1. Production Accounts 2. Expenditure Accounts
The survey was targeted towards collecting socio-economic data series for 2006 necessary for the production of quarterly GDP series.
7.2 Sources of Data: The analysis derived its data from three main sources, namely: (i) Survey on major economic indicators conducted jointly by the National
Bureau of Statistics (NBS), Central Bank of Nigeria (CBN) and National Communication Commission (NCC) .
(ii) Administrative Statistics data earlier collected prior to the survey by the
National Accounts Division of NBS. This was used in filling up some existing data gaps.
(iii) Input-output relations established from the previous quarterly GDP
analysis/estimation by the National Accounts Division of the NBS. 7.3 Producing the Estimates
Actual quarterly aggregates were generated for 2006. Current price estimates of GDP were derived while the value added at current prices was deflated using established 1990 implicit price deflators to obtain value added at 1990 constant prices.
The gross domestic product for each quarter is produced by aggregating the value added for all the industries for the particular quarter. The overall annual GDP is derived by summing the aforementioned value added for the four quarters.

119
The estimate of intermediate consumption, compensation of employees, capital consumption allowance, indirect taxes and subsidies were independently produced from the survey results. Operating surplus is derived by netting off compensation of employees, capital consumption from the value added at basic prices. By adding indirect taxes and removing subsidies from the estimates of value added at basic prices, the current price estimate for value added at producers price is obtained. All other variables in National Accounts were derived by either adding the components derived above or as residuals.
7.4 Quarterly GDP Estimates at both Current and Constant (1990) Prices:
The economy in 2006 recorded an overall GDP at current basic price growth of 27.40 percent over that of 2005. The GDP at current basic price second half yearly growth of 2006 over 2005 stood at 26.85 percent. (See table 7.4.1) The quarterly GDP estimates at current basic prices rose from a level of N3,169.6 billion, N3,399.4 billion N3,924.8 billion, N4,078.5 billion, in 2005 to N3,986.3 billion, N4,426.1 billion, N4,986.5 billion, and N5,165.7 billion, respectively in 2006. This shows an overall quarterly growth rate in 2006 levels over the levels of 2005 to be 25.77 percent, 30.20 percent, 27.05 percent and 26.66 percent respectively (See table 7.4.6). The primary sector consisting of crop production, livestock, forestry and fishing accounted for about 32.76 percent of the overall GDP at current basic prices in 2005 and 32.00 percent in 2006. Also 27.64 percent, 32.96 percent, 36.55 percent, 32.91 percent represent the primary sector quarterly GDP share at current prices in 2005 and 27.16 percent, 31.36 percent, 36.01 percent and 32.40 percent in 2006 respectively. The GDP for the Crude Petroleum and Natural Gas sector at current basic price rose from a level of N5,664.9 billion in 2005 to N6,982.9 billion in 2006 representing an annual growth of 23.27 percent. The quarterly GDP levels stood at N1,348.2 billion, N1,382.2 billion, N1,450.2 billion, and N1,484.2 billion in 2005 and N1,752.7 billion, N1,627.0 billion, N1,745.7 billion, and N1,857.5 billion respectively in 2006. This sector accounted for 38.87 percent of the GDP at Current prices in 2005 and 37.61 percent in 2006 (see Table 7.4.6). On the other hand, the Gross Domestic Product at 1990 Basic Price increased from a level of N561.9 billion in 2005 to N595.8 billion in 2006 (See table 7.4.2) showing an annual growth rate of 6.03 percent. (See table 7.4.7). The second half yearly growth rate of GDP at constant 1990 prices for 2006 over 2005 stood at 5.96 percent. The quarterly GDP estimates at constant prices rose from the levels of N120.0 billion, N128.8 billion N153.9 billion, and N159.2 billion, in 2005 to N128.6 billion, N135.4 billion, N162.5 billion, and N169.3 billion, respectively in 2006. This shows an overall corresponding quarterly growth rate in 2006 as 7.11 percent, 5.19 percent, 5.56 percent and 6.35 percent respectively (See Table 7.4.7). The primary sector consisting of crop production, livestock, forestry and fishing accounted for about 41.19 percent of the overall GDP at constant prices in 2005 and 41.72 percent in 2006. Also 35.58 percent,

120
42.24 percent, 45.07 percent, 40.82 percent represents the primary sector quarterly GDP share at constant prices in 2005 and 35.61 percent, 43.14 percent, 45.80 percent and 41.32 percent in 2006 respectively (See Table 7.4.7). The GDP for the Crude Petroleum and Natural Gas sector at constant prices (See table 7.4.7) fell slightly from a level of N136.3 billion in 2005 to N130.2 billion in 2006 representing an annual growth of -4.51 percent. This sector accounted for 24.26 percent of the GDP at Constant prices in 2005 and 21.85 percent in 2006.
The implicit deflator of the gross domestic product (See table 7.4.3) rose from a level of 2,593.24 in 2005 to 3,115.80 in 2006 resulting in a growth of 20.15 percent. The economy recorded an overall increase of 0.50 percent in the output of the oil sector at constant prices in 2005 and an overall decrease of -4.51 percent in 2006. The non-oil GDP in nominal terms (See table 7.4.6) increased from a level of N8,907.4 billion in 2005 to N11,581.7 billion in 2006 representing a growth of 30.02 percent in 2006. The non oil sector share of the overall GDP in 2005 and 2006 stood at 61.13 percent and 62.39 percent respectively. Though the economy recorded a decrease in oil production in 2006, the overall increase in the value added of crude petroleum and natural gas in 2006 was as a result of the steady increases in world oil prices.
The non-oil sector real GDP (See table 7.4.7) rose from a level of N425.6 billion in 2005 to N465.6 billion in 2006 resulting to a growth rate of 9.41 percent.

121

122

123
Chapter Eight
8.1 OVERALL ASSESSMENT The joint implementation of the survey led to a number of gains and benefits in the production of official statistics at national and sub-national levels.
- Production of comprehensive national and sub-national statistics thereby
meeting the demands of the agencies. - Elimination of non-conflicting results/findings on the various sectors of the
economy - Ensurance of credibility and acceptability of the findings of the collaborative
survey, thereby building confidence of the various levels of users on the resulting statistics.
- Establishment of best statistical practices in the conduct of surveys among the MDAs in the national statistical system in the best interest of the country.
- Production of Integrated Statistical outputs for the various levels of users - Ensurance of provision of high professional services thereby building capacity
in the various agencies and production of quality results/findings - Provision of single source of official statistics in Nigerian through the National
Bureau of Statistics. - Reduction in the funding of the surveys because of the joint implementation - Ensurance cross-fertilization of ideas and enhanced knowledge of the various
subjects by the agencies.
These gains will eventually lead to improved statistical technical coordination in Nigeria thereby raising the standard of quality of resulting official statistics in Nigeria.
8.2 RECOMMENDATION
The followings were recommended for future collaboration. - There is need for improved planning and preparation for future surveys in
terms of commencement and implementation strategies - The new technology on the data collection instruments should be
improved upon and perfected for future rounds, especially the use of scannable questionnaires. The technology is good in that it enhanced timeliness in data processing and analysis
- The lateness in provision of funds for the project affected timely statistical delivery of the survey
- There is strong need for further capacity building on data processing, analytical capability and especially report writing.
- The frames of NISH and NISE should be reviewed as a matter of urgency before the commencement of the next round in order to improve the quality and credibility of the results.
In general, the collaboration is in line with NBS vision and mission and it is being planned by the Chief Executives Officer and Director-General of NBS to extend this collaboration to all MDA’s at national and sub-national levels including the LGA level.

124
Appendix I
TABLE 1.1
2006 COLLABORATIVE SURVEY ON SOCIO-ECONOMIC ACTIVITIES LIST OF QUESTIONNAIRES BY TYPE AND BY REFERENCE NUMBERS
S/NO SURVEY SYSTEM NAME OF SURVEY QUEST REF. NO.
1. GHS NBS/CBN/NCC/06/NISH-01 2. Private Farmer (Crop) NBS/CBN/NCC/06/NISH-02 3. Private Farmer (Livestock) NBS/CBN/NCC/06/NISH-03 4.
NISH Private Farmer (Fishing) NBS/CBN/NCC/06/NISH-04
5. Manufacturing NBS/CBN/NCC/06/NISE-01 6. Mining and Quarrying NBS/CBN/NCC/06/NISE-02 7. Hotels and Restaurants NBS/CBN/NCC/06/NISE-03 8. Building and Construction NBS/CBN/NCC/06/NISE-04 9. Wholesale and Retail Trade NBS/CBN/NCC/06/NISE-05 10. Private Professional Services/Financial Intermediation NBS/CBN/NCC/06/NISE-06 11. Organized Road Transport and Communication NBS/CBN/NCC/06/NISE-07 12. Petroleum Sector Statistics (Refinery) NBS/CBN/NCC/06/NISE-08 13. Corporate Non-Financial (Business Activity) NBS/CBN/NCC/06/NISE-09 14. Balance of Payment Questionnaire NBS/CBN/NCC/06/NISE-10 15. Producer Price and Foreign Trade Survey NBS/CBN/NCC/06/NISE-11 16.
NISE
Modern Holding NBS/CBN/NCC/06/NISE-12 17. State Water Board NBS/CBN/NCC/06/SAS-01 18. Local Government Finances NBS/CNB/NCC/06/SAS-02 19. NACRDB NBS/CBN/NCC/06/SAS-03 20. Cooperative Societies NBS/CBN/NCC/06/SAS-04 21. Electricity Generation and Consumption NBS/CBN/NCC/06/SAS-05 22. Research Institutes NBS/CBN/NCC/06/SAS-06 23. Fiscal Operations of State Government NBS/CBN/NCC/06/SAS-07 24. Housing Statistics NBS/CBN/NCC/06/SAS-08 25. Health Indicator Statistics NBS/CBN/NCC/06/SAS-09 26. Education Statistics NBS/CBN/NCC/06/SAS-10 27. Vehicle Registration Statistics NBS/CBN/NCC/06/SAS-11 28. National Directorate of Employment NBS/CBN/NCC/06/SAS-12 29. Reported Road of Accident NBS/CBN/NCC/06/SAS-13 30. Agriculture Development Projects –ADP NBS/CBN/NCC/06/SAS-14 31. Air Transport Statistics NBS/CBN/NCC/06/SAS-15 32. Ocean Shipping NBS/CBN/NCC/06/SAS-16 33. River Basin and Rural Development NBS/CBN/NCC/06/SAS-17 34. Railway Services NBS/CBN/NCC/06/SAS-18 35. Unemployment and Industrial Relation NBS/CBN/NCC/06/SAS-19 36. Water Resources Statistics NBS/CBN/NCC/06/SAS-20 37. Telecom-Fixed Telephone Operators NBS/CBN/NCC/06/SAS-21 38. Telecom-Digital Mobile Telephone Operators NBS/CBN/NCC/06/SAS-22 39. Telecom-Pre-paid Calling Cards NBS/CBN/NCC/06/SAS-23 40. Telecom-Vsat/PNL Satelite Operator NBS/CBN/NCC/06/SAS-24 41. Telecom-Internet Service Provider NBS/CBN/NCC/06/SAS-25 42.
SAS
NIPOST NBS/CBN/NCC/06/SAS-26

125
TABLE 1.2
NBS/CBN/NCC COLLABORATIVE STUDY ON SOCIO-ECONOMIC ACTIVITIES 2006
STRAFIFICATION OF FHUs INTO CROP FARMING (C) LIVESTOCK KEEPING (L) AND FISHING (F) HOUSING UNITS
HU No
Crop
Livestock
Fishing
1
X
2
X
X
X
3
X
4
X
X
X
5
X
6
X
X
7
X
X
X
8
X
X
9
X
*
*
*
*
*
*
*
*
*
*
*
*

126
TABLE 1.3
NBS/CBN/NCC COLLABORATIVE SURVEY 2006 STATUS RETURNS ON ECONOMIC SURVEYS 9SUMMARY)
S/N
SECTOR NUMBER
IN FRAME
SAMPLE SIZE
RETRIVAL POSITION
PERCENTAGE OF TOTAL SAMPLE
1
AGRICULTURE/ HUNTING AND FORESTRY
391
163
53
5.93
2
FISHING
10
10
0
0.36
3
MINNING & QUARRYING
222
75
17
2.73
4
MANUFACTURING
3841
769
175
27.96
5
BUILDING & CONSTRUCTION
309
137
26
4.98
6
WHOLESALE & RETAIL
3188
450
99
16.36
7
HOTELS & RESTURANT
1456
155
60
5.64
8
ORGANISED ROAD TRANSPORT
539
200
54
7.27
9
FINANCIAL INTERMEDIATION
1681
233
2
8.47
10
PRIVATE PROFESSIONAL SERVICES
3018
558
146
20.30
TOTAL
14655
2750
632
100.00

127
TABLE 1.4 NBS/CBN/NCC COLLABORATIVE SURVEY ON SOCIOECONOMIC ACTIVITIES IN NIGERIA 2006
STATUS RETURNS ON ECONOMIC SURVEYS S E C T O R
AGRIC., HUNTING & FORESTRY FISHING MINING & QUARRYING
STATE CODE STATE LABEL
NO
. EXP
ECTE
D
NO
. RET
RIE
VED
NO
. O
UTS
TAN
DIN
G
NO
. OF
REF
USA
L
NO
. MO
VED
A
WA
Y
NO
. CLO
SED
D
OW
N
NO
. EXP
ECTE
D
NO
. RET
RIE
VED
NO
. O
UTS
TAN
DIN
G
NO
. OF
REF
USA
L
NO
. MO
VED
A
WA
Y
NO
. CLO
SED
D
OW
N
NO
. EXP
ECTE
D
NO
. RET
RIE
VED
NO
. O
UTS
TAN
DIN
G
NO
. OF
REF
USA
L
NO
. MO
VED
A
WA
Y
NO
. CLO
SED
D
OW
N
01 ABIA 11 1 5 2 3 4 2 1 1 02 ADAMAWA 3 2 1 03 AKWA IBOM 3 3 1 1 04 ANAMBRA 1 1 2 2 05 BAUCHI 3 3 2 1 1 06 BAYELSA 6 6 1 1 07 BENUE 1 1 08 BORNO 2 1 1 1 1 09 C/ RIVER 5 4 1 1 1 1 1 10 DELTA 7 2 5 1 1 3 3 11 EBONYI 2 1 1 15 8 7 12 EDO 2 2 12 12 13 EKITI 1 1 14 ENUGU 3 3 4 4 15 FCT (ABUJA) 2 2 16 GOMBE 1 1 6 5 1 17 IMO 2 2 1 1 18 JIGAWA 4 1 3 19 KADUNA 2 2 2 1 1 20 KANO 5 5 2 2 21 KATSINA 48 15 33 22 KEBBI 23 KOGI 2 2 4 4 24 KWARA 2 2 25 LAGOS 4 4 4 4 26 NASSARAWA 4 2 2 27 NIGER 15 14 1 1 1 28 OGUN 6 1 5 2 2 29 ONDO 2 2 1 1 4 4 30 OSUN 2 1 1 31 OYO 6 4 2 2 1 1 32 PLATEAU 1 1 1 1 33 RIVERS 2 2 1 1 1 1 34 SOKOTO 2 1 1 35 TARABA 2 1 1 36 YOBE 1 1 37 ZAMFARA 2 2 1 1
TOTAL 163 53 103 2 0 5 10 0 10 0 0 0 75 17 53 3 1 1

128
TABLE 1.4 (Contd) NBS/CBN/NCC COLLABORATIVE SURVEY ON SOCIOECONOMIC ACTIVITIES IN NIGERIA 2006 STATUS RETURNS ON ECONOMIC SURVEYS
S E C T O R MANUFACTURING HOTELS AND RESTAURANTS BUILDING AND CONSTRUCTION
STATE CODE
STATE LABEL N
O.
EX
PE
CTE
D
NO
. R
ETR
IEVE
D
NO
. O
UTS
TAN
DIN
G
NO
. OF
RE
FUS
AL
NO
. M
OVE
D
AW
AY
NO
. C
LOS
ED
DO
WN
NO
. E
XP
EC
TED
NO
. R
ETR
IEVE
D
NO
. O
UTS
TAN
DIN
G
NO
. OF
RE
FUS
AL
NO
. M
OVE
D
AW
AY
NO
. C
LOS
ED
DO
WN
NO
. E
XP
EC
TED
NO
. R
ETR
IEVE
D
NO
. O
UTS
TAN
DIN
G
NO
. OF
RE
FUS
AL
NO
. M
OVE
D
AW
AY
NO
. C
LOS
ED
DO
WN
01 ABIA 12 8 2 2 4 3 1 3 2 1 02 ADAMAWA 4 3 1 7 5 1 1 03 AKWA IBOM 4 4 5 5 2 2 04 ANAMBRA 16 2 14 2 1 1 1 1 05 BAUCHI 17 4 9 4 6 3 3 1 1 06 BAYELSA 4 1 2 1 2 2 2 1 1 07 BENUE 5 5 2 1 1 2 1 1 08 BORNO 7 4 1 2 7 3 4 1 1 09 C/ RIVER 5 1 1 3 6 2 2 1 1 3 1 2 10 DELTA 10 3 7 2 1 1 12 1 7 4 11 EBONYI 4 1 3 4 1 3 1 1 12 EDO 14 14 2 2 5 1 4 13 EKITI 9 1 7 1 2 1 1 1 1 14 ENUGU 4 4 4 3 1 6 1 1 1 3 15 FCT (ABUJA) 8 8 15 1 14 13 13 16 GOMBE 7 6 1 4 4 1 1 17 IMO 8 8 3 3 4 4 18 JIGAWA 9 9 2 1 1 2 2 19 KADUNA 19 7 4 3 1 4 6 2 3 1 12 2 5 5 20 KANO 49 20 11 3 15 6 2 4 9 3 5 1 21 KATSINA 31 15 16 3 3 5 2 3 22 KEBBI 5 4 1 2 1 1 1 1 23 KOGI 4 4 2 2 1 1 24 KWARA 8 6 2 2 2 2 1 1 25 LAGOS 405 50 355 20 8 12 23 3 20 26 NASSARAWA 8 4 4 3 1 2 27 NIGER 4 2 2 2 2 2 2 28 OGUN 15 2 13 2 1 1 1 1 29 ONDO 8 3 5 2 2 2 2 30 OSUN 14 5 2 2 5 2 2 1 1 31 OYO 17 7 10 2 2 3 1 2 32 PLATEAU 9 9 8 2 6 3 1 1 1 33 RIVERS 7 2 4 1 4 1 3 7 1 5 1 34 SOKOTO 5 1 4 2 2 2 2 35 TARABA 5 2 2 1 4 4 1 1 36 YOBE 4 4 2 2 1 1
37 ZAMFARA 5 1 2 2 2 2 1 1 TOTAL 769 175 542 7 14 31 155 60 86 4 2 3 137 26 90 9 3 9

129
TABLE 1.4 (Contd) NBS/CBN/NCC COLLABORATIVE SURVEY ON SOCIOECONOMIC ACTIVITIES IN NIGERIA 2006 STATUS RETURNS ON ECONOMIC SURVEYS
S E C T O R
WHOLESALE / RETAIL TRADE PRIVATE PROFESSIONAL
SERVICES BANKING AND
FINANCE
STATE CODE
STATE LABEL
NO
. EXP
ECT
NO
. R
ETR
IEVE
D
NO
. O
UTS
TAN
DIN
G
NO
. OF
REF
USA
L
NO
. MO
VED
A
WA
Y
NO
. CLO
SED
D
OW
N
NO
. EXP
EC
NO
. R
ETR
IEVE
D
NO
. O
UTS
TAN
DIN
G
NO
. OF
REF
USA
L
NO
. MO
VED
A
WA
Y
NO
. CLO
SED
D
OW
N
NO
. EXP
ECTE
D
NO
. R
ETR
IEVE
D
NO
. O
UTS
TAN
DIN
G
NO
. OF
REF
USA
L
NO
. MO
VED
A
WA
Y
NO
. CLO
SED
D
OW
N
01 ABIA 20 16 1 3 17 3 14 7 7 02 ADAMAWA 5 3 2 4 2 1 1 2 2 03 AKWA IBOM 10 10 12 12 4 4 04 ANAMBRA 8 5 3 24 2 22 10 10 05 BAUCHI 9 2 3 3 1 7 3 3 1 4 4 06 BAYELSA 4 1 1 2 5 3 1 1 2 2 07 BENUE 5 1 2 2 14 7 1 2 2 2 3 3 08 BORNO 9 3 6 8 3 4 1 4 4 09 C/ RIVER 7 2 1 2 2 8 6 1 1 4 4 10 DELTA 9 4 3 1 1 19 2 12 3 2 5 5 11 EBONYI 6 1 5 8 8 2 2 12 EDO 11 1 10 16 2 14 7 7 13 EKITI 5 3 1 1 5 4 1 3 3 14 ENUGU 8 1 4 2 1 12 3 8 1 4 1 3 15 FCT (ABUJA) 14 14 27 4 23 9 9 16 GOMBE 9 8 1 7 2 2 1 2 2 2 17 IMO 11 11 38 3 35 6 6 18 JIGAWA 4 1 3 2 1 1 3 3 19 KADUNA 19 1 5 6 2 5 33 3 8 5 3 14 10 10 20 KANO 34 7 19 2 6 26 4 8 4 10 12 12 21 KATSINA 15 8 7 8 1 7 5 5 22 KEBBI 3 1 2 1 1 2 1 1 23 KOGI 4 2 2 5 1 4 4 4 24 KWARA 10 6 4 13 6 7 3 3 25 LAGOS 97 18 79 124 48 76 61 61 26 NASSARAWA 6 4 2 9 5 4 2 2 27 NIGER 6 1 5 6 2 4 4 4 28 OGUN 10 10 7 1 6 7 7 29 ONDO 10 3 7 10 2 7 1 8 8 30 OSUN 11 5 5 1 9 3 2 4 7 7 31 OYO 16 1 13 1 1 19 3 16 11 11 32 PLATEAU 15 4 8 3 23 15 2 6 4 4 33 RIVERS 16 13 1 2 17 1 14 2 4 4 34 SOKOTO 4 1 3 1 1 2 2 35 TARABA 4 3 1 10 6 3 1 2 2 36 YOBE 4 4 2 2 2 2 37 ZAMFARA 12 7 5 2 2 2 2
TOTAL 450 99 290 19 14 28 558 146 341 24 25 22 233 2 228 0 3 0
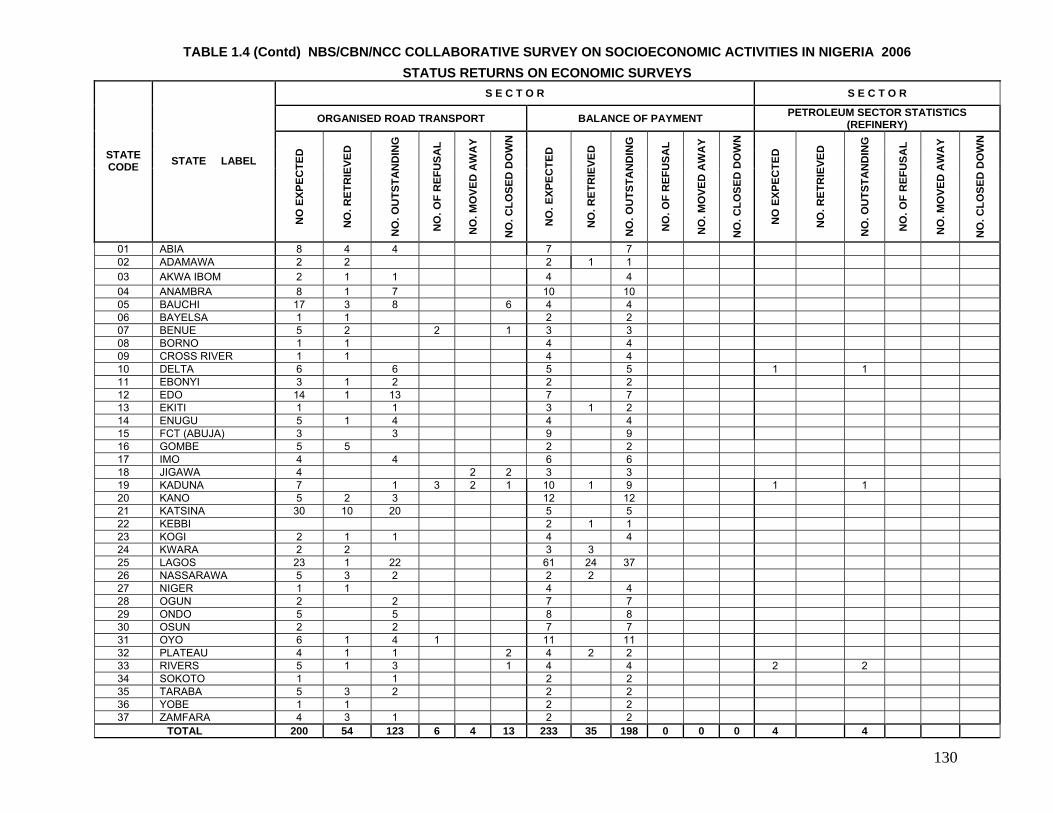
130
TABLE 1.4 (Contd) NBS/CBN/NCC COLLABORATIVE SURVEY ON SOCIOECONOMIC ACTIVITIES IN NIGERIA 2006 STATUS RETURNS ON ECONOMIC SURVEYS
S E C T O R S E C T O R
ORGANISED ROAD TRANSPORT BALANCE OF PAYMENT PETROLEUM SECTOR STATISTICS (REFINERY)
STATE CODE STATE LABEL
NO
EXP
ECTE
D
NO
. RET
RIE
VED
NO
. OU
TSTA
ND
ING
NO
. OF
REF
USA
L
NO
. MO
VED
AW
AY
NO
. CLO
SED
DO
WN
NO
. EXP
ECTE
D
NO
. RET
RIE
VED
NO
. OU
TSTA
ND
ING
NO
. OF
REF
USA
L
NO
. MO
VED
AW
AY
NO
. CLO
SED
DO
WN
NO
EXP
ECTE
D
NO
. RET
RIE
VED
NO
. OU
TSTA
ND
ING
NO
. OF
REF
USA
L
NO
. MO
VED
AW
AY
NO
. CLO
SED
DO
WN
01 ABIA 8 4 4 7 7 02 ADAMAWA 2 2 2 1 1 03 AKWA IBOM 2 1 1 4 4 04 ANAMBRA 8 1 7 10 10 05 BAUCHI 17 3 8 6 4 4 06 BAYELSA 1 1 2 2 07 BENUE 5 2 2 1 3 3 08 BORNO 1 1 4 4 09 CROSS RIVER 1 1 4 4 10 DELTA 6 6 5 5 1 1 11 EBONYI 3 1 2 2 2 12 EDO 14 1 13 7 7 13 EKITI 1 1 3 1 2 14 ENUGU 5 1 4 4 4 15 FCT (ABUJA) 3 3 9 9 16 GOMBE 5 5 2 2 17 IMO 4 4 6 6 18 JIGAWA 4 2 2 3 3 19 KADUNA 7 1 3 2 1 10 1 9 1 1 20 KANO 5 2 3 12 12 21 KATSINA 30 10 20 5 5 22 KEBBI 2 1 1 23 KOGI 2 1 1 4 4 24 KWARA 2 2 3 3 25 LAGOS 23 1 22 61 24 37 26 NASSARAWA 5 3 2 2 2 27 NIGER 1 1 4 4 28 OGUN 2 2 7 7 29 ONDO 5 5 8 8 30 OSUN 2 2 7 7 31 OYO 6 1 4 1 11 11 32 PLATEAU 4 1 1 2 4 2 2 33 RIVERS 5 1 3 1 4 4 2 2 34 SOKOTO 1 1 2 2 35 TARABA 5 3 2 2 2 36 YOBE 1 1 2 2 37 ZAMFARA 4 3 1 2 2
TOTAL 200 54 123 6 4 13 233 35 198 0 0 0 4 4

131
TABLE 1.4 (Contd) NBS/CBN/NCC COLLABORATIVE SURVEY ON SOCIOECONOMIC ACTIVITIES IN NIGERIA 2006
STATUS RETURNS ON CORPORATE NON-FINANCIAL BY STATE AND SECTOR.
S E C T O R
MANFACTURING BUILDING & CONSTRUCTION TRANSPORT/COMM.
STATE CODE STATE LABEL
NO
. EXP
ECTE
D
NO
. RET
RIE
VED
AN
ALY
SAB
LE
NO
T A
NA
LYSA
BLE
NO
. EXP
ECTE
D
NO
. RET
RIE
VED
AN
ALY
SAB
LE
NO
T A
NA
LYSA
BLE
NO
. EXP
ECTE
D
NO
. RET
RIE
VED
AN
ALY
SAB
LE
NO
T A
NA
LYSA
BLE
01 ABIA 12 1 1 02 ADAMAWA 2 2 2 3 1 1 1 03 AKWA IBOM 3 3 04 ANAMBRA 14 2 2 1 05 BAUCHI 5 4 06 BAYELSA 1 1 1 1 1 1 07 BENUE 3 3 08 BORNO 6 2 09 CROSS RIVER 7 1 1 1 10 DELTA 7 11 EBONYI 2 2 2 12 EDO 3 1 1 13 EKITI 5 5 3 2 14 ENUGU 13 1 15 FCT (ABUJA) 3 16 GOMBE 2 17 IMO 10 1 2 18 JIGAWA 19 KADUNA 8 1 20 KANO 10 1 4 21 KATSINA 1 22 KEBBI 1 1 1 23 KOGI 1 24 KWARA 4 1 1 1 1 1 2 2 2 25 LAGOS 138 24 20 4 10 18 1 1 26 NASSARAWA 4 4 1 3 4 4 4 27 NIGER 28 OGUN 13 1 29 ONDO 6 5 4 1 1 1 30 OSUN 10 31 OYO 13 10 8 2 1 1 1 2 32 PLATEAU 13 33 RIVERS 10 34 SOKOTO 1 2 35 TARABA 1 36 YOBE 37 ZAMFARA 1
TOTAL 329 58 42 16 21 3 1 2 57 9 5 4 GRAND TOTAL = 534 TOTAL RETRIEVED = 116, NO. ANALYSABLE = 63, NOT ANALYSABLE = 53.

132
TABLE 1.4 Contd) NBS/CBN/NCC COLLABORATIVE SURVEY ON SOCIO-ECONOMIC ACTIVITIES IN NIGERIA 2006 STATUS RETURNS ON CORPORATE NON-FINANCIAL BY STATE AND SECTOR
S E C T O R
WHOLESALE & RETAIL TRADE
AGRICULTURAL, MINING & QUARRYING OTHERS
STATE CODE STATE LABEL
NO
. EXP
ECTE
D
NO
. RET
RIE
VED
AN
ALY
SAB
LE
NO
T A
NA
LYSA
BLE
NO
. EXP
ECTE
D
NO
. RET
RIE
VED
AN
ALY
SAB
LE
NO
T A
NA
LYSA
BLE
NO
. EXP
ECTE
D
NO
. RET
RIE
VED
AN
ALY
SAB
LE
NO
T A
NA
LYSA
BLE
01 ABIA 1 02 ADAMAWA 1 1 1 1 1 03 AKWA IBOM 04 ANAMBRA 05 BAUCHI
06 BAYELSA 2 2 1 1
07 BENUE 08 BORNO 09 CROSS RIVER 1 1 1 2 2 2 10 DELTA 11 EBONYI 12 EDO 3 13 EKITI 1 1 1 14 ENUGU 2 15 FCT (ABUJA) 4 16 GOMBE 17 IMO 18 JIGAWA 19 KADUNA 1 20 KANO 21 KATSINA 22 KEBBI 23 KOGI 1 24 KWARA 7 7 7 25 LAGOS 49 1 1 1 14 26 NASSARAWA 4 4 2 2 6 6 3 3 5 5 5 27 NIGER 28 OGUN 1 1 1 2 29 ONDO 1 1 2 2 1 1 30 OSUN 5 5 1 4 1 1 1 3 3 3 31 OYO 1 1 1 2 2 1 1 32 PLATEAU 1 1 1 33 RIVERS 1 34 SOKOTO 35 TARABA 36 YOBE 37 ZAMFARA
TOTAL 68 14 7 7 18 10 4 6 41 22 4 18
GRAND TOTAL = 534 TOTAL RETRIEVED = 116, NO. ANALYSABLE = 63, NOT ANALYSABLE = 53.

133
TABLE 1.5 2006 NBS/CBN/NCC COLLABORATIVE SURVEY ON SOCIO-ECONOMIC ACTIVITIES IN NIGERIA
STATUS OF RETURNS ON SYSTEM OF ADMINISTRATIVE STATISTICS (SAS). AS AT JUNE 2007
S/N QUESTIONNAIRE BY TYPE NUMBER
EXPECTED NUMBER
RECEIVEDRESPONSE RATE
1 LOCAL GOVT INFORMATION SYSTEM 774 492 64%
2 VEHICLE REGISTRATION 37 31 84%
3 FISAL OPERATION 37 26 70%
4 AGRIC DEVELOPMENT 37 30 81%
5 HEALTH STATISTICS 37 26 70%
6 HOUSING STATISTICS 37 26 70%
7 EDUCATION STATISTICS 37 33 89%
8 STATE WATER BOARD 37 30 81%
9 RESEARCH INSTITUTES 11 11 100%
*10 AIR TRANSPORT SURVEY 3 1 33%
11 OCEAN SHIPPING 3 2 67%
12 ELECTRICITY GENERATION/CONSUMPTION 5 1 20%
13 REPORTED ROAD ACCIDENTS 37 31 84%
14 WATER RESOURCES STATISTICS 37 25 68%
15 COOPERATIVE SOCIETIES 37 29 78%
16 NACRDS 1 1 100%
17 RAILWAYS SERVICES 3 3 100%
18 NATIONAL DIRECTORATE OF EMPLOYMENT 37 30 81%
19 UNEMPLOYMENT/INDUSTRIAL RELATION 37 18 49%
20 RIVER BASINS/RURAL DEVELOPMENT 10 10 100%
21 FIXED TELEPHONE OPERATOR 2 2 100%
22 PRE-PAID CALLIN CARDS 4 4 100%
23 INTERNET SERVICE PROVIDERS (ISP) 15 15 100%
24 DIGITAL MOBILE 1 1 100%
25 VSAT (VERY SMALL APERTURE TERMINAL) 14 14 100%
26 NIPOST 37 15 41%
TOTAL 1,327 907 68%

134
TABLE 1.5 (Contd) NBS/CBN/NCC COLLABORATIVE SURVEY ON SOCIO-ECONOMIC ACTIVITIES IN NIGERIA, 2006
SHOWING POSITION OF RETRIEVAL OF SURVEY RETURNS ON SAS MODULE AS AT MAY, 2007
EDUCATION STATISTICS
HEALTH STATISTICS
STATE WATER BOARD
WATER RESOURCES STATISTICS
COOPERATIVE SOCIETIES
ZONE
STATE NO
EXPEC-TED
NO. REC.
NO EXPEC-TED
NO. REC.
NO EXPEC-TED
NO. REC.
NO EXPEC-TED
NO. REC.
NO EXPEC-
TED NO.
REC. SEZ ABIA 1 1 1 1 1 1 1 1 1 1 ANAMBRA 1 1 1 1 1 1 1 1 1 EBONYI 1 1 1 1 1 1 1 1 1 ENUGU 1 1 1 1 1 1 1 1 1 IMO 1 1 1 1 1 1 1 1 1 1 SSZ AKWA IBOM 1 1 1 1 1 1 1 1 BAYELSA 1 1 1 1 1 1 1 1 1 CROSS RIVER 1 1 1 1 1 1 1 1 1 1 DELTA 1 1 1 1 1 1 1 1 1 EDO 1 1 1 1 1 1 1 RIVERS 1 1 1 1 1 1 1 1 1 1 SWZ EKITI 1 1 1 1 1 1 1 1 1 1 LAGOS 1 1 1 1 1 1 1 OGUN 1 1 1 1 1 1 1 1 1 ONDO 1 1 1 1 1 1 OSUN 1 1 1 1 1 1 1 1 OYO 1 1 1 1 1 1 1 1 NEZ ADAMAWA 1 1 1 1 1 1 1 1 1 1 BAUCHI 1 1 1 1 1 1 1 1 BORNO 1 1 1 1 1 1 1 1 GOMBE 1 1 1 1 1 1 1 1 1 1 TARABA 1 1 1 1 1 1 1 1 1 1 YOBE 1 1 1 1 1 1 1 1 1 1 NCZ ABUJA 1 1 1 1 1 BENUE 1 1 1 1 1 1 1 1 1 1 KWARA 1 1 1 1 1 1 1 1 1 1 KOGI 1 1 1 1 1 1 1 1 NASARAWA 1 1 1 1 1 1 1 1 1 1 NIGER 1 1 1 1 1 1 1 1 1 1 PLATEAU 1 1 1 1 1 1 1 1 1 1 NWZ JIGAWA 1 1 1 1 1 1 1 1 1 KADUNA 1 1 1 1 1 1 1 1 1 1 KANO 1 1 1 1 1 1 1 1 1 1 KATSINA 1 1 1 1 1 1 1 1 KEBBI 1 1 1 1 1 1 1 1 1 SOKOTO 1 1 1 1 1 1 1 ZAMFARA 1 1 1 1 1 1 1 1 TOTAL 37 33 37 26 37 30 37 25 37 29

135
TABLE 1.5 (Contd) NBS/CBN/NCC COLLABORATIVE SURVEY ON SOCIO-ECONOMIC ACTIVITIES IN NIGERIA, 2006
SHOWING POSITION OF RETRIEVAL OF SURVEY RETURNS ON SAS MODULE AS AT MAY, 2007
NACRDB
TELECOM DIGITAL MOBILE
NIPOST
TELECOM FIXED TELEP-HONE
PRE-PAID CALL-ING
CARDS
INTERNET SERVICE
PROVIDER
VSAT (VERY SMALL APER-TURE
TERMINAL)
FISCAL OPERA-
TIONS OF STATE GOVT.
LOCAL GOVT FINANCES
RAILWAY
SERVICES
VEHICLE REGISTRA-
TION STATISTICS
RIVER BASIN AND
RURAL DEV.
ZONE
STATE
NO
EX
PEC
NO
. R
EC.
NO
EX
PEC
NO
. R
EC.
NO
EX
PEC
NO
. R
EC.
NO
EX
PEC
NO
. R
EC.
NO
EX
PEC
.
NO
R
EC.
NO
EX
PEC
NO
. R
EC.
NO
EX
PEC
NO
. R
EC.
NO
EX
PE
NO
. R
EC.
NO
EX
PEC
NO
. R
EC.
NO
EX
PE
NO
. R
EC.
NO
EX
PEC
NO
. R
EC.
NO
EX
PEC
NO
. R
EC.
SEZ ABIA 1 1 1 1 17 11 1 1 ANAMBRA 1 1 1 1 21 14 1 1 EBONYI 1 1 1 1 13 26 1 1 ENUGU 1 1 1 1 1 1 1 1 17 15 1 1 1 IMO 1 1 1 27 20 1 1 1 1 SSZ AKWA IBOM 1 1 1 31 8 1 1 BAYELSA 1 1 1 1 1 1 8 19 1 1 C/ RIVER 1 1 1 1 18 2 1 1 DELTA 1 1 1 25 17 1 EDO 1 1 1 1 1 1 18 11 1 1 RIVERS 1 1 1 1 23 9 1 1 1 1 SWZ EKITI 1 1 1 1 16 9 1 1 LAGOS 1 1 1 1 2 2 11 11 12 12 1 1 20 16 1 1 1 1 OGUN 1 1 1 20 16 1 1 1 1 ONDO 1 1 1 1 18 10 1 1 OSUN 1 1 1 1 1 30 24 1 1 OYO 1 1 1 1 33 9 1 1 NEZ ADAMAWA 1 1 1 1 21 14 1 1 1 1 BAUCHI 1 1 1 1 1 1 1 20 4 1 1 BORNO 1 1 1 1 27 28 1 1 1 GOMBE 1 1 1 1 11 20 1 1 TARABA 1 1 1 1 1 16 17 1 YOBE 1 1 1 1 1 1 2 17 16 1 1 NCZ ABUJA 1 1 1 1 3 3 1 1 1 6 1 1 1 BENUE 1 1 1 1 23 9 1 1 1 KWARA 1 1 1 1 16 10 1 KOGI 1 1 1 21 16 1 1 NASARAWA 1 1 1 1 13 17 1 1 NIGER 1 1 1 25 26 1 1 1 1 PLATEAU 1 1 1 1 17 20 1 1 1 1 1 1 NWZ JIGAWA 1 1 1 1 27 11 1 1 KADUNA 1 1 1 1 1 1 23 1 1 1 KANO 1 1 1 1 1 44 9 1 1 1 1 KATSINA 1 1 1 1 1 34 14 1 1 KEBBI 1 1 1 1 21 11 1 1 SOKOTO 1 1 1 1 23 10 1 1 1 1 ZAMFARA 1 1 1 14 2 1 1
TOTAL
1
3
33
1
37
15
2
2
4
4
15
15
14
14
37
26
774
492
3
3
37
31
10
10

136
HOUSING STATISTICS
RESEARCH INSTITUTES
AGRIC DEVELOPMENT
PROJECT
UNEMPLOYMENT AND INDUSTRIAL
RELATION
ELECTRICITY GENERATION & CONSUMPTION
NATIONAL DIRECTORATE
OF EMPLOYMENT
REPORTED ROAD ACCIDENTS
OCEAN SHIPPING
AIR TRANSPORT
ZONE
STATE NO
EXPEC NO.
REC. NO
EXPEC NO.
REC. NO
EXPEC NO.
REC. NO
EXPEC NO.
REC. NO
EXPEC NO.
REC. NO
EXPEC NO.
REC. NO
EXPEC NO.
REC. NO
EXPEC NO.
REC. NO
EXPEC NO.
REC. SEZ ABIA 1 1 1 1 1 1 1 1 1 1 ANAMBRA 1 1 1 1 1 1 1 EBONYI 1 1 1 1 1 1 1 1 1 ENUGU 1 1 1 1 1 1 1 1 1 1 1 1 IMO 1 1 1 1 1 1 1 1 1 SSZ AKWA IBOM 1 1 1 1 1 1 1 1 BAYELSA 1 1 1 1 1 1 1 1 1 CROSS RIVER 1 1 1 1 1 1 1 1 1
DELTA 1 1 1 1 1 1 1
EDO 1 1 1 1 1 1 1 1
RIVERS 1 1 1 1 1 1 1 1
SWZ EKITI 1 1 1 1 1 1 1 1 1 1
LAGOS 1 1 1 1 1 1 1 1 1 1 2 2 1
OGUN 1 1 1 1 1 1 1 1 1
ONDO 1 1 1 1 1 1 1
OSUN 1 1 1 1 1 1 1 1 1 1 1 1
OYO 1 1 1 1 1 1 1
NEZ ADAMAWA 1 1 1 1 1 1 1 1 1 1
BAUCHI 1 1 1 1 1 1 1 1 1
BORNO 1 1 1 1 1 1 1 1 1 1 1
GOMBE 1 1 1 1 1 1 1 1 1
TARABA 1 1 1 1 1 1 1 1 1
YOBE 1 1 1 1 1 1 1 1 1 1
NCZ ABUJA 1 1 1 1 1 1 1
BENUE 1 1 1 1 1 1 1 1 1 1
KWARA 1 1 1 1 1 1 1 1 1 1 1 1 1
KOGI 1 1 1 1 1 1 1 1 1 1
NASARAWA 1 1 1 1 1 1 1 1 1
NIGER 1 1 1 1 1 1 1 1 1 1 1 1 1
PLATEAU 1 1 1 1 1 1 1 1 1 1 1 1 1 1
NWZ JIGAWA 1 1 1 1 1 1 1 1 1
KADUNA 1 1 1 1 1 1 1 1 1 1 1 1
KANO 1 1 1 1 1 1 1 1 1 1
KATSINA 1 1 1 1 1 1 1 1
KEBBI 1 1 1 1 1 1 1 1 1
SOKOTO 1 1 1 1 1 1 1 1 1 1
ZAMFARA 1 1 1 1 1 1 1 1 1
TOTAL 37 26 11 11 37 30 37 18 5 1 37 30 37 31 3 2 3 1

137
TABLE 1.6 NBS/CBN/NCC COLLABORATIVE STUDY ON SOCIO - ECONOMIC ACTIVITIES-2006
RETRIEVAL STATUS OF GHS RECORDS Number of EA’S Number HU’S
S/No. STATE
Expected Covered Rate Expected Covered Rate
1 Oyo 60 60 100% 600 593 99% 2 Ogun 60 58 97% 600 580 97% 3 Ondo 60 60 100% 600 600 100% 4 Ekiti 60 60 100% 600 600 100% 5 Osun 60 59 98% 600 570 95% 6 Lagos 60 60 100% 600 518 86% 7 Abia 60 60 100% 600 594 99% 8 Enugu 60 60 100% 600 596 99% 9 Imo 60 59 98% 600 590 98%
10 Anambra 60 60 100% 600 600 100% 11 Ebonyi 60 58 97% 600 580 97% 12 Akwa Ibom 60 60 100% 600 600 100% 13 Bayelsa 60 51 85% 600 390 65% 14 Cross River 60 59 98% 600 590 98% 15 Rivers 60 57 95% 600 570 95% 16 Delta 60 60 100% 600 600 100% 17 Edo 60 60 100% 600 600 100% 18 Kaduna 60 60 100% 600 600 100% 19 Kano 60 60 100% 600 600 100% 20 Kebbi 60 60 100% 600 600 100% 21 Zamfara 60 60 100% 600 600 100% 22 Katsina 60 60 100% 600 600 100% 23 Sokoto 60 60 100% 600 600 100% 24 Jigawa 60 60 100% 600 600 100% 25 Plateau 60 60 100% 600 580 97% 26 Kwara 60 60 100% 600 600 100% 27 Kogi 60 60 100% 600 600 100% 28 Benue 60 60 100% 600 590 98% 29 Niger 60 60 100% 600 600 100% 30 Nassarawa 60 60 100% 600 269 45% 31 FCT 30 30 100% 300 300 100% 32 Adamawa 60 60 100% 600 600 100% 33 Bauchi 60 60 100% 600 600 100% 34 Gombe 60 60 100% 600 596 99% 35 Taraba 60 60 100% 600 600 100% 36 Yobe 60 60 100% 600 600 100% 37 Borno 60 60 100% 600 600 100%
Total 2190 2171 99% 21900 21106 96%
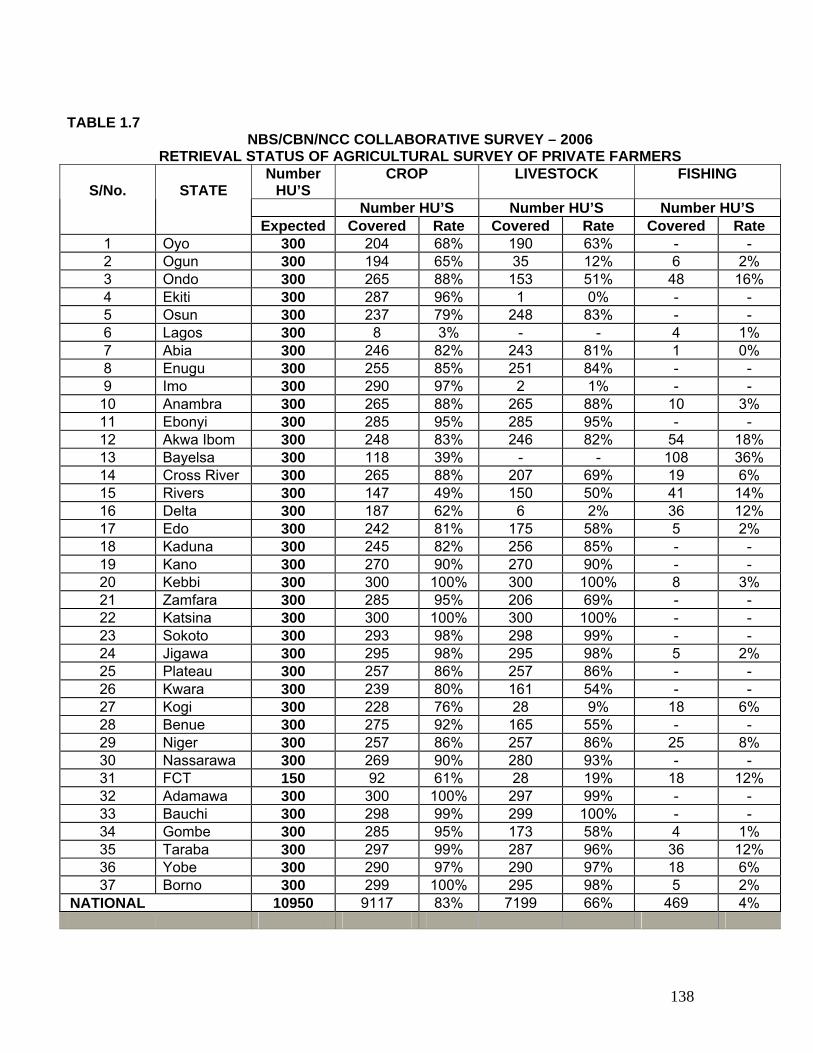
138
TABLE 1.7
NBS/CBN/NCC COLLABORATIVE SURVEY – 2006 RETRIEVAL STATUS OF AGRICULTURAL SURVEY OF PRIVATE FARMERS
Number HU’S
CROP LIVESTOCK FISHING
Number HU’S Number HU’S Number HU’S
S/No.
STATE
Expected Covered Rate Covered Rate Covered Rate 1 Oyo 300 204 68% 190 63% - - 2 Ogun 300 194 65% 35 12% 6 2% 3 Ondo 300 265 88% 153 51% 48 16% 4 Ekiti 300 287 96% 1 0% - - 5 Osun 300 237 79% 248 83% - - 6 Lagos 300 8 3% - - 4 1% 7 Abia 300 246 82% 243 81% 1 0% 8 Enugu 300 255 85% 251 84% - - 9 Imo 300 290 97% 2 1% - -
10 Anambra 300 265 88% 265 88% 10 3% 11 Ebonyi 300 285 95% 285 95% - - 12 Akwa Ibom 300 248 83% 246 82% 54 18% 13 Bayelsa 300 118 39% - - 108 36% 14 Cross River 300 265 88% 207 69% 19 6% 15 Rivers 300 147 49% 150 50% 41 14% 16 Delta 300 187 62% 6 2% 36 12% 17 Edo 300 242 81% 175 58% 5 2% 18 Kaduna 300 245 82% 256 85% - - 19 Kano 300 270 90% 270 90% - - 20 Kebbi 300 300 100% 300 100% 8 3% 21 Zamfara 300 285 95% 206 69% - - 22 Katsina 300 300 100% 300 100% - - 23 Sokoto 300 293 98% 298 99% - - 24 Jigawa 300 295 98% 295 98% 5 2% 25 Plateau 300 257 86% 257 86% - - 26 Kwara 300 239 80% 161 54% - - 27 Kogi 300 228 76% 28 9% 18 6% 28 Benue 300 275 92% 165 55% - - 29 Niger 300 257 86% 257 86% 25 8% 30 Nassarawa 300 269 90% 280 93% - - 31 FCT 150 92 61% 28 19% 18 12% 32 Adamawa 300 300 100% 297 99% - - 33 Bauchi 300 298 99% 299 100% - - 34 Gombe 300 285 95% 173 58% 4 1% 35 Taraba 300 297 99% 287 96% 36 12% 36 Yobe 300 290 97% 290 97% 18 6% 37 Borno 300 299 100% 295 98% 5 2%
NATIONAL 10950 9117 83% 7199 66% 469 4%

139
TABLE 1.8 2006 NBS/CBN/NCC COLLABORATIVE SURVEY ON SOCIO- ECONOMIC ACTIVITIES IN NIGERIA
STATUS OF RETURNS ON SYSTEM OF ADMINISTRATIVE STATISTICS (SAS) AS AT MAY 2007
S/N QUESTIONNAIRE BY TYPE NUMBER EXPECTED
NUMBER RECEIVED RESPONSE RATE
1 LOCAL GOVT INFORMATION SYSTEM 774 492 64%
2 VEHICLE REGISTRATION 37 31 84%
3 FISAL OPERATION 37 26 70%
4 AGRIC DEVELOPMENT 37 30 81%
5 HEALTH STATISTICS 37 26 70%
6 HOUSING STATISTICS 37 28 76%
7 EDUCATION STATISTICS 37 33 89%
8 STATE WATER BOARD 37 30 81%
9 RESEARCH INSTITUTES 12 11 92%
*10 AIR TRANSPORT SURVEY 3 1 33%
11 OCEAN SHIPPING 2 2 100%
12 ELECTRICITY GENERATION/CONSUMPTION 2 1 50%
13 REPORTED ROAD ACCIDENTS 37 33 89%
14 WATER RESOURCES STATISTICS 37 25 68%
15 COOPERATIVE SOCIETIES 37 27 73%
16 NACRDS 1 1 100%
*17 RAILWAYS SERVICES 2 2 100%
18 NATIONAL DIRECTORATE OF EMPLOYMENT 37 30 81%
19 UNEMPLOYMENT/INDUSTRIAL RELATION 37 15 41%
20 RIVER BASINS/RURAL DEVELOPMENT 15 10 67%
21 FIXED TELEPHONE OPERATOR 37 15 41%
22 PRE-PAID CALLIN CARDS 4 4 100%
23 INTERNET SERVICE PROVIDERS 13 13 100%
24 ICT RADIO SERVICES STATISTICS 4 4 100%
25 ICT TELEVISION SERVICES STATISTICS 5 5 100%
26 TELECOM SATELLITE OPERATORS 3 3 100%
27 TELECOM DIGITAL MOBILE 1 1 100%
28 VSAT (VERY SMALL APERTURE TERMINAL) 13 13 100%
*29 NIPOST 37 16 43%
TOTAL 1,372 928 68%
*Received at State level only, but neede at National Level.

140
TABLE 1.9
NBS/CBN/NCC COLLABORATIVE STUDY ON SOCIO-ECONOMIC ACTIVITIES 2006
TIME - LINE
S/N ACTIVITY TIME – LINE
1 Planning & Preparation January/February, 2007
2 Training of Trainers (TOT) February 19 - 23, 2007
3 State Training February 26 - March 2, 2007
4 Fieldwork March 3 - 26, 2007
5 Monitoring of Fieldwork (Hqrts) Retrieval of records 1st round March 12-16, 2007
6 Monitoring of Fieldwork (Hqts.)/Retrieval of records March 23 - 26, 2007
7 Data Processing/Analysis/Report Writing April - June, 2007

141
TABLE: 2.1.2.1 Percentage Distribution of Persons by State, Gender and Age-Group (June 2006) State 0 - 4 5 - 14 15 - 29 30 – 44 45 - 59 60-64 65+ Abia 9.6 19.9 27.6 15.1 13.0 4.3 10.6 Adamawa 12.5 29.3 27.0 17.0 9.9 1.5 2.8 Akwa ibom 11.6 29.5 23.2 16.3 14.6 2.4 2.4 Anambra 12.3 24.6 24.7 14.9 13.2 2.7 7.5 Bauchi 17.3 31.3 23.9 17.0 6.6 1.6 2.3 Bayelsa 9.1 30.2 28.5 17.6 10.8 1.9 2.0 Benue 11.4 32.0 27.7 16.1 9.0 1.6 2.3 Borno 19.4 28.5 20.4 19.9 8.5 1.2 2.1 Cross Rivers 9.7 23.6 30.8 22.6 10.5 1.1 1.9 Delta 8.8 20.7 28.5 20.4 12.9 3.0 5.7 Ebonyi 8.5 29.2 24.9 16.5 15.5 2.2 3.1 Edo 10.3 26.0 25.0 16.8 13.2 3.9 4.7 Ekiti 8.3 23.5 22.6 12.5 14.6 6.1 12.5 Enugu 9.5 31.1 18.1 19.1 17.0 1.9 3.4 Gombe 16.9 33.1 23.5 15.6 7.8 1.1 2.1 Imo 8.6 22.1 28.3 12.1 15.1 4.2 9.5 Jigawa 12.7 32.9 21.3 18.0 9.8 2.2 3.2 Kaduna 14.6 33.4 25.4 16.4 7.6 1.2 1.4 Kano 17.6 32.3 23.7 16.5 6.9 1.3 1.8 Katsina 18.4 32.5 21.1 18.0 7.1 1.6 1.3 Kebbi 14.0 36.6 17.6 18.7 9.4 1.8 1.9 Kogi 6.8 25.5 27.9 16.7 14.3 3.4 5.3 Kwara 9.0 27.6 24.1 15.8 15.1 3.0 5.3 Lagos 11.3 19.3 32.7 18.2 11.5 2.0 5.0 Nassarawa 12.3 31.1 27.9 17.1 8.6 1.0 1.9 Niger 17.7 30.2 21.4 21.1 7.1 1.2 1.3 Ogun 9.2 24.6 16.8 19.3 14.9 3.8 11.4 Ondo 10.9 23.9 25.7 17.7 12.6 4.1 5.0 Osun 11.9 25.9 24.2 13.0 10.7 3.4 10.9 Oyo 12.1 24.4 26.2 15.2 12.3 3.7 6.1 Plateau 12.8 27.5 28.2 16.1 10.1 2.1 3.2 Rivers 11.4 25.3 26.4 20.7 8.7 4.6 2.9 Sokoto 14.2 30.7 21.2 18.8 10.3 2.6 2.2 Taraba 13.8 31.3 26.4 17.4 7.6 1.5 2.1 Yobe 16.0 32.5 21.3 18.1 8.1 1.7 2.4 Zamfara 16.0 31.7 21.4 19.5 7.2 1.7 2.5 FCT 13.0 27.7 27.4 21.1 7.7 1.9 1.2 GENDER Male 13.4 29.9 22.7 15.5 11.0 2.8 4.7 Female 12.8 26.5 26.6 18.9 9.8 1.9 3.5 National 13.1 28.2 24.6 17.1 10.4 2.4 4.1

142
TABLE: 2.1.2.2 Percentage Distribution of Household Head by State, Gender and Household
Size (June 2006)
State Male Head Female Head
HH SIZE
Abia 64.4 35.6 3.6 Adamawa 92.1 7.9 4.8 Akwa ibom 76.6 23.4 4.1 Anambra 71.8 28.2 4.3 Bauchi 99.3 0.7 5.8 Bayelsa 75.1 24.9 4.3 Benue 90.5 9.5 5.2 Borno 94.6 5.4 4.6 Cross Rivers 83.0 17.0 4.5 Delta 67.8 32.2 3.2 Ebonyi 75.7 24.3 4.1 Edo 76.0 24.0 3.8 Ekiti 66.8 33.2 3.2 Enugu 58.6 41.4 4.0 Gombe 98.4 1.6 5.9 Imo 69.1 30.9 4.3 Jigawa 98.0 2.0 5.9 Kaduna 95.2 4.8 6.1 Kano 98.1 1.9 6.4 Katsina 95.7 4.3 5.8 Kebbi 99.2 0.8 5.9 Kogi 75.2 24.8 3.6 Kwara 79.1 20.9 4.1 Lagos 81.8 18.2 4.2 Nassarawa 95.9 4.1 5.6 Niger 97.6 2.4 4.9 Ogun 69.3 30.7 2.6 Ondo 74.2 25.8 3.2 Osun 65.5 34.5 3.6 Oyo 76.6 23.4 4.3 Plateau 88.5 11.5 5.4 Rivers 78.5 21.5 4.9 Sokoto 97.3 2.7 5.4 Taraba 98.0 2.0 5.3 Yobe 97.7 2.3 5.7 Zamfara 96.6 3.4 5.2 FCT 94.6 5.4 4.3 Total 83.5 16.5 4.6

143
TABLE:2.1.2.3 Percentage Distribution of Persons Aged 15 Years and Above
by Marital Status, State, Sector and Gender (June 2006) State Married Divorced Separated Widowed Never married Abia 44.6 1.1 0.4 14.0 39.9 Adamawa 60.5 1.1 3.3 3.4 31.8 Akwa ibom 50.0 1.0 2.3 10.7 36.1 Anambra 49.6 0.2 0.8 11.2 38.0 Bauchi 77.5 0.7 0.2 1.3 20.3 Bayelsa 57.4 1.3 4.2 3.4 33.7 Benue 56.7 1.9 1.8 4.0 35.6 Borno 79.3 1.0 1.3 2.8 15.6 Cross Rivers 47.1 0.6 3.2 7.5 41.7 Delta 48.6 1.4 4.8 9.1 36.1 Ebonyi 51.0 0.9 0.8 9.8 37.5 Edo 54.4 1.3 3.4 7.8 33.1 Ekiti 55.2 0.2 2.6 9.9 32.0 Enugu 43.0 0.0 1.4 17.6 38.0 Gombe 72.5 1.9 0.8 1.1 23.8 Imo 43.5 0.4 0.4 13.1 42.5 Jigawa 75.4 1.0 1.0 2.5 20.2 Kaduna 62.6 1.2 1.2 1.6 33.5 Kano 75.9 0.9 0.2 0.9 22.1 Katsina 79.9 0.2 0.5 1.4 18.0 Kebbi 80.9 0.2 0.4 1.3 17.2 Kogi 53.0 0.8 2.4 6.3 37.6 Kwara 56.9 0.5 3.3 7.2 32.1 Lagos 48.3 0.9 1.6 4.9 44.2 Nassarawa 62.3 0.5 0.5 1.5 35.2 Niger 79.5 0.5 0.5 1.1 18.4 Ogun 51.5 2.4 9.2 14.8 22.0 Ondo 54.0 0.3 4.7 7.8 33.2 Osun 54.3 0.4 5.0 9.7 30.6 Oyo 57.3 1.1 2.5 5.9 33.2 Plateau 58.5 0.7 1.4 4.4 35.0 Rivers 50.5 0.2 2.1 7.5 39.6 Sokoto 80.0 0.4 0.2 1.3 18.1 Taraba 60.7 4.6 1.2 1.5 32.0 Yobe 74.8 0.9 1.5 1.3 21.4 Zamfara 83.4 0.3 1.3 1.0 14.0 FCT 61.1 0.8 2.2 1.4 34.5 SECTOR Urban 56.1 1.0 2.3 5.1 35.5 Rural 65.4 0.9 1.6 4.7 27.4 Gender Male 57.3 0.9 1.7 1.5 38.6 Female 69.4 1.0 1.8 8.1 19.7 National 63.4 0.9 1.7 4.8 29.2

144
TABLE: 2.1.3.1 Percentage Distribution of Households by Major Sources of
Water for Drinking and Cooking, State and Sector (June 2006) State
Total Households
Pipe borne water treated
Pipe borne water untreated
Bore hole Hand pump
Well Spring protected
Well Spring unprotected
Rain water
Stream Pond River
Tanker Truck Vendor
Others
Abia 787,222 0.6 15.4 21.8 6.8 8.9 17.4 23.0 5.8 0.2 Adamawa 666,969 1.7 1.6 20.1 14.9 20.3 0.0 29.3 12.0 0.0 Akwa ibom 953,822 3.0 0.2 32.4 0.0 1.6 6.4 50.0 6.4 0.0 Anambra 974,833 7.9 0.6 27.2 4.1 0.6 6.0 47.5 5.7 0.3 Bauchi 810,479 3.3 0.0 7.4 8.9 67.1 0.0 8.9 4.5 0.0 Bayelsa 394,296 7.5 2.1 14.1 0.0 4.1 1.2 68.9 0.4 1.7 Benue 811,393 1.7 0.2 2.0 25.0 12.1 0.0 55.8 3.2 0.0 Borno 896,586 1.0 2.9 30.1 11.5 43.0 0.0 2.4 9.0 0.0 Cross Rivers 636,336 11.9 0.7 23.8 1.3 2.0 0.0 60.3 0.0 0.0 Delta 1,264,935 6.1 1.0 21.3 18.9 22.3 0.2 28.4 1.0 0.7 Ebonyi 532,721 3.9 0.0 37.0 1.0 7.2 5.1 45.2 0.6 0.0 Edo 838,107 2.0 1.0 34.8 4.4 3.5 14.8 29.9 9.6 0.0 Ekiti 752,117 11.1 0.2 9.4 41.0 3.2 0.0 35.0 0.0 0.0 Enugu 824,632 9.2 0.4 7.0 5.2 6.1 0.6 54.4 17.2 0.0 Gombe 551,260 9.6 0.2 5.9 16.6 51.2 0.2 11.2 5.2 0.0 Imo 663,558 1.6 0.7 32.6 2.7 2.3 0.4 44.9 13.5 1.4 Jigawa 716,417 2.4 3.1 50.3 5.0 34.9 0.0 1.5 1.9 0.9 Kaduna 944,947 14.4 0.5 6.8 36.7 24.8 0.0 16.9 0.0 0.0 Kano 1,606,778 2.5 3.3 29.5 14.0 38.1 0.0 8.8 3.8 0.0 Katsina 986,811 5.0 0.0 10.0 25.3 33.7 0.0 22.2 2.7 1.2 Kebbi 899,591 3.0 0.2 10.1 15.8 63.9 0.0 3.9 3.2 0.0 Kogi 805,525 9.6 2.7 22.5 18.4 1.7 0.0 29.0 16.0 0.0 Kwara 563,204 14.9 0.7 31.6 23.3 5.9 0.0 22.8 0.2 0.7 Lagos 1,624,060 16.4 12.1 37.4 7.7 5.6 0.0 0.5 17.5 2.8 Nassarawa 379,486 9.8 0.2 6.7 6.7 13.1 0.0 57.7 5.5 0.3 Niger 1,537,062 13.3 0.0 18.9 14.1 32.7 0.0 19.6 1.4 0.0 Ogun 1,165,031 10.7 3.5 35.9 14.6 9.4 0.0 25.5 0.4 0.0 Ondo 955,840 6.5 1.8 27.1 22.1 4.1 0.0 38.1 0.0 0.4 Osun 803,647 21.5 0.2 9.5 29.7 6.5 0.0 32.3 0.0 0.2 Oyo 1,045,157 11.6 0.4 30.8 32.9 3.0 0.0 19.1 2.3 0.0 Plateau 643,464 9.5 0.0 8.9 16.3 21.0 0.0 44.3 0.0 0.0 Rivers 960,259 7.0 1.2 39.5 13.6 24.2 0.2 11.2 3.0 0.0 Sokoto 692,322 16.0 0.2 5.2 15.5 62.8 0.0 0.2 0.0 0.0 Taraba 405,774 0.4 0.0 8.4 1.6 10.6 0.0 77.1 0.0 1.8 Yobe 445,603 3.4 0.5 34.4 38.9 18.3 0.0 1.1 1.6 1.8 Zamfara 763,430 8.9 1.5 12.9 36.2 13.6 0.0 26.6 0.3 0.0 FCT 238,574 25.6 3.1 23.9 9.7 0.7 0.0 21.8 15.2 0.0 SECTOR Urban 8,911,505 21.6 3.0 28.5 23.0 8.2 0.7 7.2 7.2 0.6 Rural 21,630,741 3.5 1.2 18.6 14.3 22.9 1.4 34.2 3.7 0.3 National 30,542,246 7.7 1.6 20.9 16.4 19.5 1.2 28.0 4.5 0.4
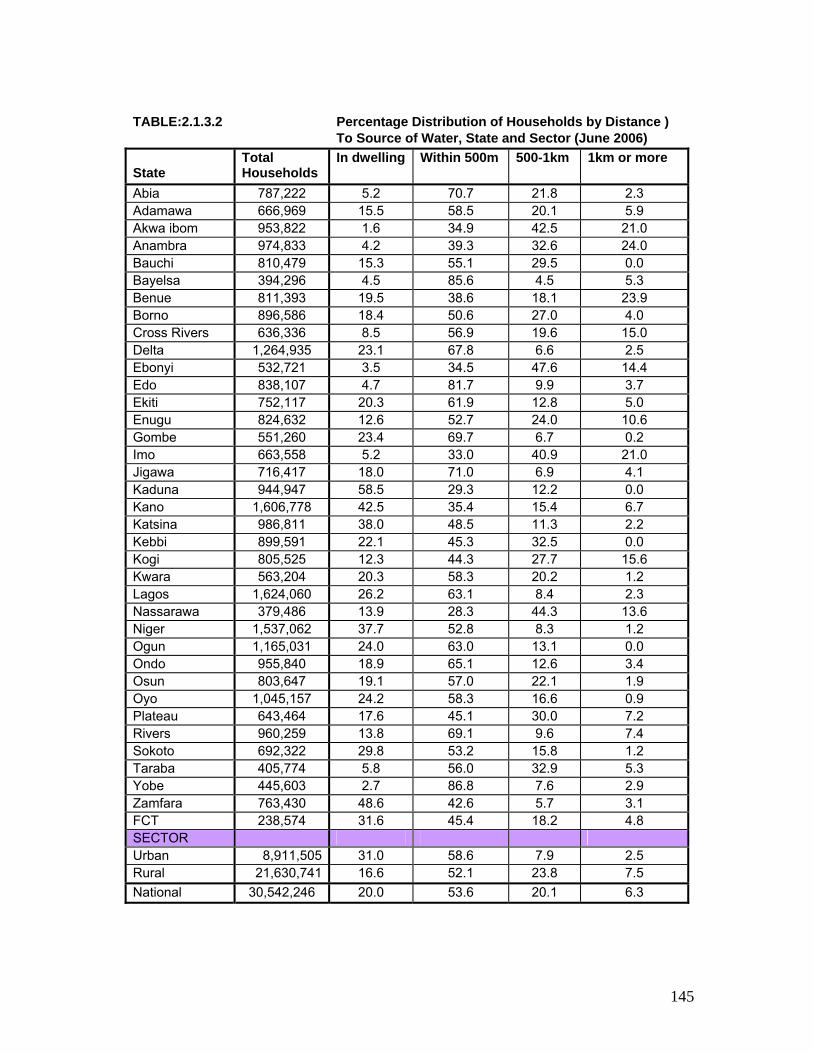
145
TABLE:2.1.3.2 Percentage Distribution of Households by Distance )
To Source of Water, State and Sector (June 2006) State
Total Households
In dwelling Within 500m 500-1km 1km or more
Abia 787,222 5.2 70.7 21.8 2.3 Adamawa 666,969 15.5 58.5 20.1 5.9 Akwa ibom 953,822 1.6 34.9 42.5 21.0 Anambra 974,833 4.2 39.3 32.6 24.0 Bauchi 810,479 15.3 55.1 29.5 0.0 Bayelsa 394,296 4.5 85.6 4.5 5.3 Benue 811,393 19.5 38.6 18.1 23.9 Borno 896,586 18.4 50.6 27.0 4.0 Cross Rivers 636,336 8.5 56.9 19.6 15.0 Delta 1,264,935 23.1 67.8 6.6 2.5 Ebonyi 532,721 3.5 34.5 47.6 14.4 Edo 838,107 4.7 81.7 9.9 3.7 Ekiti 752,117 20.3 61.9 12.8 5.0 Enugu 824,632 12.6 52.7 24.0 10.6 Gombe 551,260 23.4 69.7 6.7 0.2 Imo 663,558 5.2 33.0 40.9 21.0 Jigawa 716,417 18.0 71.0 6.9 4.1 Kaduna 944,947 58.5 29.3 12.2 0.0 Kano 1,606,778 42.5 35.4 15.4 6.7 Katsina 986,811 38.0 48.5 11.3 2.2 Kebbi 899,591 22.1 45.3 32.5 0.0 Kogi 805,525 12.3 44.3 27.7 15.6 Kwara 563,204 20.3 58.3 20.2 1.2 Lagos 1,624,060 26.2 63.1 8.4 2.3 Nassarawa 379,486 13.9 28.3 44.3 13.6 Niger 1,537,062 37.7 52.8 8.3 1.2 Ogun 1,165,031 24.0 63.0 13.1 0.0 Ondo 955,840 18.9 65.1 12.6 3.4 Osun 803,647 19.1 57.0 22.1 1.9 Oyo 1,045,157 24.2 58.3 16.6 0.9 Plateau 643,464 17.6 45.1 30.0 7.2 Rivers 960,259 13.8 69.1 9.6 7.4 Sokoto 692,322 29.8 53.2 15.8 1.2 Taraba 405,774 5.8 56.0 32.9 5.3 Yobe 445,603 2.7 86.8 7.6 2.9 Zamfara 763,430 48.6 42.6 5.7 3.1 FCT 238,574 31.6 45.4 18.2 4.8 SECTOR Urban 8,911,505 31.0 58.6 7.9 2.5 Rural 21,630,741 16.6 52.1 23.8 7.5 National 30,542,246 20.0 53.6 20.1 6.3

146
TABLE 2.1.3.3 Percentage Distribution of Households by Type of Refuse Disposal,
State and Sector (June 2006) State
Total Households
HH Bin collected by government
HH Bin collected by private agency
Government bin or shed
Disposal within compound
Unauthorized refuse heap
Other
Abia 787,222 5.0 0.0 8.9 60.2 25.5 0.4 Adamawa 666,969 0.5 0.2 0.4 22.1 75.6 1.2 Akwa ibom 953,822 0.0 2.1 2.8 93.1 1.1 0.9 Anambra 974,833 0.0 5.7 0.3 15.0 58.0 21.0 Bauchi 810,479 0.0 0.0 0.6 44.0 55.4 0.0 Bayelsa 394,296 4.9 0.8 1.6 34.4 41.8 15.2 Benue 811,393 0.2 0.5 0.0 57.6 40.9 0.7 Borno 896,586 0.3 0.0 0.2 27.0 69.2 3.3 Cross Rivers 636,336 14.5 0.0 43.4 33.6 6.6 2.0 Delta 1,264,935 1.2 4.7 2.7 33.3 54.3 3.7 Ebonyi 532,721 0.0 1.8 0.0 84.7 11.8 1.8 Edo 838,107 4.0 4.4 0.2 48.1 38.5 4.7 Ekiti 752,117 0.0 0.2 1.0 17.1 79.6 2.1 Enugu 824,632 8.6 4.8 0.0 74.5 9.9 2.2 Gombe 551,260 0.2 0.0 0.2 44.1 55.4 0.2 Imo 663,558 1.6 0.0 0.0 50.0 7.4 41.0 Jigawa 716,417 0.0 0.5 0.0 59.4 37.7 2.4 Kaduna 944,947 0.2 8.2 1.7 31.6 57.8 0.5 Kano 1,606,778 2.1 5.9 0.8 65.2 25.2 0.6 Katsina 986,811 0.7 0.0 1.2 73.6 23.1 1.0 Kebbi 899,591 2.0 0.2 0.4 72.7 24.1 0.7 Kogi 805,525 0.7 1.6 0.2 15.7 81.0 0.7 Kwara 563,204 0.9 0.3 4.1 26.5 65.5 2.6 Lagos 1,624,060 22.5 56.4 2.1 2.1 6.8 10.1 Nassarawa 379,486 1.0 0.2 0.5 19.4 62.2 16.5 Niger 1,537,062 0.2 0.0 0.0 12.6 79.1 8.0 Ogun 1,165,031 3.9 6.6 0.4 16.6 61.4 11.1 Ondo 955,840 1.6 0.0 2.5 45.0 29.1 21.8 Osun 803,647 0.0 0.2 0.0 22.1 71.8 6.0 Oyo 1,045,157 0.9 3.5 0.4 11.8 70.6 12.9 Plateau 643,464 1.1 2.7 0.0 37.3 50.3 8.7 Rivers 960,259 5.4 0.4 0.0 14.9 52.6 26.7 Sokoto 692,322 6.2 0.0 6.0 65.7 21.4 0.2 Taraba 405,774 0.0 0.0 0.0 24.8 73.8 1.5 Yobe 445,603 0.0 0.0 0.0 11.1 69.6 19.4 Zamfara 763,430 0.9 0.2 0.3 68.8 29.8 0.0 FCT 238,574 9.9 11.0 3.5 23.0 48.9 3.2 SECTOR Urban 8,911,505 7.6 10.9 4.5 23.1 49.4 4.4 Rural 21,630,741 0.6 0.5 0.5 44.7 46.2 7.5 National 30,542,246 2.2 2.9 1.4 39.7 46.9 6.8

147
TABLE: 2.1.3.4 Percentage Distribution of Households by Type of Toilet Facilities and State
(June 2006) State
Total Households
None
Toilet on water
Flush to sewage
Flush to septic tank
Pail bucket
Covered pit latrine
Uncovered pit latrine
V.I.P. latrine
Other
Abia 787,222 0.0 0.2 3.5 14.1 0.0 52.7 24.9 2.3 2.3 Adamawa 666,969 22.7 0.3 2.4 0.3 0.0 52.7 19.8 0.5 1.2 Akwa ibom 953,822 27.5 4.8 0.0 3.7 0.0 57.2 5.7 0.0 1.1 Anambra 974,833 14.7 0.0 0.6 21.3 0.0 54.1 5.3 0.3 3.8 Bauchi 810,479 15.8 0.0 0.0 0.0 0.0 40.0 44.2 0.0 0.0 Bayelsa 394,296 1.2 79.0 2.5 7.0 0.0 2.9 3.3 0.0 4.1 Benue 811,393 25.7 1.9 3.0 0.7 0.0 42.6 17.9 0.7 7.4 Borno 896,586 10.8 1.9 0.3 0.0 0.0 50.4 13.4 14.9 8.2 Cross Rivers 636,336 14.4 0.0 0.0 8.5 0.0 28.8 22.2 7.8 18.3 Delta 1,264,935 4.2 16.1 15.6 13.4 2.7 24.0 15.6 0.5 7.8 Ebonyi 532,721 13.3 0.0 1.2 2.1 0.0 25.3 42.3 0.0 15.8 Edo 838,107 7.7 2.2 3.5 7.7 0.0 38.5 33.3 0.0 7.2 Ekiti 752,117 24.8 1.5 1.4 3.9 0.0 38.4 1.9 0.2 27.9 Enugu 824,632 52.0 0.0 0.5 13.9 0.0 23.6 2.9 0.0 7.0 Gombe 551,260 10.6 0.0 1.9 0.0 0.2 37.6 49.6 0.0 0.2 Imo 663,558 22.2 0.0 1.6 6.2 0.0 64.5 2.5 0.5 2.5 Jigawa 716,417 9.8 0.0 0.5 0.7 0.0 29.6 41.4 0.0 18.0 Kaduna 944,947 12.7 0.2 5.8 5.8 0.2 48.0 17.3 0.0 10.2 Kano 1,606,778 5.8 0.2 2.7 0.8 0.0 45.2 44.6 0.0 0.6 Katsina 986,811 13.4 0.0 0.0 0.0 0.2 49.8 31.6 0.7 4.3 Kebbi 899,591 6.1 0.7 0.0 0.0 0.0 40.2 45.6 0.4 7.0 Kogi 805,525 39.5 0.3 5.7 2.4 0.0 20.2 5.1 0.0 26.8 Kwara 563,204 35.1 0.3 6.1 2.4 0.0 28.3 1.4 1.2 25.2 Lagos 1,624,060 0.2 1.9 24.4 34.7 0.5 27.6 4.7 0.0 6.1 Nassarawa 379,486 22.3 0.7 0.9 0.9 0.0 38.9 20.8 0.0 15.6 Niger 1,537,062 8.4 0.5 6.2 0.3 0.2 43.7 20.7 0.0 20.0 Ogun 1,165,031 10.3 4.6 0.4 5.5 0.2 43.2 13.8 0.7 21.3 Ondo 955,840 17.1 6.2 1.6 0.4 0.0 47.3 1.2 2.8 23.3 Osun 803,647 41.0 0.6 3.0 3.4 0.2 36.9 1.7 0.2 13.1 Oyo 1,045,157 49.3 0.7 9.1 12.9 0.0 16.4 0.5 0.5 10.5 Plateau 643,464 37.6 0.0 2.5 1.6 0.0 21.3 14.1 0.0 23.0 Rivers 960,259 8.9 25.8 3.8 12.9 0.0 8.2 22.5 0.8 17.1 Sokoto 692,322 14.0 0.0 0.0 0.0 0.0 49.1 33.2 0.0 3.7 Taraba 405,774 6.5 0.2 2.0 0.7 0.0 22.0 44.0 0.0 24.5 Yobe 445,603 4.1 0.0 1.6 0.7 1.6 36.8 12.8 0.0 42.3 Zamfara 763,430 25.7 1.2 0.0 0.2 0.2 58.6 14.1 0.0 0.0 FCT 238,574 11.0 0.7 15.9 20.7 0.0 31.0 7.9 0.0 12.8 National 30,542,246 18.5 2.9 3.3 4.9 0.2 37.8 19.3 0.9 12.3
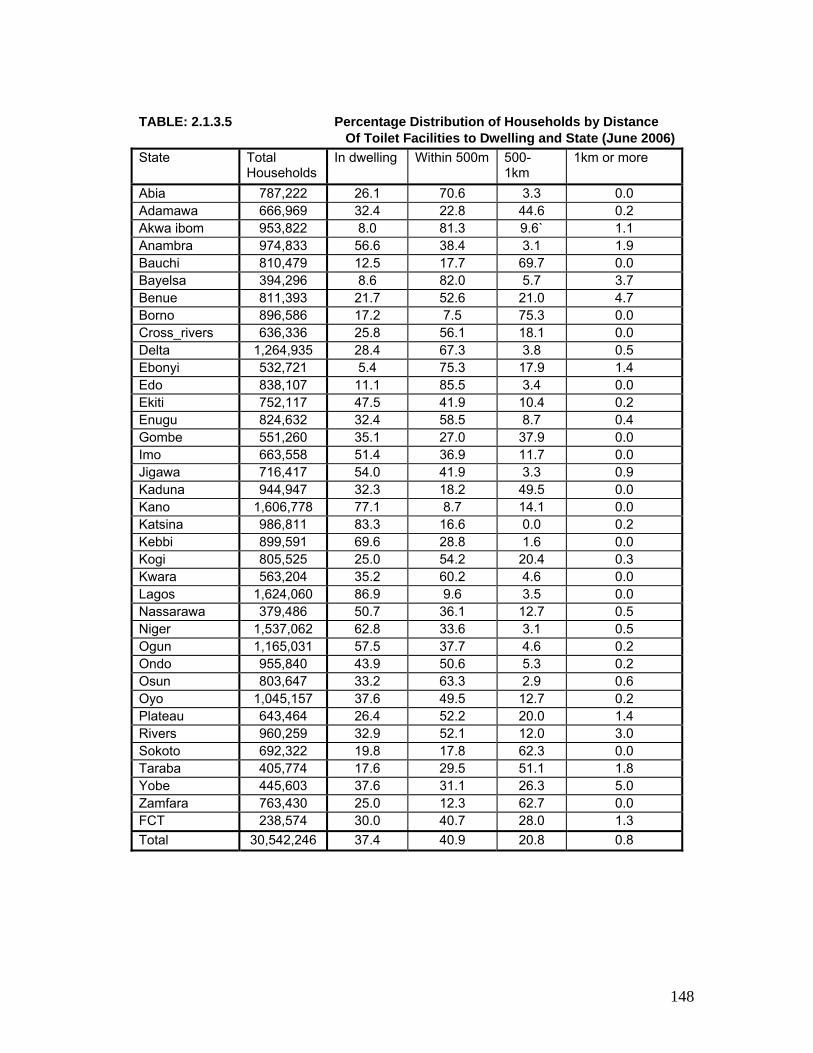
148
TABLE: 2.1.3.5 Percentage Distribution of Households by Distance
Of Toilet Facilities to Dwelling and State (June 2006)State Total
Households In dwelling Within 500m 500-
1km 1km or more
Abia 787,222 26.1 70.6 3.3 0.0 Adamawa 666,969 32.4 22.8 44.6 0.2 Akwa ibom 953,822 8.0 81.3 9.6` 1.1 Anambra 974,833 56.6 38.4 3.1 1.9 Bauchi 810,479 12.5 17.7 69.7 0.0 Bayelsa 394,296 8.6 82.0 5.7 3.7 Benue 811,393 21.7 52.6 21.0 4.7 Borno 896,586 17.2 7.5 75.3 0.0 Cross_rivers 636,336 25.8 56.1 18.1 0.0 Delta 1,264,935 28.4 67.3 3.8 0.5 Ebonyi 532,721 5.4 75.3 17.9 1.4 Edo 838,107 11.1 85.5 3.4 0.0 Ekiti 752,117 47.5 41.9 10.4 0.2 Enugu 824,632 32.4 58.5 8.7 0.4 Gombe 551,260 35.1 27.0 37.9 0.0 Imo 663,558 51.4 36.9 11.7 0.0 Jigawa 716,417 54.0 41.9 3.3 0.9 Kaduna 944,947 32.3 18.2 49.5 0.0 Kano 1,606,778 77.1 8.7 14.1 0.0 Katsina 986,811 83.3 16.6 0.0 0.2 Kebbi 899,591 69.6 28.8 1.6 0.0 Kogi 805,525 25.0 54.2 20.4 0.3 Kwara 563,204 35.2 60.2 4.6 0.0 Lagos 1,624,060 86.9 9.6 3.5 0.0 Nassarawa 379,486 50.7 36.1 12.7 0.5 Niger 1,537,062 62.8 33.6 3.1 0.5 Ogun 1,165,031 57.5 37.7 4.6 0.2 Ondo 955,840 43.9 50.6 5.3 0.2 Osun 803,647 33.2 63.3 2.9 0.6 Oyo 1,045,157 37.6 49.5 12.7 0.2 Plateau 643,464 26.4 52.2 20.0 1.4 Rivers 960,259 32.9 52.1 12.0 3.0 Sokoto 692,322 19.8 17.8 62.3 0.0 Taraba 405,774 17.6 29.5 51.1 1.8 Yobe 445,603 37.6 31.1 26.3 5.0 Zamfara 763,430 25.0 12.3 62.7 0.0 FCT 238,574 30.0 40.7 28.0 1.3 Total 30,542,246 37.4 40.9 20.8 0.8
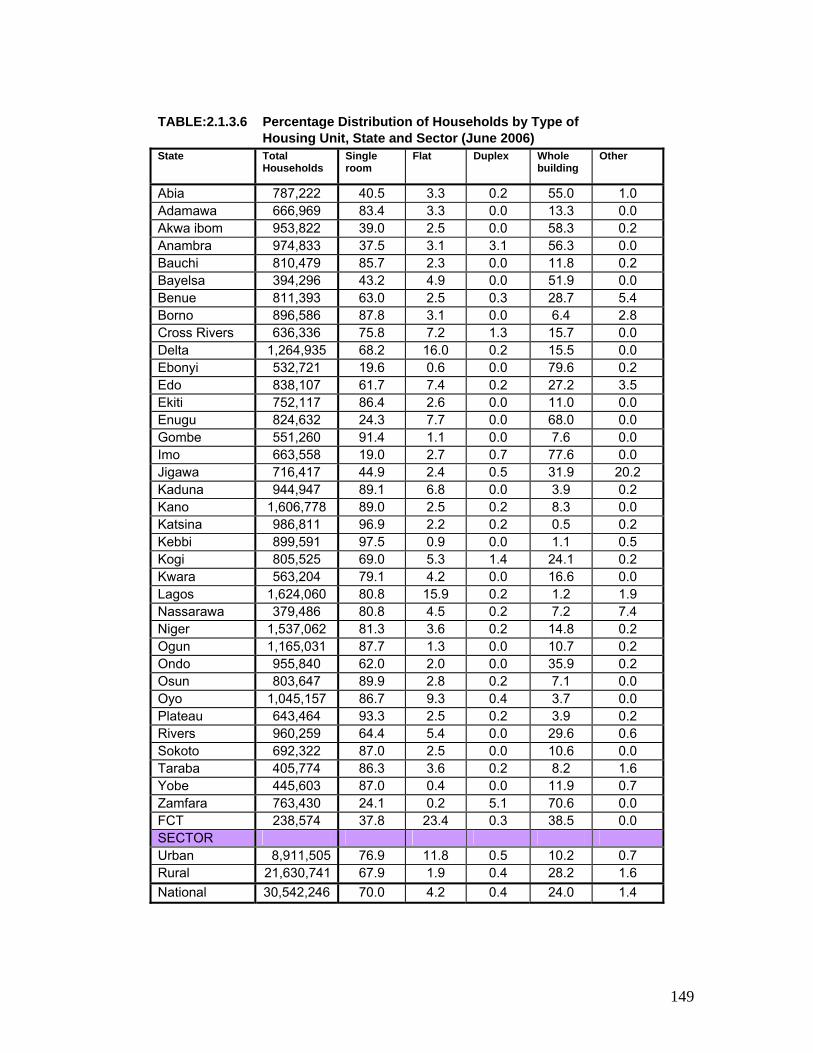
149
TABLE:2.1.3.6 Percentage Distribution of Households by Type of
Housing Unit, State and Sector (June 2006) State Total
Households Single room
Flat Duplex Whole building
Other
Abia 787,222 40.5 3.3 0.2 55.0 1.0 Adamawa 666,969 83.4 3.3 0.0 13.3 0.0 Akwa ibom 953,822 39.0 2.5 0.0 58.3 0.2 Anambra 974,833 37.5 3.1 3.1 56.3 0.0 Bauchi 810,479 85.7 2.3 0.0 11.8 0.2 Bayelsa 394,296 43.2 4.9 0.0 51.9 0.0 Benue 811,393 63.0 2.5 0.3 28.7 5.4 Borno 896,586 87.8 3.1 0.0 6.4 2.8 Cross Rivers 636,336 75.8 7.2 1.3 15.7 0.0 Delta 1,264,935 68.2 16.0 0.2 15.5 0.0 Ebonyi 532,721 19.6 0.6 0.0 79.6 0.2 Edo 838,107 61.7 7.4 0.2 27.2 3.5 Ekiti 752,117 86.4 2.6 0.0 11.0 0.0 Enugu 824,632 24.3 7.7 0.0 68.0 0.0 Gombe 551,260 91.4 1.1 0.0 7.6 0.0 Imo 663,558 19.0 2.7 0.7 77.6 0.0 Jigawa 716,417 44.9 2.4 0.5 31.9 20.2 Kaduna 944,947 89.1 6.8 0.0 3.9 0.2 Kano 1,606,778 89.0 2.5 0.2 8.3 0.0 Katsina 986,811 96.9 2.2 0.2 0.5 0.2 Kebbi 899,591 97.5 0.9 0.0 1.1 0.5 Kogi 805,525 69.0 5.3 1.4 24.1 0.2 Kwara 563,204 79.1 4.2 0.0 16.6 0.0 Lagos 1,624,060 80.8 15.9 0.2 1.2 1.9 Nassarawa 379,486 80.8 4.5 0.2 7.2 7.4 Niger 1,537,062 81.3 3.6 0.2 14.8 0.2 Ogun 1,165,031 87.7 1.3 0.0 10.7 0.2 Ondo 955,840 62.0 2.0 0.0 35.9 0.2 Osun 803,647 89.9 2.8 0.2 7.1 0.0 Oyo 1,045,157 86.7 9.3 0.4 3.7 0.0 Plateau 643,464 93.3 2.5 0.2 3.9 0.2 Rivers 960,259 64.4 5.4 0.0 29.6 0.6 Sokoto 692,322 87.0 2.5 0.0 10.6 0.0 Taraba 405,774 86.3 3.6 0.2 8.2 1.6 Yobe 445,603 87.0 0.4 0.0 11.9 0.7 Zamfara 763,430 24.1 0.2 5.1 70.6 0.0 FCT 238,574 37.8 23.4 0.3 38.5 0.0 SECTOR Urban 8,911,505 76.9 11.8 0.5 10.2 0.7 Rural 21,630,741 67.9 1.9 0.4 28.2 1.6 National 30,542,246 70.0 4.2 0.4 24.0 1.4
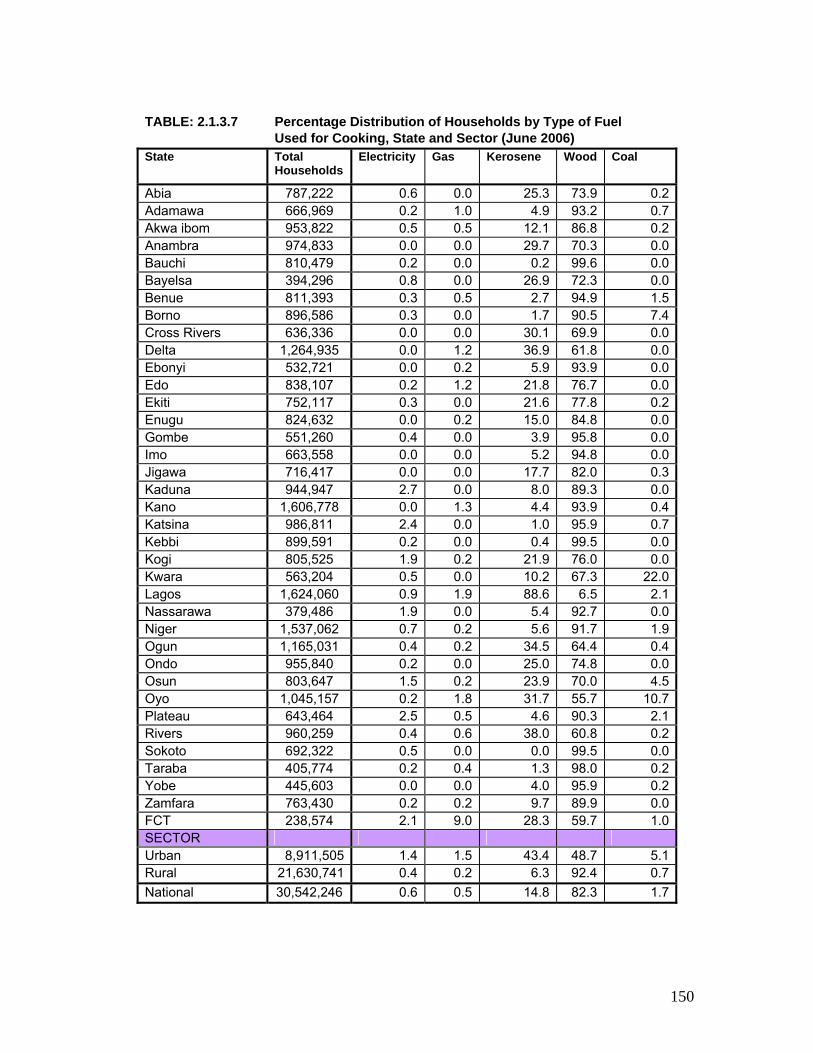
150
TABLE: 2.1.3.7 Percentage Distribution of Households by Type of Fuel
Used for Cooking, State and Sector (June 2006) State Total
Households Electricity Gas Kerosene Wood Coal
Abia 787,222 0.6 0.0 25.3 73.9 0.2Adamawa 666,969 0.2 1.0 4.9 93.2 0.7Akwa ibom 953,822 0.5 0.5 12.1 86.8 0.2Anambra 974,833 0.0 0.0 29.7 70.3 0.0Bauchi 810,479 0.2 0.0 0.2 99.6 0.0Bayelsa 394,296 0.8 0.0 26.9 72.3 0.0Benue 811,393 0.3 0.5 2.7 94.9 1.5Borno 896,586 0.3 0.0 1.7 90.5 7.4Cross Rivers 636,336 0.0 0.0 30.1 69.9 0.0Delta 1,264,935 0.0 1.2 36.9 61.8 0.0Ebonyi 532,721 0.0 0.2 5.9 93.9 0.0Edo 838,107 0.2 1.2 21.8 76.7 0.0Ekiti 752,117 0.3 0.0 21.6 77.8 0.2Enugu 824,632 0.0 0.2 15.0 84.8 0.0Gombe 551,260 0.4 0.0 3.9 95.8 0.0Imo 663,558 0.0 0.0 5.2 94.8 0.0Jigawa 716,417 0.0 0.0 17.7 82.0 0.3Kaduna 944,947 2.7 0.0 8.0 89.3 0.0Kano 1,606,778 0.0 1.3 4.4 93.9 0.4Katsina 986,811 2.4 0.0 1.0 95.9 0.7Kebbi 899,591 0.2 0.0 0.4 99.5 0.0Kogi 805,525 1.9 0.2 21.9 76.0 0.0Kwara 563,204 0.5 0.0 10.2 67.3 22.0Lagos 1,624,060 0.9 1.9 88.6 6.5 2.1Nassarawa 379,486 1.9 0.0 5.4 92.7 0.0Niger 1,537,062 0.7 0.2 5.6 91.7 1.9Ogun 1,165,031 0.4 0.2 34.5 64.4 0.4Ondo 955,840 0.2 0.0 25.0 74.8 0.0Osun 803,647 1.5 0.2 23.9 70.0 4.5Oyo 1,045,157 0.2 1.8 31.7 55.7 10.7Plateau 643,464 2.5 0.5 4.6 90.3 2.1Rivers 960,259 0.4 0.6 38.0 60.8 0.2Sokoto 692,322 0.5 0.0 0.0 99.5 0.0Taraba 405,774 0.2 0.4 1.3 98.0 0.2Yobe 445,603 0.0 0.0 4.0 95.9 0.2Zamfara 763,430 0.2 0.2 9.7 89.9 0.0FCT 238,574 2.1 9.0 28.3 59.7 1.0SECTOR Urban 8,911,505 1.4 1.5 43.4 48.7 5.1Rural 21,630,741 0.4 0.2 6.3 92.4 0.7National 30,542,246 0.6 0.5 14.8 82.3 1.7

151
TABLE:2.1.3.8 Percentage Distribution of Households by Electricity
Supply, State and Sector (June 2006) State Total
Households PHCN-NEPA only
Rural Electrification only
Private Generator only
PHCN NEPA generator
Rural Electricity-Generator
None
Abia 787,222 65.9 0.2 1.0 2.3 0.2 30.4Adamawa 666,969 28.1 0.5 1.9 5.8 0.0 63.7Akwa ibom 953,822 52.9 0.2 1.1 1.6 1.8 42.3Anambra 974,833 75.8 2.2 0.3 1.0 0.6 20.1Bauchi 810,479 21.5 3.5 0.4 1.2 0.0 73.4Bayelsa 394,296 3.7 18.9 6.1 5.3 29.9 36.1Benue 811,393 8.6 0.3 4.5 0.3 0.9 85.4Borno 896,586 20.4 0.0 0.2 0.0 0.0 79.4Cross Rivers 636,336 52.3 0.7 3.3 1.3 0.0 42.5Delta 1,264,935 68.4 0.0 0.0 2.2 0.0 29.4Ebonyi 532,721 20.2 1.4 1.2 8.4 0.4 68.5Edo 838,107 70.4 1.2 0.2 9.9 0.0 18.3Ekiti 752,117 70.3 0.0 0.0 1.5 0.2 28.0Enugu 824,632 32.0 9.0 1.1 0.7 2.2 55.0Gombe 551,260 36.0 2.0 0.0 1.1 0.0 60.9Imo 663,558 64.5 1.1 1.2 8.3 0.0 24.8Jigawa 716,417 14.1 0.3 0.0 0.9 0.0 84.7Kaduna 944,947 43.3 5.3 1.2 1.4 0.7 48.2Kano 1,606,778 46.1 0.0 0.6 1.5 0.0 51.8Katsina 986,811 20.9 0.3 0.0 5.2 0.2 73.4Kebbi 899,591 26.2 0.0 0.2 4.6 0.2 68.8Kogi 805,525 53.2 1.0 2.6 0.3 0.0 42.8Kwara 563,204 71.1 0.0 0.3 0.9 0.5 27.2Lagos 1,624,060 79.6 0.0 0.9 18.3 1.2 0.0Nassarawa 379,486 32.6 0.9 3.3 1.2 1.0 60.9Niger 1,537,062 47.5 0.7 1.2 0.2 1.0 49.4Ogun 1,165,031 68.4 0.0 0.9 0.0 0.0 30.7Ondo 955,840 53.9 0.0 2.7 0.5 0.2 42.7Osun 803,647 60.8 0.0 0.6 0.4 0.0 38.3Oyo 1,045,157 70.5 0.2 0.2 3.3 0.0 25.8Plateau 643,464 19.4 1.8 0.9 0.5 0.2 77.2Rivers 960,259 30.0 11.9 4.8 3.0 6.8 43.5Sokoto 692,322 28.1 0.0 0.7 0.0 0.0 71.1Taraba 405,774 8.5 1.7 1.3 5.0 1.8 81.8Yobe 445,603 20.1 8.2 0.0 0.9 0.2 70.7Zamfara 763,430 24.7 0.0 0.3 1.0 0.2 73.8FCT 238,574 65.6 0.0 1.4 7.0 0.4 25.6SECTOR Urban 8,911,505 80.2 0.7 0.4 5.6 0.9 12.2Rural 21,630,741 29.8 2.1 1.4 1.9 1.0 63.8National 30,542,246 41.5 1.8 1.2 2.7 1.0 51.9

152
TABLE: 2.1.3.9 Percentage Distribution of Households by Type of Housing Tenure, State and Sector (June 2006) State
Total Households
Normal rent
Free
Nominal/ Subsidized
rent
Owner occupier
Abia 787,222 55.6 6.8 0.3 37.3 Adamawa 666,969 33.6 6.6 6.5 53.3 Akwa ibom 953,822 12.2 17.1 4.4 66.3 Anambra 974,833 41.4 0.8 0.2 57.6 Bauchi 810,479 43.3 8.3 10.7 37.6 Bayelsa 394,296 59.6 7.8 5.4 27.1 Benue 811,393 31.4 15.1 18.3 35.2 Borno 896,586 34.7 12.4 20.5 32.4 Cross Rivers 636,336 37.6 24.9 5.0 32.5 Delta 1,264,935 38.7 18.8 5.3 37.2 Ebonyi 532,721 36.9 21.8 11.9 29.4 Edo 838,107 44.3 15.1 7.1 33.5 Ekiti 752,117 29.8 31.2 0.6 38.4 Enugu 824,632 35.5 19.4 6.7 38.4 Gombe 551,260 31.2 0.5 2.0 66.4 Imo 663,558 41.9 4.0 0.0 54.1 Jigawa 716,417 50.5 24.1 0.3 25.2 Kaduna 944,947 28.1 11.3 13.9 46.7 Kano 1,606,778 45.5 6.1 5.5 42.9 Katsina 986,811 45.3 4.8 14.5 35.2 Kebbi 899,591 31.8 3.1 14.1 50.9 Kogi 805,525 40.7 12.6 5.2 41.5 Kwara 563,204 33.2 16.3 0.7 49.6 Lagos 1,624,060 58.5 10.5 1.8 29.2 Nassarawa 379,486 49.2 5.8 0.0 44.7 Niger 1,537,062 58.3 1.1 0.5 40.1 Ogun 1,165,031 53.6 16.5 0.7 29.1 Ondo 955,840 27.7 29.4 0.8 42.1 Osun 803,647 26.8 37.7 0.0 35.5 Oyo 1,045,157 42.4 22.6 2.9 32.1 Plateau 643,464 42.2 8.8 10.1 38.8 Rivers 960,259 53.8 15.2 8.4 22.6 Sokoto 692,322 36.3 11.3 16.2 36.2 Taraba 405,774 32.9 13.8 18.5 34.8 Yobe 445,603 48.8 7.4 18.1 25.7 Zamfara 763,430 40.5 8.0 9.5 41.7 FCT 238,574 50.7 8.9 4.6 35.8 SECTOR Urban 8,911,505 53.3 15.2 4.5 27.0 Rural 21,630,741 36.4 13.1 6.9 43.6 National 30,542,246 41.2 13.7 6.2 38.8
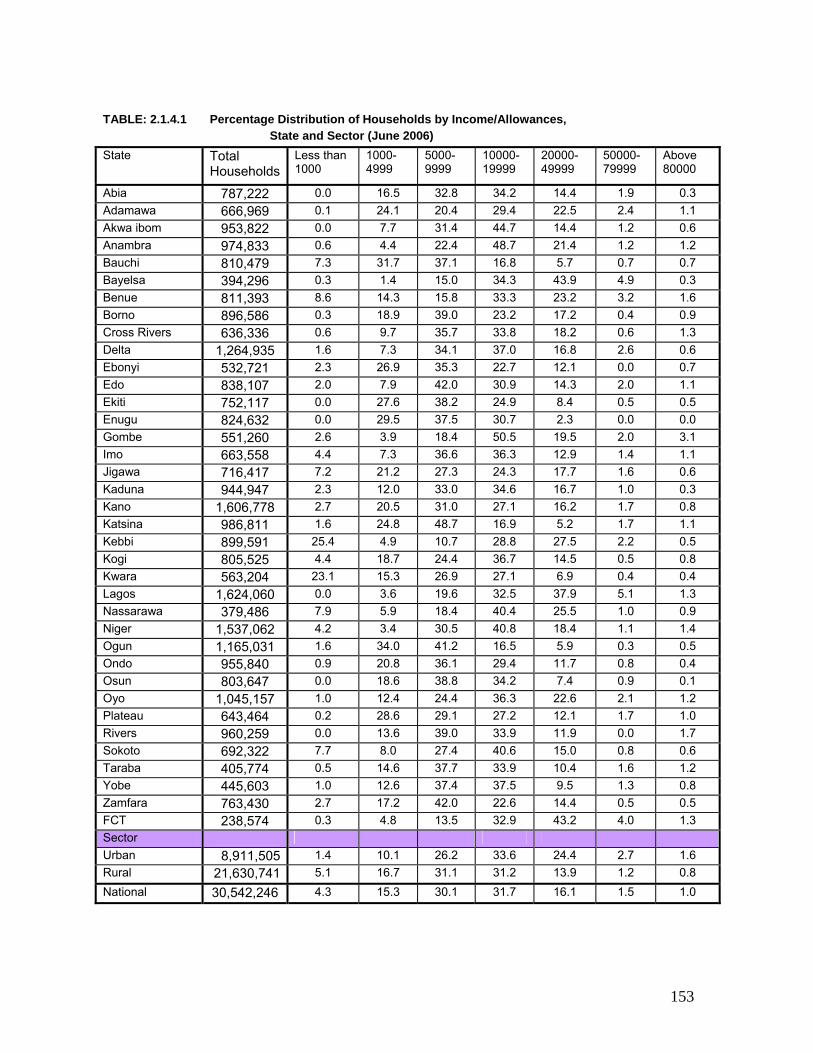
153
TABLE: 2.1.4.1 Percentage Distribution of Households by Income/Allowances,
State and Sector (June 2006) State Total
Households Less than 1000
1000-4999
5000-9999
10000-19999
20000-49999
50000-79999
Above 80000
Abia 787,222 0.0 16.5 32.8 34.2 14.4 1.9 0.3 Adamawa 666,969 0.1 24.1 20.4 29.4 22.5 2.4 1.1 Akwa ibom 953,822 0.0 7.7 31.4 44.7 14.4 1.2 0.6 Anambra 974,833 0.6 4.4 22.4 48.7 21.4 1.2 1.2 Bauchi 810,479 7.3 31.7 37.1 16.8 5.7 0.7 0.7 Bayelsa 394,296 0.3 1.4 15.0 34.3 43.9 4.9 0.3 Benue 811,393 8.6 14.3 15.8 33.3 23.2 3.2 1.6 Borno 896,586 0.3 18.9 39.0 23.2 17.2 0.4 0.9 Cross Rivers 636,336 0.6 9.7 35.7 33.8 18.2 0.6 1.3 Delta 1,264,935 1.6 7.3 34.1 37.0 16.8 2.6 0.6 Ebonyi 532,721 2.3 26.9 35.3 22.7 12.1 0.0 0.7 Edo 838,107 2.0 7.9 42.0 30.9 14.3 2.0 1.1 Ekiti 752,117 0.0 27.6 38.2 24.9 8.4 0.5 0.5 Enugu 824,632 0.0 29.5 37.5 30.7 2.3 0.0 0.0 Gombe 551,260 2.6 3.9 18.4 50.5 19.5 2.0 3.1 Imo 663,558 4.4 7.3 36.6 36.3 12.9 1.4 1.1 Jigawa 716,417 7.2 21.2 27.3 24.3 17.7 1.6 0.6 Kaduna 944,947 2.3 12.0 33.0 34.6 16.7 1.0 0.3 Kano 1,606,778 2.7 20.5 31.0 27.1 16.2 1.7 0.8 Katsina 986,811 1.6 24.8 48.7 16.9 5.2 1.7 1.1 Kebbi 899,591 25.4 4.9 10.7 28.8 27.5 2.2 0.5 Kogi 805,525 4.4 18.7 24.4 36.7 14.5 0.5 0.8 Kwara 563,204 23.1 15.3 26.9 27.1 6.9 0.4 0.4 Lagos 1,624,060 0.0 3.6 19.6 32.5 37.9 5.1 1.3 Nassarawa 379,486 7.9 5.9 18.4 40.4 25.5 1.0 0.9 Niger 1,537,062 4.2 3.4 30.5 40.8 18.4 1.1 1.4 Ogun 1,165,031 1.6 34.0 41.2 16.5 5.9 0.3 0.5 Ondo 955,840 0.9 20.8 36.1 29.4 11.7 0.8 0.4 Osun 803,647 0.0 18.6 38.8 34.2 7.4 0.9 0.1 Oyo 1,045,157 1.0 12.4 24.4 36.3 22.6 2.1 1.2 Plateau 643,464 0.2 28.6 29.1 27.2 12.1 1.7 1.0 Rivers 960,259 0.0 13.6 39.0 33.9 11.9 0.0 1.7 Sokoto 692,322 7.7 8.0 27.4 40.6 15.0 0.8 0.6 Taraba 405,774 0.5 14.6 37.7 33.9 10.4 1.6 1.2 Yobe 445,603 1.0 12.6 37.4 37.5 9.5 1.3 0.8 Zamfara 763,430 2.7 17.2 42.0 22.6 14.4 0.5 0.5 FCT 238,574 0.3 4.8 13.5 32.9 43.2 4.0 1.3 Sector Urban 8,911,505 1.4 10.1 26.2 33.6 24.4 2.7 1.6 Rural 21,630,741 5.1 16.7 31.1 31.2 13.9 1.2 0.8 National 30,542,246 4.3 15.3 30.1 31.7 16.1 1.5 1.0

154
TABLE: 2.1.4.2 Percentage Distribution of Households by Item and Expenditure (June 2006)
ITEM
Less than 1000
1000-4999
5000-9999
10000-19999
20000-49999
50000-79999
Above 80000
SCHOOL FEES
53.3
31.7
8.0
3.6
2.2
0.5
0.7
MEDICAL EXPENSES
73.9
21.5
2.7
1.0
0.4
0.2
0.4
HOUSE EXPENSES
45.3
46.5
5.7
1.5
0.5
0.1
0.4
REMITANCES
74.0
20.1
3.6
1.2
0.5
0.2
0.4
CLOTHING EXPENSES
46.2
44.1
6.7
1.9
0.4
0.2
0.5
TRANSPORT EXPENSES
53.8
41.0
3.5
1.0
0.2
0.1
0.4
FOOD EXPENSES
7.2
52.7
27.2
10.0
2.2
0.2
0.4
OTHER EXPENSES
58.9
28.0
7.3
4.1
1.1
0.1
0.6

155
TABLE: 2.1.5.1 Youth Literacy Rate in Any Language by State, Sector and Gender for Persons 15-24 Years (June 2006)
State Male Female Both Sexes
Abia 96.3 94.7 95.5 Adamawa 88.7 71.0 80.4 Akwa ibom 95.0 96.3 95.7 Anambra 93.1 95.6 94.5 Bauchi 58.6 26.8 42.0 Bayelsa 95.3 87.6 91.3 Benue 86.3 76.1 81.4 Borno 58.8 41.8 49.0 Cross Rivers 97.4 93.5 94.8 Delta 89.0 87.6 88.3 Ebonyi 93.2 92.4 92.8 Edo 92.1 86.8 89.8 Ekiti 94.6 97.7 96.3 Enugu 82.7 89.2 86.3 Gombe 85.8 78.7 82.1 Imo 93.5 95.1 94.3 Jigawa 42.3 35.9 39.8 Kaduna 73.0 58.4 66.3 Kano 74.3 49.6 61.2 Katsina 65.2 21.2 45.3 Kebbi 50.4 24.7 39.3 Kogi 91.1 92.2 91.6 Kwara 92.3 84.2 88.6 Lagos 98.0 95.5 96.7 Nassarawa 90.6 69.7 80.9 Niger 61.8 37.6 48.4 Ogun 90.4 91.8 91.2 Ondo 93.9 96.5 95.2 Osun 95.6 95.9 95.8 Oyo 94.3 92.1 93.2 Plateau 86.2 74.3 80.4 Rivers 93.2 94.0 93.5 Sokoto 54.1 27.9 42.8 Taraba 79.7 55.9 69.5 Yobe 55.4 31.7 43.5 Zamfara 31.7 11.7 19.8 FCT 82.4 75.5 79.5 SECTOR Urban 91.6 88.1 89.8 Rural 77.5 63.7 70.8 National 81.3 70.7 76.1

156
TABLE: 2.1.5.2 Adult Literacy Rate in any Language by State, Sector and Gender for Persons above 15 Years Old (June 2006)
STATE Male Female Both Sexes Abia 86.5 39.1 77.7 Adamawa 72.2 24.4 63.1 Akwa ibom 89.1 40.4 84.5 Anambra 82.0 41.0 78.1 Bauchi 41.4 10.0 31.1 Bayelsa 88.5 36.1 81.0 Benue 75.8 25.3 64.6 Borno 52.8 19.0 45.3 Cross Rivers 77.9 35.1 75.6 Delta 79.7 32.2 70.0 Ebonyi 74.3 28.1 64.3 Edo 85.7 35.9 78.5 Ekiti 73.5 34.3 67.7 Enugu 83.6 35.9 71.8 Gombe 84.8 36.5 80.1 Imo 85.5 38.0 78.9 Jigawa 52.8 13.2 41.2 Kaduna 65.6 22.6 56.4 Kano 68.9 21.5 55.6 Katsina 34.5 5.8 23.1 Kebbi 30.8 4.0 19.6 Kogi 71.7 28.6 64.4 Kwara 65.6 24.6 57.0 Lagos 93.5 42.5 90.1 Nassarawa 70.7 22.6 59.1 Niger 49.0 14.0 38.4 Ogun 71.2 29.2 63.0 Ondo 81.5 36.1 76.4 Osun 81.1 32.6 68.6 Oyo 82.4 36.2 76.2 Plateau 69.9 24.8 61.1 Rivers 88.8 37.0 83.7 Sokoto 45.0 10.0 33.2 Taraba 61.6 16.9 50.6 Yobe 37.1 11.9 30.6 Zamfara 23.7 6.0 17.5 FCT 72.3 27.0 67.1 SECTOR Urban 81.5 33.8 74.3 Rural 61.3 21.7 52.4 Total 65.7 24.3 57.2

157
TABLE 2.1.6.1 Unemployment Rates by State (June 2006)
State ILO NIGERIA Abia 19.5 25.1 Adamawa 4.1 21.5 Akwa ibom 11.0 18.0 Anambra 7.8 14.9 Bauchi 3.0 20.5 Bayelsa 13.7 21.9 Benue 4.8 7.9 Borno 6.4 12.5 Cross Rivers 24.7 32.8 Delta 15.1 22.9 Ebonyi 1.2 7.9 Edo 4.1 14.8 Ekiti 6.5 11.4 Enugu 2.6 14.1 Gombe 10.6 16.9 Imo 9.2 28.3 Jigawa 13.7 27.0 Kaduna 5.3 8.7 Kano 2.4 10.1 Katsina 3.7 10.9 Kebbi 1.1 1.3 Kogi 8.6 14.6 Kwara 14.1 17.7 Lagos 12.2 13.7 Nassarawa 3.0 11.8 Niger 2.1 4.2 Ogun 2.6 3.6 Ondo 1.9 6.7 Osun 3.5 7.2 Oyo 5.3 8.1 Plateau 5.0 6.8 Rivers 62.5 66.4 Sokoto 6.5 12.3 Taraba 13.2 15.2 Yobe 4.5 24.4 Zamfara 4.2 19.1 FCT 43.3 47.8 National 7.7 14.6
ILO Version: One-Hour Criterion Nigerian Version: 40-Hour Criterion
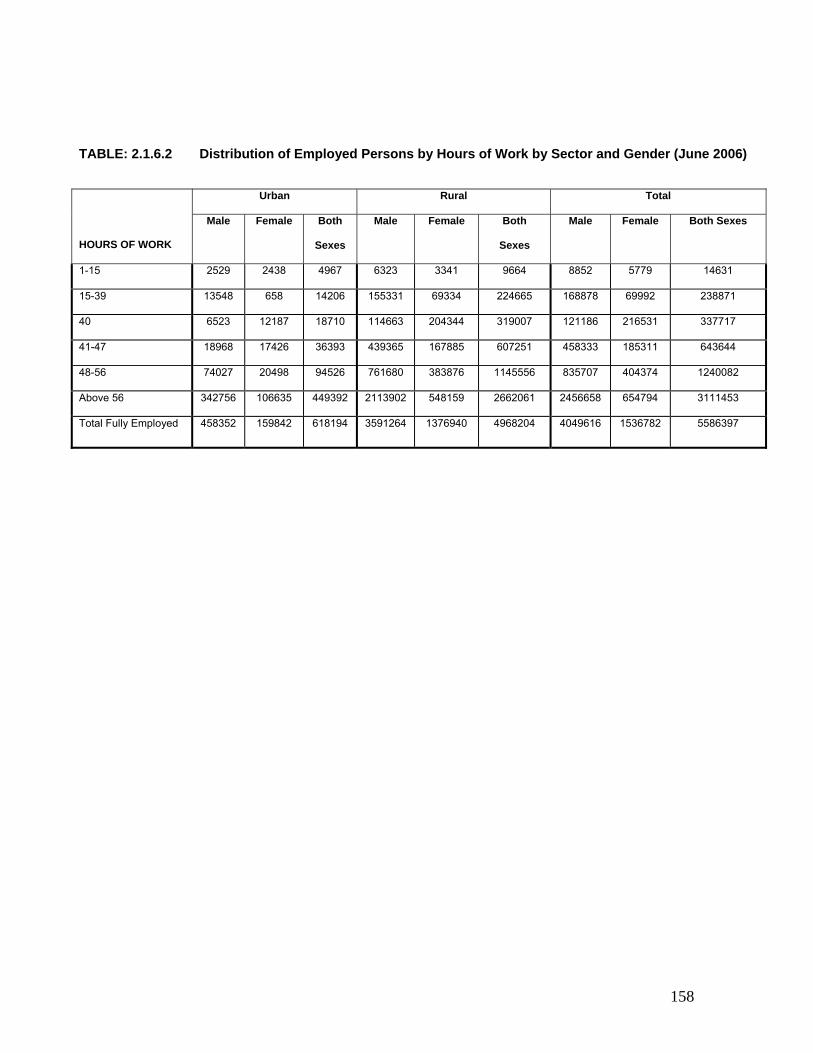
158
TABLE: 2.1.6.2 Distribution of Employed Persons by Hours of Work by Sector and Gender (June 2006)
Urban Rural Total
HOURS OF WORK
Male Female Both
Sexes
Male Female Both
Sexes
Male Female Both Sexes
1-15 2529 2438 4967 6323 3341 9664 8852 5779 14631
15-39 13548 658 14206 155331 69334 224665 168878 69992 238871
40 6523 12187 18710 114663 204344 319007 121186 216531 337717
41-47 18968 17426 36393 439365 167885 607251 458333 185311 643644
48-56 74027 20498 94526 761680 383876 1145556 835707 404374 1240082
Above 56 342756 106635 449392 2113902 548159 2662061 2456658 654794 3111453
Total Fully Employed 458352 159842 618194 3591264 1376940 4968204 4049616 1536782 5586397

159
TABLE 2.1.6.3 Distribution of Employed Persons by Industry, Sector and Gender (June 2006)
Industry Urban Rural Total Male Female Total Male Female Total Male Female Total
Agricultre,hunting and forestry 159132 28707 187840 2349579 773260 3122839 2508711 801968 3310679
Fishing 1363 0 1363 30287 0 30287 31650 0 31650
Mining and quarrying 5705 0 5705 14202 0 14202 19907 0 19907
Manufacturing 1368 0 1368 2050 0 2050 3418 0 3418
Electricity, gas and water supply
1372 0 1372 19667 7883 27551 21040 7883 28923
Construction 11934 0 11934 84522 1515 86037 96456 1515 97971
Wholesale and retail trade 55221 56365 111585 291938 322798 614736 347159 379163 726322
Hotels and restaurant 1735 1517 3252 4826 9420 14246 6561 10938 17498
Transport, storage and communication
32856 0 32856 134035 3985 138020 166892 3985 170877
Financial intermediation 2711 4301 7011 1345 1457 2802 4056 5758 9813
Real estate, renting and business activities
6627 0 6627 36957 13406 50363 43584 13406 56991
Public administration and defence
42350 19584 61933 175117 27214 202332 217467 46798 264265
Education 60535 23319 83855 232270 111900 344170 292805 135220 428025
Health and social work 4055 10204 14260 32845 30210 63055 36900 40414 77314
Other community, social and personal service activities
67840 15186 83027 167150 63867 231017 234990 79054 314044
Activities of private households 2187 658 2845 11428 10023 21451 13615 10681 24296
Extral territorial organisations and bodies
1358 0 1358 3045 0 3045 4404 0 4404
Total
458352
159842
618194
3591264
1376940
4968204
4049616
1536782
5586397

160
TABLE: 2.1.6.4
Distribution of Employed Persons by Engagement in Voluntary or
Social Work, Hours of Work, Sector and Gender (June 2006) Voluntary Work Urban Rural Total
Male Female Both Sexes
Male Female Both sexes
Male Female Both Sexes
Art and Recreation 6560 4921 11481 47021 13929 60950 53581 18850 72431
Education 22389 3654 26042 90356 21622 111978 112745 25275 138020 Health 5215 8991 14206 34555 3947 38502 39770 12938 52708
Social Services 109863 17416 127279 589166 93779 682945 699029 111195 810224
Environment 149356 102667 252023 258434 99183 357617 407790 201850 609640
Development and Housing 25353 6653 32006 752833 284713 1037546 778186 291366 1069553
Civil Advocacy 4523 0 4523 28923 3916 32839 33446 3916 37362
Philanthropy 0 0 0 11846 5021 16867 11846 5021 16867 Religion 204659 133932 338591 1051355 276445 1327800 1256014 410377 1666390 International 0 0 0 933 663 1596 933 663 1596 Business/professional 19549 7105 26654 11256 13151 24407 30804 20256 51061 Other(Specify) 7787 4515 12302 96814 17021 113835 104601 21536 126137
Hours of Work Below 15 Hours 375765 212079 587844 1573305 452368 2025673 1949070 664446 2613516
15-39 hours 110881 28701 139581 460585 76721 537306 571466 105422 676887
40 Hours 10136 2742 12878 79519 1636 81155 89655 4378 94033
41-47 Hours 10696 6422 17118 160866 14172 175037 171562 20594 192156
48-56 Hours 15046 3478 18523 62889 632 63522 77935 4110 82045
Above 56 Hours 8003 0 8003 9239 4433 13673 17242 4433 21676
Total 540966 264317 805283 2891164 761243 3652407 3432130 1025560 4457690

161
TABLE: 2.1.7.1 Percentage Distribution of Pregnant Women by State, Registration with Clinic,
Received Anti-tetanus and Number of Monthly Visit to Clinic (June 2006)
Number of Visit
State Clinic Registration
Received Anti-tetanus 0 1 2 3 4 5 6
Abia 95.0 75.6 0.0 42.9 38.1 9.5 4.8 0.0 4.8 Adamawa 68.4 76.5 0.0 30.8 38.5 9.6 21.2 0.0 0.0 Akwa ibom 58.8 53.8 0.0 0.0 30.0 20.0 40.0 10.0 0.0 Anambra 84.6 75.0 0.0 18.2 45.5 9.1 27.3 0.0 0.0 Bauchi 23.9 24.5 49.2 21.5 23.1 3.1 3.1 0.0 0.0 Bayelsa 52.6 57.9 0.0 6.7 46.7 6.7 40.0 0.0 0.0 Benue 64.0 78.4 0.0 45.5 42.4 9.1 3.0 0.0 0.0 Borno 35.4 56.0 6.7 20.0 36.7 30.0 3.3 0.0 3.3 Cross Rivers 75.0 75.0 0.0 50.0 0.0 25.0 0.0 0.0 25.0 Delta 39.1 57.1 0.0 9.1 63.6 9.1 18.2 0.0 0.0 Ebonyi 64.6 55.8 3.0 18.2 42.4 21.2 15.2 0.0 0.0 Edo 42.9 44.4 0.0 11.1 55.6 11.1 22.2 0.0 0.0 Ekiti 76.5 85.7 0.0 23.1 30.8 0.0 38.5 0.0 7.7 Enugu 86.2 85.7 0.0 28.6 14.3 28.6 28.6 0.0 0.0 Gombe 53.8 64.4 0.0 16.4 47.5 13.1 21.3 0.0 1.6 Imo 85.7 70.8 0.0 15.4 30.8 15.4 30.8 7.7 0.0 Jigawa 13.4 21.3 0.0 8.3 75.0 8.3 4.2 0.0 4.2 Kaduna 64.7 85.3 0.0 29.4 50.0 2.9 2.9 2.9 11.8 Kano 56.3 51.7 5.0 7.5 57.5 22.5 5.0 2.5 0.0 Katsina 2.5 8.0 91.7 4.2 0.0 0.0 4.2 0.0 0.0 Kebbi 4.8 9.1 80.0 6.7 6.7 0.0 6.7 0.0 0.0 Kogi 96.2 48.0 0.0 8.0 36.0 40.0 16.0 0.0 0.0 Kwara 66.7 76.5 0.0 46.2 38.5 7.7 7.7 0.0 0.0 Lagos 81.8 63.6 0.0 11.1 33.3 0.0 55.6 0.0 0.0 Nassarawa 55.3 55.7 30.6 11.3 35.5 3.2 17.7 0.0 1.6 Niger 75.4 84.3 11.5 35.4 38.9 3.5 10.6 0.0 0.0 Ogun 90.9 60.0 9.1 18.2 36.4 9.1 18.2 0.0 9.1 Ondo 62.5 64.3 0.0 40.0 0.0 20.0 40.0 0.0 0.0 Osun 73.3 91.7 0.0 27.3 0.0 9.1 63.6 0.0 0.0 Oyo 71.0 87.5 0.0 25.0 35.0 15.0 25.0 0.0 0.0 Plateau 60.7 64.3 0.0 27.3 59.1 9.1 4.5 0.0 0.0 Rivers 64.7 53.3 0.0 23.1 23.1 30.8 15.4 0.0 7.7 Sokoto 6.0 11.8 14.3 7.1 71.4 0.0 7.1 0.0 0.0 Taraba 50.0 43.4 10.9 8.7 30.4 30.4 17.4 0.0 2.2 Yobe 18.7 27.5 12.5 62.5 6.3 6.3 6.3 6.3 0.0 Zamfara 16.7 16.7 20.0 20.0 40.0 11.4 5.7 0.0 2.9 FCT 68.0 76.2 0.0 44.4 27.8 5.6 11.1 11.1 0.0 National 43.2 52.2 12.5 22.4 37.4 11.3 14.1 0.7 1.6

162
TABLE 2.1.7.2 Percentage Distribution of Women aged 15-49 Year by Method of Family Planning Used and Sector (June 2006)
METHOD Urban Rural Pill 1.3 0.6 Condom 4.7 5.3 Injection 1.4 0.5 IUD 0.4 0.0 Female Sterilization 0.1 0.1 Male sterilization 0.0 0.0 Douche 0.1 0.0 Norplant 0.2 0.2 Foaming Tab 0.0 0.0 Diaphram 0.1 0.0 Foam Jelly 0.0 0.0 Traditional methods 0.5 0.7 Abstinece 2.6 2.1 Withdrawal 0.7 0.5 Rhythm 0.4 0.0 Others 87.4 89.9

163
TABLE 2.1.8.1 Percentage Distribution of Births in the last 12 Months by State, Sector and Gender (June 2006)
State Male Female Abia 50.3 49.7 Adamawa 57.8 42.2 Akwa ibom 49.1 50.9 Anambra 47.3 52.7 Bauchi 63.7 36.3 Bayelsa 27.9 72.1 Benue 39.1 60.9 Borno 56.7 43.3 Cross Rivers 75.0 25.0 Delta 80.1 19.9 Ebonyi 55.0 45.0 Edo 42.4 57.6 Ekiti 45.4 54.6 Enugu 46.1 53.9 Gombe 68.2 31.8 Imo 44.7 55.3 Jigawa 68.6 31.4 Kaduna 46.5 53.5 Kano 54.7 45.3 Katsina 65.2 34.8 Kebbi 30.2 69.8 Kogi 54.7 45.3 Kwara 49.9 50.1 Lagos 49.8 50.2 Nassarawa 54.3 45.7 Niger 49.7 50.3 Ogun 42.2 57.8 Ondo 35.4 64.6 Osun 56.1 43.9 Oyo 59.5 40.5 Plateau 51.8 48.2 Rivers 41.4 58.6 Sokoto 50.0 50.0 Taraba 65.7 34.3 Yobe 40.2 59.8 Zamfara 55.4 44.6 FCT 55.0 45.0 SECTOR Urban 51.6 48.4 Rural 52.9 47.1 Total 52.7 47.3

164
TABLE: 2.1.8.2
Percentage Distribution of Births by State, Zone, Weight and Gender in Kg (June 2006)
State 1-1.99 2-2.99 3-3.99 4-4.99 5+ Abia 0.0 0.0 80.2 6.3 13.5 Adamawa 56.9 43.1 0.0 0.0 0.0 Akwa ibom 0.0 4.8 95.2 0.0 0.0 Anambra 0.0 8.1 78.5 0.0 13.4 Bauchi 56.7 23.6 15.0 1.2 3.5 Bayelsa 0.0 68.2 31.8 0.0 0.0 Benue 5.1 44.3 16.1 6.4 28.1 Borno 44.4 0.0 16.5 0.0 39.1 Cross Rivers 0.0 28.6 57.1 14.3 0.0 Delta 0.0 34.2 56.1 9.7 0.0 Ebonyi 0.0 39.9 49.1 11.0 0.0 Edo 32.6 22.2 36.7 8.5 0.0 Ekiti 0.0 0.0 74.1 25.9 0.0 Enugu 25.6 1.5 47.8 25.1 0.0 Gombe 0.0 26.5 73.5 0.0 0.0 Imo 69.8 0.0 7.1 8.8 14.3 Jigawa 6.6 44.3 49.0 0.0 0.0 Kaduna 20.4 22.5 57.1 0.0 0.0 Kano 0.0 4.6 95.4 0.0 0.0 Katsina 58.8 8.0 33.3 0.0 0.0 Kebbi 0.0 6.7 84.7 6.0 2.6 Kogi 0.0 16.9 67.7 15.5 0.0 Kwara 4.3 54.2 34.8 6.8 0.0 Lagos 0.0 18.4 66.4 10.9 4.3 Nassarawa 34.5 18.9 40.9 5.8 0.0 Niger 69.1 0.0 30.9 0.0 0.0 Ogun 8.5 45.7 29.6 16.2 0.0 Ondo 0.0 36.0 49.9 5.5 8.7 Osun 0.0 24.9 75.1 0.0 0.0 Oyo 30.4 21.0 39.8 0.0 8.8 Plateau 0.0 67.4 32.6 0.0 0.0 Rivers 61.2 0.0 38.8 0.0 0.0 Sokoto 23.1 64.2 12.7 0.0 0.0 Taraba 0.0 53.4 40.2 6.4 0.0 Yobe 0.0 0.0 0.0 0.0 0.0 Zamfara 0.0 0.0 100.0 0.0 0.0 FCT 0.0 0.9 47.7 18.6 32.8 ZONE North Central 9.8 40.1 33.8 5.9 10.4 North East 41.1 30.8 21.5 2.4 4.2 North West 17.6 14.2 67.9 0.2 0.1 South East 6.2 6.8 69.8 7.7 9.5 South South 14.0 22.8 56.8 6.4 0.0 South West 8.0 25.9 53.0 8.4 4.7 Total 15.0 22.2 53.5 5.1 4.3

165
TABLE: 2.1.8.3 Percentage Distribution of Children (One Year or Less) by State and Immunization Status and Gender (June 2006
State Measles BCG DPT1 DPT2 DPT3 OPV0 OPV1
OP V2
OP V3
Yellow Fever
MMR Vitamin A
Abia 18.5 7.4 3.7 0.0 0.0 7.4 7.4 11.1 3.7 3.7 7.4 29.6 Adamawa 50.0 2.4 4.8 0.0 4.8 0.0 4.8 0.0 2.4 4.8 0.0 26.2 Akwa ibom 36.7 20.4 0.0 2.0 0.0 8.2 6.1 2.0 2.0 2.0 0.0 20.4 Anambra 24.1 10.3 3.4 0.0 3.4 3.4 3.4 13.8 3.4 0.0 0.0 34.5 Bauchi 50.0 15.8 0.0 0.0 0.0 0.9 5.3 0.9 0.0 0.0 0.0 27.2 Bayelsa 0.0 0.0 0.0 25.0 0.0 0.0 0.0 0.0 0.0 0.0 0.0 75.0 Benue 30.8 28.8 3.8 3.8 5.8 1.9 3.8 0.0 0.0 0.0 1.9 19.2 Borno 64.9 2.7 0.0 2.7 0.0 2.7 2.7 2.7 8.1 2.7 0.0 10.8 Cross Rivers 40.0 10.0 0.0 0.0 0.0 20.0 0.0 0.0 0.0 10.0 0.0 20.0 Delta 0.0 0.0 8.3 0.0 0.0 0.0 0.0 0.0 41.7 8.3 8.3 33.3 Ebonyi 31.3 3.1 3.1 3.1 0.0 0.0 3.1 3.1 21.9 0.0 3.1 28.1 Edo 7.7 15.4 3.8 0.0 0.0 7.7 3.8 3.8 11.5 0.0 7.7 38.5 Ekiti 25.0 15.6 0.0 0.0 0.0 3.1 3.1 9.4 18.8 3.1 0.0 21.9 Enugu 20.8 20.8 2.1 2.1 0.0 6.3 4.2 2.1 0.0 2.1 0.0 39.6 Gombe 24.4 4.4 6.7 8.9 0.0 2.2 8.9 2.2 0.0 4.4 33.3 4.4 Imo 17.1 8.6 8.6 11.4 11.4 5.7 5.7 2.9 2.9 2.9 0.0 22.9 Jigawa 37.9 15.5 5.2 0.0 0.0 0.0 1.7 0.0 0.0 1.7 0.0 37.9 Kaduna 11.5 13.5 7.7 5.8 1.9 1.9 1.9 0.0 26.9 3.8 0.0 25.0 Kano 11.1 44.4 2.5 2.5 2.5 0.0 1.2 0.0 1.2 1.2 0.0 33.3 Katsina 63.2 19.5 2.3 0.0 0.8 2.3 3.0 3.0 0.8 0.0 0.0 5.3 Kebbi 64.9 0.0 0.0 2.7 0.0 0.0 0.0 0.0 0.0 2.7 0.0 29.7 Kogi 66.7 0.0 0.0 0.0 0.0 3.7 3.7 3.7 3.7 0.0 0.0 18.5 Kwara 16.2 10.8 2.7 5.4 2.7 0.0 2.7 0.0 8.1 2.7 0.0 48.6 Lagos 12.1 12.1 6.1 0.0 0.0 0.0 9.1 9.1 12.1 3.0 3.0 33.3 Nassarawa 28.6 28.6 1.4 0.0 1.4 1.4 0.0 1.4 2.9 8.6 1.4 24.3 Niger 38.5 2.6 0.0 2.6 2.6 2.6 0.0 0.0 2.6 0.0 0.0 48.7 Ogun 55.2 3.4 3.4 0.0 0.0 0.0 0.0 3.4 0.0 3.4 3.4 27.6 Ondo 35.7 7.1 2.4 7.1 4.8 9.5 4.8 0.0 7.1 2.4 0.0 19.0 Osun 25.5 5.5 7.3 0.0 1.8 1.8 7.3 14.5 0.0 0.0 0.0 36.4 Oyo 18.4 10.2 4.1 2.0 4.1 4.1 2.0 4.1 2.0 2.0 2.0 44.9 Plateau 16.0 11.1 0.0 1.2 0.0 1.2 4.9 3.7 16.0 6.2 0.0 39.5 Rivers 68.1 8.5 0.0 0.0 2.1 2.1 2.1 4.3 0.0 2.1 0.0 10.6 Sokoto 41.5 30.2 0.0 0.0 1.9 0.0 1.9 3.8 9.4 0.0 0.0 11.3 Taraba 23.5 13.7 3.9 2.0 5.9 0.0 0.0 0.0 0.0 9.8 0.0 41.2 Yobe 68.3 3.2 0.0 0.0 0.0 0.0 0.0 0.0 6.3 0.0 0.0 22.2 Zamfara 17.0 2.1 2.1 0.0 0.0 0.0 2.1 0.0 0.0 0.0 0.0 76.6 FCT 31.4 5.7 2.9 0.0 0.0 2.9 0.0 2.9 11.4 0.0 0.0 42.9 Gender Male 23.7 5.4 2.9 1.4 1.5 2.8 3.7 3.1 6.5 3.1 1.8 44.1 Female 23.8 4.6 3.1 2.8 2.2 2.4 3.7 3.3 5.2 2.2 1.8 44.7 National 35.1 13.8 2.6 1.8 1.6 2.2 3.2 2.7 5.0 2.3 1.5 28.3
BCG - BOVIS, CALMETTE AND GVERIN DPT - DIPHTHERIA, PERTUSSIS AND TETANUS OPV - ORAL POLIO VACCINE MMR - MEASLES, MUMPS AND RUBELLA

166
TABLE: 2.1.8.4 Percentage Distribution of Chilldren (Less than 1 Year) by State
and Reason for Not Getting Colostrum (first Yellow Milk) (June 2006) State
Bad Milk Mother Ill/Weak
Child Ill/Weak
Mother Died
Nipple/Breast Problem
Didn't Produce Milk
Other
Abia 30.4 34.8 34.8 0.0 0.0 0.0 0.0 Adamawa 33.3 33.3 33.3 0.0 0.0 0.0 0.0 Akwa ibom 32.4 32.4 32.4 0.0 0.0 2.9 0.0 Anambra 31.9 31.9 36.1 0.0 0.0 0.0 0.0 Bauchi 32.9 32.9 32.9 0.0 1.3 0.0 0.0 Bayelsa 33.3 33.3 33.3 0.0 0.0 0.0 0.0 Benue 25.5 34.3 28.4 2.9 0.0 2.9 5.9 Borno 23.5 50.0 26.5 0.0 0.0 0.0 0.0 Cross Rivers 33.3 33.3 33.3 0.0 0.0 0.0 0.0 Delta 33.3 33.3 33.3 0.0 0.0 0.0 0.0 Ebonyi 33.3 33.3 33.3 0.0 0.0 0.0 0.0 Edo 33.3 33.3 33.3 0.0 0.0 0.0 0.0 Ekiti 33.3 33.3 33.3 0.0 0.0 0.0 0.0 Enugu 30.0 30.0 33.3 0.0 3.3 0.0 3.3 Gombe 26.2 47.6 26.2 0.0 0.0 0.0 0.0 Imo 33.3 33.3 33.3 0.0 0.0 0.0 0.0 Jigawa 32.0 36.0 32.0 0.0 0.0 0.0 0.0 Kaduna 28.3 41.3 28.3 0.0 0.0 2.2 0.0 Kano 32.8 32.8 32.8 0.0 0.0 0.0 1.5 Katsina 28.9 28.9 28.9 0.0 0.8 0.0 12.6 Kebbi 33.3 33.3 33.3 0.0 0.0 0.0 0.0 Kogi 33.3 33.3 33.3 0.0 0.0 0.0 0.0 Kwara 33.3 33.3 33.3 0.0 0.0 0.0 0.0 Lagos 31.3 37.5 31.3 0.0 0.0 0.0 0.0 Nassarawa 32.0 32.0 32.0 0.0 0.0 4.0 0.0 Niger 33.3 33.3 33.3 0.0 0.0 0.0 0.0 Ogun 33.3 33.3 33.3 0.0 0.0 0.0 0.0 Ondo 33.3 33.3 33.3 0.0 0.0 0.0 0.0 Osun 32.6 34.8 32.6 0.0 0.0 0.0 0.0 Oyo 33.3 33.3 33.3 0.0 0.0 0.0 0.0 Plateau 32.9 32.9 32.9 0.0 0.0 0.0 1.4 Rivers 33.3 33.3 33.3 0.0 0.0 0.0 0.0 Sokoto 33.3 33.3 33.3 0.0 0.0 0.0 0.0 Taraba 33.3 33.3 33.3 0.0 0.0 0.0 0.0 Yobe 27.5 39.2 27.5 0.0 2.9 0.0 2.9 Zamfara 33.3 33.3 33.3 0.0 0.0 0.0 0.0 FCT 33.3 33.3 33.3 0.0 0.0 0.0 0.0
National 31.4 34.2 31.8 0.1 0.3 0.4 1.8

167
TABLE: 2.1.8.5 Percentage Distribution of Deaths in the last
12 Months by State, Sector and Gender State Male Female Abia 40.0 60.0 Adamawa 100.0 0.0 Akwa ibom 66.7 33.3 Anambra 0.0 100.0 Bauchi 25.0 75.0 Bayelsa 100.0 0.0 Benue 54.5 45.5 Borno 75.0 25.0 Cross Rivers 66.7 33.3 Delta 60.0 40.0 Ebonyi 64.7 35.3 Edo 100.0 0.0 Ekiti 100.0 0.0 Enugu 36.4 63.6 Gombe 0.0 100.0 Imo 73.7 26.3 Jigawa 53.5 46.5 Kaduna 57.1 42.9 Kano 57.1 42.9 Katsina 58.3 41.7 Kebbi 100.0 0.0 Kogi 50.0 50.0 Kwara 0.0 100.0 Lagos 71.4 28.6 Nassarawa 80.0 20.0 Niger 0.0 0.0 Ogun 0.0 0.0 Ondo 66.7 33.3 Osun 0.0 0.0 Oyo 100.0 0.0 Plateau 100.0 0.0 Rivers 25.0 75.0 Sokoto 25.0 75.0 Taraba 41.7 58.3 Yobe 75.0 25.0 Zamfara 40.0 60.0 FCT 100.0 0.0 National 57.9 42.1

168
TABLE 2.1.9.1 Percentage Distribution of Persons by Type of
Building Embarked Upon, State and Sector (June 2006) State Residential Commercial Industrial Other Abia 85.0 0.0 0.0 15.0 Adamawa 87.2 7.7 2.6 2.6 Akwa ibom 96.7 1.6 0.0 1.6 Anambra 100.0 0.0 0.0 0.0 Bauchi 89.6 6.0 0.0 4.5 Bayelsa 100.0 0.0 0.0 0.0 Benue 95.2 4.8 0.0 0.0 Borno 100.0 0.0 0.0 0.0 Cross Rivers 98.4 0.0 0.0 1.6 Delta 94.7 4.0 0.0 1.3 Ebonyi 99.1 0.0 0.0 0.9 Edo 92.3 0.0 0.0 7.7 Ekiti 100.0 0.0 0.0 0.0 Enugu 0.0 0.0 0.0 0.0 Gombe 93.9 6.1 0.0 0.0 Imo 100.0 0.0 0.0 0.0 Jigawa 88.2 4.3 0.0 7.5 Kaduna 96.6 1.7 0.0 1.7 Kano 67.3 15.6 0.0 17.0 Katsina 97.1 2.9 0.0 0.0 Kebbi 96.0 0.0 0.0 4.0 Kogi 90.7 9.3 0.0 0.0 Kwara 100.0 0.0 0.0 0.0 Lagos 90.0 10.0 0.0 0.0 Nassarawa 100.0 0.0 0.0 0.0 Niger 50.0 21.4 0.0 28.6 Ogun 85.7 14.3 0.0 0.0 Ondo 62.5 0.0 0.0 37.5 Osun 96.7 3.3 0.0 0.0 Oyo 92.5 5.0 0.0 2.5 Plateau 82.9 9.8 0.0 7.3 Rivers 100.0 0.0 0.0 0.0 Sokoto 86.1 0.0 0.0 13.9 Taraba 95.0 3.8 1.3 0.0 Yobe 97.8 2.2 0.0 0.0 Zamfara 85.2 7.4 7.4 0.0 FCT 80.0 20.0 0.0 0.0 SECTOR 0.0 0.0 0.0 0.0 Urban 94.9 2.0 0.2 3.0 Rural 96.5 1.6 0.1 1.7 National 96.3 1.7 0.1 1.9
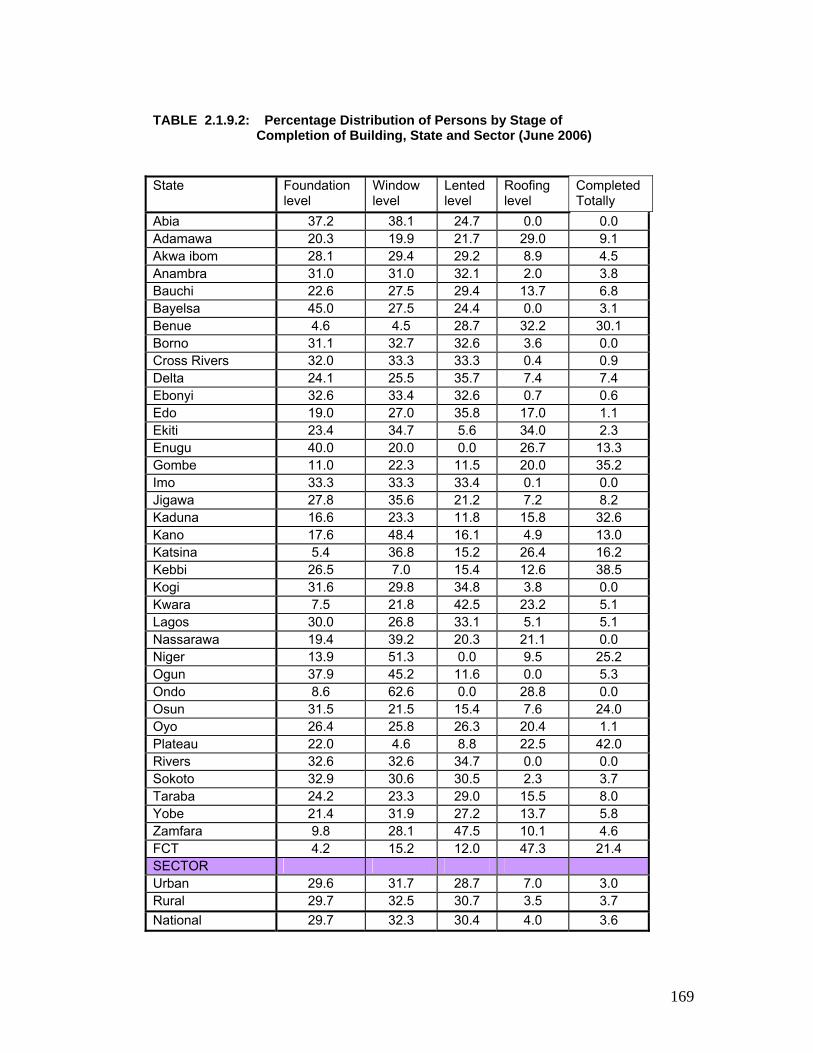
169
TABLE 2.1.9.2: Percentage Distribution of Persons by Stage of Completion of Building, State and Sector (June 2006)
State Foundation
level Window level
Lented level
Roofing level
Completed Totally
Abia 37.2 38.1 24.7 0.0 0.0 Adamawa 20.3 19.9 21.7 29.0 9.1 Akwa ibom 28.1 29.4 29.2 8.9 4.5 Anambra 31.0 31.0 32.1 2.0 3.8 Bauchi 22.6 27.5 29.4 13.7 6.8 Bayelsa 45.0 27.5 24.4 0.0 3.1 Benue 4.6 4.5 28.7 32.2 30.1 Borno 31.1 32.7 32.6 3.6 0.0 Cross Rivers 32.0 33.3 33.3 0.4 0.9 Delta 24.1 25.5 35.7 7.4 7.4 Ebonyi 32.6 33.4 32.6 0.7 0.6 Edo 19.0 27.0 35.8 17.0 1.1 Ekiti 23.4 34.7 5.6 34.0 2.3 Enugu 40.0 20.0 0.0 26.7 13.3 Gombe 11.0 22.3 11.5 20.0 35.2 Imo 33.3 33.3 33.4 0.1 0.0 Jigawa 27.8 35.6 21.2 7.2 8.2 Kaduna 16.6 23.3 11.8 15.8 32.6 Kano 17.6 48.4 16.1 4.9 13.0 Katsina 5.4 36.8 15.2 26.4 16.2 Kebbi 26.5 7.0 15.4 12.6 38.5 Kogi 31.6 29.8 34.8 3.8 0.0 Kwara 7.5 21.8 42.5 23.2 5.1 Lagos 30.0 26.8 33.1 5.1 5.1 Nassarawa 19.4 39.2 20.3 21.1 0.0 Niger 13.9 51.3 0.0 9.5 25.2 Ogun 37.9 45.2 11.6 0.0 5.3 Ondo 8.6 62.6 0.0 28.8 0.0 Osun 31.5 21.5 15.4 7.6 24.0 Oyo 26.4 25.8 26.3 20.4 1.1 Plateau 22.0 4.6 8.8 22.5 42.0 Rivers 32.6 32.6 34.7 0.0 0.0 Sokoto 32.9 30.6 30.5 2.3 3.7 Taraba 24.2 23.3 29.0 15.5 8.0 Yobe 21.4 31.9 27.2 13.7 5.8 Zamfara 9.8 28.1 47.5 10.1 4.6 FCT 4.2 15.2 12.0 47.3 21.4 SECTOR Urban 29.6 31.7 28.7 7.0 3.0 Rural 29.7 32.5 30.7 3.5 3.7 National 29.7 32.3 30.4 4.0 3.6
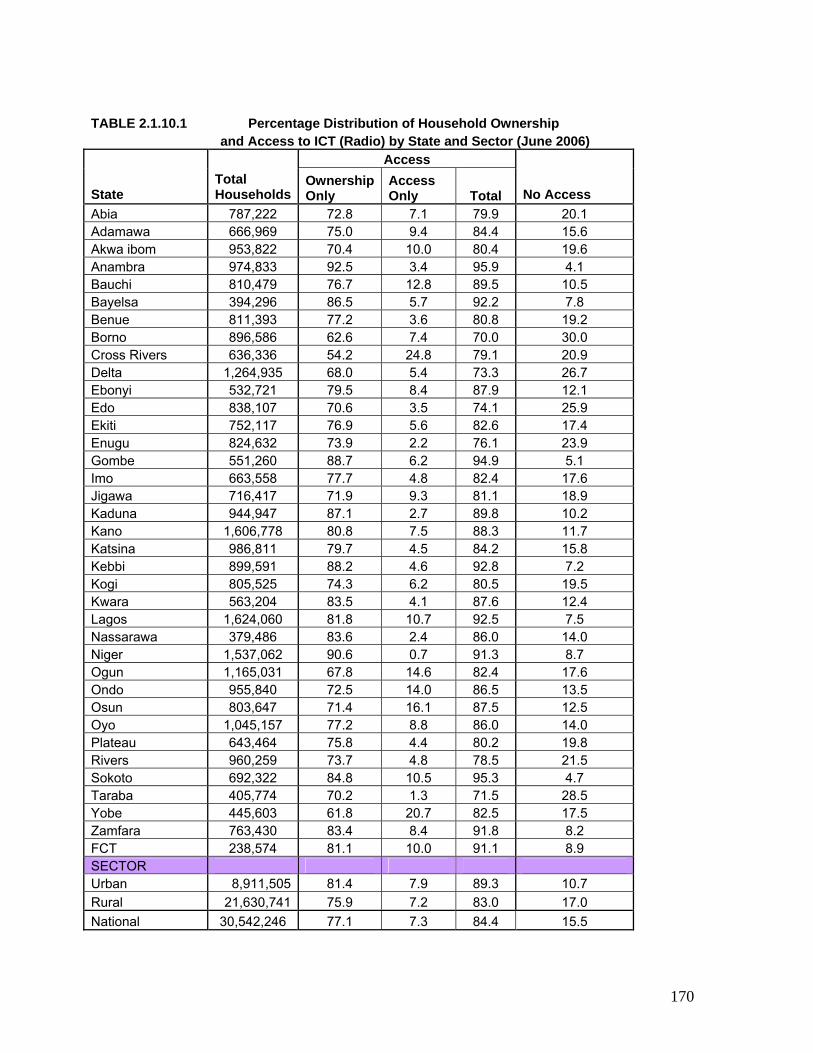
170
TABLE 2.1.10.1 Percentage Distribution of Household Ownership and Access to ICT (Radio) by State and Sector (June 2006)
Access
State Total Households
Ownership Only
Access Only Total No Access
Abia 787,222 72.8 7.1 79.9 20.1 Adamawa 666,969 75.0 9.4 84.4 15.6 Akwa ibom 953,822 70.4 10.0 80.4 19.6 Anambra 974,833 92.5 3.4 95.9 4.1 Bauchi 810,479 76.7 12.8 89.5 10.5 Bayelsa 394,296 86.5 5.7 92.2 7.8 Benue 811,393 77.2 3.6 80.8 19.2 Borno 896,586 62.6 7.4 70.0 30.0 Cross Rivers 636,336 54.2 24.8 79.1 20.9 Delta 1,264,935 68.0 5.4 73.3 26.7 Ebonyi 532,721 79.5 8.4 87.9 12.1 Edo 838,107 70.6 3.5 74.1 25.9 Ekiti 752,117 76.9 5.6 82.6 17.4 Enugu 824,632 73.9 2.2 76.1 23.9 Gombe 551,260 88.7 6.2 94.9 5.1 Imo 663,558 77.7 4.8 82.4 17.6 Jigawa 716,417 71.9 9.3 81.1 18.9 Kaduna 944,947 87.1 2.7 89.8 10.2 Kano 1,606,778 80.8 7.5 88.3 11.7 Katsina 986,811 79.7 4.5 84.2 15.8 Kebbi 899,591 88.2 4.6 92.8 7.2 Kogi 805,525 74.3 6.2 80.5 19.5 Kwara 563,204 83.5 4.1 87.6 12.4 Lagos 1,624,060 81.8 10.7 92.5 7.5 Nassarawa 379,486 83.6 2.4 86.0 14.0 Niger 1,537,062 90.6 0.7 91.3 8.7 Ogun 1,165,031 67.8 14.6 82.4 17.6 Ondo 955,840 72.5 14.0 86.5 13.5 Osun 803,647 71.4 16.1 87.5 12.5 Oyo 1,045,157 77.2 8.8 86.0 14.0 Plateau 643,464 75.8 4.4 80.2 19.8 Rivers 960,259 73.7 4.8 78.5 21.5 Sokoto 692,322 84.8 10.5 95.3 4.7 Taraba 405,774 70.2 1.3 71.5 28.5 Yobe 445,603 61.8 20.7 82.5 17.5 Zamfara 763,430 83.4 8.4 91.8 8.2 FCT 238,574 81.1 10.0 91.1 8.9 SECTOR Urban 8,911,505 81.4 7.9 89.3 10.7 Rural 21,630,741 75.9 7.2 83.0 17.0 National 30,542,246 77.1 7.3 84.4 15.5
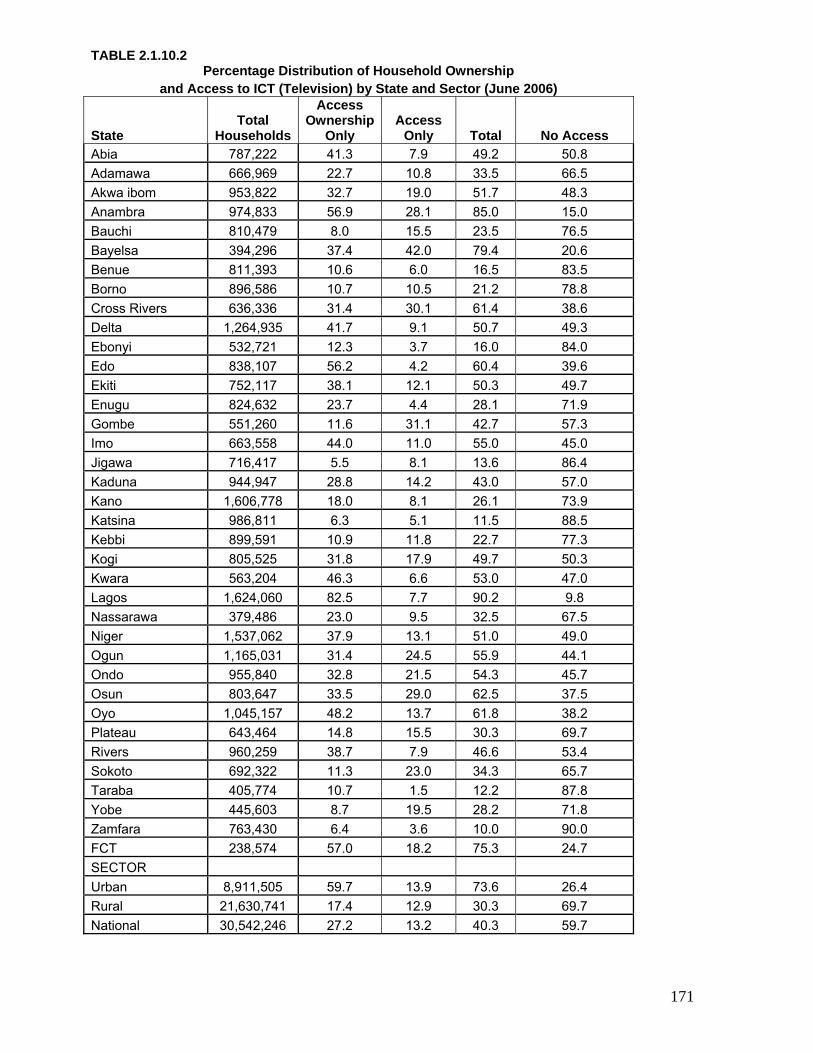
171
TABLE 2.1.10.2 Percentage Distribution of Household Ownership
and Access to ICT (Television) by State and Sector (June 2006)
State Total
Households
Access Ownership
Only Access
Only Total No Access Abia 787,222 41.3 7.9 49.2 50.8 Adamawa 666,969 22.7 10.8 33.5 66.5 Akwa ibom 953,822 32.7 19.0 51.7 48.3 Anambra 974,833 56.9 28.1 85.0 15.0 Bauchi 810,479 8.0 15.5 23.5 76.5 Bayelsa 394,296 37.4 42.0 79.4 20.6 Benue 811,393 10.6 6.0 16.5 83.5 Borno 896,586 10.7 10.5 21.2 78.8 Cross Rivers 636,336 31.4 30.1 61.4 38.6 Delta 1,264,935 41.7 9.1 50.7 49.3 Ebonyi 532,721 12.3 3.7 16.0 84.0 Edo 838,107 56.2 4.2 60.4 39.6 Ekiti 752,117 38.1 12.1 50.3 49.7 Enugu 824,632 23.7 4.4 28.1 71.9 Gombe 551,260 11.6 31.1 42.7 57.3 Imo 663,558 44.0 11.0 55.0 45.0 Jigawa 716,417 5.5 8.1 13.6 86.4 Kaduna 944,947 28.8 14.2 43.0 57.0 Kano 1,606,778 18.0 8.1 26.1 73.9 Katsina 986,811 6.3 5.1 11.5 88.5 Kebbi 899,591 10.9 11.8 22.7 77.3 Kogi 805,525 31.8 17.9 49.7 50.3 Kwara 563,204 46.3 6.6 53.0 47.0 Lagos 1,624,060 82.5 7.7 90.2 9.8 Nassarawa 379,486 23.0 9.5 32.5 67.5 Niger 1,537,062 37.9 13.1 51.0 49.0 Ogun 1,165,031 31.4 24.5 55.9 44.1 Ondo 955,840 32.8 21.5 54.3 45.7 Osun 803,647 33.5 29.0 62.5 37.5 Oyo 1,045,157 48.2 13.7 61.8 38.2 Plateau 643,464 14.8 15.5 30.3 69.7 Rivers 960,259 38.7 7.9 46.6 53.4 Sokoto 692,322 11.3 23.0 34.3 65.7 Taraba 405,774 10.7 1.5 12.2 87.8 Yobe 445,603 8.7 19.5 28.2 71.8 Zamfara 763,430 6.4 3.6 10.0 90.0 FCT 238,574 57.0 18.2 75.3 24.7 SECTOR Urban 8,911,505 59.7 13.9 73.6 26.4 Rural 21,630,741 17.4 12.9 30.3 69.7 National 30,542,246 27.2 13.2 40.3 59.7
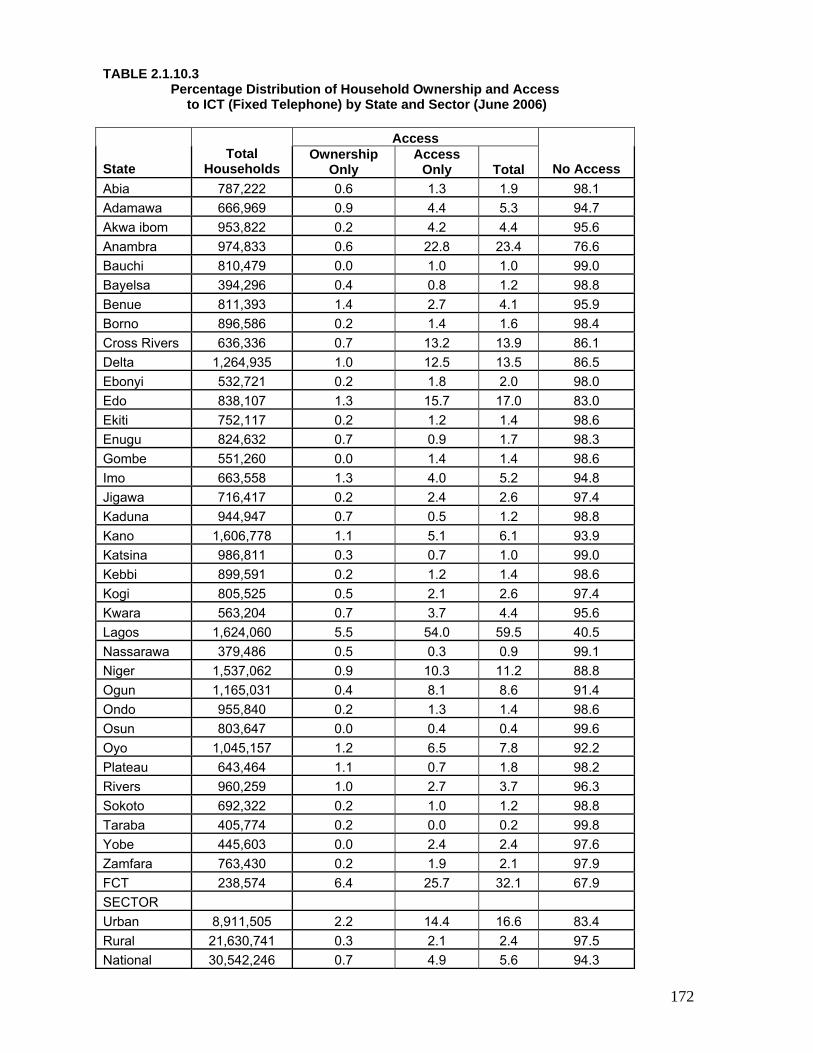
172
TABLE 2.1.10.3
Percentage Distribution of Household Ownership and Access to ICT (Fixed Telephone) by State and Sector (June 2006)
Access
State Total
Households Ownership
Only Access
Only Total No Access Abia 787,222 0.6 1.3 1.9 98.1 Adamawa 666,969 0.9 4.4 5.3 94.7 Akwa ibom 953,822 0.2 4.2 4.4 95.6 Anambra 974,833 0.6 22.8 23.4 76.6 Bauchi 810,479 0.0 1.0 1.0 99.0 Bayelsa 394,296 0.4 0.8 1.2 98.8 Benue 811,393 1.4 2.7 4.1 95.9 Borno 896,586 0.2 1.4 1.6 98.4 Cross Rivers 636,336 0.7 13.2 13.9 86.1 Delta 1,264,935 1.0 12.5 13.5 86.5 Ebonyi 532,721 0.2 1.8 2.0 98.0 Edo 838,107 1.3 15.7 17.0 83.0 Ekiti 752,117 0.2 1.2 1.4 98.6 Enugu 824,632 0.7 0.9 1.7 98.3 Gombe 551,260 0.0 1.4 1.4 98.6 Imo 663,558 1.3 4.0 5.2 94.8 Jigawa 716,417 0.2 2.4 2.6 97.4 Kaduna 944,947 0.7 0.5 1.2 98.8 Kano 1,606,778 1.1 5.1 6.1 93.9 Katsina 986,811 0.3 0.7 1.0 99.0 Kebbi 899,591 0.2 1.2 1.4 98.6 Kogi 805,525 0.5 2.1 2.6 97.4 Kwara 563,204 0.7 3.7 4.4 95.6 Lagos 1,624,060 5.5 54.0 59.5 40.5 Nassarawa 379,486 0.5 0.3 0.9 99.1 Niger 1,537,062 0.9 10.3 11.2 88.8 Ogun 1,165,031 0.4 8.1 8.6 91.4 Ondo 955,840 0.2 1.3 1.4 98.6 Osun 803,647 0.0 0.4 0.4 99.6 Oyo 1,045,157 1.2 6.5 7.8 92.2 Plateau 643,464 1.1 0.7 1.8 98.2 Rivers 960,259 1.0 2.7 3.7 96.3 Sokoto 692,322 0.2 1.0 1.2 98.8 Taraba 405,774 0.2 0.0 0.2 99.8 Yobe 445,603 0.0 2.4 2.4 97.6 Zamfara 763,430 0.2 1.9 2.1 97.9 FCT 238,574 6.4 25.7 32.1 67.9 SECTOR Urban 8,911,505 2.2 14.4 16.6 83.4 Rural 21,630,741 0.3 2.1 2.4 97.5 National 30,542,246 0.7 4.9 5.6 94.3
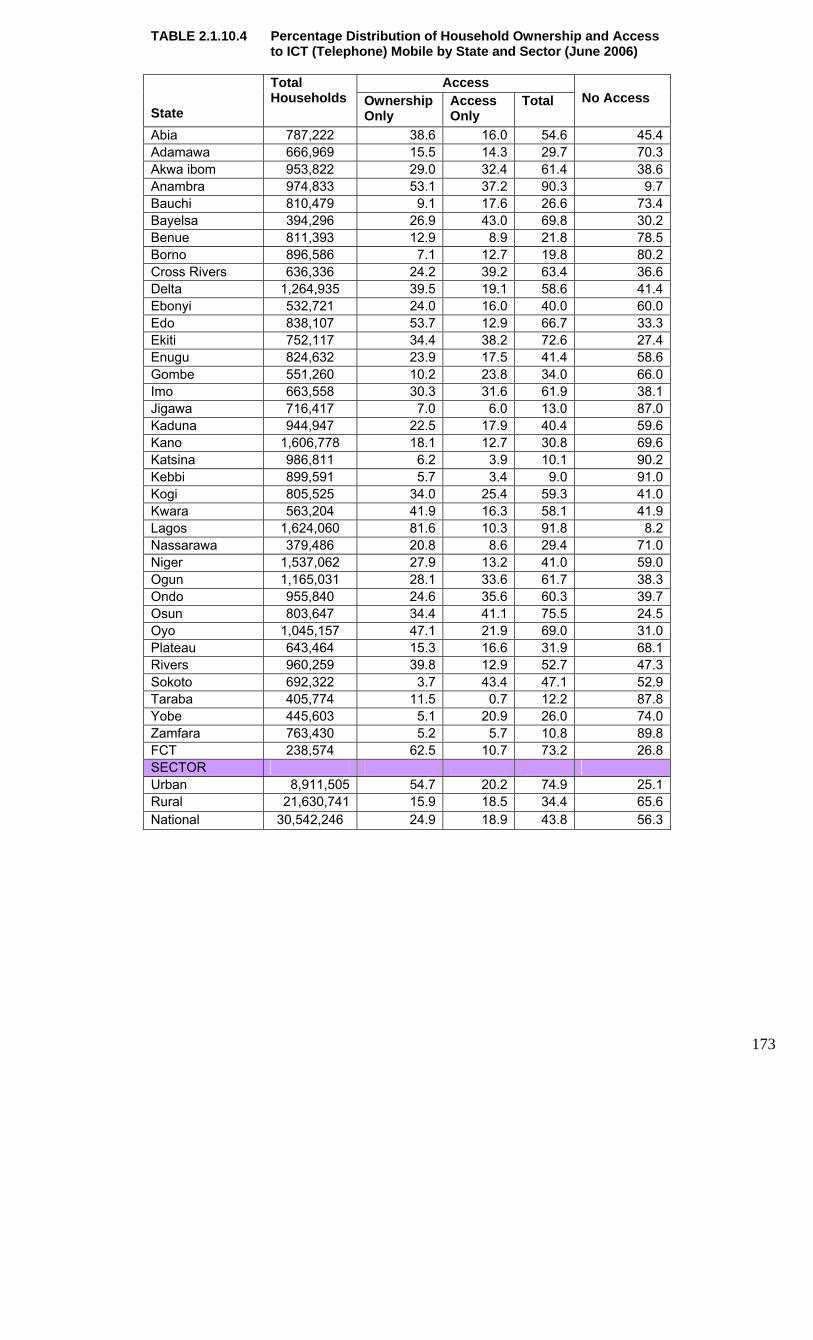
173
TABLE 2.1.10.4 Percentage Distribution of Household Ownership and Access to ICT (Telephone) Mobile by State and Sector (June 2006)
Access State
Total Households Ownership
Only Access Only
Total No Access
Abia 787,222 38.6 16.0 54.6 45.4Adamawa 666,969 15.5 14.3 29.7 70.3Akwa ibom 953,822 29.0 32.4 61.4 38.6Anambra 974,833 53.1 37.2 90.3 9.7Bauchi 810,479 9.1 17.6 26.6 73.4Bayelsa 394,296 26.9 43.0 69.8 30.2Benue 811,393 12.9 8.9 21.8 78.5Borno 896,586 7.1 12.7 19.8 80.2Cross Rivers 636,336 24.2 39.2 63.4 36.6Delta 1,264,935 39.5 19.1 58.6 41.4Ebonyi 532,721 24.0 16.0 40.0 60.0Edo 838,107 53.7 12.9 66.7 33.3Ekiti 752,117 34.4 38.2 72.6 27.4Enugu 824,632 23.9 17.5 41.4 58.6Gombe 551,260 10.2 23.8 34.0 66.0Imo 663,558 30.3 31.6 61.9 38.1Jigawa 716,417 7.0 6.0 13.0 87.0Kaduna 944,947 22.5 17.9 40.4 59.6Kano 1,606,778 18.1 12.7 30.8 69.6Katsina 986,811 6.2 3.9 10.1 90.2Kebbi 899,591 5.7 3.4 9.0 91.0Kogi 805,525 34.0 25.4 59.3 41.0Kwara 563,204 41.9 16.3 58.1 41.9Lagos 1,624,060 81.6 10.3 91.8 8.2Nassarawa 379,486 20.8 8.6 29.4 71.0Niger 1,537,062 27.9 13.2 41.0 59.0Ogun 1,165,031 28.1 33.6 61.7 38.3Ondo 955,840 24.6 35.6 60.3 39.7Osun 803,647 34.4 41.1 75.5 24.5Oyo 1,045,157 47.1 21.9 69.0 31.0Plateau 643,464 15.3 16.6 31.9 68.1Rivers 960,259 39.8 12.9 52.7 47.3Sokoto 692,322 3.7 43.4 47.1 52.9Taraba 405,774 11.5 0.7 12.2 87.8Yobe 445,603 5.1 20.9 26.0 74.0Zamfara 763,430 5.2 5.7 10.8 89.8FCT 238,574 62.5 10.7 73.2 26.8SECTOR Urban 8,911,505 54.7 20.2 74.9 25.1Rural 21,630,741 15.9 18.5 34.4 65.6National 30,542,246 24.9 18.9 43.8 56.3

174
TABLE 2.1.10.5 Percentage Distribution of Household Ownership and Access to ICT (Personal Computer) by State and Sector (June
2006)
Access State
Total Households Ownership Only Access Only
Total
Abia 787,222 0.0 2.1 2.1 Adamawa 666,969 0.5 3.8 4.4 Akwa ibom 953,822 0.2 3.2 3.4 Anambra 974,833 0.9 22.9 23.8 Bauchi 810,479 0.0 1.0 1.0 Bayelsa 394,296 0.4 2.9 3.3 Benue 811,393 1.2 3.7 4.9 Borno 896,586 0.0 0.2 0.2 Cross Rivers 636,336 0.7 17.0 17.6 Delta 1,264,935 0.5 10.5 11.0 Ebonyi 532,721 0.0 2.7 2.7 Edo 838,107 0.0 14.1 14.1 Ekiti 752,117 0.2 1.7 1.9 Enugu 824,632 1.1 3.1 4.2 Gombe 551,260 0.7 2.8 3.6 Imo 663,558 1.2 4.6 5.9 Jigawa 716,417 0.0 1.4 1.4 Kaduna 944,947 0.0 0.9 0.9 Kano 1,606,778 0.6 1.0 1.7 Katsina 986,811 0.3 1.4 1.7 Kebbi 899,591 0.0 1.4 1.4 Kogi 805,525 0.2 2.4 2.6 Kwara 563,204 0.5 3.7 4.2 Lagos 1,624,060 3.5 27.1 30.6 Nassarawa 379,486 0.2 0.5 0.7 Niger 1,537,062 0.3 7.5 7.9 Ogun 1,165,031 0.2 7.9 8.1 Ondo 955,840 0.2 2.0 2.1 Osun 803,647 0.2 3.6 3.8 Oyo 1,045,157 2.3 5.1 7.4 Plateau 643,464 1.2 3.7 5.0 Rivers 960,259 0.2 8.1 8.3 Sokoto 692,322 0.0 7.6 7.6 Taraba 405,774 0.2 0.0 0.2 Yobe 445,603 0.0 0.2 0.2 Zamfara 763,430 0.0 1.7 1.7 FCT 238,574 10.7 20.0 30.7 SECTOR Urban 8,911,505 2.1 12.6 14.7 Rural 21,630,741 0.2 2.2 2.4 Total 30,542,246 0.6 4.6 5.2
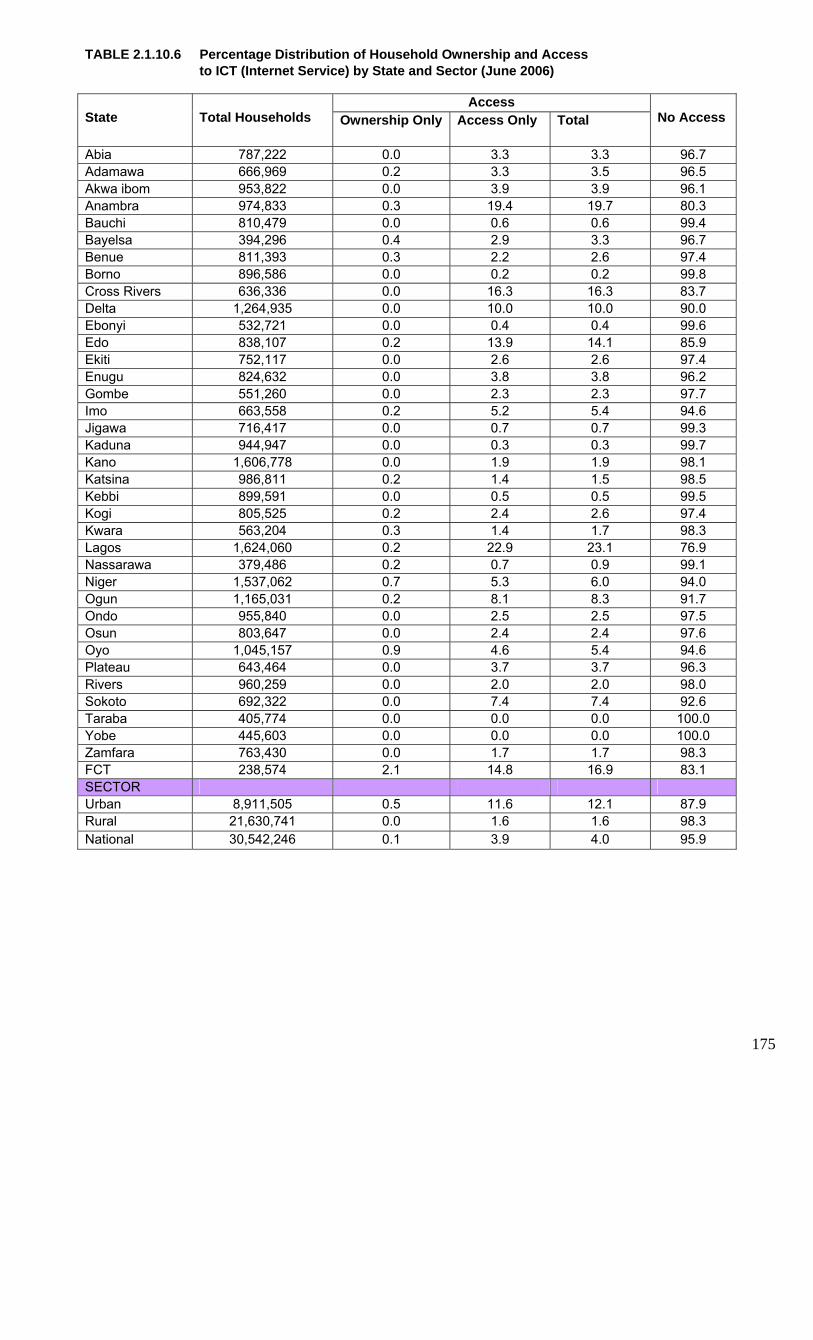
175
TABLE 2.1.10.6 Percentage Distribution of Household Ownership and Access to ICT (Internet Service) by State and Sector (June 2006)
Access
State Total Households Ownership Only Access Only Total
No Access
Abia 787,222 0.0 3.3 3.3 96.7 Adamawa 666,969 0.2 3.3 3.5 96.5 Akwa ibom 953,822 0.0 3.9 3.9 96.1 Anambra 974,833 0.3 19.4 19.7 80.3 Bauchi 810,479 0.0 0.6 0.6 99.4 Bayelsa 394,296 0.4 2.9 3.3 96.7 Benue 811,393 0.3 2.2 2.6 97.4 Borno 896,586 0.0 0.2 0.2 99.8 Cross Rivers 636,336 0.0 16.3 16.3 83.7 Delta 1,264,935 0.0 10.0 10.0 90.0 Ebonyi 532,721 0.0 0.4 0.4 99.6 Edo 838,107 0.2 13.9 14.1 85.9 Ekiti 752,117 0.0 2.6 2.6 97.4 Enugu 824,632 0.0 3.8 3.8 96.2 Gombe 551,260 0.0 2.3 2.3 97.7 Imo 663,558 0.2 5.2 5.4 94.6 Jigawa 716,417 0.0 0.7 0.7 99.3 Kaduna 944,947 0.0 0.3 0.3 99.7 Kano 1,606,778 0.0 1.9 1.9 98.1 Katsina 986,811 0.2 1.4 1.5 98.5 Kebbi 899,591 0.0 0.5 0.5 99.5 Kogi 805,525 0.2 2.4 2.6 97.4 Kwara 563,204 0.3 1.4 1.7 98.3 Lagos 1,624,060 0.2 22.9 23.1 76.9 Nassarawa 379,486 0.2 0.7 0.9 99.1 Niger 1,537,062 0.7 5.3 6.0 94.0 Ogun 1,165,031 0.2 8.1 8.3 91.7 Ondo 955,840 0.0 2.5 2.5 97.5 Osun 803,647 0.0 2.4 2.4 97.6 Oyo 1,045,157 0.9 4.6 5.4 94.6 Plateau 643,464 0.0 3.7 3.7 96.3 Rivers 960,259 0.0 2.0 2.0 98.0 Sokoto 692,322 0.0 7.4 7.4 92.6 Taraba 405,774 0.0 0.0 0.0 100.0 Yobe 445,603 0.0 0.0 0.0 100.0 Zamfara 763,430 0.0 1.7 1.7 98.3 FCT 238,574 2.1 14.8 16.9 83.1 SECTOR Urban 8,911,505 0.5 11.6 12.1 87.9 Rural 21,630,741 0.0 1.6 1.6 98.3 National 30,542,246 0.1 3.9 4.0 95.9

176
TABLE: 2.1.10.7 Distribution of Individual Ownership and Access to ICT (Radio) by State
and Sector (June 2006)
Access
State Ownership Only
Acess Only
Total No Access
Abia 45.2 45.2 90.4 9.6 Adamawa 53.4 39.1 92.6 7.4 Akwa ibom 40.6 49.7 90.2 9.8 Anambra 52.8 45.0 97.8 2.2 Bauchi 50.7 39.6 90.3 9.7 Bayelsa 58.5 38.2 96.7 3.3 Benue 51.7 38.7 90.4 9.6 Borno 45.2 36.4 81.7 18.3 Cross Rivers 50.6 38.8 89.4 10.6 Delta 48.4 38.1 86.5 13.5 Ebonyi 73.4 23.1 96.5 3.5 Edo 51.9 36.6 88.5 11.5 Ekiti 28.1 58.8 86.9 13.1 Enugu 35.0 32.1 67.1 32.9 Gombe 55.3 38.4 93.7 6.3 Imo 44.6 47.1 91.7 8.3 Jigawa 45.3 36.5 81.8 18.2 Kaduna 83.5 14.3 97.9 2.1 Kano 45.7 45.1 90.9 9.1 Katsina 81.1 14.4 95.6 4.4 Kebbi 70.3 25.4 95.7 4.3 Kogi 30.2 57.4 87.7 12.3 Kwara 48.0 46.2 94.2 5.8 Lagos 55.5 42.5 98.1 1.9 Nassarawa 70.1 25.0 95.0 5.0 Niger 49.9 44.5 94.4 5.6 Ogun 56.1 35.8 91.9 8.1 Ondo 58.5 35.8 94.3 5.7 Osun 57.8 38.1 95.8 4.2 Oyo 41.1 53.6 94.7 5.3 Plateau 54.2 36.4 90.6 9.4 Rivers 87.7 6.7 94.5 5.5 Sokoto 70.5 25.8 96.3 3.7 Taraba 56.5 27.3 83.8 16.2 Yobe 44.7 44.8 89.5 10.5 Zamfara 70.4 25.7 96.1 3.9 FCT 65.8 31.5 97.3 2.7 SECTOR Urban 60.8 34.7 95.5 4.5 Rural 54.5 36.6 91.1 8.9 Total 55.8 36.2 92.0 8.0

177
TABLE: 2.1.10.8 Distribution of Individual Ownership and Access to ICT (Television) by State and Sector (June 2006)
Access State Ownership Only Acess
Only Total
None
Abia 51.6 21.6 73.3 26.7 Adamawa 53.5 13.3 66.8 33.2 Akwa ibom 42.7 27.9 70.6 29.4 Anambra 58.2 36.7 94.9 5.1 Bauchi 50.4 8.3 58.7 41.3 Bayelsa 55.9 34.1 90.0 10.0 Benue 53.8 6.3 60.1 39.9 Borno 43.8 11.5 55.3 44.7 Cross Rivers 51.5 24.2 75.7 24.3 Delta 52.7 21.6 74.3 25.7 Ebonyi 76.8 3.2 80.0 20.0 Edo 57.5 26.7 84.2 15.8 Ekiti 30.0 33.0 63.0 37.0 Enugu 34.6 1.7 36.3 63.7 Gombe 55.4 12.2 67.6 32.4 Imo 44.3 32.9 77.2 22.8 Jigawa 46.4 5.3 51.7 48.3 Kaduna 82.5 6.0 88.5 11.5 Kano 45.9 10.1 56.0 44.0 Katsina 81.3 1.0 82.3 17.7 Kebbi 69.4 5.7 75.1 24.9 Kogi 34.3 33.4 67.7 32.3 Kwara 50.1 22.2 72.4 27.6 Lagos 70.7 26.0 96.7 3.3 Nassarawa 70.3 7.3 77.6 22.4 Niger 49.2 21.4 70.6 29.4 Ogun 55.3 19.8 75.1 24.9 Ondo 58.4 20.6 79.1 20.9 Osun 61.5 21.9 83.4 16.6 Oyo 50.6 29.7 80.3 19.7 Plateau 55.7 10.7 66.4 33.6 Rivers 88.0 3.4 91.4 8.6 Sokoto 69.3 8.0 77.3 22.7 Taraba 56.6 3.6 60.2 39.8 Yobe 44.7 13.1 57.8 42.2 Zamfara 70.1 2.7 72.8 27.2 FCT 75.2 13.5 88.7 11.3 SECTOR Urban 65.7 22.9 88.5 11.5 Rural 55.2 12.2 67.3 32.7 National 57.3 14.3 71.6 28.4

178
TABLE: 2.1.10.9 Distribution of Individual Ownership and Access to ICT (Fixed Telephone) by State
and Sector (June 2006) Access
State Ownership Only
Acess Only
Total No Access
Abia 12.4 21.6 34.0 66.0 Adamawa 20.4 30.0 50.4 49.6 Akwa ibom 17.3 17.3 34.6 65.4 Anambra 20.3 37.7 58.0 42.0 Bauchi 23.2 25.5 48.7 51.3 Bayelsa 13.2 35.3 48.5 51.5 Benue 23.4 28.4 51.8 48.2 Borno 23.9 18.8 42.7 57.3 Cross Rivers 23.2 22.8 46.0 54.0 Delta 15.6 25.2 40.8 59.2 Ebonyi 12.4 60.1 72.5 27.5 Edo 12.3 35.1 47.4 52.6 Ekiti 6.7 10.3 17.0 83.0 Enugu 15.9 20.4 36.3 63.7 Gombe 22.6 30.7 53.3 46.7 Imo 13.8 21.6 35.4 64.6 Jigawa 26.5 18.7 45.2 54.8 Kaduna 18.4 60.8 79.2 20.8 Kano 27.7 15.8 43.5 56.5 Katsina 23.1 58.1 81.0 19.0 Kebbi 20.3 43.4 63.7 36.3 Kogi 7.8 17.6 25.4 74.6 Kwara 18.5 19.5 38.0 62.0 Lagos 30.9 44.1 75.0 25.0 Nassarawa 26.1 40.6 66.7 33.3 Niger 11.5 34.9 46.4 53.6 Ogun 19.9 26.8 46.7 53.3 Ondo 18.3 30.4 48.7 51.3 Osun 19.4 29.9 49.3 50.7 Oyo 12.4 21.6 34.0 66.0 Plateau 19.4 32.7 52.1 47.9 Rivers 36.2 50.9 87.1 12.9 Sokoto 28.2 40.5 68.7 31.3 Taraba 12.6 42.3 54.9 45.1 Yobe 21.2 23.9 45.1 54.9 Zamfara 23.4 45.5 68.9 31.1 FCT 15.1 47.9 63.0 37.0 SECTOR Urban 20.9 34.7 55.6 44.4 Rural 20.3 31.7 52.0 48.0 National 18.1 34.6 52.7 47.3

179
TABLE: 2.1.10.10 Distribution of Individual Ownership and Access to ICT (Mobile Telephone) by State and Sector (June 2006)
Access State Ownership
Only Access
Only Total
No
Access
Abia 32.8 41.9 74.7 25.3 Adamawa 48.3 15.8 64.1 35.9 Akwa ibom 32.5 44.1 76.6 23.4 Anambra 40.3 54.8 95.2 4.8 Bauchi 48.7 9.0 57.7 42.3 Bayelsa 47.8 34.4 82.2 17.8 Benue 49.2 13.6 62.8 37.2 Borno 42.5 8.6 51.1 48.9 Cross Rivers 43.6 27.5 71.1 28.9 Delta 33.0 45.1 78.1 21.9 Ebonyi 72.4 14.6 87.0 13.0 Edo 37.1 51.1 88.2 11.8 Ekiti 16.4 57.6 74.0 26.0 Enugu 34.2 5.1 39.2 60.8 Gombe 52.8 12.6 65.5 34.5 Imo 34.0 41.4 75.4 24.6 Jigawa 44.5 6.9 51.4 48.6 Kaduna 78.8 9.6 88.4 11.6 Kano 42.2 14.8 57.0 43.0 Katsina 80.3 1.5 81.8 18.2 Kebbi 68.6 2.5 71.1 28.9 Kogi 20.9 53.1 74.0 26.0 Kwara 36.8 36.2 72.9 27.1 Lagos 39.3 56.5 95.8 4.2 Nassarawa 66.2 10.3 76.4 23.6 Niger 41.4 24.1 65.5 34.5 Ogun 42.8 36.7 79.6 20.4 Ondo 48.0 32.4 80.4 19.6 Osun 48.6 40.7 89.4 10.6 Oyo 30.0 52.8 82.8 17.2 Plateau 51.1 15.7 66.7 33.3 Rivers 86.3 5.4 91.7 8.3 Sokoto 68.1 10.2 78.3 21.7 Taraba 54.5 4.7 59.2 40.8 Yobe 43.6 17.7 61.3 38.7 Zamfara 68.8 3.2 72.0 28.0 FCT 52.8 33.2 86.0 14.0 SECTOR Urban 47.6 40.3 87.9 12.1 Rural 50.8 17.3 68.1 31.9 Total 50.1 22.0 72.1 27.9
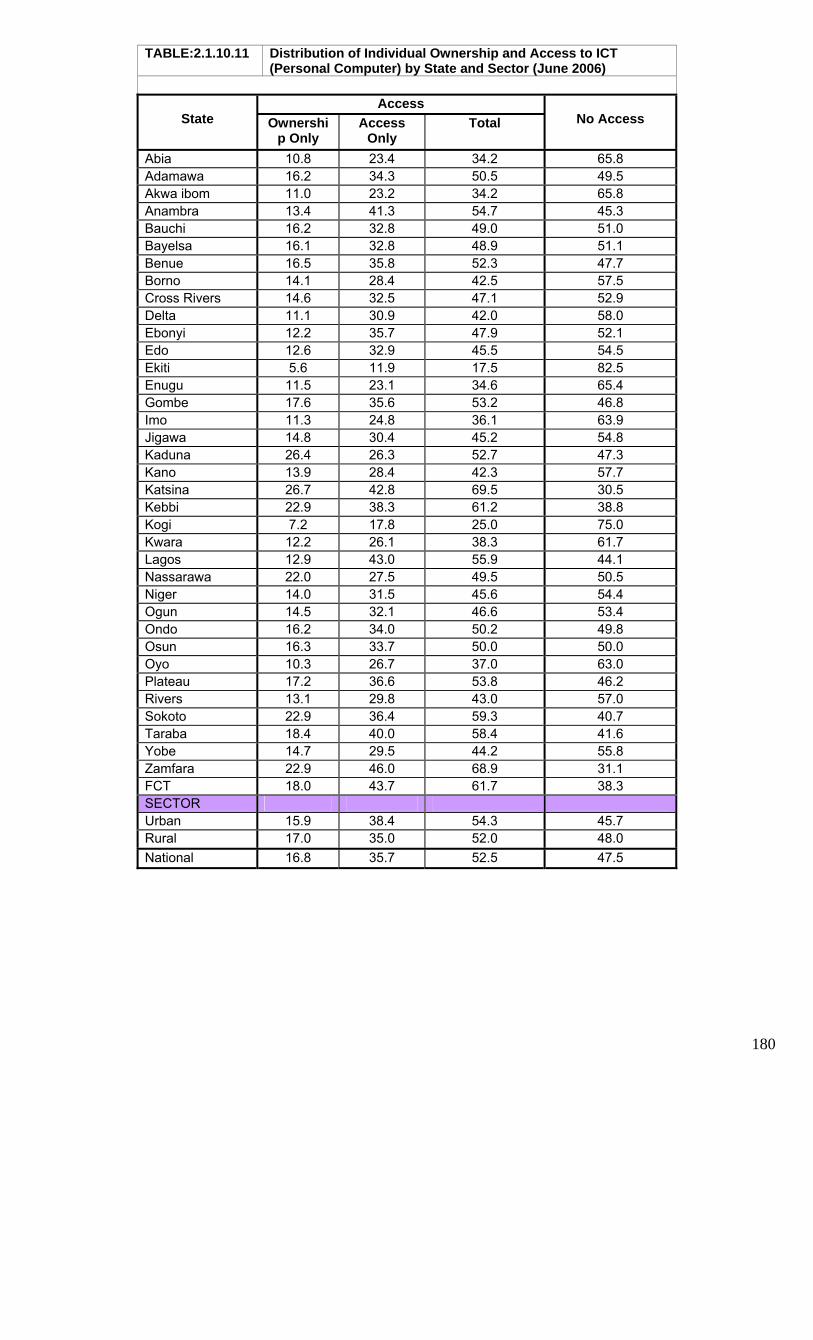
180
TABLE:2.1.10.11 Distribution of Individual Ownership and Access to ICT
(Personal Computer) by State and Sector (June 2006)
Access State Ownershi
p Only Access
Only Total
No Access
Abia 10.8 23.4 34.2 65.8 Adamawa 16.2 34.3 50.5 49.5 Akwa ibom 11.0 23.2 34.2 65.8 Anambra 13.4 41.3 54.7 45.3 Bauchi 16.2 32.8 49.0 51.0 Bayelsa 16.1 32.8 48.9 51.1 Benue 16.5 35.8 52.3 47.7 Borno 14.1 28.4 42.5 57.5 Cross Rivers 14.6 32.5 47.1 52.9 Delta 11.1 30.9 42.0 58.0 Ebonyi 12.2 35.7 47.9 52.1 Edo 12.6 32.9 45.5 54.5 Ekiti 5.6 11.9 17.5 82.5 Enugu 11.5 23.1 34.6 65.4 Gombe 17.6 35.6 53.2 46.8 Imo 11.3 24.8 36.1 63.9 Jigawa 14.8 30.4 45.2 54.8 Kaduna 26.4 26.3 52.7 47.3 Kano 13.9 28.4 42.3 57.7 Katsina 26.7 42.8 69.5 30.5 Kebbi 22.9 38.3 61.2 38.8 Kogi 7.2 17.8 25.0 75.0 Kwara 12.2 26.1 38.3 61.7 Lagos 12.9 43.0 55.9 44.1 Nassarawa 22.0 27.5 49.5 50.5 Niger 14.0 31.5 45.6 54.4 Ogun 14.5 32.1 46.6 53.4 Ondo 16.2 34.0 50.2 49.8 Osun 16.3 33.7 50.0 50.0 Oyo 10.3 26.7 37.0 63.0 Plateau 17.2 36.6 53.8 46.2 Rivers 13.1 29.8 43.0 57.0 Sokoto 22.9 36.4 59.3 40.7 Taraba 18.4 40.0 58.4 41.6 Yobe 14.7 29.5 44.2 55.8 Zamfara 22.9 46.0 68.9 31.1 FCT 18.0 43.7 61.7 38.3 SECTOR Urban 15.9 38.4 54.3 45.7 Rural 17.0 35.0 52.0 48.0 National 16.8 35.7 52.5 47.5

181
TABLE :2.1.10.12 Percentage Distribution of Individual Ownership and Access to ICT (internet) by State and Sector (June 2006)
Access
State Ownership Only
Access Only Total
No Access
Abia 0.6 1.8 2.4 97.6 Adamawa 0.8 0.6 1.4 98.6 Akwa ibom 0.9 0.9 1.8 98.2 Anambra 4.7 7.0 11.7 88.3 Bauchi 0.2 0.1 0.4 99.6 Bayelsa 0.6 0.3 0.9 99.1 Benue 0.6 1.1 1.7 98.3 Borno 0.2 0.0 0.2 99.8 Cross Rivers 1.6 1.1 2.6 97.4 Delta 4.8 3.1 7.9 92.1 Ebonyi 0.1 0.1 0.2 99.8 Edo 3.2 5.1 8.2 91.8 Ekiti 0.5 0.4 0.9 99.1 Enugu 0.0 0.0 0.0 100.0 Gombe 0.2 0.1 0.3 99.7 Imo 1.3 1.4 2.8 97.2 Jigawa 0.5 0.1 0.5 99.5 Kaduna 0.1 0.0 0.1 99.9 Kano 0.3 0.0 0.3 99.7 Katsina 0.2 0.0 0.2 99.8 Kebbi 0.1 0.0 0.2 99.8 Kogi 2.2 2.7 4.9 95.1 Kwara 0.5 0.3 0.8 99.2 Lagos 4.9 10.1 15.0 85.0 Nassarawa 0.4 0.2 0.6 99.4 Niger 2.5 1.2 3.6 96.4 Ogun 2.1 1.3 3.4 96.6 Ondo 0.5 1.1 1.6 98.4 Osun 0.5 0.3 0.7 99.3 Oyo 2.5 2.6 5.1 94.9 Plateau 0.9 0.4 1.3 98.7 Rivers 0.2 0.0 0.2 99.8 Sokoto 1.8 0.3 2.1 97.9 Taraba 0.1 0.0 0.1 99.9 Yobe 0.0 0.1 0.2 99.8 Zamfara 0.4 0.0 0.4 99.6 FCT 3.2 1.8 5.1 94.9 SECTOR Urban 2.9 2.9 5.8 94.2 Rural 0.5 0.5 1.0 99.0 National 1.0 0.9 1.9 98.1
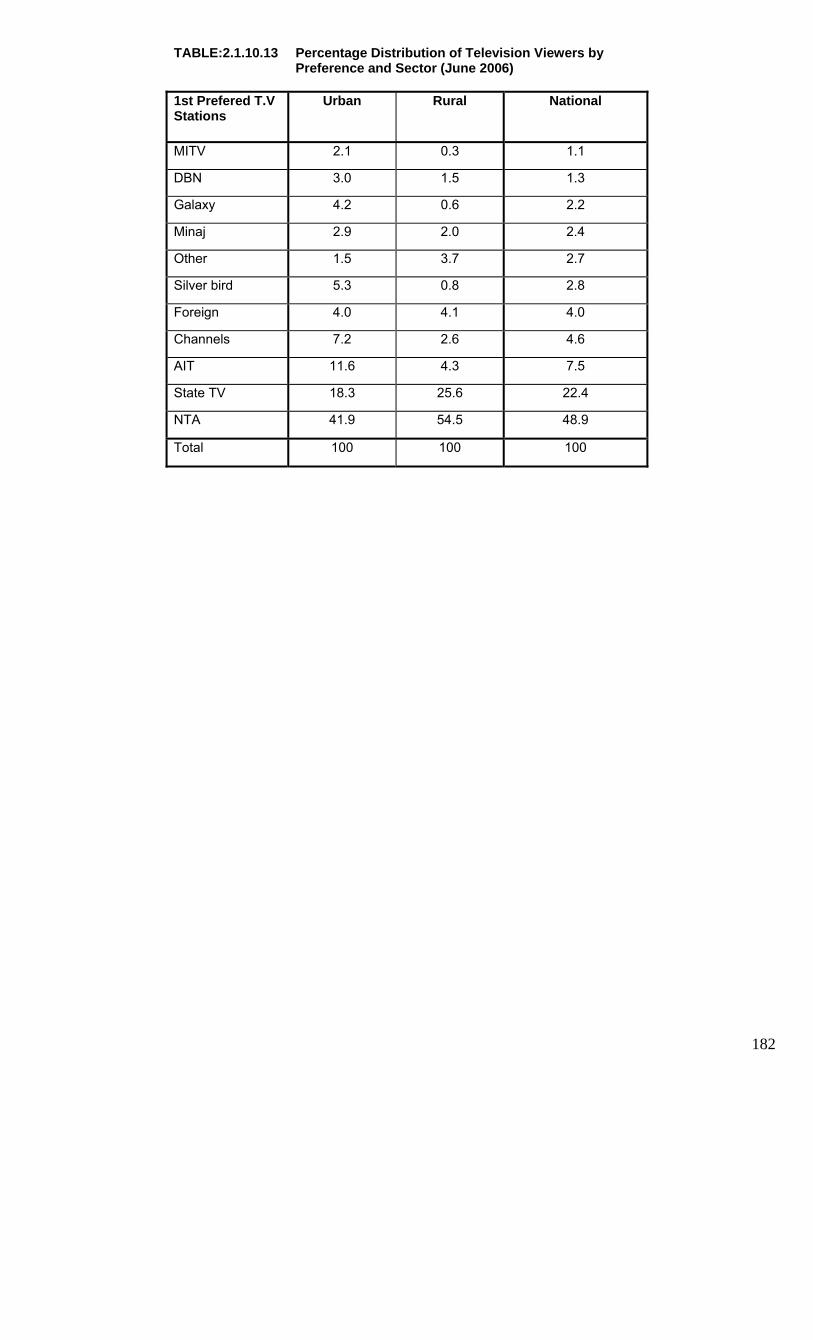
182
TABLE:2.1.10.13 Percentage Distribution of Television Viewers by
Preference and Sector (June 2006)
1st Prefered T.V Stations
Urban Rural National
MITV 2.1 0.3 1.1
DBN 3.0 1.5 1.3
Galaxy 4.2 0.6 2.2
Minaj 2.9 2.0 2.4
Other 1.5 3.7 2.7
Silver bird 5.3 0.8 2.8
Foreign 4.0 4.1 4.0
Channels 7.2 2.6 4.6
AIT 11.6 4.3 7.5
State TV 18.3 25.6 22.4
NTA 41.9 54.5 48.9
Total 100 100 100
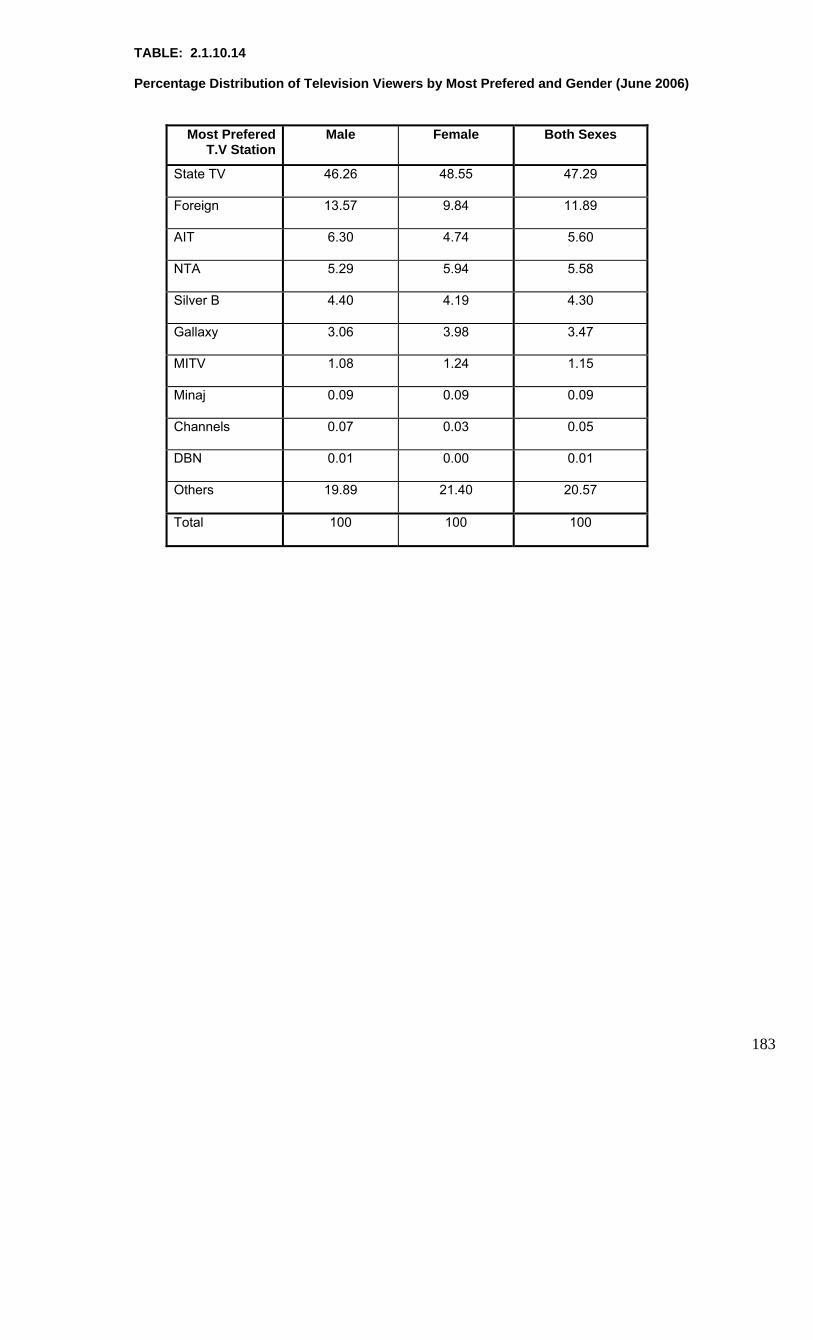
183
TABLE: 2.1.10.14
Percentage Distribution of Television Viewers by Most Prefered and Gender (June 2006)
Most Prefered T.V Station
Male Female Both Sexes
State TV 46.26 48.55 47.29
Foreign 13.57 9.84 11.89
AIT 6.30 4.74 5.60
NTA 5.29 5.94 5.58
Silver B 4.40 4.19 4.30
Gallaxy 3.06 3.98 3.47
MITV 1.08 1.24 1.15
Minaj 0.09 0.09 0.09
Channels 0.07 0.03 0.05
DBN 0.01 0.00 0.01
Others 19.89 21.40 20.57
Total 100 100 100

184
TABLE 2.1.10.15 Distribution of Persons by Type of ICT Equipments Owned and State (June 2006)
STATE Radio Television Mobile Phone
Fixed line phone
Personal Computer
Internet service
Abia 595,905 487,388 425,280 536 2,291 2,248 Adamawa 242,287 172,025 203,364 18,320 9,913 2,222 Akwa ibom 448,958 344,670 253,120 5,071 496 2,309 Anambra 910,898 760,189 454,063 29,022 6,664 3,046 Bauchi 94,846 79,087 81,892 1,286 6,712 2,330 Bayelsa 252,199 134,725 197,519 10,695 7,295 1,602 Benue 244,392 176,441 113,388 24,260 19,897 2,693 Borno 139,788 67,384 90,567 4,916 3,648 2,782 Cross Rivers 94,186 75,992 100,067 803 5,825 1,309 Delta 744,329 636,873 509,976 81,181 55,649 3,019 Ebonyi 92,771 88,043 53,105 13,148 11,990 824 Edo 743,452 648,785 478,534 43,874 56,699 2,745 Ekiti 398,402 279,305 272,657 2,603 14,570 2,067 Enugu 4,196 3,115 111,628 1,939 1,081 1,091 Gombe 75,365 63,833 90,274 16,857 18,337 1,279 Imo 557,459 370,933 397,168 15,449 14,376 3,110 Jigawa 102,971 63,182 52,057 4,664 6,670 2,520 Kaduna 313,581 223,862 251,902 12,688 4,945 3,241 Kano 538,735 362,448 376,435 38,647 8,788 6,419 Katsina 118,115 82,976 84,123 9,267 8,303 2,806 Kebbi 91,627 49,357 74,132 4,851 9,114 2,090 Kogi 482,085 372,712 296,537 16,709 10,009 2,427 Kwara 456,209 392,027 308,315 1,463 12,236 1,954 Lagos 2,802,297 2,625,424 1,549,476 91,858 27,577 5,465 Nassarawa 90,705 68,245 71,675 1,997 5,572 1,095 Niger 379,620 266,232 300,596 8,404 8,903 3,228 Ogun 717,915 536,350 528,222 14,992 15,450 3,738 Ondo 522,835 392,984 366,276 1,364 13,407 2,835 Osun 493,163 416,630 294,454 1,652 496 2,373 Oyo 1,338,780 1,226,408 679,665 49,039 21,222 4,157 Plateau 242,544 216,185 138,364 5,943 7,440 1,960 Rivers 41,076 193,115 199,835 173,877 177,554 1,707 Sokoto 158,684 98,301 172,008 47,598 39,685 3,608 Taraba 80,461 57,970 72,022 2,094 3,632 1,113 Yobe 59,572 33,796 73,479 4,135 1,378 1,343 Zamfara 80,652 50,955 70,901 7,605 3,762 2,320 FCT 357,995 330,129 209,632 18,045 6,348 1,056 Total Persons 15,109,054 12,448,076 10,002,710 786,852 627,934 92,131

185
TABLE 2.1.10.16 Percentage Distribution of Owners of ICT Equipments by Number Owned (June 2006)
Number Owned Radio Television Mobile phone
Fixed Phone
Personal Computer
Internet Service
1 97.5 96.2 94.7 92.9 87.6 93.7
2 1.6 2.6 3.6 3.1 0.0 5.0
3 0.3 0.4 0.1 0.0 0.0 0.9
4 0.1 0.3 0.1 2.3 8.8 0.2
5+ 0.5 0.5 1.6 1.7 3.6 0.2
Total Persons 15,109,054 12,448,076 10,002,710 786,852 627,934 92,131

186
TABLE 2.1.10.17 Percentage Distribution of Persons by Source of Access
to ICT Equipments (June 2006)
Source of Access Radio Television Mobile Phone
Fixed Phone
Personal Computer
Internet service
Owned 35.4 39.5 32.5 8.1 11.8 1.9
Family member/friend/neighbour 62.9 53.8 29.5 7.5 6.4 2.4
Umbrella center 0.1 0.3 24.3 23.3 9.6 0.1 Workplace 0.1 0.1 0.2 5.0 0.4 1.9
Business center 0.1 0.7 9.6 20.4 8.6 39.4
Others 1.5 5.6 4.0 35.7 63.2 54.3
Total Persons 42,725,292 31,485,209 30,786,519 9,722,973 5,336,858 4,939,630

187
TABLE 2.2.1.1 Number of persons engaged in crop farming by type and sex (in thousand) 2006.
No of Persons 1st Quarter: January -
March 2nd Quarter: April -
June 3rd Quarter: July -
September 4th Quarter: October -
December No
engaged No of days
No engaged
No of days
No engaged
No of days
No engaged
No of days
All Persons Total 48,344 256,137 50,608 259,632 43,551 222,287 32,566 175,033 Male 30,617 168,044 36,048 190,053 29,625 158,965 21,676 123,404 Female 17,728 88,092 14,560 69,579 13,926 63,322 10,890 51,629
Working Proprietors Total 11,116 114,824 12,152 121,859 10,367 106,875 8,756 86,269 Male 8,168 93,565 9,350 102,185 7,894 88,782 6,294 70,773 Female 2,949 21,259 2,802 19,674 2,472 18,093 2,462 15,496
Unpaid Family Members Total 22,905 119,057 19,709 110,298 18,349 94,866 15,876 76,544 Male 11,452 59,529 12,483 65,862 11,603 55,342 9,995 43,430 Female 11,452 59,529 7,227 44,436 6,747 39,523 5,880 33,115
Apprentice Total 885 1,482 1,806 1,802 1,294 1,431 873 709 Male 552 1,082 1,246 1,212 734 1,105 590 566 Female 333 399 561 589 561 326 283 143
Paid Employees Total 13,439 20,774 16,940 25,673 13,540 19,115 7,060 11,511 Male 10,445 13,869 12,969 20,793 9,394 13,735 4,796 8,636 Female 2,994 6,905 3,971 4,880 4,147 5,380 2,264 2,875

188
TABLE 2.2.1.3 Farm gate Prices in Naira per Kilogram
Staples 2005/06
Maize 19.73
Millet 19.79
Guinea Corn 18.75
Rice 25.84
Cotton 33.44
Beans 22.26
Cassava 20.01
Yam 20.02
Cocoyam 16.71
Melon 39.68
Groundnut 24.09

189
TABLE 2.2.1.4 Distribution of Crop Famers by Market Channel and State, 2006
State On the farm
In open market
In cooperative society
Direct to Industry Others Total
Abia 31,172 228,944 7,264 1,108 7,329 275,816Adamawa 9,596 101,688 8,497 4,431 1,477 125,689Akwa Ibom 53,113 243,283 3,340 7,976 307,712Anambra 7,152 165,247 7,710 2,415 182,524Bauchi 15,949 342,194 9,632 8,131 6,074 381,980Bayelsa 11,689 28,949 1,344 1,258 10,613 53,853Benue 124,786 432,736 10,239 54,050 621,812Borno 5,363 207,011 14,483 4,739 4,739 236,335Cross River 40,778 98,032 2,079 891 12,795 154,575Delta 66,330 160,837 1,798 7,883 236,847Ebonyi 27,903 153,407 19,732 15,263 32,375 248,681Edo 59,509 115,592 5,568 2,422 157 183,250Ekiti 47,052 82,153 10,634 1,985 2,143 143,967Enugu 52,038 220,623 6,342 1,123 7,798 287,923Gombe 38,689 2,351 41,040Imo 24,443 310,349 7,289 9,224 30,541 381,846Jigawa 19,770 154,291 10,376 6,490 5,789 196,715Kaduna 1,739 293,936 9,679 1,531 3,192 310,077Kano 49,582 622,456 17,248 15,293 4,996 709,575Katsina 2,613 403,743 24,277 0 23,730 454,363Kebbi 19,047 156,326 6,504 1,420 1,420 184,716Kogi 35,176 167,222 821 0 16,857 220,077Kwara 71,466 93,619 1,149 1,251 3,651 171,136Lagos 9,274 64,916 0 0 9,274 83,464Nassarawa 26,262 149,414 4,269 4,587 9,929 194,462Niger 22,410 223,628 2,237 940 17,515 266,730Ogun 37,684 65,651 2,365 3,222 3,976 112,898Ondo 95,445 81,603 263 0 756 178,067Osun 49,215 96,965 1,446 419 5,442 153,487Oyo 74,194 123,819 5,841 4,899 4,899 213,653Plateau 19,343 248,965 8,571 9,377 16,768 303,023Rivers 16,655 275,486 14,232 1,251 307,624Sokoto 22,527 257,331 9,151 15,839 304,848Taraba 27,868 158,990 9,646 7,526 9,250 213,281Yobe 4,517 130,676 551 551 551 136,846Zamfara 7,007 222,145 1,800 1,263 1,623 233,838FCT 7,603 43,805 756 756 52,920Nigeria 1,196,269 6,964,721 248,728 112,513 343,416 8,865,647Percentage of Total 13.5 78.6 2.8 1.3 3.9 100.0
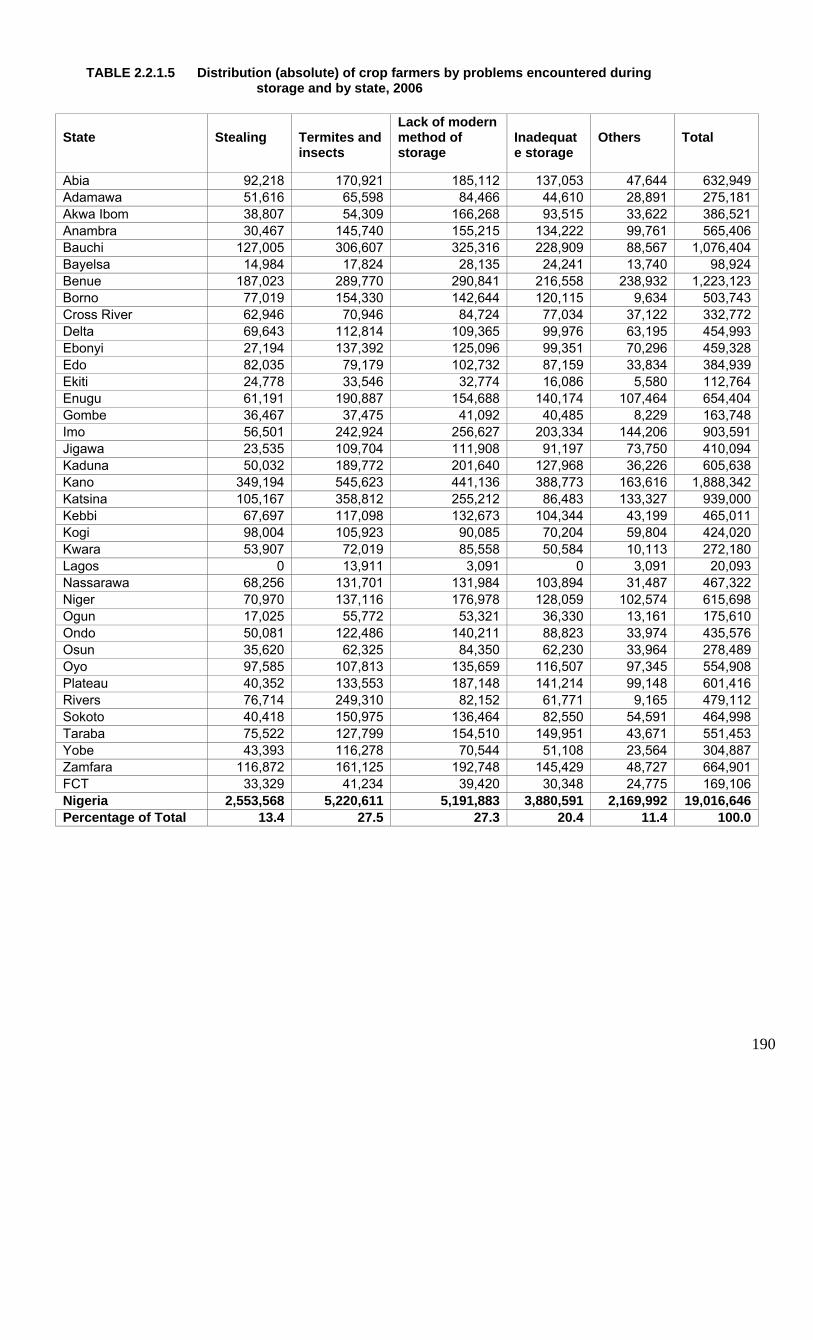
190
TABLE 2.2.1.5 Distribution (absolute) of crop farmers by problems encountered during storage and by state, 2006
State
Stealing
Termites and insects
Lack of modern method of storage
Inadequate storage
Others
Total
Abia 92,218 170,921 185,112 137,053 47,644 632,949Adamawa 51,616 65,598 84,466 44,610 28,891 275,181Akwa Ibom 38,807 54,309 166,268 93,515 33,622 386,521Anambra 30,467 145,740 155,215 134,222 99,761 565,406Bauchi 127,005 306,607 325,316 228,909 88,567 1,076,404Bayelsa 14,984 17,824 28,135 24,241 13,740 98,924Benue 187,023 289,770 290,841 216,558 238,932 1,223,123Borno 77,019 154,330 142,644 120,115 9,634 503,743Cross River 62,946 70,946 84,724 77,034 37,122 332,772Delta 69,643 112,814 109,365 99,976 63,195 454,993Ebonyi 27,194 137,392 125,096 99,351 70,296 459,328Edo 82,035 79,179 102,732 87,159 33,834 384,939Ekiti 24,778 33,546 32,774 16,086 5,580 112,764Enugu 61,191 190,887 154,688 140,174 107,464 654,404Gombe 36,467 37,475 41,092 40,485 8,229 163,748Imo 56,501 242,924 256,627 203,334 144,206 903,591Jigawa 23,535 109,704 111,908 91,197 73,750 410,094Kaduna 50,032 189,772 201,640 127,968 36,226 605,638Kano 349,194 545,623 441,136 388,773 163,616 1,888,342Katsina 105,167 358,812 255,212 86,483 133,327 939,000Kebbi 67,697 117,098 132,673 104,344 43,199 465,011Kogi 98,004 105,923 90,085 70,204 59,804 424,020Kwara 53,907 72,019 85,558 50,584 10,113 272,180Lagos 0 13,911 3,091 0 3,091 20,093Nassarawa 68,256 131,701 131,984 103,894 31,487 467,322Niger 70,970 137,116 176,978 128,059 102,574 615,698Ogun 17,025 55,772 53,321 36,330 13,161 175,610Ondo 50,081 122,486 140,211 88,823 33,974 435,576Osun 35,620 62,325 84,350 62,230 33,964 278,489Oyo 97,585 107,813 135,659 116,507 97,345 554,908Plateau 40,352 133,553 187,148 141,214 99,148 601,416Rivers 76,714 249,310 82,152 61,771 9,165 479,112Sokoto 40,418 150,975 136,464 82,550 54,591 464,998Taraba 75,522 127,799 154,510 149,951 43,671 551,453Yobe 43,393 116,278 70,544 51,108 23,564 304,887Zamfara 116,872 161,125 192,748 145,429 48,727 664,901FCT 33,329 41,234 39,420 30,348 24,775 169,106Nigeria 2,553,568 5,220,611 5,191,883 3,880,591 2,169,992 19,016,646Percentage of Total 13.4 27.5 27.3 20.4 11.4 100.0

191
TABLE 2.2.1.6. Distribution (absolute) of crop farmers by problems encountered during production process and by state, 2006 State
Lack of personnel
Lack of fund
Lack of modern methods/ equip-ment
Lack of encouragement from govern-ment
Lack of credit facilities
Far distance
Lack of Infrastructure
Others
Total
Abia 106,990 220,810 191,417 209,160 219,169 97,855 152,048 48,284 1,245,733 Adamawa 38,037 93,637 88,784 77,030 93,952 39,179 65,226 21,074 516,919 Akwa Ibom 67,245 229,749 110,937 98,500 194,806 32,576 129,555 27,292 890,659 Anambra 29,910 181,409 157,537 143,604 146,112 63,442 143,418 89,079 954,512 Bauchi 198,718 339,303 333,948 324,974 326,175 211,328 328,556 102,838 2,165,840 Bayelsa 9,215 29,393 29,576 28,366 29,576 16,028 28,003 13,130 183,285 Benue 183,878 411,478 365,369 412,794 410,161 220,015 327,893 215,108 2,546,695 Borno 75,160 197,362 139,404 181,884 159,097 84,427 125,932 8,464 971,730 Cross River 43,995 101,788 90,775 92,087 96,244 76,137 94,091 37,072 632,189 Delta 63,437 159,169 118,285 138,398 150,447 81,015 136,791 55,520 903,062 Ebonyi 61,975 160,046 138,752 136,996 139,102 109,482 126,174 85,964 958,492 Edo 66,291 114,344 93,682 93,179 106,203 64,036 90,253 27,636 655,624 Ekiti 23,366 74,166 28,837 18,930 54,516 33,526 28,096 1,793 263,230 Enugu 85,719 265,318 180,641 227,491 218,115 111,207 167,290 105,502 1,361,282 Gombe 33,264 35,537 36,312 36,028 36,028 29,117 32,037 8,849 247,172 Imo 50,966 296,656 266,624 266,589 302,548 168,527 288,093 131,396 1,771,398 Jigawa 39,459 158,237 125,428 120,280 128,432 87,852 121,182 69,885 850,754 Kaduna 94,718 306,054 234,822 224,130 273,695 140,000 184,271 37,480 1,495,170 Kano 295,061 593,217 555,181 522,401 511,974 359,534 430,307 123,472 3,391,147 Katsina 168,163 428,856 302,738 303,757 296,413 81,891 193,697 120,237 1,895,751 Kebbi 129,115 152,211 149,003 141,018 133,655 102,451 118,456 44,623 970,531 Kogi 70,155 171,691 110,687 140,228 155,360 81,212 104,477 52,953 886,765 Kwara 9,969 93,127 75,609 77,189 92,942 57,640 85,517 9,784 501,777 Lagos 3,091 34,004 38,641 23,184 37,095 3,091 20,093 3,091 162,291 Nassarawa 81,488 146,513 147,503 150,393 148,423 122,137 128,942 49,836 975,235 Niger 111,321 219,767 210,342 188,102 215,249 130,469 211,758 138,269 1,425,278 Ogun 37,341 102,812 79,284 78,221 96,335 66,088 77,090 15,560 552,732 Ondo 106,342 165,503 157,912 139,777 159,472 96,864 158,034 85,426 1,069,329 Osun 37,732 109,951 86,195 91,904 110,161 39,140 62,354 36,400 573,836 Oyo 123,442 191,842 191,277 189,644 188,722 129,891 165,964 142,803 1,323,585 Plateau 106,574 227,877 229,307 234,307 237,504 157,648 219,321 103,065 1,515,603 Rivers 21,836 238,409 53,959 60,289 84,913 39,503 53,002 35,822 587,732 Sokoto 53,866 249,521 150,184 165,534 200,254 76,514 120,457 53,190 1,069,520 Taraba 87,301 158,172 153,889 139,080 153,766 117,219 154,703 43,650 1,007,780 Yobe 46,732 120,165 68,925 59,471 77,833 53,340 50,775 24,097 501,337 Zamfara 153,397 191,902 167,004 168,346 164,638 135,720 153,039 71,745 1,205,792 FCT 37,865 44,064 41,083 32,594 42,617 38,383 42,811 22,572 301,990 Nigeria 2,953,131 7,014,060 5,699,853 5,735,857 6,191,704 3,554,482 5,119,706 2,262,963 38,531,756 Percentage of Total
7.7 18.2 14.8 14.9 16.1 9.2 13.3 5.9 100.0

192
TABLE 2.2.1.7a. Distribution (absolute) of crop farmers by access to any ICT facility by state,
2006 Radio Television Telephone (fixed)
S/N State Yes No Yes No Yes No
1 Abia 216,725 21,766 129,609 108,364 3,152 232,5322 Adamawa 171,767 9,956 46,328 137,245 1,081 183,9483 Akwa Ibom 89,303 6,331 62,160 30,108 3,365 84,6924 Anambra 184,475 5,202 152,800 36,876 11,890 175,8365 Bauchi 347,277 20,296 107,691 285,167 0 397,2516 Bayelsa 5,701 1,046 4,744 2,004 0 5,7497 Benue 391,825 49,901 51,396 386,784 0 439,6518 Borno 306,923 101,338 48,393 362,869 1,847 401,8079 Cross River 14,181 2,722 11,557 5,346 0 16,903
10 Delta 17,114 5,854 15,524 7,445 0 22,96811 Ebonyi 115,257 39,829 25,341 129,542 0 156,58212 Edo 9,760 2,202 9,089 2,873 0 11,96213 Ekiti 83,569 4,736 40,813 47,492 0 87,55814 Enugu 179,438 86,639 29,979 237,311 3,611 265,56115 Gombe 70,571 0 15,166 56,826 0 71,99216 Imo 269,847 55,810 179,249 145,775 3,662 315,29817 Jigawa 308,322 7,171 43,425 269,904 0 313,32918 Kaduna 425,891 96,819 159,307 397,814 2,958 556,88719 Kano 1,149,332 39,709 190,987 998,054 12,013 1,177,02920 Katsina 682,249 124,609 97,773 709,085 24,187 782,67121 Kebbi 249,043 28,206 42,336 234,125 3,015 273,44522 Kogi 136,433 39,070 51,655 105,759 904 155,04823 Kwara 90,358 10,646 34,317 66,686 0 100,81924 Lagos 66,462 0 60,279 6,183 46,369 20,09325 Nassarawa 143,694 5,024 16,899 132,656 1,734 146,65426 Niger 227,193 5,941 74,768 158,367 9,995 222,89427 Ogun 97,620 13,058 48,814 61,864 0 110,19828 Ondo 157,193 6,771 94,895 69,069 973 162,83329 Osun 107,782 6,526 68,176 43,393 0 111,72130 Oyo 164,106 18,026 118,297 63,836 1,801 181,83931 Plateau 196,348 67,144 28,327 235,165 3,755 259,48232 Rivers 15,637 0 11,809 3,828 0 15,63733 Sokoto 485,062 9,875 185,236 306,852 5,819 470,09234 Taraba 118,719 41,337 20,752 139,304 1,305 160,06935 Yobe 153,096 20,852 32,038 0 4,334 168,84336 Zamfara 403,720 15,623 36,365 363,859 0 392,20537 FCT 41,256 5,400 26,978 19,678 4,406 42,250
Nigeria 7,893,248 975,436 2,373,273 6,367,506 152,174 8,694,328Percentage of Total 58.8 2.0 17.7 13.1 1.1 17.9

193
TABLE 2.2.1.7a Distribution (absolute) of crop farmers by access to any ICT
Facility by state, 2006 (Contd)
Telephone (mobile) Personal computer (Pc) Internet STATE Yes No Yes No Yes No
Abia 76,448 160,713 123 237,038 0 237,161Adamawa 42,579 141,207 2,522 181,390 1,315 183,713Akwa Ibom 66,323 27,167 5,259 84,692 3,390 86,561Anambra 143,511 42,171 8,731 180,945 9,196 180,480Bauchi 102,686 284,513 345 396,905 0 397,251Bayelsa 4,465 1,950 0 6,748 0 6,748Benue 47,336 394,390 0 439,651 3,257 436,395Borno 77,877 325,777 1,006 402,648 0 400,883Cross River 10,840 6,063 0 16,903 0 16,903Delta 20,260 2,708 1,694 21,274 0 22,968Ebonyi 54,653 106,140 4,711 151,871 0 156,582Edo 9,760 2,202 0 11,962 0 12,102Ekiti 42,328 45,977 448 87,856 537 87,768Enugu 67,118 194,528 2,701 266,471 2,549 266,623Gombe 12,350 59,642 0 71,992 0 71,992Imo 193,247 131,226 9,437 316,220 7,351 318,306Jigawa 73,150 240,180 2,804 310,525 0 313,329Kaduna 176,175 387,953 2,284 561,843 2,284 561,843Kano 273,881 915,160 0 1,189,041 0 1,189,041Katsina 134,189 668,898 37,439 769,419 39,163 767,695Kebbi 10,536 265,925 4,698 271,762 0 276,461Kogi 70,763 86,355 0 155,952 197 155,952Kwara 47,507 52,738 103 100,901 0 101,004Lagos 63,371 3,091 3,091 63,371 0 66,462Nassarawa 17,984 130,876 59 150,463 0 151,041Niger 57,049 177,533 5,809 228,772 2,331 232,250Ogun 54,161 56,517 1,817 108,862 1,302 109,376Ondo 111,618 52,346 3,113 160,851 3,113 160,851Osun 87,156 25,554 6,736 106,241 0 112,178Oyo 115,858 66,275 3,538 180,102 837 182,803Plateau 32,416 231,076 1,651 261,840 1,651 261,840Rivers 12,569 3,067 8,742 6,895 0 15,637Sokoto 299,077 193,011 17,432 473,159 14,463 471,589Taraba 18,634 142,153 4,097 157,482 1,205 160,375Yobe 37,625 134,573 0 172,332 955 171,377Zamfara 14,561 383,693 0 393,592 0 393,592FCT 22,205 24,451 0 46,656 0 46,656Nigeria 2,702,264 6,167,799 140,391 8,744,630 95,095 8,783,788Percentage of Total 20.1 12.7 1.0 18.0 0.7 18.1
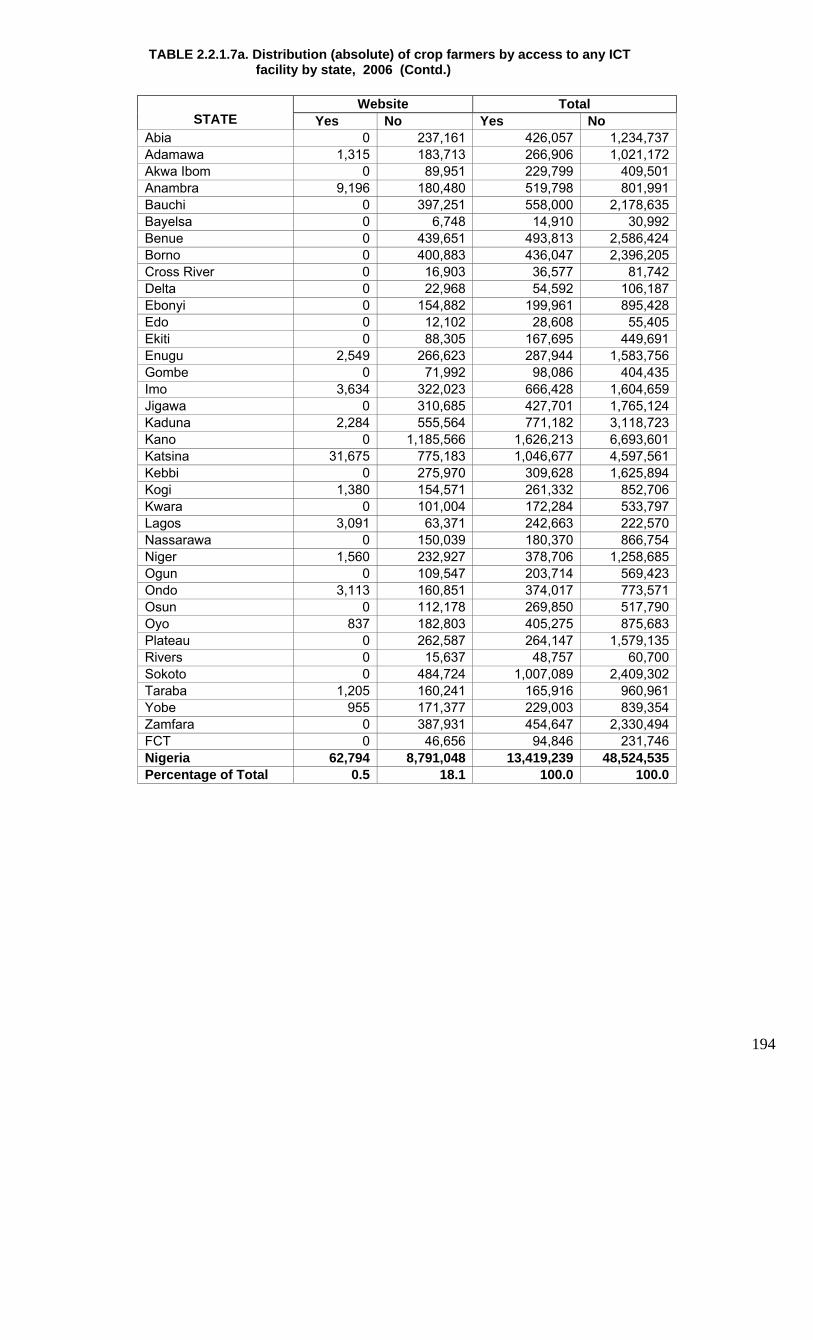
194
TABLE 2.2.1.7a. Distribution (absolute) of crop farmers by access to any ICT
facility by state, 2006 (Contd.)
Website Total STATE Yes No Yes No
Abia 0 237,161 426,057 1,234,737Adamawa 1,315 183,713 266,906 1,021,172Akwa Ibom 0 89,951 229,799 409,501Anambra 9,196 180,480 519,798 801,991Bauchi 0 397,251 558,000 2,178,635Bayelsa 0 6,748 14,910 30,992Benue 0 439,651 493,813 2,586,424Borno 0 400,883 436,047 2,396,205Cross River 0 16,903 36,577 81,742Delta 0 22,968 54,592 106,187Ebonyi 0 154,882 199,961 895,428Edo 0 12,102 28,608 55,405Ekiti 0 88,305 167,695 449,691Enugu 2,549 266,623 287,944 1,583,756Gombe 0 71,992 98,086 404,435Imo 3,634 322,023 666,428 1,604,659Jigawa 0 310,685 427,701 1,765,124Kaduna 2,284 555,564 771,182 3,118,723Kano 0 1,185,566 1,626,213 6,693,601Katsina 31,675 775,183 1,046,677 4,597,561Kebbi 0 275,970 309,628 1,625,894Kogi 1,380 154,571 261,332 852,706Kwara 0 101,004 172,284 533,797Lagos 3,091 63,371 242,663 222,570Nassarawa 0 150,039 180,370 866,754Niger 1,560 232,927 378,706 1,258,685Ogun 0 109,547 203,714 569,423Ondo 3,113 160,851 374,017 773,571Osun 0 112,178 269,850 517,790Oyo 837 182,803 405,275 875,683Plateau 0 262,587 264,147 1,579,135Rivers 0 15,637 48,757 60,700Sokoto 0 484,724 1,007,089 2,409,302Taraba 1,205 160,241 165,916 960,961Yobe 955 171,377 229,003 839,354Zamfara 0 387,931 454,647 2,330,494FCT 0 46,656 94,846 231,746Nigeria 62,794 8,791,048 13,419,239 48,524,535Percentage of Total 0.5 18.1 100.0 100.0
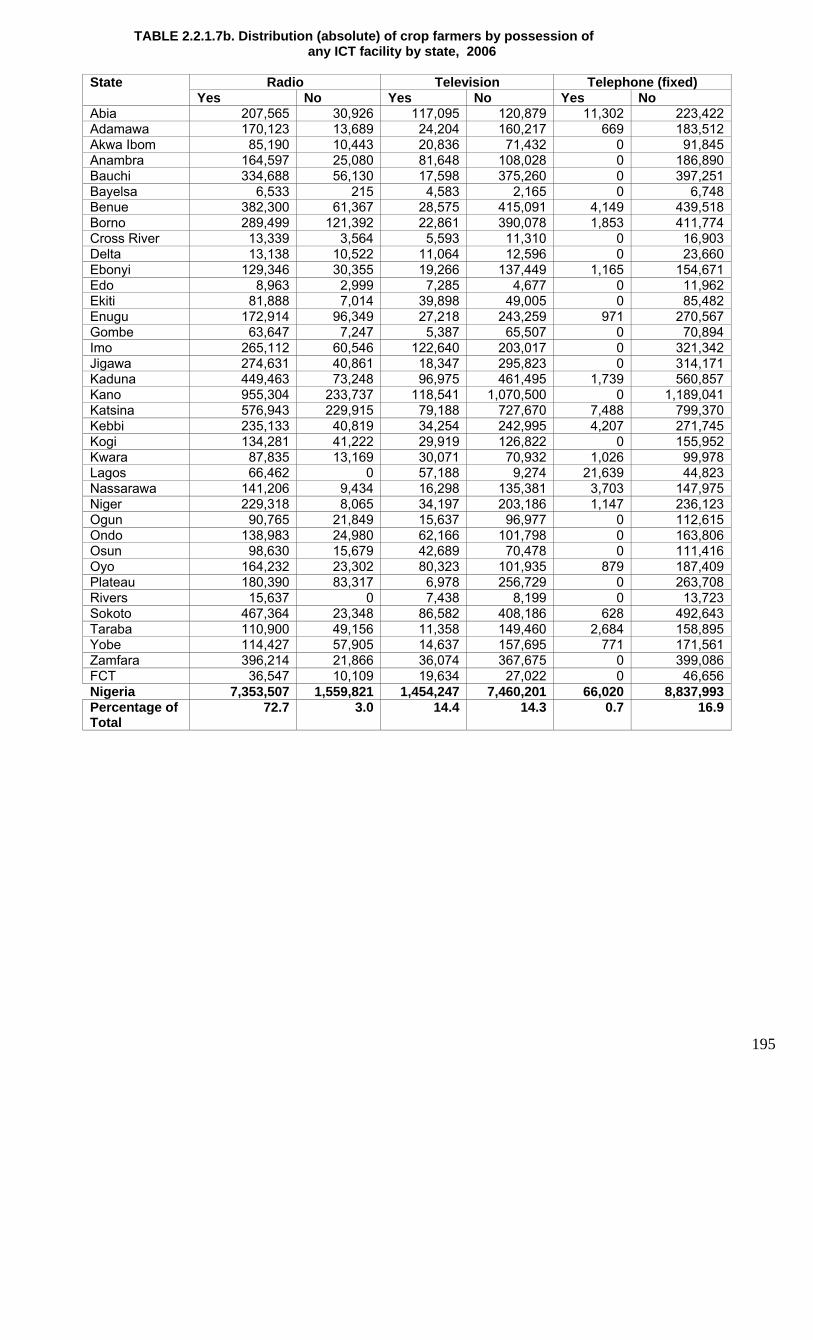
195
TABLE 2.2.1.7b. Distribution (absolute) of crop farmers by possession of any ICT facility by state, 2006
Radio Television Telephone (fixed) State Yes No Yes No Yes No
Abia 207,565 30,926 117,095 120,879 11,302 223,422Adamawa 170,123 13,689 24,204 160,217 669 183,512Akwa Ibom 85,190 10,443 20,836 71,432 0 91,845Anambra 164,597 25,080 81,648 108,028 0 186,890Bauchi 334,688 56,130 17,598 375,260 0 397,251Bayelsa 6,533 215 4,583 2,165 0 6,748Benue 382,300 61,367 28,575 415,091 4,149 439,518Borno 289,499 121,392 22,861 390,078 1,853 411,774Cross River 13,339 3,564 5,593 11,310 0 16,903Delta 13,138 10,522 11,064 12,596 0 23,660Ebonyi 129,346 30,355 19,266 137,449 1,165 154,671Edo 8,963 2,999 7,285 4,677 0 11,962Ekiti 81,888 7,014 39,898 49,005 0 85,482Enugu 172,914 96,349 27,218 243,259 971 270,567Gombe 63,647 7,247 5,387 65,507 0 70,894Imo 265,112 60,546 122,640 203,017 0 321,342Jigawa 274,631 40,861 18,347 295,823 0 314,171Kaduna 449,463 73,248 96,975 461,495 1,739 560,857Kano 955,304 233,737 118,541 1,070,500 0 1,189,041Katsina 576,943 229,915 79,188 727,670 7,488 799,370Kebbi 235,133 40,819 34,254 242,995 4,207 271,745Kogi 134,281 41,222 29,919 126,822 0 155,952Kwara 87,835 13,169 30,071 70,932 1,026 99,978Lagos 66,462 0 57,188 9,274 21,639 44,823Nassarawa 141,206 9,434 16,298 135,381 3,703 147,975Niger 229,318 8,065 34,197 203,186 1,147 236,123Ogun 90,765 21,849 15,637 96,977 0 112,615Ondo 138,983 24,980 62,166 101,798 0 163,806Osun 98,630 15,679 42,689 70,478 0 111,416Oyo 164,232 23,302 80,323 101,935 879 187,409Plateau 180,390 83,317 6,978 256,729 0 263,708Rivers 15,637 0 7,438 8,199 0 13,723Sokoto 467,364 23,348 86,582 408,186 628 492,643Taraba 110,900 49,156 11,358 149,460 2,684 158,895Yobe 114,427 57,905 14,637 157,695 771 171,561Zamfara 396,214 21,866 36,074 367,675 0 399,086FCT 36,547 10,109 19,634 27,022 0 46,656Nigeria 7,353,507 1,559,821 1,454,247 7,460,201 66,020 8,837,993Percentage of Total
72.7 3.0 14.4 14.3 0.7 16.9

196
TABLE 2.2.1.7b. Distribution (absolute) of crop farmers by possession of
any ICT facility by state, 2006 (Contd)
Telephone (mobile) Personal computer (Pc)
Internet STATE
Yes No Yes No Yes No Abia 70,346 166,816 123 237,038 0 237,161Adamawa 25,056 159,537 793 183,389 234 183,948Akwa Ibom 25,497 67,993 0 91,845 0 91,845Anambra 65,764 123,912 0 189,676 0 188,190Bauchi 19,881 367,319 1,707 395,544 0 397,251Bayelsa 3,252 3,495 0 6,748 0 6,748Benue 22,887 420,780 8,164 435,502 8,164 435,502Borno 14,330 399,297 0 410,856 0 413,627Cross River 3,984 12,918 0 16,903 0 16,903Delta 6,292 17,368 0 23,660 0 23,660Ebonyi 50,238 106,456 1,329 155,348 449 156,694Edo 4,013 7,949 0 11,962 0 11,962Ekiti 18,865 70,038 0 88,902 0 88,902Enugu 26,823 237,190 971 269,900 0 270,871Gombe 3,062 67,832 0 70,894 0 69,796Imo 109,011 216,646 633 325,024 0 325,657Jigawa 29,484 284,686 0 314,171 0 314,171Kaduna 47,463 516,665 1,739 562,388 1,739 562,388Kano 115,696 1,073,346 0 1,189,041 0 1,189,041Katsina 69,492 737,367 22,464 784,395 7,488 799,370Kebbi 12,622 263,821 2,104 274,339 2,104 274,339Kogi 33,862 122,385 0 155,952 394 155,952Kwara 29,210 71,794 0 101,004 0 101,004Lagos 43,278 23,184 0 66,462 0 66,462Nassarawa 16,345 135,333 1,144 151,572 0 152,716Niger 17,334 221,497 0 235,014 0 236,574Ogun 10,488 102,127 0 112,615 0 112,615Ondo 49,641 114,323 3,113 160,851 0 163,964Osun 31,167 80,858 0 114,309 0 114,309Oyo 55,922 132,052 3,957 184,331 3,957 181,630Plateau 13,800 249,908 0 263,708 0 263,708Rivers 8,199 7,438 0 15,637 0 15,637Sokoto 16,442 478,326 0 494,768 0 494,768Taraba 11,672 149,115 3,263 158,316 1,307 160,272Yobe 9,989 163,824 771 173,177 771 171,561Zamfara 20,645 383,103 0 399,086 1,096 397,990FCT 18,878 27,778 0 46,656 0 46,656Nigeria 1,130,928 7,784,475 52,274 8,870,982 27,703 8,893,844Percentage of Total
11.2 14.9 0.5 17.0 0.3 17.0

197
TABLE 2.2.1.7b. Distribution (absolute) of crop farmers by possession of
any ICT facility by state, 2006 (Contd)
Website Total STATE Yes No Yes No
Abia 0 235,979 406,431 1,252,221Adamawa 234 183,948 221,313 1,068,239Akwa Ibom 0 91,845 131,524 517,248Anambra 0 189,398 312,009 1,011,173Bauchi 0 396,593 373,874 2,385,348Bayelsa 0 6,748 14,368 32,865Benue 6,090 437,577 460,330 2,645,337Borno 0 411,897 328,543 2,558,921Cross River 0 16,903 22,916 95,403Delta 0 23,660 30,494 135,125Ebonyi 449 156,893 202,242 897,867Edo 0 11,962 20,260 63,473Ekiti 0 88,902 140,651 478,246Enugu 971 269,900 229,867 1,658,035Gombe 0 69,796 72,095 421,965Imo 0 323,978 497,397 1,776,210Jigawa 0 314,171 322,463 1,878,053Kaduna 1,739 562,388 600,855 3,299,430Kano 0 1,189,041 1,189,541 7,133,748Katsina 7,488 799,370 770,550 4,877,458Kebbi 2,104 274,339 292,527 1,642,399Kogi 0 155,541 198,455 913,825Kwara 0 101,004 148,141 558,884Lagos 0 66,462 188,566 276,667Nassarawa 0 152,716 178,695 885,127Niger 0 236,574 281,995 1,377,034Ogun 0 112,615 116,890 671,413Ondo 0 163,175 253,903 892,897Osun 0 114,309 172,486 621,358Oyo 3,957 181,630 313,227 992,289Plateau 0 262,057 201,169 1,643,136Rivers 0 15,637 31,273 76,270Sokoto 0 492,716 571,016 2,884,754Taraba 1,009 160,571 142,194 985,784Yobe 2,387 171,561 143,754 1,067,284Zamfara 2,262 389,333 456,291 2,358,139FCT 0 46,656 75,060 251,532Nigeria 28,688 8,877,841 10,113,368 52,285,157Percentage of Total 0.3 17.0 100.0 100.0
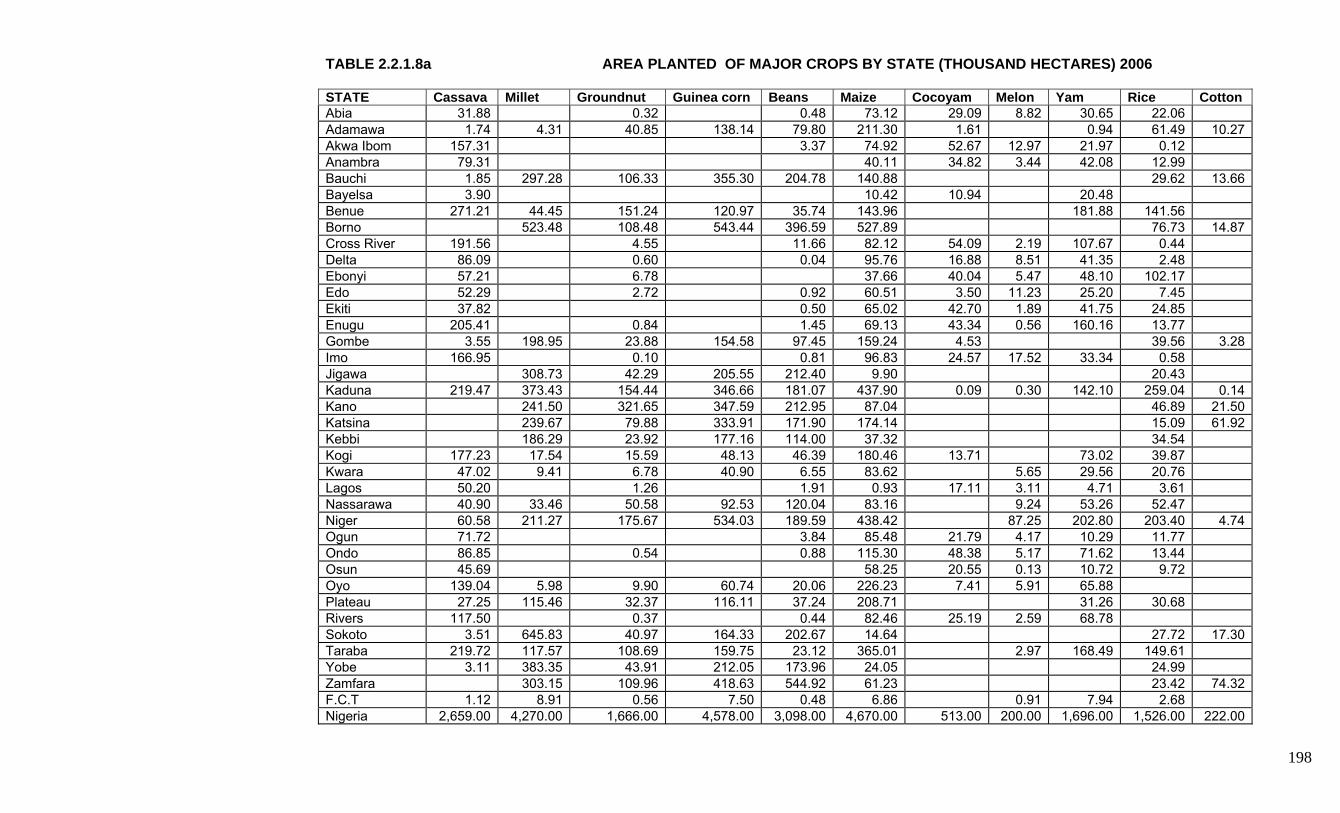
198
TABLE 2.2.1.8a AREA PLANTED OF MAJOR CROPS BY STATE (THOUSAND HECTARES) 2006 STATE Cassava Millet Groundnut Guinea corn Beans Maize Cocoyam Melon Yam Rice Cotton Abia 31.88 0.32 0.48 73.12 29.09 8.82 30.65 22.06 Adamawa 1.74 4.31 40.85 138.14 79.80 211.30 1.61 0.94 61.49 10.27 Akwa Ibom 157.31 3.37 74.92 52.67 12.97 21.97 0.12 Anambra 79.31 40.11 34.82 3.44 42.08 12.99 Bauchi 1.85 297.28 106.33 355.30 204.78 140.88 29.62 13.66 Bayelsa 3.90 10.42 10.94 20.48 Benue 271.21 44.45 151.24 120.97 35.74 143.96 181.88 141.56 Borno 523.48 108.48 543.44 396.59 527.89 76.73 14.87 Cross River 191.56 4.55 11.66 82.12 54.09 2.19 107.67 0.44 Delta 86.09 0.60 0.04 95.76 16.88 8.51 41.35 2.48 Ebonyi 57.21 6.78 37.66 40.04 5.47 48.10 102.17 Edo 52.29 2.72 0.92 60.51 3.50 11.23 25.20 7.45 Ekiti 37.82 0.50 65.02 42.70 1.89 41.75 24.85 Enugu 205.41 0.84 1.45 69.13 43.34 0.56 160.16 13.77 Gombe 3.55 198.95 23.88 154.58 97.45 159.24 4.53 39.56 3.28 Imo 166.95 0.10 0.81 96.83 24.57 17.52 33.34 0.58 Jigawa 308.73 42.29 205.55 212.40 9.90 20.43 Kaduna 219.47 373.43 154.44 346.66 181.07 437.90 0.09 0.30 142.10 259.04 0.14 Kano 241.50 321.65 347.59 212.95 87.04 46.89 21.50 Katsina 239.67 79.88 333.91 171.90 174.14 15.09 61.92 Kebbi 186.29 23.92 177.16 114.00 37.32 34.54 Kogi 177.23 17.54 15.59 48.13 46.39 180.46 13.71 73.02 39.87 Kwara 47.02 9.41 6.78 40.90 6.55 83.62 5.65 29.56 20.76 Lagos 50.20 1.26 1.91 0.93 17.11 3.11 4.71 3.61 Nassarawa 40.90 33.46 50.58 92.53 120.04 83.16 9.24 53.26 52.47 Niger 60.58 211.27 175.67 534.03 189.59 438.42 87.25 202.80 203.40 4.74 Ogun 71.72 3.84 85.48 21.79 4.17 10.29 11.77 Ondo 86.85 0.54 0.88 115.30 48.38 5.17 71.62 13.44 Osun 45.69 58.25 20.55 0.13 10.72 9.72 Oyo 139.04 5.98 9.90 60.74 20.06 226.23 7.41 5.91 65.88 Plateau 27.25 115.46 32.37 116.11 37.24 208.71 31.26 30.68 Rivers 117.50 0.37 0.44 82.46 25.19 2.59 68.78 Sokoto 3.51 645.83 40.97 164.33 202.67 14.64 27.72 17.30 Taraba 219.72 117.57 108.69 159.75 23.12 365.01 2.97 168.49 149.61 Yobe 3.11 383.35 43.91 212.05 173.96 24.05 24.99 Zamfara 303.15 109.96 418.63 544.92 61.23 23.42 74.32 F.C.T 1.12 8.91 0.56 7.50 0.48 6.86 0.91 7.94 2.68 Nigeria 2,659.00 4,270.00 1,666.00 4,578.00 3,098.00 4,670.00 513.00 200.00 1,696.00 1,526.00 222.00

199
TABLE 2.2.1.8b PRODUCTION OF MAJOR CROPS IN THOUSAND TONNES BY STATE. 2006 STATE CASSAVA MILLET GROUNDNUT GUINEA CORN BEANS MAIZE COCOYAM MELON YAM RICE COTTON Abia 616.10 0.55 0.82 128.65 154.13 13.13 653.19 56.57 Adamawa 13.54 4.36 92.66 206.54 108.24 203.16 3.61 10.36 120.56 14.80 Akwa Ibom 1518.97 7.91 84.27 116.31 4.45 162.95 0.29 Anambra 1212.47 70.12 154.38 2.55 769.26 29.92 Bauchi 17.67 367.60 157.11 379.85 142.55 189.36 49.82 31.96 Bayelsa 49.33 11.45 40.93 257.98 Benue 4117.66 81.99 418.02 248.75 49.38 165.84 3175.73 291.34 Borno 695.59 305.07 838.97 666.30 695.89 134.89 106.86 Cross River 2646.68 6.86 21.72 120.13 228.12 2.55 1596.55 0.57 Delta 1236.85 1.18 0.07 181.43 46.35 6.60 656.88 4.63 Ebonyi 746.52 6.69 0.00 41.38 178.60 8.13 747.45 264.45 Edo 717.49 4.96 1.24 104.15 14.42 13.83 387.03 19.29 Ekiti 791.41 0.47 122.53 214.97 3.87 848.37 50.10 Enugu 2673.77 0.83 2.22 109.59 197.24 0.71 2486.69 35.80 Gombe 9.49 307.27 50.64 189.42 172.07 211.60 19.46 93.07 7.46 Imo 2682.67 0.09 0.75 189.04 139.26 11.34 689.78 0.28 Jigawa 311.25 27.51 158.40 112.34 7.17 37.31 Kaduna 2356.43 851.70 394.31 770.95 271.58 1114.88 0.39 0.29 2115.18 675.09 0.19 Kano 451.66 389.04 629.24 206.63 148.96 96.56 74.65 Katsina 258.45 65.42 385.50 106.10 183.15 20.39 124.37 Kebbi 263.33 40.56 223.28 101.49 35.60 73.41 Kogi 3360.69 21.87 42.36 66.47 72.15 309.78 49.87 1118.59 83.95 Kwara 669.89 14.30 23.59 65.18 7.61 112.29 2.98 472.05 49.63 Lagos 784.83 2.84 3.15 1.99 36.51 4.07 35.35 7.57 Nassarawa 604.89 51.48 90.24 171.67 133.13 122.11 14.94 1303.85 125.55 Niger 613.72 237.17 371.05 517.28 638.35 412.57 237.95 2486.98 481.45 5.57 Ogun 1264.71 3.93 103.11 80.66 6.12 120.10 14.25 Ondo 1820.05 0.61 0.82 217.19 243.85 10.58 1457.19 26.83 Osun 827.02 84.71 139.85 0.26 207.05 15.09 Oyo 1677.25 7.87 27.39 67.49 32.56 341.08 21.56 12.06 1732.59 Plateau 357.20 169.02 51.24 256.31 43.99 414.29 571.86 62.87 Rivers 1400.16 0.34 0.63 121.26 139.50 3.19 895.68 Sokoto 11.78 739.25 58.42 116.76 245.19 16.46 36.18 22.74 Taraba 3213.25 159.40 207.98 234.61 30.41 563.71 9.19 3255.95 313.05 Yobe 21.45 486.62 80.74 242.79 203.75 19.48 34.06 Zamfara 449.91 142.66 699.67 380.82 59.22 24.66 127.38 F.C.T 7.05 9.91 1.03 4.88 1.63 5.38 2.20 65.36 3.51 Nigeria 38041.00 5940.00 3062.00 6474.00 3770.00 7023.00 2220.00 371.00 28280.00 3333.00 516.00

200
TABLE 2.2.2.1 Distribution of Livestock Farmers by Source and Type of Input, 2006
MINISTRY EXTENTION
AGRO-SERVICE CENTER
FARM-SERVICE CENTER
COOPERATIVE SOCIETY
LOCAL MARKET OTHERS ITEM
Number % Number % Number % Number % Number % Number %
LIVESTOCK FEEDS 105,730 28.9 31,270 22.6 53,984 24.6 36,682 14.0 4,046,027 51.4 1,591,276 59.7
PULLET MASH 58,447 16.0 23,764 17.2 48,320 22.0 27,791 10.6 789,158 10.0 216,339 8.1
GR0WERS MASH 61,719 16.9 19,561 14.1 48,010 21.8 25,791 9.8 776,573 9.9 202,352 7.6
LAYERS MASH 50,621 13.9 24,359 17.6 51,729 23.5 35,169 13.4 692,987 8.8 163,369 6.1
BROILERS MASH 22,779 6.2 9,644 7.0 5,756 2.6 39,909 15.2 373,090 4.7 82,320 3.1
OTHER POULTRY FEEDS 26,002 7.1 17,980 13.0 5,088 2.3 41,981 16.0 670,663 8.5 296,934 11.1
DAY OLD CHICKS 19,543 5.4 10,031 7.2 4,044 1.8 29,110 11.1 300,704 3.8 72,551 2.7
ELECTRICITY/STOVE 20,379 5.6 1,761 1.3 2,935 1.3 25,463 9.7 222,920 2.8 39,892 1.5

201
TABLE 2.2.2.2 Number of Persons Engaged in Livestock Farming by Sex, 2006
WORKING PROPRIETOR UNPAID FAMILY APPRENTICE
STATE TOTAL MALE FEMALE TOTAL MALE FEMALE TOTAL MALE FEMALE
Abia 358,421 90,436 267,985 61,528 20,448 41,080 1,343 1,343 Adamawa 166,937 161,113 5,824 214,877 151,769 63,109 6,664 4,063 2,602 Akwa ibom 442,251 260,785 181,466 596,295 271,025 325,270 2,588 1,270 1,318 Anambra 462,043 323,001 139,042 479,712 68,695 411,017 3,468 . Bauchi 384,055 354,700 29,356 352,306 167,214 185,092 Benue 925,791 815,348 110,443 1,333,923 636,222 697,701 17,846 -1,785 19,630 Borno 361,412 361,412 0 858,746 387,289 471,457 9,038 0 9,038 Cross Rivers 290,646 203,368 87,278 491,413 206,696 284,718 3,795 1,843 1,952 Delta . . . . . . Ebonyi 589,234 461,755 127,479 1,748,668 751,033 997,635 51,484 4,080 47,404 Edo 268,845 181,777 87,068 357,220 174,838 182,382 848 439 410 Enugu 788,398 454,275 334,123 792,069 279,890 512,179 4,846 1,322 3,524 Imo 10,751 4,300 6,450 . 8,601 . . Jigawa 1,058,864 881,815 177,049 2,137,969 1,278,048 859,921 69,215 29,021 40,194 Kaduna 1,354,961 1,304,877 50,083 1,991,181 1,051,346 939,835 4,856 4,856 0 Kano 3,697,896 3,426,225 271,670 8,147,734 5,873,138 2,274,596 521,374 349,310 172,064 Katsina 1,952,356 1,577,383 374,974 2,806,327 1,738,528 1,067,799 183,749 132,172 51,576 Kebbi 610,434 398,559 211,875 908,067 601,373 306,694 120,854 70,956 49,898 Kogi 352,222 245,461 106,761 552,599 260,544 292,056 4,370 4,781 -411 Kwara 273,614 213,278 60,337 546,244 250,894 295,350 16,380 11,547 4,833 Nassarawa 562,728 527,681 35,047 1,428,413 779,979 648,434 53,003 50,932 2,071 Niger 453,479 441,490 11,989 365,338 250,992 114,347 14,844 8,895 5,948 Ogun 82,268 46,669 35,599 . 10,419 . . Ondo 126,468 67,805 58,663 98,996 30,026 68,970 37,913 17,926 19,987 Osun 61,730 16,999 44,731 17,925 2,981 14,944 . . Oyo 962,524 542,972 419,552 390,211 187,818 202,394 6,386 6,386 0 Plateau 578,449 531,698 46,751 1,320,041 759,572 560,469 8,988 4,629 4,359 Rivers 394,315 228,596 165,719 576,286 276,406 299,879 43,812 23,865 19,947 Sokoto 851,151 736,051 115,100 1,128,176 695,793 432,384 18,436 18,436 0 Taraba 151,211 113,915 37,296 293,431 165,663 127,768 783 783 0 Yobe 240,447 237,289 3,158 396,362 350,615 45,747 . . Zamfara 49,128 37,654 11,473 109,766 86,112 23,654 3,412 3,412 0 FCT 32,836 31,324 1,512 7,266 798 6,468 529 . Total 18,895,867 15,280,013 3,615,854 30,528,110 17,755,742 12,772,368 1,210,824 753,137 457,687

202
TABLE 2.2.2.2.(Contd) Number of Persons Engaged in Livestock Farming by Sex, 2006 WORKING PROPRIE-
TOR
UNPAID FAMILY APPRENTICE
STATE Total Male % Female % Total Male % Female % Total Male % Female Abia 358,421 90,436 25.23 267,985 74.77 61,528 20,448 33.23 41,080 67 1,343 0 1,343 Adamawa 166,937 161,113 96.51 5,824 3.49 214,877 151,769 70.63 63,109 29 6,664 4,063 2,602 Akwa ibom 442,251 260,785 58.97 181,466 41.03 596,295 271,025 45.45 325,270 55 2,588 1,270 1,318 Anambra 462,043 323,001 69.91 139,042 30.09 479,712 68,695 14.32 411,017 86 3,468 . Bauchi 384,055 354,700 92.36 29,356 7.64 352,306 167,214 47.46 185,092 53 Benue 925,791 815,348 88.07 110,443 11.93 1,333,923 636,222 47.70 697,701 52 17,846 -1,785 19,630 Borno 361,412 361,412 100.00 0 0.00 858,746 387,289 45.10 471,457 55 9,038 0 9,038 Cross Rivers 290,646 203,368 69.97 87,278 30.03 491,413 206,696 42.06 284,718 58 3,795 1,843 1,952 Delta . . . . . . Ebonyi 589,234 461,755 78.37 127,479 21.63 1,748,668 751,033 42.95 997,635 57 51,484 4,080 47,404 Edo 268,845 181,777 67.61 87,068 32.39 357,220 174,838 48.94 182,382 51 848 439 410 Enugu 788,398 454,275 57.62 334,123 42.38 792,069 279,890 35.34 512,179 65 4,846 1,322 3,524 Imo 10,751 4,300 40.00 6,450 60.00 . 8,601 . . Jigawa 1,058,864 881,815 83.28 177,049 16.72 2,137,969 1,278,048 59.78 859,921 40 69,215 29,021 40,194 Kaduna 1,354,961 1,304,877 96.30 50,083 3.70 1,991,181 1,051,346 52.80 939,835 47 4,856 4,856 0 Kano 3,697,896 3,426,225 92.65 271,670 7.35 8,147,734 5,873,138 72.08 2,274,596 28 521,374 349,310 172,064 Katsina 1,952,356 1,577,383 80.79 374,974 19.21 2,806,327 1,738,528 61.95 1,067,799 38 183,749 132,172 51,576 Kebbi 610,434 398,559 65.29 211,875 34.71 908,067 601,373 66.23 306,694 34 120,854 70,956 49,898 Kogi 352,222 245,461 69.69 106,761 30.31 552,599 260,544 47.15 292,056 53 4,370 4,781 -411 Kwara 273,614 213,278 77.95 60,337 22.05 546,244 250,894 45.93 295,350 54 16,380 11,547 4,833 Nassarawa 562,728 527,681 93.77 35,047 6.23 1,428,413 779,979 54.60 648,434 45 53,003 50,932 2,071 Niger 453,479 441,490 97.36 11,989 2.64 365,338 250,992 68.70 114,347 31 14,844 8,895 5,948 Ogun 82,268 46,669 56.73 35,599 43.27 . 10,419 . . Ondo 126,468 67,805 53.61 58,663 46.39 98,996 30,026 30.33 68,970 70 37,913 17,926 19,987 Osun 61,730 16,999 27.54 44,731 72.46 17,925 2,981 16.63 14,944 83 . . Oyo 962,524 542,972 56.41 419,552 43.59 390,211 187,818 48.13 202,394 52 6,386 6,386 0 Plateau 578,449 531,698 91.92 46,751 8.08 1,320,041 759,572 57.54 560,469 42 8,988 4,629 4,359 Rivers 394,315 228,596 57.97 165,719 42.03 576,286 276,406 47.96 299,879 52 43,812 23,865 19,947 Sokoto 851,151 736,051 86.48 115,100 13.52 1,128,176 695,793 61.67 432,384 38 18,436 18,436 0 Taraba 151,211 113,915 75.33 37,296 24.67 293,431 165,663 56.46 127,768 44 783 783 0 Yobe 240,447 237,289 98.69 3,158 1.31 396,362 350,615 88.46 45,747 12 . . Zamfara 49,128 37,654 76.65 11,473 23.35 109,766 86,112 78.45 23,654 22 3,412 3,412 0 FCT 32,836 31,324 95.40 1,512 4.60 7,266 798 10.98 6,468 89 529 . Total 18,895,867 15,280,013 80.86 3,615,854 19.14 30,528,110 17,755,742 58.16 12,772,368 42 1,210,824 753,137 457,687

203
TABLE 2.2.2.3 Stocks and Changes in Stocks of Livestock by Type, 2006 LIVESTOCK/POULTRY DESRCIPTION
Initial population
Number born Number bought
Number slaughtered
Number dead
Number sold BALANCE
CATTLE 10,069,448 2,236,399 1,106,247 190,963 200,935 1,121,774 11,898,422 GOAT 36,115,821 18,440,368 3,747,405 2,855,106 1,679,762 6,376,792 47,391,934 SHEEP 15,613,179 7,944,082 2,253,944 1,597,283 540,290 3,189,763 20,483,869 PIG 1,122,809 1,318,395 88,394 77,824 175,552 327,637 1,948,585 CAMEL 71,164 43,612 12,907 2,947 3,277 13,270 108,189 DONKEY 492,597 92,201 55,308 50,294 31,987 51,352 506,473 HORSE 116,951 40,787 15,309 33,300 1,708 4,316 133,722 OTHER ANIMALS 536,845 116,752 42,693 81,655 80,196 90,194 444,246 CHICKEN 55,392,884 47,498,455 8,075,741 11,927,186 11,708,754 16,333,182 70,997,959 GUINEA FOWL 6,522,836 3,842,228 978,220 1,148,213 474,918 2,282,582 7,437,571 DUCK 2,087,153 2,134,494 177,187 278,938 460,991 850,757 2,808,147 TURKEY 466,217 77,241 847,133 62,175 36,313 389,404 902,700 OTHER BIRDS 347,965 189,837 31,636 68,461 54,076 91,967 354,935
TABLE 2.2.2.4 Diary Products: Quantity and Value by Type, 2006
DAIRY PRODUCTS QUANTITY PRODUCED
VALUE OF PRODUCT
EGGS (CRATES) 10,694,534 3,071,171,681 MILK (LITRES) 8,068,053 437,157,468 CHEESE (KG) 516,671 226,159,127 BUTTER (KG) 1,633,750 97,931,885 OTHER DAIRIES 14,947 1,186,265 Total 20,927,955 3,833,606,426
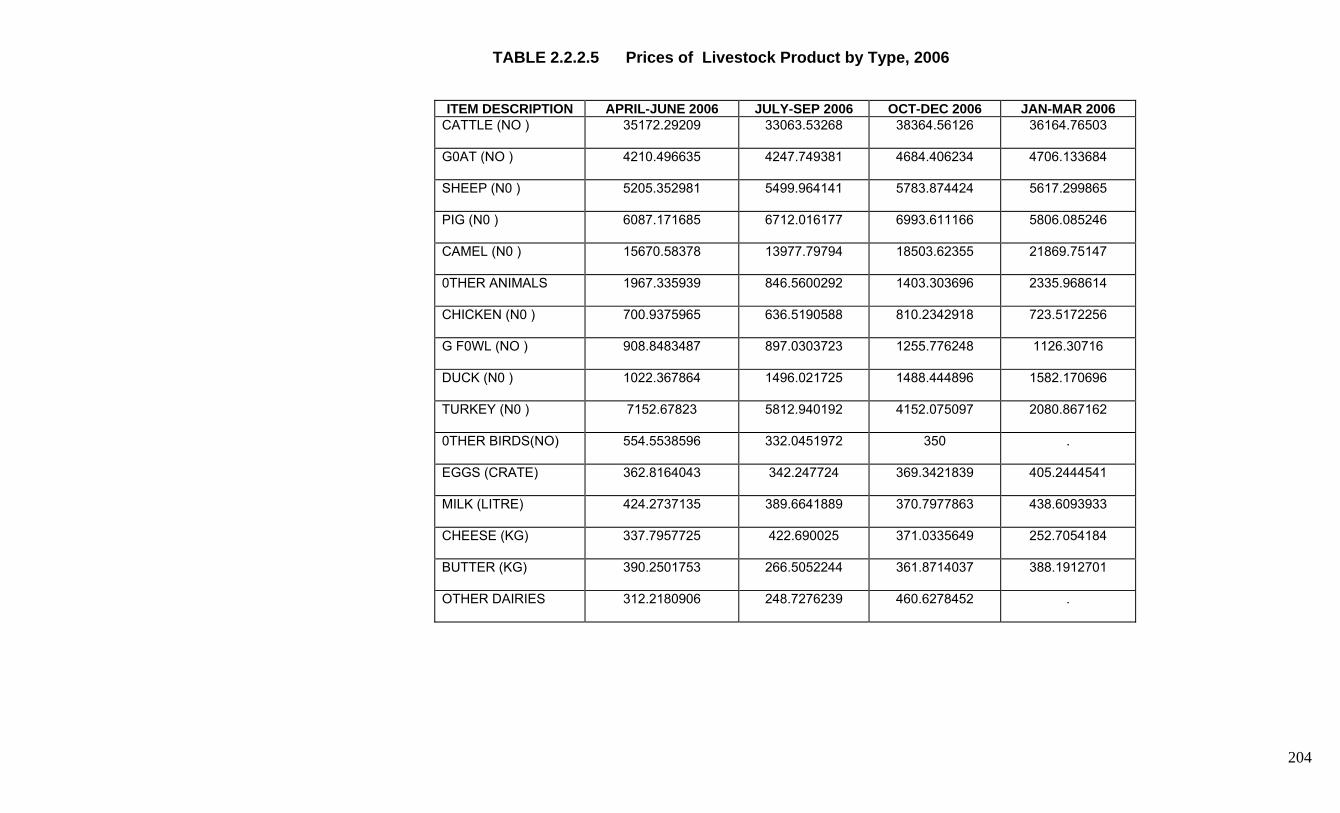
204
TABLE 2.2.2.5 Prices of Livestock Product by Type, 2006
ITEM DESCRIPTION APRIL-JUNE 2006 JULY-SEP 2006 OCT-DEC 2006 JAN-MAR 2006
CATTLE (NO ) 35172.29209 33063.53268 38364.56126 36164.76503
G0AT (NO ) 4210.496635 4247.749381 4684.406234 4706.133684
SHEEP (N0 ) 5205.352981 5499.964141 5783.874424 5617.299865
PIG (N0 ) 6087.171685 6712.016177 6993.611166 5806.085246
CAMEL (N0 ) 15670.58378 13977.79794 18503.62355 21869.75147
0THER ANIMALS 1967.335939 846.5600292 1403.303696 2335.968614
CHICKEN (N0 ) 700.9375965 636.5190588 810.2342918 723.5172256
G F0WL (NO ) 908.8483487 897.0303723 1255.776248 1126.30716
DUCK (N0 ) 1022.367864 1496.021725 1488.444896 1582.170696
TURKEY (N0 ) 7152.67823 5812.940192 4152.075097 2080.867162
0THER BIRDS(NO) 554.5538596 332.0451972 350 .
EGGS (CRATE) 362.8164043 342.247724 369.3421839 405.2444541
MILK (LITRE) 424.2737135 389.6641889 370.7977863 438.6093933
CHEESE (KG) 337.7957725 422.690025 371.0335649 252.7054184
BUTTER (KG) 390.2501753 266.5052244 361.8714037 388.1912701
OTHER DAIRIES 312.2180906 248.7276239 460.6278452 .

205
TABLE 2.2.2.6 Funds Committed to Livestock Farming by Source, 2006
STATE
OWN FUNDS AMOUNT
RETAINED PROFIT
AMOUNT
SHORT TERM PRIV. LOAN
AMOUNT
NACRDB AMOUNT
BANKS AMOUNT
OTHERS AMOUNT
TOTAL FUNDS AVAILABLE
AMOUNT Abia 188,067,555 4,465,576 . . 4,196,970 196,730,101 Adamawa 1,230,532,665 26,251,683 . 3,252,167 16,837,884 1,276,874,399 Akwa ibom 924,985,503 9,082,881 8,387,885 . . 29,995,675 972,451,943 Anambra 821,612,643 . . . 53,214,217 874,826,860 Bauchi 2,570,410,481 54,810,353 . . 2,625,220,834 Benue 4,159,668,697 824,189,368 7,495,200 378,864,514 5,370,217,779 Borno 805,193,123 . . 271,688,243 1,076,881,366 Cross_rivers 475,370,524 36,690,361 1,626,286 . 513,687,170 Delta . . . . 0 Ebonyi 1,863,213,687 56,207,276 . 69,704,453 1,989,125,415 Edo 122,476,464 511,921 . 468,042 4,738,926 128,195,353 Enugu 1,382,595,257 15,831,667 . . . 1,398,426,923 Imo 88,585,886 . . 322,521,429 . . 411,107,314 Jigawa 5,872,757,387 2,135,067,805 3,204,800 32,270,556 96,366,556 1,377,199,928 9,516,867,031 Kaduna 7,580,837,634 47,748,000 23,355,000 . 18,535,714 22,877,705 7,693,354,053 Kano 18,158,309,848 184,663,772 23,388,222 . 202,973,081 18,569,334,924 Katsina 10,311,557,457 274,371,691 . . 74,340,000 158,883,529 10,819,152,678 Kebbi 4,689,860,606 353,743,008 . . 11,977,754 5,055,581,368 Kogi 800,901,195 158,745,754 . 22,231,145 981,878,095 Kwara 461,598,681 33,894,109 10,025,018 3,132,818 508,650,626 Nassarawa 1,301,988,735 183,165,980 2,901,632 5,973,947 1,494,030,293 Niger 1,344,382,475 . 243,096 4,184,189 1,348,809,760 Ogun 139,876,892 . . . 139,876,892 Ondo 201,571,725 11,931,944 16,491,852 . 229,995,521 Osun 59,097,642 . . . 59,097,642 Oyo 650,560,758 111,866,688 108,158,400 34,265,611 904,851,458 Plateau 2,130,140,400 6,345,355 . 4,243,094 36,606,332 2,177,335,181 Rivers 923,534,536 114,106,603 45,236,581 3,561,935 1,086,439,655 Sokoto 5,822,323,788 133,826,302 17,079,018 37,715,350 6,010,944,458 Taraba 512,011,788 2,685,347 . 2,997,039 517,694,175 Yobe 771,307,019 11,752,000 3,770,433 . 786,829,452 Zamfara 3,081,758,660 12,762,071 . . . . 3,094,520,731 FCT 38,774,400 . . . . . 38,774,400 Total 79,485,864,111 4,804,717,516 261,338,403 365,285,044 196,737,531 2,753,821,249 87,867,763,854

206
TABLE 2.2.2.7 Number of livestock processing facilities by type and capacity,2006
AVAILABLE CAPACITY
UTILIZED CAPACITY
536527.2682 439937.9194
REFRIGERATORS 102711.9534 89835.52168
SMOKING KILN 211333.7716 155867.2832
DAIRIES 32205.84938 23598.52857
OTHERS 112731.0665 89044.87152
Total 995509.9091 798284.1244
TABLE 2.2.2.8 Distribution of livestock farmers by market channel, 2006
WHERE DO YOU SELL YOUR LIVESTOCK PRODUCE
%
IN THE FARM 558,090 6.8
IN THE NEIGHBOURH00D 1,667,083 20.4
IN THE 0PEN MARKET 5,518,488 67.4
IN THE COOPERATIVE S0CIETY 113,797 1.4
DIRECT T0 THE INDUSTRY 68,352 0.8
0THERS 262,049 3.2
Total 8,187,859

207
TABLE 2.2.2.9 Comparison of LIvestock Farming Season between 2006 and 2005 BETTER SAME WORST DON'T KNOW
FACTOR % % % %
WEATHER 4,104,169 27.6 1,697,681 24.8 389,447 17.2 407,187 28.6
HARVEST / 0UTPUT 3,784,883 25.4 1,747,051 25.5 479,443 21.2 300,205 21.1
INCOME 3,567,656 24.0 1,684,032 24.6 716,054 31.6 340,768 24.0
PRICE 3,418,000 23.0 1,728,741 25.2 678,784 30.0 374,474 26.3
Total 14,874,708 6,857,505 100.0 2,263,728 100.0 1,422,634
TABLE 2.2.210 Livestock farmers expectation for 2006 season by factor,2006 BETTER SAME WORST DON'T KNOW
FACTOR % % % %
WEATHER 4635196 25.7 710697 25.0 87295 21.4 1156506 26.1
HARVEST / 0UTPUT 4510716 25.0 690807 24.3 77481 19.0 1122130 25.3
INCOME 4523313 25.1 717155 25.2 111004 27.3 1044170 23.5
PRICE 4384939 24.3 725165 25.5 131409 32.3 1112587 25.1
Total 18054164 2843824 407189 4435392

208
TABLE 2.2.2.11 Distribution of Livestock Farmers by Problems Encountered in Purchasing Livestock Inputs, 2006
TOO
COSTLY/HIGH COST
LACK OF FUND (M0NEY)
DON'T kNOW WHERE TO
OBTAIN
NOT AVAILABLE
SCARE
LACK OF TRANSPORT
BAD ROAD
OTHERS STATE
% % % % % % % %
Abia 34,113 1.0 45,294 1.0 19,642 1.5 17,191 1.4 18,483 2.3 31,897 2.0 34,952 1.9 15,646 1.9
Adamawa 62,322 1.7 98,686 2.2 31,823 2.4 21,890 1.8 10,411 1.3 33,697 2.1 24,812 1.4 21,048 2.5
Anambra 29,724 0.8 29,724 0.7 5,945 0.5 8,670 0.7 17,091 2.1 29,724 1.9 29,724 1.6 27,990 3.4
Bauchi 193,658 5.4 259,590 5.8 97,802 7.4 43,539 3.6 37,278 4.6 115,601 7.2 137,373 7.6 34,934 4.2
Benue 280,200 7.8 364,633 8.2 206,029 15.6 187,313 15.5 109,573 13.4 205,828 12.9 232,641 12.9 145,956 17.6
Borno 76,190 2.1 134,390 3.0 42,115 3.2 3,013 0.2 12,311 1.5 73,075 4.6 43,553 2.4 0 0.0
Ebonyi 46,241 1.3 53,637 1.2 7,359 0.6 6,703 0.6 16,575 2.0 27,456 1.7 31,038 1.7 26,193 3.2
Enugu 25,221 0.7 24,339 0.5 2,203 0.2 4,405 0.4 8,921 1.1 19,163 1.2 25,221 1.4 5,507 0.7
Jigawa 275,846 7.7 297,841 6.7 95,710 7.2 96,055 7.9 31,136 3.8 89,918 5.6 96,572 5.3 82,885 10.0
Kaduna 295,589 8.3 395,330 8.9 31,121 2.4 27,062 2.2 11,715 1.4 27,692 1.7 50,009 2.8 0 0.0
Kano 889,555 24.8 976,023 22.0 337,902 25.6 381,457 31.5 192,701 23.6 308,037 19.3 342,070 18.9 101,670 12.3
Katsina 302,207 8.4 403,307 9.1 19,091 1.4 16,714 1.4 14,510 1.8 36,678 2.3 41,045 2.3 44,483 5.4
Kebbi 122,697 3.4 151,555 3.4 77,191 5.8 71,512 5.9 30,542 3.7 37,307 2.3 50,032 2.8 19,219 2.3
Kogi 81,163 2.3 97,642 2.2 12,536 0.9 12,914 1.1 21,408 2.6 40,039 2.5 48,320 2.7 43,868 5.3
Kwara 55,570 1.6 78,656 1.8 6,474 0.5 8,205 0.7 8,115 1.0 33,596 2.1 52,363 2.9 11,129 1.3
Nassarawa 120,974 3.4 142,799 3.2 50,130 3.8 53,765 4.4 66,094 8.1 112,537 7.0 128,405 7.1 36,316 4.4
Niger 94,882 2.6 159,588 3.6 55,376 4.2 31,030 2.6 24,130 3.0 33,352 2.1 69,342 3.8 38,309 4.6
Plateau 142,317 4.0 150,572 3.4 79,423 6.0 81,689 6.8 96,068 11.8 126,946 7.9 129,241 7.1 94,303 11.4
Sokoto 170,559 4.8 266,814 6.0 42,179 3.2 38,275 3.2 34,692 4.2 86,590 5.4 83,417 4.6 39,912 4.8
Taraba 80,825 2.3 88,725 2.0 43,919 3.3 36,791 3.0 21,978 2.7 37,003 2.3 39,774 2.2 19,435 2.3
Yobe 75,295 2.1 107,275 2.4 18,490 1.4 9,519 0.8 3,092 0.4 39,658 2.5 57,484 3.2 1,506 0.2
Zamfara 121,132 3.4 109,270 2.5 33,668 2.5 47,226 3.9 23,218 2.8 44,042 2.8 55,109 3.0 16,831 2.0
FCT 6,149 0.2 8,165 0.2 4,301 0.3 4,301 0.4 6,426 0.8 7,056 0.4 7,014 0.4 1,235 0.1
Total 3,582,431 100.0 4,443,854 100.0 1,320,429 100.0 1,209,240 100.0 816,467 100.0 1,596,891 100.0 1,809,512 100.0 828,374 100.0
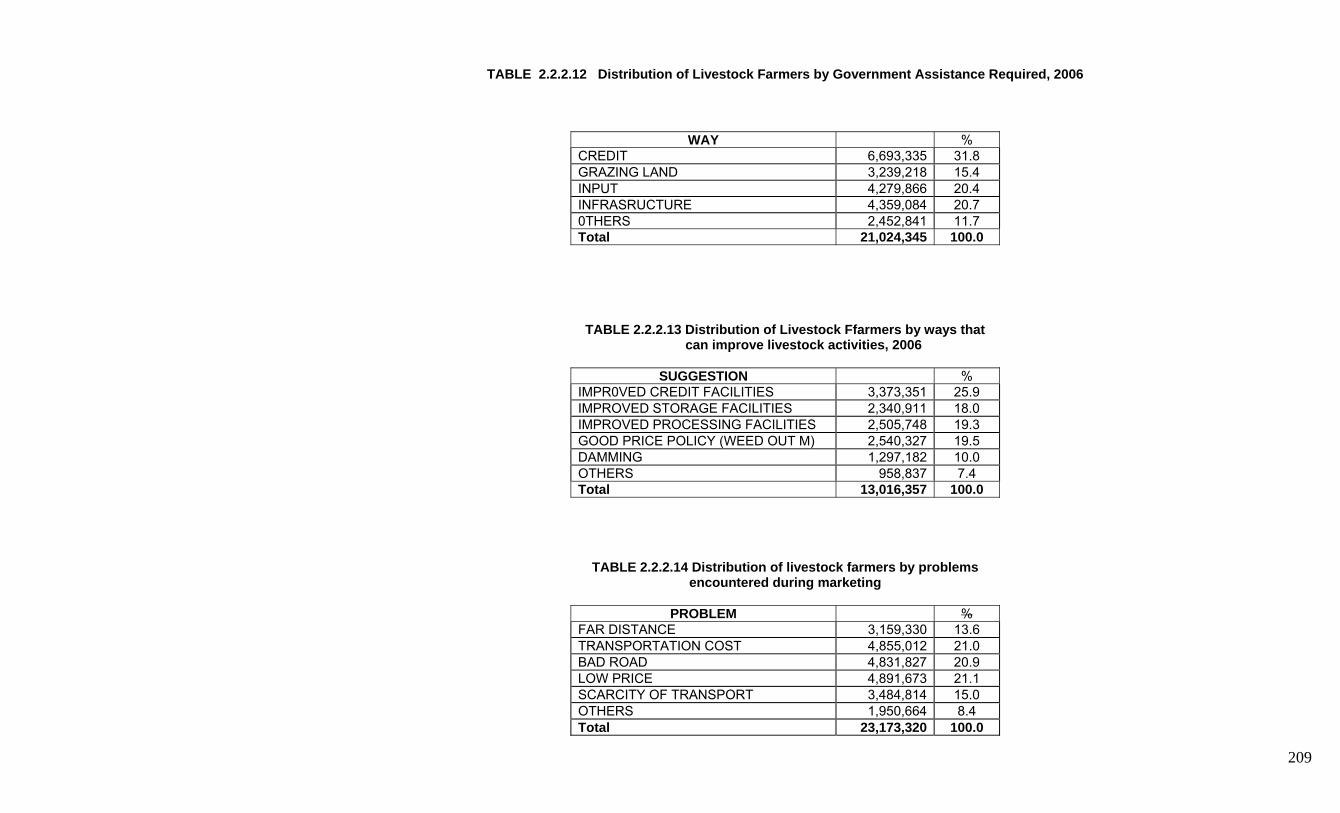
209
TABLE 2.2.2.12 Distribution of Livestock Farmers by Government Assistance Required, 2006
WAY % CREDIT 6,693,335 31.8 GRAZING LAND 3,239,218 15.4 INPUT 4,279,866 20.4 INFRASRUCTURE 4,359,084 20.7 0THERS 2,452,841 11.7 Total 21,024,345 100.0
TABLE 2.2.2.13 Distribution of Livestock Ffarmers by ways that can improve livestock activities, 2006
SUGGESTION %
IMPR0VED CREDIT FACILITIES 3,373,351 25.9 IMPROVED STORAGE FACILITIES 2,340,911 18.0 IMPROVED PROCESSING FACILITIES 2,505,748 19.3 GOOD PRICE POLICY (WEED OUT M) 2,540,327 19.5 DAMMING 1,297,182 10.0 OTHERS 958,837 7.4 Total 13,016,357 100.0
TABLE 2.2.2.14 Distribution of livestock farmers by problems encountered during marketing
PROBLEM %
FAR DISTANCE 3,159,330 13.6 TRANSPORTATION COST 4,855,012 21.0 BAD ROAD 4,831,827 20.9 LOW PRICE 4,891,673 21.1 SCARCITY OF TRANSPORT 3,484,814 15.0 OTHERS 1,950,664 8.4 Total 23,173,320 100.0

210
TABLE 2.2.2.15a Distribution of Livestock Farmers by Possession of any Information and Communication Technology Facility
ACCESS TO RADIO ACCESS TO TELEVISION ACCESS TO TELEPHONE (FIXED) ACCESS TO TELEPHONE
(MOBILE) ACCESS TO PERSONAL COMPUTER
STATE Yes No Yes No Yes No Yes No Yes No
Abia 133782.6061 9434.787878 77677.51515 65539.87878 0 143217.3939 58875.0909 84342.30303 872.969697 142344.4242 Adamawa 157244.76 15210.
13333 37120.56389 135334.3294 2651.766667 169803.1267 19936.61556 152518.2778 520.3466667 171934.5467
Akwa ibom 168542.5587 17902.14231 102685.6817 83759.01923 5847.553846 180597.1471 109833.3577 76611.34327 5733.71827 180710.9827 Anambra 152830.9 743.1 132519.5 21054.5 10238.26667 143335.7333 121455.5667 32118.43334 1651.333333 151922.6667 Bauchi 305417.8456 113510.2427 146182.3515 272745.7368 2283.764706 416644.3235 121198.9172 297729.1711 0 418928.0882 Benue 321312.0857 51774.87857 52890.23572 320196.7286 8209.028572 364877.9357 52734.08572 320352.8786 2074.564286 371012.4 Borno 243854.9679 83814.10358 22414.89524 305254.1762 0 327669.0714 35407.6 292261.4714 743.8571429 326925.2143 C/Rvers 56973.70181 12220.465 34690.90609 34503.26071 0 69194.16681 44376.98395 24817.18286 3439.115619 65755.05119 Delta 0 6569 0 6569 0 6569 0 6569 0 6569 Ebonyi 150150.7901 42391.94568 45974.19259 146568.5432 1138.425926 191404.3099 52476.88148 140065.8543 1138.425926 191404.3099 Edo 46122.51098 27356.12341 36724.14361 36754.49078 2632.371158 70846.26324 32438.6332 41040.00119 409.354 73069.28039 Enugu 149300.3903 54172.428 26377.22967 177095.5887 0 203472.8183 31773.46633 171699.352 0 203472.8183 Imo 4300.285714 0 4300.285714 0 0 4300.285714 4300.285714 0 4300.285714 0 Jigawa 309730.5667 42797.43333 88143.12778 264384.8722 56896.32778 295631.6722 106637.4944 245890.5056 59299.92778 293228.0722 Kaduna 348823.6071 131640.6429 114921.4286 365542.8214 0 480464.25 140611.9286 339852.3214 4671 475793.25 Kano 1013902.359 125883.6667 181040.8907 958745.1348 9171.851852 1130614.174 228619.8722 911166.1533 6053.422222 1133732.603 Katsina 362375.1078 88396.17157 31169.35294 419601.9265 5344.705883 445426.5735 42824.45588 407946.8235 5344.705883 445426.5735 Kebbi 149153.3839 15398.60085 19477.42542 145074.5593 5187.166102 159364.8186 5966.518645 158585.4661 229.9728814 164322.0119 Kogi 106136.4255 15016.82553 32645.98724 88507.26383 657.1914894 120496.0596 50505.16596 70648.08511 0 121153.2511 Kwara 83452.30944 10532.23636 31909.99103 62074.55478 596.7272727 93387.81854 39853.92296 54130.62285 1163.6183 92820.92751 Nassarawa 144921.3073 14769.87368 35376.76083 124314.4202 2543.194737 157147.9863 43950.41114 115740.7699 1496.331579 158194.8494 Niger 185435.5265 4957.061224 79902.30204 110490.2857 8655.67347 181736.9143 83562.54693 106830.0408 5377.567347 185015.0204 Ogun 36901.33333 0 10853.33333 26048 0 36901.33333 10853.33333 26048 0 36901.33333 Ondo 58259.28767 7708.148148 40008.45433 25958.98148 0 65967.43582 40086.88026 25880.55556 0 65967.43582 Osun 18127.25113 5812.95 19468.70113 4471.5 2235.75 21704.45113 17680.10113 6260.1 470.6842105 23469.51692 Oyo 160143.104 40722.496 43263.36 157602.24 1648.128 199217.472 77307.504 123558.096 0 200865.6 Plateau 179998.8123 49205.42925 37927.47736 191276.7642 3490.909434 225713.3321 33882.07264 195322.1689 848.618868 228355.6226 Rivers 84444.58548 27515.95162 53304.36451 58656.17258 3027.645161 108932.8919 56661.48871 55299.04839 11077.61936 100882.9177 Sokoto 274840.0234 15691.34737 84163.72105 206367.6497 5337.192982 285194.1778 138765.7468 151765.624 9835.684211 280695.6866 Taraba 100371.3277 26280.70614 16327.87105 110324.1628 379.625 126272.4088 14107.39781 112544.636 1198.815789 125453.218 Yobe 129844.91 20330.96 20639.45 129536.42 146.9 150028.97 40806.37167 109369.4983 146.9 150028.97 Zamfara 186890.45 3032.571429 0 189923.0214 0 189923.0214 1920 188003.0214 0 189923.0214 FCT 7812 1260 2772 6300 1596 7476 2646 6426 798 8274 Total 5831397.081 1082052.422 1662873.5 5250576.003 139916.1667 6773533.337 1862056.697 5051392.806 128896.8391 6784552.665

211
TABLE 2.2.2.15a (Contd) Distribution of Livestock Farmers by Possession of any Information and Communication Technology Facility
ACCESS TO INTERNET ACCESS TO WEBSITE
STATE Yes No Yes No
Abia 0 143217.3939 0 143217.3939 Adamawa 3172.113334 169282.78 520.3466667 171934.5467 Akwa ibom 1150.338462 185294.3625 0 186444.701 Anambra 412.8333333 153161.1667 412.8333333 153161.1667 Bauchi 0 418928.0882 0 418928.0882 Benue 8142.107145 364944.8572 0 373086.9643 Borno 0 327669.0714 0 327669.0714 C/Rvers 2571.763238 66622.40357 1460.468 67733.69881 Delta 0 6569 0 6569 Ebonyi 1138.425926 191404.3099 1138.425926 191404.3099 Edo 0 73478.63439 0 73478.63439 Enugu 0 203472.8183 0 203472.8183 Imo 4300.285714 0 0 4300.285714 Jigawa 56940.83889 295587.1611 3672.166667 348855.8333 Kaduna 0 480464.25 0 480464.25 Kano 6053.422222 1133732.603 6053.422222 1133732.603 Katsina 5344.705883 445426.5735 5344.705883 445426.5735 Kebbi 0 164551.9847 536.6033898 164015.3814 Kogi 0 121153.2511 0 121153.2511 Kwara 268.5272727 93716.01854 179.0181818 93805.52763 Nassarawa 2099.41579 157591.7652 989.9684211 158701.2126 Niger 4843.493877 185549.0939 3130.77551 187261.8122 Ogun 0 36901.33333 0 36901.33333 Ondo 0 65967.43582 0 65967.43582 Osun 0 23940.20113 0 23940.20113 Oyo 0 200865.6 0 200865.6 Plateau 1137.920755 228066.3208 0 229204.2415 Rivers 8797.980645 103162.5565 427.4322581 111533.1048 Sokoto 5718.421053 284812.9497 1448.666667 289082.7041 Taraba 0 126652.0338 0 126652.0338 Yobe 146.9 150028.97 146.9 150028.97 Zamfara 0 189923.0214 0 189923.0214 FCT 126 8946 126 8946 Total 112365.4935 6801084.01 25587.73312 6887861.77

212
TABLE 2.2.2.15b Distribution of livestock farmers by possession of any information and communication technology facility
OWN A RADIO OWN A TELEVISION OWN A TELEPHONE (FIXED)
OWN A TELEPHONE (MOBILE)
STATE
Yes No Yes No Yes No Yes No Abia 130358 12859.5 75428 67789.5 7050.9 136166 47829 94045.7 Adamawa 150840 21614.4 32017 140438 1834.6 169049 21714 150740 Akwa ibom 149969 36475.3 56588 129856 359.48 163342 37458 135590 Anambra 140694 12880.4 63246 90327.9 0 151097 54246 99327.7 Bauchi 331990 86937.7 40815 378113 0 402585 36486 382443 Benue 304983 68103.7 36071 337016 1360.7 358632 29981 330012 Borno 238769 88900.2 8393.2 319276 0 327669 2913.4 324756 Cross_rivers 51925.7 17268.5 13766 55428.1 0 68868.9 11445 57423.8 Delta 0 6569 0 6569 0 0 0 0 Ebonyi 167904 24638.6 28864 163678 4538.5 170773 51457 125713 Edo 46546.7 26932 34063 39415.4 1491.9 70004.1 25843 45652.8 Enugu 140393 63079.8 13602 189871 440.53 203032 8590.4 194882 Imo 4300.29 0 4300.3 0 0 4300.29 4300.3 0 Jigawa 296316 56212 11617 340911 1780.4 350748 20386 332142 Kaduna 383041 97423.7 77220 403244 1557 478907 31918 448546 Kano 887388 252398 119005 1020781 4803.8 1134982 117365 1022421 Katsina 285820 164951 11637 439134 1797.8 448974 16277 434494 Kebbi 144282 20269.6 24585 139967 5021.1 159531 4918.9 159633 Kogi 92729.7 28423.5 13259 107894 0 98430.9 18385 79618.7 Kwara 79827.2 14157.4 27688 66296.4 89.509 93895 21340 72644.1 Nassarawa 142532 17159.5 26917 132774 2173.4 155231 24271 133133 Niger 183486 6906.12 35445 154947 184.16 188901 29337 159748 Ogun 25396.8 11504.5 6946.1 29955.2 0 36901.3 3256 33645.3 Ondo 55973.7 9993.7 26295 39672.3 0 65250.4 18710 46540.2 Osun 15891.5 8048.7 8641.9 15298.3 0 20810.2 3984 16826.1 Oyo 148452 52413.9 39864 161002 0 199217 54955 144881 Plateau 162564 66640.7 7425.4 221779 1813 221528 10979 211456 Rivers 68736.5 43224.1 42227 69733.8 2600.2 94337.9 43945 54631.2 Sokoto 258737 31794.4 32256 258276 1570.7 288961 18653 271878 Taraba 96628.4 30023.7 18259 108393 2430.9 124221 11886 114766 Yobe 116803 33373.2 10136 140040 0 150176 12340 137836 Zamfara 173178 16745.3 0 189923 0 189923 1920 188003 FCT 7560 1512 1722 7350 0 9072 1722 7350 Total 5484016 1429434 948299 5965150 42898 6735516 798813 6010778

213
TABLE 2.2.2.15b Distribution of livestock farmers by possession of any information and communication technology facility
OWN A PERSONAL COMPUTER
OWN AN INTERNET OWN A WEBSITE STATE
Yes No Yes No Yes No Abia 335.76 142882 335.7575758 142882 2350.3 140867 Adamawa 1954.6 170500 1434.288889 171021 1434.3 171021 Akwa ibom 359.48 186085 359.4807692 186085 359.48 186085 Anambra 0 153574 0 153574 0 153574 Bauchi 0 418928 0 418928 0 418928 Benue 0 373087 0 373087 0 373087 Borno 0 327669 0 327669 0 327669 Cross_rivers 0 69194.2 0 69194.2 0 69194.2 Delta 0 6569 0 6569 0 6569 Ebonyi 6296.3 186246 6296.254321 186246 6296.3 186246 Edo 0 73478.6 0 73478.6 0 73478.6 Enugu 0 203473 0 203473 0 203473 Imo 2150.1 2150.14 0 4300.29 0 4300.29 Jigawa 890.22 351638 2114.277778 350414 1502.3 351026 Kaduna 0 480464 0 480464 0 480464 Kano 4585.9 1135200 4815.222222 1134971 4081.5 1135705 Katsina 2720.9 448050 1797.764706 448974 1797.8 448974 Kebbi 1648.1 162904 2504.149153 162048 3168.5 161383 Kogi 0 121153 0 121153 0 121153 Kwara 179.02 93805.5 0 93984.5 0 93984.5 Nassarawa 0 159691 0 159691 0 159691 Niger 184.16 190208 184.1632653 190208 184.16 190208 Ogun 0 36901.3 0 36901.3 0 36901.3 Ondo 0 65967.4 0 65967.4 0 65967.4 Osun 0 23940.2 0 23940.2 0 23940.2 Oyo 0 200866 0 200866 0 200866 Plateau 1813 227391 1812.958491 227391 1813 227391 Rivers 3027.6 108933 0 111961 0 111961 Sokoto 0 290531 686.2105263 289845 0 290531 Taraba 0 126652 0 126652 0 126652 Yobe 0 150176 0 150176 0 150176 Zamfara 0 189923 0 189923 0 189923 FCT 0 9072 0 9072 0 9072 Total 26145 6887304 22340.5277 6891109 22987 6890462
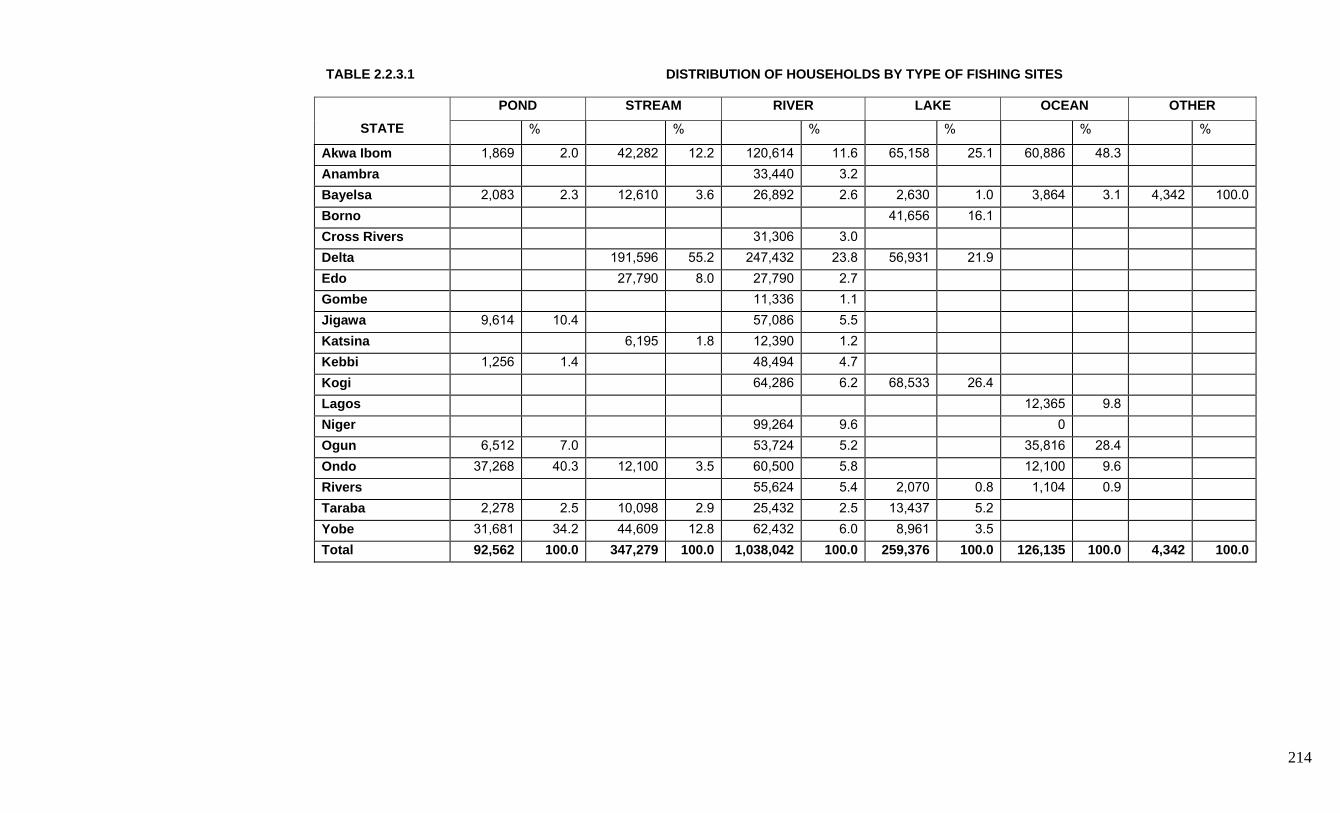
214
TABLE 2.2.3.1 DISTRIBUTION OF HOUSEHOLDS BY TYPE OF FISHING SITES
POND STREAM RIVER LAKE OCEAN OTHER STATE % % % % % %
Akwa Ibom 1,869 2.0 42,282 12.2 120,614 11.6 65,158 25.1 60,886 48.3 Anambra 33,440 3.2 Bayelsa 2,083 2.3 12,610 3.6 26,892 2.6 2,630 1.0 3,864 3.1 4,342 100.0 Borno 41,656 16.1 Cross Rivers 31,306 3.0 Delta 191,596 55.2 247,432 23.8 56,931 21.9 Edo 27,790 8.0 27,790 2.7 Gombe 11,336 1.1 Jigawa 9,614 10.4 57,086 5.5 Katsina 6,195 1.8 12,390 1.2 Kebbi 1,256 1.4 48,494 4.7 Kogi 64,286 6.2 68,533 26.4 Lagos 12,365 9.8 Niger 99,264 9.6 0 Ogun 6,512 7.0 53,724 5.2 35,816 28.4 Ondo 37,268 40.3 12,100 3.5 60,500 5.8 12,100 9.6 Rivers 55,624 5.4 2,070 0.8 1,104 0.9 Taraba 2,278 2.5 10,098 2.9 25,432 2.5 13,437 5.2 Yobe 31,681 34.2 44,609 12.8 62,432 6.0 8,961 3.5 Total 92,562 100.0 347,279 100.0 1,038,042 100.0 259,376 100.0 126,135 100.0 4,342 100.0

215
TABLE 2.2.3.2 Number of Persons Engaged in Fish Farming by Sex, 2006
QUARTER MALE
FEMALE
1ST APR - JUN 2ND JUL - SEP 3RD OCT - DEC 4TH JAN - MAR
443,857
507,457
451,285
490,510
99013
123795
122830
141046 TABLE 2.2.3.3 Distribution of Household by POND Capacity 2006
ITEM
AVAILABLE CAPACITY
UTILIZED CAPACITY
Fresh Fish Shrimps Other
53244937
0
654751
35442617
0
486256

216
TABLE 2.2.3.4 Quarterly fish production by type
ITEM Qtr1 Qtr2 Qtr3 Qtr4
ARTISANAL 0 878 1,703,684 809,300
COASTAL & BRAKISH WATER 18,286,022 46,992,423 80104,319 59,858,439
INLAND RIVERS & LAKES 257,386,211 211,628,506 195,332,184 548,025,669
IN SHORES 128,854 122,106 1,068,398 438,141
FISH FARMS/PONDS 7806 4,757 124,019 308,983
DISTANT WATERS 75,115,268 54,157,938 10,685,258 14,252,777
SHRIMPS 16,126,896 10,840,404 9,963,334 7,700,848
CRABS 207,465 183,048 165,630 124,223
PERIWINCLES 487,918 539,402 302,551 289,162
OTHERS 4,447,886 61,329,889 34,424,554 25,407,367
TABLE 2.2.3.5: Distribution of Fish Holdings by Source of Input
MINISTRY/EXTENTION
AGROCENTRE
SERVICE CENTER
ITEM
NUMBER % NUMBER % NUMBER %
FINGERLINGS 21780 50 0 0 0 0 FERTILIZER 0 0 0 0 14071 80.5 FISH FEED 21780 50 1220 100.0 3419 19.5 POULTRY DROPPINGS 0 0 0 0 0 0 WATER TREATMENT CHEMICAL 0 0 0 0 0 0 OTHERS 0 0 0 0 0 0
TABLE 2.2.3.5: Distribution of Fish Holdings by Source of Input (Contd)
COOPERATIVELOCAL
MARKET OTHERS
ITEM NUMEBER % NUMBER % NUMBER %
FINGERLINGS 0 0 107068 25.8 9389 9.1 FERTILIZER 0 0 18348 4.4 18499 17.9 FISH FEED 0 0 108424 26.2 47131 45.6 POULTRY DROPPINGS 0 0 3256 8 3256 3.2 WATER TREATMENT CHEMICAL 0 0 3256 8 0 0 OTHERS 0 0 174171 42.0 25072 24.3
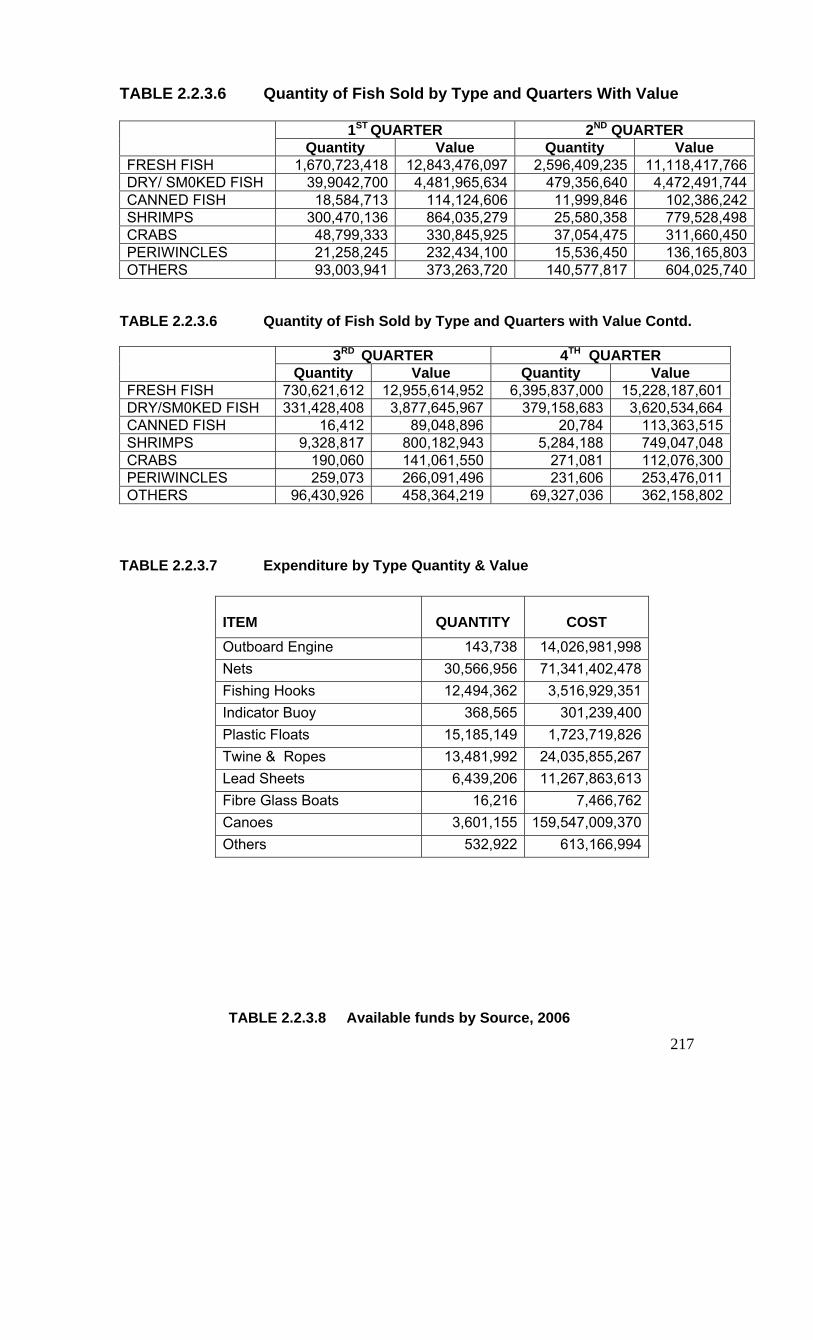
217
TABLE 2.2.3.6 Quantity of Fish Sold by Type and Quarters With Value
1ST QUARTER 2ND QUARTER Quantity Value Quantity Value
FRESH FISH 1,670,723,418 12,843,476,097 2,596,409,235 11,118,417,766DRY/ SM0KED FISH 39,9042,700 4,481,965,634 479,356,640 4,472,491,744CANNED FISH 18,584,713 114,124,606 11,999,846 102,386,242SHRIMPS 300,470,136 864,035,279 25,580,358 779,528,498CRABS 48,799,333 330,845,925 37,054,475 311,660,450PERIWINCLES 21,258,245 232,434,100 15,536,450 136,165,803OTHERS 93,003,941 373,263,720 140,577,817 604,025,740
TABLE 2.2.3.6 Quantity of Fish Sold by Type and Quarters with Value Contd.
3RD QUARTER 4TH QUARTER Quantity Value Quantity Value
FRESH FISH 730,621,612 12,955,614,952 6,395,837,000 15,228,187,601DRY/SM0KED FISH 331,428,408 3,877,645,967 379,158,683 3,620,534,664CANNED FISH 16,412 89,048,896 20,784 113,363,515SHRIMPS 9,328,817 800,182,943 5,284,188 749,047,048CRABS 190,060 141,061,550 271,081 112,076,300PERIWINCLES 259,073 266,091,496 231,606 253,476,011OTHERS 96,430,926 458,364,219 69,327,036 362,158,802
TABLE 2.2.3.7 Expenditure by Type Quantity & Value
ITEM
QUANTITY
COST
Outboard Engine 143,738 14,026,981,998 Nets 30,566,956 71,341,402,478 Fishing Hooks 12,494,362 3,516,929,351 Indicator Buoy 368,565 301,239,400 Plastic Floats 15,185,149 1,723,719,826 Twine & Ropes 13,481,992 24,035,855,267 Lead Sheets 6,439,206 11,267,863,613 Fibre Glass Boats 16,216 7,466,762 Canoes 3,601,155 159,547,009,370 Others 532,922 613,166,994
TABLE 2.2.3.8 Available funds by Source, 2006

218
ITEM
QUANTITY
Own Funds 28,336,555,514Retained Profit 7,315,652,685Short-Term Private Loan 1,732,028,670NACRDB 158,838,439Other Banks 0Social Capital 1,006,340,193Others 648,797,285Total 39,198,212,785
TABLE 2.2.3.9 Fish Processing Facilities by Capacity (KG) 2006
ITEM
AVAILABLE CAPACITY
UTILIZED CAPACITY
% UTILIZATION
Smoking Kiln 6564924 5171077 78.77
Canning 46619 29109 62.44
Ice Block Plants 126788 65606 51.67
Others 533780 428220 80.22
TABLE 2.2.3.10: Fish Storage Facilities by Capacity (KG) 2006
ITEM AVAILABLE
CAPACITYUTILIZED
CAPACITY%
UTILIZATION Refrigerator 20,054 17,205 85.79
Warehouse 184,464 82,663 44.81
Store 671,726,572 2,185,260 0.33
Others 417,463 363,014 86.96
TABLE 2.2.3.11 Distribution of Fish Farmers by Market Channel 2006
NUMBER
%
At the Fish sites 1,238,902 19.9
In the open Market 1,248,475 20.0%
In the Cooperative Society 1,248,475 20.0%
Direct to the Industry 1,256,807 20.1%
Others 1,248,475 20.0%

219
TABLE 2.2.3.12 Comparison of 2005 Fishing Seasons with 2006
ITEM BETTER SAME WORST DON’T KNOW
Weather 750,118 246,681 56,635 230,315
Production/Output 791,856 193,631 101,648 196,311
Income 727,145 335,742 148,399 83,929
Price 685,551 435,968 69,612 42,884
TABLE 2.2.3.13 Fish farmers Expectation in 2007 Fishing Season
ITEM BETTER SAME WORST DON’T KNOW
Weather 930669 70,455 6,402 724,064
Production/Output 978812 96,045 4,326 678,063
Income 996782 225,451 63,328 478,863
Price 977951 219,654 47,144 524,411
TABLE 2.2.3.14 Distribution of Fish farmers by “desired government
assistance”, 2006
ITEM NUMBER
%
Credit 1,214,269 40.6
Input 636,102 21.3
Infrastructure 845,796 28.3
Others 292,297 9.8
TABLE 2.2.3.15 Distribution of Fish Farmers by Problems Encountered when Purchasing Fishing Tools, 2006

220
ITEM NUMBER
%
High Cost 930,912 37.6
Scarcity 281,740 11.4
Lack of Transportation 411,134 16.6
Far Distance 630,042 25.5
Others 221,458 8.9
TABLE 2.2.3.16 Distribution of Holders by Problems
Encountered During Production Process 2006
ITEM NUMBER
% Lack of Transport 581,178 21.4
Needs on the Sea 728,989 26.9
Too much Rain 443,944 16.4
Distance to Site 619,490 22.9
Others 335,854 12.4
TABLE 2.2.3.17 Distribution of Holders by Problems Encountered During Storage Process 2006
Item Number %
Obsolete Equipment 508,907 21.3
Lack of Electricity 648,266 27.1
Lack of Funds 893,565 37.4
PSSTS 164,276 6.9
Others 173,754 7.3

221
TABLE 2.2.3.18 Distribution of Holders by Problems Encountered During Marketing 2006
Item Number %
Distance to Market 609,244 17.2
Poor road Network 664,435 18.8
High Cost of Transport 798,986 22.6
Poor Pricing Policy 535,629 15.1
No. Government Support 662,139 18.7
Others 269,035 7.6

222
TABLE 2.2.3.19a Distribution of Holders by access to Information and Communication Technology Facility, 2006
ACCESS TO RADIO ACCESS TO TELEVISION ACCESS TO TELEPHONE FIXED
ACCESS TO TELEPHONE MOBILE
STATE
YES NO YES NO YES NO YES NO Akwa ibom 117498.8571 5785.92857 68808.04286 54476.74 445.0714286 122839.714 103345.5857 19939.2 Anambra 33439.5 0 22293 11146.5 0 33439.5 33439.5 0 Bayelsa 26935.78788 2151.54545 15251.09091 13836.24 107.3333333 28980 16025.19192 13062.14141 Borno 41656 0 41656 0 0 41656 0 41656 Cross_rivers 24191 7115 22768 8538 8538 22768 21345 9961 Delta 101819.486 174078.52 0 275898 0 275898.006 56931.34 218966.666 Edo 27790 0 27790 0 0 27790 22232 5558 Gombe 11335.5 0 11335.5 0 0 11335.5 0 11335.5 Jigawa 57085.5 0 0 57085.5 0 57085.5 0 57085.5 Katsina 15487.5 0 0 15487.5 0 15487.5 0 15487.5 Kebbi 76636.315 0 0 76636.32 0 76636.315 0 76636.315 Kogi 87837.75 0 19305 68532.75 0 87837.75 25868.7 61969.05 Lagos 12365 0 12365 0 0 12365 12365 0 Niger 99264 0 18499.2 80764.8 18499.2 80764.8 18499.2 80764.8 Ogun 78144 0 6512 71632 0 78144 6512 71632 Ondo 93170 9680 67034 35816 0 102850 55660 47190 Rivers 38785.025 22636.1 19323.5 42097.63 0 61421.125 37818.85 23602.275 Taraba 28242 4782.75 2884.625 30140.13 0 33024.75 5542 27482.75 Yobe 85936.499 0 19537.7 66398.8 0 85936.499 55185.433 30751.066 TOTAL 1057619.72 226229.844 375362.6588 908486.9 27589.60476 1256259.96 470769.8006 813079.7634
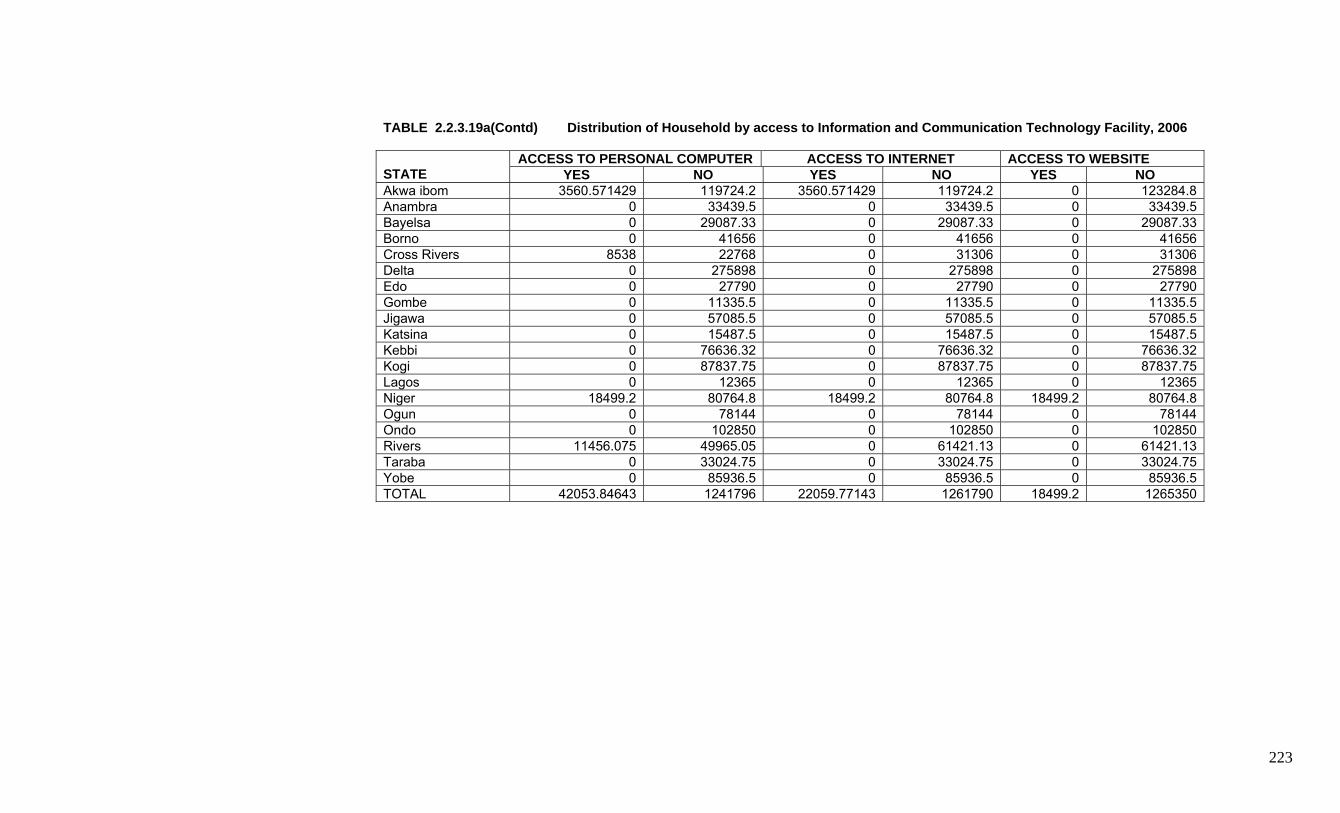
223
TABLE 2.2.3.19a(Contd) Distribution of Household by access to Information and Communication Technology Facility, 2006
ACCESS TO PERSONAL COMPUTER ACCESS TO INTERNET ACCESS TO WEBSITE STATE YES NO YES NO YES NO Akwa ibom 3560.571429 119724.2 3560.571429 119724.2 0 123284.8 Anambra 0 33439.5 0 33439.5 0 33439.5 Bayelsa 0 29087.33 0 29087.33 0 29087.33 Borno 0 41656 0 41656 0 41656 Cross Rivers 8538 22768 0 31306 0 31306 Delta 0 275898 0 275898 0 275898 Edo 0 27790 0 27790 0 27790 Gombe 0 11335.5 0 11335.5 0 11335.5 Jigawa 0 57085.5 0 57085.5 0 57085.5 Katsina 0 15487.5 0 15487.5 0 15487.5 Kebbi 0 76636.32 0 76636.32 0 76636.32 Kogi 0 87837.75 0 87837.75 0 87837.75 Lagos 0 12365 0 12365 0 12365 Niger 18499.2 80764.8 18499.2 80764.8 18499.2 80764.8 Ogun 0 78144 0 78144 0 78144 Ondo 0 102850 0 102850 0 102850 Rivers 11456.075 49965.05 0 61421.13 0 61421.13 Taraba 0 33024.75 0 33024.75 0 33024.75 Yobe 0 85936.5 0 85936.5 0 85936.5 TOTAL 42053.84643 1241796 22059.77143 1261790 18499.2 1265350

224
TABLE 2.2.3.19b Distribution of Household by Possession of Information and Communication Technology Facility, 2006
OWN RADIO
OWN TELEVISION
OWN TELEPHONE
FIXED
OWN TELEPHONE MOBILE
OWN PERSONAL
COMPUTER
OWN INTERNET
OWN WEBSITE
STATE
YES
NO
YES
NO
YES
NO
YES
NO
YES
NO
YES
NO
YES
NO Akwa ibom 117499 5785.9 65693 57592 7566.2 115719 45486.3 77798.48572 0 123284.7857 0 123285 0 123285
Anambra 33440 0 11147 22293 0 33440 33439.5 0 0 33439.5 0 33440 0 33440
Bayelsa 24096 4991 10359 18728 0 29087 2592.262626 26495.07071 0 29087.33333 0 29087 0 29087
Borno 24994 16662 0 41656 0 41656 0 41656 0 41656 0 41656 0 41656
Cross Rivers 24191 7115 17076 14230 0 31306 21345 9961 0 31306 0 31306 0 31306
Delta 101819 174079 0 275898 0 275898 0 275898.006 0 275898.006 0 275898 0 275898
Edo 16674 11116 0 27790 0 27790 0 27790 0 27790 0 27790 0 27790
Gombe 11336 0 0 11336 0 11336 0 11335.5 0 11335.5 0 11336 0 11336
Jigawa 57086 0 0 57086 0 57086 0 57085.5 0 57085.5 0 57086 0 57086
Katsina 12390 3097.5 0 15488 0 15488 0 15487.5 0 15487.5 0 15488 0 15488
Kebbi 75380 1256.3 0 76636 0 76636 0 76636.315 0 76636.315 0 76636 0 76636
Kogi 87838 0 19305 68533 0 87838 25868.7 61969.05 0 87837.75 0 87838 0 87838
Lagos 12365 0 12365 0 0 12365 12365 0 0 12365 0 12365 0 12365
Niger 80765 18499 18499 80765 18499 80765 18499.2 80764.8 18499 80764.8 18499 80765 18499 80765
Ogun 6512 71632 6512 71632 0 78144 6512 71632 0 78144 0 78144 0 78144
Ondo 84458 18392 14762 88088 0 102850 36300 66550 0 102850 0 102850 0 102850
Rivers 29399 32022 4830.9 56590 0 61421 11456.075 49965.05 0 61421.125 0 61421 0 61421
Taraba 27483 5542 2505 30520 0 33025 1518.5 31506.25 0 33024.75 0 33025 0 33025
Yobe 85936 0 12193 73744 0 85936 15375.533 70560.966 0 85936.499 0 85936 0 85936

225
TABLE 2.2.3.19b Distribution of Household by Possession of Information and Communication Technology Facility, 2006 (Contd)
OWN TELEPHONE MOBILE
OWN PERSONAL COMPUTER
OWN INTERNET
OWN WEBSITE
Quantity % Quantity % Quantity % Quantity % 45486.3 19.71 0 0 0 0 0 0
33439.5 14.49 0 0 0 0 0 0
2592.262626 1.12 0 0 0 0 0 0
0 0 0 0 0 0 0 0
21345 9.25 0 0 0 0 0 0
0 0 0 0 0 0 0 0
0 0 0 0 0 0 0 0
0 0 0 0 0 0 0 0
0 0 0 0 0 0 0 0
0 0 0 0 0 0 0 0
0 0 0 0 0 0 0 0
25868.7 11.21 0 0 0 0 0 0
12365 5.36 0 0 0 0 0 0
18499.2 8.02 18499.2 100 18499.2 100 18499.2 100
6512 2.82 0 0 0 0 0 0
36300 15.73 0 0 0 0 0 0
11456.075 4.96 0 0 0 0 0 0
1518.5 0.66 0 0 0 0 0 0
15375.533 6.66 0 0 0 0 0 0
230758.0706 18499.2 18499.2 18499.2

226
TABLE 2.2.3.19b Distribution of Household by Possession of Information and Communication Technology Facility, 2006 (Contd)
ACCESS TO RADIO
YES
ACCESS TO TELEVISION
ACCESS TO
TELEPHONE FIXED
STATE Quantity % Quantity Quantity %
Akwa ibom 117498.857 11.11 68808.0429 18.33 445.0714 1.61
Anambra 33439.5 3.17 22293 5.94 0 0
Bayelsa 26935.7879 2.54 15251.0909 4.06 107.3333 0.39
Borno 41656 3.94 41656 11.10 0 0
Cross Rivers 24191 2.29 22768 6.07 8538 30.95
Delta 101819.486 9.63 0 0 0 0
Edo 27790 2.63 27790 7.40 0 0
Gombe 11335.5 1.07 11335.5 3.02 0 0
Jigawa 57085.5 5.40 0 0 0 0
Katsina 15487.5 1.46 0 0 0 0
Kebbi 76636.315 7.25 0 0 0 0
Kogi 87837.75 8.31 19305 5.14 0 0
Lagos 12365 1.17 12365 3.29 0 0
Niger 99264 9.39 18499.2 4.93 18499.2 67.05
Ogun 78144 7.39 6512 1.73 0 0
Ondo 93170 8.81 67034 17.86 0 0
Rivers 38785.025 3.67 19323.5 5.15 0 0
Taraba 28242 2.67 2884.625 0.77 0 0
Yobe 85936.499 8.73 19537.7 5.21 0 0
1057619.72 375362.659 27589.6
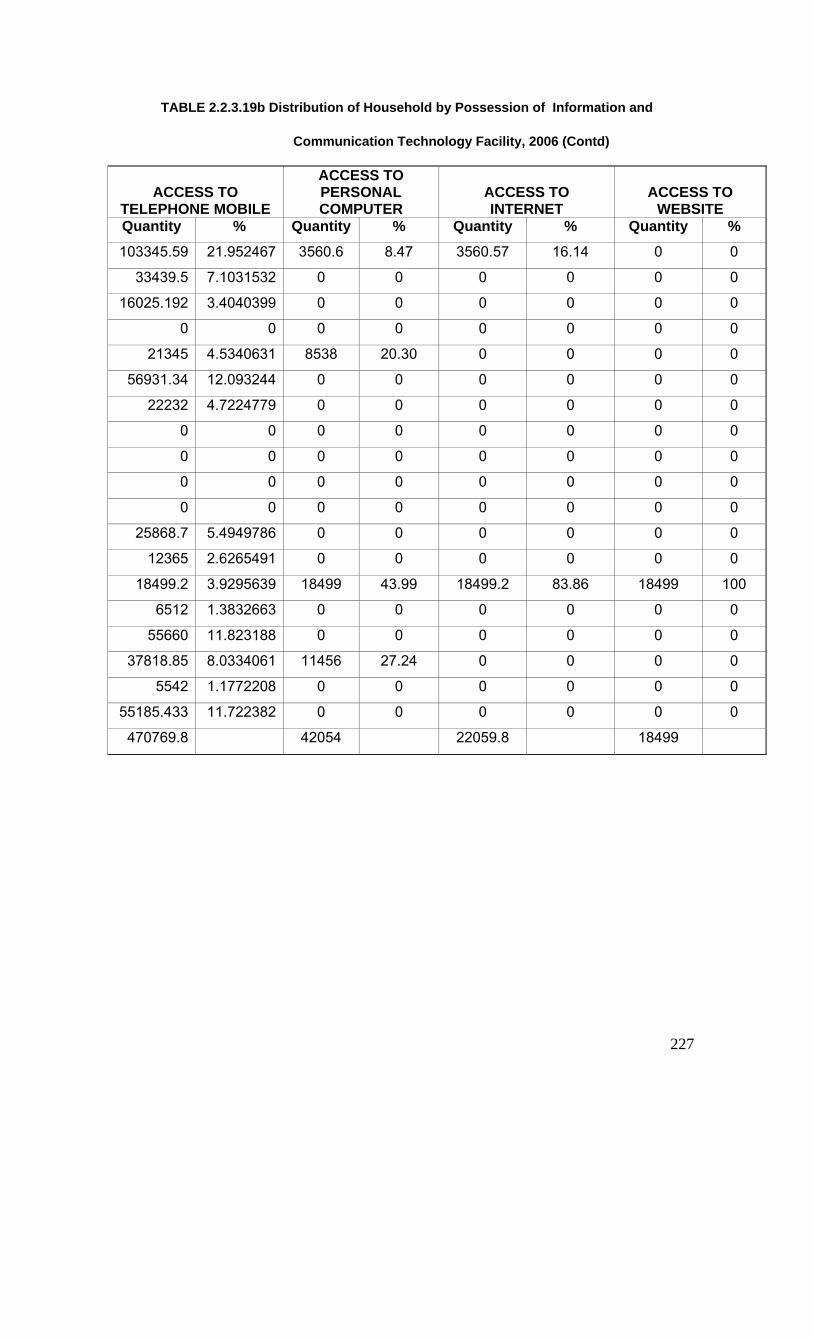
227
TABLE 2.2.3.19b Distribution of Household by Possession of Information and
Communication Technology Facility, 2006 (Contd)
ACCESS TO
TELEPHONE MOBILE
ACCESS TO PERSONAL COMPUTER
ACCESS TO INTERNET
ACCESS TO
WEBSITE Quantity % Quantity % Quantity % Quantity %
103345.59 21.952467 3560.6 8.47 3560.57 16.14 0 0
33439.5 7.1031532 0 0 0 0 0 0
16025.192 3.4040399 0 0 0 0 0 0
0 0 0 0 0 0 0 0
21345 4.5340631 8538 20.30 0 0 0 0
56931.34 12.093244 0 0 0 0 0 0
22232 4.7224779 0 0 0 0 0 0
0 0 0 0 0 0 0 0
0 0 0 0 0 0 0 0
0 0 0 0 0 0 0 0
0 0 0 0 0 0 0 0
25868.7 5.4949786 0 0 0 0 0 0
12365 2.6265491 0 0 0 0 0 0
18499.2 3.9295639 18499 43.99 18499.2 83.86 18499 100
6512 1.3832663 0 0 0 0 0 0
55660 11.823188 0 0 0 0 0 0
37818.85 8.0334061 11456 27.24 0 0 0 0
5542 1.1772208 0 0 0 0 0 0
55185.433 11.722382 0 0 0 0 0 0
470769.8 42054 22059.8 18499
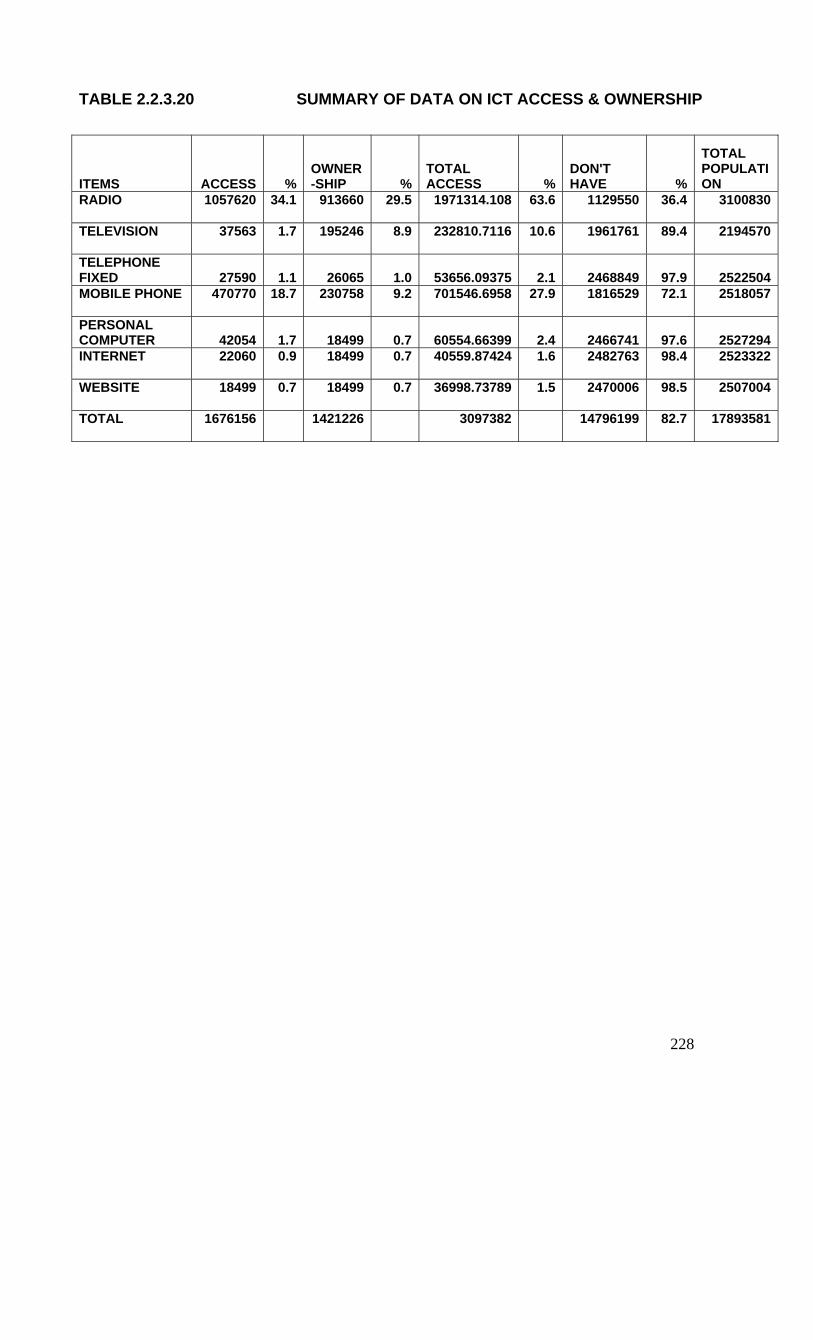
228
TABLE 2.2.3.20 SUMMARY OF DATA ON ICT ACCESS & OWNERSHIP
ITEMS ACCESS % OWNER-SHIP %
TOTAL ACCESS %
DON'T HAVE %
TOTAL POPULATION
RADIO 1057620 34.1 913660 29.5 1971314.108 63.6 1129550 36.4 3100830
TELEVISION 37563 1.7 195246 8.9 232810.7116 10.6 1961761 89.4 2194570
TELEPHONE FIXED 27590 1.1 26065 1.0 53656.09375 2.1 2468849 97.9 2522504MOBILE PHONE 470770 18.7 230758 9.2 701546.6958 27.9 1816529 72.1 2518057
PERSONAL COMPUTER 42054 1.7 18499 0.7 60554.66399 2.4 2466741 97.6 2527294INTERNET 22060 0.9 18499 0.7 40559.87424 1.6 2482763 98.4 2523322
WEBSITE 18499 0.7 18499 0.7 36998.73789 1.5 2470006 98.5 2507004
TOTAL 1676156 1421226 3097382 14796199 82.7 17893581

229
NBS/CBN/NCC COLLABORATIVE SURVEY 2006 TABLE 3.1.1 WHOLESALE AND RETAIL TRADE
ITEM Q1 2006 Q2 2006 1ST HALF '06 Q3 2006 Q4 2006 2ND HALF '06
NUMBER OF PERSONS ENGAGED (of which) 1,651,383 1,939,076 1,939,076 1,962,647 1,981,389 1,981,389 NUMBER OF OPERATIVES 15,457 17,389 17,389 17,389 18,162 18,162
VALUE OF SALES (N'000) 78,101,701 97,044,302 175,146,003 95,480,057 98,619,623 194,099,680
COST OF GOOD SOLD: OPENING STOCK (N'000) 26,430,919 28,036,993 54,467,912 27,666,574 30,181,067 57,847,641 COST OF GOOD SOLD: PURCHASES (N'000) 33,241,803 34,094,995 67,336,798 44,744,679 44,752,568 89,497,247 COST OF GOOD SOLD: LESS CLOSING STOCK (N'000) 17,923,891 18,649,788 36,573,679 18,882,126 20,028,742 38,910,868
COST OF OPERATION: SALARIES AND WAGES (N'000) 3,408,131 3,443,521 6,851,652 3,592,906 3,545,794 7,138,700 COST OF OPERATION: OTHER BENEFITS (N'000) 1,276,584 1,283,829 2,560,413 1,283,829 1,187,320 2,471,149 COST OF OPERATION: IMPORTED MERCHANDISE (N'000) 862,981 898,790 1,761,771 898,790 938,044 1,836,834 COST OF OPERATION: LOCAL MERCHANDISE (N'000) 15,603,157 15,705,946 31,309,103 15,813,243 15,793,664 31,606,907 COST OF OPERATION: DEPRECIATION (N'000) 17,458,024 16,544,422 34,002,446 17,745,266 17,756,698 35,501,964 COST OF OPERATION: OTHER COST (N'000) 5,462,490 6,166,297 11,628,787 6,391,453 8,073,428 14,464,881
CAPITAL EXPENDITURE: NEW MACHINERY AND EQUIPMENT (N'000) 71,180,202 26,782,919 97,963,121 37,881,950 31,938,845 69,820,795 CAPITAL EXPENDITURE: NEW VEHICLES (N'000) 61,027,008 57,549,192 118,576,200 57,549,386 57,603,614 115,153,000 CAPITAL EXPENDITURE: RESIDENTIAL BUILDINGS (N'000) 2,064,116 2,064,277 4,128,393 2,064,341 2,065,114 4,129,455 CAPITAL EXPENDITURE: NON-RESIDENTIAL BUILDINGS (N'000) 76,055,038 82,717,825 158,772,863 50,673,647 47,596,263 98,269,910 CAPITAL EXPENDITURE: MAJOR REPAIRS AND MAINTENANCE (N'000) 42,907,748 47,139,864 90,047,612 40,277,360 63,195,362 103,472,722
SOURCE OF FUNDS INVESTED: COMPANY (N'000) 143,000,000 140,000,000 283,000,000 143,000,000 128,000,000 271,000,000 SOURCE OF FUNDS INVESTED: LOCAL BANK LOANS (N'000) 641,000,000 407,000,000 1,048,000,000 407,000,000 407,000,000 814,000,000 SOURCE OF FUNDS INVESTED: FOREIGN LOANS (N'000) - - - - - - SOURCE OF FUNDS INVESTED: INCREASE IN EQUITY (N'000) 4,727,576 5,192,411 9,919,987 4,758,264 5,549,725 10,307,989 SOURCE OF FUNDS INVESTED: OTHERS (N'000) 1,935,018 1,999,809 3,934,827 1,981,453 2,041,188 4,022,641
WORKING CAPITAL: STOCK VALUE AT COST (N'000) 3,563,216 2,963,292 6,526,508 2,468,219 2,773,623 5,241,842 WORKING CAPITAL: DEBTORS (N'000) 2,845,852 2,877,603 5,723,455 2,604,498 3,113,901 5,718,399 WORKING CAPITAL: PREPAYMENTS (N'000) 426,033 429,478 855,511 447,060 447,189 894,250 WORKING CAPITAL: CASH IN BANKS (N'000) 1,220,520 1,424,327 2,644,847 1,210,763 1,128,036 2,338,799 WORKING CAPITAL: CASH AT HAND (N'000) 3,435,309 4,359,507 7,794,816 4,083,858 5,286,602 9,370,460 WORKING CAPITAL: CURRENT TAXATION (N'000) 95,737 104,077 199,813 85,013 136,633 221,646 WORKING CAPITAL: DIVIDEND AND INTEREST DUE (N'000) 22,574 26,277 48,850 26,277 32,395 58,672 WORKING CAPITAL: TRADE AND OTHER CREDITORS (N'000) 966,479 975,012 1,941,491 1,007,214 1,055,388 2,062,602 WORKING CAPITAL: BANK OVERDRAFT AND LOAN (N'000) 2,044,730 1,722,260 3,766,990 1,542,025 1,472,018 3,014,043 WORKING CAPITAL: MAJOR REPAIRS AND MAINTENANCE (N'000) 153,024 168,030 321,054 128,518 127,552 256,070
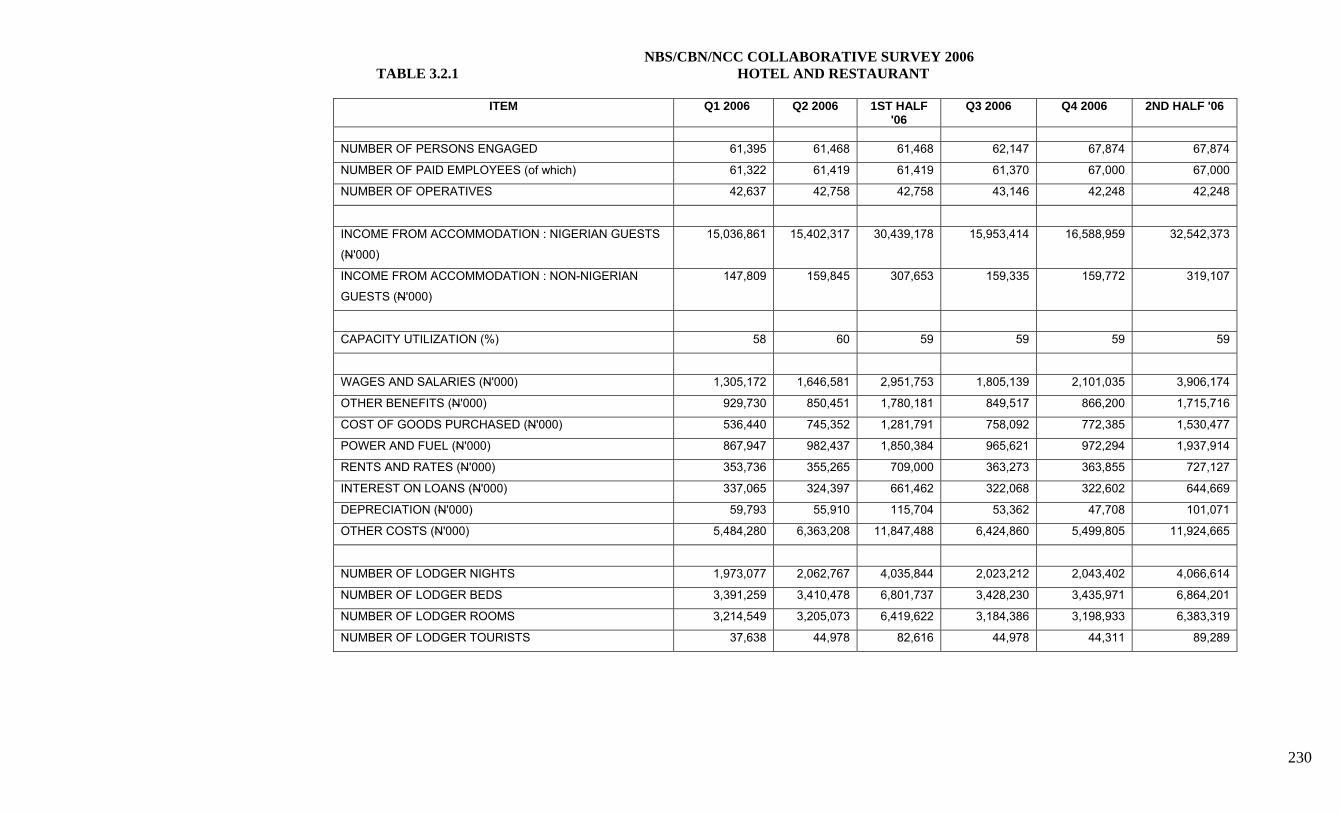
230
NBS/CBN/NCC COLLABORATIVE SURVEY 2006 TABLE 3.2.1 HOTEL AND RESTAURANT
ITEM Q1 2006 Q2 2006 1ST HALF '06
Q3 2006 Q4 2006 2ND HALF '06
NUMBER OF PERSONS ENGAGED 61,395 61,468 61,468 62,147 67,874 67,874
NUMBER OF PAID EMPLOYEES (of which) 61,322 61,419 61,419 61,370 67,000 67,000
NUMBER OF OPERATIVES 42,637 42,758 42,758 43,146 42,248 42,248
INCOME FROM ACCOMMODATION : NIGERIAN GUESTS
(N'000)
15,036,861 15,402,317 30,439,178 15,953,414 16,588,959 32,542,373
INCOME FROM ACCOMMODATION : NON-NIGERIAN
GUESTS (N'000)
147,809 159,845 307,653 159,335 159,772 319,107
CAPACITY UTILIZATION (%) 58 60 59 59 59 59
WAGES AND SALARIES (N'000) 1,305,172 1,646,581 2,951,753 1,805,139 2,101,035 3,906,174
OTHER BENEFITS (N'000) 929,730 850,451 1,780,181 849,517 866,200 1,715,716
COST OF GOODS PURCHASED (N'000) 536,440 745,352 1,281,791 758,092 772,385 1,530,477
POWER AND FUEL (N'000) 867,947 982,437 1,850,384 965,621 972,294 1,937,914
RENTS AND RATES (N'000) 353,736 355,265 709,000 363,273 363,855 727,127
INTEREST ON LOANS (N'000) 337,065 324,397 661,462 322,068 322,602 644,669
DEPRECIATION (N'000) 59,793 55,910 115,704 53,362 47,708 101,071
OTHER COSTS (N'000) 5,484,280 6,363,208 11,847,488 6,424,860 5,499,805 11,924,665
NUMBER OF LODGER NIGHTS 1,973,077 2,062,767 4,035,844 2,023,212 2,043,402 4,066,614
NUMBER OF LODGER BEDS 3,391,259 3,410,478 6,801,737 3,428,230 3,435,971 6,864,201
NUMBER OF LODGER ROOMS 3,214,549 3,205,073 6,419,622 3,184,386 3,198,933 6,383,319
NUMBER OF LODGER TOURISTS 37,638 44,978 82,616 44,978 44,311 89,289

231
NBS/CBN/NCC COLLABORATIVE SURVEY 2006 TABLE 3.3.1 BUILDING AND CONSTRUCTION
ITEM Q1 2006 Q2 2006 1ST HALF '06 Q3 2006 Q4 2006 2ND HALF '06
NUMBER OF PERSONS ENGAGED (of which) 744,119 766,866 766,866 802,686 746,210 746,210
NUMBER OF ARTISANS 10,910 10,922 10,922 10,874 12,633 12,633
VALUE OF WORK DONE (N'000) 33,017,344 26,626,198 59,643,542 30,314,525 26,764,725 57,079,250
VALUE OF NEW CONTRACT SERVICES (N'000) 29,261,870 30,667,580 59,929,450 30,915,826 29,204,598 60,120,424
COST OF OPERATIONS: WAGES AND SALARIES (N'000) 1,103,651 1,283,204 2,386,855 1,374,406 1,522,370 2,896,776
COST OF OPERATIONS: OTHER BENEFITS (N'000) 35,428 38,958 74,386 41,965 42,559 84,523
COST OF OPERATIONS: COST OF MATERIALS (N'000) 8,662,768 8,121,151 16,783,919 8,111,905 8,068,586 16,180,491
COST OF OPERATIONS: COST OF ELECTRICITY & FUEL (N'000) 3,140,957 3,743,578 6,884,535 3,753,347 3,751,136 7,504,483
COST OF OPERATIONS: SPARE PARTS (N'000) 2,072,544 2,055,073 4,127,617 2,045,126 1,152,687 3,197,813
COST OF OPERATIONS: DEPRECIATION (N'000) 1,886,704 1,908,786 3,795,490 1,888,641 1,914,585 3,803,226
COST OF OPERATIONS: RENT (N'000) 958,362 958,362 1,916,725 958,362 942,330 1,900,692
COST OF OPERATIONS: OTHERS (N'000) 2,588,917 2,205,972 4,794,889 4,294,298 5,039,427 9,333,725
SOURCE OF FUND: COMPANY (N'000) 5,769,724 7,730,647 13,500,371 7,179,332 7,821,683 15,001,015
SOURCE OF FUND: LOCAL BANK LOANS (N'000) 3,446,403 3,226,182 6,672,585 3,021,850 3,027,792 6,049,642
SOURCE OF FUND: FOREIGN LOANS (N'000) 2,932,525 2,932,525 5,865,050 2,932,525 2,929,958 5,862,483
SOURCE OF FUND: INCREASE IN EQUITY CAPITAL (N'000) 12,547,796 12,547,891 25,095,687 12,547,927 7,958,879 20,506,806

232
NBS/CBN/NCC COLLABORATIVE SURVEY 2006 TABLE 3.4.1 MANUFACTURING
ITEM Q1 2006 Q2 2006 1ST HALF '06 Q3 2006 Q4 2006 2ND HALF '06 NUMBER ENGAGED MALE 291,697 288,975 288,975 285,288 285,881 285,881 NUMBER ENGAGED FEMALE 91,131 93,742 93,742 100,503 102,083 102,083
NUMBER OF PAID EMPLOYEES MALE 245,649 249,973 249,973 246,417 251,224 251,224 NUMBER OF PAID EMPLOYEES FEMALE 37,313 37,203 37,203 37,269 38,015 38,015
TOTAL INVENTORY VALUE OF OPENING STOCK OF RAW MATERIAL (N'000) 352,000,000 372,000,000 724,000,000 368,000,000 373,000,000 741,000,000 TOTAL INVENTORY VALUE OF CLOSING STOCK OF RAW MATERIAL (N'000) 37,696,918 39,691,563 77,388,481 44,729,754 48,367,340 93,097,094 TOTAL INVENTORY VALUE OF OPENING STOCK OF FINISHED GOODS (N'000) 13,228,882 13,493,385 26,722,267 13,924,609 14,525,913 28,450,522 TOTAL INVENTORY VALUE OF CLOSING STOCK OF FINISHED GOODS (N'000) 18,874,655 19,099,869 37,974,524 19,169,490 21,080,533 40,250,023
VALUE OF SALES: DOMESTIC (N'000) 882,000,000 902,000,000 1,784,000,000 951,000,000 981,000,000 1,932,000,000 VALUE OF SALES: EXPORT (N'000) 8,861,725 8,878,187 17,739,912 11,265,690 11,500,733 22,766,423
COST OF OPERATION: RAW MATERIAL (N'000) 58,480,903 70,004,643 128,485,546 73,597,233 89,822,604 163,419,837 COST OF OPERATION: DEPRECIATIONS (N'000) 27,645,974 27,732,034 55,378,008 27,579,689 28,055,513 55,635,202 COST OF OPERATION: ENERGY (N'000) 140,000,000 163,000,000 303,000,000 182,000,000 192,000,000 374,000,000 COST OF OPERATION: INTEREST CHARGED (N'000) 92,566,552 105,000,000 197,566,552 101,000,000 113,000,000 214,000,000 COST OF OPERATION: WAGES AND SALARIES (N'000) 81,693,260 82,418,968 164,112,228 85,742,162 90,690,759 176,432,921 COST OF OPERATION: SUPPLEMENTARY BENEFITS (N'000) 44,406,429 44,514,702 88,921,131 44,668,891 45,645,165 90,314,056 COST OF OPERATION: OTHERS (N'000) 42,874,088 43,728,349 86,602,437 53,581,427 53,758,816 107,340,243
INSTALLED CAPACITY UTILIZED (%) 54.37 53.63 53.63 53.87 55.05 55.05
CAPITAL EXPENDITURE: MACHINE AND EQUIPMENTS (N'000) 93,319,016 94,213,180 187,532,196 109,000,000 106,000,000 215,000,000 CAPITAL EXPENDITURE: SPAREPARTS (N'000) 35,079,065 36,265,518 71,344,583 36,220,216 37,292,493 73,512,709 CAPITAL EXPENDITURE: REPAIR AND MAINTAINANCE (N'000) 68,712,024 69,647,319 138,359,343 68,437,754 69,663,803 138,101,557 CAPITAL EXPENDITURE: RESEARCH AND DEVELOPMENT (N'000) 50,068,246 48,970,334 99,038,580 45,020,990 45,024,392 90,045,382 CAPITAL EXPENDITURE: VEHICLES (N'000) 54,514,287 54,889,717 109,404,004 57,229,460 57,181,832 114,411,292 CAPITAL EXPENDITURE: BUILDING (N'000) 48,280,489 48,187,866 96,468,355 48,261,679 53,766,432 102,028,111 CAPITAL EXPENDITURE: RESIDENCE (N'000) 11,572,334 11,573,760 23,146,094 11,574,024 11,572,421 23,146,445 CAPITAL EXPENDITURE: NON-RESIDENCE (N'000) 270,824 270,824 541,648 270,824 270,824 541,648 CAPITAL EXPENDITURE: OTHERS (N'000) 2,199,667 2,229,978 4,429,645 2,199,930 2,198,416 4,398,346
QUANTITY OF RAW MATERIAL: IMPORTED (%) 53 53 53 65 54 54 QUANTITY OF RAW MATERIAL: LOCALLY SOURCED (%) 47 47 47 35 46 46
SOURCE OF WORKING CAPITAL: BANK LOANS (N'000) 16,815,042 17,704,926 34,519,968 17,858,895 18,120,523 35,979,418 SOURCE OF WORKING CAPITAL: OWN FUND (N'000) 3,067,405 3,394,395 6,461,800 3,814,337 4,137,157 7,951,494 SOURCE OF WORKING CAPITAL: FOREIGN (N'000) 10,580,279 10,580,279 21,160,558 10,119,358 10,163,255 20,282,613 SOURCE OF WORKING CAPITAL: EQUITY (N'000) 35,733,352 35,960,520 71,693,872 38,537,286 38,531,799 77,069,085 SOURCE OF WORKING CAPITAL: OTHERS (N'000) 41,402,983 41,607,742 83,010,725 41,116,290 42,280,247 83,396,537 FOREIGN EXCHANGE: UTILIZATION 46,138,547 53,165,194 99,303,741 51,882,408 53,533,491 105,415,899 FOREIGN EXCHANGE: DEMAND 20,273,329 20,072,280 40,345,609 20,880,032 21,273,483 42,153,515 FOREIGN EXCHANGE FORECAST: DEMAND 84,614,223 88,525,223 173,139,446 89,764,221 94,298,385 184,062,606

233
NBS/CBN/NCC COLLABORATIVE SURVEY 2006 TABLE 3.4.2 CAPACITY UTILIZATION (%)
PRODUCTS
UNIT OF MEASU-REMENT
NO. OF ESTAB.
1ST QRT '06
2ND QTR '06
1ST HALF '06
3RD QTR '06
4TH QTR '06
2ND HALF '06
MEAT AND DAIRY PRODUCTS KG 2 59 59 58.50 54 55 54.00 VEGETABLE AND GRAIN MILL LITRES 10 50 48 48.80 49 48 48.40 BAKERY PRODUCTS KG 21 47 46 46.60 46 46 46.03 SUGAR, COCOA AND CONFECTIONERY M/TONS 3 45 47 46.00 44 46 45.00 MISCELLANEOUS FOOD PRODUCTS M/TONS 2 26 22 24.00 26 26 26.00 BEER & STOUT HECT 3 58 55 56.50 55 60 57.50 SOFT DRINKS HECT 1 55 35 45.00 35 35 35.00 TEXTILES SQ MTRS 8 55 54 54.60 54 59 56.60 WEARING APPAREL SQ MTRS 6 67 67 67.00 67 67 67.00 KNITTING CARPET AND RUGS SQ MTRS 0 0 0 0.00 0 0 0.00 LEATHER FOOT WEAR PAIRS 3 73 65 69.00 72 81 76.17 WOOD & CORK PRODUCTS TONS 0 0 0 0.00 0 0 0.00 SAWMILL TONS 5 53 53 52.50 53 53 52.50 PAPER MANUFACTURE & PRODUCTS M/TONS 2 63 68 65.00 70 70 70.00 PRINTING AND PUBLISHING M/TONS 12 50 50 49.83 45 50 47.75 BASIC INDUSTRIAL CHEMICAL M/TONS 3 50 50 50.00 49 50 49.25 PAINTS LITRES 6 51 51 51.25 52 52 51.88 DRUGS AND MEDICINE LITRES 5 56 56 56.00 58 57 57.33 SOAP AND PERFUMES M/TONS 6 54 55 54.30 55 53 53.80 OTHER CHEMICALS AND PET.PRODS. M/TONS 1 91 63 77.00 92 89 90.50 TYRES AND TUBES M/TONS 1 65 70 67.50 68 60 64.00 PLASTIC PRODUCTS M/TONS 9 65 65 65.19 65 65 64.88 GLASS AND GLASS PRODUCTS M/TONS 2 44 46 44.75 51 51 51.00 CEMENTS AND CEMENTS PRODUCTS M/TONS 16 52 52 51.50 52 52 52.13 BASIC METAL INDUSTRY M/TONS 0 0 0 0.00 0 0 0.00 STRUCTURAL METAL PRODUCTS M/TONS 2 51 58 54.00 58 54 55.50 FABRICATED METAL PRODUCTS M/TONS 16 60 60 59.69 57 62 59.46 RADIO, TV, ELECTRICAL & COMM. SET 3 53 53 53.17 53 53 53.00 MOTOR VEHICLE ASSEMBLY TONS 1 16 16 16.00 16 16 16.00 FUNITURE SET 9 56 56 56.25 56 56 56.13
TOTAL 158 AVERAGE 48.73 47.26 48.00 48.30 48.82 48.56
WEIGHTED AVERAGE 54.15 52.52 53.33 53.67 54.24 53.96

234
NBS/CBN/NCC COLLABORATIVE SURVEY 2006 TABLE 3.5.1 MINNING AND QUARRYING
ITEM Q1 2006 Q2 2006 1ST HALF '06 Q3 2006 Q4 2006 2ND HALF '06
NUMBER OF PERSONS ENGAGED (OF WHICH)
10,774 11,152 11,152 10,656 10,760 10,760
NUMBER OF OPERATIVES 6,177 5,916 5,916 6,151 6,164 6,164 WAGES AND SALARIES (N'000) 18,183,752 18,262,954 36,446,706 18,151,902 18,357,382 36,509,284 OTHER SUPPLEMENTARY BENEFITS (N'000)
17,551 17,381 34,932 16,232 21,612 37,844
TOTAL EMOLUMENT (N'000) 18,201,303 18,280,335 36,481,638 18,168,134 18,378,994 36,547,128 NEW MACHINERY AND EQUIPMENT (N'000)
8,085,722 8,085,722 16,171,444 8,085,722 8,086,388 16,172,110
NEW VEHICLES (N'000) 797 797 1,593 797 797 1,593 RESIDENTIAL BUILDINGS (N'000)
38,445 38,445 76,890 38,445 38,445 76,890
NON-RESIDENTIAL BUILDINGS (N'000)
32,281 32,281 64,563 32,281 32,281 64,563
MAJOR REPAIRS AND MAINTENANCE (N'000)
14,038 14,587 28,625 14,443 14,378 28,821
OTHER ASSETS ACQUIRED (N'000)
6,921 6,921 13,842 6,921 6,921 13,842
TOTAL CAPITAL EXPENDITURE (N'000)
8,178,204 8,178,753 16,356,957 8,178,609 8,179,210 16,357,819
COST OF MATERIALS, FUEL AND ELECTRICITY (N'000)
34,906 35,102 70,008 34,527 35,207 69,734
RENT (N'000) 200,792 200,805 401,597 201,184 201,184 402,368 DEPRECIATION (N'000) 3,604,464 3,774,228 7,378,692 4,165,927 3,577,001 7,742,928 SPARE PARTS (N'000) 10,640,167 10,715,673 21,355,840 10,297,752 10,454,640 20,752,392 OTHER COSTS (N'000) 3,241,194 3,437,729 6,678,923 3,632,828 3,572,888 7,205,716 OPERATING COST (N'000) 17,721,523 18,163,537 35,885,061 18,332,218 17,840,919 36,173,138 MINERAL TYPE AVESP Q1QTY Q1SPRI Q1VAL Q2QTY Q2SPRI Q2VAL Q3QTY Q3SPRI Q3VA Q4QTY Q4SPRI Q4VAL GOLD 0 0 0 0 0 0 0 0 0 0 0 0 0 KAOLIN 3,030 144 3,030 435,250 150 3,140 471,000 148 3,150 466,200 162 3,200 518,400 MARBLE 1,482 29,382 1,489 43,741,524 29,918 1,450 43,366,524 22,487 1,528 34,357,816 1,471,870 1,463 2,152,736,462 GYPSUM 4,535 55,565 496 27,573,361 32,321 16,624 537,291,720 21,090 496 10,465,565 32,569 522 17,012,298 DOLOMITE 0 0 0 0 0 0 0 0 0 0 0 0 0 CASSITERITE 0 0 0 0 0 0 0 0 0 0 0 0 0 COLUMBITE 0 0 0 0 0 0 0 0 0 0 0 0 0 REFINE TIN 0 0 0 0 0 0 0 0 0 0 0 0 0 BARYTES 0 0 0 0 0 0 0 0 0 0 0 0 0 FEILDSPAR 0 0 0 0 0 0 0 0 0 0 0 0 0 LEAD/ZINC 0 0 0 0 0 0 0 0 0 0 0 0 0 IRON ORE 0 0 0 0 0 0 0 0 0 0 0 0 0 LIMESTONE 209 140 209 29,260 146 210 30,660 152 230 34,960 163 240 39,120 TANTALITE 131 120 113 13,560 135 117 15,795 146 145 21,170 157 150 23,550 GRANITE 770 1,959 627 1,227,832 1,175 1,280 1,504,095 3,330 601 2,000,343 1,685 575 967,941 SALT 367 653 131 85,266 658 148 97,384 670 145 97,150 535 1,045 559,346 WHITE STONE 581 3,918 653 2,557,984 3,918 653 2,557,984 3,918 692 2,711,463 3,931 326 1,283,255
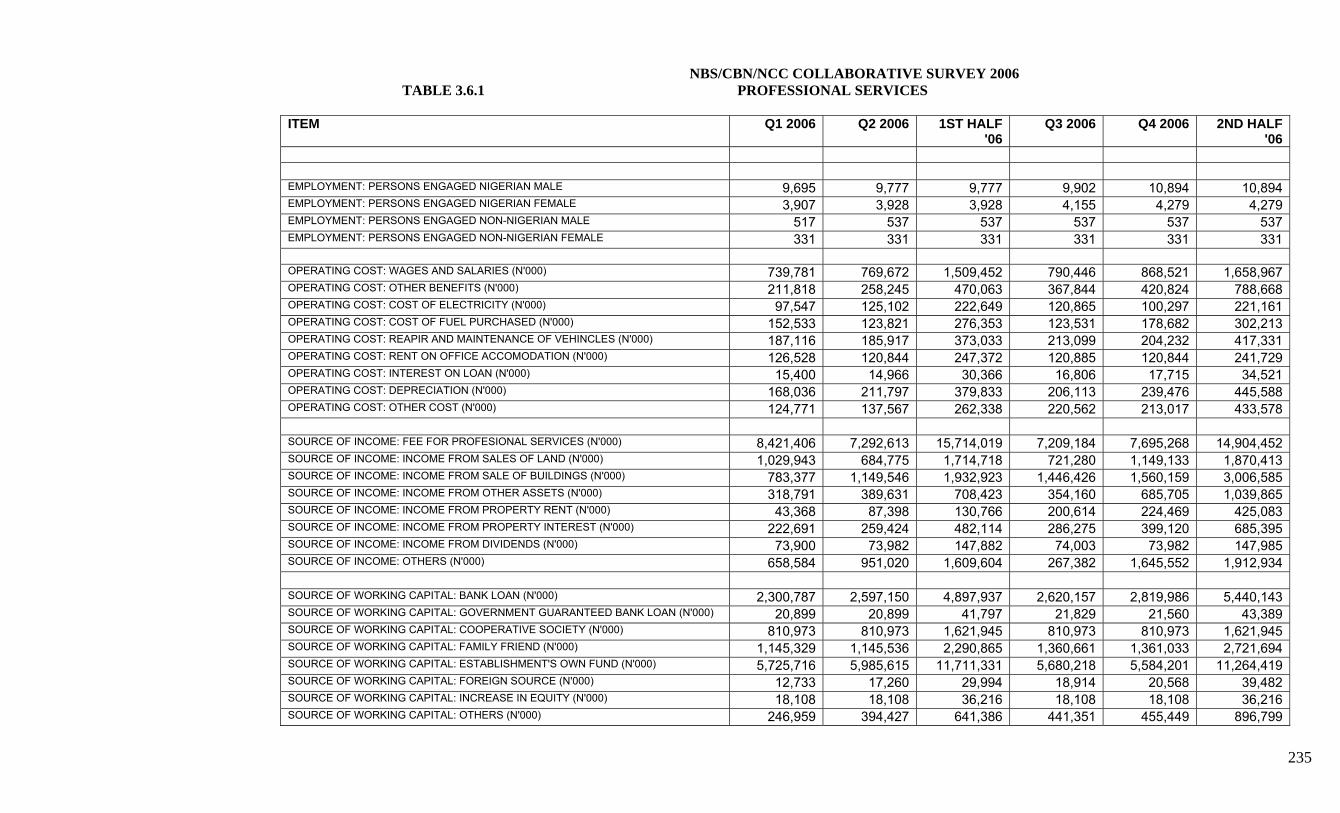
235
NBS/CBN/NCC COLLABORATIVE SURVEY 2006 TABLE 3.6.1 PROFESSIONAL SERVICES
ITEM Q1 2006 Q2 2006 1ST HALF '06
Q3 2006 Q4 2006 2ND HALF '06
EMPLOYMENT: PERSONS ENGAGED NIGERIAN MALE 9,695 9,777 9,777 9,902 10,894 10,894 EMPLOYMENT: PERSONS ENGAGED NIGERIAN FEMALE 3,907 3,928 3,928 4,155 4,279 4,279 EMPLOYMENT: PERSONS ENGAGED NON-NIGERIAN MALE 517 537 537 537 537 537 EMPLOYMENT: PERSONS ENGAGED NON-NIGERIAN FEMALE 331 331 331 331 331 331 OPERATING COST: WAGES AND SALARIES (N'000) 739,781 769,672 1,509,452 790,446 868,521 1,658,967 OPERATING COST: OTHER BENEFITS (N'000) 211,818 258,245 470,063 367,844 420,824 788,668 OPERATING COST: COST OF ELECTRICITY (N'000) 97,547 125,102 222,649 120,865 100,297 221,161 OPERATING COST: COST OF FUEL PURCHASED (N'000) 152,533 123,821 276,353 123,531 178,682 302,213 OPERATING COST: REAPIR AND MAINTENANCE OF VEHINCLES (N'000) 187,116 185,917 373,033 213,099 204,232 417,331 OPERATING COST: RENT ON OFFICE ACCOMODATION (N'000) 126,528 120,844 247,372 120,885 120,844 241,729 OPERATING COST: INTEREST ON LOAN (N'000) 15,400 14,966 30,366 16,806 17,715 34,521 OPERATING COST: DEPRECIATION (N'000) 168,036 211,797 379,833 206,113 239,476 445,588 OPERATING COST: OTHER COST (N'000) 124,771 137,567 262,338 220,562 213,017 433,578 SOURCE OF INCOME: FEE FOR PROFESIONAL SERVICES (N'000) 8,421,406 7,292,613 15,714,019 7,209,184 7,695,268 14,904,452 SOURCE OF INCOME: INCOME FROM SALES OF LAND (N'000) 1,029,943 684,775 1,714,718 721,280 1,149,133 1,870,413 SOURCE OF INCOME: INCOME FROM SALE OF BUILDINGS (N'000) 783,377 1,149,546 1,932,923 1,446,426 1,560,159 3,006,585 SOURCE OF INCOME: INCOME FROM OTHER ASSETS (N'000) 318,791 389,631 708,423 354,160 685,705 1,039,865 SOURCE OF INCOME: INCOME FROM PROPERTY RENT (N'000) 43,368 87,398 130,766 200,614 224,469 425,083 SOURCE OF INCOME: INCOME FROM PROPERTY INTEREST (N'000) 222,691 259,424 482,114 286,275 399,120 685,395 SOURCE OF INCOME: INCOME FROM DIVIDENDS (N'000) 73,900 73,982 147,882 74,003 73,982 147,985 SOURCE OF INCOME: OTHERS (N'000) 658,584 951,020 1,609,604 267,382 1,645,552 1,912,934 SOURCE OF WORKING CAPITAL: BANK LOAN (N'000) 2,300,787 2,597,150 4,897,937 2,620,157 2,819,986 5,440,143 SOURCE OF WORKING CAPITAL: GOVERNMENT GUARANTEED BANK LOAN (N'000) 20,899 20,899 41,797 21,829 21,560 43,389 SOURCE OF WORKING CAPITAL: COOPERATIVE SOCIETY (N'000) 810,973 810,973 1,621,945 810,973 810,973 1,621,945 SOURCE OF WORKING CAPITAL: FAMILY FRIEND (N'000) 1,145,329 1,145,536 2,290,865 1,360,661 1,361,033 2,721,694 SOURCE OF WORKING CAPITAL: ESTABLISHMENT'S OWN FUND (N'000) 5,725,716 5,985,615 11,711,331 5,680,218 5,584,201 11,264,419 SOURCE OF WORKING CAPITAL: FOREIGN SOURCE (N'000) 12,733 17,260 29,994 18,914 20,568 39,482 SOURCE OF WORKING CAPITAL: INCREASE IN EQUITY (N'000) 18,108 18,108 36,216 18,108 18,108 36,216 SOURCE OF WORKING CAPITAL: OTHERS (N'000) 246,959 394,427 641,386 441,351 455,449 896,799
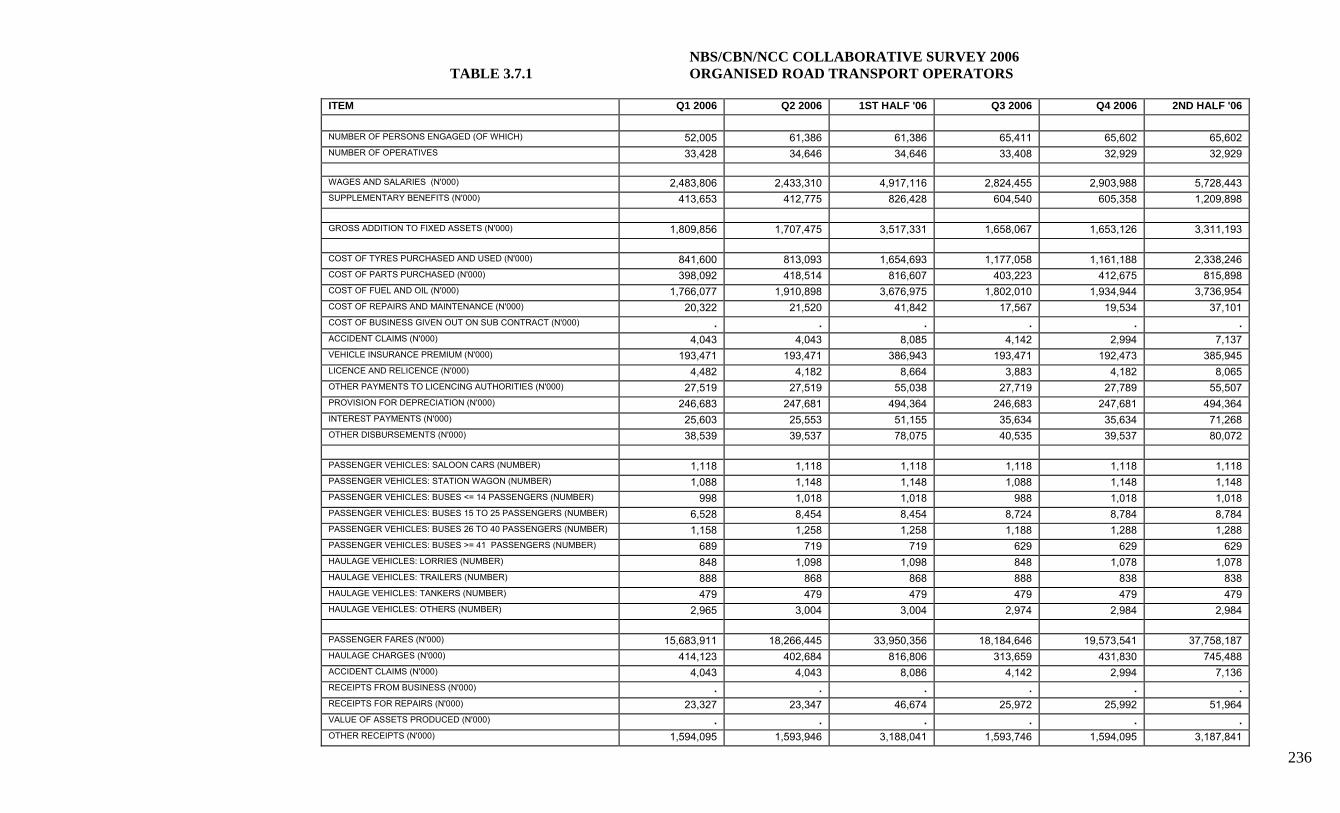
236
NBS/CBN/NCC COLLABORATIVE SURVEY 2006 TABLE 3.7.1 ORGANISED ROAD TRANSPORT OPERATORS
ITEM Q1 2006 Q2 2006 1ST HALF '06 Q3 2006 Q4 2006 2ND HALF '06
NUMBER OF PERSONS ENGAGED (OF WHICH) 52,005 61,386 61,386 65,411 65,602 65,602 NUMBER OF OPERATIVES 33,428 34,646 34,646 33,408 32,929 32,929 WAGES AND SALARIES (N'000) 2,483,806 2,433,310 4,917,116 2,824,455 2,903,988 5,728,443 SUPPLEMENTARY BENEFITS (N'000) 413,653 412,775 826,428 604,540 605,358 1,209,898 GROSS ADDITION TO FIXED ASSETS (N'000) 1,809,856 1,707,475 3,517,331 1,658,067 1,653,126 3,311,193 COST OF TYRES PURCHASED AND USED (N'000) 841,600 813,093 1,654,693 1,177,058 1,161,188 2,338,246 COST OF PARTS PURCHASED (N'000) 398,092 418,514 816,607 403,223 412,675 815,898 COST OF FUEL AND OIL (N'000) 1,766,077 1,910,898 3,676,975 1,802,010 1,934,944 3,736,954 COST OF REPAIRS AND MAINTENANCE (N'000) 20,322 21,520 41,842 17,567 19,534 37,101 COST OF BUSINESS GIVEN OUT ON SUB CONTRACT (N'000) . . . . . . ACCIDENT CLAIMS (N'000) 4,043 4,043 8,085 4,142 2,994 7,137 VEHICLE INSURANCE PREMIUM (N'000) 193,471 193,471 386,943 193,471 192,473 385,945 LICENCE AND RELICENCE (N'000) 4,482 4,182 8,664 3,883 4,182 8,065 OTHER PAYMENTS TO LICENCING AUTHORITIES (N'000) 27,519 27,519 55,038 27,719 27,789 55,507 PROVISION FOR DEPRECIATION (N'000) 246,683 247,681 494,364 246,683 247,681 494,364 INTEREST PAYMENTS (N'000) 25,603 25,553 51,155 35,634 35,634 71,268 OTHER DISBURSEMENTS (N'000) 38,539 39,537 78,075 40,535 39,537 80,072 PASSENGER VEHICLES: SALOON CARS (NUMBER) 1,118 1,118 1,118 1,118 1,118 1,118 PASSENGER VEHICLES: STATION WAGON (NUMBER) 1,088 1,148 1,148 1,088 1,148 1,148 PASSENGER VEHICLES: BUSES <= 14 PASSENGERS (NUMBER) 998 1,018 1,018 988 1,018 1,018 PASSENGER VEHICLES: BUSES 15 TO 25 PASSENGERS (NUMBER) 6,528 8,454 8,454 8,724 8,784 8,784 PASSENGER VEHICLES: BUSES 26 TO 40 PASSENGERS (NUMBER) 1,158 1,258 1,258 1,188 1,288 1,288 PASSENGER VEHICLES: BUSES >= 41 PASSENGERS (NUMBER) 689 719 719 629 629 629 HAULAGE VEHICLES: LORRIES (NUMBER) 848 1,098 1,098 848 1,078 1,078 HAULAGE VEHICLES: TRAILERS (NUMBER) 888 868 868 888 838 838 HAULAGE VEHICLES: TANKERS (NUMBER) 479 479 479 479 479 479 HAULAGE VEHICLES: OTHERS (NUMBER) 2,965 3,004 3,004 2,974 2,984 2,984 PASSENGER FARES (N'000) 15,683,911 18,266,445 33,950,356 18,184,646 19,573,541 37,758,187 HAULAGE CHARGES (N'000) 414,123 402,684 816,806 313,659 431,830 745,488 ACCIDENT CLAIMS (N'000) 4,043 4,043 8,086 4,142 2,994 7,136 RECEIPTS FROM BUSINESS (N'000) . . . . . . RECEIPTS FOR REPAIRS (N'000) 23,327 23,347 46,674 25,972 25,992 51,964 VALUE OF ASSETS PRODUCED (N'000) . . . . . . OTHER RECEIPTS (N'000) 1,594,095 1,593,946 3,188,041 1,593,746 1,594,095 3,187,841
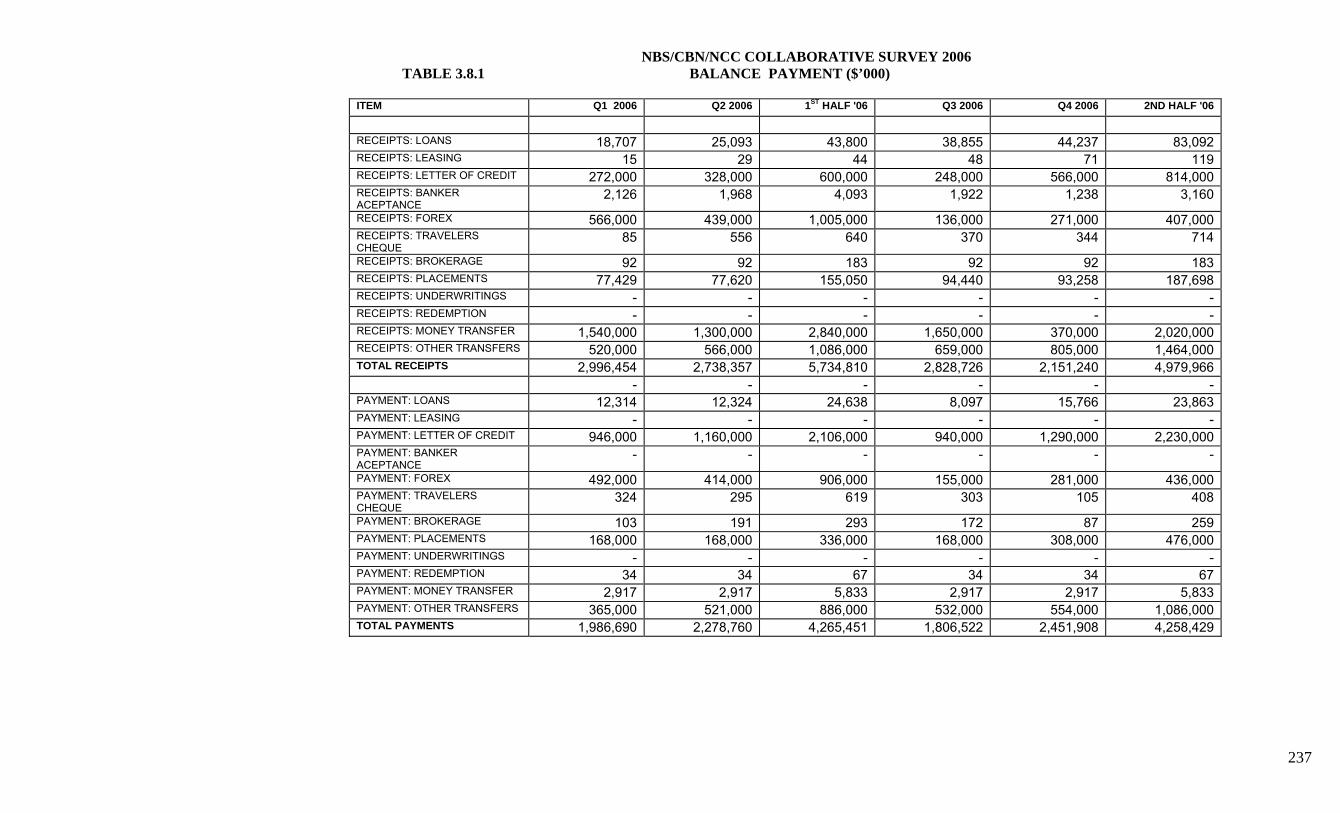
237
NBS/CBN/NCC COLLABORATIVE SURVEY 2006 TABLE 3.8.1 BALANCE PAYMENT ($’000)
ITEM Q1 2006 Q2 2006 1ST HALF '06 Q3 2006 Q4 2006 2ND HALF '06 RECEIPTS: LOANS 18,707 25,093 43,800 38,855 44,237 83,092 RECEIPTS: LEASING 15 29 44 48 71 119 RECEIPTS: LETTER OF CREDIT 272,000 328,000 600,000 248,000 566,000 814,000 RECEIPTS: BANKER ACEPTANCE
2,126 1,968 4,093 1,922 1,238 3,160
RECEIPTS: FOREX 566,000 439,000 1,005,000 136,000 271,000 407,000 RECEIPTS: TRAVELERS CHEQUE
85 556 640 370 344 714
RECEIPTS: BROKERAGE 92 92 183 92 92 183 RECEIPTS: PLACEMENTS 77,429 77,620 155,050 94,440 93,258 187,698 RECEIPTS: UNDERWRITINGS - - - - - - RECEIPTS: REDEMPTION - - - - - - RECEIPTS: MONEY TRANSFER 1,540,000 1,300,000 2,840,000 1,650,000 370,000 2,020,000 RECEIPTS: OTHER TRANSFERS 520,000 566,000 1,086,000 659,000 805,000 1,464,000 TOTAL RECEIPTS 2,996,454 2,738,357 5,734,810 2,828,726 2,151,240 4,979,966
- - - - - - PAYMENT: LOANS 12,314 12,324 24,638 8,097 15,766 23,863 PAYMENT: LEASING - - - - - - PAYMENT: LETTER OF CREDIT 946,000 1,160,000 2,106,000 940,000 1,290,000 2,230,000 PAYMENT: BANKER ACEPTANCE
- - - - - -
PAYMENT: FOREX 492,000 414,000 906,000 155,000 281,000 436,000 PAYMENT: TRAVELERS CHEQUE
324 295 619 303 105 408
PAYMENT: BROKERAGE 103 191 293 172 87 259 PAYMENT: PLACEMENTS 168,000 168,000 336,000 168,000 308,000 476,000 PAYMENT: UNDERWRITINGS - - - - - - PAYMENT: REDEMPTION 34 34 67 34 34 67 PAYMENT: MONEY TRANSFER 2,917 2,917 5,833 2,917 2,917 5,833 PAYMENT: OTHER TRANSFERS 365,000 521,000 886,000 532,000 554,000 1,086,000 TOTAL PAYMENTS 1,986,690 2,278,760 4,265,451 1,806,522 2,451,908 4,258,429
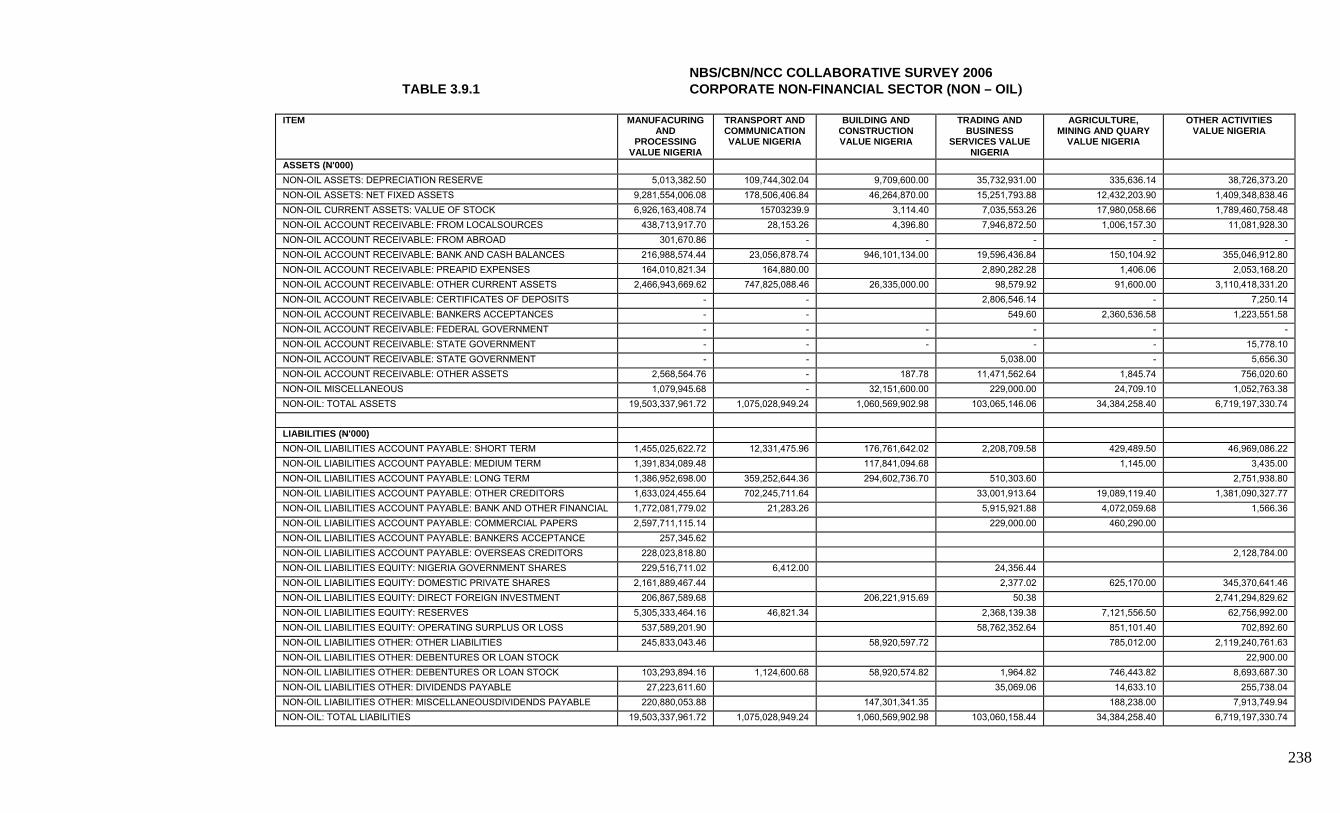
238
NBS/CBN/NCC COLLABORATIVE SURVEY 2006 TABLE 3.9.1 CORPORATE NON-FINANCIAL SECTOR (NON – OIL)
ITEM MANUFACURING AND
PROCESSING VALUE NIGERIA
TRANSPORT AND COMMUNICATION VALUE NIGERIA
BUILDING AND CONSTRUCTION VALUE NIGERIA
TRADING AND BUSINESS
SERVICES VALUE NIGERIA
AGRICULTURE, MINING AND QUARY
VALUE NIGERIA
OTHER ACTIVITIES VALUE NIGERIA
ASSETS (N'000) NON-OIL ASSETS: DEPRECIATION RESERVE 5,013,382.50 109,744,302.04 9,709,600.00 35,732,931.00 335,636.14 38,726,373.20 NON-OIL ASSETS: NET FIXED ASSETS 9,281,554,006.08 178,506,406.84 46,264,870.00 15,251,793.88 12,432,203.90 1,409,348,838.46 NON-OIL CURRENT ASSETS: VALUE OF STOCK 6,926,163,408.74 15703239.9 3,114.40 7,035,553.26 17,980,058.66 1,789,460,758.48 NON-OIL ACCOUNT RECEIVABLE: FROM LOCALSOURCES 438,713,917.70 28,153.26 4,396.80 7,946,872.50 1,006,157.30 11,081,928.30 NON-OIL ACCOUNT RECEIVABLE: FROM ABROAD 301,670.86 - - - - - NON-OIL ACCOUNT RECEIVABLE: BANK AND CASH BALANCES 216,988,574.44 23,056,878.74 946,101,134.00 19,596,436.84 150,104.92 355,046,912.80 NON-OIL ACCOUNT RECEIVABLE: PREAPID EXPENSES 164,010,821.34 164,880.00 2,890,282.28 1,406.06 2,053,168.20 NON-OIL ACCOUNT RECEIVABLE: OTHER CURRENT ASSETS 2,466,943,669.62 747,825,088.46 26,335,000.00 98,579.92 91,600.00 3,110,418,331.20 NON-OIL ACCOUNT RECEIVABLE: CERTIFICATES OF DEPOSITS - - 2,806,546.14 - 7,250.14 NON-OIL ACCOUNT RECEIVABLE: BANKERS ACCEPTANCES - - 549.60 2,360,536.58 1,223,551.58 NON-OIL ACCOUNT RECEIVABLE: FEDERAL GOVERNMENT - - - - - - NON-OIL ACCOUNT RECEIVABLE: STATE GOVERNMENT - - - - - 15,778.10 NON-OIL ACCOUNT RECEIVABLE: STATE GOVERNMENT - - 5,038.00 - 5,656.30 NON-OIL ACCOUNT RECEIVABLE: OTHER ASSETS 2,568,564.76 - 187.78 11,471,562.64 1,845.74 756,020.60 NON-OIL MISCELLANEOUS 1,079,945.68 - 32,151,600.00 229,000.00 24,709.10 1,052,763.38 NON-OIL: TOTAL ASSETS 19,503,337,961.72 1,075,028,949.24 1,060,569,902.98 103,065,146.06 34,384,258.40 6,719,197,330.74
LIABILITIES (N'000) NON-OIL LIABILITIES ACCOUNT PAYABLE: SHORT TERM 1,455,025,622.72 12,331,475.96 176,761,642.02 2,208,709.58 429,489.50 46,969,086.22 NON-OIL LIABILITIES ACCOUNT PAYABLE: MEDIUM TERM 1,391,834,089.48 117,841,094.68 1,145.00 3,435.00 NON-OIL LIABILITIES ACCOUNT PAYABLE: LONG TERM 1,386,952,698.00 359,252,644.36 294,602,736.70 510,303.60 2,751,938.80 NON-OIL LIABILITIES ACCOUNT PAYABLE: OTHER CREDITORS 1,633,024,455.64 702,245,711.64 33,001,913.64 19,089,119.40 1,381,090,327.77 NON-OIL LIABILITIES ACCOUNT PAYABLE: BANK AND OTHER FINANCIAL 1,772,081,779.02 21,283.26 5,915,921.88 4,072,059.68 1,566.36 NON-OIL LIABILITIES ACCOUNT PAYABLE: COMMERCIAL PAPERS 2,597,711,115.14 229,000.00 460,290.00 NON-OIL LIABILITIES ACCOUNT PAYABLE: BANKERS ACCEPTANCE 257,345.62 NON-OIL LIABILITIES ACCOUNT PAYABLE: OVERSEAS CREDITORS 228,023,818.80 2,128,784.00 NON-OIL LIABILITIES EQUITY: NIGERIA GOVERNMENT SHARES 229,516,711.02 6,412.00 24,356.44 NON-OIL LIABILITIES EQUITY: DOMESTIC PRIVATE SHARES 2,161,889,467.44 2,377.02 625,170.00 345,370,641.46 NON-OIL LIABILITIES EQUITY: DIRECT FOREIGN INVESTMENT 206,867,589.68 206,221,915.69 50.38 2,741,294,829.62 NON-OIL LIABILITIES EQUITY: RESERVES 5,305,333,464.16 46,821.34 2,368,139.38 7,121,556.50 62,756,992.00 NON-OIL LIABILITIES EQUITY: OPERATING SURPLUS OR LOSS 537,589,201.90 58,762,352.64 851,101.40 702,892.60 NON-OIL LIABILITIES OTHER: OTHER LIABILITIES 245,833,043.46 58,920,597.72 785,012.00 2,119,240,761.63 NON-OIL LIABILITIES OTHER: DEBENTURES OR LOAN STOCK 22,900.00 NON-OIL LIABILITIES OTHER: DEBENTURES OR LOAN STOCK 103,293,894.16 1,124,600.68 58,920,574.82 1,964.82 746,443.82 8,693,687.30 NON-OIL LIABILITIES OTHER: DIVIDENDS PAYABLE 27,223,611.60 35,069.06 14,633.10 255,738.04 NON-OIL LIABILITIES OTHER: MISCELLANEOUSDIVIDENDS PAYABLE 220,880,053.88 147,301,341.35 188,238.00 7,913,749.94 NON-OIL: TOTAL LIABILITIES 19,503,337,961.72 1,075,028,949.24 1,060,569,902.98 103,060,158.44 34,384,258.40 6,719,197,330.74

239
NBS/CBN/NCC COLLABORATIVE SURVEY 2006 TABLE 3.9.2 CORPORATE NON-FINANCIAL SECTOR (FOREIGN PRIVATE)
ITEM
MANUFACURING AND PROCESSING VALUE NIGERIA
TRANSPORT AND COMMUNICATION VALUE NIGERIA
BUILDING AND CONSTRUCTION VALUE NIGERIA
TRADING AND BUSINESS
SERVICES VALUE NIGERIA
AGRICULTURE, MINING AND
QUARY VALUE NIGERIA
OTHER ACTIVITIES
VALUE NIGERIA
ASSETS (N'000) FOREIGN PRIVATE INVESTMENT ASSETS: CASH BALANCE ON HAND 63,433,320.60 5,289.90 684,171.85 703,153.66 FOREIGN PRIVATE INVESTMENT ASSETS: CASH BALANCE AT BANK 5,626,278.10 11,289.70 260,427.96 FOREIGN PRIVATE INVESTMENT ASSETS: ACCOUNT RECEIVABLE FROM C 1,903,750.28 2,977.00 1,710,429.60 FOREIGN PRIVATE INVESTMENT ASSETS: ACCOUNT RECEIVABLE FROM O FOREIGN PRIVATE INVESTMENT ASSETS: INTER COMPANY ACCOUNTS: L 4,495,489.84 NON-OIL ACCOUNT INVESTMENTS: ABROAD 225,074.94 NON-OIL ACCOUNT INVESTMENTS: IN OTHER NIGERIA COMPASNIES 62,040,579.24 NON-OIL SECURITIES: STATE GOVERNMENT 68,700.00
FOREIGN PRIVATE INVESTMENT ASSETS: INTER COMPANY ACCOUNTS: L 67,449.66 2,806,561,235.68 FOREIGN PRIVATE INVESTMENT ASSETS: SECURITIES: GOVERNMENT FOREIGN PRIVATE INVESTMENT ASSETS: OTHER SECURITIES UNLISTED FOREIGN PRIVATE INVESTMENT ASSETS: INVESTMENT IN AFFILIATES 13,741,259.50 FOREIGN PRIVATE INVESTMENT ASSETS: MORTGAGE HELD FOREIGN PRIVATE INVESTMENT ASSETS: MORTGAGE PREPAID EXPENSES 109,575,675.60 FOREIGN PRIVATE INVESTMENT ASSETS: MORTGAGE MISCELLANEOUS 238,160.00 68,700.00 FOREIGN PRIVATE INVESTMENT ASSETS: INVENTORIES RAW MATERIALS 1,310,034,437.60 1,919,389,138.84 2,223,558.53 2,024,360.00 FOREIGN PRIVATE INVESTMENT ASSETS: INVENTORIES SUPPLIES 2,236,069,387.06 526.70 FOREIGN PRIVATE INVESTMENT ASSETS: INVENTORIES GOODS IN PROC 149,408,411.92 1,898,040,952.76 1,482,372.34 114,500.00 FOREIGN PRIVATE INVESTMENT ASSETS: INVENTORIES FINISHED GOODS 1,733,720,756.24 741,186.18 251,900.00 FOREIGN PRIVATE INVESTMENT ASSETS: FREEHOLD EMPLOYED IN BUSINESS 538,362,351.70 25,304.50 FOREIGN PRIVATE INVESTMENT ASSETS: FREEHOLD OTHERS 335,297.22 5,496,000.00 32.06 FOREIGN PRIVATE INVESTMENT ASSETS: LEASEHOLD PROPERTY IN NIG 34,314,266.84 34,350,000.00 36.64 FOREIGN PRIVATE INVESTMENT ASSETS: LEASEHOLD MACHINERY EQUIP 732,137,750.32 4,122,000.00 111,069.58 2,885.40 32,060.00 FOREIGN PRIVATE INVESTMENT ASSETS: LEASEHOLD FURNITURE AND FIXTUES 171,303,862.20 2,290,000.00 FOREIGN PRIVATE INVESTMENT ASSETS: MOTOR VEHICLE IN NIGERIA 324,687,590.46 1,790.78 916.00 517,989,513.30 FOREIGN PRIVATE INVESTMENT ASSETS: OTHERS 642,704,928.46 2,290.00 TOTAL ASSETS (N'000) 8,134,494,777.78 46,260,977.00 6,624,116,072.74 6,873,114.40 521,444,614.92
LIABILITIES (N'000) FOREIGN PRIVATE INVESTMENT LIABILITIES: ACCOUNTS PAYABLE TO 2,261,273,003.40 5,915,924,082.98 FOREIGN PRIVATE INVESTMENT LIABILITIES: ACCOUNTS PAYABLE TO 3,956,249,236.66 7,678,828.00 6,686,800.00 FOREIGN PRIVATE INVESTMENT LIABILITIES: ACCOUNTS PAYABLE TO 221,839,330.30 5,106,883.20 111,405,272.63 FOREIGN PRIVATE INVESTMENT LIABILITIES: AFTER 12 MONTHS TO B 1,374,000,000.00 8,987,929.00 708,197,279.66 FOREIGN PRIVATE INVESTMENT LIABILITIES: AFTER 12 MONTHS TO T 51,945,251.64 6,870,000.00 FOREIGN PRIVATE INVESTMENT LIABILITIES: AFTER 12 MONTHS TO O FOREIGN PRIVATE INVESTMENT LIABILITIES: LOANS AGAINST LIFE I FOREIGN PRIVATE INVESTMENT LIABILITIES: DIRECT LOAND ADV 3,664,000.00 FOREIGN PRIVATE INVESTMENT LIABILITIES: CUSTOMERS ADVANCE PA 524,982.50 222,627,345.26 FOREIGN PRIVATE INVESTMENT LIABILITIES: MORTGAGES PAYMENT WI FOREIGN PRIVATE INVESTMENT LIABILITIES: MORTGAGES PAYMENT WI FOREIGN PRIVATE INVESTMENT LIABILITIES: DUE AFTER 12 MONTHS FOREIGN PRIVATE INVESTMENT LIABILITIES: DUE AFTER 12 MONTHS 15,538,063 FOREIGN PRIVATE INVESTMENT LIABILITIES: ACCRUED LIABILITIES: 45,871,654.10 2,530,313 1,924 FOREIGN PRIVATE INVESTMENT LIABILITIES: ACCRUED LIABILITIES: 216,705,260.22 6,415,985 733 180,725,197 FOREIGN PRIVATE INVESTMENT LIABILITIES: MISCELLANEOUS 2,564,763.36 458 FPI 8,134,637,482.18 46,258,000.00 6,624,121,362.64 6,873,114.40 521,444,614.89
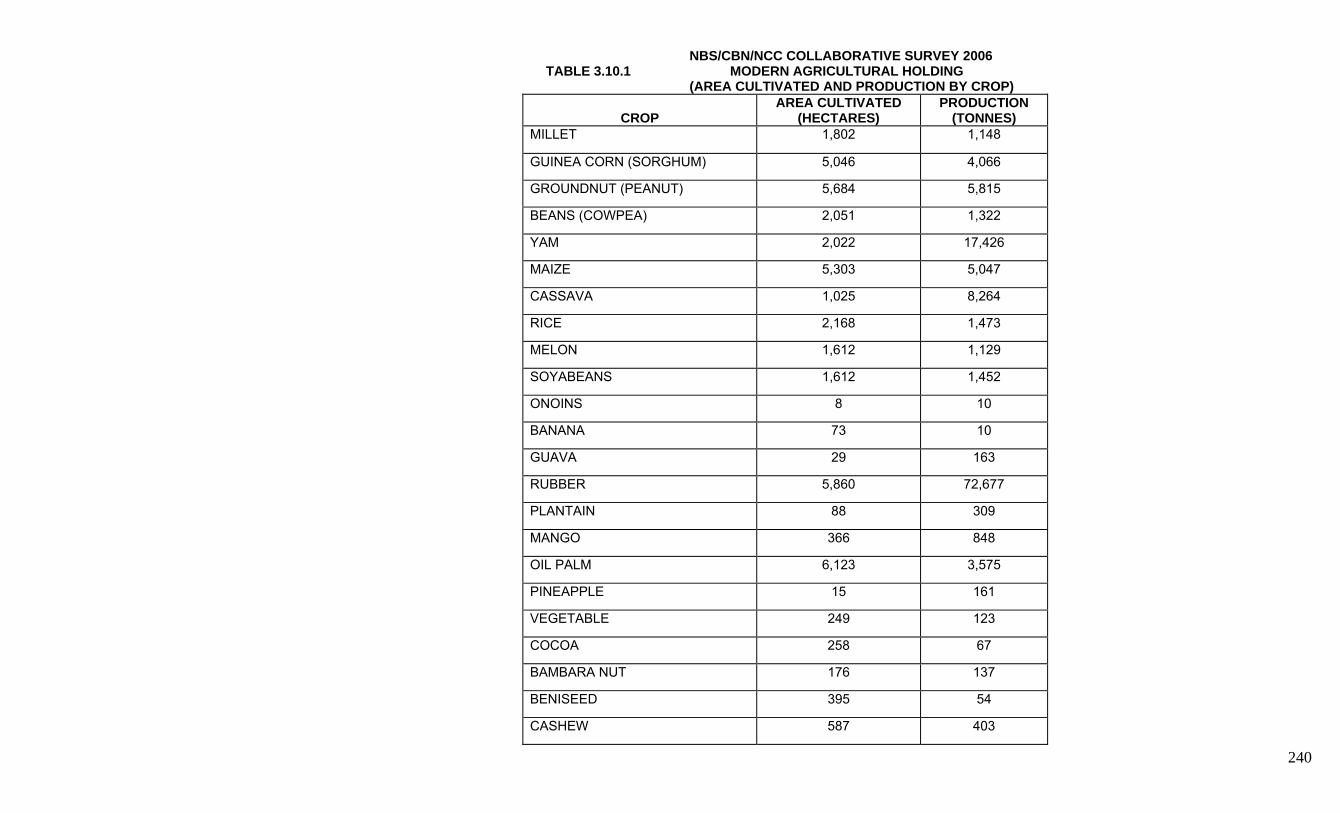
240
NBS/CBN/NCC COLLABORATIVE SURVEY 2006 TABLE 3.10.1 MODERN AGRICULTURAL HOLDING
(AREA CULTIVATED AND PRODUCTION BY CROP)
CROP AREA CULTIVATED
(HECTARES) PRODUCTION
(TONNES) MILLET 1,802 1,148
GUINEA CORN (SORGHUM) 5,046 4,066
GROUNDNUT (PEANUT) 5,684 5,815
BEANS (COWPEA) 2,051 1,322
YAM 2,022 17,426
MAIZE 5,303 5,047
CASSAVA 1,025 8,264
RICE 2,168 1,473
MELON 1,612 1,129
SOYABEANS 1,612 1,452
ONOINS 8 10
BANANA 73 10
GUAVA 29 163
RUBBER 5,860 72,677
PLANTAIN 88 309
MANGO 366 848
OIL PALM 6,123 3,575
PINEAPPLE 15 161
VEGETABLE 249 123
COCOA 258 67
BAMBARA NUT 176 137
BENISEED 395 54
CASHEW 587 403

241
NBS/CBN/NCC COLLABORATIVE SURVEY 2006 TABLE 3.10.2 MODERN AGRICULTURAL HOLDING (Number of Livestock by Kind and Sex)
NUMBER OF ANIMALS NUMBER OF FEMALES
KIND TOTAL MALE FEMALE PRODUCING MILK NOT PRODUCING MILK
CATTLE 22,966 5,453 17,514 2,836 14,678
SHEEP 3,113 799 2,314 0 0
GOAT 5,233 771 4,461 0 0
CAMEL 0 0 0 0 0
DONKEY` 0 0 0 0 0
PIG 1,323 551 771 0 0
OTHERS 385 165 220 0 0
ALL ANIMALS 33,019 7,739 25,280 2,836 14,678
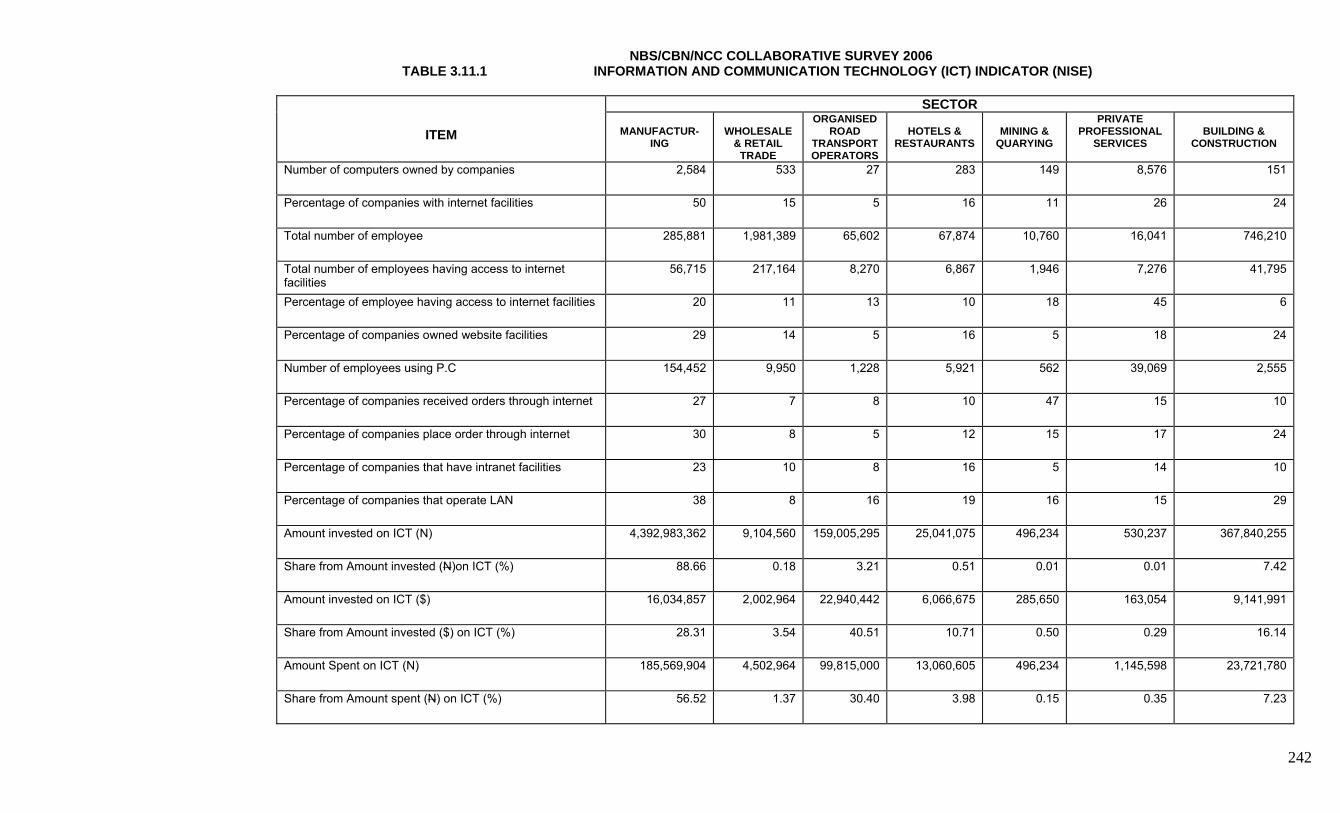
242
NBS/CBN/NCC COLLABORATIVE SURVEY 2006 TABLE 3.11.1 INFORMATION AND COMMUNICATION TECHNOLOGY (ICT) INDICATOR (NISE)
SECTOR
ITEM
MANUFACTUR-ING
WHOLESALE
& RETAIL TRADE
ORGANISED ROAD
TRANSPORT OPERATORS
HOTELS &
RESTAURANTS
MINING &
QUARYING
PRIVATE PROFESSIONAL
SERVICES
BUILDING &
CONSTRUCTION
Number of computers owned by companies 2,584 533 27 283 149 8,576 151
Percentage of companies with internet facilities 50 15 5 16 11 26 24
Total number of employee 285,881 1,981,389 65,602 67,874 10,760 16,041 746,210
Total number of employees having access to internet facilities
56,715 217,164 8,270 6,867 1,946 7,276 41,795
Percentage of employee having access to internet facilities 20 11 13 10 18 45 6
Percentage of companies owned website facilities 29 14 5 16 5 18 24
Number of employees using P.C 154,452 9,950 1,228 5,921 562 39,069 2,555
Percentage of companies received orders through internet 27 7 8 10 47 15 10
Percentage of companies place order through internet 30 8 5 12 15 17 24
Percentage of companies that have intranet facilities 23 10 8 16 5 14 10
Percentage of companies that operate LAN 38 8 16 19 16 15 29
Amount invested on ICT (N) 4,392,983,362 9,104,560 159,005,295 25,041,075 496,234 530,237 367,840,255
Share from Amount invested (N)on ICT (%) 88.66 0.18 3.21 0.51 0.01 0.01 7.42
Amount invested on ICT ($) 16,034,857 2,002,964 22,940,442 6,066,675 285,650 163,054 9,141,991
Share from Amount invested ($) on ICT (%) 28.31 3.54 40.51 10.71 0.50 0.29 16.14
Amount Spent on ICT (N) 185,569,904 4,502,964 99,815,000 13,060,605 496,234 1,145,598 23,721,780
Share from Amount spent (N) on ICT (%) 56.52 1.37 30.40 3.98 0.15 0.35 7.23
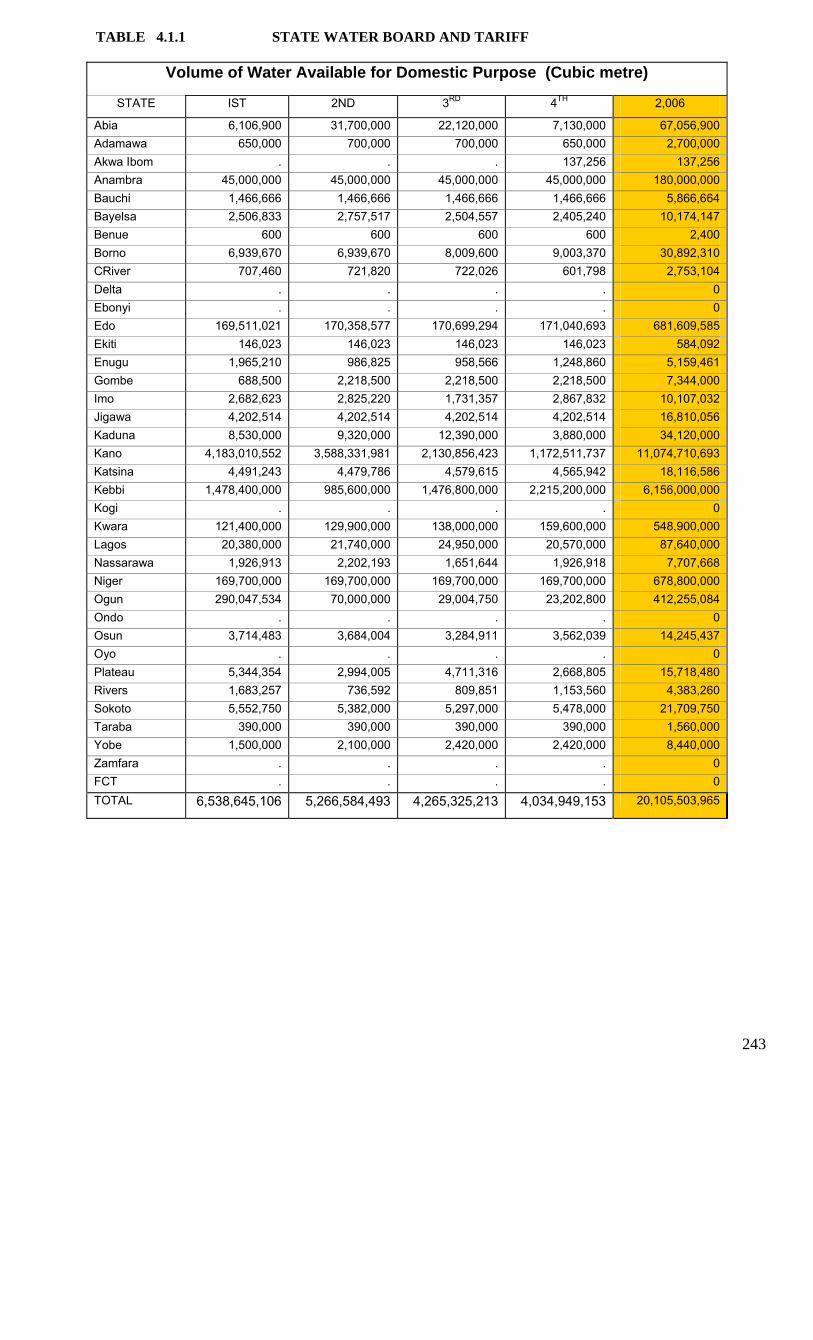
243
TABLE 4.1.1 STATE WATER BOARD AND TARIFF
Volume of Water Available for Domestic Purpose (Cubic metre)
STATE IST 2ND 3RD 4TH 2,006
Abia 6,106,900 31,700,000 22,120,000 7,130,000 67,056,900 Adamawa 650,000 700,000 700,000 650,000 2,700,000 Akwa Ibom . . . 137,256 137,256 Anambra 45,000,000 45,000,000 45,000,000 45,000,000 180,000,000 Bauchi 1,466,666 1,466,666 1,466,666 1,466,666 5,866,664 Bayelsa 2,506,833 2,757,517 2,504,557 2,405,240 10,174,147 Benue 600 600 600 600 2,400 Borno 6,939,670 6,939,670 8,009,600 9,003,370 30,892,310 CRiver 707,460 721,820 722,026 601,798 2,753,104 Delta . . . . 0 Ebonyi . . . . 0 Edo 169,511,021 170,358,577 170,699,294 171,040,693 681,609,585 Ekiti 146,023 146,023 146,023 146,023 584,092 Enugu 1,965,210 986,825 958,566 1,248,860 5,159,461 Gombe 688,500 2,218,500 2,218,500 2,218,500 7,344,000 Imo 2,682,623 2,825,220 1,731,357 2,867,832 10,107,032 Jigawa 4,202,514 4,202,514 4,202,514 4,202,514 16,810,056 Kaduna 8,530,000 9,320,000 12,390,000 3,880,000 34,120,000 Kano 4,183,010,552 3,588,331,981 2,130,856,423 1,172,511,737 11,074,710,693 Katsina 4,491,243 4,479,786 4,579,615 4,565,942 18,116,586 Kebbi 1,478,400,000 985,600,000 1,476,800,000 2,215,200,000 6,156,000,000 Kogi . . . . 0 Kwara 121,400,000 129,900,000 138,000,000 159,600,000 548,900,000 Lagos 20,380,000 21,740,000 24,950,000 20,570,000 87,640,000 Nassarawa 1,926,913 2,202,193 1,651,644 1,926,918 7,707,668 Niger 169,700,000 169,700,000 169,700,000 169,700,000 678,800,000 Ogun 290,047,534 70,000,000 29,004,750 23,202,800 412,255,084 Ondo . . . . 0 Osun 3,714,483 3,684,004 3,284,911 3,562,039 14,245,437 Oyo . . . . 0 Plateau 5,344,354 2,994,005 4,711,316 2,668,805 15,718,480 Rivers 1,683,257 736,592 809,851 1,153,560 4,383,260 Sokoto 5,552,750 5,382,000 5,297,000 5,478,000 21,709,750 Taraba 390,000 390,000 390,000 390,000 1,560,000 Yobe 1,500,000 2,100,000 2,420,000 2,420,000 8,440,000 Zamfara . . . . 0 FCT . . . . 0 TOTAL 6,538,645,106 5,266,584,493 4,265,325,213 4,034,949,153 20,105,503,965

244
Table 4.1.1. (Contd) Volume of Water Available for Industrial Purpose (cubic metre)
IST 2ND 3RD 4TH 2,006
45,802,000 23,775,000 16,590,000 5,345,000 91,512,000 120,000 100,000 1,000,000 1,200,000 2,420,000
. . . 19,608 19,608 85,000,000 85,000,000 85,000,000 85,000,000 340,000,000 64,808,385 64,808,385 64,808,385 64,808,385 259,233,540
51,159 56,276 51,113 48,500 207,048 3,000 3,000 3,000 3,000 12,000
308,403 308,403 508,000 408,860 1,533,666 176,865 180,455 180,506 150,449 688,275
. . . . 0
. . . . 0 9,020,527 9,065,630 9,083,761 9,101,929 36,271,847
36,505 36,505 36,505 36,505 146,020 655,070 328,941 319,522 416,287 1,719,820 81,000 261,000 261,000 261,000 864,000
536,525 542,442 192,373 337,393 1,608,733 325,314 325,314 325,314 325,314 1,301,256
2,850,000 3,130,000 4,130,000 1,290,000 11,400,000 2,928,107,386 2,511,832,387 1,491,599,496 802,758,216 7,734,297,485
264,191 223,989 228,981 228,297 945,458 92,400,000 61,600,000 92,300,000 138,450,000 384,750,000
. . . . 0 30,300,000 32,500,000 34,700,000 39,900,000 137,400,000
5,100,000 5,440,000 6,240,000 5,140,000 21,920,000 352,485 402,480 302,130 352,485 1,409,580
170,000,000 170,000,000 170,000,000 170,000,000 680,000,000 1,243,062 1,491,674 1,243,062 994,449 4,972,247
. . . . 0 530,640 526,286 464,130 508,863 2,029,919
. . . . 0 943,121 748,501 897,393 667,201 3,256,216
1,122,172 491,061 539,901 769,040 2,922,174 510,000 538,200 541,000 540,000 2,129,200 390,000 390,000 390,000 390,000 1,560,000
4,650 4,650 4,650 4,650 18,600 . . . . 0 . . . . 0
3,441,042,460 2,974,110,579 1,981,940,222 1,329,455,431 9,726,548,692

245
TABLE 4.1.1 (Contd) Volume of Water Available for Other Purposes (cubic metre)
IST 2ND 3RD 4TH 2,006
15,267 7,925 5,530 1,785 30,507 4,992,593 2,995,500 30,000,000 5,940,620 43,928,713
. . . 39,216 39,216 200,000,000 100,000,000 100,000,000 150,000,000 550,000,000
87 87 87 87 348 300 300 300 300 1,200
3,000,000 3,000,000 3,000,000 3,000,000 12,000,000 300 300 300 300 1,200 300 300 300 300 1,200
. . . . 0
. . . . 0 592 . . . 592 25 25 25 25 100 94 94 94 94 376
40,500 130,500 130,500 130,500 432,000 30 30 30 30 120
725,314 725,314 725,314 725,314 2,901,256 24 24 24 24 96
1,254,903,165 1,074,499,594 634,256,927 351,753,521 3,315,413,207 35 35 35 35 140
277,200,000 184,800,000 276,900,000 415,350,000 1,154,250,000 . . . . 0 . . 400 . 400
922,783,254 897,857,611 859,006,438 832,871,695 3,512,518,998 70,497 80,568 60,426 70,497 281,988
630,000,000 630,000,000 19,660,000 17,910,000 1,297,570,000 104,495,148 95,390,621 84,965,507 92,930,421 377,781,697
. . . . 0 300 300 300 300 1,200
. . . . 0 182,854 231,308 129,602 664,262 1,208,026 637,500 637,500 637,500 637,500 2,550,000 12,450 12,450 12,450 12,450 49,800
300 300 300 300 1,200 32,500,000 32,500,000 37,500,000 37,500,000 140,000,000
. . . . 0
. . . . 0 3,431,560,929 3,022,870,686 2,046,992,389 1,909,539,576 10,410,963,580
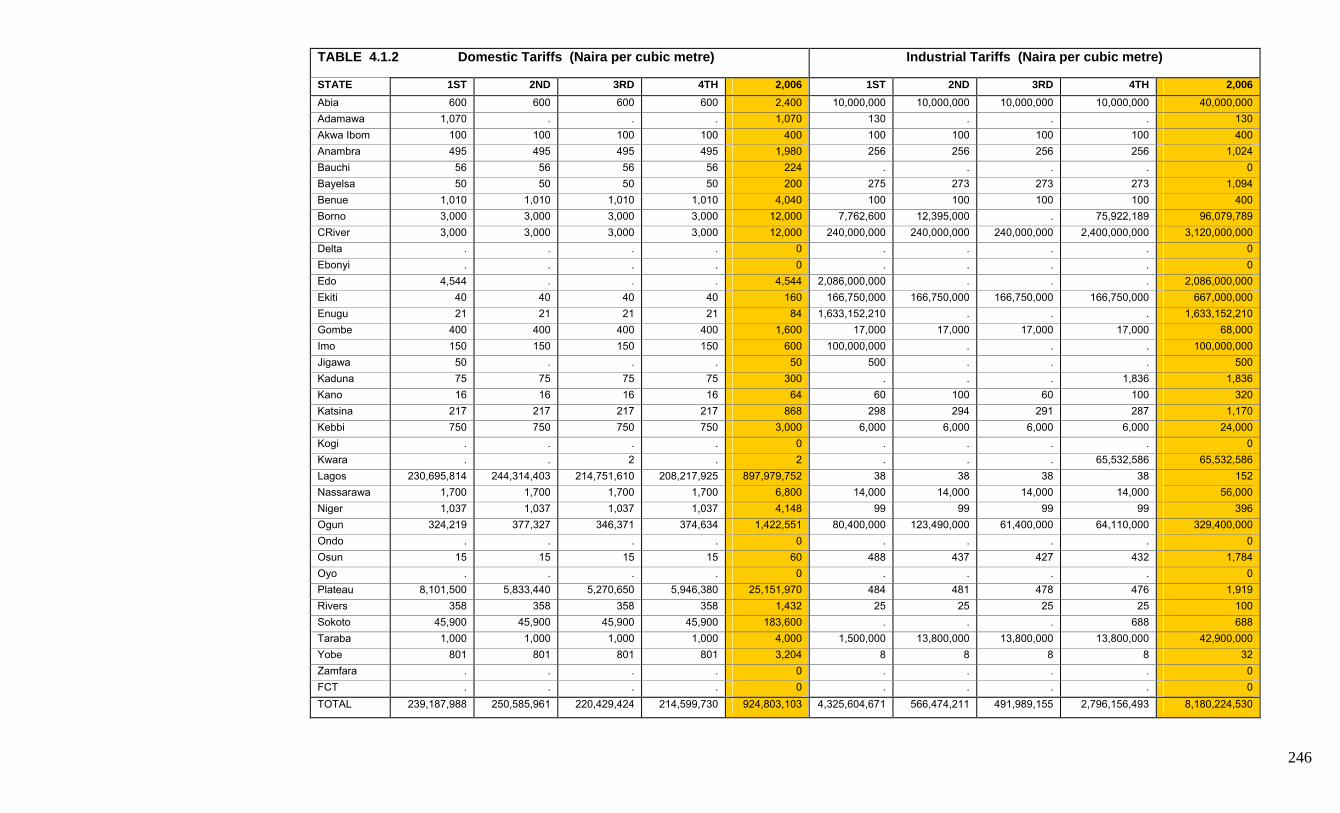
246
TABLE 4.1.2 Domestic Tariffs (Naira per cubic metre) Industrial Tariffs (Naira per cubic metre)
STATE 1ST 2ND 3RD 4TH 2,006 1ST 2ND 3RD 4TH 2,006 Abia 600 600 600 600 2,400 10,000,000 10,000,000 10,000,000 10,000,000 40,000,000 Adamawa 1,070 . . . 1,070 130 . . . 130 Akwa Ibom 100 100 100 100 400 100 100 100 100 400 Anambra 495 495 495 495 1,980 256 256 256 256 1,024 Bauchi 56 56 56 56 224 . . . . 0 Bayelsa 50 50 50 50 200 275 273 273 273 1,094 Benue 1,010 1,010 1,010 1,010 4,040 100 100 100 100 400 Borno 3,000 3,000 3,000 3,000 12,000 7,762,600 12,395,000 . 75,922,189 96,079,789 CRiver 3,000 3,000 3,000 3,000 12,000 240,000,000 240,000,000 240,000,000 2,400,000,000 3,120,000,000 Delta . . . . 0 . . . . 0 Ebonyi . . . . 0 . . . . 0 Edo 4,544 . . . 4,544 2,086,000,000 . . . 2,086,000,000 Ekiti 40 40 40 40 160 166,750,000 166,750,000 166,750,000 166,750,000 667,000,000 Enugu 21 21 21 21 84 1,633,152,210 . . . 1,633,152,210 Gombe 400 400 400 400 1,600 17,000 17,000 17,000 17,000 68,000 Imo 150 150 150 150 600 100,000,000 . . . 100,000,000 Jigawa 50 . . . 50 500 . . . 500 Kaduna 75 75 75 75 300 . . . 1,836 1,836 Kano 16 16 16 16 64 60 100 60 100 320 Katsina 217 217 217 217 868 298 294 291 287 1,170 Kebbi 750 750 750 750 3,000 6,000 6,000 6,000 6,000 24,000 Kogi . . . . 0 . . . . 0 Kwara . . 2 . 2 . . . 65,532,586 65,532,586 Lagos 230,695,814 244,314,403 214,751,610 208,217,925 897,979,752 38 38 38 38 152 Nassarawa 1,700 1,700 1,700 1,700 6,800 14,000 14,000 14,000 14,000 56,000 Niger 1,037 1,037 1,037 1,037 4,148 99 99 99 99 396 Ogun 324,219 377,327 346,371 374,634 1,422,551 80,400,000 123,490,000 61,400,000 64,110,000 329,400,000 Ondo . . . . 0 . . . . 0 Osun 15 15 15 15 60 488 437 427 432 1,784 Oyo . . . . 0 . . . . 0 Plateau 8,101,500 5,833,440 5,270,650 5,946,380 25,151,970 484 481 478 476 1,919 Rivers 358 358 358 358 1,432 25 25 25 25 100 Sokoto 45,900 45,900 45,900 45,900 183,600 . . . 688 688 Taraba 1,000 1,000 1,000 1,000 4,000 1,500,000 13,800,000 13,800,000 13,800,000 42,900,000 Yobe 801 801 801 801 3,204 8 8 8 8 32 Zamfara . . . . 0 . . . . 0 FCT . . . . 0 . . . . 0 TOTAL 239,187,988 250,585,961 220,429,424 214,599,730 924,803,103 4,325,604,671 566,474,211 491,989,155 2,796,156,493 8,180,224,530

247
TABLE 4.1.3 State Govt Allocation to Water Board (N) STATE 1ST 2ND 3RD 4TH 2,006
Abia 323 323 323 323 1,292
Adamawa 1,200 . . . 1,200
Akwa Ibom . . . 2,065,000,000 2,065,000,000
Anambra . . . . 0
Bauchi . . . . 0
Bayelsa 39 39 39 39 156
Benue . . . . 0
Borno 454 . . . 454
CRiver 77 77 77 77 308
Delta . . . . 0
Ebonyi . . . . 0
Edo 59 . . . 59
Ekiti 445 445 445 445 1,780
Enugu 540 540 552 552 2,184
Gombe 486,118,258 486,118,258 486,118,258 486,118,258 1,944,473,032
Imo . . . . 0
Jigawa 14,000,000 . . . 14,000,000
Kaduna . . . 205 205
Kano . . . . 0
Katsina 7 7 7 7 28
Kebbi 481 481 481 481 1,924
Kogi . . . . 0
Kwara . . . 570 570
Lagos 1,019 991 985 968 3,963
Nassarawa 177,250,000 177,250,000 177,250,000 177,250,000 709,000,000
Niger . . . . 0
Ogun 845 832 833 824 3,334
Ondo . . . . 0
Osun 86 86 86 89 347
Oyo . . . . 0
Plateau 115 114 114 114 457
Rivers . . . . 0
Sokoto . . . 2 2
Taraba 374 374 374 374 1,496
Yobe . . . . 0
Zamfara . . . . 0
FCT . . . . 0
TOTAL 677,374,322 663,372,567 663,372,574 2,728,373,328 4,732,492,791

248
TABLE 4.1.4 STATE WATER BOARD - EMPLOYMENT
1ST QTR 2ND QTR 3RD QTR 4TH QTR STATE Male Femal
e Total Male Fem
ale Total Male Femal
e Total Male Female Total
Abia 81 404 485 81 404 485 81 404 485 81 404 485 Adamawa . . 0 . . 0 . 0 0 . 0 0 Akwa Ibom 252 34 286 252 34 286 252 34 286 252 34 286 Anambra . . . . . . . . . . . . Bauchi . . . . . . . 0 . . 0 . Bayelsa . . . . . . . . . . 0 . Benue . . . . . . . . . . 0 . Borno 72 . 72 . . 0 . 0 0 . 0 0 CRiver 9 . 9 9 . 9 9 . 9 9 0 9 Delta . . . . . . . . . . . . Ebonyi . . . . . . . . . . . . Edo . . . . . . . 0 . . 0 . Ekiti 99 . 99 99 . 99 99 . 99 99 0 99 Enugu 66 . 66 66 . 66 66 . 66 66 0 66 Gombe 725 30 755 733 32 765 735 32 767 739 34 773 Imo . . . . . . . . . . 0 . Jigawa 445 5 450 . . 0 . . 0 . 0 0 Kaduna . . . . . . . . . . 0 . Kano . . . . . . . . . . 0 . Katsina . . . . . . . . . 0 0 . Kebbi 31 . 31 31 . 31 31 . 31 31 0 31 Kogi . . . . . . . . . . . . Kwara . . . . . . . . . 27 0 . Lagos 273 . 273 268 . 268 264 . 264 260 0 260 Nassarawa 259 13 272 259 13 272 257 12 269 257 12 269 Niger . . . . . . . . . . 0 . Ogun 219 . 219 201 . 201 201 . 201 218 0 218 Ondo . . . . . . . . . . . . Osun . . . . . . . . . . 0 . Oyo . . . . . . . . . . . . Plateau . . . . . . . . . 0 0 . Rivers . . . . . . . . . . 0 . Sokoto . . . . . . . . . . 0 . Taraba 35 . 35 35 . 35 35 . 35 35 0 35 Yobe . . . . . . . . . . 0 . Zamfara . . . . . . . . . . . . FCT . . . . . . . . . . . . TOTAL 2,566 486 3,052 2,034 483 2,517 2,030 482 2,512 2,074 484 2,531

249
TABLE 4.1.5 STATE WATER BOARD – COST OF OPERATION
Electricity and Fuel Repairs and Maintenance
STATE IST 2ND 3RD 4TH 2,006 IST 2ND 3RD 4TH 2,006
Abia . . . . . . . . . 0 Adamawa 9,506,000 9,230,000 8,000,000 6,800,000 33,536,000 11,000,000 7,200,000 7,300,000 7,300,000 32,800,000 Akwa Ibom . . . 71,000,714 71,000,714 . . . 32,735,012 32,735,012 Anambra 2,006,751 1,063,966 400,470 355,400 3,826,587 6,295,720 4,629,485 1,990,470 1,085,135 14,000,810 Bauchi 12,540,000 12,540,000 12,540,000 12,540,000 50,160,000 10,750,000 9,242,150 13,558,350 11,420,500 44,971,000 Bayelsa 31,200,000 . . . 31,200,000 27,071,625 . . . 27,071,625 Benue 1,250,000 1,250,000 1,250,000 1,250,000 5,000,000 88,183,502 88,183,602 88,183,602 88,183,602 352,734,308 Borno 9,000,000 9,000,000 9,000,000 9,000,000 36,000,000 568,475 600,000 800,000 991,500 2,959,975 CRiver 3,537,680 4,220,530 3,720,000 11,250,000 22,728,210 2,865,615 18,000,500 21,750,000 19,175,000 61,791,115 Delta . . . . . . . . . 0 Ebonyi . . . . . . . . . 0 Edo 811,890 1,099,970 793,520 893,000 3,598,380 1,517,640 1,707,450 694,340 725,930 4,645,360 Ekiti 2,496,000 2,496,000 2,496,000 3,000,000 10,488,000 5,100,000 5,106,000 5,106,000 14,200,000 29,512,000 Enugu 16,850,559 16,535,452 17,033,468 16,747,518 67,166,997 3,546,267 5,065,761 3,616,638 4,550,129 16,778,795 Gombe 665,100 2,485,300 2,565,000 2,560,000 8,275,400 357,000 1,500,000 693,500 1,379,950 3,930,450 Imo 5,984,030 5,826,774 6,717,649 5,704,907 24,233,360 4,673,367 4,265,652 4,630,971 7,124,854 20,694,844 Jigawa 1,200,000 . . . 1,200,000 2,156,000 . . . 2,156,000 Kaduna 39,630,444 41,055,844 32,405,543 22,973,480 136,065,311 3,369,121 5,700,522 2,990,808 1,620,657 13,681,108 Kano 97,691,317 89,721,735 68,753,173 50,654,725 306,820,950 90,225,000 32,820,000 83,850,000 53,220,000 260,115,000 Katsina 15,642,534 17,964,932 19,668,026 20,915,175 74,190,667 1,877,793 4,693,454 4,912,953 7,371,574 18,855,774 Kebbi 15,600,469 17,052,695 . . 32,653,164 5,249,498 4,923,514 . . 10,173,012 Kogi . . . . . . . . . 0 Kwara 970,000 1,906,000 1,492,850 2,934,405 7,303,255 5,716,040 3,231,195 2,163,016 4,804,849 15,915,100 Lagos 51,610,000 51,610,000 51,610,000 51,610,000 206,440,000 52,730,000 52,730,000 52,730,000 52,730,000 210,920,000 Nassarawa 9,753,400 4,637,300 8,491,000 1,432,000 24,313,700 257,400 1,446,200 6,939,400 7,180,360 15,823,360 Niger 2,500,000 7,200,000 11,500,000 3,700,000 24,900,000 1,000,000 10,000,000 6,500,000 45,500,000 63,000,000 Ogun 9,021,450 7,140,080 2,296,844 6,315,510 24,773,884 4,397,310 2,841,605 3,984,556 7,848,690 19,072,161 Ondo . . . . . . . . . 0 Osun 3,691,916 7,113,390 7,708,820 3,612,970 22,127,096 36,482,775 36,482,775 36,482,775 36,482,775 145,931,100 Oyo . . . . . . . . . 0 Plateau 2,200,000 3,350,000 1,852,477 450,000 7,852,477 3,809,679 4,229,060 3,131,425 3,471,830 14,641,994 Rivers 545,559 545,559 545,559 545,559 2,182,236 37,093,922 37,093,922 37,093,922 37,098,922 148,380,688 Sokoto 10,299,520 14,434,695 11,876,520 10,438,835 47,049,570 2,468,400 1,469,150 1,545,610 6,060,950 11,544,110 Taraba 21,422,764 21,605 708 25,086,070 46,531,147 1,500,000 13,800,000 13,800,000 13,800,000 42,900,000 Yobe 2,000,000 5,000,000 1,500,000 . 8,500,000 35,410,000 28,140,000 27,040,000 30,470,000 121,060,000 Zamfara . . . . . . . . . 0 FCT . . . . . . . . . 0 TOTAL 379,627,383 334,501,827 284,217,627 341,770,268 1,340,117,105 445,672,149 385,101,997 431,488,336 496,532,219 1,758,794,701

250
TABLE 4.1.5 (Contd) STATE WATER BOARD – COST OF OPERATION (Contd)
Research & Development Depreciation
STATE IST 2ND 3RD 4TH 2,006 IST 2ND 3RD 4TH 2,006
Abia . . . . 0 . . . . 0 Adamawa 450,000 8,000,000 1,500,000 15,000,000 24,950,000 41,095,643 4,153,999 40,966,535 40,894,368 127,110,545 Akwa Ibom . . . 309,237,010 309,237,010 . . . 309,712,099 309,712,099 Anambra . 61,160,312 61,107,585 61,161,198 183,429,095 27,207,351 31,044,689 15,184,027 25,792,322 99,228,389 Bauchi . . 6,950,000 . 6,950,000 9,245,885 9,245,885 9,245,885 9,245,885 36,983,540 Bayelsa . . . . 0 . . . . 0 Benue . 3,000,000 3,000,000 3,000,000 9,000,000 . . . . 0 Borno . 300,000 105,000 218,000 623,000 14,185,238 42,555,444 39,718,386 45,392,441 141,851,509 CRiver 300,000 15,860,000 18,220,000 12,520,000 46,900,000 5,339,819 5,303,286 5,515,533 5,661,079 21,819,717 Delta . . . . 0 . . . . 0 Ebonyi . . . . 0 . . . . 0 Edo . 22,749,825 24,359,980 25,450,271 72,560,076 . . . . 0 Ekiti 1,481,050 10,725,000 12,378,500 14,200,000 38,784,550 28,415,608 253,146,010 31,369,553 31,995,023 344,926,194 Enugu . . . 22,200 22,200 26,471,586 26,471,586 26,471,586 26,471,586 105,886,344 Gombe . 26,820,315 27,284,876 2,918,387 57,023,578 428,000 1,166,500 3,263,600 2,804,630 7,662,730 Imo . 6,688,417 6,879,414 6,606,296 20,174,127 772,442 2,011,497 1,233,835 143,205 4,160,979 Jigawa 150,000 . . . 150,000 16,688,038 . . . 16,688,038 Kaduna 4,084,843 49,440,000 54,720,000 59,760,000 168,004,843 64,214,848 75,132,620 50,183,095 55,591,820 245,122,383 Kano . 61,725,654 61,088,218 56,937,239 179,751,111 . . . . 0 Katsina 31,840 15,954,877 69,463,769 16,834,326 102,284,812 18,813,609 16,210,196 16,722,743 1,703,202 53,449,750 Kebbi 18,900,000 22,221,754 22,221,754 22,221,754 85,565,262 24,623,649 25,298,782 . . 49,922,431 Kogi . . . . 0 . . . . 0 Kwara . 16,955,851 23,527,403 15,677,768 56,161,022 30,000 36,000 80,000 65,480 211,480 Lagos . 141,800,000 141,800,000 141,800,000 425,400,000 155,750,000 155,750,000 155,750,000 155,750,000 623,000,000 Nassarawa 7,550 7,270,273 7,270,273 7,270,273 21,818,369 2,809,889 2,809,889 2,809,889 2,809,889 11,239,556 Niger 81,000,000 41,179,039 44,005,418 44,632,719 210,817,176 . . . . 0 Ogun . 87,591,800 25,000,000 30,820,800 143,412,600 46,408,984 45,385,342 47,620,030 45,917,469 185,331,825 Ondo . . . . 0 . . . . 0 Osun . 46,030,238 46,030,238 46,030,238 138,090,714 25,915,770 24,977,695 24,778,966 24,507,603 100,180,034 Oyo . . . . 0 . . . . 0 Plateau 396,000 . 457,330,231 4 457,726,235 . . . 10,204,817 10,204,817 Rivers . . . . 0 . . . . 0 Sokoto . 31,484,374 25,248,168 24,778,119 81,510,661 . . . . 0 Taraba . . . . 0 . . . . 0 Yobe 600,000 3,000,000 3,000,000 1,000,000 7,600,000 . . . . 0 Zamfara . . . . 0 . . . . 0 FCT . . . . 0 . . . . 0 TOTAL 107,401,283 679,957,729 1,142,490,827 918,096,602 2,847,946,441 508,416,359 720,699,420 470,913,663 794,662,918 2,494,692,360
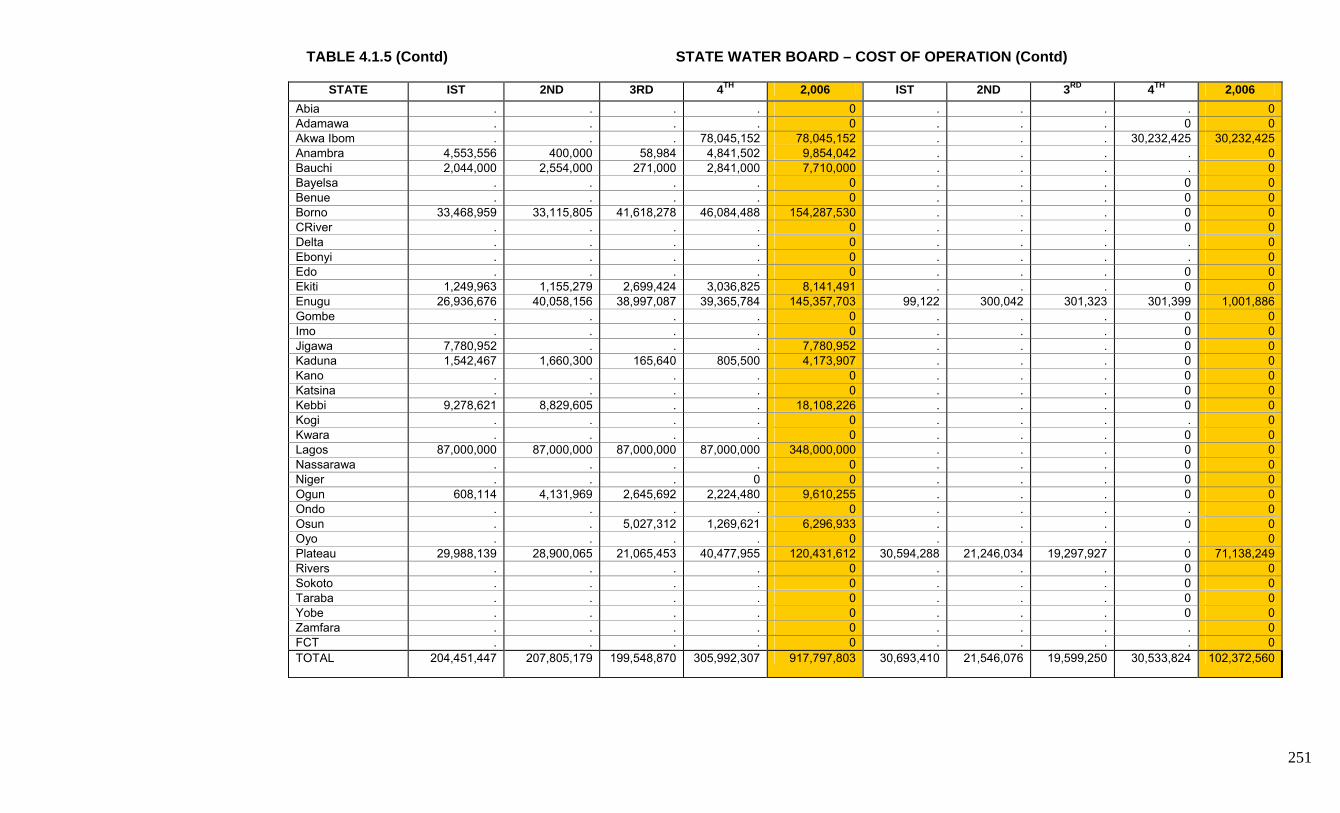
251
TABLE 4.1.5 (Contd) STATE WATER BOARD – COST OF OPERATION (Contd)
STATE IST 2ND 3RD 4TH 2,006 IST 2ND 3RD 4TH 2,006 Abia . . . . 0 . . . . 0 Adamawa . . . . 0 . . . 0 0 Akwa Ibom . . . 78,045,152 78,045,152 . . . 30,232,425 30,232,425 Anambra 4,553,556 400,000 58,984 4,841,502 9,854,042 . . . . 0 Bauchi 2,044,000 2,554,000 271,000 2,841,000 7,710,000 . . . . 0 Bayelsa . . . . 0 . . . 0 0 Benue . . . . 0 . . . 0 0 Borno 33,468,959 33,115,805 41,618,278 46,084,488 154,287,530 . . . 0 0 CRiver . . . . 0 . . . 0 0 Delta . . . . 0 . . . . 0 Ebonyi . . . . 0 . . . . 0 Edo . . . . 0 . . . 0 0 Ekiti 1,249,963 1,155,279 2,699,424 3,036,825 8,141,491 . . . 0 0 Enugu 26,936,676 40,058,156 38,997,087 39,365,784 145,357,703 99,122 300,042 301,323 301,399 1,001,886 Gombe . . . . 0 . . . 0 0 Imo . . . . 0 . . . 0 0 Jigawa 7,780,952 . . . 7,780,952 . . . 0 0 Kaduna 1,542,467 1,660,300 165,640 805,500 4,173,907 . . . 0 0 Kano . . . . 0 . . . 0 0 Katsina . . . . 0 . . . 0 0 Kebbi 9,278,621 8,829,605 . . 18,108,226 . . . 0 0 Kogi . . . . 0 . . . . 0 Kwara . . . . 0 . . . 0 0 Lagos 87,000,000 87,000,000 87,000,000 87,000,000 348,000,000 . . . 0 0 Nassarawa . . . . 0 . . . 0 0 Niger . . . 0 0 . . . 0 0 Ogun 608,114 4,131,969 2,645,692 2,224,480 9,610,255 . . . 0 0 Ondo . . . . 0 . . . . 0 Osun . . 5,027,312 1,269,621 6,296,933 . . . 0 0 Oyo . . . . 0 . . . . 0 Plateau 29,988,139 28,900,065 21,065,453 40,477,955 120,431,612 30,594,288 21,246,034 19,297,927 0 71,138,249 Rivers . . . . 0 . . . 0 0 Sokoto . . . . 0 . . . 0 0 Taraba . . . . 0 . . . 0 0 Yobe . . . . 0 . . . 0 0 Zamfara . . . . 0 . . . . 0 FCT . . . . 0 . . . . 0 TOTAL 204,451,447 207,805,179 199,548,870 305,992,307 917,797,803 30,693,410 21,546,076 19,599,250 30,533,824 102,372,560

252
TABLE 4.1.5 (Contd) STATE WATER BOARD – CAPACITY
Machinery and Equipment 1ST QTR Spare Parts 1ST QTR STATE
IST 2ND 3RD 4TH 2,006 IST 2ND 3RD 4TH 2,006
Abia . . . . . . . . . . Adamawa . 4,992,593 8,936,120 63,711,500 77,640,213 500,000 650,000 500,000 500,000 2,150,000 Akwa Ibom . . . 8,950,575,259 8,950,575,259 . . . 263,030,972 263,030,972 Anambra . . . . 0 . . . . 0 Bauchi . . . . 0 . . . . 0 Bayelsa . . . . 0 . . . . 0 Benue . . . . 0 . . . . 0 Borno 8,493,430 4,247,715 7,079,525 8,493,430 28,314,100 6,814,467 425,904 22,998,826 8,518,084 38,757,281 CRiver 53,000,000 . . . 53,000,000 200,000 120,000 250,000 50,000 620,000 Delta . . . . . . . . . . Ebonyi . . . . . . . . . . Edo . . . . 0 . . . . 0 Ekiti . 4,807,304 112,800,000 . 117,607,304 1,200,000 1,900,000 1,100,000 . 4,200,000 Enugu . . . . 0 . . . . 0 Gombe . 848,000 . . 848,000 . 206,355 . 276,498 482,853 Imo . . . . 0 . . . . 0 Jigawa 250,000 . . . 250,000 400,000 . . . 400,000 Kaduna 49,157,412 31,159,849 42,131,923 63,094,876 185,544,060 . . . 10,915,503 10,915,503 Kano . . . . 0 . . . . 0 Katsina 820,000 250,000 250,000 1,273,790 2,593,790 100,000 121,000 140,000 286,000 647,000 Kebbi 180,182,500 . 734,020 . 180,916,520 2,750,000 . . . 2,750,000 Kogi . . . . . . . . . . Kwara . . . . 0 . . . . 0 Lagos 17,450,000 17,950,000 980,000 360,000 36,740,000 51,270,000 17,950,000 980,000 360,000 70,560,000 Nassarawa 3,602,563 7,828,980 1,296,690 899,620 13,627,853 127,690 150,850 165,200 88,550 532,290 Niger 8,900,000 . 250,000,000 1,060,000 259,960,000 5,000,000 9,295,000 11,800,000 700,000 26,795,000 Ogun 400,000 . . 40,619,500 41,019,500 50,000,000 22,949,769 38,078,245 9,363,000 120,391,014 Ondo . . . . . . . . . . Osun 15,384,688 15,384,688 15,384,688 15,384,688 61,538,752 57,660 206,135 98,920 . 362,715 Oyo . . . . . . . . . . Plateau 3,143,250 15,000 198,700 785,000 4,141,950 1,900,245 314,650 2,844,336 511,950 5,571,181 Rivers . . . . 0 . . . . 0 Sokoto . . . 152,500,000 152,500,000 . . . 3,600,000 3,600,000 Taraba . . . . 0 . . . . 0 Yobe . 30,000,000 18,000,000 . 48,000,000 . 3,000,000 1,000,000 . 4,000,000 Zamfara . . . . . . . . . . FCT . . . . . . . . . . TOTAL 340,783,843 117,484,129 457,791,666 9,298,757,663 10,214,817,301 120,320,062 57,289,663 79,955,527 298,200,557 555,765,809

253
TABLE 4.1.5 (Contd) STATE WATER BOARD – CAPACITY
Research & Development 4TH QTR ICT (Computer, etc) STATE
IST 2ND 3RD 4TH 2,006 IST 2ND 3RD 4TH 2,006
Abia . . . . . . . . . . Adamawa 450,000 700,000 430,000 400,000 1,980,000 100,000 150,000 100,000 100,000 450,000 Akwa Ibom . . . . 0 . . . . 0 Anambra . . . . 0 . . . . 0 Bauchi . . . . 0 . . . . 0 Bayelsa . . . . 0 . . . . 0 Benue . . . . 0 . . . . 0 Borno . . 15,000,000 900,000 15,900,000 . . . . 0 CRiver 300,000 . 200,000 . 500,000 . . . . 0 Delta . . . . . . . . . . Ebonyi . . . . . . . . . . Edo . . . . 0 . . . . 0 Ekiti 1,481,050 2,762,818 2,762,818 2,762,818 9,769,504 99,750 99,750 99,750 99,750 399,000 Enugu . . . . 0 . . . . 0 Gombe . . . . 0 . . . . 0 Imo . . . . 0 . . . . 0 Jigawa 150,000 . . . 150,000 1,000,000 . . . 1,000,000 Kaduna 4,084,843 . 1,144,693 5,417,250 10,646,786 4,970,281 5,646,724 3,229,959 1,393,125 15,240,089 Kano . . . . 0 . . . . 0 Katsina 31,840 . 819,910 . 851,750 4,900 . . 536,200 541,100 Kebbi 18,900,000 . . . 18,900,000 9,065,979 . 2,458,516 . 11,524,495 Kogi . . . . . . . . . . Kwara . . . . 0 . . . . 0 Lagos . . 12,440,000 55,590,000 68,030,000 . . . 420,000 420,000 Nassarawa 7,550 16,500 . 3,600 27,650 . . . . 0 Niger 81,000,000 81,000,000 81,000,000 81,000,000 324,000,000 . . . . 0 Ogun . . 3,178,000 1,300,570 4,478,570 50,000 . 5,153,950 1,524,780 6,728,730 Ondo . . . . . . . . . . Osun . 485,000 485,000 . 970,000 . . . . 0 Oyo . . . . . . . . . . Plateau 396,000 . . . 396,000 450,000 . 200,000 1,000 651,000 Rivers . . . . 0 . . . . 0 Sokoto . . . 450,000,000 450,000,000 . . . . 0 Taraba . . . . 0 . . . . 0 Yobe 600,000 720,000 500,000 . 1,820,000 2,000,000 8,000,000 1,000,000 6,000,000 17,000,000 Zamfara . . . . . . . . . . FCT . . . . . . . . . . TOTAL 107,401,283 85,684,318 117,960,421 597,374,238 908,420,260 17,740,910 13,896,474 12,242,175 10,074,855 53,954,414

254
TABLE 4.1.5 (Contd) STATE WATER BOARD – CAPACITY
Vehicles Building (Residential) STATE
IST 2ND 3RD 4TH 2,006 IST 2ND 3RD 4TH 2,006
Abia . . . . . . . . . . Adamawa 500,000 1,200,000 1,000,000 100,000 2,800,000 1,200,000 2,000,000 1,200,000 1,000,000 5,400,000 Akwa Ibom . . . . 0 . . . . 0 Anambra . . . . 0 . . . . 0 Bauchi . . . . 0 . . . . 0 Bayelsa . . . . 0 . . . . 0 Benue . . . . 0 . . . . 0 Borno . . . . 0 . . . . 0 CRiver . . . . 0 . . . . 0 Delta . . . . . . . . . . Ebonyi . . . . . . . . . . Edo . . . . 0 . . . . 0 Ekiti . . . . 0 . . . . 0 Enugu . . . . 0 . . . . 0 Gombe . . . . 0 . . . . 0 Imo . . . . 0 . . . . 0 Jigawa 1,350,000 . . . 1,350,000 . . . . 0 Kaduna . . . . 0 . . . . 0 Kano . . . . 0 . . . . 0 Katsina . . . . 0 . . . . 0 Kebbi 81,866,500 33,667,500 . . 115,534,000 . . . . 0 Kogi . . . . . . . . . . Kwara . . . . 0 . . . . 0 Lagos 199,350,000 199,350,000 199,350,000 199,350,000 797,400,000 . . . . 0 Nassarawa . . . . 0 . . . . 0 Niger . . . . 0 . . . . 0 Ogun . . . . 0 . . . . 0 Ondo . . . . . . . . . . Osun . . . . 0 . . . . 0 Oyo . . . . . . . . . . Plateau 50,884,253 45,586,389 33,988,918 17,253,006 147,712,566 . . . . 0 Rivers . . . . 0 . . . . 0 Sokoto . . . . 0 . . . . 0 Taraba . . . . 0 . . . . 0 Yobe . . . . 0 . . . . 0 Zamfara . . . . . . . . . . FCT . . . . . . . . . . TOTAL 333,950,753 279,803,889 234,338,918 216,703,006 1,064,796,566 1,200,000 2,000,000 1,200,000 1,000,000 5,400,000
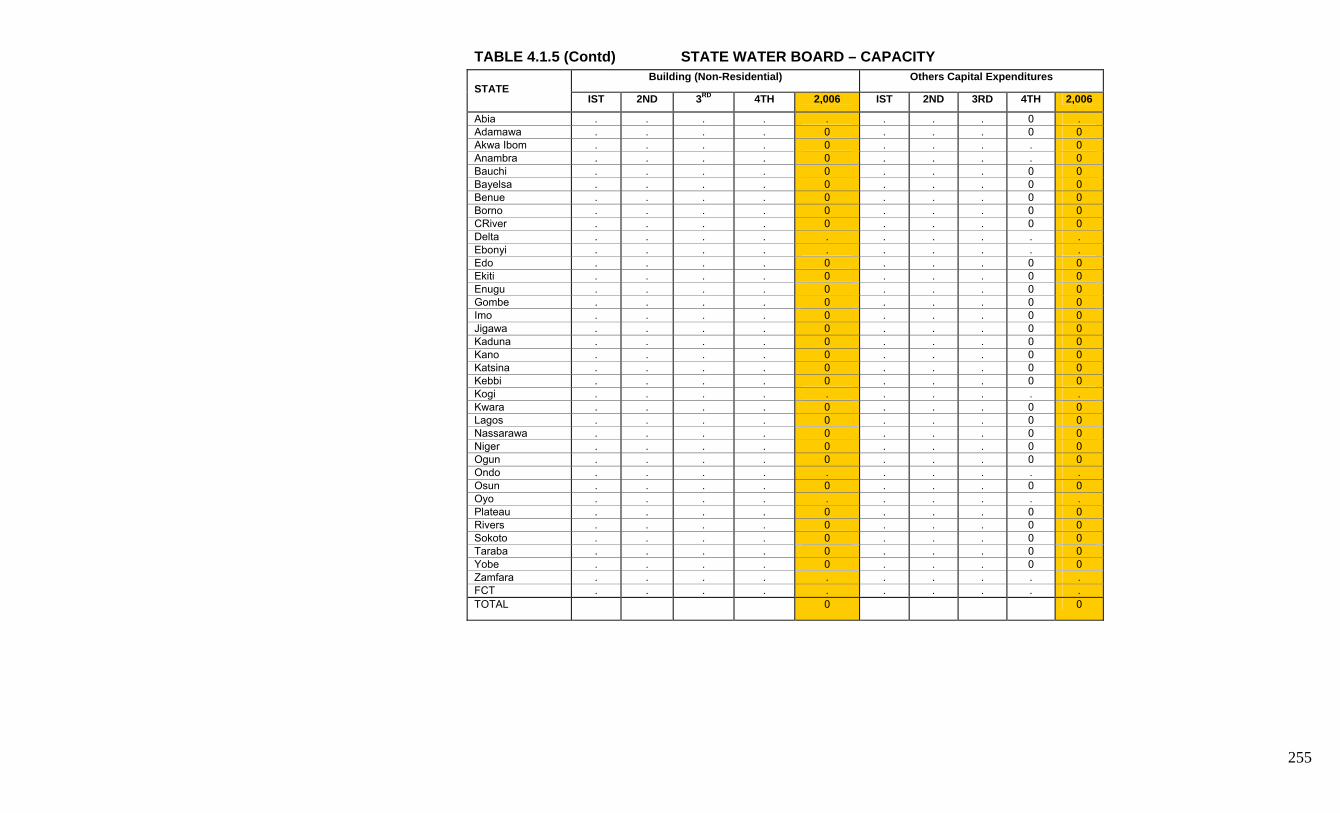
255
TABLE 4.1.5 (Contd) STATE WATER BOARD – CAPACITY
Building (Non-Residential) Others Capital Expenditures STATE
IST 2ND 3RD 4TH 2,006 IST 2ND 3RD 4TH 2,006
Abia . . . . . . . . 0 . Adamawa . . . . 0 . . . 0 0 Akwa Ibom . . . . 0 . . . . 0 Anambra . . . . 0 . . . . 0 Bauchi . . . . 0 . . . 0 0 Bayelsa . . . . 0 . . . 0 0 Benue . . . . 0 . . . 0 0 Borno . . . . 0 . . . 0 0 CRiver . . . . 0 . . . 0 0 Delta . . . . . . . . . . Ebonyi . . . . . . . . . . Edo . . . . 0 . . . 0 0 Ekiti . . . . 0 . . . 0 0 Enugu . . . . 0 . . . 0 0 Gombe . . . . 0 . . . 0 0 Imo . . . . 0 . . . 0 0 Jigawa . . . . 0 . . . 0 0 Kaduna . . . . 0 . . . 0 0 Kano . . . . 0 . . . 0 0 Katsina . . . . 0 . . . 0 0 Kebbi . . . . 0 . . . 0 0 Kogi . . . . . . . . . . Kwara . . . . 0 . . . 0 0 Lagos . . . . 0 . . . 0 0 Nassarawa . . . . 0 . . . 0 0 Niger . . . . 0 . . . 0 0 Ogun . . . . 0 . . . 0 0 Ondo . . . . . . . . . . Osun . . . . 0 . . . 0 0 Oyo . . . . . . . . . . Plateau . . . . 0 . . . 0 0 Rivers . . . . 0 . . . 0 0 Sokoto . . . . 0 . . . 0 0 Taraba . . . . 0 . . . 0 0 Yobe . . . . 0 . . . 0 0 Zamfara . . . . . . . . . . FCT . . . . . . . . . . TOTAL 0 0

256
TABLE 4.1.5 (Contd) STATE WATER BOARD – RECEIPTS STATE IST 2ND 3RD 4TH 2,006 IST 2ND 3RD 4TH 2,006
Abia . . . . . . . . . . Adamawa 300,480 482,525 421,600 212,100 1,416,705 . . . . 0 Akwa Ibom . . . 99,575,960 99,575,960 . . . 64,000,000 64,000,000 Anambra 6,321,809 3,459,320 2,261,160 1,274,000 13,316,289 . . . . 0 Bauchi . . . . 0 . . . . 0 Bayelsa 12,254,607 . . . 12,254,607 . . . . 0 Benue 2,858,258 4,690,044 3,949,792 3,637,660 15,135,754 . . . . 0 Borno 1,010,150 1,008,000 1,691,377 1,591,014 5,300,541 . . . . 0 CRiver 3,120,000 3,725,000 3,825,255 3,122,012 13,792,267 5,339,819 5,303,286 5,515,533 5,661,079 21,819,717 Delta . . . . . . . . . . Ebonyi . . . . . . . . . . Edo 10,007,010 12,810,717 6,667,660 7,678,623 37,164,010 . . . . 0 Ekiti 4,253,939 3,164,690 3,961,822 2,801,125 14,181,576 . . . . 0 Enugu 14,377,818 13,910,569 11,739,057 13,133,298 53,160,742 24,000,000 36,000,000 36,000,000 36,000,000 132,000,000 Gombe 2,071,743 225,147 1,560,750 1,888,450 5,746,090 20,231,339 3,064,323 20,541,136 16,922,791 60,759,589 Imo . . . . 0 . . . . 0 Jigawa . . . 6,695,250 6,695,250 . . . . 0 Kaduna 148,717,782 170,477,410 124,731,151 113,897,759 557,824,102 . . . . 0 Kano 125,897,372 115,816,734 112,377,118 99,206,522 453,297,746 . . . . 0 Katsina 59,443,554 73,017,383 72,713,604 63,500,405 268,674,946 2,378,275 3,703,977 101,712,410 3,521,831 111,316,493 Kebbi 31,056,200 30,556,100 31,776,200 31,600,101 124,988,601 . . . . 0 Kogi . . . . . . . . . . Kwara 14,776,884 17,477,033 14,623,584 20,615,498 67,492,999 . . . . 0 Lagos 286,000,000 286,000,000 286,000,000 286,000,000 1,144,000,000 10,400,000 10,400,000 10,400,000 10,400,000 41,600,000 Nassarawa 4,257,210 4,333,638 4,131,815 4,343,440 17,066,103 13,000,000 14,829,050 28,632,500 . 56,461,550 Niger 17,855,929 20,723,727 19,660,000 17,910,000 76,149,656 22 . . . 22 Ogun 38,045,031 44,188,492 38,408,998 34,889,821 155,532,342 80,400,000 123,490,000 61,400,000 64,110,000 329,400,000 Ondo . . . . . . . . . . Osun 10,285,278 23,621,782 20,187,239 11,258,584 65,352,883 . . . . 0 Oyo . . . . . . . . . . Plateau 53,429,049 38,967,734 45,333,131 46,859,032 184,588,946 . 552,477 . . 552,477 Rivers 2,377,375 2,377,357 2,377,375 2,377,375 9,509,482 . . . . 0 Sokoto 22,758,085 21,927,816 21,041,195 17,512,632 83,239,728 . . . . 0 Taraba . . . . 0 . . . . 0 Yobe 2,163,303 1,993,300 1,780,714 1,423,943 7,361,260 . . . . 0 Zamfara . . . . . . . . . . FCT . . . . . . . . . . TOTAL 873,638,866 894,954,518 831,220,597 893,004,604 3,492,818,585 155,749,455 197,343,113 264,201,579 200,615,701 817,909,848
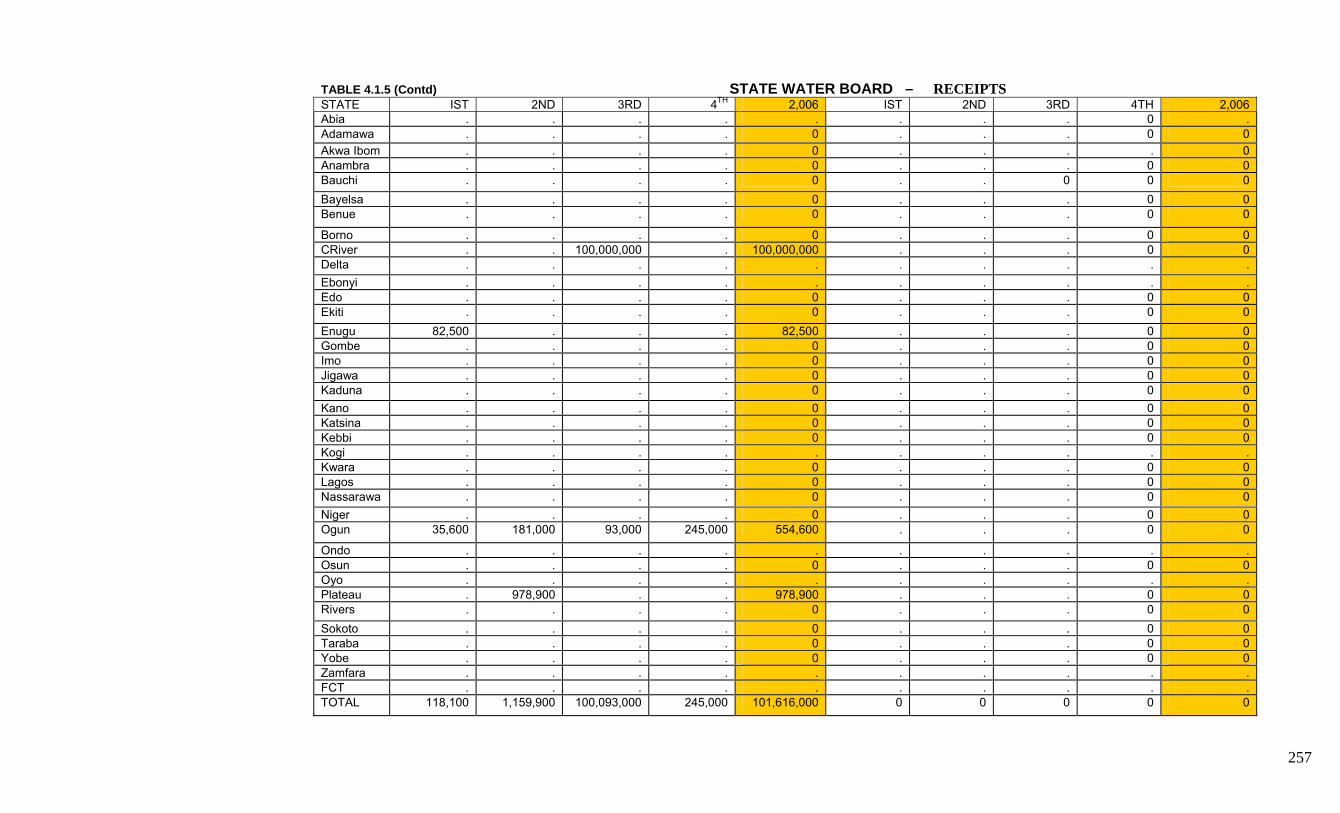
257
TABLE 4.1.5 (Contd) STATE WATER BOARD – RECEIPTS STATE IST 2ND 3RD 4TH 2,006 IST 2ND 3RD 4TH 2,006 Abia . . . . . . . . 0 . Adamawa . . . . 0 . . . 0 0 Akwa Ibom . . . . 0 . . . . 0 Anambra . . . . 0 . . . 0 0 Bauchi . . . . 0 . . 0 0 0 Bayelsa . . . . 0 . . . 0 0 Benue . . . . 0 . . . 0 0
Borno . . . . 0 . . . 0 0 CRiver . . 100,000,000 . 100,000,000 . . . 0 0 Delta . . . . . . . . . . Ebonyi . . . . . . . . . . Edo . . . . 0 . . . 0 0 Ekiti . . . . 0 . . . 0 0 Enugu 82,500 . . . 82,500 . . . 0 0 Gombe . . . . 0 . . . 0 0 Imo . . . . 0 . . . 0 0 Jigawa . . . . 0 . . . 0 0 Kaduna . . . . 0 . . . 0 0 Kano . . . . 0 . . . 0 0 Katsina . . . . 0 . . . 0 0 Kebbi . . . . 0 . . . 0 0 Kogi . . . . . . . . . . Kwara . . . . 0 . . . 0 0 Lagos . . . . 0 . . . 0 0 Nassarawa . . . . 0 . . . 0 0 Niger . . . . 0 . . . 0 0 Ogun 35,600 181,000 93,000 245,000 554,600 . . . 0 0
Ondo . . . . . . . . . . Osun . . . . 0 . . . 0 0 Oyo . . . . . . . . . . Plateau . 978,900 . . 978,900 . . . 0 0 Rivers . . . . 0 . . . 0 0 Sokoto . . . . 0 . . . 0 0 Taraba . . . . 0 . . . 0 0 Yobe . . . . 0 . . . 0 0 Zamfara . . . . . . . . . . FCT . . . . . . . . . . TOTAL 118,100 1,159,900 100,093,000 245,000 101,616,000 0 0 0 0 0

258
TABLE 4.1.6 a STATE WATER BOARD
INFORMATION AND COMMUNICATION TECHNOLOGY
Percent Establisment owning internet facilities 33.3
Establishment having website? 25.9
Establishment receiving orders through the internet? 22.2
Do you place orders through the internet? 18.5
Etablishment having intrarnets? 29.6
Establishments having Local Area Networks (LAN) 29.6

259
TABLE 4.1.6 (b) STATE WATER BOARD INFORMATION AND COMMUNICATION TECHNOLOGY
STATE
Number of computers in your
organizations?
Number of employees with
access to internet facilitie
Number of employee using
Personal Computers (PCs)
Investment on ICT from domestics
sources during the year (Naira)
Investment on ICT from foreign sources
during the year (USD)
Amount spend on ICT during the year (Naira)
Abia 1 0 1 0 0 0 Adamawa 9 0 0 0 0 0 Akwa Ibom 20 10 30 3,210,000 3,658,331 0 Anambra 8 12 5 0 0 0 Bauchi . . . . . 0 Bayelsa 1 0 0 0 0 0 Benue 3 0 0 0 0 0 Borno 16 0 0 0 0 0 Criver 10 5 3 0 0 0 Delta . . . . . . Ebonyi . . . . . . Edo 25 0 0 0 0 0 Ekiti 9 5 4 0 0 0 Enugu 10 3 10 0 0 0 Gombe 0 0 0 0 0 0 Imo 3 0 5 0 0 0 Jigawa 8 20 2 0 0 0 Kaduna 100 50 300 0 0 0 Kano 18 0 0 0 0 0 Katsina 20 3 2 647,000 0 647,000 Kebbi 2 0 2 0 0 0 Kogi . . . . . . Kwara 11 0 0 0 0 0 Lagos 100 100 100 35,600,000 0 35,600,000 Nassarawa 9 1 4 0 0 0 Niger 0 12 0 0 0 0 Ogun 36 11 36 1,730,218 0 1,730,218 Ondo . . . . . . Osun 14 30 150 487,855 . 487,855 Oyo . . . . . . Plateau 16 12 10 2,175,000 0 2,175,000 Rivers 4 10 0 0 0 0 Sokoto 6 0 2 0 0 0 Taraba 6 36 3 0 0 0 Yobe 8 15 15 960,000 0 200,000 Zamfara . . . . . . FCT . . . . . . TOTAL 473 335 684 44,810,073 3,658,331 40,840,073

260
TABLE 4.2.1 WATER RESOURCES STATISTICS Value of Contracts Projects
Project Number Project Number Project Number
Project Number
Project Number
Project Number
Project Number
Project Number
Project Number
Project Number
Project Number
Project Number
STATE
1 2 3 4 5 6 7 8 9 10 11 12 Abia 93,000,000 160,000,000 30,000,000 12,000,000 15,600,000 28,000,000 . . . . . . Adamawa 5,940,620 97,875,000 2,995,500 3,503,900 . . . . . . . . Akwa-Ibom . . . . . . . . . . . . Anambra 1,500,000 1,200,000 . . . . . . . . . . Bauchi 573,923,400 901,598,233 38,734,416 106,325,036 . . . . . . . . Bayesa 130,000,000 45,531,000 45,531,000 22,236,000 55,990,000 41,300,000 28,069,000 26,400,000 36,088,000 31,438,000 39,169,000 57,629,000 Benue 3,000,000 3,640,000 25,000,000 13,800,000 14,880,000 3,105,000 590,000,000 136,492,000 211,740,000 25,393,000 13,800,000 112,100,000 Borno . . . . . . . . . . . . Cross River . . . . . . . . . . . . Delta 4,312,980 . 4,985,858 2,156,490 2,156,491 4,687,133 2,190,169 2,125,594 9,988,838 12,894,816 4,530,000 11,299,714 Ebonyi . . . . . . . . . . . . Edo . . . . . . . . . . . . Ekiti 340,000 962,000 1,000,000 60,000,000 147,000,000 2,700,000 10,000,000 9,900,000 1,200,000 17,212,492 . . Enugu . . . . . . . . . . . . Gombe 64,000,000 86,000,000 . . . . . . . . . . Imo . . . . . . . . . . . . Jigawa 21,000,000,000 15,000,000,000 38,943,600 6,000,000,000 . . . . . . . . Kaduna 2,684,194 6,564,158 2,682,853 9,698,785 26,551,305 13,256,833 15,588,547 8,993,050 6,439,702 7,095,375 6,710,456 9,500,000 Kano 300,000,000 5,859,401,351 36,379,750 42,936,941 79,116,400 36,551,600 34,479,500 6,321,175 32,340,400 9,782,036 10,000,000 311,683,189 Katsina 5,000,000 15,000,000 13,223,600 36,195,690 . 100,000,00
0 . . . . . .
Kebbi 10,954,800 17,047,800 18,000,000 50,000,000 157,942,056 24,523,066 11,250,000 54,635,490 10,954,800 64,445,000 15,610,140 146,511,773 Kogi . . . . . . . . . . . . Kwara 928,776,972 1,739,160 9,975,300 5,953,500 5,051,371 69,903,200 2,024,750 14,741,797 1,283,880 2,147,350 3,874,547 619,000 Lagos . . . . . . . . . . . . Nasarawa . . . . . . . . . . . . Niger 4,900,000 222,000,000 . . . . . . . . . . Ogun . . . . . . . . . . . . Ondo . . . . . . . . . . . . Osun . . . . . . . . . . . . Oyo . . . . . . . . . . . . Plateau 3,171,050 7,440,000 . . . . . . . . . . Rivers 65,000,000 6,096,750 220,000 76,392,811 79,557,084 50,000,000 20,000,000 2,585,000 . . . . Sokoto . . . . . . . . . . . . Taraba 450,000 . . . . . . . . . . . Yobe 86,893,030 1,000,000 2,400,000 1,500,000 5,950,000 3,718,000 7,375,786 2,042,857 3,900,000 5,052,500 4,000,000 9,000,000 Zamfara . 2,000,000 9,723,499 921,000 78,792,000 83,800,000 773,000 . . . . . FCT . . . . . . . . . . . .

261
TABLE 4.2.1(Contd) WATER RESOURCES STATISTICS Value of Contracts Projects
Project Number
Project Number
Project Number Project Number
Project Number
Project Number
Project Number
Project Number
Project Number
Project Number
Project Number
STATE 14 15 16 17 18 19 20 21 22 23 24
Abia . . . . . . . . . . . Adamawa . . . . . . . . . . . Akwa-Ibom . . . . . . . . . . . Anambra . . . . . . . . . . . Bauchi . . . . . . . . . . . Bayesa 24,169,000 14,270,000 24,869,000 49,369,000 25,169,000 12,300,000 16,400,000 31,761,000 21,300,000 75,450,000 39,550,000 Benue 35,000,000 85,000,000 8,581,000 . . . . . . . . Borno . . . . . . . . . . . Cross River . . . . . . . . . . . Delta 2,367,750 9,971,539 4,882,113 12,410,552 4,923,278 18,634,408 4,882,113 4,998,213 2,663,175 4,800,000 3,661,880 Ebonyi . . . . . . . . . . . Edo . . . . . . . . . . . Ekiti . . . . . . . . . . . Enugu . . . . . . . . . . . Gombe . . . . . . . . . . . Imo . . . . . . . . . . . Jigawa . . . . . . . . . . . Kaduna 10,289,500 11,467,418 6,446,370 13,400,436 2,682,853 27,984,716 3,690,803 13,926,527 . . . Kano . . . . . . . . . . . Katsina . . . . . . . . . . . Kebbi . . . . . . . . . . . Kogi . . . . . . . . . . . Kwara 3,069,270 1,507,500 3,016,980 1,309,367 1,190,456 1,122,920 12,892,684 8,216,298 3,646,788 20,964,100 2,858,220 Lagos . . . . . . . . . . . Nasarawa . . . . . . . . . . . Niger . . . . . . . . . . . Ogun . . . . . . . . . . . Ondo . . . . . . . . . . . Osun . . . . . . . . . . . Oyo . . . . . . . . . . . Plateau . . . . . . . . . . . Rivers . . . . . . . . . . . Sokoto . . . . . . . . . . . Taraba . . . . . . . . . . . Yobe 2,915,000 1,800,000 2,915,000 2,616,000 489,613 8,476,650 1,500,000 800,000 2,680,650 3,855,000 3,855,000 Zamfara . . . . . . . . . . . FCT . . . . . . . . . . .

262
TABLE 4.2.1(Contd) WATER RESOURCES STATISTICS Value of Contracts Projects
Project Number
Project Number
Project Number
Project Number
Project Number
Project Number
Project Number
Project Number
Project Number
Project Number
Project Number
Project Number
STATE 26 27 28 29 30 31 32 33 34 35 36 37
Abia . . . . . . . . . . . . Adamawa . . . . . . . . . . . . Akwa-Ibom . . . . . . . . . . . . Anambra . . . . . . . . . . . . Bauchi . . . . . . . . . . . . Bayesa 33,488,500 21,300,000 5,000,000 25,169,000 1,525,000,000 24,669,000 49,819,000 11,394,000 25,169,000 69,715,400 2,579,500,000 . Benue . . . . . . . . . . . . Borno . . . . . . . . . . . . Cross River . . . . . . . . . . . . Delta 386,400 714,000 4,995,203 4,840,000 1,925,325 3,661,880 3,661,880 3,661,880 2,465,925 2,465,925 11,711,135 1,145,650 Ebonyi . . . . . . . . . . . . Edo . . . . . . . . . . . . Ekiti . . . . . . . . . . . . Enugu . . . . . . . . . . . . Gombe . . . . . . . . . . . . Imo . . . . . . . . . . . . Jigawa . . . . . . . . . . . . Kaduna . . . . . . . . . . . . Kano . . . . . . . . . . . . Katsina . . . . . . . . . . . . Kebbi . . . . . . . . . . . . Kogi . . . . . . . . . . . . Kwara 7,789,500 3,698,400 2,696,941 1,912,370 1,085,400 1,499,628 2,199,610 4,000,000 3,600,500 55,973,497 32,663,590 4,705,710 Lagos . . . . . . . . . . . . Nasarawa . . . . . . . . . . . . Niger . . . . . . . . . . . . Ogun . . . . . . . . . . . . Ondo . . . . . . . . . . . . Osun . . . . . . . . . . . . Oyo . . . . . . . . . . . . Plateau . . . . . . . . . . . . Rivers . . . . . . . . . . . . Sokoto . . . . . . . . . . . . Taraba . . . . . . . . . . . . Yobe 345,000 1,911,800 2,529,000 1,155,000 12,000 12,000 971,000 300,000 2,980,000 774,510 1,700,000 4,508,000 Zamfara . . . . . . . . . . . . FCT. . . . . . . . . . . . .
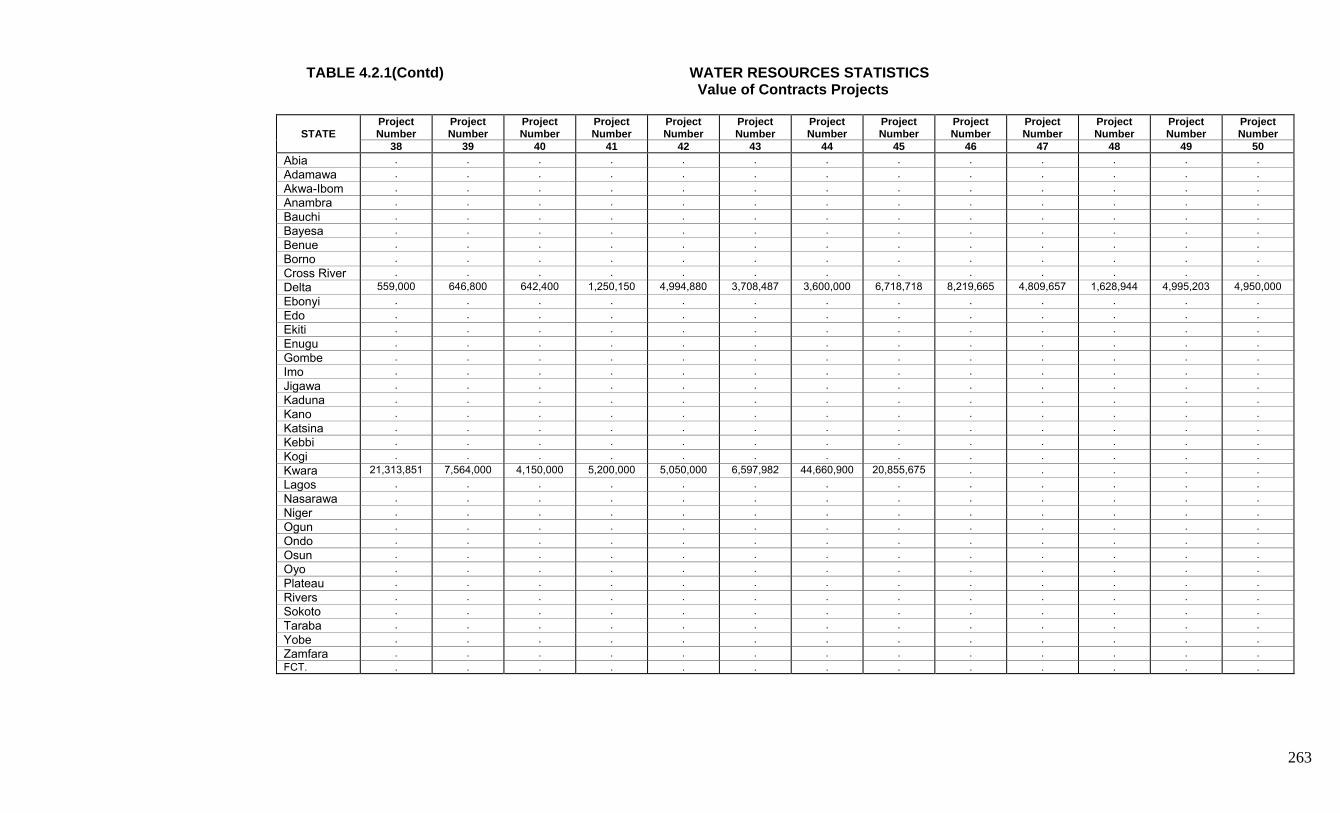
263
TABLE 4.2.1(Contd) WATER RESOURCES STATISTICS Value of Contracts Projects
Project Number
Project Number
Project Number
Project Number
Project Number
Project Number
Project Number
Project Number
Project Number
Project Number
Project Number
Project Number
Project Number
STATE
38 39 40 41 42 43 44 45 46 47 48 49 50 Abia . . . . . . . . . . . . . Adamawa . . . . . . . . . . . . . Akwa-Ibom . . . . . . . . . . . . . Anambra . . . . . . . . . . . . . Bauchi . . . . . . . . . . . . . Bayesa . . . . . . . . . . . . . Benue . . . . . . . . . . . . . Borno . . . . . . . . . . . . . Cross River . . . . . . . . . . . . . Delta 559,000 646,800 642,400 1,250,150 4,994,880 3,708,487 3,600,000 6,718,718 8,219,665 4,809,657 1,628,944 4,995,203 4,950,000 Ebonyi . . . . . . . . . . . . . Edo . . . . . . . . . . . . . Ekiti . . . . . . . . . . . . . Enugu . . . . . . . . . . . . . Gombe . . . . . . . . . . . . . Imo . . . . . . . . . . . . . Jigawa . . . . . . . . . . . . . Kaduna . . . . . . . . . . . . . Kano . . . . . . . . . . . . . Katsina . . . . . . . . . . . . . Kebbi . . . . . . . . . . . . . Kogi . . . . . . . . . . . . . Kwara 21,313,851 7,564,000 4,150,000 5,200,000 5,050,000 6,597,982 44,660,900 20,855,675 . . . . . Lagos . . . . . . . . . . . . . Nasarawa . . . . . . . . . . . . . Niger . . . . . . . . . . . . . Ogun . . . . . . . . . . . . . Ondo . . . . . . . . . . . . . Osun . . . . . . . . . . . . . Oyo . . . . . . . . . . . . . Plateau . . . . . . . . . . . . . Rivers . . . . . . . . . . . . . Sokoto . . . . . . . . . . . . . Taraba . . . . . . . . . . . . . Yobe . . . . . . . . . . . . . Zamfara . . . . . . . . . . . . . FCT. . . . . . . . . . . . . .

264
TABLE 4.2.2 WATER RESOURCES STATISTICS Amount Spent on Projects by Type
Project Number
Project Number
Project Number
Project Number
Project Number
Project Number
Project Number
Project Number
Project Number
Project Number
STATE
1 2 3 4 5 6 7 8 9 10 Abia 107,125,000 13,198,670 17,638,276 12,000,000 10,100,000 2,000,000 . . . . Adamawa 5,940,620 97,875,000 2,995,500 3,503,900 . . . . . . Akwa-Ibom . . . . . . . . . . Anambra 1,500,000 1,200,000 . . . . . . . . Bauchi 382,798,849 60,100,000,000 12,580,500 59,081,225 . . . . . . Bayesa . 30,811,000 17,493,123 16,011,000 10,970,000 23,300,000 6,500,000 12,000,000 17,088,500 8,000,000 Benue 431,000,000 3,640,000 24,800,000 13,800,000 14,880,000 3,105,000 254,000,000 82,000,000 152,484,000 20,890,000 Borno . . . . . . . . . . Cross River . . . . . . . . . . Delta 4,312,980 . 4,985,858 2,156,490 2,156,490 4,452,776 . . 9,489,396 12,849,816 Ebonyi . . . . . . . . . . Edo . . . . . . . . . . Ekiti 340,000 962,000 1,000,000 60,000,000 147,000,000 2,700,000 10,000,000 194,000,000 1,200,000 17,212,492 Enugu . . . . . . . . . . Gombe 90,000,000 . . . . . . . . . Imo . . . . . . . . . . Jigawa . . . 310,000,000 . . . . . . Kaduna 2,684,194 6,564,158 2,682,853 9,598,785 26,551,305 10,097,091 15,588,547 8,993,050 6,439,702 7,095,375 Kano 300,000,000 3,857,173,994 36,379,750 42,936,941 79,116,400 36,551,600 34,479,500 6,321,175 32,340,400 9,782,036 Katsina 5,000,000 15,000,000 13,223,600 36,195,690 63,007,950 36,933,950 . . . . Kebbi 8,656,300 11,000,000 . 22,000,000 105,034,467 15,700,000 7,386,875 . . . Kogi . . . . . . . . . . Kwara 633,410,162 1,438,196 7,855,988 4,686,065 3,984,022 65,049,098 1,211,813 14,004,707 1,219,686 1,219,686 Lagos . . . . . . . . . . Nasarawa . . . . . . . . . . Niger 3,200,000 205,000,000 . . . . . . . . Ogun . . . . . . . . . . Ondo . . . . . . . . . . Osun . . . . . . . . . . Oyo . . . . . . . . . . Plateau 3,171,050 7,440,000 . . . . . . . . Rivers . . . . . . . . . . Sokoto . . . . . . . . . . Taraba 450,000 20,000 200,000 . . . . . . . Yobe 15,000,000 . 450,000 700,000 4,865,512 . 5,000,000 . . . Zamfara . . . 921,000 939,600 . 773,000 . . . FCT . . . . . . . . . .

265
TABLE 4.2.2(Contd) WATER RESOURCES STATISTICS Amount Spent on Projects by Type
Project Number
Project Number
Project Number
Project Number
Project Number
Project Number
Project Number
Project Number
Project Number
Project Number
STATE
11 12 13 14 15 16 17 18 19 20 Abia . . . . . . . . . . Adamawa . . . . . . . . . . Akwa-Ibom . . . . . . . . . . Anambra . . . . . . . . . . Bauchi . . . . . . . . . . Bayesa 27,300,000 25,221,100 8,000,000 2,000,000 3,600,000 . . 3,500,000 4,000,000 8,000,000 Benue 12,800,000 52,000,000 135,950,000 10,500,000 35,000,000 3,581,000 . . . . Borno . . . . . . . . . . Cross River . . . . . . . . . . Delta . 10,734,728 18,718,172 . 9,472,961 . . 4,677,114 . 4,638,007 Ebonyi . . . . . . . . . . Edo . . . . . . . . . . Ekiti . . . . . . . . . . Enugu . . . . . . . . . . Gombe . . . . . . . . . . Imo . . . . . . . . . . Jigawa . . . . . . . . . . Kaduna 6,710,456 9,500,000 4,950,000 10,289,500 . . . 2,682,853 . . Kano 10,000,000 6,400,000 . . . . . . . . Katsina . . . . . . . . . . Kebbi 6,800,000 112,105,572 . . . . . . . . Kogi . . . . . . . . . . Kwara 3,487,093 495,200 888,989 2,915,807 1,432,125 2,866,131 1,243,899 1,130,933 1,066,774 10,958,781 Lagos . . . . . . . . . . Nasarawa . . . . . . . . . . Niger . . . . . . . . . . Ogun . . . . . . . . . . Ondo . . . . . . . . . . Osun . . . . . . . . . . Oyo . . . . . . . . . . Plateau . . . . . . . . . . Rivers . . . . . . . . . . Sokoto . . . . . . . . . . Taraba . . . . . . . . . . Yobe 3,000,000 3,000,000 1,320,000 . 357,143 . 1,300,000 . . 700,000 Zamfara . . . . . . . . . . FCT . . . . . . . . . .

266
TABLE 4.2.2(Contd) WATER RESOURCES STATISTICS Amount Spent on Projects by Type
Project Number
Project Number
Project Number
Project Number
Project Number
Project Number
Project Number
Project Number
Project Number
Project Number STATE
21 22 23 24 25 26 27 28 29 30 Abia . . . . . . . . . . Adamawa . . . . . . . . . . Akwa-Ibom . . . . . . . . . . Anambra . . . . . . . . . . Bauchi . . . . . . . . . . Bayesa . 13,300,000 70,180,000 16,000,000 . . 7,000,000 . 7,300,000 775,622,000 Benue . . . . . . . . . . Borno . . . . . . . . . . Cross River . . . . . . . . . . Delta . 2,530,016 . . 1,890,000 386,400 714,000 . . 1,829,059 Ebonyi . . . . . . . . . . Edo . . . . . . . . . . Ekiti . . . . . . . . . . Enugu . . . . . . . . . . Gombe . . . . . . . . . . Imo . . . . . . . . . . Jigawa . . . . . . . . . . Kaduna . . . . . . . . . . Kano . . . . . . . . . . Katsina . . . . . . . . . . Kebbi . . . . . . . . . . Kogi . . . . . . . . . . Kwara 7,394,586 3,026,834 13,626,665 2,715,309 3,075,364 7,164,782 3,513,480 2,561,894 1,816,572 1,083,400 Lagos . . . . . . . . . . Nasarawa . . . . . . . . . . Niger . . . . . . . . . . Ogun . . . . . . . . . . Ondo . . . . . . . . . . Osun . . . . . . . . . . Oyo . . . . . . . . . . Plateau . . . . . . . . . . Rivers . . . . . . . . . . Sokoto . . . . . . . . . . Taraba . . . . . . . . . . Yobe . . . . . . . . 540,000 11,750 Zamfara . . . . . . . . . . FCT . . . . . . . . . .

267
TABLE 4.2.2(Contd) WATER RESOURCES STATISTICS Amount Spent on Projects by Type
STATE
Project Number
Project Number
Project Number
Project Number
Project Number
Project Number
Project Number
Project Number
Project Number
Project Number
31 32 33 34 35 36 37 38 39 40 Abia . . . . . . . . . . Adamawa . . . . . . . . . . Akwa-Ibom . . . . . . . . . . Anambra . . . . . . . . . . Bauchi . . . . . . . . . . Bayesa 8,000,000 12,950,000 . . 17,400,000 . . . . . Benue . . . . . . . . . . Borno . . . . . . . . . . Cross River . . . . . . . . . . Delta . 3,478,786 0 2,465,925 2,465,925 . . . . . Ebonyi . . . . . . . . . . Edo . . . . . . . . . . Ekiti . . . . . . . . . . Enugu . . . . . . . . . . Gombe . . . . . . . . . . Imo . . . . . . . . . . Jigawa . . . . . . . . . . Kaduna . . . . . . . . . . Kano . . . . . . . . . . Katsina . . . . . . . . . . Kebbi . . . . . . . . . . Kogi . . . . . . . . . . Kwara 1,424,646 2,089,630 2,000,000 1,080,150 16,792,049 9,799,077 4,078,498 14,707,468 2,269,200 1,245,100 Lagos . . . . . . . . . . Nasarawa . . . . . . . . . . Niger . . . . . . . . . . Ogun . . . . . . . . . . Ondo . . . . . . . . . . Osun . . . . . . . . . . Oyo . . . . . . . . . . Plateau . . . . . . . . . . Rivers . . . . . . . . . . Sokoto . . . . . . . . . . Taraba . . . . . . . . . . Yobe 11,750 . . . . . . . . . Zamfara . . . . . . . . . . FCT . . . . . . . . . .

268
TABLE 4.2.2(Contd) WATER RESOURCES STATISTICS Amount Spent on Projects by Type
Project Number
Project Number
Project Number
Project Number
Project Number
Project Number
Project Number
Project Number
Project Number
Project Number
STATE
41 42 43 44 45 46 47 48 49 50 Abia . . . . . . . . . . Adamawa . . . . . . . . . . Akwa-Ibom . . . . . . . . . . Anambra . . . . . . . . . . Bauchi . . . . . . . . . . Bayesa . . . . . . . . . . Benue . . . . . . . . . . Borno . . . . . . . . . . Cross River . . . . . . . . . . Delta . . 3,523,063 . . . . 1,628,944 . . Ebonyi . . . . . . . . . . Edo . . . . . . . . . . Ekiti . . . . . . . . . . Enugu . . . . . . . . . . Gombe . . . . . . . . . . Imo . . . . . . . . . . Jigawa . . . . . . . . . . Kaduna . . . . . . . . . . Kano . . . . . . . . . . Katsina . . . . . . . . . . Kebbi . . . . . . . . . . Kogi . . . . . . . . . . Kwara 1,560,000 1,515,000 1,979,394 13,390,270 6,256,703 . . . . . Lagos . . . . . . . . . . Nasarawa . . . . . . . . . . Niger . . . . . . . . . . Ogun . . . . . . . . . . Ondo . . . . . . . . . . Osun . . . . . . . . . . Oyo . . . . . . . . . . Plateau . . . . . . . . . . Rivers . . . . . . . . . . Sokoto . . . . . . . . . . Taraba . . . . . . . . . . Yobe . . . . . . . . . . Zamfara . . . . . . . . . . FCT . . . . . . . . . .

269
TABLE 4.2.3 WATER RESOURCES STATISTICS Percentage of Completion by Project Type
Project Number
Project Number
Project Number
Project Number
Project Number
Project Number
Project Number
Project Number
Project Number
Project Number
Project Number
Project Number
STATE 1 2 3 4 5 6 7 8 9 10 11 12 Abia 100.0 85.0 5.0 100.0 30.0 . . . . . . . Adamawa 100.0 100.0 100.0 100.0 . . . . . . . . Akwa-Ibom . . . . . . . . . . . . Anambra 100.0 100.0 . . . . . . . . . . Bauchi 30.0 . 75.0 100.0 . . . . . . . . Bayesa . 70.0 35.0 35.0 30.0 40.0 30.0 65.0 30.0 30.0 70.0 30.0 Benue 10.0 100.0 100.0 100.0 100.0 100.0 60.0 60.0 65.0 95.0 85.0 16.0 Borno . . . . . . . . . . . . Cross River 95.0 100.0 90.0 . . 100.0 100.0 . . . . . Delta 100.0 . 100.0 100.0 100.0 . 100.0 100.0 100.0 100.0 . 100.0 Ebonyi 100.0 . . . . . . . . . . . Edo . . . . . . . . . . . . Ekiti 100.0 100.0 100.0 100.0 100.0 100.0 100.0 100.0 100.0 100.0 . . Enugu . . . . . . . . . . . . Gombe 85.0 0.1 . . . . . . . . . . Imo . . . . . . . . . . . . Jigawa 20.0 20.0 80.0 5.0 . . . . . . . . Kaduna 100.0 100.0 100.0 100.0 100.0 95.0 100.0 100.0 100.0 90.0 100.0 100.0 Kano 100.0 . 100.0 100.0 100.0 100.0 100.0 100.0 100.0 100.0 100.0 . Katsina . 100.0 100.0 100.0 . 100.0 . . . . . . Kebbi 95.0 85.0 . 75.0 85.0 85.0 95.0 60.0 95.0 95.0 90.0 95.0 Kogi . . . . . . . . . . . . Kwara . 100.0 . . . . 100.0 100.0 100.0 100.0 100.0 100.0 Lagos . . . . . . . . . . . . Nasarawa . . . . . . . . . . . . Niger 75.0 87.8 . . . . . . . . . . Ogun . . . . . . . . . . . . Ondo . . . . . . . . . . . . Osun . . . . . . . . . . . . Oyo . . . . . . . . . . . . Plateau 100.0 100.0 . . . . . . . . . . Rivers 100.0 100.0 100.0 85.0 75.0 100.0 100.0 100.0 . . . . Sokoto . . . . . . . . . . . . Taraba 100.0 100.0 50.0 . . . . . . . . . Yobe . . . . . . . . . . . . Zamfara 100.0 . 20.0 100.0 80.0 40.0 100.0 . . . . . FCT . . . . . . . . . . . .

270
TABLE 4.2.3 (Contd) WATER RESOURCES STATISTICS Percentage of Completion by Project Type
Project Number
Project Number
Project Number
Project Number
Project Number
Project Number
Project Number
Project Number
Project Number
Project Number
Project Number
Project Number
STATE 13 14 15 16 17 18 19 20 21 22 23 24 Abia . . . . . . . . . . . . Adamawa . . . . . . . . . . . . Akwa-Ibom . . . . . . . . . . . . Anambra . . . . . . . . . . . . Bauchi . . . . . . . . . . . . Bayesa 30.0 40.0 30.0 20.0 40.0 25.0 30.0 60.0 20.0 50.0 80.0 30.0 Benue 75.0 18.0 18.0 65.0 . . . . . . . . Borno . . . . . . . . . . . . Cross River . . . . . . . . . . . . Delta 100.0 . 100.0 100.0 100.0 100.0 100.0 100.0 100.0 100.0 . 100.0 Ebonyi . . . . . . . . . . . . Edo . . . . . . . . . . . . Ekiti . . . . . . . . . . . . Enugu . . . . . . . . . . . . Gombe . . . . . . . . . . . . Imo . . . . . . . . . . . . Jigawa . . . . . . . . . . . . Kaduna 100.0 100.0 50.0 20.0 50.0 100.0 50.0 100.0 60.0 . . . Kano . . . . . . . . . . . . Katsina . . . . . . . . . . . . Kebbi . . . . . . . . . . . . Kogi . . . . . . . . . . . . Kwara 100.0 . 100.0 100.0 100.0 100.0 100.0 100.0 100.0 100.0 100.0 100.0 Lagos . . . . . . . . . . . . Nasarawa . . . . . . . . . . . . Niger . . . . . . . . . . . . Ogun . . . . . . . . . . . . Ondo . . . . . . . . . . . . Osun . . . . . . . . . . . . Oyo . . . . . . . . . . . . Plateau . . . . . . . . . . . . Rivers . . . . . . . . . . . . Sokoto . . . . . . . . . . . . Taraba . . . . . . . . . . . . Yobe . . . . . . . . . . . . Zamfara . . . . . . . . . . . . FCT . . . . . . . . . . . .
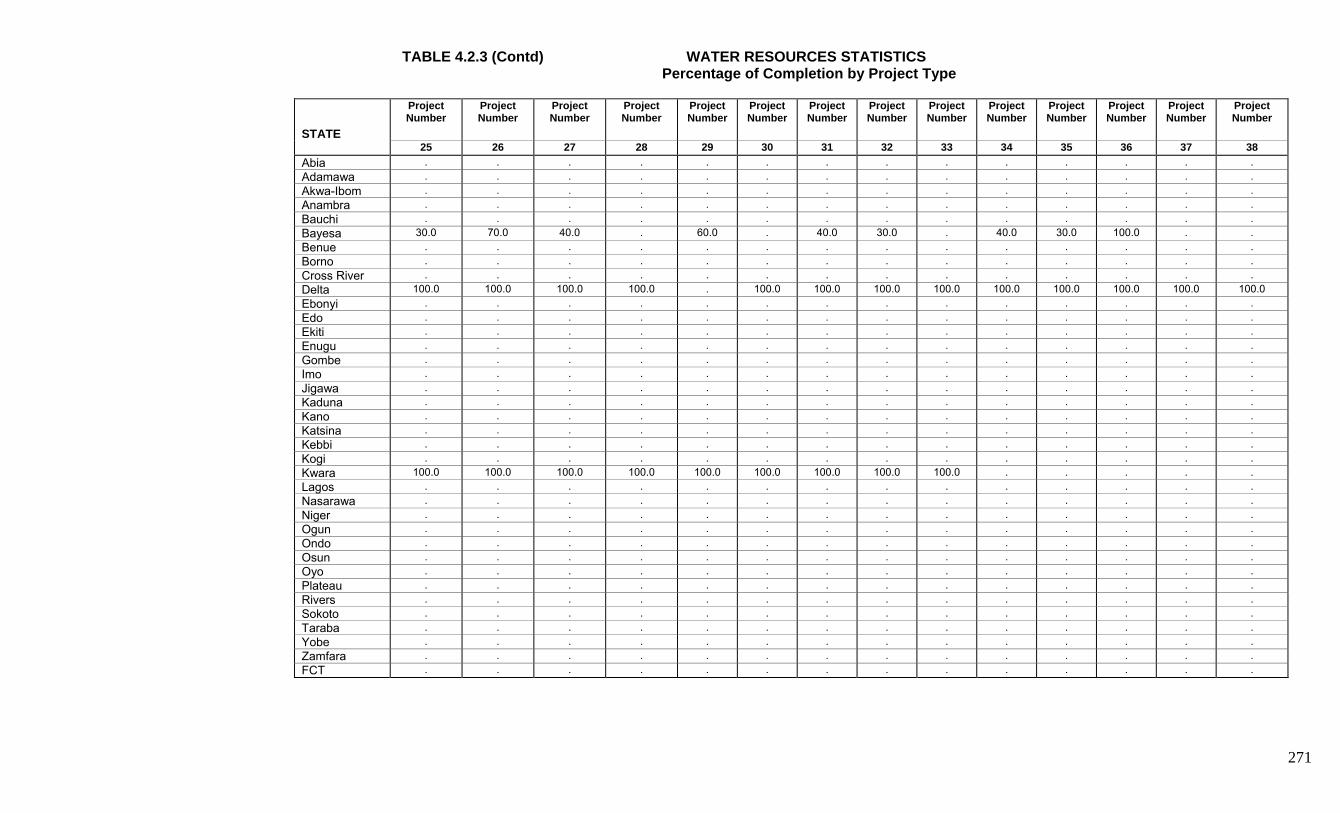
271
TABLE 4.2.3 (Contd) WATER RESOURCES STATISTICS Percentage of Completion by Project Type
STATE
Project Number
Project Number
Project Number
Project Number
Project Number
Project Number
Project Number
Project Number
Project Number
Project Number
Project Number
Project Number
Project Number
Project Number
25 26 27 28 29 30 31 32 33 34 35 36 37 38 Abia . . . . . . . . . . . . . . Adamawa . . . . . . . . . . . . . . Akwa-Ibom . . . . . . . . . . . . . . Anambra . . . . . . . . . . . . . . Bauchi . . . . . . . . . . . . . . Bayesa 30.0 70.0 40.0 . 60.0 . 40.0 30.0 . 40.0 30.0 100.0 . . Benue . . . . . . . . . . . . . . Borno . . . . . . . . . . . . . . Cross River . . . . . . . . . . . . . . Delta 100.0 100.0 100.0 100.0 . 100.0 100.0 100.0 100.0 100.0 100.0 100.0 100.0 100.0 Ebonyi . . . . . . . . . . . . . . Edo . . . . . . . . . . . . . . Ekiti . . . . . . . . . . . . . . Enugu . . . . . . . . . . . . . . Gombe . . . . . . . . . . . . . . Imo . . . . . . . . . . . . . . Jigawa . . . . . . . . . . . . . . Kaduna . . . . . . . . . . . . . . Kano . . . . . . . . . . . . . . Katsina . . . . . . . . . . . . . . Kebbi . . . . . . . . . . . . . . Kogi . . . . . . . . . . . . . . Kwara 100.0 100.0 100.0 100.0 100.0 100.0 100.0 100.0 100.0 . . . . . Lagos . . . . . . . . . . . . . . Nasarawa . . . . . . . . . . . . . . Niger . . . . . . . . . . . . . . Ogun . . . . . . . . . . . . . . Ondo . . . . . . . . . . . . . . Osun . . . . . . . . . . . . . . Oyo . . . . . . . . . . . . . . Plateau . . . . . . . . . . . . . . Rivers . . . . . . . . . . . . . . Sokoto . . . . . . . . . . . . . . Taraba . . . . . . . . . . . . . . Yobe . . . . . . . . . . . . . . Zamfara . . . . . . . . . . . . . . FCT . . . . . . . . . . . . . .
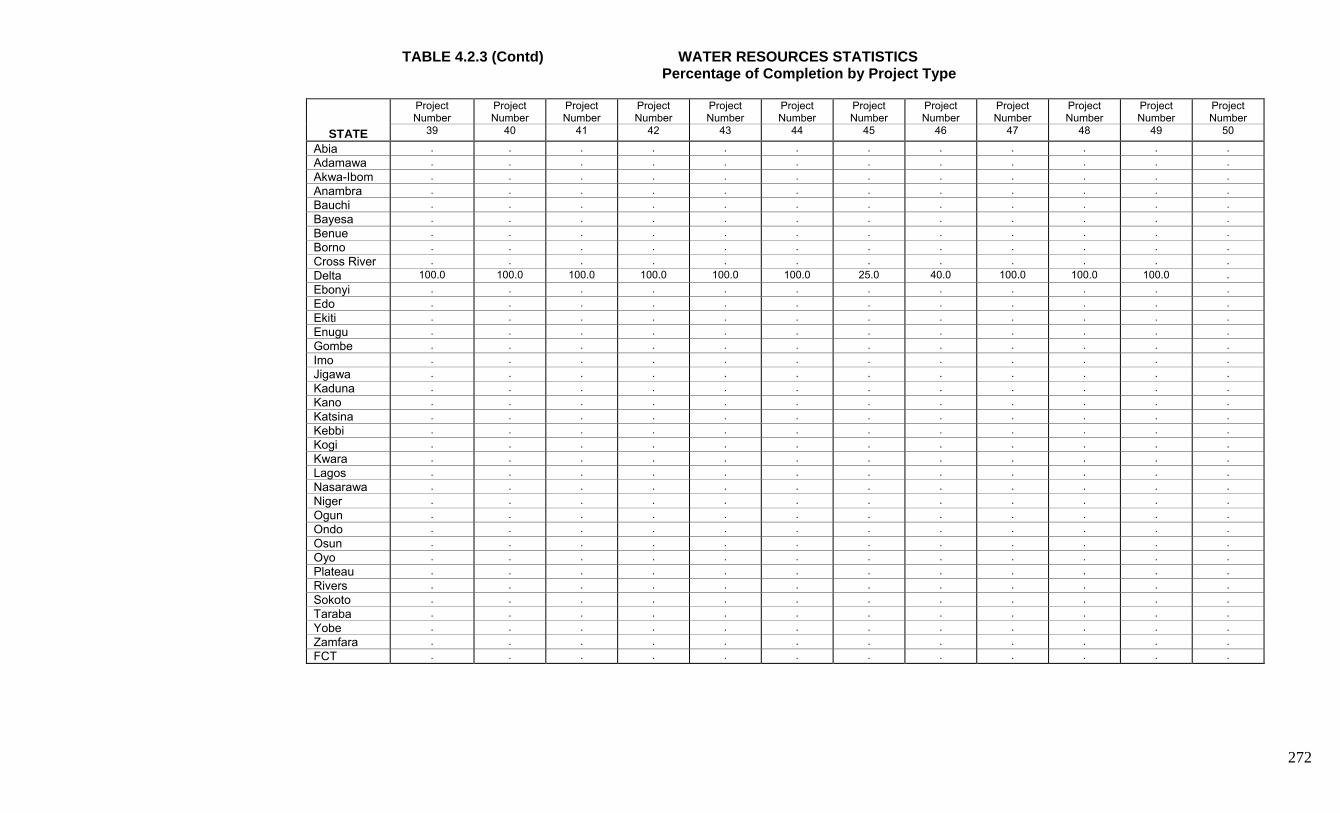
272
TABLE 4.2.3 (Contd) WATER RESOURCES STATISTICS Percentage of Completion by Project Type
Project Number
Project Number
Project Number
Project Number
Project Number
Project Number
Project Number
Project Number
Project Number
Project Number
Project Number
Project Number
STATE 39 40 41 42 43 44 45 46 47 48 49 50
Abia . . . . . . . . . . . . Adamawa . . . . . . . . . . . . Akwa-Ibom . . . . . . . . . . . . Anambra . . . . . . . . . . . . Bauchi . . . . . . . . . . . . Bayesa . . . . . . . . . . . . Benue . . . . . . . . . . . . Borno . . . . . . . . . . . . Cross River . . . . . . . . . . . . Delta 100.0 100.0 100.0 100.0 100.0 100.0 25.0 40.0 100.0 100.0 100.0 . Ebonyi . . . . . . . . . . . . Edo . . . . . . . . . . . . Ekiti . . . . . . . . . . . . Enugu . . . . . . . . . . . . Gombe . . . . . . . . . . . . Imo . . . . . . . . . . . . Jigawa . . . . . . . . . . . . Kaduna . . . . . . . . . . . . Kano . . . . . . . . . . . . Katsina . . . . . . . . . . . . Kebbi . . . . . . . . . . . . Kogi . . . . . . . . . . . . Kwara . . . . . . . . . . . . Lagos . . . . . . . . . . . . Nasarawa . . . . . . . . . . . . Niger . . . . . . . . . . . . Ogun . . . . . . . . . . . . Ondo . . . . . . . . . . . . Osun . . . . . . . . . . . . Oyo . . . . . . . . . . . . Plateau . . . . . . . . . . . . Rivers . . . . . . . . . . . . Sokoto . . . . . . . . . . . . Taraba . . . . . . . . . . . . Yobe . . . . . . . . . . . . Zamfara . . . . . . . . . . . . FCT . . . . . . . . . . . .
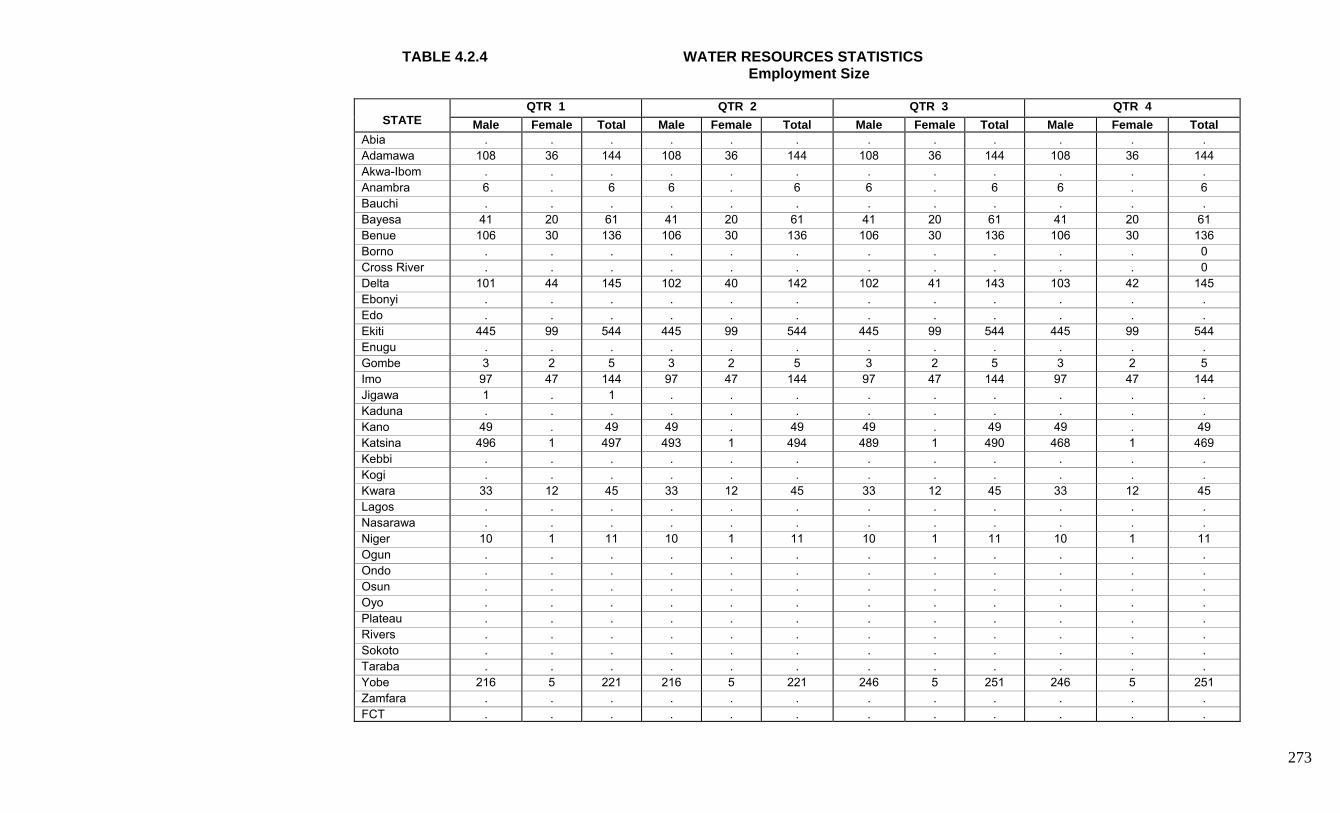
273
TABLE 4.2.4 WATER RESOURCES STATISTICS Employment Size
QTR 1 QTR 2 QTR 3 QTR 4
STATE Male Female Total Male Female Total Male Female Total Male Female Total Abia . . . . . . . . . . . . Adamawa 108 36 144 108 36 144 108 36 144 108 36 144 Akwa-Ibom . . . . . . . . . . . . Anambra 6 . 6 6 . 6 6 . 6 6 . 6 Bauchi . . . . . . . . . . . . Bayesa 41 20 61 41 20 61 41 20 61 41 20 61 Benue 106 30 136 106 30 136 106 30 136 106 30 136 Borno . . . . . . . . . . . 0 Cross River . . . . . . . . . . . 0 Delta 101 44 145 102 40 142 102 41 143 103 42 145 Ebonyi . . . . . . . . . . . . Edo . . . . . . . . . . . . Ekiti 445 99 544 445 99 544 445 99 544 445 99 544 Enugu . . . . . . . . . . . . Gombe 3 2 5 3 2 5 3 2 5 3 2 5 Imo 97 47 144 97 47 144 97 47 144 97 47 144 Jigawa 1 . 1 . . . . . . . . . Kaduna . . . . . . . . . . . . Kano 49 . 49 49 . 49 49 . 49 49 . 49 Katsina 496 1 497 493 1 494 489 1 490 468 1 469 Kebbi . . . . . . . . . . . . Kogi . . . . . . . . . . . . Kwara 33 12 45 33 12 45 33 12 45 33 12 45 Lagos . . . . . . . . . . . . Nasarawa . . . . . . . . . . . . Niger 10 1 11 10 1 11 10 1 11 10 1 11 Ogun . . . . . . . . . . . . Ondo . . . . . . . . . . . . Osun . . . . . . . . . . . . Oyo . . . . . . . . . . . . Plateau . . . . . . . . . . . . Rivers . . . . . . . . . . . . Sokoto . . . . . . . . . . . . Taraba . . . . . . . . . . . . Yobe 216 5 221 216 5 221 246 5 251 246 5 251 Zamfara . . . . . . . . . . . . FCT . . . . . . . . . . . .

274
TABLE 4.2.5 WATER RESOURCES STATISTICS Capital Expenditure by Type
STATE Machinery &
Equipment Transport Equipment Residential Building Non Residential
Building
Abia 67,125,000 . . 6,000,000 Adamawa . . . . Akwa-Ibom . . . . Anambra 4,000,000 4,000,000 1,000,000 0 Bauchi 36,880,938 . . . Bayesa . . . . Benue 1,800,000 . . 4,200,000 Borno . . . . Cross River . . . . Delta . . . . Ebonyi 339,220,000 . . . Edo . . . . Ekiti 117,607,304 9,769,504 399,000 . Enugu . . . . Gombe . . . . Imo 21,918,300 . . . Jigawa 87,000,000 . . . Kaduna . . . . Kano . . . . Katsina 101,323,022 . . . Kebbi 29,567,492 . . . Kogi . . . . Kwara . . . . Lagos . . . . Nasarawa . . . 7,500,000 Niger . . . . Ogun . . . . Ondo . . . . Osun . . . . Oyo . . . . Plateau 1,268,131 816,055 . . Rivers 299,851,645 . . . Sokoto . . . . Taraba 14,410,000 60,000 45,000 . Yobe 230,112,000 86,123,000 12,200,000 10,000,000 Zamfara . . . . FCT . . . . TOTAL 1,352,083,832 100,768,559 13,644,000 27,700,000
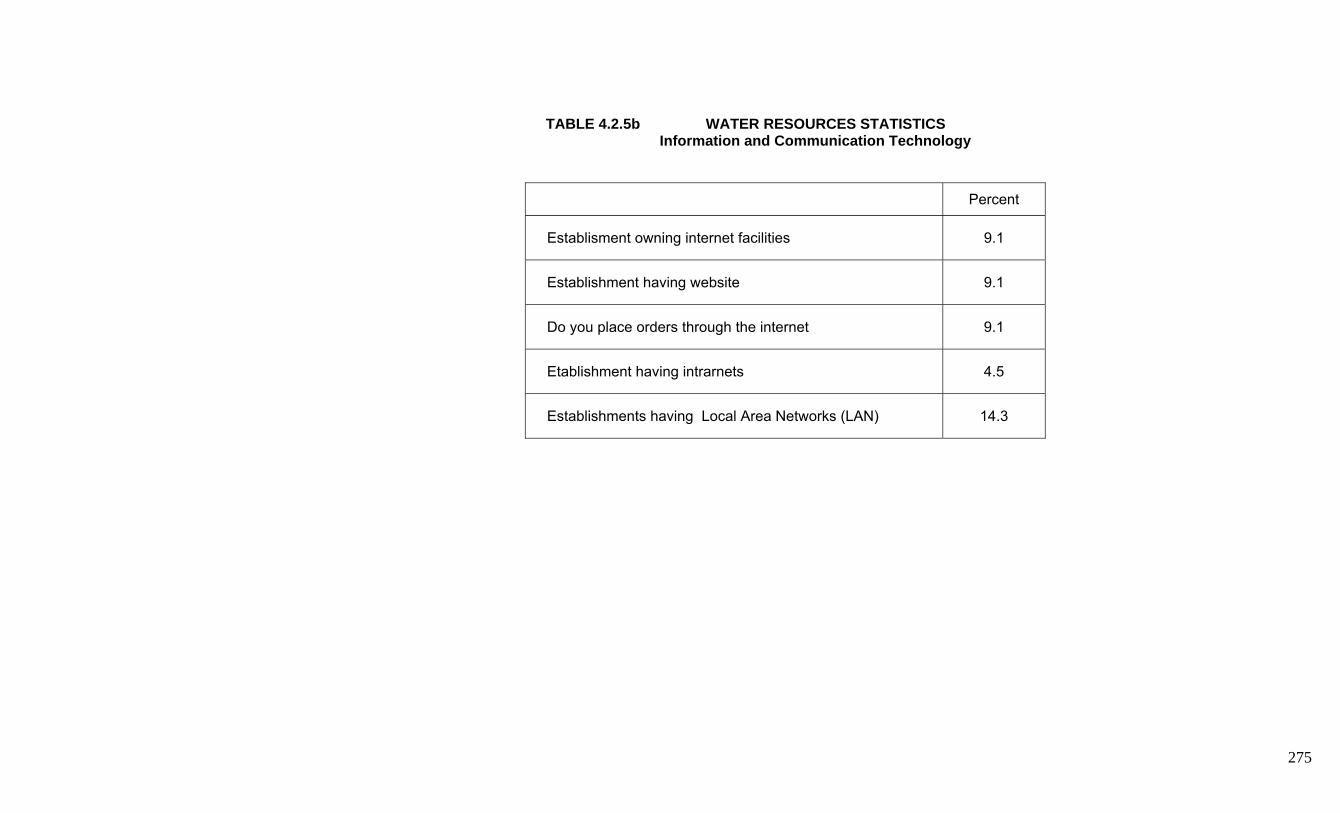
275
TABLE 4.2.5b WATER RESOURCES STATISTICS Information and Communication Technology
Percent
Establisment owning internet facilities 9.1
Establishment having website 9.1
Do you place orders through the internet 9.1
Etablishment having intrarnets 4.5
Establishments having Local Area Networks (LAN) 14.3

276
TABLE 4.2.6 WATER RESOURCES STATISTICS Information and Communication Technology
STATE
Number of
computers in your organisations
Number of employees with
access to internet facilities
Number of employee using
Personal Computers (PCs)
Investment on ICT from
domestics sources during the year (Naira)
Investment on ICT from foreign sources during the year (USD)
Amount spend
on ICT during the year (Naira)
Abia 10 . 3 . . . Adamawa 2 0 0 0 0 0 Akwa-Ibom . . . . . . Anambra 8 0 0 0 0 0 Bauchi 2 . 2 . . . Bayesa 6 . 2 . . . Benue 10 . . . . . Borno . . . . . . Cross River 2 . . . . . Delta 30 2 30 . . . Ebonyi 2 5 5 . . . Edo . . . . . . Ekiti 9 5 4 . . . Enugu . . . . . . Gombe 2 . . . . . Imo 3 . 5 . . . Jigawa 5 5 4 1,000,000 10,000 . Kaduna 16 0 2 . . . Kano . . . . . . Katsina 10 . 2 . . . Kebbi 3 . . . . . Kogi . . . . . . Kwara 5 . 5 . . . Lagos . . . . . . Nasarawa 5 . 2 . . . Niger 2 2 4 88,000 . 88,000 Ogun . . . . . . Ondo . . . . . . Osun . . . . . . Oyo . . . . . . Plateau 3 4 6,000 0 . 150,000 Rivers 10 . . . . . Sokoto . . . . . . Taraba . . . . . 150,000 Yobe 2 10 3 . . . Zamfara 2 . 2 . . . FCT . . . . . . TOTAL 149 33 6,075 1,088,000 10,000 388,000

277
TABLE 4.3.1 STATE GOVERNMENT FINANCES
INTERNALLY GENERATED REVENUE
Taxes Fines and Fees STATE IST 2ND 3RD 4TH 2,006 IST 2ND 3RD 4TH 2,006 Abia 334,981,371 322,380,752 344,141,604 412,311,582 1,413,815,309 49,951,993 34,300,675 32,521,145 27,945,668 144,719,481 Adamawa 207,565,720 224,806,041 202,100,778 825,127,840 11,241,094 185,585,297 144,532,677 1,237,448 342,596,516 Akwa-Ibom . . . . 0 . . . . 0 Anambra 102,000,000 136,000,000 100,000,000 252,000,000 590,000,000 150,000,000 227,000,000 229,000,000 229,000,000 835,000,000 Bauchi . . . 914,401,200 914,401,200 . . . 88,664,205 88,664,205 Bayesa . . . . 0 . . . . 0 Benue . . . 1,138 1,138 . . . 751,909,000 751,909,000 Borno 360,773,122 317,581,068 31,312,317 709,666,507 13,189,394 11,807,412 36,728,029 . 61,724,835 Cross River . . . . 0 . . . . 0 Delta . . . . 0 . . . . 0 Ebonyi 84,005,230 123,289,722 142,611,007 149,547,709 499,453,668 2,498,375 2,391,360 14,553,441 9,266,830 28,710,006 Edo . . . . 0 . . . . 0 Ekiti . . . 875,060,018 875,060,018 . . . 6,828,108 6,828,108 Enugu 228,426,368 332,840,419 802,684,488 807,782,356 2,171,733,631 40,303,028 41,266,993 75,044,392 60,268,156 216,882,569 Gombe . . . 777,918,851 777,918,851 . . . 15,605,051 15,605,051 Imo . . . . 0 . . . . 0 Jigawa . . . . 0 . . . . 0 Kaduna 599,481,741 692,295,901 710,793,598 759,815,662 2,762,386,902 111,861,331 58,556,887 36,441,977 33,619,085 240,479,280 Kano 492,195,036 555,330,974 582,954,481 616,292,339 2,246,772,830 40,742,781 55,837,359 40,983,117 103,457,915 241,021,172 Katsina 262,379,531 283,299,399 311,048,179 . 856,727,109 . . . . 0 Kebbi 212,356,668 202,541,175 246,371,560 294,664,894 955,934,297 28,240,229 68,958,905 10,479,922 19,509,351 127,188,407 Kogi . . . . 0 . . . . 0 Kwara . . . . 0 . . . . 0 Lagos . . . 488,300,000 488,300,000 . . . 632,000,000 632,000,000 Nasarawa 28,208,746 61,846,869 71,608,316 63,851,420 225,515,351 . . . . 0 Niger 257,490,707 298,542,441 306,958,175 306,186,663 1,169,177,986 325,280,548 26,685,329 12,743,507 28,717,473 393,426,857 Ogun 508,997,546 697,771,822 620,468,932 748,961,615 2,576,199,915 5,097,923 69,901,729 62,157,642 75,531,158 212,688,452 Ondo 376,809,194 513,901,898 378,671,093 354,765,536 1,624,147,721 4,248,255 34,288,229 49,101,911 109,895,813 197,534,208 Osun 449,238,255 449,238,255 449,238,255 471,128,141 1,818,842,906 134,504,516 134,504,516 134,504,516 385,592,135 789,105,683 Oyo 828,314,095 102,258,632 959,963,501 889,598,600 2,780,134,828 105,894,788 112,222,858 86,852,427 117,401,421 422,371,494 Plateau 338,684 338,684 338,684 338,684 1,354,736 17,158,887 17,156,887 17,156,887 17,156,887 68,629,548 Rivers 479,132,989 521,876,417 556,034,878 585,766,154 2,142,810,438 61,986,934 49,837,960 60,456,649 46,244,925 218,526,468 Sokoto 47,238,871 58,632,253 123,219,215 350,632,338 579,722,677 11,341,862 48,393,812 25,068,415 22,740,709 107,544,798 Taraba 112,500,000 112,500,000 113,625,000 114,761,250 453,386,250 115,522,231 115,522,231 116,677,454 117,844,228 465,566,144 Yobe . . . . 0 . . . . 0 Zamfara . . . . 0 . . . . 0 FCT . . . . 0 . . . . 0 TOTAL 5,955,523,455 5,990,032,401 7,076,849,324 10,436,186,928 29,458,592,108 1,229,064,169 1,294,218,439 1,185,004,108 2,900,435,566 6,608,722,282

278
TABLE 4.3.1 (Contd) STATE GOVERNMENT FINANCES INTERNALLY GENERATED REVENUE
Licenses Earnings and Sales by Govt. Debts
STATE IST 2ND 3RD 4TH 2,006 IST 2ND 3RD 4TH 2,006 Abia 13,766,118 12,805,040 12,606,728 17,300,315 56,478,201 285,800 4,614,370 322,365 258,165 5,480,700Adamawa 3,657,380 11,682,291 14,073,722 5,509,775 34,923,168 4,640,876 4,085,300 3,844,985 238,733,715 251,304,876Akwa-Ibom . . . . 0 . . . . 0Anambra 19,000,000 15,000,000 20,000,000 20,000,000 74,000,000 1,000,000 21,000,000 1,000,000 3,000,000 26,000,000Bauchi . . . 30,868,450 30,868,450 . . . 266,351,491 266,351,491Bayesa . . . . 0 . . . . 0Benue . . . 16,578,000 16,578,000 . . . 131,631,000 131,631,000Borno 588,700 388,200 698,450 . 1,675,350 17,366,030 16,481,588 8,799,675 . 42,647,293Cross River . . . . 0 . . . . 0Delta . . . . 0 . . . . 0Ebonyi 4,307,351 3,602,100 3,284,893 3,059,643 14,253,987 1,900,580 868,113 13,019,833 13,939,362 29,727,888Edo . . . . 0 . . . . 0Ekiti . . . 19,933,675 19,933,675 . . . . 0Enugu 14,145,948 14,492,878 13,618 16,537,057 45,189,501 144,920 1,094,931 441,331 783,467 2,464,649Gombe . . . 764,300 764,300 . . . 9,022,354 9,022,354Imo . . . . 0 . . . . 0Jigawa . . . . 0 . . . . 0Kaduna 30,502,185 28,197,486 32,298,014 30,460,807 121,458,492 2,430,985 17,859,790 87,897,605 23,497,285 131,685,665Kano 24,857,510 310,017,980 32,117,550 30,952,875 397,945,915 5,210,407 7,388,560 5,550,241 62,731,130 80,880,338Katsina 5,967,590 5,836,164 9,511,244 . 21,314,998 . . . . 0Kebbi 1,460,834 884,660 577,020 22,665,123 25,587,637 10,443,120 24,956,733 346,175,769 117,960,120 499,535,742Kogi . . . . 0 . . . . 0Kwara . . . . 0 . . . . 0Lagos . . . 84,000,000 84,000,000 . . . 109,800,000 109,800,000Nasarawa 59,796,609 6,239,450 4,382,976 14,512,475 84,931,510 . . . . 0Niger 861,900 2,686,450 10,833,895 8,576,160 22,958,405 . . . 4,473,351 4,473,351Ogun 12,262,268 16,813,778 14,951,059 18,047,268 62,074,373 147,147,182 201,765,346 179,412,703 216,567,214 744,892,445Ondo 17,177,150 13,598,299 11,915,179 12,588,421 55,279,049 15,891,950 66,437,934 63,314,041 54,824,975 200,468,900Osun 27,485,764 27,485,764 27,485,764 25,636,814 108,094,106 55,183,537 55,183,537 55,183,537 45,487,454 211,038,065Oyo 43,957,900 52,801,048 54,650,041 64,654,271 216,063,260 8,189,016 33,494,264 48,144,378 50,839,091 140,666,749Plateau 16,378,187 16,378,187 16,378,187 16,378,187 65,512,748 4,518,668 4,518,668 4,518,668 4,518,668 18,074,672Rivers 30,543,241 31,050,040 29,080,972 27,134,904 117,809,157 12,220,649 887,948 31,983,819 936,355 46,028,771Sokoto . . . . 0 . . 57,003,500 282,460,598 339,464,098Taraba 400,000 4,000,000 404,000,011 4,080,400 412,480,411 118,244,019 118,244,019 9,426,459 120,620,724 366,535,221Yobe . . . . 0 . . . . 0Zamfara . . . . 0 . . . . 0FCT . . . . 0 . . . . 0TOTAL 327,116,635 573,959,815 698,859,323 490,238,920 2,090,174,693 404,817,739 578,881,101 916,038,909 1,758,436,519 3,658,174,268

279
TABLE 4.3.1 (Contd) STATE GOVERNMENT FINANCES
INTERNALLY GENERATED REVENUE
Rent on Govt. properties Interests, repayments and dividends STATE IST 2ND 3RD 4TH 2,006 IST 2ND 3RD 4TH 2,006
Abia . . . . 0 . . . . 0 Adamawa 130,720 4,246,280 56,201,277 134,276 60,712,553 22,547 571,920 144,040 . 738,507 Akwa-Ibom . . . . 0 . . . . 0 Anambra 7,000,000 4,000,000 1,000,000 5,000,000 17,000,000 10,000,000 68,000,000 132,000,000 226,000,000 436,000,000 Bauchi . . . 5,650,631 5,650,631 . . . 502,909,994 502,909,994 Bayesa . . . . 0 . . . . 0 Benue . . . 27,521,000 27,521,000 . . . 13,637,000 13,637,000 Borno 849,632 237,477 13,815,979 . 14,903,088 3,787,570 3,787,570 3,787,570 . 11,362,710 Cross River . . . . 0 . . . . 0 Delta . . . . 0 . . . . 0 Ebonyi 3,126,191 9,202,149 7,765,075 8,302,198 28,395,613 7,512,870 1,492,115 10,205,385 12,641,262 31,851,632 Edo . . . . 0 . . . . 0 Ekiti . . . . 0 . . . . 0 Enugu 9,217,576 21,250,899 40,659,615 14,062,426 85,190,516 13,223,137 838,623 . 19,948,573 34,010,333 Gombe . . . 6,394,889 6,394,889 . . . 59,211,688 59,211,688 Imo . . . . 0 . . . . 0 Jigawa . . . . 0 . . . . 0 Kaduna 28,533,134 23,499,558 13,245,318 25,317,863 90,595,873 302,335,910 208,893,732 175,248,156 247,618,167 934,095,965 Kano 58,583,551 1,412,450 48,126,097 27,373,065 135,495,163 83,920,190 131,519,359 156,056,433 134,838,250 506,334,232 Katsina 1,016,758 470,088 3,692,221 . 5,179,067 6,691,811 12,689,083 11,181,559 . 30,562,453 Kebbi 9,199,936 11,697,817 4,441,148 3,576,154 28,915,055 . 65,999,999 23,480,660 . 89,480,659 Kogi . . . . 0 . . . . 0 Kwara . . . . 0 . . . . 0 Lagos . . . 170,000,000 170,000,000 . . . 536,000,000 536,000,000 Nasarawa . . . . 0 . . . . 0 Niger 70,776,821 4,018,712 5,048,644 2,802,716 82,646,893 . . . . 0 Ogun 4,200,961 5,760,276 5,122,122 6,182,860 21,266,219 7,266,528 10,119,404 8,998,322 10,861,782 37,246,036 Ondo 61,227,039 3,241,839 32,180,425 163,487,779 260,137,082 36,502,281 65,296,744 58,636,569 317,500 160,753,094 Osun 24,828,236 24,828,236 24,828,236 33,455,706 107,940,414 7,161,284 7,161,285 7,161,284 3,745,457 25,229,310 Oyo 4,138,854 11,501,476 8,912,774 12,580,386 37,133,490 436,224 13,836,787 35,677,308 55,894,842 105,845,161 Plateau 12,611,775 12,611,775 12,611,775 12,611,775 50,447,100 . . . . 0 Rivers 3,700,962 3,700,962 3,700,962 3,700,962 14,803,848 11,144,263 5,260,511 46,500,592 125,574,973 188,480,339 Sokoto 8,436,542 38,390,912 29,819,312 36,951,280 113,598,046 4,617,059 87,675,251 51,187,963 9,631,946 153,112,219 Taraba 3,750,000 3,750,000 3,787,500 3,825,375 15,112,875 43,558,894 43,558,894 43,994,482 44,434,427 175,546,697 Yobe . . . . 0 . . . . 0 Zamfara . . . . 0 . . . . 0 FCT . . . . 0 . . . . 0 TOTAL 311,328,688 183,820,906 314,958,480 568,931,341 1,379,039,415 538,180,568 726,701,277 764,260,323 2,003,265,861 4,032,408,029

280
TABLE 4.3.1 (Contd) STATE GOVERNMENT FINANCES
INTERNALLY GENERATED REVENUE
Reimbursement Miscellaneous STATE IST 2ND 3RD 4TH 2,006 IST 2ND 3RD 4TH 2,006 Abia . . . . 0 . . . 0 0 Adamawa . . . . 0 1,356,642 1,372,080 2,907,569 1,052,840 6,689,131 Akwa-Ibom . . . . 0 . . . . 0 Anambra . . 18,000,000 410,000,000 428,000,000 . 258,000,000 126,000,000 0 384,000,000 Bauchi . . . . 0 . . . 0 0 Bayesa . . . . 0 . . . . 0 Benue . . . . 0 . . . 6,017,000 6,017,000 Borno . . . . 0 131,145,615 13,159,615 95,601,821 0 239,907,051 C/River . . . . 0 . . . . 0 Delta . . . . 0 . . . . 0 Ebonyi . . . . 0 30,025,189 40,217,319 5,354,663 7,536,122 83,133,293 Edo . . . . 0 . . . . 0 Ekiti . . . . 0 . . . 30,284,885 30,284,885 Enugu . . 71,000 . 71,000 . . 103,975 18,750 122,725 Gombe . . . . 0 . . . 248,617,350 248,617,350 Imo . . . . 0 . . . . 0 Jigawa . . . . 0 . . . . 0 Kaduna 191,500,000 . . . 191,500,000 260,627,233 262,435,737 261,402,484 281,149,293 1,065,614,747 Kano 847,220 476,241 6,708,000 121,340,600 129,372,061 424,677,738 439,013,598 466,466,818 355,717,752 1,685,875,906 Katsina . . . . 0 . . . 0 0 Kebbi 40,056,041 900,000 1,600,000 19,775,895 62,331,936 . . 9,162,240 280,890 9,443,130 Kogi . . . . 0 . . . . 0 Kwara . . . . 0 . . . . 0 Lagos . . . 113,000,000 113,000,000 . . . 603,100,000 603,100,000 Nasarawa . . . . 0 5,083,500 10,613,300 8,224,200 4,794,000 28,715,000 Niger . . . . 0 395,396 4,269,162 6,231,144 3,323,715 14,219,417 Ogun . . . . 0 404,541,212 554,699,018 493,246,498 594,891,421 2,047,378,149 Ondo . . . . 0 . . . 0 0 Osun 490,535,754 . . . 490,535,754 69,814,122 69,814,122 69,814,122 27,312,531 236,754,897 Oyo . . . . 0 840,000 . . 0 840,000 Plateau . . . . 0 979,267 979,267 979,267 979,267 3,917,068 Rivers . . . . 0 78,837,747 240,224,669 78,649,006 207,916,098 605,627,520 Sokoto . . . . 0 . . . 0 0 Taraba 150,000,000 150,000,000 151,500 153,015,000 453,166,500 750,000 750,000 757,500 765,075 3,022,575 Yobe . . . . 0 . . . 0 0 Zamfara . . . . 0 . . . . 0 FCT . . . . 0 . . . . 0 TOTAL 872,939,015 151,376,241 26,530,500 817,131,495 1,867,977,251 1,409,073,661 1,895,547,887 1,624,901,307 2,373,756,989 7,303,279,844

281
TABLE 4.4.1 COOPERATIVE SOCIETY TYPE AND MEMBERSHIP OF COOPERATIVE SOCIETIES
FISHERY LIVESTOCK CREDIT AND THRIFT MARKETING STATE Registered Unegistered Membership Registered Unegistered Membership Registered Unegistered Membership
Abia 5 165 325 100 7,952 Adamawa 4 . 60 140 . 1,450 3 . 70 Akwa-Ibom 500 3,780 500 3,696 Anambra 231 2,772 210 2,520 442 1 11,036 Bauchi . . . . . . . . . Bayesa 46 . 460 22 . 220 18 . 180 Benue 42 3 2,000 34 15 5,000 Borno . 1,892 . 30 10 1,885,456 C/River 1,010 16 45 1,200 72 155 5,200 Delta 22 . 3,100 . 3,020 . 160,552 Ebonyi 6 1,060 26 635 12 566 Edo . . . . . . . . . Ekiti 10 3 250 5,000 125 300,250 Enugu 155 30 1,550 145 35 1,450 Gombe 29 0 320 142 0 4,129 216 0 25,192 Imo . . . Jigawa 192 1 6,104 1,198 3 30,740 1,280 8 29,000 Kaduna 14 8 210 10 4 150 15 5 225 Kano 8 . 372 7 . 271 567 . 12,623 Katsina . . . . . . . . . Kebbi . . . . . . . . . Kogi 1,800 . 6,060 6,060 . 8,136 16,201 . 19,538 Kwara 15 . 7,000 . 7 . 5,000 Lagos . . . . . . . . . Nasarawa 250 . 11,000 150 . 8,600 100 . 8,000 Niger . . 35 . 350 Ogun 424 3 427 5,924 4 5,928 Ondo 39 13 9,852 3,010 1,001 4,011 716 121 837 Osun . . . . . . . . . Oyo . . 8,390 . 335,600 Plateau 7 394 Rivers 2,595 . 44,115 1,645 . 19,740 1,251 . 12,510 Sokoto . . . . . . . . . Taraba 150 90 5,000 15 1,100 Yobe 4 0 134 30 0 626 22 0 470 Zamfara 120 . 1,200 1,020 . 9,900 270 . 1,500 FCT . . . . . . . . . TOTAL 6,496 118 108,093 14,373 1,086 98,218 45,195 579 2,834,485

282
TABLE 4.4.1 (Contd) COOPERATIVE SOCIETY TYPE AND MEMBERSHIP OF COOPERATIVE SOCIETIES
FISHERY LIVESTOCK CREDIT AND THRIFT MARKETING STATE Registered Unegistered Membership Registered Unegistered Membership Registered Unegistered Membership
Abia 5 165 325 100 7,952 Adamawa 4 . 60 140 . 1,450 3 . 70 Akwa-Ibom 500 3,780 500 3,696 Anambra 231 2,772 210 2,520 442 1 11,036 Bauchi . . . . . . . . . Bayesa 46 . 460 22 . 220 18 . 180 Benue 42 3 2,000 34 15 5,000 Borno . 1,892 . 30 10 1,885,456 C/River 1,010 16 45 1,200 72 155 5,200 Delta 22 . 3,100 . 3,020 . 160,552 Ebonyi 6 1,060 26 635 12 566 Edo . . . . . . . . . Ekiti 10 3 250 5,000 125 300,250 Enugu 155 30 1,550 145 35 1,450 Gombe 29 0 320 142 0 4,129 216 0 25,192 Imo . . . Jigawa 192 1 6,104 1,198 3 30,740 1,280 8 29,000 Kaduna 14 8 210 10 4 150 15 5 225 Kano 8 . 372 7 . 271 567 . 12,623 Katsina . . . . . . . . . Kebbi . . . . . . . . . Kogi 1,800 . 6,060 6,060 . 8,136 16,201 . 19,538 Kwara 15 . 7,000 . 7 . 5,000 Lagos . . . . . . . . . Nasarawa 250 . 11,000 150 . 8,600 100 . 8,000 Niger . . 35 . 350 Ogun 424 3 427 5,924 4 5,928 Ondo 39 13 9,852 3,010 1,001 4,011 716 121 837 Osun . . . . . . . . . Oyo . . 8,390 . 335,600 Plateau 7 394 Rivers 2,595 . 44,115 1,645 . 19,740 1,251 . 12,510 Sokoto . . . . . . . . . Taraba 150 90 5,000 15 1,100 Yobe 4 0 134 30 0 626 22 0 470 Zamfara 120 . 1,200 1,020 . 9,900 270 . 1,500 FCT . . . . . . . . . TOTAL 6,496 118 108,093 14,373 1,086 98,218 45,195 579 2,834,485
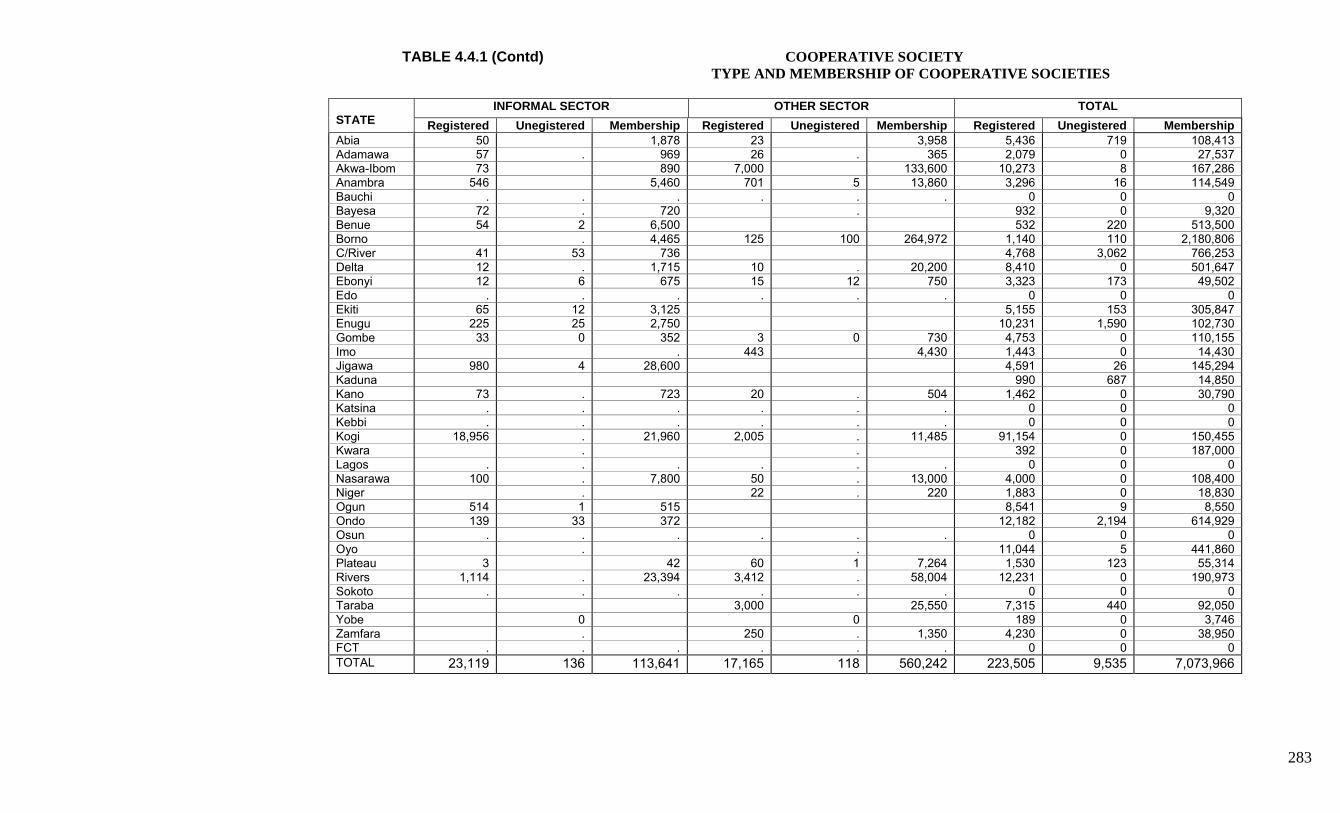
283
TABLE 4.4.1 (Contd) COOPERATIVE SOCIETY TYPE AND MEMBERSHIP OF COOPERATIVE SOCIETIES
INFORMAL SECTOR OTHER SECTOR TOTAL STATE Registered Unegistered Membership Registered Unegistered Membership Registered Unegistered Membership Abia 50 1,878 23 3,958 5,436 719 108,413 Adamawa 57 . 969 26 . 365 2,079 0 27,537 Akwa-Ibom 73 890 7,000 133,600 10,273 8 167,286 Anambra 546 5,460 701 5 13,860 3,296 16 114,549 Bauchi . . . . . . 0 0 0 Bayesa 72 . 720 . 932 0 9,320 Benue 54 2 6,500 532 220 513,500 Borno . 4,465 125 100 264,972 1,140 110 2,180,806 C/River 41 53 736 4,768 3,062 766,253 Delta 12 . 1,715 10 . 20,200 8,410 0 501,647 Ebonyi 12 6 675 15 12 750 3,323 173 49,502 Edo . . . . . . 0 0 0 Ekiti 65 12 3,125 5,155 153 305,847 Enugu 225 25 2,750 10,231 1,590 102,730 Gombe 33 0 352 3 0 730 4,753 0 110,155 Imo . 443 4,430 1,443 0 14,430 Jigawa 980 4 28,600 4,591 26 145,294 Kaduna 990 687 14,850 Kano 73 . 723 20 . 504 1,462 0 30,790 Katsina . . . . . . 0 0 0 Kebbi . . . . . . 0 0 0 Kogi 18,956 . 21,960 2,005 . 11,485 91,154 0 150,455 Kwara . . 392 0 187,000 Lagos . . . . . . 0 0 0 Nasarawa 100 . 7,800 50 . 13,000 4,000 0 108,400 Niger . 22 . 220 1,883 0 18,830 Ogun 514 1 515 8,541 9 8,550 Ondo 139 33 372 12,182 2,194 614,929 Osun . . . . . . 0 0 0 Oyo . . 11,044 5 441,860 Plateau 3 42 60 1 7,264 1,530 123 55,314 Rivers 1,114 . 23,394 3,412 . 58,004 12,231 0 190,973 Sokoto . . . . . . 0 0 0 Taraba 3,000 25,550 7,315 440 92,050 Yobe 0 0 189 0 3,746 Zamfara . 250 . 1,350 4,230 0 38,950 FCT . . . . . . 0 0 0 TOTAL 23,119 136 113,641 17,165 118 560,242 223,505 9,535 7,073,966
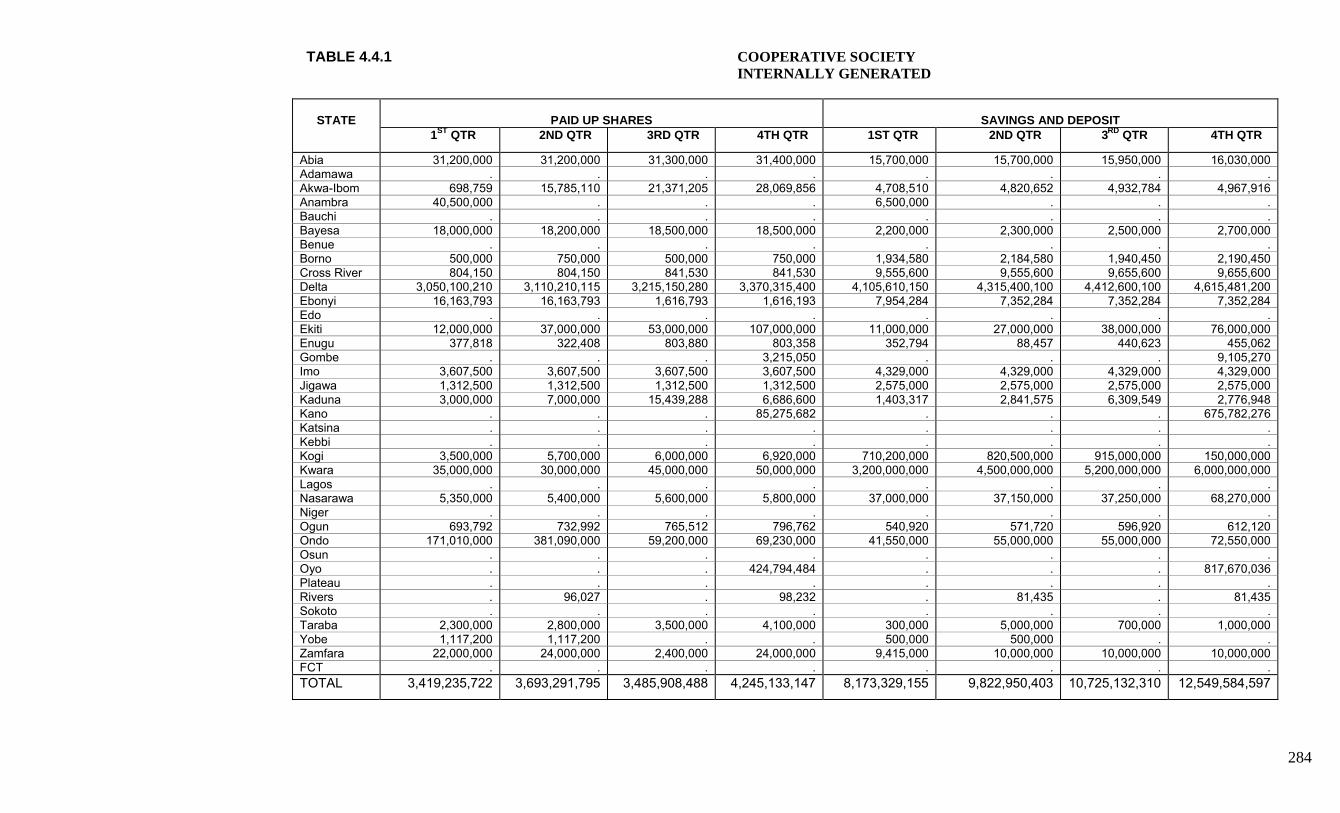
284
TABLE 4.4.1 COOPERATIVE SOCIETY INTERNALLY GENERATED
PAID UP SHARES
SAVINGS AND DEPOSIT
STATE
1ST QTR 2ND QTR 3RD QTR 4TH QTR 1ST QTR 2ND QTR 3RD QTR 4TH QTR
Abia 31,200,000 31,200,000 31,300,000 31,400,000 15,700,000 15,700,000 15,950,000 16,030,000 Adamawa . . . . . . . . Akwa-Ibom 698,759 15,785,110 21,371,205 28,069,856 4,708,510 4,820,652 4,932,784 4,967,916 Anambra 40,500,000 . . . 6,500,000 . . . Bauchi . . . . . . . . Bayesa 18,000,000 18,200,000 18,500,000 18,500,000 2,200,000 2,300,000 2,500,000 2,700,000 Benue . . . . . . . . Borno 500,000 750,000 500,000 750,000 1,934,580 2,184,580 1,940,450 2,190,450 Cross River 804,150 804,150 841,530 841,530 9,555,600 9,555,600 9,655,600 9,655,600 Delta 3,050,100,210 3,110,210,115 3,215,150,280 3,370,315,400 4,105,610,150 4,315,400,100 4,412,600,100 4,615,481,200 Ebonyi 16,163,793 16,163,793 1,616,793 1,616,193 7,954,284 7,352,284 7,352,284 7,352,284 Edo . . . . . . . . Ekiti 12,000,000 37,000,000 53,000,000 107,000,000 11,000,000 27,000,000 38,000,000 76,000,000 Enugu 377,818 322,408 803,880 803,358 352,794 88,457 440,623 455,062 Gombe . . . 3,215,050 . . . 9,105,270 Imo 3,607,500 3,607,500 3,607,500 3,607,500 4,329,000 4,329,000 4,329,000 4,329,000 Jigawa 1,312,500 1,312,500 1,312,500 1,312,500 2,575,000 2,575,000 2,575,000 2,575,000 Kaduna 3,000,000 7,000,000 15,439,288 6,686,600 1,403,317 2,841,575 6,309,549 2,776,948 Kano . . . 85,275,682 . . . 675,782,276 Katsina . . . . . . . . Kebbi . . . . . . . . Kogi 3,500,000 5,700,000 6,000,000 6,920,000 710,200,000 820,500,000 915,000,000 150,000,000 Kwara 35,000,000 30,000,000 45,000,000 50,000,000 3,200,000,000 4,500,000,000 5,200,000,000 6,000,000,000 Lagos . . . . . . . . Nasarawa 5,350,000 5,400,000 5,600,000 5,800,000 37,000,000 37,150,000 37,250,000 68,270,000 Niger . . . . . . . . Ogun 693,792 732,992 765,512 796,762 540,920 571,720 596,920 612,120 Ondo 171,010,000 381,090,000 59,200,000 69,230,000 41,550,000 55,000,000 55,000,000 72,550,000 Osun . . . . . . . . Oyo . . . 424,794,484 . . . 817,670,036 Plateau . . . . . . . . Rivers . 96,027 . 98,232 . 81,435 . 81,435 Sokoto . . . . . . . . Taraba 2,300,000 2,800,000 3,500,000 4,100,000 300,000 5,000,000 700,000 1,000,000 Yobe 1,117,200 1,117,200 . . 500,000 500,000 . . Zamfara 22,000,000 24,000,000 2,400,000 24,000,000 9,415,000 10,000,000 10,000,000 10,000,000 FCT . . . . . . . . TOTAL 3,419,235,722 3,693,291,795 3,485,908,488 4,245,133,147 8,173,329,155 9,822,950,403 10,725,132,310 12,549,584,597

285
TABLE 4.4.1 COOPERATIVE SOCIETY INTERNALLY GENERATED
RESERVES
TOTAL INTERNALLY GENERATED
STATE
1ST QTR 2ND QTR 3RD QTR 4TH QTR 1ST QTR 2ND QTR 3RD QTR 4TH QTR
Abia 5,000,000 5,100,000 5,120,000 5,180,000 51,900,000 52,000,000 52,370,000 52,610,000 Adamawa . . . . 0 0 0 0 Akwa-Ibom . . . . 5,407,269 20,605,762 26,303,989 33,037,772 Anambra 4,828,296 . . . 51,828,296 0 0 0 Bauchi . . . . 0 0 0 0 Bayesa . . . . 20,200,000 20,500,000 21,000,000 21,200,000 Benue . . . . 0 0 0 0 Borno 1,416,280 15,517,280 1,416,280 1,551,280 3,850,860 18,451,860 3,856,730 4,491,730 Cross River 2,171,300 2,171,300 2,271,300 2,271,300 12,531,050 12,531,050 12,768,430 12,768,430 Delta 201,400,370 237,310,172 266,451,318 315,110,275 7,357,110,730 7,662,920,387 7,894,201,698 8,300,906,875 Ebonyi 9,954,200 9,954,200 9,954,200 9,954,200 34,072,277 33,470,277 18,923,277 18,922,677 Edo . . . . 0 0 0 0 Ekiti . 67,000,000 . . 23,000,000 131,000,000 91,000,000 183,000,000 Enugu 176,173 218,962 48,015 48,525 906,785 629,827 1,292,518 1,306,945 Gombe . . . 2,001,000 0 0 0 14,321,320 Imo . . . . 7,936,500 7,936,500 7,936,500 7,936,500 Jigawa 293,750 293,750 293,750 293,750 4,181,250 4,181,250 4,181,250 4,181,250 Kaduna 31,041,611 15,111,867 311,110 2,248,151 35,444,928 24,953,442 22,059,947 11,711,699 Kano . . . . 0 0 0 761,057,958 Katsina . . . . 0 0 0 0 Kebbi . . . . 0 0 0 0 Kogi 10,200,000 200,000,000 60,000,000 80,000,000 723,900,000 1,026,200,000 981,000,000 236,920,000 Kwara . . . . 3,235,000,000 4,530,000,000 5,245,000,000 6,050,000,000 Lagos . . . . 0 0 0 0 Nasarawa 3,550,000 3,550,000 3,560,000 4,750,000 45,900,000 46,100,000 46,410,000 78,820,000 Niger . . . . 0 0 0 0 Ogun 147,862 151,857 155,057 157,557 1,382,574 1,456,569 1,517,489 1,566,439 Ondo 6,500,000 8,500,000 95,000,000 10,500,000 219,060,000 444,590,000 209,200,000 152,280,000 Osun . . . . 0 0 0 0 Oyo . . . 55,739,043 0 0 0 1,298,203,563 Plateau . . . . 0 0 0 0 Rivers . 58,715 . 97,073 0 236,177 0 276,740 Sokoto . . . . 0 0 0 0 Taraba 200,000 220,000 300,000 650,000 2,800,000 8,020,000 4,500,000 5,750,000 Yobe . . . . 1,617,200 1,617,200 0 0 Zamfara 4,000,000 6,000,000 6,000,000 6,000,000 35,415,000 40,000,000 18,400,000 40,000,000 FCT . . . . 0 0 0 0 TOTAL 280,879,842 571,158,103 450,881,030 496,552,154 11,873,444,719 14,087,400,301 14,661,921,828 17,291,269,898
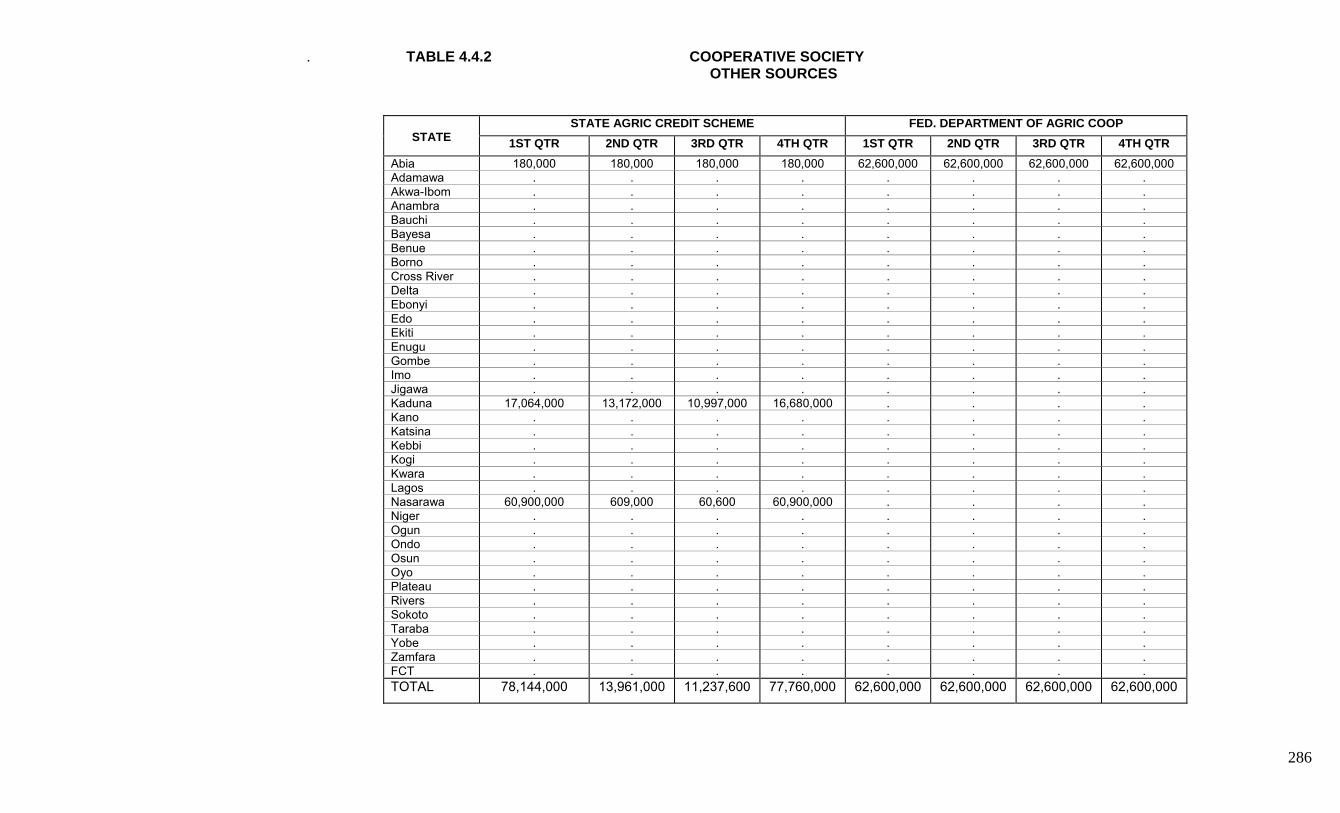
286
. TABLE 4.4.2 COOPERATIVE SOCIETY OTHER SOURCES
STATE AGRIC CREDIT SCHEME FED. DEPARTMENT OF AGRIC COOP
STATE 1ST QTR 2ND QTR 3RD QTR 4TH QTR 1ST QTR 2ND QTR 3RD QTR 4TH QTR Abia 180,000 180,000 180,000 180,000 62,600,000 62,600,000 62,600,000 62,600,000 Adamawa . . . . . . . . Akwa-Ibom . . . . . . . . Anambra . . . . . . . . Bauchi . . . . . . . . Bayesa . . . . . . . . Benue . . . . . . . . Borno . . . . . . . . Cross River . . . . . . . . Delta . . . . . . . . Ebonyi . . . . . . . . Edo . . . . . . . . Ekiti . . . . . . . . Enugu . . . . . . . . Gombe . . . . . . . . Imo . . . . . . . . Jigawa . . . . . . . . Kaduna 17,064,000 13,172,000 10,997,000 16,680,000 . . . . Kano . . . . . . . . Katsina . . . . . . . . Kebbi . . . . . . . . Kogi . . . . . . . . Kwara . . . . . . . . Lagos . . . . . . . . Nasarawa 60,900,000 609,000 60,600 60,900,000 . . . . Niger . . . . . . . . Ogun . . . . . . . . Ondo . . . . . . . . Osun . . . . . . . . Oyo . . . . . . . . Plateau . . . . . . . . Rivers . . . . . . . . Sokoto . . . . . . . . Taraba . . . . . . . . Yobe . . . . . . . . Zamfara . . . . . . . . FCT . . . . . . . . TOTAL 78,144,000 13,961,000 11,237,600 77,760,000 62,600,000 62,600,000 62,600,000 62,600,000

287
TABLE 4.4.2 (Contd) COOPERATIVE SOCIETY OTHER SOURCES
NACRDB STATE COOP BANK/FINANCE AGENCIES STATE 1ST QTR 2ND QTR 3RD QTR 4TH QTR 1ST QTR 2ND QTR 3RD QTR 4TH QTR
Abia 1,740,000 1,740,000 1,740,000 1,740,000 2,000,000 2,000,000 2,000,000 2,000,000 Adamawa . . . . . . . . Akwa-Ibom . . . . . . . . Anambra 800,000 . . . . . . . Bauchi . . . . . . . . Bayesa . . . . 300,000 500,000 700,000 . Benue . . . . . . . . Borno . . . . . . . . Cross River . . . . . . . . Delta . . . . 45,110,210 51,600,215 52,400,500 61,537,634 Ebonyi . . . . . . . . Edo . . . . . . . . Ekiti . . . . . . . . Enugu . . . . . . . . Gombe . . . 4,800,000 . . . 355,500,000 Imo . . . . . . . . Jigawa . . . . . . . . Kaduna . . . . . . . . Kano . . . . . . . 1,000,000 Katsina . . . . . . . . Kebbi . . . . . . . . Kogi . . . . . . . . Kwara . . . . 70,000,000 80,000,000 90,000,000 120,000,000 Lagos . . . . . . . . Nasarawa 60,000,000 60,000,000 60,000,000 60,000,000 . . . . Niger . . . . . . . . Ogun . . . . 7,550 7,640 7,732 7,817 Ondo 6,000,000 2,100,000 . . . 7,400,000 . . Osun . . . . . . . . Oyo . . . . . . . . Plateau . . . . . . . . Rivers . . . . . . . . Sokoto . . . . . . . . Taraba 600,000 750,000 800,000 1,000,000 . . . . Yobe 3,580,000 3,580,000 . . . . . . Zamfara 5,000,000 7,000,000 7,000,000 7,000,000 . . . . FCT . . . . . . . . TOTAL 77,720,000 75,170,000 69,540,000 74,540,000 117,417,760 141,507,855 145,108,232 540,045,451

288
TABLE 4.4.2 (Contd) COOPERATIVE SOCIETY OTHER SOURCES
DEPOSIT MONEY BANKS TOTAL STATE 1ST QTR 2ND QTR 3RD QTR 4TH QTR 1ST QTR 2ND QTR 3RD QTR 4TH QTR
Abia . . . . 66,520,000 66,520,000 66,520,000 66,520,000 Adamawa . . . . 0 0 0 0 Akwa-Ibom . . . . 0 0 0 0 Anambra . . . . 800,000 0 0 0 Bauchi . . . . 0 0 0 0 Bayesa . . . . 300,000 500,000 700,000 0 Benue . . . . 0 0 0 0 Borno . . . . 0 0 0 0 Cross River 2,750,300 2,750,300 2,875,300 2,875,300 2,750,300 2,750,300 2,875,300 2,875,300 Delta 29,500,100 30,200,115 31,200,750 32,615,000 74,610,310 81,800,330 83,601,250 94,152,634 Ebonyi . . . . 0 0 0 0 Edo . . . . 0 0 0 0 Ekiti . . . . 0 0 0 0 Enugu . . . . 0 0 0 0 Gombe . . . 3,500,000 0 0 0 363,800,000 Imo . . . . 0 0 0 0 Jigawa 700 700 700 700 700 700 700 700 Kaduna 10,020,824 15,632,113 12,789,450 16,111,125 27,084,824 28,804,113 23,786,450 32,791,125 Kano . . . . 0 0 0 1,000,000 Katsina . . . . 0 0 0 0 Kebbi . . . . 0 0 0 0 Kogi . . . . 0 0 0 0 Kwara . . . . 70,000,000 80,000,000 90,000,000 120,000,000 Lagos . . . . 0 0 0 0 Nasarawa . . . . 120,900,000 60,609,000 60,060,600 120,900,000 Niger . . . . 0 0 0 0 Ogun . . . . 7,550 7,640 7,732 7,817 Ondo . . . . 6,000,000 9,500,000 0 0 Osun . . . . 0 0 0 0 Oyo . . . . 0 0 0 0 Plateau . . . . 0 0 0 0 Rivers . . . . 0 0 0 0 Sokoto . . . . 0 0 0 0 Taraba . . . . 600,000 750,000 800,000 1,000,000 Yobe . . . . 3,580,000 3,580,000 0 0 Zamfara . . . . 5,000,000 7,000,000 7,000,000 7,000,000 FCT . . . . 0 0 0 0 TOTAL 42,271,924 48,583,228 46,866,200 55,102,125 378,153,684 341,822,083 335,352,032 810,047,576

289
TABLE 4.4.3 COOPERATIVE SOCIETY FUND UTILIZATION
RECURRENT EXPENDITURE CAPITAL EXPENDITURE
STATE 1ST QTR 2ND QTR 3RD QTR 4TH QTR 1ST QTR 2ND QTR 3RD QTR 4TH QTR Abia 13,780,000 13,780,000 13,780,000 13,780,000 39,100,000 39,100,000 39,100,000 39,100,000 Adamawa . . . . . . . . Akwa-Ibom 183,910,475 183,910,475 183,910,475 183,910,475 144,641,830 144,641,830 144,641,830 144,641,830 Anambra 18,000,000 . . . 25,000,000 . . . Bauchi . . . . . . . . Bayesa . . . . . . . . Benue . . . . . . . . Borno . . . . . . . . Cross River . . . . . . . . Delta 26,315,250 31,520,100 36,515,300 67,200,510 612,370,180 975,800,415 920,300,400 170,045,050 Ebonyi 8,361,069 8,361,069 8,361,069 8,361,069 7,139,829 7,139,829 7,139,829 7,139,829 Edo . . . . . . . . Ekiti 225,000 225,000 223,000 273,000 19,000,000 14,000,000 19,000,000 25,000,000 Enugu . . . . . . . . Gombe . . . 6,075,560 . . . 2,225,780 Imo . . . . . . . . Jigawa 312,500 312,500 312,500 312,500 1,825,000 1,825,000 1,825,000 1,825,000 Kaduna 890,902 2,640,039 22,387 30,111,428 6,947,498 50,000,000 30,000,000 953,000,143 Kano . . . 2,000,000 . . . . Katsina . . . . . . . . Kebbi . . . . . . . . Kogi . . . . . . . . Kwara . . . . . . . . Lagos . . . . . . . . Nasarawa 7,500,000 7,500,000 7,500,000 10,000,000 6,500,000 6,500,000 7,000,000 7,550,000 Niger . . . . . . . . Ogun 210,761 222,661 233,561 245,461 136,547 144,147 151,197 158,697 Ondo . . . . . . . . Osun . . . . . . . . Oyo . . . . . . . . Plateau . . . . . . . . Rivers . . . . . . . . Sokoto . . . . . . . . Taraba . . . . . . . . Yobe 1,400,000 1,400,000 . . 700,000 700,000 . . Zamfara . . . . . . . . FCT . . . . . . . . TOTAL 260,905,957 249,871,844 250,858,292 322,270,003 863,360,884 1,239,851,221 1,169,158,256 1,350,686,329

290
TABLE 4.4.3 (Contd) COOPERATIVE SOCIETY FUND UTILIZATION
CREDIT TO MEMBERS INPUT SUPPLIES STATE 1ST QTR 2ND QTR 3RD QTR 4TH QTR 1ST QTR 2ND QTR 3RD QTR 4TH QTR
Abia 40,100,000 4,500,000 4,500,000 4,500,000 4,100,000 4,100,000 4,100,000 4,100,000 Adamawa . . . . . . . . Akwa-Ibom . . . . . . . . Anambra 4,000,000 . . . . . . Bauchi . . . . . . . . Bayesa 11,700,000 12,800,000 13,000,000 13,500,000 . . . . Benue . . . . . . . . Borno . . 1,750,000 2,000,000 . . . . Cross River 25,180,250 25,180,250 25,305,250 25,305,250 . . . . Delta 611,521,520 652,030,011 671,040,020 701,263,011 . . . . Ebonyi 9,582,309 9,582,309 9,582,309 9,582,309 2,116,574 2,116,574 2,116,574 2,116,574 Edo . . . . . . . . Ekiti 65,000,000 70,000,000 85,000,000 100,000,000 . . . . Enugu 253,500 14,300 66,454 67,544 2,000 2,090 3,020 3,295 Gombe . . . 385,500,000 . . . 2,342,130 Imo 1,500,000 1,500,000 1,500,000 1,500,000 . . . . Jigawa 1,437,500 1,437,500 1,437,500 1,437,500 2,800,000 2,800,000 2,800,000 2,800,000 Kaduna 32,497,954 34,824,514 35,428,676 33,497,956 . . . . Kano . . . 12,647,370 . . . 212,000,000 Katsina . . . . . . . . Kebbi . . . . . . . . Kogi . . . . . . . . Kwara 7,000,000,000 8,000,000,000 9,000,000,000 12,000,000,000 . . . . Lagos . . . . . . . . Nasarawa 154,300,000 154,300,000 155,200,000 160,000,000 . . . . Niger . . . . . . . . Ogun 1,102,206 1,189,426 1,276,526 1,363,026 128,959 136,259 143,659 150,979 Ondo 100,000,000 . 203,000,000 . 260,000,000 . . . Osun . . . . . . . . Oyo . . . 129,820,356 . . . . Plateau . . . . . . . . Rivers . . . . . . . . Sokoto . . . . . . . . Taraba 600,000 750,000 800,000 1,000,000 . 160,000,000 . . Yobe 1,700,000 1,700,000 . . 100,369 100,369 . . Zamfara 27,000,000 31,000,000 31,000,000 31,000,000 . . . . FCT . . . . . . . . TOTAL 8,087,475,239 9,000,808,310 10,239,886,735 13,613,984,322 269,247,902 169,255,292 9,163,253 223,512,978

291
TABLE 4.4.4 COOPERATIVE SOCIETY
INFORMATION AND COMMUNICATION TECHNOLOGY
Percent
Establisment owning internet facilities 4.3
Establishment having website? 4.2
Do you place orders through the internet 4.2
Etablishment having intrarnets 4.2
Establishments having Local Area Networks (LAN) 4.2

292
TABLE 4.4.5
COOPERATIVE SOCIETY
INFORMATION AND COMMUNICATION TECHNOLOGY
STATE
Number of Computers in your Organisations
Number of Employees with access to Internet Facilities
Number of Employee using Personal Computers (PCs)
Amount spend on ICT during the year (Naira)
Abia 0 0 0 0 Adamawa 1 2 0 0 Akwa-Ibom 8 . 4 200,000 Anambra 1 0 0 0 Bauchi . . . . Bayesa 4 0 0 0 Benue 1 0 0 0 Borno 0 0 0 0 Cross River . . . 0 Delta 0 0 0 0 Ebonyi 0 0 0 0 Edo . . . . Ekiti 0 0 0 0 Enugu 0 0 0 0 Gombe 0 0 0 0 Imo 0 0 0 0 Jigawa . . 3 0 Kaduna 2 2 2 0 Kano 0 0 0 0 Katsina . . . . Kebbi . . . . Kogi . . . 0 Kwara 3 0 0 0 Lagos . . . . Nasarawa 5 0 0 0 Niger 0 0 0 0 Ogun 3 4 4 0 Ondo 0 0 0 0 Osun . . . . Oyo 0 0 0 0 Plateau 0 0 0 0 Rivers 1 0 0 0 Sokoto . . . . Taraba 0 0 0 0 Yobe 1 0 0 0 Zamfara 2 0 0 0 FCT . . . . TOTAL 32 8 13 200,000

293
TABLE 4.5.1 HOUSING STATISTICS APPLICATION AND APPROVAL FOR BUILDING (Private Individuals)
NUMBER OF APPLICATIONS 1ST QTR 2ND QTR 3RD QTR 4TH QTR TOTAL (2006)
STATE Male Female Male Female Male Female Male Female Male Female Total Abia . . . . . . . . 0 0 0 Adamawa 360 . 300 . 100 . 120 . 880 0 880 Akwa-Ibom . . . . . . . . 0 0 0 Anambra . . . . . . . . 0 0 0 Bauchi 44 7 78 5 30 3 20 2 172 17 189 Bayesa 16 4 16 1 11 4 15 5 58 14 72 Benue 156 20 205 40 224 36 140 20 725 116 841 Borno . . . . . . . . 0 0 0 Cross River 164 42 150 26 177 47 160 47 651 162 813 Delta . . . . . . . . 0 0 0 Ebonyi . . . . . . . . 0 0 0 Edo . . . . . . . . 0 0 0 Ekiti 116 48 116 49 144 65 87 38 463 200 663 Enugu 28 4 55 5 52 4 26 9 161 22 183 Gombe 35 10 73 16 81 5 86 12 275 43 318 Imo . . . . . . . . 0 0 0 Jigawa . . . . . . . . 0 0 0 Kaduna . . . . . . 381 . 381 0 381 Kano 950 44 112 71 137 67 638 90 1,837 272 2,109 Katsina . . . . . . . . 0 0 0 Kebbi . . . . . . . . 0 0 0 Kogi . . . . . . . . 0 0 0 Kwara 60 21 28 9 64 12 35 9 187 51 238 Lagos 56 12 22 36 16 11 13 34 107 93 200 Nasarawa 10 . 5 . 8 . 8 . 31 0 31 Niger 68 13 82 9 70 8 59 11 279 41 320 Ogun . . . . . . . . 0 0 0 Ondo . . . . . . . . 0 0 0 Osun 4 1 3 . 1 . 6 . 14 1 15 Oyo . . . . . . . . 0 0 0 Plateau . . . . . . . . 0 0 0 Rivers . . . . . . . . 0 0 0 Sokoto 30 20 . 10 . . 20 10 50 40 90 Taraba 104 4 107 5 95 3 80 6 386 18 404 Yobe . . . . . . . . 0 0 0 Zamfara 165 414 875 315 586 102 116 300 1,742 1,131 2,873 FCT . . . . . . . . 0 0 0 TOTAL 2,366 664 2,227 597 1,796 367 2,010 593 8,399 2,221 10,620

294
TABLE 4.5.1 (Contd) HOUSING STATISTICS APPLICATION AND APPROVAL FOR BUILDING (Private Individuals)
APPROVAL
NUMBER STARTED
1ST QTR 2ND QTR 3RD QTR 4TH QTR TOTAL (2006) 1ST QTR 2ND QTR 3RD QTR 4TH QTR TOTAL (2006)
STATE
M F M F M F M F M F Total M F M F M F M F M F Total Abia . . . . . . . . 0 0 0 . . . . . . . . 0 0 0 Adamawa 262 . 273 . 61 . 74 . 670 0 670 260 . 265 . 50 . 50 . 625 0 625 Akwa Ibom . . . . . . . . 0 0 0 . . . . . . . . 0 0 0 Anambra . . . . . . . . 0 0 0 . . . . . . . . 0 0 0 Bauchi 39 6 55 3 17 3 15 2 126 14 140 . . . . . . . . 0 0 0 Bayesa . . . . . . 1 . 1 0 1 16 4 16 1 11 4 15 5 58 14 72 Benue 32 4 45 2 41 3 23 6 141 15 156 . . . . . . . . 0 0 0 Borno . . . . . . . . 0 0 0 . . . . . . . . 0 0 0 C/River 118 38 96 26 125 25 125 33 464 122 586 . . . . . . . . 0 0 0 Delta . . . . . . . . 0 0 0 . . . . . . . . 0 0 0 Ebonyi . . . . . . . . 0 0 0 . . . . . . . . 0 0 0 Edo . . . . . . . . 0 0 0 . . . . . . . . 0 0 0 Ekiti 11 5 10 . 17 4 14 . 52 9 61 . . . . . . . . 0 0 0 Enugu 9 2 7 . 24 3 12 5 52 10 62 17 2 9 2 1 . 18 3 45 7 52 Gombe 40 2 50 4 46 8 42 5 178 19 197 40 2 50 4 46 8 42 5 178 19 197 Imo . . . . . . . . 0 0 0 . . . . . . . . 0 0 0 Jigawa . . . . . . . . 0 0 0 . . . . . . . . 0 0 0 Kaduna . . . . . . 54 . 54 0 54 . . . . . . . . 0 0 0 Kano . . . . 300 20 50 8 350 28 378 246 9 12 2 258 11 269 Katsina . . . . . . . . 0 0 0 . . . . . . . . 0 0 0 Kebbi . . . . . . . . 0 0 0 . . . . . . . . 0 0 0 Kogi . . . . . . . . 0 0 0 . . . . . . . . 0 0 0 Kwara 46 21 21 5 23 5 26 9 116 40 156 . . . . . . . . 0 0 0 Lagos 53 9 20 27 16 9 9 13 98 58 156 53 9 13 20 8 4 6 6 80 39 119 Nasarawa 1 . 3 . 3 . 7 . 14 0 14 . . . . . . . . 0 0 0 Niger 12 4 13 . 10 3 16 1 51 8 59 . . . . . . . . 0 0 0 Ogun . . . . . . . . 0 0 0 . . . . . . . . 0 0 0 Ondo . . . . . . . . 0 0 0 . . . . . . . . 0 0 0 Osun 3 . 2 . 1 . 5 . 11 0 11 . . . . . . . . 0 0 0 Oyo . . . . . . . . 0 0 0 . . . . . . . . 0 0 0 Plateau . . . . . . . . 0 0 0 . . . . . . . . 0 0 0 Rivers . . . . . . . . 0 0 0 . . . . . . . . 0 0 0 Sokoto . . . . . . . . 0 0 0 . . . . . . . . 0 0 0 Taraba 104 4 107 5 95 3 80 6 386 18 404 104 4 107 5 95 3 80 6 386 18 404 Yobe . . . . . . . . 0 0 0 . . . . . . . . 0 0 0 Zamfara 100 168 600 200 410 66 216 12 1,326 446 1,772 100 115 421 86 320 42 183 10 1,024 253 1,277 FCT . . . . . . . . 0 0 0 . . . . . . . . 0 0 0 TOTAL 830 263 1,302 272 1,189 152 769 100 4,090 787 4,877 590 136 881 118 777 70 406 37 2,654 361 3,015

295
TABLE 4.5.2 HOUSING STATISTICS APPLICATION AND APPROVAL FOR BUILDING (Corporate Bodies)
NUMBER OF APPLICATIONS APPROVAL NUMBER STARTED STATE 1ST
QTR 2ND
QTR 3RD QTR
4TH QTR
TOTAL 1ST QTR
2ND QTR
3RD QTR
4TH QTR
TOTAL 1ST QTR
2ND QTR
3RD QTR
4TH QTR
TOTAL
Abia . . . . 0 . . . . 0 . . . . 0 Adamawa 20 10 12 10 52 18 8 9 8 43 8 4 5 6 23 Akwa-Ibom . . . . 0 . . . . 0 . . . . 0 Anambra . . . . 0 . . . . 0 . . . . 0 Bauchi 1 2 . 1 4 1 2 . 1 4 . . . . 0 Bayesa 5 3 1 . 9 2 . . . 2 5 3 1 . 9 Benue 6 8 18 14 46 3 5 5 6 19 . . . . 0 Borno . . . . 0 . . . . 0 . . . . 0 Cross River . . . . 0 . . . . 0 . . . . 0 Delta . . . . 0 . . . . 0 . . . . 0 Ebonyi . . . . 0 . . . . 0 . . . . 0 Edo . . . . 0 . . . . 0 . . . . 0 Ekiti 2 1 2 . 5 1 . . . 1 1 . . . 1 Enugu . . . . 0 . . . . 0 . . . . 0 Gombe 11 18 21 6 56 . 4 7 1 12 1 4 7 1 13 Imo . . . . 0 . . . . 0 . . . . 0 Jigawa . . . . 0 . . . . 0 . . . . 0 Kaduna . . . 21 21 . . . 3 3 . . . . 0 Kano . . . . 0 . . . . 0 . . . . 0 Katsina . . . . 0 . . . . 0 . . . . 0 Kebbi . . . . 0 . . . . 0 . . . . 0 Kogi . . . . 0 . . . . 0 . . . . 0 Kwara 2 . . . 2 1 . . . 1 . . . . 0 Lagos . . . . 0 . . . . 0 . . . . 0 Nasarawa 2 5 2 4 13 . 4 2 4 10 . . . . 0 Niger 1 1 . 1 3 1 1 . . 2 . . . . 0 Ogun . . . . 0 . . . . 0 . . . . 0 Ondo . . . . 0 . . . . 0 . . . . 0 Osun 1 1 . 3 5 1 . 1 1 3 . . . . 0 Oyo . . . . 0 . . . . 0 . . . . 0 Plateau . . . . 0 . . . . 0 . . . . 0 Rivers . . . . 0 . . . . 0 . . . . 0 Sokoto . . . . 0 . . . . 0 . . . . 0 Taraba 3 1 3 1 8 3 1 3 1 8 3 1 3 1 8 Yobe . . . . 0 . . . . 0 . . . . 0 Zamfara 300 16 . . 316 10 5 . . 15 6 5 . . 11 FCT . . . . 0 . . . . 0 . . . . 0 TOTAL 354 66 59 61 540 41 30 27 25 123 24 17 16 8 65
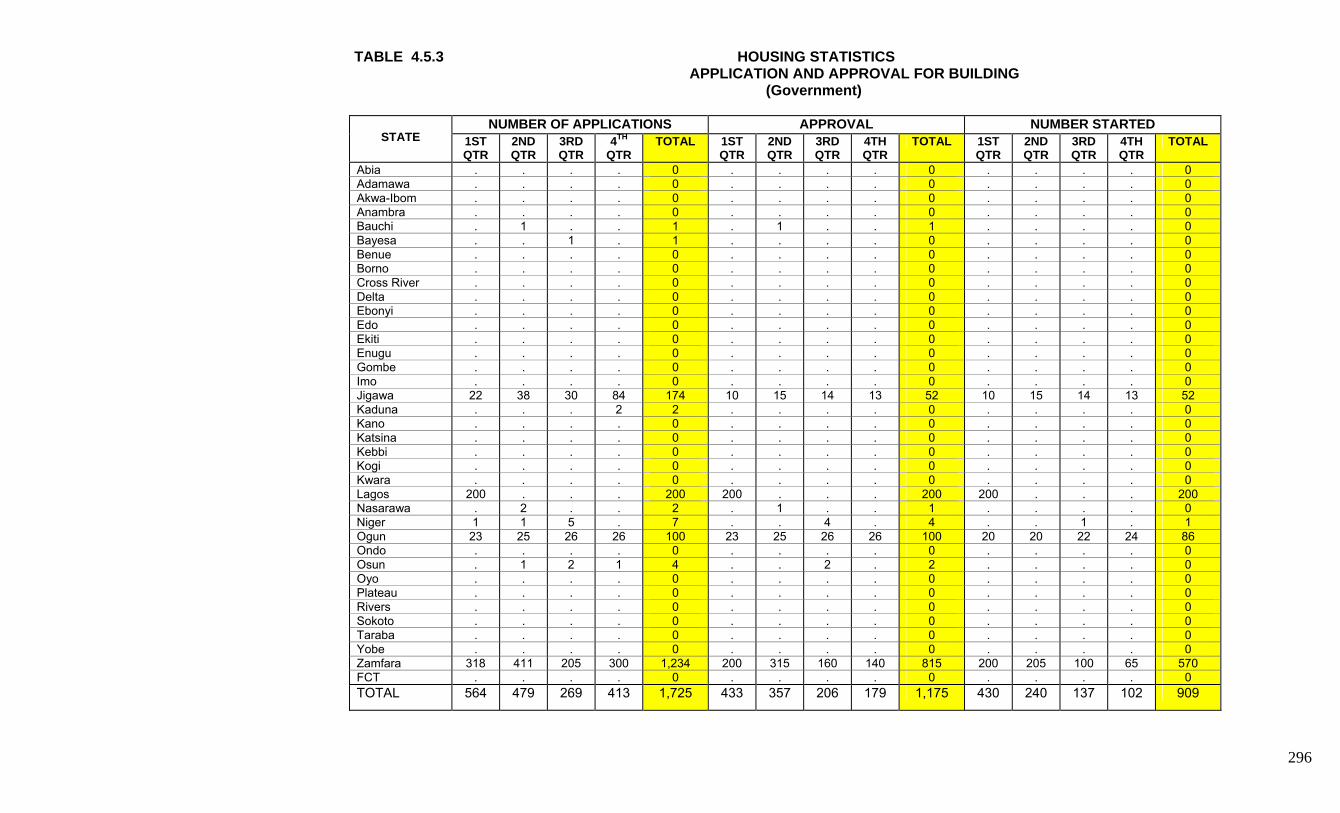
296
TABLE 4.5.3 HOUSING STATISTICS APPLICATION AND APPROVAL FOR BUILDING (Government)
NUMBER OF APPLICATIONS APPROVAL NUMBER STARTED STATE 1ST
QTR 2ND QTR
3RD QTR
4TH QTR
TOTAL 1ST QTR
2ND QTR
3RD QTR
4TH QTR
TOTAL 1ST QTR
2ND QTR
3RD QTR
4TH QTR
TOTAL
Abia . . . . 0 . . . . 0 . . . . 0 Adamawa . . . . 0 . . . . 0 . . . . 0 Akwa-Ibom . . . . 0 . . . . 0 . . . . 0 Anambra . . . . 0 . . . . 0 . . . . 0 Bauchi . 1 . . 1 . 1 . . 1 . . . . 0 Bayesa . . 1 . 1 . . . . 0 . . . . 0 Benue . . . . 0 . . . . 0 . . . . 0 Borno . . . . 0 . . . . 0 . . . . 0 Cross River . . . . 0 . . . . 0 . . . . 0 Delta . . . . 0 . . . . 0 . . . . 0 Ebonyi . . . . 0 . . . . 0 . . . . 0 Edo . . . . 0 . . . . 0 . . . . 0 Ekiti . . . . 0 . . . . 0 . . . . 0 Enugu . . . . 0 . . . . 0 . . . . 0 Gombe . . . . 0 . . . . 0 . . . . 0 Imo . . . . 0 . . . . 0 . . . . 0 Jigawa 22 38 30 84 174 10 15 14 13 52 10 15 14 13 52 Kaduna . . . 2 2 . . . . 0 . . . . 0 Kano . . . . 0 . . . . 0 . . . . 0 Katsina . . . . 0 . . . . 0 . . . . 0 Kebbi . . . . 0 . . . . 0 . . . . 0 Kogi . . . . 0 . . . . 0 . . . . 0 Kwara . . . . 0 . . . . 0 . . . . 0 Lagos 200 . . . 200 200 . . . 200 200 . . . 200 Nasarawa . 2 . . 2 . 1 . . 1 . . . . 0 Niger 1 1 5 . 7 . . 4 . 4 . . 1 . 1 Ogun 23 25 26 26 100 23 25 26 26 100 20 20 22 24 86 Ondo . . . . 0 . . . . 0 . . . . 0 Osun . 1 2 1 4 . . 2 . 2 . . . . 0 Oyo . . . . 0 . . . . 0 . . . . 0 Plateau . . . . 0 . . . . 0 . . . . 0 Rivers . . . . 0 . . . . 0 . . . . 0 Sokoto . . . . 0 . . . . 0 . . . . 0 Taraba . . . . 0 . . . . 0 . . . . 0 Yobe . . . . 0 . . . . 0 . . . . 0 Zamfara 318 411 205 300 1,234 200 315 160 140 815 200 205 100 65 570 FCT . . . . 0 . . . . 0 . . . . 0 TOTAL 564 479 269 413 1,725 433 357 206 179 1,175 430 240 137 102 909

297
TABLE 4.5.4 HOUSING STATISTICS APPLICATION AND APPROVAL FOR LAND ALLOCATION (NGO)
NUMBER OF APPLICATIONS APPROVAL NUMBER STARTED
STATE 1ST QTR
2ND QTR
3RD QTR
4TH QTR
TOTAL (2006)
1ST QTR
2ND QTR
3RD QTR
4TH QTR
TOTAL (2006)
1ST QTR
2ND QTR
3RD QTR
4TH QTR
TOTAL (2006)
Abia . . . . 0 . . . . 0 . . . . 0 Adamawa . . . . 0 . . . . 0 . . . . 0 Akwa-Ibom . . . . 0 . . . . 0 . . . . 0 Anambra . . . . 0 . . . . 0 . . . . 0 Bauchi . 3 1 . 4 . 3 1 . 4 . . . . 0 Bayesa . . . . 0 . . . . 0 . . 1 . 1 Benue . . . . 0 . . . . 0 . . . . 0 Borno . . . . 0 . . . . 0 . . . . 0 Cross River . . 1 . 1 . . 1 . 1 . . . . 0 Delta . . . . 0 . . . . 0 . . . . 0 Ebonyi . . . . 0 . . . . 0 . . . . 0 Edo . . . . 0 . . . . 0 . . . . 0 Ekiti 2 1 2 . 5 1 . . . 1 1 . . . 1 Enugu . . . . 0 . . . . 0 . . . . 0 Gombe . . . . 0 . . . . 0 . . . . 0 Imo . . . . 0 . . . . 0 . . . . 0 Jigawa . . . . 0 . . . . 0 . . . . 0 Kaduna . . . 17 17 . . . 2 2 . . . . 0 Kano . . . . 0 . . . . 0 . . . . 0 Katsina . . . . 0 . . . . 0 . . . . 0 Kebbi . . . . 0 . . . . 0 . . . . 0 Kogi . . . . 0 . . . . 0 . . . . 0 Kwara . . . . 0 . . . . 0 . . . . 0 Lagos . . . . 0 . . . . 0 . . . . 0 Nasarawa . . 1 . 1 . . . . 0 . . 1 . 1 Niger . . 1 . 1 . . . . 0 . . . . 0 Ogun 25 30 23 24 102 25 30 23 24 102 20 30 23 24 97 Ondo . . . . 0 . . . . 0 . . . . 0 Osun . . . . 0 . . . . 0 . . . . 0 Oyo . . . . 0 . . . . 0 . . . . 0 Plateau . . . . 0 . . . . 0 . . . . 0 Rivers . . . . 0 . . . . 0 . . . . 0 Sokoto . . . . 0 . . . . 0 . . . . 0 Taraba . . . . 0 . . . . 0 . . . . 0 Yobe . . . . 0 . . . . 0 . . . . 0 Zamfara 116 192 95 80 483 50 65 46 50 211 35 42 30 32 139 FCT . . . . 0 . . . . 0 . . . . 0 TOTAL 143 226 124 121 614 76 98 71 76 321 56 72 55 56 239
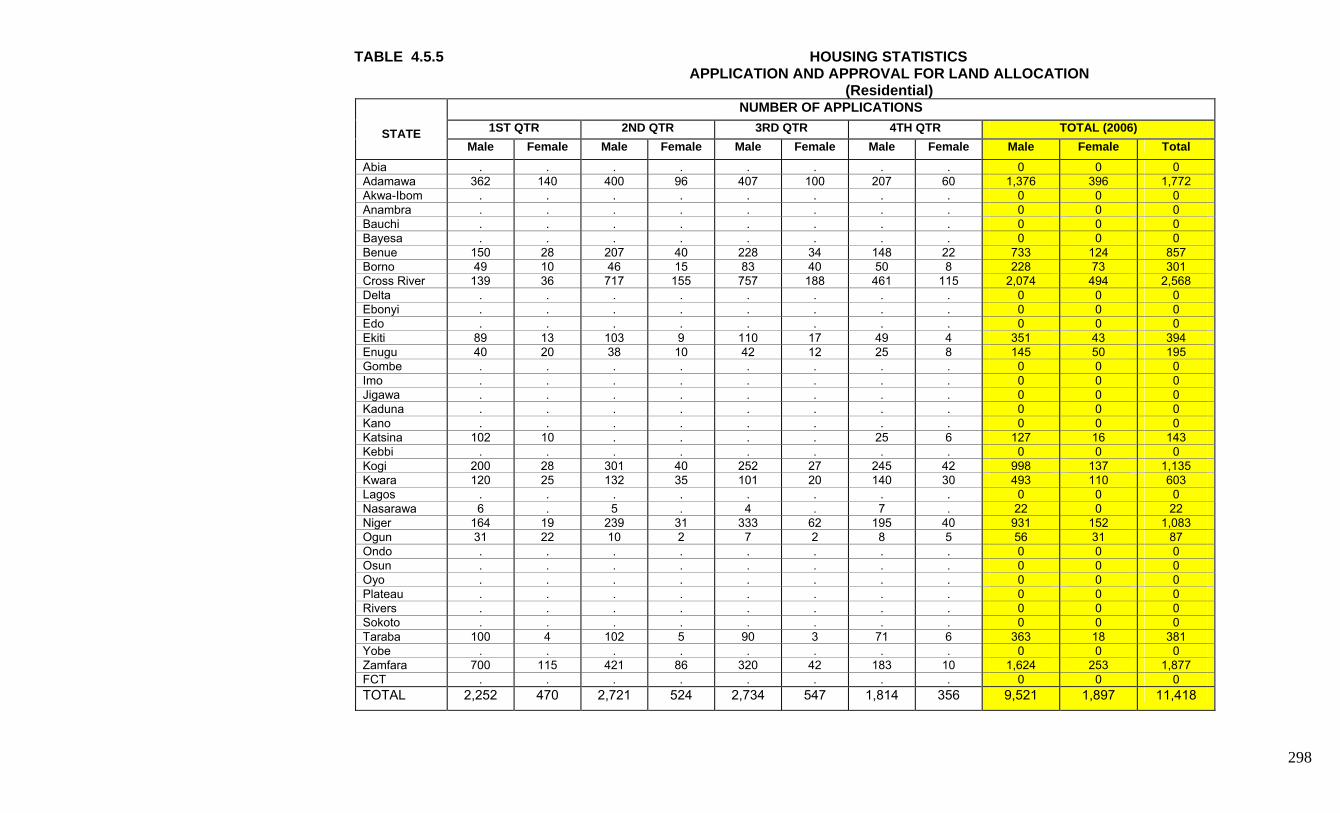
298
TABLE 4.5.5 HOUSING STATISTICS APPLICATION AND APPROVAL FOR LAND ALLOCATION (Residential)
NUMBER OF APPLICATIONS 1ST QTR 2ND QTR 3RD QTR 4TH QTR TOTAL (2006)
STATE Male Female Male Female Male Female Male Female Male Female Total
Abia . . . . . . . . 0 0 0 Adamawa 362 140 400 96 407 100 207 60 1,376 396 1,772 Akwa-Ibom . . . . . . . . 0 0 0 Anambra . . . . . . . . 0 0 0 Bauchi . . . . . . . . 0 0 0 Bayesa . . . . . . . . 0 0 0 Benue 150 28 207 40 228 34 148 22 733 124 857 Borno 49 10 46 15 83 40 50 8 228 73 301 Cross River 139 36 717 155 757 188 461 115 2,074 494 2,568 Delta . . . . . . . . 0 0 0 Ebonyi . . . . . . . . 0 0 0 Edo . . . . . . . . 0 0 0 Ekiti 89 13 103 9 110 17 49 4 351 43 394 Enugu 40 20 38 10 42 12 25 8 145 50 195 Gombe . . . . . . . . 0 0 0 Imo . . . . . . . . 0 0 0 Jigawa . . . . . . . . 0 0 0 Kaduna . . . . . . . . 0 0 0 Kano . . . . . . . . 0 0 0 Katsina 102 10 . . . . 25 6 127 16 143 Kebbi . . . . . . . . 0 0 0 Kogi 200 28 301 40 252 27 245 42 998 137 1,135 Kwara 120 25 132 35 101 20 140 30 493 110 603 Lagos . . . . . . . . 0 0 0 Nasarawa 6 . 5 . 4 . 7 . 22 0 22 Niger 164 19 239 31 333 62 195 40 931 152 1,083 Ogun 31 22 10 2 7 2 8 5 56 31 87 Ondo . . . . . . . . 0 0 0 Osun . . . . . . . . 0 0 0 Oyo . . . . . . . . 0 0 0 Plateau . . . . . . . . 0 0 0 Rivers . . . . . . . . 0 0 0 Sokoto . . . . . . . . 0 0 0 Taraba 100 4 102 5 90 3 71 6 363 18 381 Yobe . . . . . . . . 0 0 0 Zamfara 700 115 421 86 320 42 183 10 1,624 253 1,877 FCT . . . . . . . . 0 0 0 TOTAL 2,252 470 2,721 524 2,734 547 1,814 356 9,521 1,897 11,418
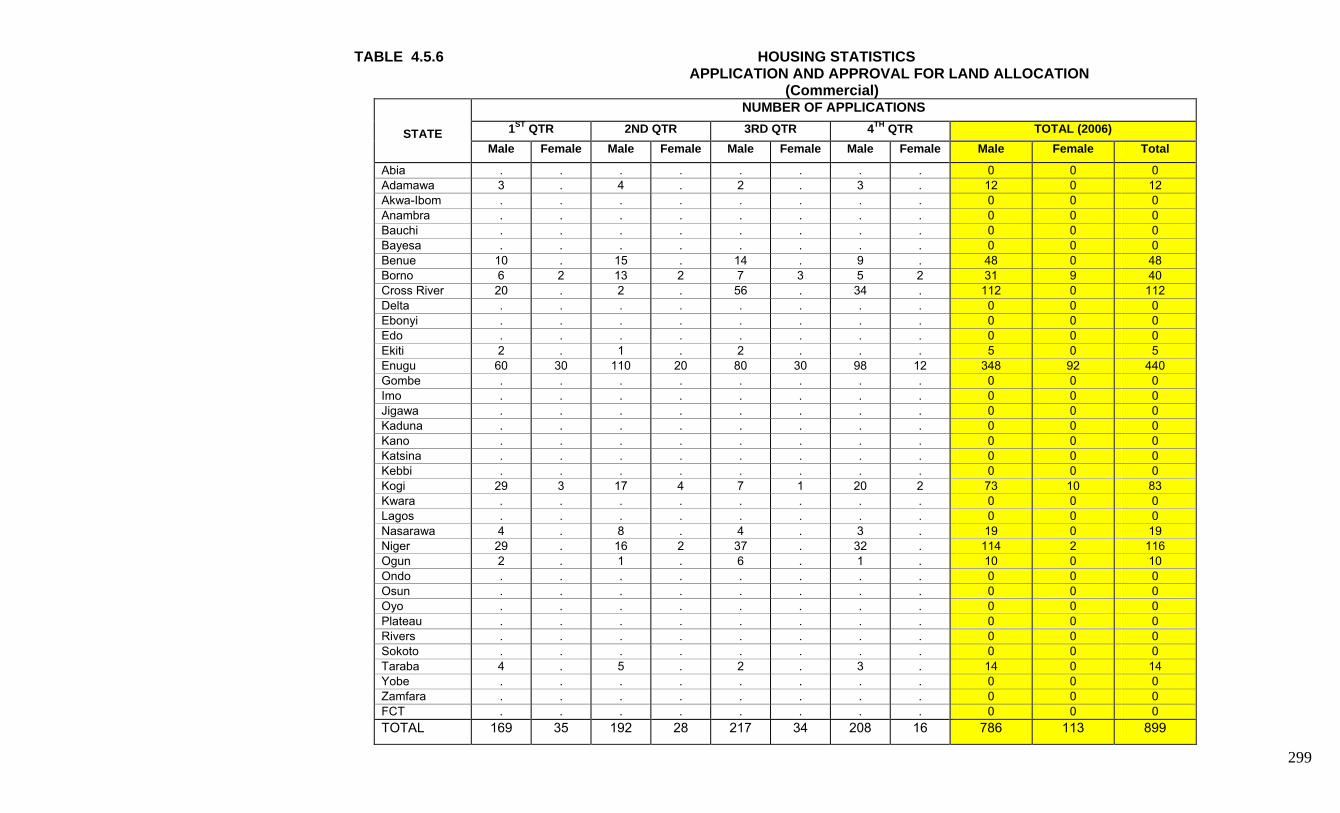
299
TABLE 4.5.6 HOUSING STATISTICS APPLICATION AND APPROVAL FOR LAND ALLOCATION (Commercial)
NUMBER OF APPLICATIONS 1ST QTR 2ND QTR 3RD QTR 4TH QTR TOTAL (2006)
STATE Male Female Male Female Male Female Male Female Male Female Total
Abia . . . . . . . . 0 0 0 Adamawa 3 . 4 . 2 . 3 . 12 0 12 Akwa-Ibom . . . . . . . . 0 0 0 Anambra . . . . . . . . 0 0 0 Bauchi . . . . . . . . 0 0 0 Bayesa . . . . . . . . 0 0 0 Benue 10 . 15 . 14 . 9 . 48 0 48 Borno 6 2 13 2 7 3 5 2 31 9 40 Cross River 20 . 2 . 56 . 34 . 112 0 112 Delta . . . . . . . . 0 0 0 Ebonyi . . . . . . . . 0 0 0 Edo . . . . . . . . 0 0 0 Ekiti 2 . 1 . 2 . . . 5 0 5 Enugu 60 30 110 20 80 30 98 12 348 92 440 Gombe . . . . . . . . 0 0 0 Imo . . . . . . . . 0 0 0 Jigawa . . . . . . . . 0 0 0 Kaduna . . . . . . . . 0 0 0 Kano . . . . . . . . 0 0 0 Katsina . . . . . . . . 0 0 0 Kebbi . . . . . . . . 0 0 0 Kogi 29 3 17 4 7 1 20 2 73 10 83 Kwara . . . . . . . . 0 0 0 Lagos . . . . . . . . 0 0 0 Nasarawa 4 . 8 . 4 . 3 . 19 0 19 Niger 29 . 16 2 37 . 32 . 114 2 116 Ogun 2 . 1 . 6 . 1 . 10 0 10 Ondo . . . . . . . . 0 0 0 Osun . . . . . . . . 0 0 0 Oyo . . . . . . . . 0 0 0 Plateau . . . . . . . . 0 0 0 Rivers . . . . . . . . 0 0 0 Sokoto . . . . . . . . 0 0 0 Taraba 4 . 5 . 2 . 3 . 14 0 14 Yobe . . . . . . . . 0 0 0 Zamfara . . . . . . . . 0 0 0 FCT . . . . . . . . 0 0 0 TOTAL 169 35 192 28 217 34 208 16 786 113 899

300
TABLE 4.5.6 (Contd) HOUSING STATISTICS APPLICATION AND APPROVAL FOR LAND ALLOCATION (Commercial)
APPROVAL 1ST QTR 2ND QTR 3RD QTR 4TH QTR TOTAL (2006)
STATE Male Female Male Female Male Female Male Female Male Female Total Abia . . . . . . . . 0 0 0 Adamawa . . . . . . 12 . 12 0 12 Akwa-Ibom . . . . . . . . 0 0 0 Anambra . . . . . . . . 0 0 0 Bauchi . . . . . . . . 0 0 0 Bayesa . . . . . . . . 0 0 0 Benue 4 . 6 . 5 . 5 . 20 0 20 Borno 11 2 9 4 12 5 10 1 42 12 54 Cross River 20 . 2 . 56 . 34 . 112 0 112 Delta . . . . . . . . 0 0 0 Ebonyi . . . . . . . . 0 0 0 Edo . . . . . . . . 0 0 0 Ekiti 1 . . . . . . . 1 0 1 Enugu 70 5 75 . 85 2 60 3 290 10 300 Gombe . . . . . . . . 0 0 0 Imo . . . . . . . . 0 0 0 Jigawa . . . . . . . . 0 0 0 Kaduna . . . . . . . . 0 0 0 Kano . . . . . . . . 0 0 0 Katsina . . . . . . . . 0 0 0 Kebbi . . . . . . . . 0 0 0 Kogi 11 1 7 2 4 1 9 1 31 5 36 Kwara . . . . . . . . 0 0 0 Lagos . . . . . . . . 0 0 0 Nasarawa . . 3 . 2 . 3 . 8 0 8 Niger 27 . 16 2 37 . 30 . 110 2 112 Ogun 2 . 1 . 6 . 1 . 10 0 10 Ondo . . . . . . . . 0 0 0 Osun . . . . . . . . 0 0 0 Oyo . . . . . . . . 0 0 0 Plateau . . . . . . . . 0 0 0 Rivers . . . . . . . . 0 0 0 Sokoto . . . . . . . . 0 0 0 Taraba 4 . 5 . 2 . 3 . 14 0 14 Yobe . . . . . . . . 0 0 0 Zamfara . . . . . . . . 0 0 0 FCT . . . . . . . . 0 0 0 TOTAL 150 8 124 8 209 8 167 5 650 29 679

301
TABLE 4.5.7 HOUSING STATISTICS APPLICATION AND APPROVAL FOR LAND ALLOCATION (Industrial)
NUMBER OF APPLICATIONS APPROVAL STATE
1ST QTR 2ND QTR 3RD QTR 4TH QTR TOTAL 1ST QTR 2ND QTR 3RD QTR 4TH QTR TOTAL Abia . . . . 0 . . . . 0 Adamawa 9 1 1 1 12 . . . . 0 Akwa-Ibom . . . . 0 . . . . 0 Anambra . . . . 0 . . . . 0 Bauchi . . . . 0 . . . . 0 Bayesa . . . . 0 . . . . 0 Benue . . 1 . 1 . . 1 . 1 Borno . . 1 . 1 2 . 1 2 5 Cross River 3 4 . . 7 3 4 . . 7 Delta . . . . 0 . . . . 0 Ebonyi . . . . 0 . . . . 0 Edo . . . . 0 . . . . 0 Ekiti 2 . 2 . 4 2 1 1 . 4 Enugu 20 30 15 20 85 5 5 5 5 20 Gombe . . . . 0 . . . . 0 Imo . . . . 0 . . . . 0 Jigawa . . . . 0 . . . . 0 Kaduna . . . . 0 . . . . 0 Kano . . . . 0 . . . . 0 Katsina . . . . 0 . . . . 0 Kebbi . . . . 0 . . . . 0 Kogi 4 2 2 3 11 1 1 1 2 5 Kwara . . . . 0 . . . . 0 Lagos . . . . 0 . . . . 0 Nasarawa . . . 1 1 . . . 1 1 Niger . 1 2 . 3 . 1 2 . 3 Ogun . . . . 0 . . . . 0 Ondo . . . . 0 . . . . 0 Osun . . . . 0 . . . . 0 Oyo . . . . 0 . . . . 0 Plateau . . . . 0 . . . . 0 Rivers . . . . 0 . . . . 0 Sokoto . . . . 0 . . . . 0 Taraba 1 1 . . 2 1 1 . . 2 Yobe . . . . 0 . . . . 0 Zamfara 16 10 9 6 41 6 4 5 4 19 FCT . . . . 0 . . . . 0 TOTAL 55 49 33 31 168 20 17 16 14 67

302
TABLE 4.5.7 (Contd) HOUSING STATISTICS APPLICATION AND APPROVAL FOR LAND ALLOCATION (Other Purposes)
NUMBER OF APPLICATIONS 1ST QTR 2ND QTR 3RD QTR 4TH QTR TOTAL (2006)
STATE Male Female Male Female Male Female Male Female Male Female Total
Abia . . . . . . . . 0 0 0 Adamawa 6 . 18 . 19 . 8 . 51 0 51 Akwa-Ibom . . . . . . . . 0 0 0 Anambra . . . . . . . . 0 0 0 Bauchi . . . . . . . . 0 0 0 Bayesa . . . . . . . . 0 0 0 Benue . . . . . . . . 0 0 0 Borno . . 2 . 2 1 2 1 6 2 8 Cross River 2 . . . . . . . 2 0 2 Delta . . . . . . . . 0 0 0 Ebonyi . . . . . . . . 0 0 0 Edo . . . . . . . . 0 0 0 Ekiti 116 48 116 49 144 65 87 38 463 200 663 Enugu . . . . . . . . 0 0 0 Gombe . . . . . . . . 0 0 0 Imo . . . . . . . . 0 0 0 Jigawa . . . . . . . . 0 0 0 Kaduna . . . . . . . . 0 0 0 Kano . . . . . . . . 0 0 0 Katsina . . . . . . . . 0 0 0 Kebbi . . . . . . . . 0 0 0 Kogi . . . . . . . . 0 0 0 Kwara . . . . . . . . 0 0 0 Lagos . . . . . . . . 0 0 0 Nasarawa 2 . 2 . 2 1 . . 6 1 7 Niger 10 2 8 1 10 3 6 2 34 8 42 Ogun . . . . . . . . 0 0 0 Ondo . . . . . . . . 0 0 0 Osun . . . . . . . . 0 0 0 Oyo . . . . . . . . 0 0 0 Plateau . . . . . . . . 0 0 0 Rivers . . . . . . . . 0 0 0 Sokoto . . . . . . . . 0 0 0 Taraba . . . . . . . . 0 0 0 Yobe . . . . . . . . 0 0 0 Zamfara . . . . . . . . 0 0 0 FCT . . . . . . . . 0 0 0 TOTAL 136 50 146 50 177 70 103 41 562 211 773

303
TABLE 4.5.7 (Contd) HOUSING STATISTICS APPLICATION AND APPROVAL FOR LAND ALLOCATION (Other Purposes)
APPROVAL 1ST QTR 2ND QTR 3RD QTR 4TH QTR TOTAL (2006)
STATE Male Female Male Female Male Female Male Female Male Female Total
Abia . . . . . . . . 0 0 0 Adamawa . . . . . . . . 0 0 0 Akwa-Ibom . . . . . . . . 0 0 0 Anambra . . . . . . . . 0 0 0 Bauchi . . . . . . . . 0 0 0 Bayesa . . . . . . . . 0 0 0 Benue . . . . . . . . 0 0 0 Borno 5 1 3 1 5 1 2 2 15 5 20 Cross River 2 . . . . . . . 2 0 2 Delta . . . . . . . . 0 0 0 Ebonyi . . . . . . . . 0 0 0 Edo . . . . . . . . 0 0 0 Ekiti 86 39 74 34 119 51 72 27 351 151 502 Enugu . . . . . . . . 0 0 0 Gombe . . . . . . . . 0 0 0 Imo . . . . . . . . 0 0 0 Jigawa . . . . . . . . 0 0 0 Kaduna . . . . . . . . 0 0 0 Kano . . . . . . . . 0 0 0 Katsina . . . . . . . . 0 0 0 Kebbi . . . . . . . . 0 0 0 Kogi . . . . . . . . 0 0 0 Kwara . . . . . . . . 0 0 0 Lagos . . . . . . . . 0 0 0 Nasarawa . . 3 . . . . . 3 0 3 Niger 10 2 8 1 10 3 6 2 34 8 42 Ogun . . . . . . . . 0 0 0 Ondo . . . . . . . . 0 0 0 Osun . . . . . . . . 0 0 0 Oyo . . . . . . . . 0 0 0 Plateau . . . . . . . . 0 0 0 Rivers . . . . . . . . 0 0 0 Sokoto . . . . . . . . 0 0 0 Taraba . . . . . . . . 0 0 0 Yobe . . . . . . . . 0 0 0 Zamfara . . . . . . . . 0 0 0 FCT . . . . . . . . 0 0 0 TOTAL 103 42 88 36 134 55 80 31 405 164 569

304
TABLE 4.5.8a HOUSING STATISTICS INFORMATION COMMUNICATION TECHNOLOGY
Percent
Establisment owning internet facilities 17.4
Establishment having website 13.6
Establishment receiving orders through the internet 9.1
Placement of orders through the internet 4.5
Etablishment having intrarnets 4.3
Establishments having Local Area Networks (LAN) 4.3

305
TABLE 4.5.8b HOUSING STATISTICS INFORMATION COMMUNICATION TECHNOLOGY
STATE
Number of Computers in your
organisations
Number of Employees with
access to internet facilitie
Number of Employee using
Personal Computers (PCs)
Investment on ICT from Domestics
Sources during the year (Naira)
Investment on ICT from Foreign
Sources during the year (USD)
Amount Spend on ICT during the year
(Naira)
Abia . . . . . . Adamawa 2 2 2 2 2 2 Akwa-Ibom . . . . . . Anambra . . . . . . Bauchi 8 . . . . . Bayesa 1 . . . . . Benue . . . . . . Borno 4 . . . . . Cross River . . . . . . Delta . . . . . . Ebonyi 4 7 4 . . 0 Edo . . . . . . Ekiti 8 . 10 . . . Enugu 9 7 0 . . 0 Gombe 2 . 5 . . . Imo . . . . . . Jigawa 1 . 2 . . . Kaduna . . . . . . Kano 6 10 14 . . . Katsina 1 . 2 . . . Kebbi . . . . . . Kogi . . . . . . Kwara 9 . 18 . . . Lagos 44 . . . . . Nasarawa 6 . 4 . . . Niger 14 5 19 . . . Ogun 10 4 2 . . . Ondo . . . . . . Osun 2 4 4 . . . Oyo . . . . . . Plateau 8 . 8 . . . Rivers . . . . . . Sokoto 1 5 2 . . 0 Taraba 2 . . . . . Yobe 3 . . . . . Zamfara 1 . . . . . FCT . . . . . . TOTAL 146 44 96 2 2 2

306
TABLE 4.6.1 HEALTH STATISTICS 2006 ` Number of Hospitals by Type
GENERAL
MATERNITY (WOMEN & CHILDREN)
CHILDREN
INFECTIOUS DISEASES
STATE QTR 1
QTR 2
QTR 3
QTR 4
QTR 1
QTR 2
QTR 3
QTR 4
QTR 1
QTR 2
QTR 3
QTR 4
QTR 1
QTR 2
QTR 3
QTR 4
Abia 16 16 16 16 50 50 50 50 12 12 12 12 Adamawa 16 16 16 16 80 80 80 80 1 1 1 1 Akwa-Ibom . . . . . . . . . . . . . . . . Anambra 32 32 32 32 21 21 21 21 Bauchi 16 16 16 16 183 183 183 183 Bayesa . . . . . . . . . . . . . . . . Benue . . . 16 . . . . . . . . . . Borno . . . . . . . . . . . . . . . . Cross River 19 19 19 19 1 1 1 1 1 1 1 1 Delta 56 56 56 56 156 156 156 156 Ebonyi 38 38 38 38 7 15 25 39 6 6 6 6 Edo . . . . . . . . . . . . . . . . Ekiti 17 17 17 17 Enugu 7 7 7 7 Gombe 7 8 9 9 3 3 3 3 Imo 19 19 19 19 436 436 436 436 Jigawa . . . . . . . . . . . . . . . . Kaduna 27 27 27 27 1 1 1 1 Kano 24 24 24 24 2 2 2 2 1 1 1 1 1 1 1 1 Katsina . . . . . . . . . . . . . . . . Kebbi 16 16 16 16 1 1 1 1 Kogi 51 51 51 51 Kwara . . . . . . . . . . . . . . . . Lagos . . . . . . . . . . . . . . . . Nasarawa 17 17 17 17 Niger 7 7 7 7 8 8 8 8 Ogun . . . 27 . . . 1 . . . . . . Ondo . . . . . . . . . . . . . . . . Osun 11 11 11 11 15 15 15 15 6 6 6 6 Oyo 27 27 27 27 2 2 2 2 1 1 1 1 1 1 1 1 Plateau 14 14 14 14 14 14 14 14 Rivers . . . . . . . . . . . . . . . . Sokoto 13 13 13 13 2 2 2 2 . . . . 1 1 1 1 Taraba 15 15 15 15 16 16 16 16 Yobe 11 11 11 13 34 36 39 40 Zamfara . . . . . . . . . . . . . . . . FCT . . . . . . . . . . . . . . . . TOTAL 476 477 478 523 1,031 1,041 1,054 1,070 9 9 9 9 23 23 23 23

307
TABLE 4.6.1 (Contd) HEALTH STATISTICS 2006 ` Number of Hospitals by Type
ORTHOPEDIC PSYCHIATRIC SPECIALIST TEACHING COMMUNITY HEALTH CENTRE
STATE QTR 1
QTR 2
QTR 3
QTR 4
QTR 1
QTR 2
QTR 3
QTR 4
QTR 1
QTR 2
QTR 3
QTR 4
QTR 1
QTR 2
QTR 3
QTR 4
QTR 1
QTR 2
QTR 3
QTR 4
Abia 1 1 1 1 1 1 1 1 . . . . Adamawa 1 1 1 1 . . . . 793 793 793 793 Akwa-Ibom . . . . . . . . . . . . . . . . . . . . Anambra 1 1 1 1 . . . . 1 1 1 1 353 353 353 353 Bauchi 1 1 1 1 1 1 1 1 . . . . . . . . Bayesa . . . . . . . . . . . . . . . . . . . . Benue . . . . . . . . . . . . . . . . . . . . Borno . . . . . . . . . . . . . . . . . . . . Cross River 1 1 1 1 1 1 1 1 177 177 177 177 Delta . . . . . . . . 325 325 325 325 Ebonyi 4 4 4 4 1 1 1 1 307 307 307 307 Edo . . . . . . . . . . . . . . . . . . . . Ekiti . . . . 4 4 4 4 . . . . 236 236 236 236 Enugu 1 1 1 1 1 1 1 1 2 2 2 2 2 2 2 2 . . . . Gombe . . . . . . . . 7 7 7 7 Imo 1 1 1 1 1 1 1 1 8 8 8 8 Jigawa . . . . . . . . . . . . . . . . . . . . Kaduna 1 1 1 1 1 1 1 1 . . . . . . . . Kano 1 1 1 1 1 1 1 1 3 3 3 3 1 1 1 1 11 11 11 11 Katsina . . . . . . . . . . . . . . . . . . . . Kebbi 1 1 1 1 1 1 1 1 1 1 1 1 . . . . Kogi . . . . . . . . . . . . 2 2 2 2 840 840 840 840 Kwara . . . . . . . . . . . . . . . . . . . . Lagos . . . . . . . . . . . . . . . . . . . . Nasarawa 1 1 1 1 1 1 1 1 67 67 67 67 Niger 1 1 1 1 1 1 1 1 . . . . Ogun . . . . . . 4 . . . 1 . . . 1 . . . 426 Ondo . . . . . . . . . . . . . . . . . . . . Osun 2 2 2 2 553 553 553 553 Oyo 1 1 1 1 9 9 9 9 2 2 2 2 . . . . Plateau 1 1 1 1 1 1 1 1 1 1 1 1 808 808 808 808 Rivers . . . . . . . . . . . . . . . . . . . . Sokoto . . . . 1 1 1 1 2 2 2 2 1 1 1 1 . . . . Taraba . . . . . . . . 1 1 1 1 24 24 24 24 Yobe . . . . . . . . 1 1 1 1 . . . . Zamfara . . . . . . . . . . . . . . . . . . . . FCT . . . . . . . . . . . . . . . . . . . . TOTAL 3 3 3 3 10 10 10 14 32 32 32 33 21 21 21 22 4,509 4,509 4,509 4,935

308
TABLE 4.6.2 HEALTH STATISTICS 2006 ` Number of Hospitals Bed by Type of Hospital
GENERAL MATERNITY (WOMEN & CHILDREN)
CHILDREN INFECTIOUS DISEASES STATE
QTR 1 QTR 2 QTR 3 QTR 4 QTR 1 QTR 2 QTR 3 QTR 4 QTR 1 QTR 2 QTR 3 QTR 4 QTR 1 QTR 2 QTR 3 QTR 4 Abia 480 480 480 480 200 200 200 200 198 198 198 198 Adamawa 1,852 1,852 1,852 1,852 50 50 50 50 Akwa-Ibom . . . . . . . . . . . . . . . . Anambra 3,299 3,299 3,299 3,299 Bauchi 1,576 1,576 1,576 1,576 1,508 1,508 1,508 1,508 Bayesa . . . . . . . . . . . . . . . . Benue . . . 1,016 . . . . . . . . . Borno . . . . . . . . . . . . . . . . Cross River 1,452 1,452 1,452 1,452 54 54 54 54 Delta 2,234 2,234 2,234 2,234 764 764 764 764 Ebonyi 1,696 1,696 1,696 1,696 503 503 503 503 4 4 4 4 Edo . . . . . . . . . . . . . . . . Ekiti 500 500 500 500 Enugu 181 . . 181 . . . . . . . . . . . . Gombe 1,910 1,860 1,860 1,860 Imo 4,479 4,479 4,479 4,479 1,960 1,960 1,960 1,960 Jigawa . . . . . . . . . . . . . . . . Kaduna 1,924 1,924 1,924 1,924 . . . . . . . . Kano 3,284 3,284 3,284 3,284 300 300 300 300 100 100 100 100 437 437 437 437 Katsina . . . . . . . . . . . . . . . . Kebbi 2,306 2,306 2,306 2,306 . . . . Kogi 6,455 6,455 6,455 6,455 . . . . . . . . Kwara . . . 12 . . . 455 . . . 1 . . . . Lagos . . . . . . . . . . . . . . . . Nasarawa 1,356 1,356 1,356 1,356 . . . . Niger 1,400 1,400 1,400 1,400 675 675 675 675 Ogun . . . 1,238 . . . 38 . . . . . . Ondo . . . . . . . . . . . . . . . . Osun 654 654 654 654 18 18 18 18 Oyo 2,234 2,234 2,234 2,234 218 218 218 218 30 30 30 30 Plateau 716 716 716 716 140 140 140 140 Rivers . . . . . . . . . . . . . . . . Sokoto 814 814 814 814 100 100 100 100 . . . . 32 32 32 32 Taraba 2,780 2,780 2,780 2,780 927 927 927 927 Yobe . . . 1,050 . . . 427 . . . . . . Zamfara . . . . . . . . . . . . . . . . FCT . . . . . . . . . . . . . . . . TOTAL 43,582 43,351 43,351 46,848 7,295 7,295 7,295 8,215 104 104 104 105 819 819 819 819

309
TABLE 4.6.2 (Contd) HEALTH STATISTICS 2006 ` Number of Hospitals Bed by Type of Hospital
PSYCHIATRIC SPECIALIST TEACHING COMMUNITY HEALTH CENTRE
QTR 1 QTR 2
QTR 3
QTR 4
QTR 1
QTR 2
QTR 3
QTR 4
QTR 1
QTR 2
QTR 3
QTR 4
QTR 1
QTR 2
QTR 3
QTR 4
40 40 40 40 300 300 300 300 . . . . 42 42 42 42 329 329 329 329 . . . . . . . . . . . . . . . . . . . . . . . .
394 394 394 394 . . . . 366 366 366 366 1,381 1,381 1,381 1,381 . . . . 800 800 800 800 . . . . . . . . . . . . . . . . . . . . . . . . . . . . . . . 264 . . . . 571 571 571 571 . . . . . . . . . . . . . . . .
201 201 201 201 . . . . 412 412 412 412 1,915 1,915 1,915 1,915 . . . . . . . . . . . . 19,189 19,189 19,189 19,189 14 14 14 14 208 208 208 208 3,569 3,569 3,569 3,569 . . . . . . . . . . . . . . . . . . . . 321 321 321 321 . . . . . . . . . . . . . . . . . . . . . . . .
20 20 20 20 350 350 350 350 . . . . 160 160 160 160 326 326 326 326 250 250 250 250 120 120 120 120 . . . . . . . . . . . . . . . .
52 52 52 52 . . . . . . . . . . . . 280 280 280 280 1,337 1,337 1,337 1,337 280 280 280 280
. . . . . . . . . . . . . . . .
. . . . 800 800 800 800 117 117 117 117 . . . .
. . . . . . . . 200 200 200 200 . . . .
. . . . . . . 4 . . . 1 . . . .
. . . . . . . . . . . . . . . .
. . . . 173 173 173 173 116 116 116 116 . . . .
. . . . 100 100 100 100 . . . . . . . .
. . . 420 . . . . . . 228 . . . 1,861
. . . . . . . . . . . . . . . .
. . . . . . . . 961 961 961 961 . . . .
. . . . . . . . 198 198 198 198 . . . . 554 554 554 554 521 521 521 521 4,040 4,040 4,040 4,040 . . . . . . . . . . . . . . . .
250 250 250 250 500 500 500 500 500 500 500 500 420 420 450 450 . . . . . . . . . . . . 1,463 1,463 1,463 1,463 . . . . . . . . . . . . . . . . . . . . . . . . . . . . . . . . . . . . . . . . . . . . . . . .
1,279 1,279 1,279 1,699 5,604 5,604 5,604 5,872 4,149 4,149 4,149 4,378 33,108 33,108 33,138 34,999
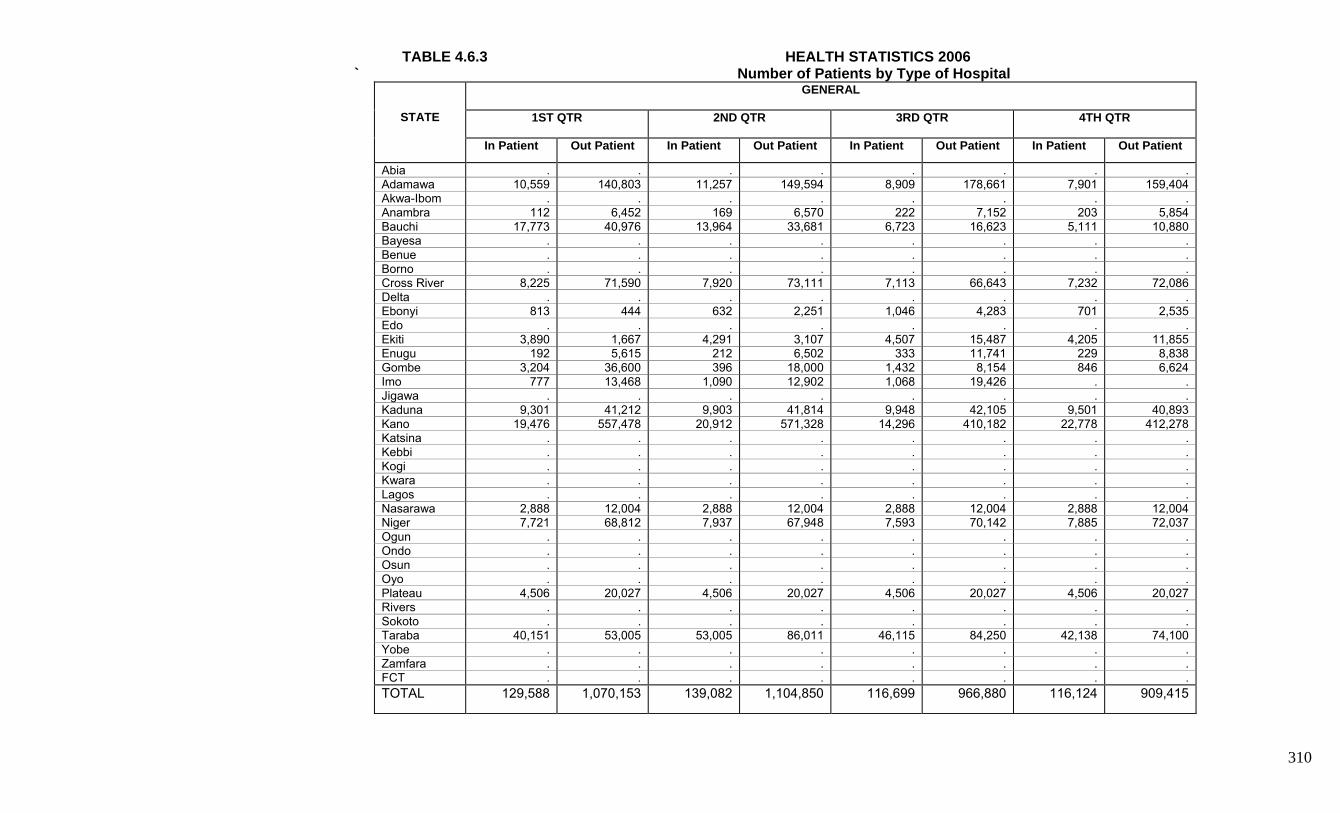
310
TABLE 4.6.3 HEALTH STATISTICS 2006 ` Number of Patients by Type of Hospital
GENERAL
1ST QTR 2ND QTR 3RD QTR 4TH QTR
STATE
In Patient Out Patient In Patient Out Patient In Patient Out Patient In Patient Out Patient
Abia . . . . . . . . Adamawa 10,559 140,803 11,257 149,594 8,909 178,661 7,901 159,404 Akwa-Ibom . . . . . . . . Anambra 112 6,452 169 6,570 222 7,152 203 5,854 Bauchi 17,773 40,976 13,964 33,681 6,723 16,623 5,111 10,880 Bayesa . . . . . . . . Benue . . . . . . . . Borno . . . . . . . . Cross River 8,225 71,590 7,920 73,111 7,113 66,643 7,232 72,086 Delta . . . . . . . . Ebonyi 813 444 632 2,251 1,046 4,283 701 2,535 Edo . . . . . . . . Ekiti 3,890 1,667 4,291 3,107 4,507 15,487 4,205 11,855 Enugu 192 5,615 212 6,502 333 11,741 229 8,838 Gombe 3,204 36,600 396 18,000 1,432 8,154 846 6,624 Imo 777 13,468 1,090 12,902 1,068 19,426 . . Jigawa . . . . . . . . Kaduna 9,301 41,212 9,903 41,814 9,948 42,105 9,501 40,893 Kano 19,476 557,478 20,912 571,328 14,296 410,182 22,778 412,278 Katsina . . . . . . . . Kebbi . . . . . . . . Kogi . . . . . . . . Kwara . . . . . . . . Lagos . . . . . . . . Nasarawa 2,888 12,004 2,888 12,004 2,888 12,004 2,888 12,004 Niger 7,721 68,812 7,937 67,948 7,593 70,142 7,885 72,037 Ogun . . . . . . . . Ondo . . . . . . . . Osun . . . . . . . . Oyo . . . . . . . . Plateau 4,506 20,027 4,506 20,027 4,506 20,027 4,506 20,027 Rivers . . . . . . . . Sokoto . . . . . . . . Taraba 40,151 53,005 53,005 86,011 46,115 84,250 42,138 74,100 Yobe . . . . . . . . Zamfara . . . . . . . . FCT . . . . . . . . TOTAL 129,588 1,070,153 139,082 1,104,850 116,699 966,880 116,124 909,415

311
TABLE 4.6.3 (Contd) HEALTH STATISTICS 2006 ` Number of Patients by Type of Hospital
MATERNITY (WOMEN & CHILREN 1ST QTR 2ND QTR 3RD QTR 4TH QTR
STATE
In Patient Out Patient In Patient Out Patient In Patient Out Patient In Patient Out Patient
Abia . . . . . . . . Adamawa Akwa-Ibom . . . . . . . . Anambra 60 450 70 490 85 700 120 1,200 Bauchi . . . . . . . . Bayesa . . . . . . . . Benue . . . . . . . . Borno . . . . . . . . Cross River Delta . . . . . . . . Ebonyi 722 1,761 704 3,168 1,030 3,560 538 2,487 Edo . . . . . . . . Ekiti . . . . . . . . Enugu . . . Gombe 180 752 45 70 45 621 35 82 Imo . . . . . . . . Jigawa . . . . . . . . Kaduna . . . . . . . . Kano . . . . . . . . Katsina . . . . . . . . Kebbi . . . . . . . . Kogi . . . . . . . . Kwara . . . . . . . . Lagos . . . . . . . . Nasarawa . . . . . . Niger 3,371 40,153 4,231 39,855 5,136 41,393 4,022 40,699 Ogun . . . . . . . . Ondo . . . . . . . . Osun . . . . . . . . Oyo . . . . . . . . Plateau 754 800 754 800 754 800 754 800 Rivers . . . . . . . . Sokoto . . . . . . . . Taraba . . . . . . . . Yobe . . . . . . . . Zamfara . . . . . . . . FCT . . . . . . . . TOTAL 5,087 43,916 5,804 44,383 7,050 47,074 5,469 45,268

312
TABLE 4.6.3 (Contd) HEALTH STATISTICS 2006 ` Number of Patients by Type of Hospital
CHILDREN 1ST QTR 2ND QTR 3RD QTR 4TH QTR
STATE
In Patient Out Patient In Patient Out Patient In Patient Out Patient In Patient Out Patient Abia . . . . . . . . Adamawa Akwa-Ibom . . . . . . . . Anambra 70 600 45 1,000 41 602 33 720 Bauchi . . . . . . . . Bayesa . . . . . . . . Benue . . . . . . . . Borno . . . . . . . . Cross River Delta . . . . . . . . Ebonyi 506 210 613 2,133 1,015 3,327 489 1,986 Edo . . . . . . . . Ekiti . . . . . . . . Enugu . . . . . . . . Gombe 36 36 36 36 36 36 36 36 Imo . . . . . . . . Jigawa . . . . . . . . Kaduna . . . . . . . . Kano . . . . . . . . Katsina . . . . . . . . Kebbi . . . . . . . . Kogi . . . . . . . . Kwara . . . . . . . . Lagos . . . . . . . . Nasarawa 1,369 5,048 Niger Ogun . . . . . . . . Ondo . . . . . . . . Osun . . . . . . . . Oyo . . . . . . . . Plateau Rivers . . . . . . . . Sokoto . . . . . . . . Taraba . . . . . . . . Yobe . . . . . . . . Zamfara . . . . . . . . FCT . . . . . . . . TOTAL 1,981 5,894 694 3,169 1,092 3,965 558 2,742

313
TABLE 4.6.3 (Contd) HEALTH STATISTICS 2006 ` Number of Patients by Type of Hospital
INFECTIOUS DISEASES 1ST QTR 2ND QTR 3RD QTR 4TH QTR
STATE In Patient Out Patient In Patient Out Patient In Patient Out Patient In Patient Out Patient Abia . . . . . . . . Adamawa 41 1,295 47 1,408 24 1,321 24 1,437 Akwa-Ibom . . . . . . . . Anambra . . . . . . Bauchi . . . . . . . . Bayesa . . . . . . . . Benue . . . . . . . . Borno . . . . . . . . Cross River . . . . . . . . Delta . . . . . . . . Ebonyi Edo . . . . . . . . Ekiti . . . . . . . . Enugu . . . . . . . . Gombe Imo . . . . . . . . Jigawa . . . . . . . . Kaduna . . . . . . . . Kano . . . . . . . . Katsina . . . . . . . . Kebbi . . . . . . . . Kogi . . . . . . . . Kwara . . . . . . . . Lagos . . . . . . . . Nasarawa . . . . . . . . Niger Ogun . . . . . . . . Ondo . . . . . . . . Osun . . . . . . . . Oyo . . . . . . . . Plateau . . . Rivers . . . . . . . . Sokoto . . . . . . . . Taraba . . . . . . . . Yobe . . . . . . . . Zamfara . . . . . . . . FCT . . . . . . . . TOTAL 41 1,295 47 1,408 24 1,321 24 1,437
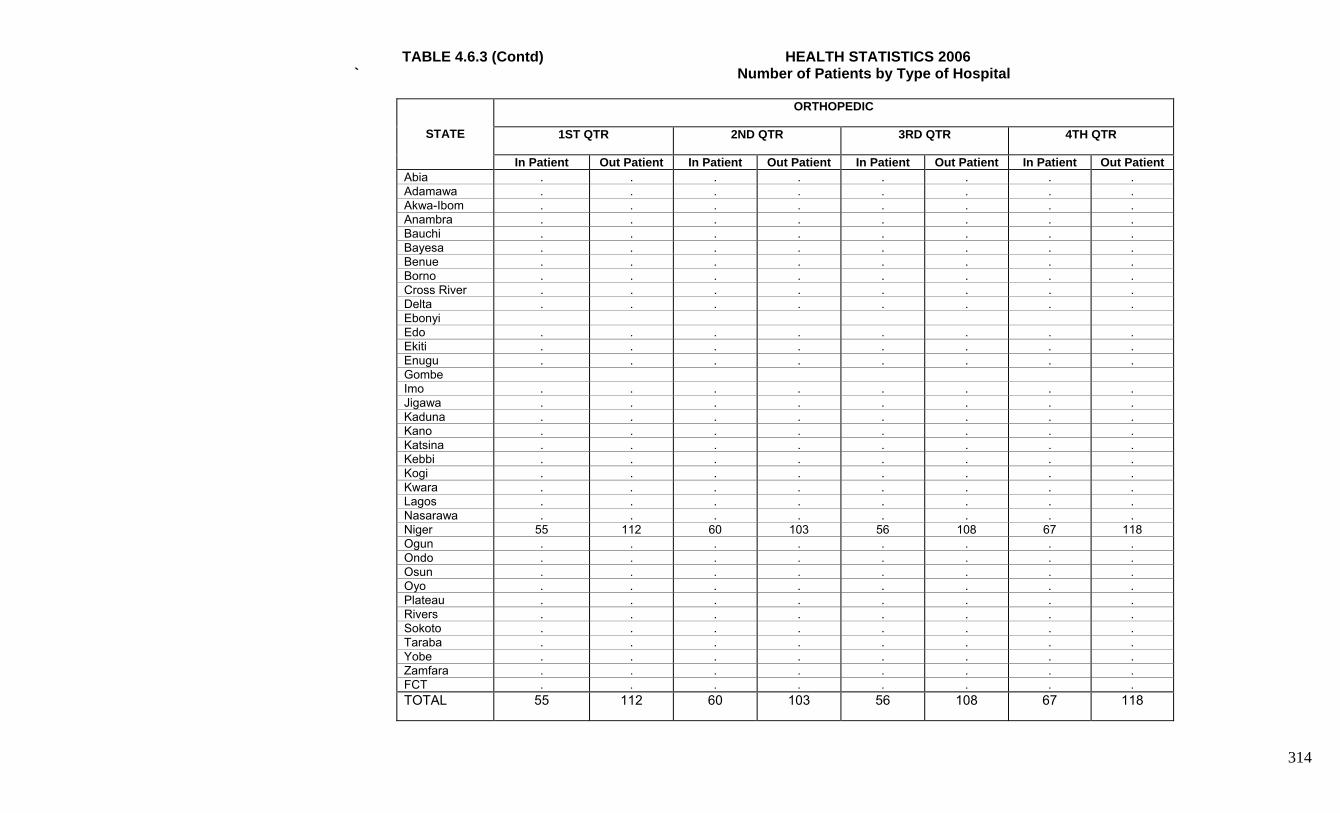
314
TABLE 4.6.3 (Contd) HEALTH STATISTICS 2006 ` Number of Patients by Type of Hospital
ORTHOPEDIC
1ST QTR 2ND QTR 3RD QTR 4TH QTR
STATE
In Patient Out Patient In Patient Out Patient In Patient Out Patient In Patient Out Patient Abia . . . . . . . . Adamawa . . . . . . . . Akwa-Ibom . . . . . . . . Anambra . . . . . . . . Bauchi . . . . . . . . Bayesa . . . . . . . . Benue . . . . . . . . Borno . . . . . . . . Cross River . . . . . . . . Delta . . . . . . . . Ebonyi Edo . . . . . . . . Ekiti . . . . . . . . Enugu . . . . . . . . Gombe Imo . . . . . . . . Jigawa . . . . . . . . Kaduna . . . . . . . . Kano . . . . . . . . Katsina . . . . . . . . Kebbi . . . . . . . . Kogi . . . . . . . . Kwara . . . . . . . . Lagos . . . . . . . . Nasarawa . . . . . . . . Niger 55 112 60 103 56 108 67 118 Ogun . . . . . . . . Ondo . . . . . . . . Osun . . . . . . . . Oyo . . . . . . . . Plateau . . . . . . . . Rivers . . . . . . . . Sokoto . . . . . . . . Taraba . . . . . . . . Yobe . . . . . . . . Zamfara . . . . . . . . FCT . . . . . . . . TOTAL 55 112 60 103 56 108 67 118

315
TABLE 4.6.4 HEALTH STATISTICS 2006 ` Health Personnel by Type
Med Doctors Dentists
1ST QTR 2ND QTR 3RD QTR 4TH QTR 1ST QTR 2ND QTR 3RD QTR 4TH QTR
STATE
Male Female Male Female Male Female Male Female Male Female Male Female Male Fenmale Male Female Abia 11 9 11 9 11 9 11 9 Adamawa . 43 . 43 . 43 . 43 . 3 . 3 . 5 5 Akwa-Ibom . . . . . . . . . . . . . . . . Anambra 107 5 107 5 107 5 107 5 4 8 4 8 4 8 4 8 Bauchi 88 7 99 10 114 11 114 11 4 1 4 1 4 1 1 4 Bayesa . . . . . . . . . . . . . . . . Benue . . . . . . . . . . . . . . . . Borno . . . . . . . . . . . . . . . . Cross River 75 4 75 4 75 4 75 4 Delta . . . . . . . . . . . . . . . . Ebonyi 266 79 266 79 266 79 266 79 2 . 2 . 2 . 2 . Edo . . . . . . . . . . . . . . . . Ekiti 39 42 39 42 39 42 39 42 6 5 6 5 6 5 6 5 Enugu . . . . . . . . . . . . . . . . Gombe 70 2 70 2 70 2 70 2 2 1 2 1 2 1 2 1 Imo . . . . . . . . . . . . . . . . Jigawa . . . . . . . . . . . . . . . . Kaduna 134 35 134 35 134 35 134 35 17 20 17 20 17 20 17 20 Kano . 242 . 280 . 280 . 288 . 16 . 16 . 16 . 16 Katsina . . . . . . . . . . . . . . . . Kebbi 85 3 85 3 85 3 85 3 1 . 1 . 1 . 1 . Kogi . . . . . . . . . . . . . . . . Kwara . . . . . . . . . . . . . . . . Lagos . . . . . . . . . . . . . . . . Nasarawa . . . . . . . . . . . . . . . . Niger 247 6 247 6 247 6 247 6 13 . 13 . 13 . 13 . Ogun . . . . . . . . . . . . . . . . Ondo . . . . . . . . . . . . . . . . Osun 293 85 293 85 293 85 293 85 25 9 25 9 25 9 25 9 Oyo . . . . . . . . . . . . . . . . Plateau 48 25 48 25 48 25 48 25 4 . 4 . 4 . 4 . Rivers . . . . . . . . . . . . . . . . Sokoto 43 3 43 3 43 3 43 2 . . . . . . . . Taraba 36 2 36 2 36 2 36 2 11 6 11 6 11 6 11 6 Yobe . . . . . . . . . . . . . . . . Zamfara . . . . . . . . . . . . . . . . FCT . . . . . . . . . . . . . . . . TOTAL 1,542 592 1,553 633 1,568 634 1,568 641 89 69 89 69 89 71 86 74

316
TABLE 4.6.4(Contd) HEALTH STATISTICS 2006 ` Health Personnel by Type
Pharmacists Pharmacy Staff
1ST QTR 2ND QTR 3RD QTR 4TH QTR 1ST QTR 2ND QTR 3RD QTR 4TH QTR
STATE
Male Fem Male Fem Male Fem Male Fem Male Fem Male Fem Male Fem Male Fem Abia 8 4 8 4 8 4 8 4 Adamawa . 13 . 13 . 13 . 13 . 69 . 69 . 69 . 90 Akwa-Ibom . . . . . . . . . . . . . . . . Anambra 7 9 7 9 7 9 7 9 23 22 23 22 23 22 23 22 Bauchi 21 2 21 2 21 2 21 2 Bayesa . . . . . . . . . . . . . . . . Benue . . . . . . . . . . . . . . . . Borno . . . . . . . . . . . . . . . . Cross River 11 3 11 3 11 3 11 3 70 146 70 146 70 146 70 146 Delta . . . . . . . . . . . . . . . . Ebonyi 20 14 20 14 20 14 20 14 11 6 11 6 11 6 11 6 Edo . . . . . . . . . . . . . . . . Ekiti 12 15 12 15 12 15 12 15 58 48 58 48 58 48 58 48 Enugu . . . . . . . . . . . . . . . . Gombe 16 . 16 . 6 . 16 . 36 18 36 18 36 18 36 18 Imo . . . . . . . . . . . . . . . . Jigawa . . . . . . . . . . . . . . . . Kaduna 47 29 47 29 47 29 47 29 124 91 124 91 124 91 133 96 Kano . 46 . 46 . 46 . 46 . 193 . 193 . 193 . 193 Katsina . . . . . . . . . . . . . . . . Kebbi 9 1 9 1 9 1 9 1 73 5 73 5 73 5 73 5 Kogi . . . . . . . . . . . . . . . . Kwara . . . . . . . . . . . . . . . . Lagos . . . . . . . . . . . . . . . . Nasarawa . . . . . . . . . . . . . . . . Niger 82 9 82 9 82 9 82 9 52 . 52 . 52 . 52 . Ogun . . . . . . . . . . . . . . . . Ondo . . . . . . . . . . . . . . . . Osun 60 20 60 20 60 20 60 20 54 30 54 30 54 30 54 30 Oyo . . . . . . . . . . . . . . . . Plateau 64 32 64 32 64 32 64 32 9 5 9 5 9 5 9 5 Rivers . . . . . . . . . . . . . . . . Sokoto 17 2 17 2 17 2 17 2 112 9 112 9 112 9 112 9 Taraba 10 . 10 . 10 . 10 . 24 26 24 26 24 26 24 26 Yobe . . . . . . . . . . . . . . . . Zamfara . . . . . . . . . . . . . . . . FCT . . . . . . . . . . . . . . . . TOTAL 384 199 384 199 374 199 384 199 646 668 646 668 646 668 655 694
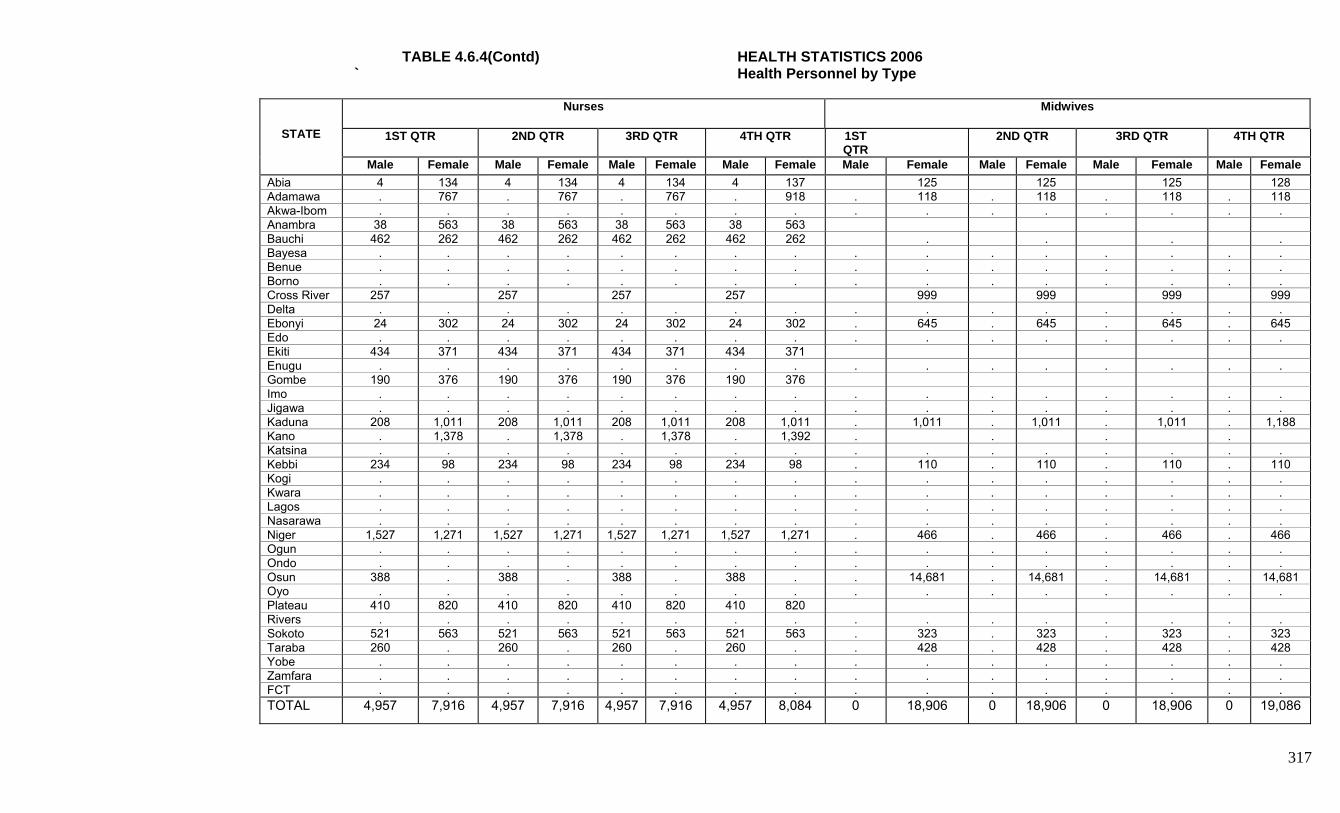
317
TABLE 4.6.4(Contd) HEALTH STATISTICS 2006 ` Health Personnel by Type
Nurses Midwives
1ST QTR 2ND QTR 3RD QTR 4TH QTR 1ST QTR
2ND QTR 3RD QTR 4TH QTR
STATE
Male Female Male Female Male Female Male Female Male Female Male Female Male Female Male Female Abia 4 134 4 134 4 134 4 137 125 125 125 128 Adamawa . 767 . 767 . 767 . 918 . 118 . 118 . 118 . 118 Akwa-Ibom . . . . . . . . . . . . . . . . Anambra 38 563 38 563 38 563 38 563 Bauchi 462 262 462 262 462 262 462 262 . . . . Bayesa . . . . . . . . . . . . . . . . Benue . . . . . . . . . . . . . . . . Borno . . . . . . . . . . . . . . . . Cross River 257 257 257 257 999 999 999 999 Delta . . . . . . . . . . . . . . . . Ebonyi 24 302 24 302 24 302 24 302 . 645 . 645 . 645 . 645 Edo . . . . . . . . . . . . . . . . Ekiti 434 371 434 371 434 371 434 371 Enugu . . . . . . . . . . . . . . . . Gombe 190 376 190 376 190 376 190 376 Imo . . . . . . . . . . . . . . . . Jigawa . . . . . . . . . . . . . . . . Kaduna 208 1,011 208 1,011 208 1,011 208 1,011 . 1,011 . 1,011 . 1,011 . 1,188 Kano . 1,378 . 1,378 . 1,378 . 1,392 . . . . Katsina . . . . . . . . . . . . . . . . Kebbi 234 98 234 98 234 98 234 98 . 110 . 110 . 110 . 110 Kogi . . . . . . . . . . . . . . . . Kwara . . . . . . . . . . . . . . . . Lagos . . . . . . . . . . . . . . . . Nasarawa . . . . . . . . . . . . . . . . Niger 1,527 1,271 1,527 1,271 1,527 1,271 1,527 1,271 . 466 . 466 . 466 . 466 Ogun . . . . . . . . . . . . . . . . Ondo . . . . . . . . . . . . . . . . Osun 388 . 388 . 388 . 388 . . 14,681 . 14,681 . 14,681 . 14,681 Oyo . . . . . . . . . . . . . . . . Plateau 410 820 410 820 410 820 410 820 Rivers . . . . . . . . . . . . . . . . Sokoto 521 563 521 563 521 563 521 563 . 323 . 323 . 323 . 323 Taraba 260 . 260 . 260 . 260 . . 428 . 428 . 428 . 428 Yobe . . . . . . . . . . . . . . . . Zamfara . . . . . . . . . . . . . . . . FCT . . . . . . . . . . . . . . . . TOTAL 4,957 7,916 4,957 7,916 4,957 7,916 4,957 8,084 0 18,906 0 18,906 0 18,906 0 19,086

318
TABLE 4.6.4Contd) HEALTH STATISTICS 2006 ` Health Personnel by Type
Community Health Workers Heath Education Officers 1ST QTR 2ND QTR 3RD QTR 4TH QTR 1ST QTR 2ND QTR 3RD QTR 4TH QTR
STATE
Male Fem Male Fem Male Fem Male Fem Male Fem Male Fem Male Fem Male Fem Abia 3 1 3 1 3 1 3 1 Adamawa 1,141 752 1,141 752 1,137 751 1,131 742 20 8 20 8 20 8 20 8 Akwa-Ibom . . . . . . . . . . . . . . . . Anambra 7 1 7 1 7 1 7 1 Bauchi 211 53 211 53 211 53 211 53 2 2 2 2 Bayesa . . . . . . . . . . . . . . . . Benue . . . . . . . . . . . . . . . . Borno . . . . . . . . . . . . . . . . C/ River 42 114 42 114 42 114 42 114 36 39 36 39 36 39 36 39 Delta . . . . . . . . . . . . . . . . Ebonyi 60 34 60 34 60 34 60 34 26 14 26 14 26 14 26 14 Edo . . . . . . . . . . . . . . . . Ekiti 431 370 431 370 431 370 431 370 2 2 2 2 2 2 2 2 Enugu . . . . . . . . . . . . . . . . Gombe 101 48 101 48 101 48 101 48 4 2 4 2 4 2 4 2 Imo . . . . . . . . . . . . . . . . Jigawa . . . . . . . . . . . . . . . . Kaduna 45 42 45 42 45 42 45 42 2 . 2 . 2 . 2 . Kano . 693 . 693 . 693 . 693 . . . Katsina . . . . . . . . . . . . . . . . Kebbi 334 57 334 57 334 57 334 57 14 4 14 4 14 4 14 4 Kogi . . . . . . . . . . . . . . . . Kwara . . . . . . . . . . . . . . . . Lagos . . . . . . . . . . . . . . . . Nasarawa . . . . . . . . . . . . . . . . Niger 2,604 1,139 2,604 1,139 2,604 1,139 2,604 1,139 3 1 3 1 3 1 3 1 Ogun . . . . . . . . . . . . . . . . Ondo . . . . . . . . . . . . . . . . Osun 151 866 151 866 151 866 151 866 1 1 1 1 1 1 1 1 Oyo . . . . . . . . . . . . . . . . Plateau 153 306 153 306 153 306 153 306 9 2 9 2 9 2 9 2 Rivers . . . . . . . . . . . . . . . . Sokoto 1,253 209 1,253 209 1,253 209 1,253 209 36 3 36 3 36 3 36 3 Taraba 1,442 . 1,442 . 1,442 . 1,442 . Yobe . . . . . . . . . . . . . . . . Zamfara . . . . . . . . . . . . . . . . FCT . . . . . . . . . . . . . . . . TOTAL 7,968 4,683 7,968 4,683 7,964 4,682 7,958 4,673 165 78 165 78 165 78 165 78
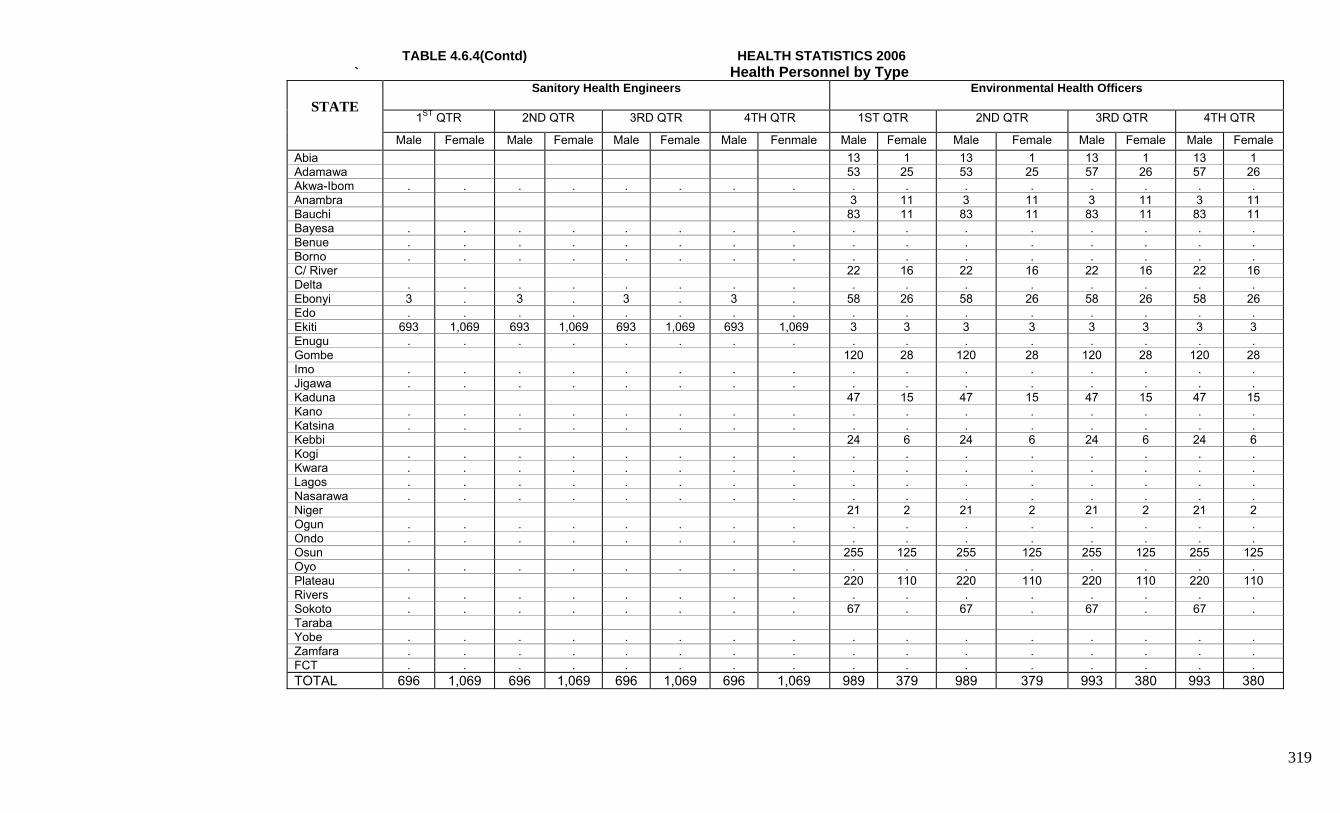
319
TABLE 4.6.4(Contd) HEALTH STATISTICS 2006 ` Health Personnel by Type
Sanitory Health Engineers Environmental Health Officers
1ST QTR 2ND QTR 3RD QTR 4TH QTR 1ST QTR 2ND QTR 3RD QTR 4TH QTR
STATE
Male Female Male Female Male Female Male Fenmale Male Female Male Female Male Female Male Female Abia 13 1 13 1 13 1 13 1 Adamawa 53 25 53 25 57 26 57 26 Akwa-Ibom . . . . . . . . . . . . . . . . Anambra 3 11 3 11 3 11 3 11 Bauchi 83 11 83 11 83 11 83 11 Bayesa . . . . . . . . . . . . . . . . Benue . . . . . . . . . . . . . . . . Borno . . . . . . . . . . . . . . . . C/ River 22 16 22 16 22 16 22 16 Delta . . . . . . . . . . . . . . . . Ebonyi 3 . 3 . 3 . 3 . 58 26 58 26 58 26 58 26 Edo . . . . . . . . . . . . . . . . Ekiti 693 1,069 693 1,069 693 1,069 693 1,069 3 3 3 3 3 3 3 3 Enugu . . . . . . . . . . . . . . . . Gombe 120 28 120 28 120 28 120 28 Imo . . . . . . . . . . . . . . . . Jigawa . . . . . . . . . . . . . . . . Kaduna 47 15 47 15 47 15 47 15 Kano . . . . . . . . . . . . . . . . Katsina . . . . . . . . . . . . . . . . Kebbi 24 6 24 6 24 6 24 6 Kogi . . . . . . . . . . . . . . . . Kwara . . . . . . . . . . . . . . . . Lagos . . . . . . . . . . . . . . . . Nasarawa . . . . . . . . . . . . . . . . Niger 21 2 21 2 21 2 21 2 Ogun . . . . . . . . . . . . . . . . Ondo . . . . . . . . . . . . . . . . Osun 255 125 255 125 255 125 255 125 Oyo . . . . . . . . . . . . . . . . Plateau 220 110 220 110 220 110 220 110 Rivers . . . . . . . . . . . . . . . . Sokoto . . . . . . . . 67 . 67 . 67 . 67 . Taraba Yobe . . . . . . . . . . . . . . . . Zamfara . . . . . . . . . . . . . . . . FCT . . . . . . . . . . . . . . . . TOTAL 696 1,069 696 1,069 696 1,069 696 1,069 989 379 989 379 993 380 993 380

320
TABLE 4.6.4(Contd) HEALTH STATISTICS 2006 ` Health Personnel by Type
Medical Laboratory Staff Radiology Diagnosis Staff 1ST QTR 2ND QTR 3RD QTR 4TH QTR 1ST QTR 2ND QTR 3RD QTR 4TH QTR
STATE
Male Fem Male Fem Male Fem Male Fem Male Fem Male Fem Male Fem Male Fem Abia 9 10 9 10 9 10 9 10 . . . . . . . . Adamawa . 119 . 109 . 109 . 109 . 18 . 18 . 18 . 18 Akwa-Ibom . . . . . . . . . . . . . . . . Anambra 15 16 15 16 15 16 15 16 . . . . Bauchi 55 7 55 7 55 7 55 7 . . . . . . . . Bayesa . . . . . . . . . . . . . . . . Benue . . . . . . . . . . . . . . . . Borno . . . . . . . . . . . . . . . . C/ River 59 68 59 68 59 68 59 68 63 88 63 88 63 88 63 88 Delta . . . . . . . . . . . . . . . . Ebonyi 101 27 101 27 101 27 101 27 Edo . . . . . . . . . . . . . . . . Ekiti 38 31 38 31 38 31 38 31 31 22 31 22 31 22 31 22 Enugu . . . . . . . . . . . . . . . . Gombe 19 4 19 4 19 4 19 4 2 . 2 . 2 . 2 . Imo . . . . . . . . . . . . . . . . Jigawa . . . . . . . . . . . . . . . . Kaduna 113 62 113 62 113 62 123 67 3 3 3 3 Kano . 223 . 223 . 223 . 223 . . . . . . . . Katsina . . . . . . . . . . . . . . . . Kebbi 63 35 63 35 63 35 63 35 3 . 3 . 3 . 3 . Kogi . . . . . . . . . . . . . . . . Kwara . . . . . . . . . . . . . . . . Lagos . . . . . . . . . . . . . . . . Nasarawa . . . . . . . . . . . . . . . . Niger 70 52 70 52 70 52 70 52 1 1 1 1 Ogun . . . . . . . . . . . . . . . . Ondo . . . . . . . . . . . . . . . . Osun 78 42 78 42 78 42 78 42 12 2 12 2 12 2 12 2 Oyo . . . . . . . . . . . . . . . . Plateau 200 100 200 100 200 100 200 100 4 2 4 2 4 2 4 2 Rivers . . . . . . . . . . . . . . . . Sokoto 142 17 142 17 142 17 142 17 . . . . . . . . Taraba 66 22 66 22 66 22 66 22 15 4 15 4 15 4 15 4 Yobe . . . . . . . . . . . . . . . . Zamfara . . . . . . . . . . . . . . . . FCT . . . . . . . . . . . . . . . . TOTAL 1,028 835 1,028 825 1,028 825 1,038 830 134 136 134 136 134 136 134 136

321
TABLE 4.6.4 (Contd) HEALTH STATISTICS 2006 ` Health Personnel by Type
Medical Record Staff
1ST QTR 2ND QTR 3RD QTR 4TH QTR
STATE
Male Female Male Female Male Female Male Female Abia 1 7 1 7 1 7 1 7 Adamawa . 117 . 117 . 117 . 126 Akwa-Ibom . . . . . . . . Anambra 4 22 4 22 4 22 4 22 Bauchi 81 25 81 25 81 25 81 25 Bayesa . . . . . . . . Benue . . . . . . . . Borno . . . . . . . . C/ River 58 122 58 122 58 122 58 122 Delta . . . . . . . . Ebonyi 39 33 39 33 39 33 39 33 Edo . . . . . . . . Ekiti 59 70 59 70 59 70 59 70 Enugu . . . . . . . . Gombe 23 19 23 19 23 19 23 19 Imo . . . . . . . . Jigawa . . . . . . . . Kaduna 106 81 106 81 106 81 100 86 Kano . 94 . 94 . 94 . 94 Katsina . . . . . . . . Kebbi 94 25 94 25 94 25 94 25 Kogi . . . . . . . . Kwara . . . . . . . . Lagos . . . . . . . . Nasarawa . . . . . . . . Niger 87 48 87 48 87 48 87 48 Ogun . . . . . . . . Ondo . . . . . . . . Osun 62 64 62 64 62 64 62 64 Oyo . . . . . . . . Plateau 81 41 81 41 81 41 81 41 Rivers . . . . . . . . Sokoto 209 50 209 50 209 50 209 50 Taraba 16 14 16 14 16 14 16 14 Yobe . . . . . . . . Zamfara . . . . . . . . FCT . . . . . . . . TOTAL 920 832 920 832 920 832 914 846

322
TABLE 4.6.5 HEALTH STATISTICS 2006 ` Health Training Institutions by Type
Nursing Midwifery Nursing/Midwifery STATE QTR 1 QTR 2 QTR 3 QTR 4 QTR 1 QTR 2 QTR 3 QTR 4 QTR 1 QTR 2 QTR 3 QTR 4 Abia 2 2 2 2 3 3 3 3 Adamawa 1 1 1 1 1 1 1 1 Akwa-Ibom . . . . . . . . . . . . Anambra . . 1 . . . 1 . . . . Bauchi 1 1 1 1 1 1 1 1 Bayesa . . . . . . . . . . . . Benue . . . 2 . . . 2 . . . Borno . . . . . . . . . . . . Cross River 3 3 3 3 3 3 3 3 Delta 3 3 3 3 2 2 2 2 Ebonyi 3 3 3 3 2 2 2 2 2 2 2 2 Edo . . . . . . . . . . . . Ekiti 1 1 1 1 1 1 1 1 Enugu . . . 2 . . . 1 . . . Gombe 1 1 1 1 Imo 5 5 5 5 2 2 2 2 1 1 1 1 Jigawa . . . . . . . . . . . . Kaduna 1 1 1 1 1 1 1 1 1 1 1 1 Kano 1 1 1 1 1 1 1 1 Katsina . . . . . . . . . . . . Kebbi 1 1 1 1 Kogi 1 1 1 1 1 1 1 1 1 1 1 1 Kwara . . . 1 . . . 1 . . . . Lagos . . . . . . . . . . . . Nasarawa 1 1 1 1 Niger 1 1 1 1 1 1 1 1 Ogun 3 3 3 3 2 2 2 2 Ondo . . . . . . . . . . . . Osun 5 5 5 5 4 4 4 4 Oyo 3 3 3 3 1 1 1 1 1 1 1 1 Plateau . . . 2 . . . 2 . . . Rivers . . . . . . . . . . . . Sokoto 2 2 2 2 1 1 1 1 Taraba 1 1 1 1 1 1 1 1 Yobe 1 1 1 1 . . . . Zamfara . . . . . . . . . . . . FCT . . . . . . . . . . . .
TOTAL 39 39 40 46 28 28 29 34 8 8 8 8

323
TABLE 4.6.5 (Contd) HEALTH STATISTICS 2006
` Health Training Institutions by Type Medical Laboratory Radiography Health Technical Medical Records
STATE QTR 1 QTR 2 QTR 3 QTR 4 QTR 1 QTR 2 QTR 3 QTR 4 QTR 1 QTR 2 QTR 3 QTR 4 QTR 1 QTR 2 QTR 3 QTR 4
Abia 2 2 2 2 . . . . 1 1 1 1 Adamawa . . . . . . . . 1 1 1 1 . . . . Akwa-Ibom . . . . . . . . . . . . . . . . Anambra . . 1 . . . . . . . . . . . . . Bauchi 1 1 1 1 . . . . . . . . 1 1 1 1 Bayesa . . . . . . . . . . . . . . . . Benue . . . 1 . . . . . . . 5 . . . . Borno . . . . . . . . . . . . . . . . Cross River . . . . . . . . . . . . . . . . Delta . . . . . . . . 1 1 1 1 . . . . Ebonyi . . . . 1 1 1 1 . . . . Edo . . . . . . . . . . . . . . . . Ekiti 1 1 1 1 1 1 1 1 1 1 1 1 Enugu . . . . . . . . . 2 . . . 2 Gombe . . . . . . . . 1 1 1 1 . . . . Imo 1 1 1 1 . . . . Jigawa . . . . . . . . . . . . . . . . Kaduna 2 2 2 2 2 2 2 2 2 2 2 2 Kano 1 1 1 1 . . . . Katsina . . . . . . . . . . . . . . . . Kebbi . . . . . . . . 1 1 1 1 . . . . Kogi . . . . . . . . . . . . Kwara . . . 1 . . . . . . . . . . 1 Lagos . . . . . . . . . . . . . . . . Nasarawa 1 1 1 1 . . . . 1 1 1 1 1 1 1 1 Niger . . . . . . . . 2 2 2 2 . . . . Ogun . . . . 1 1 1 1 . . . . Ondo . . . . . . . . . . . . . . . . Osun 1 1 1 1 1 1 1 1 1 1 1 1 Oyo 1 1 1 1 1 1 1 1 1 1 1 1 Plateau . . . 1 . . . . . . 2 . . . 2 Rivers . . . . . . . . . . . . . . . . Sokoto 1 1 1 1 1 1 1 1 Taraba . . . . . . . . 1 1 1 1 . . . . Yobe . . . . . . . . 1 1 1 1 . . . . Zamfara . . . . . . . . . . . . . . . . FCT . . . . . . . . . . . . . . . .
TOTAL 9 9 10 12 0 0 0 0 19 19 19 28 9 9 9 14

324
TABLE 4.6.6 HEALTH STATISTICS 2006 ` Children Immunization
NUMBER FULLY IMMUNIZED TUBERCULOSIS DPT
STATE QTR 1 QTR 2 QTR 3 QTR 4 QTR 1 QTR 2 QTR 3 QTR 4 QTR 1 QTR 2 QTR 3 QTR 4
Abia 22,224 17,441 29,360 15,140 . . . . . . . . Adamawa 4,924 1,396 18,515 17,806 6,692 7,757 17,203 16,965 Akwa-Ibom . . . . . . . . . . . . Anambra 25,590 22,487 33,328 28,171 14,201 15,268 21,093 14,913 Bauchi . . . . . . . . . . . . Bayesa . . . . . . . . . . . . Benue . . . 7,395 . . . . . . . . Borno . . . . . . . . . . . . Cross River 12,751 13,541 15,109 10,623 19,160 9,951 22,119 25,151 39,374 41,905 42,771 40,800 Delta . . . . . . . . . . . . Ebonyi . . . . . . . . . . . . Edo . . . . . . . . . . . . Ekiti . . . . . . . . . . . . Enugu 14,938 21,661 21,574 10,069 12,862 29,720 24,692 17,743 12,836 15,469 19,132 14,536 Gombe 10,900 11,867 20,500 25,000 25,000 8,000 10,000 10,000 10,000 8,000 4,000 3,500 Imo . 52,475 39,022 . . Jigawa . . . . . . . . . . . . Kaduna 44,530 4,396 44,434 29,814 . . . . . . . . Kano . . . . . . . . . . . . Katsina . . . . . . . . . . . . Kebbi . . . . 75,975 112,582 . . 263,647 426,620 Kogi 617,117 617,117 117,057 117,057 . . . . . . . . Kwara . . . . . . 6,433 . . . 10,021 Lagos . . . . . . . . . . . . Nasarawa 25,790 5,481 43,931 44,176 12,334 18,582 9,282 7,958 Niger . . 42 70 81 88 70 60 50 90 60 62 Ogun . . . . . . . . . . . . Ondo . . . . . . . . . . . . Osun . . . . . . . . . . . . Oyo . . . . . . . . . . . . Plateau 3,843 3,843 3,843 3,843 . . . . . . . . Rivers . . . . . . . . . . . . Sokoto . . . 13,102 . . . 13,000 . . . Taraba 27,236 37,600 5,400 20,610 Yobe . . . . . . Zamfara . . . . . . . . . . . . FCT . . . . . . . . . . . . TOTAL 779,129 802,428 329,669 267,792 100,919 54,636 195,302 233,951 108,487 107,071 377,188 535,375
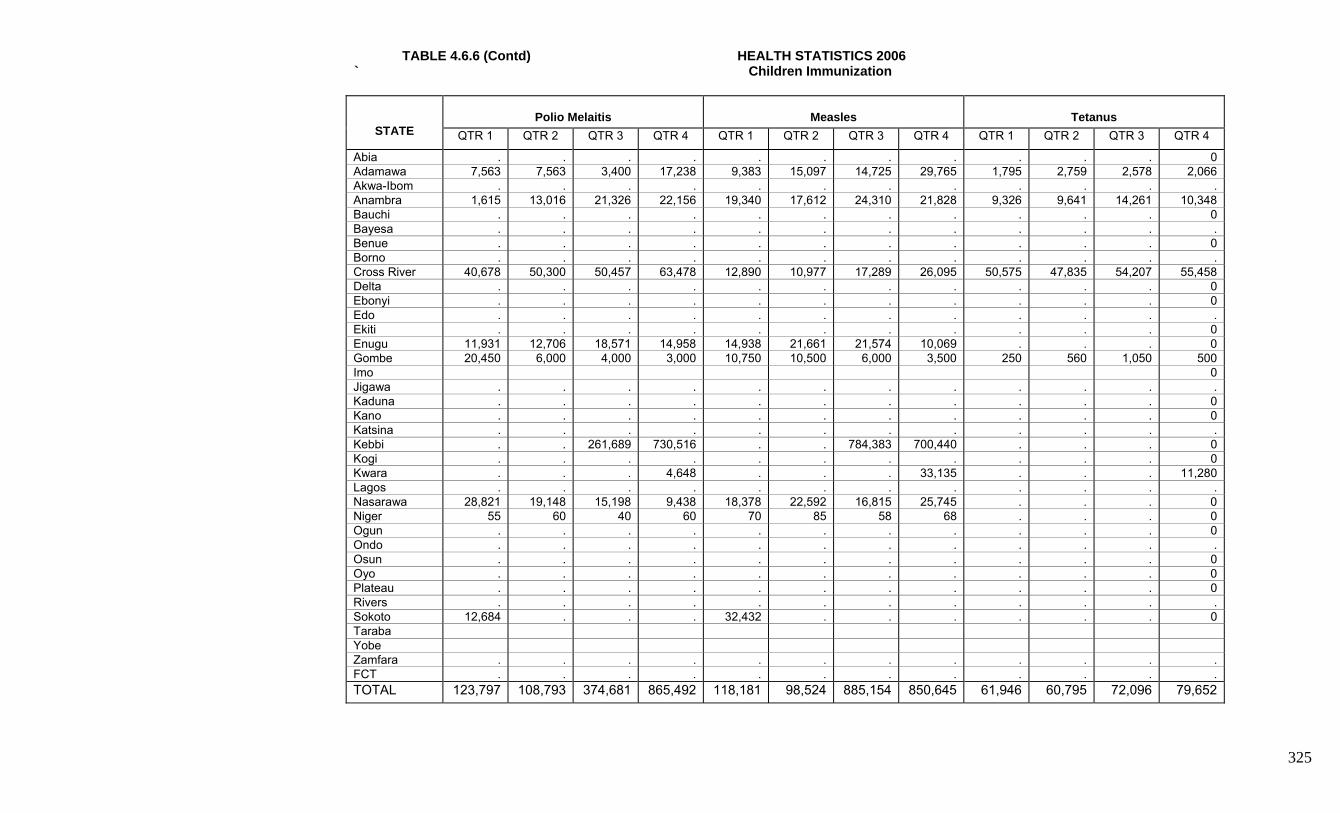
325
TABLE 4.6.6 (Contd) HEALTH STATISTICS 2006 ` Children Immunization
Polio Melaitis
Measles
Tetanus
STATE QTR 1 QTR 2 QTR 3 QTR 4 QTR 1 QTR 2 QTR 3 QTR 4 QTR 1 QTR 2 QTR 3 QTR 4
Abia . . . . . . . . . . . 0 Adamawa 7,563 7,563 3,400 17,238 9,383 15,097 14,725 29,765 1,795 2,759 2,578 2,066 Akwa-Ibom . . . . . . . . . . . . Anambra 1,615 13,016 21,326 22,156 19,340 17,612 24,310 21,828 9,326 9,641 14,261 10,348 Bauchi . . . . . . . . . . . 0 Bayesa . . . . . . . . . . . . Benue . . . . . . . . . . . 0 Borno . . . . . . . . . . . . Cross River 40,678 50,300 50,457 63,478 12,890 10,977 17,289 26,095 50,575 47,835 54,207 55,458 Delta . . . . . . . . . . . 0 Ebonyi . . . . . . . . . . . 0 Edo . . . . . . . . . . . . Ekiti . . . . . . . . . . . 0 Enugu 11,931 12,706 18,571 14,958 14,938 21,661 21,574 10,069 . . . 0 Gombe 20,450 6,000 4,000 3,000 10,750 10,500 6,000 3,500 250 560 1,050 500 Imo 0 Jigawa . . . . . . . . . . . . Kaduna . . . . . . . . . . . 0 Kano . . . . . . . . . . . 0 Katsina . . . . . . . . . . . . Kebbi . . 261,689 730,516 . . 784,383 700,440 . . . 0 Kogi . . . . . . . . . . . 0 Kwara . . . 4,648 . . . 33,135 . . . 11,280 Lagos . . . . . . . . . . . . Nasarawa 28,821 19,148 15,198 9,438 18,378 22,592 16,815 25,745 . . . 0 Niger 55 60 40 60 70 85 58 68 . . . 0 Ogun . . . . . . . . . . . 0 Ondo . . . . . . . . . . . . Osun . . . . . . . . . . . 0 Oyo . . . . . . . . . . . 0 Plateau . . . . . . . . . . . 0 Rivers . . . . . . . . . . . . Sokoto 12,684 . . . 32,432 . . . . . . 0 Taraba Yobe Zamfara . . . . . . . . . . . . FCT . . . . . . . . . . . . TOTAL 123,797 108,793 374,681 865,492 118,181 98,524 885,154 850,645 61,946 60,795 72,096 79,652

326
TABLE 4.6.7 HEALTH STATISTICS 2006 ` Finances
STATE GOVT BUDGETARY ALLOCATION TO HEALTH SECTOR STATE
QTR 1 QTR 2 QTR 3 QTR 4 TOTAL Abia . . . . 0 Adamawa 807,903,336 807,903,336 807,903,336 807,903,336 3,231,613,344 Akwa-Ibom . . . . 0 Anambra 120,000,000 135,000,000 130,000,000 150,000,000 535,000,000 Bauchi . . . . 0 Bayesa . . . . 0 Benue . . . 2,934,720,000 2,934,720,000 Borno . . . . 0 Cross River 346,350,135 346,350,135 346,350,135 346,350,135 1,385,400,540 Delta 2,716,455,000 5,432,910,000 8,149,365,000 10,865,820,000 27,164,550,000 Ebonyi . . . . 0 Edo . . . . 0 Ekiti 19,362,654 193,620,536 193,620,536 193,620,536 600,224,262 Enugu Gombe . . . . 0 Imo . . . . 0 Jigawa . . . . 0 Kaduna 501,409,634 501,409,634 501,409,634 501,409,634 2,005,638,536 Kano . . . 1,645,000,000 1,645,000,000 Katsina . . . . 0 Kebbi 291,343,150 240,328,589 471,867,901 408,416,206 1,411,955,846 Kogi 1,637,151,274 1,637,151,274 1,637,151,274 1,637,151,274 6,548,605,096 Kwara . . . 1,881,062,697 1,881,062,697 Lagos . . . . 0 Nasarawa 3,567,024,400 3,567,024,400 3,567,024,400 3,567,024,400 14,268,097,600 Niger 542,476,548 542,476,548 542,476,548 542,476,548 2,169,906,192 Ogun . . . 2,367,000,000 2,367,000,000 Ondo . . . . 0 Osun . . . . 0 Oyo . . . . 0 Plateau . . . 486,812,010 486,812,010 Rivers . . . . 0 Sokoto 489,077,728 489,077,728 489,077,728 489,077,728 1,956,310,912 Taraba 1,935,000,000 . . . 1,935,000,000 Yobe . . . Zamfara . . . . 0 FCT . . . . 0 TOTAL 12,973,553,859 13,893,252,180 16,836,246,492 28,823,844,504 72,526,897,035

327
TABLE 4.6.7 (Contd) HEALTH STATISTICS 2006 ` Finances
STATE GOVT ANNUAL BUDGET STATE
QTR 1 QTR 2 QTR 3 QTR 4 TOTAL Abia . . . . 0 Adamawa 9,099,014,873 9,099,014,873 9,099,014,873 9,099,014,873 36,396,059,492 Akwa-Ibom . . . . 0 Anambra 8,950,000,000 8,950,000,000 8,950,000,000 8,950,000,000 35,800,000,000 Bauchi . . . . 0 Bayesa . . . . 0 Benue . . . 46,378,600 46,378,600 Borno . . . . 0 Cross River 9,810,254,363 9,810,254,363 9,810,254,363 9,810,254,363 39,241,017,452 Delta 37,499,874,768 74,999,749,537 112,499,624,305 149,999,499,075 374,998,747,685 Ebonyi . . . . 0 Edo . . . . 0 Ekiti 6,549,227,208 654,927,208 654,922,708 6,549,227,208 14,408,304,332 Enugu 36,842,188 36,842,188 36,842,188 36,842,188 147,368,750 Gombe . . . . 0 Imo . . . . 0 Jigawa . . . . 0 Kaduna . . . . 0 Kano . . . 49,991,565,350 49,991,565,350 Katsina . . . . 0 Kebbi 40,521,993 . . . 40,521,993 Kogi 31,314,403,414 31,314,403,414 31,314,403,414 31,314,403,414 125,257,613,656 Kwara . . . 35,657,921,076 35,657,921,076 Lagos . . . . 0 Nasarawa 31,683,313,129 31,683,313,129 31,683,313,129 31,683,313,129 126,733,252,516 Niger 10,355,957,077 10,355,957,077 10,355,957,077 10,355,957,077 41,423,828,308 Ogun . . . 48,580,000,000 48,580,000,000 Ondo . . . . 0 Osun . . . . 0 Oyo . . . . 0 Plateau . . . 31,879,064,838 31,879,064,838 Rivers . . . . 0 Sokoto Taraba 766,000,000 . . . 766,000,000 Yobe 38,000,000,000 Zamfara . . . . 0 FCT . . . . 0 TOTAL 184,105,409,013 176,904,461,789 214,404,332,057 423,953,441,191 961,367,644,048

328
TABLE 4.6.7 (Contd) HEALTH STATISTICS 2006
` Finances
GRANTS FROM FEDERAL GOVT GRANTS FROM STATE GOVT STATE QTR 1 QTR 2 QTR 3 QTR 4 TOTAL QTR 1 QTR 2 QTR 3 QTR 4 TOTAL
Abia . . . . 0 . . . . 0 Adamawa . . . . 0 Akwa-Ibom . . . . 0 . . . . 0 Anambra . . . . 0 . . . . 0 Bauchi . . . . 0 . . . . 0 Bayesa . . . . 0 . . . . 0 Benue . . . . 0 . . . . 0 Borno . . . . 0 . . . . 0 Cross River 93,148,652 93,148,652 93,148,652 93,148,652 372,594,608 Delta . . . . 0 . . . . 0 Ebonyi . . . . 0 . . . . 0 Edo . . . . 0 . . . . 0 Ekiti . . . . 0 . . . . 0 Enugu . . . . 0 . . . . 0 Gombe . . . . 0 . . . . 0 Imo . . . . 0 . . . . 0 Jigawa . . . . 0 . . . . 0 Kaduna . . . . 0 . . . . 0 Kano . . . . 0 . . . . 0 Katsina . . . . 0 . . . . 0 Kebbi . . . . 0 . . . . 0 Kogi 30,000,000 30,000,000 30,000,000 30,000,000 120,000,000 69,000,000 69,000,000 69,000,000 69,000,000 276,000,000 Kwara . . . 50,000,000 50,000,000 . . . 21,141,021 21,141,021 Lagos . . . . 0 . . . . 0 Nasarawa 15,598,494,483 15,598,494,483 15,598,494,483 15,598,494,483 62,393,977,932 . . . . 0 Niger . . . . 0 . . . . 0 Ogun . . . . 0 . . . . 0 Ondo . . . . 0 . . . . 0 Osun . . . . 0 . . . . 0 Oyo . . . . 0 . . . . 0 Plateau . . . . 0 . . . . 0 Rivers . . . . 0 . . . . 0 Sokoto . . . . 0 . . . . 0 Taraba . . . 26,711,199 . . . Yobe . . . . 0 . . . . 0 Zamfara . . . . 0 . . . . 0 FCT . . . . 0 . . . . 0 TOTAL 15,628,494,483 15,628,494,483 15,628,494,483 15,678,494,483 62,563,977,932 188,859,851 162,148,652 162,148,652 183,289,673 669,735,629

329
TABLE 4.6.8 HEALTH STATISTICS 2006 ` Compensation of Employees
WAGES AND SALARIES OTHER BENEFITS OTHER COMPENSATIONS STATE QTR
1 QTR
2 QTR
3 QTR
4 TOTAL QTR
1 QTR
2 QTR
3 QTR
4 TOTAL QTR
1 QTR
2 QTR
3 QTR
4 TOTAL
Abia . . . . 0 . . . . 0 . . . 0 0
Adamawa 22,098,883 19,680,379 19,453,160 19,453,160 80,685,582 . . . . 0 . . . 0 0 Akwa-Ibom . . . . 0 . . . . 0 . . . . 0 Anambra . . . . 0 . . . . 0 . . . 0 0
Bauchi 218,885,284 651,328,485 905,183,070 1,111,609,941 2,887,006,780 . . . . 0 . . . 0 0
Bayesa . . . . 0 . . . . 0 . . . . 0
Benue . . . . 0 . . . . 0 . . . 0 0
Borno . . . . 0 . . . . 0 . . . . 0
C/ River . . . . 0 . . . . 0 . . . 0 0
Delta . . . . 0 . . . . 0 . . . 0 0
Ebonyi . . . . 0 . . . . 0 . . . 0 0
Edo . . . . 0 . . . . 0 . . . . 0
Ekiti . . . . 0 . . . . 0 . . . 0 0
Enugu . . . . 0 . . . . 0 . . . 0 0
Gombe 800,000,000 . . . 800,000,000 . . . . 0 . . . 0 0
Imo . . . . 0 . . . . 0 . . . 0 0
Jigawa . . . . 0 . . . . 0 . . . . 0
Kaduna . . . . 0 . . . . 0 . . . 0 0
Kano . . . 79,441,182 79,441,182 . . . . 0 . . . 0 0
Katsina . . . . 0 . . . . 0 . . . . 0
Kebbi 129,471,297 152,342,051 157,264,623 163,941,698 603,019,669 . . . . 0 . . . 0 0
Kogi 29,871,110 32,635,650 31,920,827 31,995,315 126,422,902 . . . . 0 . . . 0 0
Kwara . . . 505,706,676 505,706,676 . . . 221,050,000 221,050,000 . . . 0 0
Lagos . . . . 0 . . . . 0 . . . . 0
Nasarawa 85,557,730 85,557,730 855,577,730 85,557,730 1,112,250,920 . . . . 0 . . . 0 0
Niger . . . . 0 . . . . 0 . . . 0 0
Ogun . . . . 0 . . . . 0 . . . 0 0
Ondo . . . . 0 . . . . 0 . . . . 0
Osun . . . . 0 . . . . 0 . . . 0 0
Oyo . . . . 0 . . . . 0 . . . 0 0
Plateau . . . . 0 . . . . 0 . . . 0 0
Rivers . . . . 0 . . . . 0 . . . . 0
Sokoto . . . . 0 . . . . 0 . . . 0 0
Taraba 758,672,063 . . . 758,672,063 . . . . 0 . . . 0 0
Yobe 132,885,000 132,885,000 153,850,000 153,850,000 573,470,000 18,854,500 23,122,500 315,000,000 . 356,977,000 . . . 0 0
Zamfara . . . . 0 . . . . 0 . . . . 0
FCT . . . . 0 . . . . 0 . . . . 0
TOTAL 2,177,441,367 1,074,429,295 2,123,249,410 2,151,555,702 7,526,675,774 TOTAL 23,122,500 315,000,000 221,050,000 578,027,000 0 0

330
TABLE 4.6.9 HEALTH STATISTICS 2006 ` Capital Expenditure by Type
MACHINERY AND EQUIPMENT TRANSPORT EQUIPMENT STATE
QTR 1 QTR 2 QTR 3 QTR 4 TOTAL QTR 1 QTR 2 QTR 3 QTR 4 TOTAL Abia . . . . 0 . . . . 0 Adamawa . 25,307,760 . . 25,307,760 . . 3,700,000 . 3,700,000 Akwa-Ibom . . . . 0 . . . . 0 Anambra . . . . 0 . . . . 0 Bauchi . 8,778,024 555,322,713 558,600,213 1,122,700,950 Bayesa . . . . 0 . . . . 0 Benue . . . . 0 . . . . 0 Borno . . . . 0 . . . . 0 Cross River . . . . 0 . . . . 0 Delta . . . . 0 . . . . 0 Ebonyi . . . . 0 . . . . 0 Edo . . . . 0 . . . . 0 Ekiti . . . . 0 . . . . 0 Enugu . . . . 0 . . . . 0 Gombe 100,000,000 . . . 100,000,000 . . . Imo . . . . 0 . . . . 0 Jigawa . . . . 0 . . . . 0 Kaduna . . . . 0 . . . . 0 Kano . . . . 0 . . . . 0 Katsina . . . . 0 . . . . 0 Kebbi 56,646,436 . 76,521,214 83,564,782 216,732,432 15,100,000 . . . 15,100,000 Kogi 301,533,333 301,533,333 301,533,333 301,533,333 1,206,133,332 0 Kwara . . . . 0 . . . . 0 Lagos . . . . 0 . . . . 0 Nasarawa . . . . 0 . . . . 0 Niger . . . . 0 . . . . 0 Ogun . . . . 0 . . . . 0 Ondo . . . . 0 . . . . 0 Osun . . . . 0 . . . . 0 Oyo . . . . 0 . . . . 0 Plateau . . . . 0 . . . . 0 Rivers . . . . 0 . . . . 0 Sokoto . . . . 0 . . . . 0 Taraba . . . . 0 . . . . 0 Yobe . . 22,719,200 4,533,000 27,252,200 . . . 0 Zamfara . . . . 0 . . . . 0 FCT . . . . 0 . . . . 0 TOTAL 458,179,769 335,619,117 956,096,460 948,231,328 2,698,126,674 15,100,000 0 3,700,000 0 18,800,000
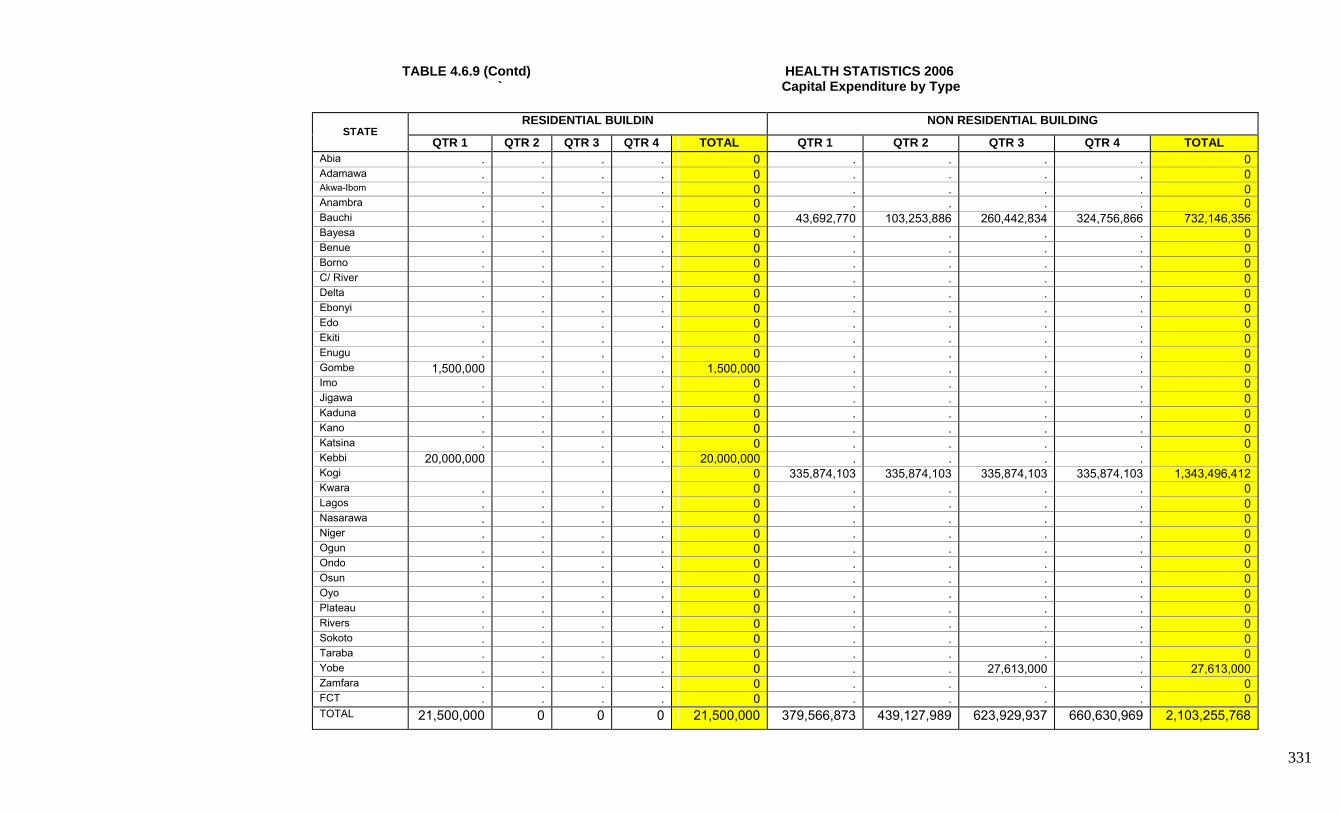
331
TABLE 4.6.9 (Contd) HEALTH STATISTICS 2006 ` Capital Expenditure by Type
RESIDENTIAL BUILDIN NON RESIDENTIAL BUILDING
STATE QTR 1 QTR 2 QTR 3 QTR 4 TOTAL QTR 1 QTR 2 QTR 3 QTR 4 TOTAL
Abia . . . . 0 . . . . 0 Adamawa . . . . 0 . . . . 0 Akwa-Ibom . . . . 0 . . . . 0 Anambra . . . . 0 . . . . 0 Bauchi . . . . 0 43,692,770 103,253,886 260,442,834 324,756,866 732,146,356 Bayesa . . . . 0 . . . . 0 Benue . . . . 0 . . . . 0 Borno . . . . 0 . . . . 0 C/ River . . . . 0 . . . . 0 Delta . . . . 0 . . . . 0 Ebonyi . . . . 0 . . . . 0 Edo . . . . 0 . . . . 0 Ekiti . . . . 0 . . . . 0 Enugu . . . . 0 . . . . 0 Gombe 1,500,000 . . . 1,500,000 . . . . 0 Imo . . . . 0 . . . . 0 Jigawa . . . . 0 . . . . 0 Kaduna . . . . 0 . . . . 0 Kano . . . . 0 . . . . 0 Katsina . . . . 0 . . . . 0 Kebbi 20,000,000 . . . 20,000,000 . . . . 0 Kogi 0 335,874,103 335,874,103 335,874,103 335,874,103 1,343,496,412 Kwara . . . . 0 . . . . 0 Lagos . . . . 0 . . . . 0 Nasarawa . . . . 0 . . . . 0 Niger . . . . 0 . . . . 0 Ogun . . . . 0 . . . . 0 Ondo . . . . 0 . . . . 0 Osun . . . . 0 . . . . 0 Oyo . . . . 0 . . . . 0 Plateau . . . . 0 . . . . 0 Rivers . . . . 0 . . . . 0 Sokoto . . . . 0 . . . . 0 Taraba . . . . 0 . . . . 0 Yobe . . . . 0 . . 27,613,000 . 27,613,000 Zamfara . . . . 0 . . . . 0 FCT . . . . 0 . . . . 0 TOTAL 21,500,000 0 0 0 21,500,000 379,566,873 439,127,989 623,929,937 660,630,969 2,103,255,768
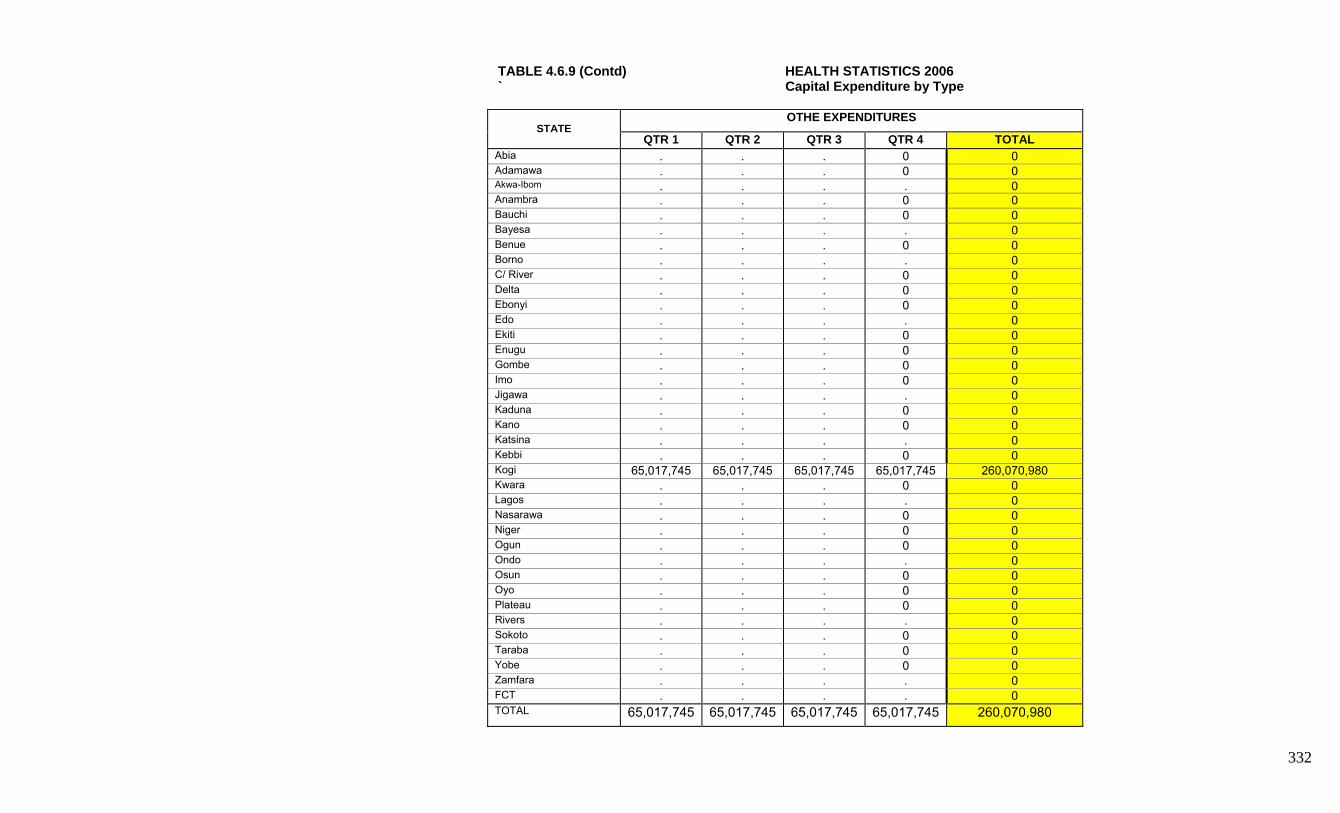
332
TABLE 4.6.9 (Contd) HEALTH STATISTICS 2006 ` Capital Expenditure by Type
OTHE EXPENDITURES STATE
QTR 1 QTR 2 QTR 3 QTR 4 TOTAL Abia . . . 0 0 Adamawa . . . 0 0 Akwa-Ibom . . . . 0 Anambra . . . 0 0 Bauchi . . . 0 0 Bayesa . . . . 0 Benue . . . 0 0 Borno . . . . 0 C/ River . . . 0 0 Delta . . . 0 0 Ebonyi . . . 0 0 Edo . . . . 0 Ekiti . . . 0 0 Enugu . . . 0 0 Gombe . . . 0 0 Imo . . . 0 0 Jigawa . . . . 0 Kaduna . . . 0 0 Kano . . . 0 0 Katsina . . . . 0 Kebbi . . . 0 0 Kogi 65,017,745 65,017,745 65,017,745 65,017,745 260,070,980 Kwara . . . 0 0 Lagos . . . . 0 Nasarawa . . . 0 0 Niger . . . 0 0 Ogun . . . 0 0 Ondo . . . . 0 Osun . . . 0 0 Oyo . . . 0 0 Plateau . . . 0 0 Rivers . . . . 0 Sokoto . . . 0 0 Taraba . . . 0 0 Yobe . . . 0 0 Zamfara . . . . 0 FCT . . . . 0 TOTAL 65,017,745 65,017,745 65,017,745 65,017,745 260,070,980

333
TABLE 4.6.10a HEALTH STATISTICS 2006 ` Information and Communication Technology
Percent
Establisment owning internet facilities 68.0
Establishment having website 17.4
Establishment receiving orders through the internet 29.2
Placement of orders through the internet 29.2
Etablishment having intrarnets 36.4
Establishments having Local Area Networks (LAN) 21.7

334
TABLE 4.6.10b HEALTH STATISTICS 2006 ` Information and Communication Technology
STATE Number of Computers in your Organisations
Number of Employees with access to Internet Facilitie
Number of employee using Personal
Computers (PCs)
Investment on ICT from Foreign sources during
the year (USD) Amount Spend on ICT during the year (Naira)
Abia 19 . 7 . . Adamawa 13 6 9 . . Akwa-Ibom . . . . . Anambra 43 3 43 . . Bauchi 17 . 30 . . Bayesa . . . . . Benue 20 . 20 . . Borno . . . . . Cross River 17 30 17 . . Delta 29 37 28 . . Ebonyi 1 1 1 . . Edo . . . . . Ekiti . . . . . Enugu 22 10 5 . . Gombe 65 5 8 . . Imo 11 . 1 . . Jigawa . . . . . Kaduna 16 192 12 . 0 Kano 23 . 4 . 0 Katsina . . . . . Kebbi 12 8 . . . Kogi 28 25 . . . Kwara . . . . . Lagos . . . . . Nasarawa 10 . 7 . 0 Niger 8 . 8 . . Ogun 39 . . 3,969 . Ondo . . . . . Osun . 4 . . . Oyo 10 . 5 . . Plateau 6 . 6 . 0 Rivers . . . . . Sokoto 26 . . . . Taraba 22 100 20 . . Yobe 6 11 23 . . Zamfara . . . . . FCT . . . . . TOTAL 463 432 254 3,969 0

335
TABLE 4.7.1 EDUCATION STATISTICS
Educational Institutions, (Public)
Primary
Secondary Tech &
Vocational College of Education
Polytechnics/Col of Tech
University
Others
STATE
2005 2006 2005 2006 2005 2006 2005 2006 2005 2006 2005 2006 2,005 2,006 Abia 770 793 198 208 22 22 1 1 1 1 2 2 . . Adamawa 1,727 1,684 217 411 13 13 1 1 1 1 1 1 1 1 Akwa-Ibom 1,100 1,136 238 238 6 6 1 1 2 2 1 1 . . Anambra . . . . . . . . . . . . . . Bauchi . . 192 234 9 11 1 1 3 3 1 1 1 1 Bayesa 535 544 148 168 7 7 . . . . 1 1 3 3 Benue 2,635 2,635 739 740 4 4 2 2 2 2 1 1 2 2 Borno 1,275 1,275 81 81 8 8 1 1 1 1 1 1 1 1 Cross River 967 1,031 228 230 19 19 1 1 . . 2 2 . . Delta . . . . . . . . . . . . . . Ebonyi 911 919 158 161 5 5 1 1 1 1 1 1 1 1 Edo 1,068 1,100 337 347 2 2 3 3 2 2 2 2 . . Ekiti 734 734 407 407 4 4 1 1 1 1 1 1 15 15 Enugu 1,158 1,158 284 298 7 7 1 2 1 1 2 2 . . Gombe 1,336 1,436 113 257 16 16 . . . . . . 0 . Imo . 1,260 . 310 . 4 . 1 . 3 . 2 1 . Jigawa 2,956 3,051 853 869 11 11 3 2 8 7 3 3 . . Kaduna 3,335 3,196 336 283 4 4 1 1 1 1 1 1 0 . Kano 3,785 3,795 452 516 7 7 3 3 1 1 2 2 . . Katsina 1,958 2,158 129 263 9 5 2 2 1 1 0 1 . . Kebbi 1,330 1,474 187 75 2 2 1 1 1 1 . . 1 1 Kogi 2,068 2,171 310 326 4 4 2 2 2 2 1 1 0 . Kwara 1,241 1,466 236 320 5 5 3 3 2 2 1 1 5 5 Lagos . . . . . . 2 2 1 1 1 1 . . Nasarawa 1,120 . 213 . 7 . 1 . 1 . 1 . . 1 Niger . 2,628 . 363 . 11 . 2 . 5 . 2 . . Ogun 1,356 1,368 448 457 7 7 2 1 6 5 3 3 . . Ondo . . . . . . . . . . . . . . Osun 1,287 1,287 350 557 9 9 2 2 2 2 2 2 4 4 Oyo 1,783 2,009 768 890 5 5 1 1 1 1 1 2 . . Plateau 1,686 1,686 580 580 1 1 2 2 1 1 1 1 8 8 Rivers 1,261 1,354 245 263 4 4 2 2 1 1 2 2 . . Sokoto 1,608 1,608 75 180 7 18 1 1 1 1 1 1 0 . Taraba 1,492 1,492 268 268 7 7 1 1 1 1 . . . . Yobe 961 961 42 42 13 13 1 1 6 6 1 1 . . Zamfara 1,109 1,109 135 135 1 1 2 2 4 4 . . . . FCT . . . . . . . . . . . . . . TOTAL 44,552 48,518 8,967 10,477 225 242 46 47 56 61 37 42 43 43

336
TABLE 4.7.1 (Contd) EDUCATION STATISTICS
Educational Institutions, (Private)
Primary Secondary Tech & Vocational
College of Education
Polytechnics/Col of Tech
University Others STATE
2005 2006 2005 2006 2005 2006 2005 2006 2005 2006 2005 2006 2006 2005 Abia 560 568 149 220 . . . . . . . . 0 . Adamawa 223 245 27 51 1 . . . . . 1 1 0 . Akwa-Ibom 400 801 167 242 1 1 . . . . . . 0 . Anambra . . . . . . . . . . . . . . Bauchi 49 60 52 71 1 1 . . . . . . 0 . Bayesa 80 80 20 20 . . . . . . . . 0 . Benue 2,860 2,870 598 620 6 6 1 1 1 1 1 1 0 . Borno 121 76 29 34 . . . . . . . . 0 . Cross River 320 319 124 199 . . . . . . . . 0 . Delta . . . . . . . . . . . . . . Ebonyi 50 54 27 32 . . . . . . . . 0 . Edo 306 315 297 305 . . . . . . 1 1 0 . Ekiti 377 377 94 94 . . . . . . . . 0 . Enugu 592 592 123 123 . . 1 1 1 1 3 3 0 . Gombe 128 250 31 33 1 1 . . . . . . 0 . Imo . 301 . 156 . 291 . . . . . . 1 . Jigawa 759 1,039 201 198 . 1 . 1 . 1 7 7 0 . Kaduna . . . . . . . . . . . . 0 . Kano 322 378 153 191 . . . . . . . . 0 . Katsina 155 147 27 28 . . . . . . 1 1 0 . Kebbi 40 35 45 5 . . . . . . . . 0 . Kogi 225 236 120 123 . . . . . . . . 0 . Kwara 466 875 118 127 2 2 1 1 1 1 1 1 1 1 Lagos . . . . . . . . . . . . 0 . Nasarawa 426 . 69 . . . . . . . . . 0 . Niger . 210 . 53 . . . . . . . . 0 . Ogun 716 996 199 196 1 1 1 7 7 . . Ondo . . . . . . . . . . . . . . Osun 340 357 120 128 2 2 . 1 . 2 2 2 0 . Oyo 1,137 2,165 182 204 . . . . . . . . 0 . Plateau 388 388 335 335 . . 1 1 . . 1 1 0 . Rivers 220 313 185 201 1 1 . . . . . . 0 . Sokoto 66 66 6 6 . . . . . . . . 0 . Taraba 210 210 92 92 . . . . . . 1 1 0 . Yobe 30 30 10 10 . . . . . . . . 0 . Zamfara 48 48 21 21 . . . . . . . . 0 . FCT . . . . . . . . . . . . . . TOTAL 11,614 14,401 3,621 4,118 15 307 4 7 3 7 26 26 2 1

337
TABLE 4.7.2 EDUCATION STATISTICS
Number of Teachers (Public)
STATE Primary Secondary Tech & Vocational
College of Education
Polytechnics/Col of Tech
University Others
2005 2006 2005 2006 2005 2006 2005 2006 2005 2006 2005 2006 2005 2006 Abia 11,719 12,124 14,486 12,486 . . . . . . . . . . Adamawa 15,949 18,493 4,171 4,081 260 233 . 131 . . . . . . Akwa-Ibom 16,449 15,200 6,504 5,093 382 406 . . . . . . . . Anambra . . . . . . . . . . . . . . Bauchi 14,790 16,801 2,133 3,405 164 250 . . . . . . 255 262 Bayesa 5,328 5,495 1,704 2,362 229 229 . . . . 380 539 277 277 Benue 25,997 26,547 7,784 8,954 250 258 6,334 7,495 4,408 5,008 650 850 . . Borno 13,821 13,889 2,392 2,389 115 105 . . . . . . . . Cross River 16,642 14,318 3,319 5,409 367 463 . . . . . . . . Delta . . . . . . . . . . . . . . Ebonyi 11,376 11,569 2,019 2,029 . . . . . . . . . . Edo 10,416 10,728 5,076 5,228 650 701 1,889 1,430 221 258 7,281 7,499 454 467 Ekiti 8,856 8,856 12,426 12,426 98 98 321 321 . . . . . 0 Enugu 13,914 13,954 6,154 6,271 1,248 1,240 151 151 150 156 362 384 . . Gombe 11,438 13,500 2,031 2,599 253 359 . . . . . . . . Imo . 17,667 . 6,711 . 107 . 245 . . . 814 . . Jigawa 32,546 33,315 14,320 15,247 56 56 154 163 140 161 . . . . Kaduna 29,669 28,769 . . . . . . . . . . . 0 Kano 32,826 34,566 . . . . . . . . . . . . Katsina 4,598 5,533 2,940 4,290 219 261 . . . . . . . . Kebbi 2,154 10,852 2,866 3,529 92 107 88 101 205 215 . . . . Kogi 14,739 15,476 4,592 4,822 . 243 . . . . . . . . Kwara 16,703 18,460 4,699 4,839 80 94 . . . . . . . . Lagos 16,976 16,925 16,998 16,831 . . 423 . . . 640 640 . . Nasarawa 9,364 . 4,153 . 141 . 205 . 217 . 242 242 67 67 Niger . 22,413 . 5,033 . 432 . . . . . . . . Ogun 16,744 16,915 11,535 12,247 . . . . . . . . . . Ondo . . . . . . . . . . . . . . Osun 13,923 14,868 . . . . . . 300 373 . . . . Oyo 27,433 28,384 11,726 14,697 146 146 254 254 . . . . . . Plateau 17,957 18,855 3,153 5,773 . . . . . . . . . . Rivers 9,625 8,940 5,103 5,259 151 158 1,005 1,609 . . . . . . Sokoto 2,254 . 4,139 . . . . . . . . . . 0 Taraba 15,964 16,710 2,378 2,567 180 180 231 231 103 103 . . . . Yobe 961 961 278 278 13 13 1 1 6 6 1 1 . . Zamfara 8,317 8,317 2,956 2,956 65 65 . . . . . . . . FCT . . . . . . . . . . . . . . TOTAL 449,448 499,400 162,035 177,811 5,159 6,204 11,056 12,132 5,750 6,280 9,556 10,969 1,053 1,073

338
TABLE 4.7.2 (Contd) EDUCATION STATISTICS
No of Teachers (Private)
Primary Secondary Tech & Vocational
College of Education
Polytechnics/ Col of Tech
University Others STATE
2005 2006 2005 2006 2005 2006 2005 2006 2005 2006 2005 2006 2006 2005 Abia . . . . . . . . . . . . . 0 Adamawa . . . . . . . . . . . . . 0 Akwa-Ibom . . . . . . . . . . . . . 0 Anambra . . . . . . . . . . . . . . Bauchi . . 954 . 20 40 . . . . . . . 0 Bayesa 294 324 201 225 . . . . . . . . . 0 Benue 1,028 1,138 1,205 1,308 450 498 2,120 2,150 3,150 4,150 632 639 . 0 Borno 1,557 993 560 586 . . . . . . . . . 0 Cross River . . . . . . . . . . . . . 0 Delta . . . . . . . . . . . . . . Ebonyi 890 582 320 386 . . . . . . . . . 0 Edo 3,295 3,362 4,018 4,138 . . . . . . 106 109 . 0 Ekiti . . . . . . . . . . . . . 0 Enugu 1,354 1,356 1,678 1,672 241 241 132 132 28 34 35 116 . 0 Gombe 3,250 4,310 588 416 20 20 . . . . . . . 0 Imo . 5,359 . 2,128 . . . . . . . . . 0 Jigawa 256 269 36 40 . . . . . . . . . 0 Kaduna . . . . . . . . . . . . . 0 Kano 7,012 10,513 3,601 4,284 . . . . . . . . . 0 Katsina . . . . . . . . . . . . 0 Kebbi . . . . . . . . . . . . . 0 Kogi 1,471 1,545 1,164 1,222 . . . . . . . . . 0 Kwara . 3,381 . 613 . . . . . . . . . 0 Lagos 33,018 . 3,184 . . . . . . . . . . 0 Nasarawa . . . . . . . . . . . . . 0 Niger . . . . . . . . . . . . . 0 Ogun . . . . . . . . . . . . . . Ondo . . . . . . . . . . . . . . Osun 35,037 35,147 . . . . . . . . . . . 0 Oyo 7,346 8,565 2,211 2,422 . . . . . . . . . 0 Plateau . . 2,888 3,032 . . . . . . . . . 0 Rivers 3,563 3,638 1,130 1,242 102 161 . . . . . . . 0 Sokoto . . . . . . . . . . . . . 0 Taraba 183 183 92 92 . . . . . . . . . 0 Yobe 30 30 10 10 . . . . . . . . . 0 Zamfara . . . . . . . . . . . . . 0 FCT . . . . . . . . . . . . . . TOTAL 99,584 80,695 23,840 23,816 833 960 2,252 2,282 3,178 4,184 773 864 0 0
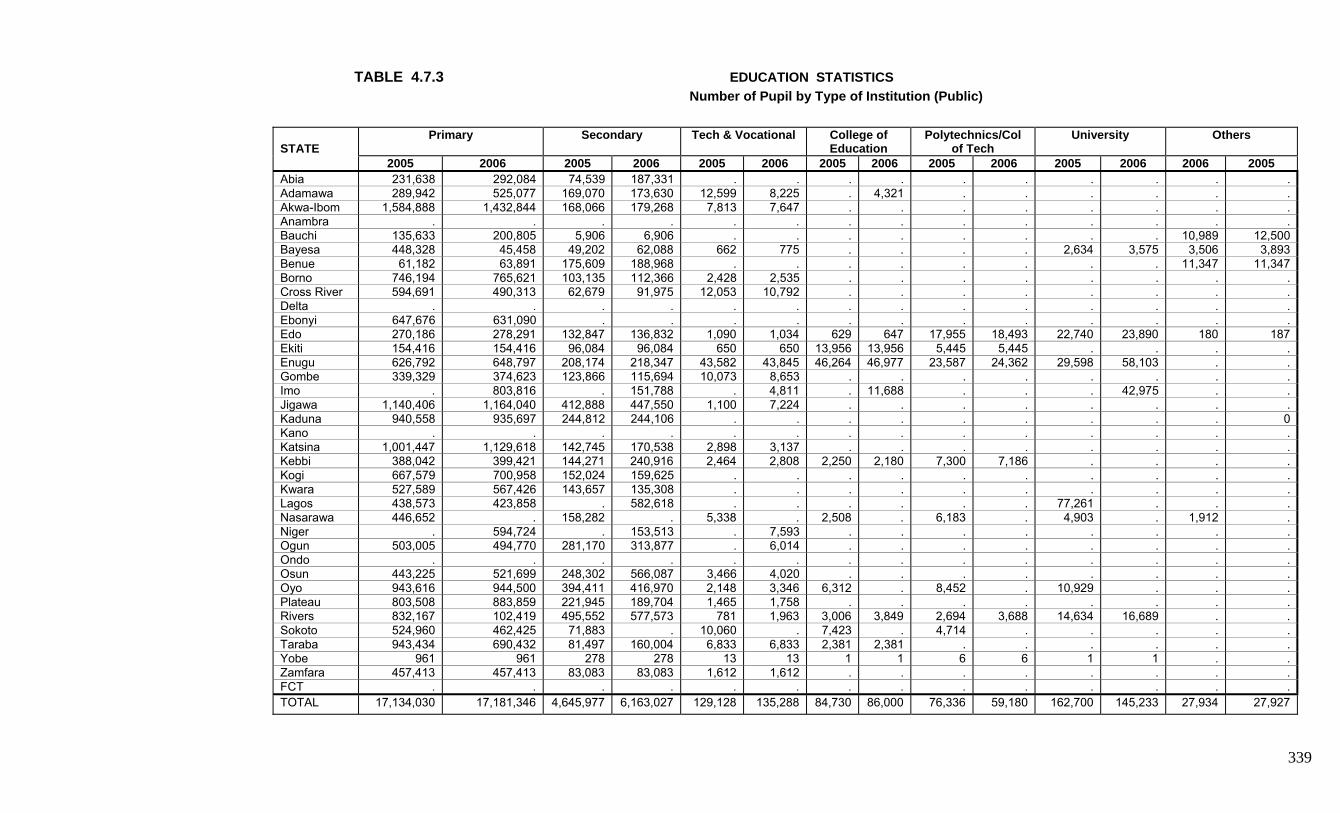
339
TABLE 4.7.3 EDUCATION STATISTICS
Number of Pupil by Type of Institution (Public)
Primary Secondary Tech & Vocational College of Education
Polytechnics/Col of Tech
University Others STATE
2005 2006 2005 2006 2005 2006 2005 2006 2005 2006 2005 2006 2006 2005 Abia 231,638 292,084 74,539 187,331 . . . . . . . . . . Adamawa 289,942 525,077 169,070 173,630 12,599 8,225 . 4,321 . . . . . . Akwa-Ibom 1,584,888 1,432,844 168,066 179,268 7,813 7,647 . . . . . . . . Anambra . . . . . . . . . . . . . . Bauchi 135,633 200,805 5,906 6,906 . . . . . . . . 10,989 12,500 Bayesa 448,328 45,458 49,202 62,088 662 775 . . . . 2,634 3,575 3,506 3,893 Benue 61,182 63,891 175,609 188,968 . . . . . . . . 11,347 11,347 Borno 746,194 765,621 103,135 112,366 2,428 2,535 . . . . . . . . Cross River 594,691 490,313 62,679 91,975 12,053 10,792 . . . . . . . . Delta . . . . . . . . . . . . . . Ebonyi 647,676 631,090 . . . . . . . . . . . . Edo 270,186 278,291 132,847 136,832 1,090 1,034 629 647 17,955 18,493 22,740 23,890 180 187 Ekiti 154,416 154,416 96,084 96,084 650 650 13,956 13,956 5,445 5,445 . . . . Enugu 626,792 648,797 208,174 218,347 43,582 43,845 46,264 46,977 23,587 24,362 29,598 58,103 . . Gombe 339,329 374,623 123,866 115,694 10,073 8,653 . . . . . . . . Imo . 803,816 . 151,788 . 4,811 . 11,688 . . . 42,975 . . Jigawa 1,140,406 1,164,040 412,888 447,550 1,100 7,224 . . . . . . . . Kaduna 940,558 935,697 244,812 244,106 . . . . . . . . . 0 Kano . . . . . . . . . . . . . . Katsina 1,001,447 1,129,618 142,745 170,538 2,898 3,137 . . . . . . . . Kebbi 388,042 399,421 144,271 240,916 2,464 2,808 2,250 2,180 7,300 7,186 . . . . Kogi 667,579 700,958 152,024 159,625 . . . . . . . . . . Kwara 527,589 567,426 143,657 135,308 . . . . . . . . . . Lagos 438,573 423,858 . 582,618 . . . . . . 77,261 . . . Nasarawa 446,652 . 158,282 . 5,338 . 2,508 . 6,183 . 4,903 . 1,912 . Niger . 594,724 . 153,513 . 7,593 . . . . . . . . Ogun 503,005 494,770 281,170 313,877 . 6,014 . . . . . . . . Ondo . . . . . . . . . . . . . . Osun 443,225 521,699 248,302 566,087 3,466 4,020 . . . . . . . . Oyo 943,616 944,500 394,411 416,970 2,148 3,346 6,312 . 8,452 . 10,929 . . . Plateau 803,508 883,859 221,945 189,704 1,465 1,758 . . . . . . . . Rivers 832,167 102,419 495,552 577,573 781 1,963 3,006 3,849 2,694 3,688 14,634 16,689 . . Sokoto 524,960 462,425 71,883 . 10,060 . 7,423 . 4,714 . . . . . Taraba 943,434 690,432 81,497 160,004 6,833 6,833 2,381 2,381 . . . . . . Yobe 961 961 278 278 13 13 1 1 6 6 1 1 . . Zamfara 457,413 457,413 83,083 83,083 1,612 1,612 . . . . . . . . FCT . . . . . . . . . . . . . . TOTAL 17,134,030 17,181,346 4,645,977 6,163,027 129,128 135,288 84,730 86,000 76,336 59,180 162,700 145,233 27,934 27,927

340
TABLE 4.7.3(Contd) EDUCATION STATISTICS
Number of Pupil by Type of Institution (Private) STATE Primary Secondary Tech & Vocational College of
Education Polytechnics/Col
of Tech University Others
2005 2006 2005 2006 2005 2006 2005 2006 2005 2006 2005 2006 2006 2005 Abia . . . . . . . . . . . . . 0 Adamawa 24,658 24,658 2,116 316 60 70 . . . . . . . 0 Akwa-Ibom 70,513 82,804 55,814 55,886 . . . . . . . . . 0 Anambra . . . . . . . . . . . . . . Bauchi . 301,260 24,138 46,596 428 7,780 . . . . . . . 0 Bayesa 31,776 40,682 25,693 28,388 . . . . . . . . . 0 Benue 571,516 748,179 45,941 107,832 1,590 25,102 . . . . . . . 0 Borno 41,361 14,707 10,214 10,871 . . . . . . . . . 0 Cross River . . . . . . . . . . . . . 0 Delta . . . . . . . . . . . . . . Ebonyi 26,842 . 23,201 . . . . . . . . . . 0 Edo 54,667 56,307 71,429 73,571 . . . . . . 742 764 210 229 Ekiti 10,643 10,643 9,757 9,757 . . . . . . . . . 0 Enugu 190,068 232,305 48,688 49,367 . . 2,048 2,637 3,001 3,050 12,000 12,000 . 0 Gombe 5,229 6,230 11,055 10,346 60 120 . . . . . . . 0 Imo . 387,313 . 43,873 . . . . . . . . . 0 Jigawa 10,233 10,383 1,801 1,801 . . . . . . . . . 0 Kaduna . . . . . . . . . . . . . 0 Kano . . . . . . . . . . . . . 0 Katsina . . . . . . . . . . . . . 0 Kebbi . . . . . . . . . . . . . 0 Kogi 29,629 31,110 . . . . . . . . . . . 0 Kwara 57,973 100,639 7,352 7,727 . . . . . . . . . 0 Lagos 990,018 1,070,226 74,765 83,542 . . . . . . . . . 0 Nasarawa . . . . . . . . . . . . . 0 Niger . . . . . . . . . . . . . 0 Ogun . . . . . . . . . . . . . . Ondo . . . . . . . . . . . . . . Osun 35,037 35,147 . . . . . . . . . . . 0 Oyo . . . . . . . . . . . . . 0 Plateau . . 46,114 50,725 . . . . . . . . . 0 Rivers 415,203 503,124 246,489 349,763 203,112 163,419 . . . . . . . 0 Sokoto . . 963 . . . . . . . . . . 0 Taraba 40,866 50,223 25,947 31,164 . . . . . . . . . 0 Yobe . . . . . . . . . . . . . 0 Zamfara . . . . . . . . . . . . . 0 FCT . . . . . . . . . . . . . . TOTAL 2,606,232 3,705,940 731,477 961,525 205,250 196,491 2,048 2,637 3,001 3,050 12,742 12,764 210 229

341
TABLE 4.7.4 EDUCATION STATISTICS
Sources of Fund
State Govt Budgetary Allocation to Education Sector
State Govt Annual Budget State Govt Actual Allocation to Education Sector
Grants From Fed Govt Grants From Foreign Dev artner
Grants From NGOs & Others
STATE 2005 2006 2005 2006 2005 2006 2005 2006 2005 2006 2006 2005 Abia . . . . . . . . . . . .
Adamawa 117,159,075 219,267,375 . . 259,525,385 302,762,651 . . . . . .
Akwa-Ibom 10,880,000,000 4,428,000,000 83,280,000,000 . 2,307,000,000 . 2,307,000,000 . . . . .
Anambra . . . . . . . . . . . .
Bauchi . . . . . . . . . . . .
Bayesa 4,459,825,856 5,398,266,062 11,624,008,999 12,907,860,862 1,484,577,321 1,498,565,425 . . . . . .
Benue . . . . . . . . . . . .
Borno 5,237,822,890 9,549,107,000 38,737,838,500 48,464,344,000 885,740,063 1,669,707,137 . 39,150,000 . . . 184,000
Cross River 5,000,000,000 5,800,000,000 35,900,000,000 23,582,148,000 300,650,200 . . . 801,355 . . .
Delta . . . . . . . . . . . .
Ebonyi 1,200,000,000 2,000,000,000 1,040,000,000 6,241,000,000 . . 60,000,000 21,000,000 . . . .
Edo 7,840,469,000 . 51,201,000,000 . 1,851,200,000 . . . . . . .
Ekiti 328,100,000 885,452,382 20,954,415,902 26,196,908,840 287,741,230 165,398,251 13,196,257,271 17,373,667,816 650,000,000 650,000,000 . .
Enugu . 963,019,040 . . . . . . . . . .
Gombe 3,800,000,000 3,800,000,000 28,900,000,000 37,000,000,000 . . . . . . . .
Imo . 6,805,144,662 . 37,000,000,000 . . . . . . . .
Jigawa . . 48,548,300,000 . 6,007,636,000 5,688,763,000 . . . . . .
Kaduna 62,225,949,330 48,272,366,020 . . 8,383,070,345 7,740,655,220 . . . . . .
Kano 3,455,000,000 3,600,000,000 41,691,274,140 49,991,000,000 . . . . . . . .
Katsina 31,711,058,105 40,304,753,470 . . 6,338,170,000 7,930,306,445 . . . . . .
Kebbi 8,571,974,004 6,966,900,000 . . 8,571,977,004 6,966,900,000 . . . . . .
Kogi 1,659,565,246 1,785,000,000 31,314,403,414 33,915,253,950 . 1,737,158,098 . . . . . .
Kwara . . . . . . . . . . . .
Lagos 1,150,000,000 1,150,000,000 . . . . . . . . . .
Nasarawa . 3,516,753,561 . 29,052,313,129 . 3,194,241,512 . . . . . .
Niger . 6,356,435,834 . 42,423,828,311 . 878,652,030 . . . . . .
Ogun . . . 48,584,300,000 . . . . . . . .
Ondo . . . . . . . . . . . .
Osun 4,588,920 4,752,150 . . . . . . . . . .
Oyo 1,641,445,158 3,521,215,118 56,576,432,175 60,798,055,786 . . . . . . . .
Plateau 3,739,245,680 . 29,180,048,405 . . . . . . . . .
Rivers 8,015,178,275 8,614,951,327 96,750,000,000 168,030,823,470 . . . . . . . .
Sokoto 5,137,925,495 6,082,690,409 32,373,388,000 41,025,500,500 . . . . . . . .
Taraba 240,000,000 121,101,993 . . . . . . . . . .
Yobe . . . . . . . . . . . .
Zamfara . . . . . . . . . . . .
FCT . . . . . . . . . . . .
TOTAL 166,415,307,034 170,145,176,403 608,071,109,535 665,213,336,848 36,677,287,548 37,773,109,769 15,563,257,271 17,433,817,816 650,801,355 650,000,000 0 184,000

342
TABLE 4.7.5 EDUCATION STATISTICS
Cost of Operation Electricity, Fuel bills Repairs &
Maintenance Consumables Wages & Salaries Other Benefits Other Costs STATE
2005 2006 2005 2006 2005 2006 2005 2006 2005 2006 2006 2005 Abia . . . . . . . . . . . . Adamawa 2,279 8,175 2,403 4,182 . . 46,214,575 48,159,075 . . . . Akwa-Ibom . . . . . . 130,100,000 150,139,564 . . . . Anambra . . . . . . . . . . . . Bauchi . . . . . . 804,916,680 . . . . . Bayesa . . 3,310 3,110 . . 3,135,195,856 3,924,846,082 . . 1,291,530,000 1,443,820,000 Benue . . . . . . . . . . . . Borno 3,140 3,000 9,500 9,500 . . 1,797,022,690 2,534,645 . . . . C/ River . . . . . . 87,132,230 106,245,550 . . . . Delta . . . . . . . . . . . . Ebonyi . . . . . . . . . . . . Edo . . . . . . . . . . . . Ekiti 7,595,215 4,538,010 1,462 1,256 3,999 2,917 2,287,417,380 2,771,838,050 520,979,430 1,212,328,048 Enugu 1,000 1,910 1,000 1,910 1,000 1,910 77,757,325 74,008,161 . . . . Gombe . . . . . . 1,000,000,000 900,000,000 . . . . Imo . . . . . . . . . . . . Jigawa . . . . . 0 3,419,952,760 3,669,015,139 . . . . Kaduna . . . . . . 2,388,661,400 . 238,866,140 . . . Kano . . . . . . . . . . . . Katsina . . . . . . . . . . . . Kebbi . . . . . . . . . . . . Kogi . . . . . . 82,703,959 85,620,748 . . . . Kwara . . 1,521 1,500 2,000 2,300 91,085,278 95,782,753 . . . . Lagos . . . . . . . . . . . . Nasarawa 1,265 . 6,065 . . . 1,030,699,585 . . . . . Niger . . . . . . . . . . . . Ogun . . . . . . . . . . . . Ondo . . . . . . . . . . . . Osun . . . . . . . . . . . . Oyo . . . . . . 185,409,715 212,031,157 14,066,928 17,293,762 . . Plateau . . . . . . . . . . . . Rivers 6,026 4,967 8,165 6,596 . . 13,603,661 12,664,219 . . . . Sokoto . . . . . . . . . . . . Taraba . . . . . . 7,581,167,618 7,581,167,620 . . . . Yobe . . . . . . . . . . . . Zamfara . . . . . . . . . . . . FCT . . . . . . . . . . . . TOTAL 7,608,925 4,556,062 33,426 28,054 6,999 7,127 24,159,040,712 19,634,052,763 773,912,498 1,229,621,810 1,291,530,000 1,443,820,000
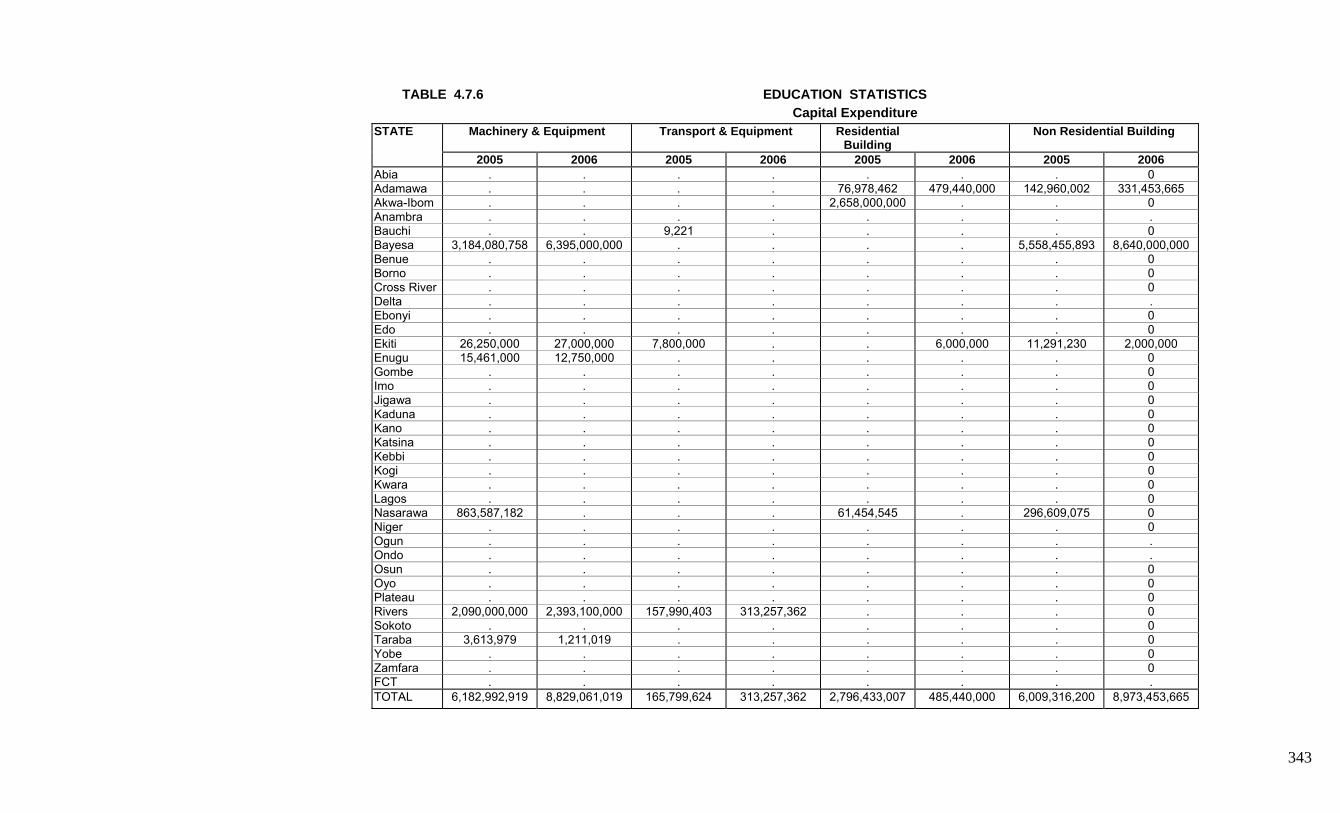
343
TABLE 4.7.6 EDUCATION STATISTICS
Capital Expenditure Machinery & Equipment Transport & Equipment Residential
Building Non Residential Building STATE
2005 2006 2005 2006 2005 2006 2005 2006 Abia . . . . . . . 0 Adamawa . . . . 76,978,462 479,440,000 142,960,002 331,453,665 Akwa-Ibom . . . . 2,658,000,000 . . 0 Anambra . . . . . . . . Bauchi . . 9,221 . . . . 0 Bayesa 3,184,080,758 6,395,000,000 . . . . 5,558,455,893 8,640,000,000 Benue . . . . . . . 0 Borno . . . . . . . 0 Cross River . . . . . . . 0 Delta . . . . . . . . Ebonyi . . . . . . . 0 Edo . . . . . . . 0 Ekiti 26,250,000 27,000,000 7,800,000 . . 6,000,000 11,291,230 2,000,000 Enugu 15,461,000 12,750,000 . . . . . 0 Gombe . . . . . . . 0 Imo . . . . . . . 0 Jigawa . . . . . . . 0 Kaduna . . . . . . . 0 Kano . . . . . . . 0 Katsina . . . . . . . 0 Kebbi . . . . . . . 0 Kogi . . . . . . . 0 Kwara . . . . . . . 0 Lagos . . . . . . . 0 Nasarawa 863,587,182 . . . 61,454,545 . 296,609,075 0 Niger . . . . . . . 0 Ogun . . . . . . . . Ondo . . . . . . . . Osun . . . . . . . 0 Oyo . . . . . . . 0 Plateau . . . . . . . 0 Rivers 2,090,000,000 2,393,100,000 157,990,403 313,257,362 . . . 0 Sokoto . . . . . . . 0 Taraba 3,613,979 1,211,019 . . . . . 0 Yobe . . . . . . . 0 Zamfara . . . . . . . 0 FCT . . . . . . . . TOTAL 6,182,992,919 8,829,061,019 165,799,624 313,257,362 2,796,433,007 485,440,000 6,009,316,200 8,973,453,665

344
TABLE 4.7.7 EDUCATION STATISTICS Information Communication Technology
Percent
Establisment owning internet facilities 45.5
Establishment having website 30.3
Establishment receiving orders through the internet 30.3
Do you place orders through the internet 24.2
Etablishment having intrarnets 27.3

345
TABLE 4.7.8 EDUCATION STATISTICS Information Communication Technology
STATE
Number of computers in your
organizations
Number of employees with access to internet facilitie
Number of employee using Personal
Computers (PCs)
Investment on ICT from domestics
sources during the year (Naira)
Investment on ICT from foreign sources during
the year (USD)
Amount spend on ICT during the year
(Naira)
Abia 1 0 0 0 0 0 Adamawa 8 0 8 0 0 0 Akwa-Ibom 11 8 0 0 0 0 Anambra . . . . . . Bauchi 15 0 0 0 0 5,000 Bayesa 24 12 15 0 0 5,000 Benue 6 0 1 0 0 0 Borno 6 0 0 0 0 0 Cross River 0 0 0 0 0 0 Delta . . . . . . Ebonyi 30 4 2 0 0 0 Edo 0 0 0 0 0 0 Ekiti 15 0 14 20 1,538 20 Enugu 10 8 5 0 0 0 Gombe 0 0 0 0 0 0 Imo 23 40 25 0 0 0 Jigawa 80 0 168 3,345 0 3,545 Kaduna 12 0 0 0 0 0 Kano 46 100 25 0 0 0 Katsina 9 0 0 0 0 0 Kebbi 390 0 0 0 0 0 Kogi 0 0 0 0 0 0 Kwara 0 0 0 0 0 0 Lagos 35 0 100 0 0 0 Nasarawa 14 0 3 0 0 0 Niger 3 3 1 0 0 0 Ogun 40 . 6 . . . Ondo . . . . . . Osun 28 15 0 0 0 2,000 Oyo 30 20 20 0 0 0 Plateau 19 4 15 0 0 0 Rivers 4 8 6 5,200 0 0 Sokoto 20 200 50 0 0 0 Taraba 7 0 0 0 0 0 Yobe 3 4 3 0 0 0 Zamfara 10 0 10 10 10 10 FCT . . . . . . TOTAL 899 426 477 8,575 1,548 15,575

346
TABLE 5.1.1 IMPORT PRICE INDEX (BASE: JAN 2005 =100) AT 10-DIGIT LEVEL OF HS CODE
Descriptions Jan_05 Feb_05 Mar_05 Apr_05 May_05 Jun_05 Live animals; animals products Frozen herrings (excl. livers and roes) 100 94.3 97.7 107.9 77.4 107.9 Frozen mackerel 100 46.8 75.5 55.3 94.9 76.2 Frozen fish, nes 100 110.3 89.7 131.0 243.3 373.4 Flours meals and pellets of fish,fit for human consumption 100 92.8 70.7 45.8 55.4 55.4 Smoked fish (excl. salmon and herrings) 100 100.0 100.0 171.1 81.2 95.0 Dried fish, not smoked (excl. cod) 100 191.8 160.2 110.1 121.8 153.3 Milk/cream of >1% but=<6% fat, not concent.or sweetened 100 68.0 50.5 72.8 59.4 60.9 Milk and cream in solid forms of >1.5% fat, unsweetened 100 100.0 100.1 99.9 100.2 99.5 Live trees &other plant,Blb, Root, Cut flowers etc Products offish, etc; dead animals of chapter 3 100 122.3 74.1 98.8 98.4 134.5 Spelt, common wheat and meslin 100 82.0 91.0 86.5 238.2 59.4 Semi-milled or wholly milled rice 100 100.0 100.0 48.0 79.5 67.7 Maize (corn) starch 100 33.3 44.4 100.0 222.8 65.7 Animals and vegetable fats and oil and other cleavage products Fats/bovine ani./sheep/goats,raw/rendered,(exl.that of 1503) 100 100.3 99.5 100.6 100.0 100.3 Margarine (excl. liquid) 100 52.5 108.3 84.5 84.0 118.5 Edible preparations of fats and oils, nes 100 100.0 66.7 88.9 100.0 100.0 Prepared of meat, fish or Crustacenans, Molluses etc Cane or beet sugar, in solid form, nes 100 83.3 101.9 114.8 110.8 80.1 Glucose syrup 100 41.1 16.6 6.7 100.0 100.0 Preparations for infant use, for retail sale, of flour, etc 100 168.9 28.5 71.3 100.0 25.4 Food prep's of goods of hdgs 0401-0404/of flour,meal,etc not 100 89.0 104.6 88.1 107.3 71.5 Tomatoes, preserved otherwise than by vinegar/acetic acid, nes 100 85.3 80.0 55.3 53.1 100.0 Mineral Products Bituminous mixt.based on nat.asphalt,bitumen..(eg. cut-backs) 100 100.0 100.0 100.0 100.0 100.0 Inorganic chem.; composts of prec met radioact elements etc Calcium carbonate 100 100.0 66.3 88.8 85.0 80.0 Other cyclic hydrocarbons, nes 100 100.0 170.8 100.0 100.0 53.0 Dichloromethane (methylene chloride) 100 78.0 77.1 78.9 77.1 80.6 Dichlorodifluoromethane 100 140.4 84.1 108.1 31.4 7.6 Oth. Halog.deriv.of acyclic hydrocarbons nes contg.>=2 halogen 100 95.2 65.1 83.7 81.4 76.7 Chlorobenzene, o-dichlorobenzene and p-dichlorobenzene 100 73.4 38.8 48.8 53.7 47.1 Methanol (methyl alcohol) 100 100.0 100.0 100.0 100.0 100.0 Dodecan-1-ol, hexadecan-1-ol and octadecan-1-ol 100 53.4 67.5 18.8 46.6 116.1 Reactive dyes and preparations based thereon 100 91.8 95.9 95.9 87.1 103.5 Pigments and preparations based thereon 100 100.0 69.5 100.0 63.7 44.9 Mixt./with bas./odorifer's subs.incl.alc.sol's for food/drnk 100 129.6 76.5 102.0 73.6 84.1 Mixt.with basis of odorifer's subs.inc.alc.sol's for ind. Nes 100 138.8 79.6 106.1 48.9 100.0 Products put up as glues or adhesives for retail sale, =<1kg 100 52.4 46.5 49.4 47.9 75.1 Adhesives based on rubber or plastic (incl. artificial resins) 100 73.5 63.1 57.5 100.0 100.0 Agricultural insecticides 100 60.9 73.0 78.0 70.6 79.4 Plastics and articles thereof Polyvinyl chloride, not mixed with oth. subs., in pry. Forms 100 93.3 122.3 84.4 73.2 106.0 Acrylic polymers prepared,in primary forms, nes 100 71.9 14.1 149.3 52.5 19.0 Other polyethers, in primary forms, nes 100 100.0 100.0 100.0 100.0 100.0 Unsaturated polyesters, in primary forms, nes 100 97.3 97.3 97.3 97.3 97.3 Polyester chips 100 50.0 75.0 41.1 58.1 49.6 Other cellular plates, strips..., of plastics, nes 100 227.6 187.6 106.0 192.3 221.4 Boxes, cases, crates and similar articles of plastics 100 33.3 67.9 47.0 100.0 33.5 Sacks and bags (incl. cones) of polymers of ethylene 100 94.9 94.9 94.9 94.9 97.9 Stoppers, lids, caps and other closures of plastics 100 102.9 67.6 156.6 63.7 96.0 Tubes..., of vulcanized rubb., not reinforced, without fitts. 100 110.5 94.8 94.8 141.8 47.7 Tubes..., of vul. rubber, reinforced with mat., no fittings 100 107.2 69.1 98.6 91.6 140.7 Inner tubes, of rubber of a kind used on bicycles 100 83.8 91.5 91.6 91.3 91.9 Of a kind used on motor cycles 100 95.6 65.2 87.0 82.6 100.0 Articles of vulcanized rubber, nes 100 189.1 93.6 64.6 87.4 128.7

347
Pulp of wood or of other fibrous cellulosic materials; waste etc Paper... (excl. mech. fibres), weighing >=40g/m2 but =<150g/m2 100 62.2 99.0 53.7 84.2 73.1 Paper... (excl. mechanical fibres), weighing >150g/m2 100 100.0 68.4 89.5 21.1 59.7 Unbleached kraftliner, uncoated, in rolls or sheets 100 82.2 113.4 98.5 98.0 103.3 Kraftliner, uncoated (excl. unbleached), in rolls or sheets 100 114.7 85.3 85.3 90.2 95.1 Paper..., coated with kaolin, etc, weighing =<150g/m2 100 55.6 33.3 51.9 55.6 61.7 Paper..., coated with kaolin, etc, weighing >150g/m2 100 40.1 46.7 62.3 49.7 83.6 Other printed matter, nes 100 99.9 100.1 99.6 100.7 98.4 Textiles and Textiles Articles Textile fabrics impregnated... with plastics, nes 100 56.0 58.5 52.4 57.2 66.0 Footwear, Headgear, Umbrellas, Sunshades, Whips etc Footwear, nes, not covering the ankle, of rubber or plastics 100 87.1 87.4 89.5 84.4 88.3 Outer soles and heels of rubber or plastics 100 49.2 49.7 66.3 100.0 32.4 Art of stone, plaster, cement, abestos, mica or similar materials Worked granite 100 90.7 102.4 106.9 62.7 164.0 Millstones, etc, of oth. agglomerated abrasives or of ceramics 100 48.8 54.6 48.8 92.9 78.5 Boards..., of plaster or compositions based on plaster, nes 100 100.0 66.7 88.9 100.0 85.2 Glazed ceramic flags and paving, hearth or wall tiles,etc,nes 100 90.2 134.0 75.9 60.6 127.9 Tableware and kitchenware, of porcelain or china 100 33.3 62.7 65.4 24.7 38.0 Ceramic tableware... oth household art.(excl.porcelain/china) 100 111.9 88.2 73.5 77.4 69.6 Iron and steel F/hotrol.i/steel,not coils,wid>=600mm,>=4.75mm but <=10mm thck 100 33.3 44.1 61.5 85.5 95.9 F/cold-rolled i/steel, coils, width >=600mm, < 0.5mm thick 100 33.3 44.4 59.3 45.7 49.8 Doors, window-frames and thresholds for doors of iron or steel 100 65.9 51.3 54.7 34.6 64.5 Equip.for scaffolding,shuttering,propping/pitpropping i/steel 100 65.9 56.5 56.5 48.1 56.5 Structures and parts of structures, nes, of iron or steel 100 109.7 90.3 90.3 90.3 90.3 Reservoirs,tanks...(excl.for gas)of iron/steel,>=300 l 100 82.7 75.0 51.2 82.7 75.0 Aluminium foil, =<0.2mm thick, not backed (excl. rolled) 100 100.0 100.0 96.9 99.0 98.6 Aluminium foil, =<0.2mm thick, backed with paper, plastics... 100 79.0 75.5 81.6 79.9 65.0 Hand-operated spanners and wrenches, non-adjustable 100 29.3 38.7 34.0 36.4 35.2 Nuclear reactors boilers mchy & appliance, parts Spark-ignition reciprocating piston eng. for veh., >1000cc 100 100.0 100.0 100.0 100.0 100.0 Spark-ignition recipro./rotary internal combustion eng., nes 100 78.3 100.0 83.7 51.1 100.0 For internal combustion engines for motor vehicles 100 92.7 100.0 73.9 104.1 155.5 Mach., apparatus & equipment for type-setting/composing, nes 100 135.8 82.1 82.1 84.5 79.6 Ac motors, single-phase 100 85.3 92.7 89.0 90.8 89.9 Generating sets with compression-ignition engines, =<75 kva 100 100.0 100.0 100.0 100.0 100.0 Gen sets with compression-ignition engines, >75 kva-<=375 kva 100 139.5 98.7 112.7 117.0 129.3 Rail, tramw locom; rolling_stock & parts thereof Ckd engine capacity =<1000cc imported by others 100 100.0 100.0 100.0 100.0 100.0 Vehicles engine capacity 1000-1500cc of less than 8 years 100 279.6 47.6 74.8 141.5 100.5 Vehicles engine capacity 1000-1500cc of more than 8 years 100 73.3 108.7 74.0 73.3 56.7
Descriptions Jul_05 Aug_05 Sep_05 Oct_05 Nov_05 Dec_05 Live animals; animals products Frozen herrings (excl. livers and roes) 100.4 114.4 107.9 100.4 107.9 107.9 Frozen mackerel 51.3 157.3 46.9 70.0 104.9 104.9 Frozen fish, nes 113.2 186.4 47.5 325.3 316.1 116.2 Flours meals and pellets of fish,fit for human consumption 56.5 57.3 70.2 75.2 54.4 55.1 Smoked fish (excl. salmon and herrings) 68.1 131.3 98.1 98.8 109.4 104.6 Dried fish, not smoked (excl. cod) 83.9 116.5 89.8 100.0 151.1 112.5 Milk/cream of >1% but=<6% fat, not concent.or sweetened 44.3 61.2 55.5 55.4 30.1 84.8 Milk and cream in solid forms of >1.5% fat, unsweetened 101.0 97.9 99.9 100.2 99.5 99.6 Live trees &other plant,Blb, Root, Cut flowers etc Products offish, etc; dead animals of chapter 3 135.6 90.3 45.0 90.3 75.2 108.5 Spelt, common wheat and meslin 41.8 87.4 99.6 164.8 53.0 77.7 Semi-milled or wholly milled rice 93.6 75.7 65.9 100.0 105.0 100.0 Maize (corn) starch 254.6 181.0 167.1 200.9 183.0 114.3

348
Animals and vegetable fats and oil and other cleavage products Fats/bovine ani./sheep/goats,raw/rendered,(exl.that of 1503) 100.1 100.2 100.2 100.2 100.2 100.2 Margarine (excl. liquid) 202.1 100.0 165.2 100.0 118.6 66.6 Edible preparations of fats and oils, nes 18.9 100.0 100.0 100.0 100.0 100.0 Prepared of meat, fish or Crustacenans, Molluses etc Cane or beet sugar, in solid form, nes 153.4 99.0 37.6 110.8 96.6 81.1 Glucose syrup 41.8 100.0 100.0 62.6 100.0 100.0 Preparations for infant use, for retail sale, of flour, etc 100.0 117.5 100.0 100.0 100.0 100.0 Food prep's of goods of hdgs 0401-0404/of flour,meal,etc not 134.8 58.0 129.2 27.4 107.3 71.5 Tomatoes, preserved otherwise than by vinegar/acetic acid, nes 100.0 80.0 100.0 50.6 100.0 100.0 Mineral Products Bituminous mixt.based on nat.asphalt,bitumen..(eg. cut-backs) 100.0 100.0 100.0 100.0 100.0 100.0 Inorganic chem...; composts of prec met radioact elements etc Calcium carbonate 84.6 83.2 82.6 83.5 83.1 83.1 Other cyclic hydrocarbons, nes 100.0 84.3 100.0 100.0 100.0 201.4 Dichloromethane (methylene chloride) 73.7 87.5 58.4 87.5 75.1 100.0 Dichlorodifluoromethane 49.1 100.0 116.0 46.7 55.2 72.6 Oth. halog.deriv.of acyclic hydrocarbons nes contg.>=2 halogen 80.6 79.6 100.0 86.7 88.2 100.0 Chlorobenzene, o-dichlorobenzene and p-dichlorobenzene 49.9 88.6 61.9 66.8 69.2 116.4 Methanol (methyl alcohol) 100.0 100.0 100.0 100.0 100.0 100.0 Dodecan-1-ol, hexadecan-1-ol and octadecan-1-ol 60.5 74.4 83.7 72.9 78.2 78.2 Reactive dyes and preparations based thereon 70.7 87.1 87.1 81.6 85.3 83.7 Pigments and preparations based thereon 100.0 62.2 67.0 100.0 89.0 100.0 Mixt./with bas./odorifer's subs.incl.alc.sol's for food/drnk 86.6 81.4 84.0 84.0 83.2 1.4 Mixt.with basis of odorifer's subs.inc.alc.sol's for ind. Nes 41.9 63.6 68.5 58.0 53.9 60.1 Products put up as glues or adhesives for retail sale, =<1kg 69.4 72.3 100.0 46.3 73.1 109.2 Adhesives based on rubber or plastic (incl. artificial resins) 81.0 75.1 100.0 63.1 63.1 63.1 Agricultural insecticides 76.0 75.3 76.9 76.1 76.1 50.0 Plastics and articles thereof Polyvinyl chloride, not mixed with oth. subs., in pry. Forms 67.0 126.1 124.9 55.9 84.4 84.4 Acrylic polymers prepared,in primary forms, nes 62.9 18.2 73.6 100.0 100.0 100.0 Other polyethers, in primary forms, nes 100.0 82.7 100.0 100.0 100.0 100.0 Unsaturated polyesters, in primary forms, nes 97.3 97.3 97.3 108.2 97.3 100.9 Polyester chips 49.6 52.4 51.0 97.5 100.0 82.8 Other cellular plates, strips..., of plastics, nes 114.9 65.9 80.8 82.4 59.0 52.0 Boxes, cases, crates and similar articles of plastics 30.6 54.7 39.6 41.7 45.3 42.2 Sacks and bags (incl. cones) of polymers of ethylene 94.9 119.6 100.0 91.7 47.4 94.9 Stoppers, lids, caps and other closures of plastics 105.5 88.4 96.6 96.8 93.9 95.8 Tubes..., of vulcanized rubb., not reinforced, without fitts. 94.8 258.7 176.7 217.7 197.2 207.5 Tubes..., of vul. rubber, reinforced with mat., no fittings 110.3 47.0 99.3 85.6 60.4 81.8 Inner tubes, of rubber of a kind used on bicycles 91.5 91.6 91.5 91.6 91.7 91.5 Of a kind used on motor cycles 89.9 95.6 95.2 93.6 94.8 94.5 Articles of vulcanized rubber, nes 238.4 110.0 118.1 74.6 137.3 86.5 Pulp of wood or of other fibrous cellulosic materials; waste etc Paper... (excl. mech. fibres), weighing >=40g/m2 but =<150g/m2 85.4 86.9 85.5 92.4 87.8 89.0 Paper... (excl. mechanical fibres), weighing >150g/m2 63.9 48.2 57.3 56.5 54.0 160.2 Unbleached kraftliner, uncoated, in rolls or sheets 100.0 100.4 82.2 94.2 82.2 82.2 Kraftliner, uncoated (excl. unbleached), in rolls or sheets 85.3 90.2 90.2 90.2 88.6 90.2 Paper..., coated with kaolin, etc, weighing =<150g/m2 54.4 50.2 56.0 53.4 56.0 54.6 Paper..., coated with kaolin, etc, weighing >150g/m2 65.2 56.4 68.4 63.3 62.7 64.8 Other printed matter, nes 103.0 93.9 127.0 60.7 103.0 5.7 Textiles and Textiles Articles Textile fabrics impregnated... with plastics, nes 33.9 71.9 92.1 100.0 43.7 69.6 Footwear, Headgear, Umbrellas, Sunshades, Whips etc Footwear, nes, not covering the ankle, of rubber or plastics 89.5 75.4 100.0 93.1 93.1 89.5 Outer soles and heels of rubber or plastics 66.2 52.5 100.0 41.7 44.7 62.1

349
Art of stone, plaster, cement, abestos, mica or similar materials Worked granite 94.1 154.3 121.2 164.0 47.3 35.3 Millstones, etc, of oth. agglomerated abrasives or of ceramics 100.0 100.0 87.2 100.0 48.8 48.8 Boards..., of plaster or compositions based on plaster, nes 100.0 95.1 93.4 96.2 94.9 94.8 Glazed ceramic flags and paving, hearth or wall tiles,etc,nes 78.1 41.9 64.5 44.8 33.6 100.8 Tableware and kitchenware, of porcelain or china 42.7 35.1 38.6 38.8 37.5 38.3 Ceramic tableware... oth household art.(excl.porcelain/china) 33.0 59.1 39.4 56.4 55.6 82.4 Iron and steel F/hotrol.i/steel,not coils,wid>=600mm,>=4.75mm but <=10mm thck 81.0 87.5 113.5 94.0 98.3 93.3 F/cold-rolled i/steel, coils, width >=600mm, < 0.5mm thick 51.6 49.0 50.1 50.2 33.8 105.2 Doors, window-frames and thresholds for doors of iron or steel 65.0 78.7 49.9 86.2 100.0 103.3 Equip.for scaffolding,shuttering,propping/pitpropping i/steel 31.4 56.5 20.0 56.5 17.8 106.6 Structures and parts of structures, nes, of iron or steel 90.3 90.3 90.3 90.3 90.3 100.9 Reservoirs,tanks...(excl.for gas)of iron/steel,>=300 l 140.3 33.9 84.0 75.0 64.3 105.0 Aluminium foil, =<0.2mm thick, not backed (excl. rolled) 98.2 98.6 68.2 94.9 87.2 97.2 Aluminium foil, =<0.2mm thick, backed with paper, plastics... 100.0 74.7 35.9 59.0 43.0 104.2 Hand-operated spanners and wrenches, non-adjustable 35.8 100.0 67.9 83.9 75.9 183.1 Nuclear reactors boilers mchy & appliance, parts Spark-ignition reciprocating piston eng. for veh., >1000cc 100.0 119.8 109.9 100.0 100.0 35.4 Spark-ignition recipro./rotary internal combustion eng., nes 100.0 100.0 100.0 66.7 100.0 100.0 For internal combustion engines for motor vehicles 96.0 60.9 46.6 35.7 126.4 97.2 Mach., apparatus & equipment for type-setting/composing, nes 82.3 91.6 64.8 90.5 135.8 135.8 Ac motors, single-phase 90.4 90.1 90.3 48.4 69.3 100.0 Generating sets with compression-ignition engines, =<75 kva 100.0 100.0 100.0 100.0 100.0 100.0 Gen sets with compression-ignition engines, >75 kva-<=375 kva 59.4 65.8 59.0 116.6 80.5 85.3 Rail, tramw locom; rolling_stock & parts thereof Ckd engine capacity =<1000cc imported by others 100.0 100.0 100.0 100.0 100.0 100.0 Vehicles engine capacity 1000-1500cc of less than 8 years 136.2 223.9 64.5 13.1 72.0 101.9 Vehicles engine capacity 1000-1500cc of more than 8 years 60.2 62.9 50.0 97.5 70.1 72.5 Live animals; animals products Frozen herrings (excl. livers and roes) 121.2 77.6 100.4 104.0 100.4 141.4 Frozen mackerel 116.3 100.7 88.0 99.8 101.3 85.8 Frozen fish, nes 149.6 117.0 190.6 123.0 105.2 132.6 Flours meals and pellets of fish,fit for human consumption 60.7 99.5 87.7 62.9 62.1 62.1 Smoked fish (excl. salmon and herrings) 129.0 99.1 147.3 104.6 99.6 78.2 Dried fish, not smoked (excl. cod) 101.7 158.7 151.1 71.1 151.1 131.7 Milk/cream of >1% but=<6% fat, not concent.or sweetened 66.0 114.1 111.2 132.4 48.8 86.0 Milk and cream in solid forms of >1.5% fat, unsweetened 122.7 150.6 114.4 95.5 118.3 125.6 Live trees &other plant,Blb, Root, Cut flowers etc Products offish, etc; dead animals of chapter 3 85.3 111.0 84.4 68.8 59.1 97.2 Spelt, common wheat and meslin 106.5 108.9 125.5 126.3 98.8 115.5 Semi-milled or wholly milled rice 70.9 109.3 99.9 83.1 95.2 108.3 Maize (corn) starch 65.7 124.0 105.6 97.6 103.0 95.9 Animals and vegetable fats and oil and other cleavage products Fats/bovine ani./sheep/goats,raw/rendered,(exl.that of 1503) 106.8 103.7 113.3 118.3 110.0 126.5 Margarine (excl. liquid) 116.7 110.7 98.9 104.7 99.0 96.6 Edible preparations of fats and oils, nes 100.0 88.9 102.3 100.0 102.3 103.1 Prepared of meat, fish or Crustacenans, Molluses etc Cane or beet sugar, in solid form, nes 110.8 122.3 110.9 118.1 98.9 102.0 Glucose syrup 116.6 100.0 100.0 100.9 104.0 97.5 Preparations for infant use, for retail sale, of flour, etc 101.5 107.7 92.6 175.8 116.9 124.2 Food prep's of goods of hdgs 0401-0404/of flour,meal,etc not 91.5 104.3 107.3 103.4 103.4 102.5 Tomatoes, preserved otherwise than by vinegar/acetic acid, nes 116.8 101.2 100.0 115.8 99.5 104.8 Mineral Products Bituminous mixt.based on nat.asphalt,bitumen..(eg. cut-backs) 103.3 109.7 123.5 81.7 102.1 104.7

350
Inorganic chem..; composts of prec met radioact elements etc Calcium carbonate 97.5 93.4 97.0 103.4 126.2 105.4 Other cyclic hydrocarbons, nes 110.8 111.4 110.8 115.9 116.3 123.6 Dichloromethane (methylene chloride) 92.5 112.5 101.8 111.5 157.6 142.8 Dichlorodifluoromethane 116.7 121.6 124.7 114.8 72.6 105.4 Oth. halog.deriv.of acyclic hydrocarbons nes contg.>=2 halogen 107.8 125.4 122.1 118.7 120.3 102.0 Chlorobenzene, o-dichlorobenzene and p-dichlorobenzene 121.4 129.0 75.8 78.9 98.4 98.1 Methanol (methyl alcohol) 107.4 126.6 137.5 109.7 102.0 109.0 Dodecan-1-ol, hexadecan-1-ol and octadecan-1-ol 107.6 70.5 84.6 89.4 122.8 101.1 Reactive dyes and preparations based thereon 102.7 104.7 78.0 113.9 106.5 86.7 Pigments and preparations based thereon 94.5 105.7 89.7 100.9 91.8 95.5 Mixt./with bas./odorifer's subs.incl.alc.sol's for food/drnk 105.7 101.0 98.4 95.8 104.4 104.4 Mixt.with basis of odorifer's subs.inc.alc.sol's for ind. Nes 115.1 108.8 120.6 103.4 105.0 106.0 Products put up as glues or adhesives for retail sale, =<1kg 85.5 104.3 112.5 80.3 101.3 104.5 Adhesives based on rubber or plastic (incl. artificial resins) 129.5 97.1 82.8 101.2 99.8 98.9 Agricultural insecticides 117.6 103.5 120.4 102.6 118.6 108.1 Plastics and articles thereof Polyvinyl chloride, not mixed with oth. subs., in pry. Forms 87.7 119.7 118.9 118.1 116.9 106.2 Acrylic polymers prepared,in primary forms, nes 113.2 125.6 102.0 118.0 100.2 101.9 Other polyethers, in primary forms, nes 101.2 110.3 113.2 106.0 108.1 95.7 Unsaturated polyesters, in primary forms, nes 101.4 88.9 108.8 100.8 107.7 110.0 Polyester chips 103.7 102.9 102.1 104.9 102.1 109.0 Other cellular plates, strips..., of plastics, nes 115.3 108.9 103.9 98.0 136.4 119.9 Boxes, cases, crates and similar articles of plastics 101.5 116.1 107.2 108.8 111.4 117.2 Sacks and bags (incl. cones) of polymers of ethylene 108.5 100.9 98.6 105.9 54.8 54.0 Stoppers, lids, caps and other closures of plastics 112.6 109.8 116.0 117.4 123.9 136.5 Tubes..., of vulcanized rubb., not reinforced, without fitts. 192.9 135.5 124.4 130.6 112.6 130.6 Tubes..., of vul. rubber, reinforced with mat., no fittings 96.7 102.2 110.2 104.1 109.9 105.6 Inner tubes, of rubber of a kind used on bicycles 116.2 107.2 107.3 105.6 87.5 91.5 Of a kind used on motor cycles 102.0 109.3 114.3 107.7 94.8 94.8 Articles of vulcanized rubber, nes 106.4 102.1 106.9 115.4 105.5 100.3 Pulp of wood or of other fibrous cellulosic materials; waste etc Paper... (excl. mech. fibres), weighing >=40g/m2 but =<150g/m2 98.1 104.8 91.7 82.7 86.9 106.4 Paper... (excl. mechanical fibres), weighing >150g/m2 108.4 117.4 108.8 110.8 107.8 110.2 Unbleached kraftliner, uncoated, in rolls or sheets 97.6 102.7 106.4 110.5 116.2 110.5 Kraftliner, uncoated (excl. unbleached), in rolls or sheets 101.9 101.1 106.7 111.6 109.8 113.8 Paper..., coated with kaolin, etc, weighing =<150g/m2 99.0 101.6 56.0 105.3 101.6 100.2 Paper..., coated with kaolin, etc, weighing >150g/m2 83.3 113.3 93.8 107.9 101.4 99.5 Other printed matter, nes 128.1 118.1 115.1 116.0 106.3 111.4 Textiles and Textiles Articles Textile fabrics impregnated... with plastics, nes 106.0 107.7 99.0 98.4 98.6 104.0 Footwear, Headgear, Umbrellas, Sunshades, Whips etc Footwear, nes, not covering the ankle, of rubber or plastics 93.1 95.2 93.1 98.8 103.5 93.6 Outer soles and heels of rubber or plastics 109.1 107.3 116.9 110.0 112.6 111.7 Art of stone, plaster, cement, abestos, mica or similar materials Worked granite 107.6 120.3 100.3 116.2 113.1 117.5 Millstones, etc, of oth. agglomerated abrasives or of ceramics 103.3 112.4 104.0 109.7 105.3 95.4 Boards..., of plaster or compositions based on plaster, nes 102.1 95.7 108.8 125.3 93.4 93.4 Glazed ceramic flags and paving, hearth or wall tiles,etc,nes 109.5 103.1 97.1 102.8 127.5 102.9 Tableware and kitchenware, of porcelain or china 111.0 108.1 102.5 105.2 101.4 104.8 Ceramic tableware... oth household art.(excl.porcelain/china) 103.1 99.2 109.9 106.6 107.4 103.5 Iron and steel F/hotrol.i/steel,not coils,wid>=600mm,>=4.75mm but <=10mm thck 99.5 104.7 104.9 107.1 107.6 109.0 F/cold-rolled i/steel, coils, width >=600mm, < 0.5mm thick 106.9 106.9 103.1 103.1 106.2 104.6 Doors, window-frames and thresholds for doors of iron or steel 102.8 99.3 101.9 105.2 103.3 104.9 Equip.for scaffolding,shuttering,propping/pitpropping i/steel 108.8 106.1 103.5 109.7 106.4 103.8 Structures and parts of structures, nes, of iron or steel 103.1 100.5 101.5 100.8 98.0 100.3 Reservoirs,tanks...(excl.for gas)of iron/steel,>=300 l 108.1 100.4 101.3 100.6 106.1 103.8 Aluminium foil, =<0.2mm thick, not backed (excl. rolled) 101.7 101.1 101.7 105.1 98.2 101.1

351
Aluminium foil, =<0.2mm thick, backed with paper, plastics... 109.5 108.2 105.0 112.8 109.5 103.8 Hand-operated spanners and wrenches, non-adjustable 103.7 108.7 107.2 103.7 105.0 103.8 Nuclear reactors boilers mchy & appliance, parts Spark-ignition reciprocating piston eng. for veh., >1000cc 110.7 111.9 100.8 106.4 105.6 102.1 Spark-ignition recipro./rotary internal combustion eng., nes 103.3 106.0 107.1 99.2 101.4 102.8 For internal combustion engines for motor vehicles 100.3 96.3 106.9 103.3 100.6 99.4 Mach., apparatus & equipment for type-setting/composing, nes 97.6 92.6 95.2 103.1 98.9 104.4 Ac motors, single-phase 114.9 104.6 105.9 99.4 108.3 109.7 Generating sets with compression-ignition engines, =<75 kva 98.1 102.6 107.3 106.0 98.1 98.5 Gen sets with compression-ignition engines, >75 kva-<=375 kva 109.8 104.1 108.7 102.6 106.3 103.3 Rail, tramw locom; rolling_stock & parts thereof Ckd engine capacity =<1000cc imported by others 99.3 109.1 104.3 102.5 102.5 100.0 Vehicles engine capacity 1000-1500cc of less than 8 years 109.8 105.7 108.8 108.0 111.8 101.9 Vehicles engine capacity 1000-1500cc of more than 8 years 107.2 106.4 108.0 106.4 106.6 84.7 Live animals; animals products Frozen herrings (excl. livers and roes) 122.0 100.2 95.3 115.2 108.9 127.0 Frozen mackerel 102.2 117.2 103.3 46.9 124.5 99.4 Frozen fish, nes 112.3 119.2 110.6 135.7 99.8 109.1 Flours meals and pellets of fish,fit for human consumption 87.7 83.9 70.2 101.1 54.4 106.8 Smoked fish (excl. salmon and herrings) 98.2 68.1 68.1 98.2 68.1 101.6 Dried fish, not smoked (excl. cod) 100.0 120.3 100.0 124.4 120.8 100.0 Milk/cream of >1% but=<6% fat, not concent.or sweetened 135.2 126.4 178.7 123.2 177.2 154.3 Milk and cream in solid forms of >1.5% fat, unsweetened 126.3 99.8 124.1 90.2 127.4 80.9 Live trees &other plant,Blb, Root, Cut flowers etc Products offish, etc; dead animals of chapter 3 99.8 97.7 64.3 106.9 111.0 99.9 Spelt, common wheat and meslin 101.9 105.8 120.7 109.1 167.6 118.2 Semi-milled or wholly milled rice 118.4 118.9 136.2 142.6 124.1 128.2 Maize (corn) starch 100.0 114.3 117.4 121.8 114.3 119.7 Animals and vegetable fats and oil and other cleavage products Fats/bovine ani./sheep/goats,raw/rendered,(exl.that of 1503) 118.7 115.1 118.3 116.2 116.5 106.6 Margarine (excl. liquid) 105.2 117.0 117.2 116.9 101.7 100.9 Edible preparations of fats and oils, nes 110.0 105.7 123.7 109.8 108.4 103.4 Prepared of meat, fish or Crustacenans, Molluses etc Cane or beet sugar, in solid form, nes 104.7 104.3 103.0 99.5 113.5 100.0 Glucose syrup 100.0 116.6 104.2 109.3 103.8 104.2 Preparations for infant use, for retail sale, of flour, etc 122.9 100.0 100.3 107.6 109.7 104.6 Food prep's of goods of hdgs 0401-0404/of flour,meal,etc not 98.2 107.3 118.4 104.2 107.3 105.8 Tomatoes, preserved otherwise than by vinegar/acetic acid, nes 96.8 106.5 100.0 103.6 100.0 116.3 Mineral Products Bituminous mixt.based on nat.asphalt,bitumen..(eg. cut-backs) 116.1 111.3 116.5 112.3 109.2 108.9 Inorganic chem..; composts of prec met radioact elements etc Calcium carbonate 100.1 109.5 106.7 132.1 117.6 97.3 Other cyclic hydrocarbons, nes 130.7 108.4 163.8 139.0 124.4 100.1 Dichloromethane (methylene chloride) 9.9 116.2 104.0 118.5 118.1 112.6 Dichlorodifluoromethane 110.8 128.9 105.4 105.4 119.2 108.1 Oth. halog.deriv.of acyclic hydrocarbons nes contg.>=2 halogen 135.7 131.5 102.0 98.0 101.5 102.4 Chlorobenzene, o-dichlorobenzene and p-dichlorobenzene 96.9 98.6 75.8 102.3 87.4 109.6 Methanol (methyl alcohol) 104.7 137.7 125.7 122.6 122.3 125.3 Dodecan-1-ol, hexadecan-1-ol and octadecan-1-ol 122.5 127.2 224.3 201.3 166.5 158.8 Reactive dyes and preparations based thereon 87.9 82.1 81.7 93.6 96.8 80.4 Pigments and preparations based thereon 99.1 100.5 96.3 87.2 121.7 129.7 Mixt./with bas./odorifer's subs.incl.alc.sol's for food/drnk 104.4 98.4 98.7 96.9 101.7 104.3 Mixt.with basis of odorifer's subs.inc.alc.sol's for ind. Nes 103.7 120.1 103.5 104.7 116.7 112.2 Products put up as glues or adhesives for retail sale, =<1kg 87.5 81.9 76.2 74.8 100.0 125.6 Adhesives based on rubber or plastic (incl. artificial resins) 112.6 121.5 117.1 103.7 106.4 86.7 Agricultural insecticides 107.4 99.6 91.4 88.7 112.2 114.3

352
Plastics and articles thereof Polyvinyl chloride, not mixed with oth. subs., in pry. Forms 105.8 99.7 108.0 108.7 112.8 91.7 Acrylic polymers prepared,in primary forms, nes 106.4 103.7 106.1 115.6 106.5 110.1 Other polyethers, in primary forms, nes 99.4 113.0 102.1 99.6 100.7 99.1 Unsaturated polyesters, in primary forms, nes 111.9 104.0 108.1 106.9 98.9 104.6 Polyester chips 103.5 100.5 104.3 104.0 107.4 104.7 Other cellular plates, strips..., of plastics, nes 109.0 112.8 99.7 128.7 137.6 124.2 Boxes, cases, crates and similar articles of plastics 110.1 105.9 117.8 99.0 100.1 108.3 Sacks and bags (incl. cones) of polymers of ethylene 101.6 103.3 108.0 92.6 92.9 94.4 Stoppers, lids, caps and other closures of plastics 122.3 132.4 117.4 119.9 117.2 117.6 Tubes..., of vulcanized rubb., not reinforced, without fitts. 102.7 197.2 126.4 102.7 197.2 197.2 Tubes..., of vul. rubber, reinforced with mat., no fittings 98.0 98.0 98.0 60.4 60.4 60.4 Inner tubes, of rubber of a kind used on bicycles 92.8 99.5 105.2 124.2 95.0 101.8 Of a kind used on motor cycles 99.3 99.4 101.1 105.5 99.3 99.3 Articles of vulcanized rubber, nes 98.1 86.2 99.6 114.5 113.5 107.1 Pulp of wood or of other fibrous cellulosic materials; waste etc Paper... (excl. mech. fibres), weighing >=40g/m2 but =<150g/m2 104.6 103.7 101.1 103.7 105.9 95.6 Paper... (excl. mechanical fibres), weighing >150g/m2 108.4 106.6 105.2 109.0 111.0 105.2 Unbleached kraftliner, uncoated, in rolls or sheets 108.2 114.5 110.6 101.3 100.9 101.4 Kraftliner, uncoated (excl. unbleached), in rolls or sheets 112.3 109.1 95.8 106.6 113.5 114.4 Paper..., coated with kaolin, etc, weighing =<150g/m2 101.6 101.7 109.2 101.7 101.6 101.7 Paper..., coated with kaolin, etc, weighing >150g/m2 101.5 99.5 103.6 101.4 107.1 99.5 Other printed matter, nes 108.8 106.0 109.1 103.4 103.6 109.1 Textiles and Textiles Articles Textile fabrics impregnated... with plastics, nes 108.4 109.4 102.6 108.7 109.3 110.6 Footwear, Headgear, Umbrellas, Sunshades, Whips etc Footwear, nes, not covering the ankle, of rubber or plastics 93.1 98.3 98.6 98.8 103.5 97.8 Outer soles and heels of rubber or plastics 112.4 105.7 102.4 101.2 106.1 106.2 Art of stone, plaster, cement, asbestos, mica or similar materials Worked granite 110.8 107.9 100.3 113.9 105.9 106.5 Millstones, etc, of oth. agglomerated abrasives or of ceramics 107.0 99.2 112.7 121.9 96.1 97.4 Boards..., of plaster or compositions based on plaster, nes 108.1 105.8 106.0 98.8 98.4 105.2 Glazed ceramic flags and paving, hearth or wall tiles,etc,nes 108.0 105.4 109.7 117.5 116.2 119.0 Tableware and kitchenware, of porcelain or china 91.5 88.0 96.7 98.8 124.7 113.6 Ceramic tableware... oth household art.(excl.porcelain/china) 103.1 124.8 95.6 105.8 100.1 117.7 Iron and steel F/hotrol.i/steel,not coils,wid>=600mm,>=4.75mm but <=10mm thck 109.3 102.1 102.1 109.0 106.2 103.0 F/cold-rolled i/steel, coils, width >=600mm, < 0.5mm thick 109.3 103.1 108.7 98.6 103.1 105.8 Doors, window-frames and thresholds for doors of iron or steel 100.4 77.2 99.2 107.2 105.5 104.6 Equip.for scaffolding,shuttering,propping/pitpropping i/steel 107.6 104.3 102.6 104.3 104.4 105.8 Structures and parts of structures, nes, of iron or steel 101.2 98.1 99.6 100.4 101.0 97.0 Reservoirs,tanks...(excl.for gas)of iron/steel,>=300 l 106.7 105.6 101.0 106.5 104.3 103.7 Aluminium foil, =<0.2mm thick, not backed (excl. rolled) 107.2 102.6 108.4 98.2 100.0 98.2 Aluminium foil, =<0.2mm thick, backed with paper, plastics... 106.0 107.1 107.8 105.0 107.8 109.0 Hand-operated spanners and wrenches, non-adjustable 107.1 111.5 110.8 105.7 103.8 104.4 Nuclear reactors boilers mchy & appliance, parts Spark-ignition reciprocating piston eng. for veh., >1000cc 106.3 195.4 119.3 107.5 105.3 100.4 Spark-ignition recipro./rotary internal combustion eng., nes 103.2 99.7 102.5 102.8 100.0 100.1 For internal combustion engines for motor vehicles 109.6 104.6 101.5 106.0 102.4 104.2 Mach., apparatus & equipment for type-setting/composing, nes 102.1 100.4 100.9 106.0 108.0 104.6 Ac motors, single-phase 104.6 104.6 114.9 113.1 108.7 109.2 Generating sets with compression-ignition engines, =<75 kva 102.6 102.6 99.8 94.9 95.5 107.3 Gen sets with compression-ignition engines, >75 kva-<=375 kva 104.1 104.1 105.5 108.9 105.4 106.3 Rail, tramw locom; rolling_stock & parts thereof Ckd engine capacity =<1000cc imported by others 109.1 109.1 102.9 108.7 104.3 102.5 Vehicles engine capacity 1000-1500cc of less than 8 years 98.9 96.4 110.1 105.2 108.8 108.0 Vehicles engine capacity 1000-1500cc of more than 8 years 105.7 106.4 106.6 103.7 105.5 104.2

353
Table 5.1.2 Jan_05 Feb_05 Mar_05 Apr_05 May_05 Jun_05 Live animals; animals products
Frozen shrimps and prawns 100 114.1 100.2 115.1 97.6 97.8 Live trees &other plant,Blb, Root, Cut flowers etc Ginger 100 105.2 128.1 101.1 111.5 97.4 NIGERIAN STANDARD RUBBER CRUMB T.S.R.-20 100 92.0 89.2 99.8 92.7 91.7 Sesamum seeds 100 100.3 97.8 100.3 98.1 98.0 Natural gum Arabic 100 45.1 95.3 53.6 68.7 60.4 Prepared foodstuff; beverages,spirits and vinegar;tobacco Cocoa beans, whole or broken, raw or roasted 100 106.1 119.0 105.5 121.7 95.4 Cocoa paste, not defatted 100 85.5 92.9 73.1 75.7 69.8 Cocoa butter, fat and oil 100 90.9 93.5 103.8 88.9 100.2 Prepared foodstuffs; beverages, spirits and vinegar; tobacco 100 148.5 123.0 101.7 118.3 101.7 Chocolate, etc,contain. cocoa, in blocks, slabs or bars >2kg 100 41.4 130.7 109.4 86.5 101.9 Beer made from malt 100 124.5 168.5 171.4 159.7 146.6 Prepared foodstuffs; beverages, spirits and vinegar; tobacco 100 102.2 106.0 100.7 106.1 100.4 Mineral products Cement clinkers 100 104.2 92.0 102.3 91.7 98.2 PETROLEUM OILS & OILS OBTAINED FROM BITUMINOUS MINERALS, CRUDE 100 100 100 100 100 100 Inorganic chem.; composts of prec met radioact elements etc Products of the chemical and allied industries 100 107.4 123.4 105.5 110.7 108.3 Plastics and articles thereof Plastic, rubber and articles thereof 100 110.1 110.2 111.2 90.3 113.6 Boxes, cases, crates and similar articles of plastics 100 65.2 270.9 54.5 63.5 66.9 Plastic, rubber and articles thereof 100 74.4 98.1 100.0 89.7 97.8 Plastic, rubber and articles thereof 100 98.1 104.8 96.8 99.9 92.5 Tableware and kitchenware of plastics 100 95.1 107.2 84.3 96.0 90.0 Tech. specified nat. rubber, in pry. forms/in plates,etc 100 98.1 93.6 98.9 90.5 90.8 New pneumatic tyres, of rubber of a kind used on motor cars 100 116.9 111.7 108.3 144.3 103.7 Raw hides and skins, leather, furskins etc.; saddlery Raw hides and skins, leather, furskins etc.; saddlery 100 135.0 107.8 126.9 82.0 82.7 Raw hides and skins, leather, furskins etc.; saddlery 100 33.4 35.9 24.1 39.8 37.3 Raw hides and skins, leather, furskins etc.; saddlery 100 116.9 91.0 127.5 154.7 170.9 Wood and articles of wood, wood charcoal and articles Wood charcoal 100 93.3 96.7 86.2 93.9 92.3 Wood and articles of wood, wood charcoal and articles 100 110.2 100.5 63.4 58.2 51.3 Paper making material;paper and paperboard,articles Paper making material; paper and paperboard, articles 100 97.9 97.9 97.9 97.9 97.9 Sanitary towels & tampons,napkins &napkin liners for babes,etc 100 110.7 155.8 141.5 126.5 120.4 Textiles and Textiles Articles Cotton, not carded or combed 100 97.9 95.2 102.5 98.9 97.3 Uncombed cabled cotton yarn,>=85%,nprs,>14mn but<=43mn psy 100 96.2 118.1 106.0 179.1 112.8 Synthetic staple fibres, of polyesters, not carded, etc 100 100.4 80.4 96.3 110.7 95.3 Footwear, Headgear, Umbrellas, Sunshades, Whips etc

354
Footwear, headgear, umbrellas, sunshades, whips etc. 100 98.6 94.3 96.0 95.5 98.6 Base metals and articles of base metals Base metals and articles of base metals 100 152.9 98.6 96.7 98.6 95.6 Aluminium alloys, unwrought 100 88.8 66.2 96.3 58.7 59.6 Rectangular(incl.square)plates..ofaluminium alloys>0.2mm thick 100 99.9 100.0 99.8 96.1 96.7 Zinc plates, sheets, strip and foil 100 97.9 100.3 108.3 110.7 110.7 Base metals and articles of base metals 100 103.6 81.5 113.8 87.3 61.6 Live animals; animals products Frozen shrimps and prawns 97.4 81.2 83.5 84.6 80.8 90.9 Live trees &other plant,Blb, Root, Cut flowers etc Ginger 93.2 91.7 91.6 120.9 120.8 119.4 NIGERIAN STANDARD RUBBER CRUMB T.S.R.-20 73.6 63.4 76.5 87.5 80.0 107.7 Sesamum seeds 98.4 94.4 97.2 100.3 97.3 102.2 Natural gum Arabic 168.2 60.6 64.5 44.7 226.2 40.8 Prepared foodstuff; beverages,spirits and vinegar;tobacco Cocoa beans, whole or broken, raw or roasted 107.8 101.8 108.0 111.9 102.9 98.6 Cocoa paste, not defatted 77.7 65.2 84.6 83.7 87.1 90.5 Cocoa butter, fat and oil 100.8 92.1 99.8 95.0 100.0 99.0 Prepared foodstuffs; beverages, spirits and vinegar; tobacco 102.8 101.7 123.5 151.9 143.7 148.6 Chocolate, etc,contain. cocoa, in blocks, slabs or bars >2kg 92.9 108.3 104.4 78.3 83.9 93.6 Beer made from malt 133.9 133.3 108.8 123.8 92.9 135.7 Prepared foodstuffs; beverages, spirits and vinegar; tobacco 100.3 103.9 99.3 100.2 101.0 53.4 Mineral products Cement clinkers 90.3 88.0 94.2 92.8 93.5 97.7 PETROLEUM OILS & OILS OBTAINED FROM BITUMINOUS MINERALS, CRUDE 100 97.1 97.07 97.07 97.074 97.074 Inorganic chem.; composts of prec met radioact elements etc Products of the chemical and allied industries 115.4 118.3 114.1 120.0 112.0 92.1 Plastics and articles thereof Plastic, rubber and articles thereof 113.0 111.9 113.0 111.3 110.8 113.6 Boxes, cases, crates and similar articles of plastics 48.3 51.4 69.7 91.1 66.2 87.6 Plastic, rubber and articles thereof 99.2 100.5 99.0 104.0 102.1 100.0 Plastic, rubber and articles thereof 94.9 95.3 99.8 99.7 95.1 93.1 Tableware and kitchenware of plastics 100.2 92.1 86.2 88.5 59.7 87.6 Tech. specified nat. rubber, in pry. forms/in plates,etc 76.2 77.2 75.5 73.8 84.5 83.4 New pneumatic tyres, of rubber of a kind used on motor cars 112.3 107.8 137.5 98.8 103.3 99.6 Raw hides and skins, leather, furskins etc.; saddlery Raw hides and skins, leather, furskins etc.; saddlery 98.2 93.0 77.3 79.7 93.3 94.5 Raw hides and skins, leather, furskins etc.; saddlery 40.6 27.1 41.8 31.8 25.5 23.2 Raw hides and skins, leather, furskins etc.; saddlery 156.3 107.3 92.1 88.7 69.8 86.7 Wood and articles of wood, wood charcoal and articles Wood charcoal 95.2 87.9 92.1 90.6 100.5 93.5 Wood and articles of wood, wood charcoal and articles 90.6 96.0 62.1 44.0 85.8 55.7 Paper making material;paper and paperboard,articles Paper making material; paper and paperboard, articles 97.9 97.9 70.0 110.7 90.3 97.9 Sanitary towels & tampons,napkins &napkin liners for babes,etc 106.0 144.3 141.4 109.8 72.9 92.4

355
Textiles and Textiles Articles Cotton, not carded or combed 98.0 99.5 100.4 112.0 104.9 103.6 Uncombed cabled cotton yarn,>=85%,nprs,>14mn but<=43mn psy 108.3 123.0 140.3 116.8 120.9 129.3 Synthetic staple fibres, of polyesters, not carded, etc 90.4 94.3 93.8 102.0 96.1 99.5 Footwear, Headgear, Umbrellas, Sunshades, Whips etc Footwear, headgear, umbrellas, sunshades, whips etc. 80.4 97.9 97.3 97.3 93.4 90.5 Base metals and articles of base metals Base metals and articles of base metals 67.4 95.9 102.5 66.1 69.8 85.1 Aluminium alloys, unwrought 62.0 62.7 85.9 71.1 65.4 67.6 Rectangular(incl.square)plates..ofaluminium alloys>0.2mm thick 93.7 96.5 95.9 98.8 97.5 100.2 Zinc plates, sheets, strip and foil 108.3 110.7 108.3 156.3 143.7 119.4 Base metals and articles of base metals 55.6 66.2 106.6 107.7 62.5 159.7 Live animals; animals products Frozen shrimps and prawns 101.0 95.9 99.6 98.6 88.9 95.8 Live trees &other plant,Blb, Root, Cut flowers etc Ginger 89.5 97.8 89.2 70.5 85.6 80.4 NIGERIAN STANDARD RUBBER CRUMB T.S.R.-20 110.7 110.7 110.7 125.1 113.2 110.7 Sesamum seeds 99.2 95.3 78.5 97.2 85.5 79.8 Natural gum Arabic 55.1 55.8 78.5 60.5 79.4 60.5 Prepared foodstuff; beverages,spirits and vinegar;tobacco Cocoa beans, whole or broken, raw or roasted 102.4 95.8 100.2 99.1 100.0 89.6 Cocoa paste, not defatted 75.3 88.3 69.5 98.1 99.2 72.6 Cocoa butter, fat and oil 99.6 102.4 97.6 78.5 89.7 80.3 Prepared foodstuffs; beverages, spirits and vinegar; tobacco 115.3 111.3 102.0 171.4 99.9 100.2 Chocolate, etc,contain. cocoa, in blocks, slabs or bars >2kg 75.6 87.1 68.3 86.3 70.5 79.8 Beer made from malt 88.5 99.8 89.9 75.3 85.6 90.3 Prepared foodstuffs; beverages, spirits and vinegar; tobacco 69.5 89.8 79.5 55.6 70.2 88.6 Mineral products Cement clinkers 99.4 78.5 90.3 80.5 95.3 80.4 PETROLEUM OILS & OILS OBTAINED FROM BITUMINOUS MINERALS, CRUDE 97.1 100 100.1 102.1 100 104.4 Inorganic chem.; composts of prec met radioact elements etc Products of the chemical and allied industries 89.3 96.5 91.9 92.2 85.2 91.4 Plastics and articles thereof Plastic, rubber and articles thereof 103.0 98.4 87.9 89.0 76.4 88.0 Boxes, cases, crates and similar articles of plastics 98.1 91.6 83.6 75.2 88.8 78.3 Plastic, rubber and articles thereof 87.5 101.9 112.0 101.9 111.1 110.1 Plastic, rubber and articles thereof 89.5 84.0 64.3 74.1 94.2 84.4 Tableware and kitchenware of plastics 65.6 75.3 77.3 87.0 60.8 76.3 Tech. specified nat. rubber, in pry. forms/in plates,etc 80.5 90.7 70.8 80.6 71.1 90.7 New pneumatic tyres, of rubber of a kind used on motor cars 99.8 95.0 85.7 94.2 77.5 84.5 Raw hides and skins, leather, furskins etc.; saddlery Raw hides and skins, leather, furskins etc.; saddlery 89.6 83.0 86.9 72.4 81.9 79.7 Raw hides and skins, leather, furskins etc.; saddlery 40.2 60.7 79.5 86.7 77.7 80.1 Raw hides and skins, leather, furskins etc.; saddlery 66.7 86.3 74.4 83.3 68.5 77.6 Wood and articles of wood, wood charcoal and articles Wood charcoal 89.9 70.4 80.7 90.4 81.4 80.9 Wood and articles of wood, wood charcoal and articles 70.6 62.1 82.5 72.4 92.0 82.9 Paper making material;paper and paperboard,articles

356
Paper making material; paper and paperboard, articles 99.8 96.0 80.5 60.3 70.7 70.6 Sanitary towels & tampons,napkins &napkin liners for babes,etc 88.2 65.0 73.5 84.8 66.2 71.1 Textiles and Textiles Articles Cotton, not carded or combed 100.2 90.3 90.4 80.4 80.7 90.4 Uncombed cabled cotton yarn,>=85%,nprs,>14mn but<=43mn psy 110.7 107.1 109.4 95.8 102.0 109.6 Synthetic staple fibres, of polyesters, not carded, etc 95.5 82.5 81.9 92.3 81.5 71.7 Footwear, Headgear, Umbrellas, Sunshades, Whips etc Footwear, headgear, umbrellas, sunshades, whips etc. 93.2 83.5 94.3 95.0 94.8 84.6 Base metals and articles of base metals Base metals and articles of base metals 83.9 74.0 63.6 73.4 62.8 82.3 Aluminium alloys, unwrought 81.1 71.6 61.1 70.7 80.9 71.2 Rectangular(incl.square)plates..ofaluminium alloys>0.2mm thick 93.4 83.3 73.2 83.4 73.1 63.0 Zinc plates, sheets, strip and foil 108.3 110.7 119.4 100.2 143.7 112.0 Base metals and articles of base metals 91.2 99.6 80.7 110.7 112.0 112.0 Frozen shrimps and prawns 75.8 102.1 86.9 100.0 99.9 93.8 Live trees &other plant,Blb, Root, Cut flowers etc Ginger 90.3 88.6 96.1 99.4 87.8 92.4 NIGERIAN STANDARD RUBBER CRUMB T.S.R.-20 96.8 119.4 106.0 104.0 100.2 89.7 Sesamum seeds 60.9 70.1 69.3 80.5 84.9 90.2 Natural gum Arabic 88.8 66.3 80.3 78.6 79.8 83.5 Prepared foodstuff; beverages,spirits and vinegar;tobacco Cocoa beans, whole or broken, raw or roasted 90.5 99.0 77.5 60.8 80.8 65.5 Cocoa paste, not defatted 78.8 86.5 94.5 99.3 89.6 79.8 Cocoa butter, fat and oil 99.8 92.4 98.2 87.5 79.8 95.6 Prepared foodstuffs; beverages, spirits and vinegar; tobacco 110.7 100.2 100.2 99.8 60.5 78.5 Chocolate, etc,contain. cocoa, in blocks, slabs or bars >2kg 82.4 112.0 86.3 87.7 99.3 88.8 Beer made from malt 97.1 88.3 79.2 86.3 82.5 76.5 Prepared foodstuffs; beverages, spirits and vinegar; tobacco 84.2 60.8 86.9 90.1 101.4 80.6 Mineral products Cement clinkers 70.7 84.3 94.3 80.3 90.2 91.2 PETROLEUM OILS & OILS OBTAINED FROM BITUMINOUS MINERALS, CRUDE 99.6 100 109.3 100.3 97.074 105.7 Inorganic chem...; composts of prec met radioact elements etc Products of the chemical and allied industries 92.1 84.3 72.1 82.0 81.9 91.8 Plastics and articles thereof Plastic, rubber and articles thereof 78.0 87.9 89.4 94.7 110.7 97.6 Boxes, cases, crates and similar articles of plastics 82.2 73.2 76.6 86.9 67.5 70.6 Plastic, rubber and articles thereof 98.6 89.8 78.2 89.1 79.5 89.5 Plastic, rubber and articles thereof 74.0 64.0 73.9 63.8 73.9 64.0 Tableware and kitchenware of plastics 83.8 91.3 86.5 74.7 82.9 75.5 Tech. specified nat. rubber, in pry. forms/in plates,etc 80.7 70.7 60.8 70.7 80.7 70.9 New pneumatic tyres, of rubber of a kind used on motor cars 98.4 88.9 89.4 76.8 65.5 86.2 Raw hides and skins, leather, furskins etc.; saddlery Raw hides and skins, leather, furskins etc.; saddlery 75.0 83.1 73.6 85.4 85.0 70.9 Raw hides and skins, leather, furskins etc.; saddlery 78.0 82.7 77.7 66.1 75.2 63.1 Raw hides and skins, leather, furskins etc.; saddlery 85.1 91.4 81.2 80.3 89.3 88.5 Wood and articles of wood, wood charcoal and articles Wood charcoal 70.8 60.8 70.9 60.8 80.9 70.6 Wood and articles of wood, wood charcoal and articles 72.2 62.5 82.7 71.2 72.1 81.7 Paper making material;paper and paperboard,articles Paper making material; paper and paperboard, articles 80.3 90.1 84.3 80.1 71.6 70.2

357
Sanitary towels & tampons,napkins &napkin liners for babes,etc 80.2 84.4 74.3 87.9 78.9 81.8 Textiles and Textiles Articles Cotton, not carded or combed 80.6 70.4 60.6 70.6 80.6 70.5 Uncombed cabled cotton yarn,>=85%,nprs,>14mn but<=43mn psy 98.6 91.0 97.1 81.7 91.4 105.9 Synthetic staple fibres, of polyesters, not carded, etc 81.8 71.8 82.3 91.8 82.1 91.9 Footwear, Headgear, Umbrellas, Sunshades, Whips etc Footwear, headgear, umbrellas, sunshades, whips etc. 73.9 84.2 74.0 63.9 73.6 83.9 Base metals and articles of base metals Base metals and articles of base metals 72.0 62.3 72.3 82.3 72.2 82.4 Aluminium alloys, unwrought 70.8 81.0 91.2 81.3 71.2 91.4 Rectangular(incl.square)plates..ofaluminium alloys>0.2mm thick 83.1 73.1 62.8 73.2 83.1 84.5 Zinc plates, sheets, strip and foil 144.3 144.3 144.3 154.7 110.7 110.7 Base metals and articles of base metals 90.3 82.0 91.1 110.7 110.7 92.8

358
Table 5.1.3: IMPORT PRICE INDEX, JANUARY,2005_AS BASE MONTHDescreption Jan_05 Feb_05 Mar_05 Apr_05 May_05 Jun_05 Live animals; animals products 100 100.5 93.0 99.2 104.2 127.7 Live trees &other plant,Blb, Root, Cut flowers etc 100 84.4 77.4 83.3 159.7 81.8 Animals and vegetable fats and oil and other cleavage products 100 84.2 91.5 91.3 94.7 106.3 Prepared of meat, fish or Crustacenans, Molluses etc 100 93.5 66.3 67.2 94.3 75.4 Mineral Products 100 100.0 100.0 100.0 100.0 100.0 Inorganic chem; composts of prec met radioact elements etc 100 92.5 78.3 81.1 71.1 76.5 Plastics and articles thereof 100 104.1 88.6 93.8 94.8 95.0 Pulp of wood or of other fibrous cellulosic materials; waste etc 100 79.2 78.0 77.2 71.4 82.1 Textiles and Textiles Articles 100 56.0 58.5 52.4 57.2 65.9 Footwear, Headgear, Umbrellas, Sunshades, Whips etc 100 68.2 68.6 77.9 92.2 60.3 Art of stone, plaster, cement, abestos, mica or similar materials 100 79.1 84.8 76.6 69.7 93.9 Iron and steel 100 66.6 64.0 65.1 66.9 70.1 Nuclear reactors boilers mchy & appliance, parts 100 104.5 96.2 91.6 92.5 107.7 Rail, tramw locom; rolling_stock & parts thereof 100 151.0 85.4 82.9 105.0 85.7 100 105.0 98.1 103.6 102.8 116.7 Live animals; animals products 77.3 115.3 77.0 115.7 121.7 98.2 Live trees &other plant,Blb, Root, Cut flowers etc 131.4 108.6 94.4 139.0 104.1 100.1 Animals and vegetable fats and oil and other cleavage products 107.0 100.1 121.8 100.1 106.3 88.9 Prepared of meat, fish or Crustacenans, Molluses etc 106.0 90.9 93.4 70.3 100.8 90.5 Mineral Products 100.0 100.0 100.0 100.0 100.0 100.0 Inorganic chem; composts of prec met radioact elements etc 74.9 81.0 85.7 76.9 78.2 87.9 Plastics and articles thereof 96.2 93.4 96.0 95.5 93.5 93.9 Pulp of wood or of other fibrous cellulosic materials; waste etc 79.6 75.2 80.9 73.0 76.3 78.1 Textiles and Textiles Articles 33.9 71.9 92.1 100.0 43.6 69.6 Footwear, Headgear, Umbrellas, Sunshades, Whips etc 77.9 64.0 100.0 67.4 68.9 75.8 Art of stone, plaster, cement, abestos, mica or similar materials 74.6 80.9 74.0 83.4 52.9 66.7 Iron and steel 77.0 74.3 64.4 76.7 67.8 111.0 Nuclear reactors boilers mchy & appliance, parts 89.7 89.7 81.5 79.7 101.7 93.4 Rail, tramw locom; rolling_stock & parts thereof 98.8 128.9 71.5 70.2 80.7 91.5 101.1 100.4 101.8 101.1 103.0 100.9
Live animals; animals products 108.4 114.7 123.8 99.2 98.3 105.4 Live trees &other plant,Blb, Root, Cut flowers etc 82.1 113.3 103.8 94.0 89.0 104.2 Animals and vegetable fats and oil and other cleavage products 107.9 101.1 104.8 107.6 103.8 108.8 Prepared of meat, fish or Crustacenans, Molluses etc 107.4 107.1 102.2 122.8 104.5 106.2 Mineral Products 103.3 109.7 123.4 81.7 102.1 104.7 Inorganic chem; composts of prec met radioact elements etc 107.5 107.7 103.8 102.7 109.6 106.1 Plastics and articles thereof 111.4 110.0 109.5 110.1 105.1 105.2 Pulp of wood or of other fibrous cellulosic materials; waste etc 102.4 108.4 96.9 106.4 104.3 107.4 Textiles and Textiles Articles 106.0 107.7 99.0 98.4 98.6 104.0 Footwear, Headgear, Umbrellas, Sunshades, Whips etc 101.1 101.3 105.0 104.4 108.0 102.6 Art of stone, plaster, cement, abestos, mica or similar materials 106.1 106.4 103.8 111.0 108.0 102.9 Iron and steel 104.9 104.0 103.3 105.3 104.5 103.9 Nuclear reactors boilers mchy & appliance, parts 105.0 102.6 104.5 102.9 102.8 102.9 Rail, tramw locom; rolling_stock & parts thereof 105.4 107.1 107.0 105.6 207.7 207.7 104.2 107.2 106.5 103.7 110.4 112.3
Year on Year 4.2 2.1 8.5 0.1 7.5 -3.7

359
Table 5.1.3: IMPORT PRICE INDEX, JANUARY,2005_AS BASE MONTHDescreption (Contd)
Live animals; animals products 110.5 104.4 106.3 104.3 110.1 109.9 Live trees &other plant,Blb, Root, Cut flowers etc 105.0 109.2 109.6 120.1 129.2 116.5 Animals and vegetable fats and oil and other cleavage products 111.3 112.6 119.7 114.3 108.8 103.6 Prepared of meat, fish or Crustacenans, Molluses etc 104.5 106.9 105.2 104.8 106.9 106.2 Mineral Products 116.1 111.3 116.5 112.3 109.2 108.9 Inorganic chem; composts of prec met radioact elements etc 100.9 110.8 111.5 111.2 114.2 111.2 Plastics and articles thereof 104.3 111.1 107.3 105.9 110.0 108.6 Pulp of wood or of other fibrous cellulosic materials; waste etc 106.5 105.9 105.0 103.9 106.2 103.8 Textiles and Textiles Articles 108.4 109.4 102.6 108.7 109.3 110.6 Footwear, Headgear, Umbrellas, Sunshades, Whips etc 102.7 102.0 100.5 100.0 104.8 102.0 Art of stone, plaster, cement, abestos, mica or similar materials 104.8 105.2 103.5 109.5 106.9 109.9 Iron and steel 106.1 101.3 104.5 103.9 104.0 103.5 Nuclear reactors boilers mchy & appliance, parts 104.6 115.9 106.3 105.6 103.6 104.6 Rail, tramw locom; rolling_stock & parts thereof 104.6 104.0 106.5 105.8 106.2 104.9 106.5 107.8 107.5 107.9 109.2 107.4
Year on Year 5.3 7.4 5.6 6.7 6.1 6.5

360
TABLE 5.1.4 EXPORT PRICE INDEX, JANUARY,2005_AS BASE MONTH Jan_05 Feb_05 Mar_05 Apr_05 May_05 Jun_05 Live animals; animals products 100 114.1 100.2 115.1 97.6 97.8 Live trees &other plant,Blb, Root, Cut flowers etc 100 85.7 102.6 88.7 92.7 86.9 Prepared foodstuff; beverages,spirits and vinegar;tobacco 100 99.9 119.1 109.4 108.1 102.3 Mineral Products 100 104.2 92.0 102.3 91.7 98.2 Inorganic chem; composts of prec met radioact elements etc 100 107.4 123.4 105.5 110.7 108.3 Plastics and articles thereof 100 94.0 128.1 93.4 96.3 93.6 Raw hides and skins, leather, furskins etc.; saddlery 100 95.1 78.2 92.9 92.2 97.0 Wood and articles of wood, wood charcoal and articles 100 101.7 98.6 74.8 76.0 71.8 Paper making material;paper and paperboard,articles 100 104.3 126.8 119.7 112.2 109.2 Textiles and Textiles Articles 100 98.2 97.9 101.6 129.6 101.8 Footwear, Headgear, Umbrellas, Sunshades, Whips etc 100 98.6 94.3 96.0 95.5 98.6 Base metals and articles of base metals 100 108.6 89.3 103.0 90.3 84.8 100 101.0 104.2 100.2 99.4 95.9
Jul_05 Aug_05 Sep_05 Oct_05 Nov_05 Dec_05 Live animals; animals products 97.4 81.2 83.5 84.6 80.8 90.9 Live trees &other plant,Blb, Root, Cut flowers etc 108.3 77.5 82.5 88.4 131.1 92.5 Prepared foodstuff; beverages,spirits and vinegar;tobacco 102.3 100.9 104.0 106.4 101.6 102.8 Mineral Products 90.3 88.0 94.2 92.8 93.5 97.7 Inorganic chem; composts of prec met radioact elements etc 115.4 118.3 114.1 120.0 112.0 92.1 Plastics and articles thereof 92.0 90.9 97.2 95.3 88.8 95.0 Raw hides and skins, leather, furskins etc.; saddlery 98.4 75.8 70.4 66.7 62.9 68.1 Wood and articles of wood, wood charcoal and articles 92.9 92.0 77.1 67.3 93.1 74.6 Paper making material;paper and paperboard,articles 102.0 121.1 105.7 110.3 81.6 95.2 Textiles and Textiles Articles 98.9 105.6 111.5 110.3 107.3 110.8 Footwear, Headgear, Umbrellas, Sunshades, Whips etc 80.4 97.9 97.3 97.3 93.4 90.5 Base metals and articles of base metals 77.4 86.4 99.8 100.0 87.8 106.4 96.3 94.6 94.8 94.9 94.5 93.1
Jan_06 Feb_06 Mar_06 Apr_06 May_06 Jun_06 Live animals; animals products 101.0 95.9 99.6 98.6 88.9 95.8 Live trees &other plant,Blb, Root, Cut flowers etc 88.6 89.9 89.2 88.3 90.9 82.9 Prepared foodstuff; beverages,spirits and vinegar;tobacco 89.5 96.4 86.7 94.9 87.9 85.9 Mineral Products 99.4 78.5 90.3 80.5 95.3 80.4 Inorganic chem; composts of prec met radioact elements etc 89.3 96.5 91.9 92.2 85.2 91.4 Plastics and articles thereof 89.1 91.0 83.1 86.0 82.8 87.5 Raw hides and skins, leather, furskins etc.; saddlery 65.5 76.7 80.3 80.8 76.1 79.2 Wood and articles of wood, wood charcoal and articles 80.3 66.3 81.6 81.4 86.7 81.9 Paper making material;paper and paperboard,articles 94.0 80.5 77.0 72.5 68.5 70.8 Textiles and Textiles Articles 102.1 93.3 93.9 89.5 88.1 90.6 Footwear, Headgear, Umbrellas, Sunshades, Whips etc 93.2 83.5 94.3 95.0 94.8 84.6 Base metals and articles of base metals 91.6 87.8 79.6 87.7 94.5 88.1 90.3 86.3 87.3 87.3 86.6 84.9
Year on Year -9.7 -14.5 -16.2 -12.9 -12.8 -11.4
Jul_06 Aug_06 Sep_06 Oct_06 Nov_06 Dec_06 Live animals; animals products 75.8 102.1 86.9 100.0 99.9 93.8 Live trees &other plant,Blb, Root, Cut flowers etc 84.2 86.1 87.9 90.6 88.2 89.0 Prepared foodstuff; beverages,spirits and vinegar;tobacco 91.9 91.3 89.0 87.4 84.8 80.8 Mineral Products 70.7 84.3 94.3 80.3 90.2 91.2 Inorganic chem; composts of prec met radioact elements etc 92.1 84.3 72.1 82.0 81.9 91.8 Plastics and articles thereof 85.1 80.8 79.3 79.6 80.1 79.2 Raw hides and skins, leather, furskins etc.; saddlery 79.4 85.8 77.5 77.3 83.2 74.2 Wood and articles of wood, wood charcoal and articles 71.5 61.6 76.8 66.0 76.5 76.2 Paper making material;paper and paperboard,articles 80.3 87.2 79.3 84.0 75.3 76.0 Textiles and Textiles Articles 87.0 77.7 80.0 81.4 84.7 89.4 Footwear, Headgear, Umbrellas, Sunshades, Whips etc 73.9 84.2 74.0 63.9 73.6 83.9 Base metals and articles of base metals 92.1 88.5 92.3 100.4 89.6 92.4 82.0 84.5 82.5 82.7 84.0 84.8
Year on Year -14.85 -10.71 -13 -12.9 -11.1 -8.861

361
TABLE 5.1.5 Monthly Terms Of Trade Jan_05 Feb_05 Mar_05 Apr_05 May_05 Jun_05 Exports Price Index 100 101.0 104.2 100.2 99.4 95.9 Imports Price Index 100 105.0 98.1 103.6 102.8 116.7 Monthly Terms Of Trade 100 96.2 106.2 96.7 96.7 82.2 Jul_05 Aug_05 Sep_05 Oct_05 Nov_05 Dec_05 Exports Price Index 96.3 94.6 94.8 94.9 94.5 93.1 Imports Price Index 101.1 100.4 101.8 101.1 103.0 100.9 Monthly Terms Of Trade 95.3 94.3 93.1 94.0 91.7 92.2
Jan_06 Feb_06 Mar_06 Apr_06 May_06 Jun_06 Exports Price Index 90.3 86.3 87.3 87.3 86.6 84.9 Imports Price Index 104.2 107.2 106.5 103.7 110.4 112.3 Terms Of Trade 86.7 80.5 82.0 84.2 78.4 75.6 Jul_06 Aug_06 Sep_06 Oct_06 Nov_06 Dec_06 Exports Price Index 82.0 84.5 82.5 82.7 84.0 84.8 Imports Price Index 106.5 107.8 107.5 107.9 109.2 107.4 Monthly Terms Of Trade 77.0 78.4 76.7 76.7 76.9 78.9

362
TABLE 6.1 PRODUCER PRICE INDEX
YEAR MONTH
ALL COMMO-DITIES AGRICULTURE
AGRIC. HUNTING & FORESTRY
(Modern Holding)
FISHING (Modern Holding)
INDUS-TRY
MINING AND QUARRYING
2004 JAN 100.2 102.9 103.8 100 100.1 99.3 FEB 99.4 99.3 99.1 100 99.3 100.1 MAR 99.6 98.2 97.6 100 99.6 98 APR 100.2 100 100 100 100.2 99.4 MAY 101.6 100 100 100 101.5 99.5 JUN 100 100 100 100 100 100 JUL 101.3 100.1 100.1 100 101.4 99.4 AUG 107.3 100 100 100 107.4 100.3 SEP 98.1 100 100 100 98.1 99.3 OCT 99.3 100 100 100 99.3 103.5 NOV 99.3 100 100 100 99.3 103.5
DEC 97.8 100 100 100 97.7 103.6 2005 JAN 101.8 100.6 100.6 100 103.9 102.2
FEB 101.5 100.5 100.5 100 102.8 103.8 MAR 103.3 103.2 103.3 100 103.9 103.8 APR 101.5 100.5 100.5 100 103.3 103.8 MAY 101.6 100.6 100.7 100 102.5 103.8 JUN 102.6 100.7 100.4 105 104.3 103.8 JUL 103.2 103.8 103.4 104.6 102.7 101.6 AUG 103.2 103.8 103.4 104.6 102.7 101.6 SEP 101.1 100.1 100.1 100 102.4 104.5 OCT 101.4 100.4 100.4 100 102.7 104.8 NOV 103.8 101 100.5 107.6 107.3 104.8
DEC 104.8 102.7 103 101.2 106.4 104.8 2006 JAN 105.0 102.9 103.0 101.2 106.6 111.9
FEB 106.5 102.9 103.0 101.2 108.2 111.9 MAR 106.5 102.9 103.0 101.2 108.2 112.8 APR 106.6 102.9 103.0 101.2 108.3 113.4 MAY 106.6 102.9 103.0 101.2 108.3 113.7 JUN 106.6 103.1 103.0 104.4 108.3 116.1 JUL 106.4 103.1 103.0 104.4 108.1 114.1 AUG 106.4 103.1 103.0 104.4 108.1 113.5 SEP 106.4 103.1 103.0 104.4 108.1 114.8 OCT 106.5 103.1 103.0 104.4 108.3 120.9 NOV 106.9 103.1 103.0 104.4 108.7 121.6
DEC 108.1 103.1 103.0 104.4 110.0 122.2
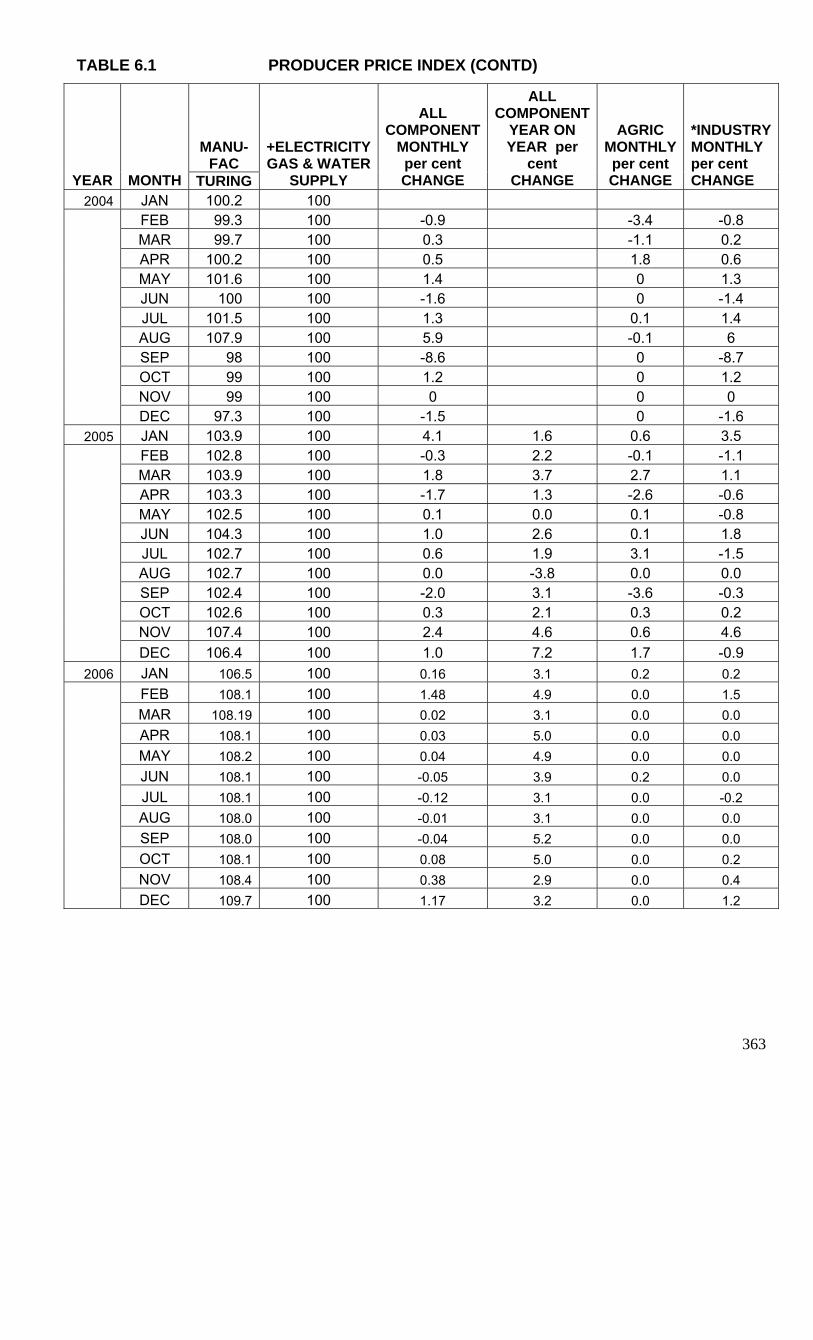
363
TABLE 6.1 PRODUCER PRICE INDEX (CONTD)
MANU-FAC
YEAR MONTH TURING
+ELECTRICITY GAS & WATER
SUPPLY
ALL COMPONENT
MONTHLY per cent CHANGE
ALL COMPONENT
YEAR ON YEAR per
cent CHANGE
AGRIC MONTHLY per cent CHANGE
*INDUSTRY MONTHLY per cent CHANGE
2004 JAN 100.2 100 FEB 99.3 100 -0.9 -3.4 -0.8 MAR 99.7 100 0.3 -1.1 0.2 APR 100.2 100 0.5 1.8 0.6 MAY 101.6 100 1.4 0 1.3 JUN 100 100 -1.6 0 -1.4 JUL 101.5 100 1.3 0.1 1.4 AUG 107.9 100 5.9 -0.1 6 SEP 98 100 -8.6 0 -8.7 OCT 99 100 1.2 0 1.2 NOV 99 100 0 0 0
DEC 97.3 100 -1.5 0 -1.6 2005 JAN 103.9 100 4.1 1.6 0.6 3.5
FEB 102.8 100 -0.3 2.2 -0.1 -1.1 MAR 103.9 100 1.8 3.7 2.7 1.1 APR 103.3 100 -1.7 1.3 -2.6 -0.6 MAY 102.5 100 0.1 0.0 0.1 -0.8 JUN 104.3 100 1.0 2.6 0.1 1.8 JUL 102.7 100 0.6 1.9 3.1 -1.5 AUG 102.7 100 0.0 -3.8 0.0 0.0 SEP 102.4 100 -2.0 3.1 -3.6 -0.3 OCT 102.6 100 0.3 2.1 0.3 0.2 NOV 107.4 100 2.4 4.6 0.6 4.6
DEC 106.4 100 1.0 7.2 1.7 -0.9 2006 JAN 106.5 100 0.16 3.1 0.2 0.2
FEB 108.1 100 1.48 4.9 0.0 1.5 MAR 108.19 100 0.02 3.1 0.0 0.0 APR 108.1 100 0.03 5.0 0.0 0.0 MAY 108.2 100 0.04 4.9 0.0 0.0 JUN 108.1 100 -0.05 3.9 0.2 0.0 JUL 108.1 100 -0.12 3.1 0.0 -0.2 AUG 108.0 100 -0.01 3.1 0.0 0.0 SEP 108.0 100 -0.04 5.2 0.0 0.0 OCT 108.1 100 0.08 5.0 0.0 0.2 NOV 108.4 100 0.38 2.9 0.0 0.4
DEC 109.7 100 1.17 3.2 0.0 1.2

364
TABLE 6.2
PRODUCER PRICE INDEX (BASE: JUNE 2004 =100) January - December 2006
Grouping of Commodities at 4-Digit Level of ISIC
Jan-06 Feb-06 Mar-06 Apr-06 May-06 Jun-06 Other animal farming; production 174.99 174.99 174.99 174.99 174.99 174.99 Fishing 100.00 100.00 100.00 100.00 100.00 103.17 Quarrying of stone, sand and plaster products 130.29 130.29 131.40 132.09 132.43 135.25 Electricity And Gas 100.00 100.00 100.00 100.00 100.00 100.00 Manufacture of cocoa, chocolate products 99.14 99.14 100.00 100.00 100.00 100.00 Manufacture of wearing apparel 118.52 118.52 118.52 118.52 118.69 118.69 Manufacture of luggage, handbags 112.82 115.38 112.82 115.38 115.38 112.82 Manufacture of pharmaceuticals And Medicinal Products 118.63 120.76 111.34 118.22 118.22 118.28 Manufacture of other rubber products 102.04 102.06 102.21 102.35 102.60 103.23 Manufacture of cement, lime and plaster Products 124.00 124.00 124.00 124.00 124.00 124.00
TABLE 6.2 CNTD.
PRODUCER PRICE INDEX (BASE: JUNE 2004 =100) Grouping of Commodities at 4-Digit Level of ISIC
Jul-06 Aug-06 Sep-06 Oct-06 Nov-06 Dec-06 Other animal farming; production 174.99 174.99 174.99 174.99 174.99 174.99 Fishing 103.17 103.17 103.17 103.17 103.17 103.17 Quarrying of stone, sand and plaster products 132.90 132.21 133.68 140.79 141.59 142.27 Electricity And Gas 100.00 100.00 100.00 100.00 100.00 100.00 Manufacture of cocoa, chocolate products 100.00 100.00 100.00 100.00 101.61 101.61 Manufacture of wearing apparel 118.69 118.85 118.85 119.18 119.18 119.18 Manufacture of luggage, handbags 115.38 112.82 107.69 107.69 107.69 107.69 Manufacture of pharmaceuticals And Medicinal Products 119.65 119.65 119.65 118.55 118.55 118.55 Manufacture of other rubber products 103.87 106.48 108.11 104.76 108.49 106.91 Manufacture of cement, lime and plaster Products 124.00 124.00 140.00 140.00 140.00 124.00

365
TABLE 6.3
PRODUCER ORICE INDEX (BASE: JUNE 2004 = 100) Commodity Group at 4-Digit ISIC Level
Month to Month Percent Change
Jan-06 Feb-06 Mar-06 Apr-06 May-06 Jun-06 Other animal farming; production -39.61 0.00 0.00 0.00 0.00 0.00 Fishing -1.19 0.00 0.00 0.00 0.00 3.17 Quarrying of stone, sand and plaster products 3.03 0.00 0.85 0.52 0.26 2.13 Electricity And Gas -13.34 0.00 0.00 0.00 0.00 0.00 Manufacture of cocoa, chocolate products -0.36 0.00 0.87 0.00 0.00 0.00 Manufacture of wearing apparel -7.62 0.00 0.00 0.00 0.14 0.00 Manufacture of luggage, handbags 3.41 2.27 -2.22 2.27 0.00 -2.22 Manufacture of pharmaceuticals And Medicinal Products -6.52 1.80 -7.80 6.18 0.00 0.05 Manufacture of other rubber products -12.48 0.02 0.14 0.13 0.24 0.61 Manufacture of cement, lime and plaster Products 3.08 0.00 0.00 0.00 0.00 0.00
Jul-06 Aug-06 Sep-06 Oct-06 Nov-06 Dec-06 Other animal farming; production 0.00 0.00 0.00 0.00 0.00 0.00 Fishing 0.00 0.00 0.00 0.00 0.00 0.00 Quarrying of stone, sand and plaster products -1.74 -0.52 1.11 5.32 0.57 0.48 Electricity And Gas 0.00 0.00 0.00 0.00 0.00 0.00 Manufacture of cocoa, chocolate products 0.00 0.00 0.00 0.00 1.61 0.00 Manufacture of wearing apparel 0.00 0.14 0.00 0.28 0.00 0.00 Manufacture of luggage, handbags 2.27 -2.22 -4.55 0.00 0.00 0.00 Manufacture of pharmaceuticals And Medicinal Products 1.16 0.00 0.00 -0.92 0.00 0.00 Manufacture of other rubber products 0.63 2.51 1.53 -3.10 3.56 -1.46 Manufacture of cement, lime and plaster Products 0.00 0.00 12.90 0.00 0.00 -11.43

366
TABLE 7.4.1 Gross Domestic Product At Current Basic Prices (=N=Million)
ACTIVITY SECTOR Q1 Q2 Q3 Q4 Total Q1 Q2 Q3 Q4 Total Crop Production 749,944.00 986,377.88 1,292,413.04 1,199,547.32 4,228,282.24 931,324.96 1,232,947.25 1,619,235.44 1,508,111.44 5,291,619.08 Livestock 73,375.52 77,684.62 79,503.85 82,688.33 313,252.32 87,245.71 89,714.46 104,601.46 97,140.98 378,702.61 Forestry 15,272.37 15,388.12 15,504.64 15,620.67 61,785.79 19,471.79 18,637.17 17,928.53 17,423.59 73,461.07 Fishing 37,596.90 40,821.50 47,099.60 44,360.03 169,878.03 44,769.06 46,705.82 53,775.42 51,203.90 196,454.21 Coal Mining 0.10 0.10 0.08 0.00 0.28 0.12 0.12 0.07 0.00 0.30 Crude Petroleum & Natural Gas 1,348,242.20 1,382,231.50 1,450,210.10 1,484,199.40 5,664,883.21 1,752,716.79 1,627,023.96 1,745,733.86 1,857,460.83 6,982,935.44 Metal Ores 2.43 5.26 3.56 3.65 14.90 7.43 5.71 4.87 4.20 22.21 Quarrying & Other Mining 3,072.46 4,033.28 5,282.11 4,898.50 17,286.35 7,287.45 5,126.67 7,146.61 7,700.72 27,261.45 Oil Refining 8,194.71 6,462.91 7,247.40 7,132.44 29,037.47 10,571.07 8,337.07 9,349.06 9,200.76 37,457.96 Cement 1,929.07 2,452.74 2,174.67 1,945.36 8,501.84 2,588.90 2,990.61 2,811.18 3,400.96 11,791.64 Other Manufacturing 17,982.84 80,669.26 85,635.36 190,879.83 375,167.29 20,504.71 89,346.08 110,568.56 208,855.18 429,274.54 Electricity 4,948.95 6,517.73 8,537.28 7,901.95 27,905.92 9,511.44 10,416.89 12,349.22 8,696.64 40,974.19 Water 365.81 370.60 374.41 370.68 1,481.50 376.38 434.46 457.98 371.82 1,640.63 Building & Construction 54,746.48 48,992.60 50,388.13 61,658.92 215,786.12 63,418.42 58,033.27 58,218.30 70,662.29 250,332.27 Wholesale and Retail Trade 500,300.84 378,698.99 462,163.26 527,088.21 1,868,251.30 577,573.08 742,848.04 698,648.12 722,725.29 2,741,794.53 Hotel and Restaurants 11,405.12 10,422.79 12,276.59 11,975.54 46,080.04 14,648.16 12,736.13 15,567.95 14,659.63 57,611.87 Road Transport 88,082.70 88,225.50 92,182.91 94,114.15 362,605.26 92,317.15 105,383.73 102,608.69 115,930.69 416,240.26 Rail Transport & Pipelines 0.95 2.15 1.57 2.28 6.94 1.03 2.33 1.70 2.47 7.53 Water Transport 192.94 238.58 257.72 293.64 982.88 208.32 257.61 278.27 317.05 1,061.25 Air Transport 638.00 737.86 828.00 1,078.96 3,282.82 782.53 958.60 1,083.64 1,199.11 4,023.88 Transport Services 3,615.55 4,181.42 4,692.29 6,114.45 18,603.71 3,982.02 4,605.25 5,167.90 6,734.21 20,489.38 Telecommunications 8,606.41 9,226.20 9,860.42 10,500.97 38,194.00 37,724.57 39,364.77 42,645.17 44,285.36 164,019.87 Post 303.42 300.29 322.17 393.32 1,319.20 345.97 342.40 367.35 448.48 1,504.19 Financial Institutions 28,761.00 31,471.62 31,314.59 34,981.17 126,528.38 63,443.89 72,095.33 72,095.33 80,746.77 288,381.31 Insurance 937.36 1,002.89 1,104.71 1,176.11 4,221.07 1,831.19 2,080.89 2,080.89 2,330.60 8,323.58 Real Estate 136,590.20 148,978.21 190,485.87 204,736.47 680,790.75 153,388.71 167,300.26 213,912.72 230,582.98 765,184.66 Business Services (Not Health or education)
8,187.41 8,473.67 8,026.15 7,357.28 32,044.51 10,848.16 10,180.17 9,743.58 12,598.60 43,370.51
Public Administration 27,925.04 27,925.04 27,925.04 31,415.66 115,190.77 31,837.33 31,837.33 31,837.33 35,817.00 131,329.00 Education 6,313.34 6,313.34 6,313.34 7,102.50 26,042.52 7,197.54 7,197.54 7,197.54 8,097.24 29,689.87 Health 1,653.87 1,653.87 1,653.87 1,860.61 6,822.22 1,885.53 1,885.53 1,885.53 2,121.22 7,777.80 Private Non Profit Organisations
37.45 37.45 37.45 42.13 154.48 38.50 38.50 38.50 43.31 158.80
Other Services 29,965.66 29,031.52 30,532.45 36,583.17 126,112.79 37,909.56 36,727.77 38,626.60 46,281.37 159,545.29 Broadcasting 422.36 422.36 422.36 475.15 1,742.22 522.07 522.07 522.07 587.33 2,153.55
GDP Current Basic Price 3,169,613.44 3,399,351.82 3,924,774.99 4,078,498.85 14,572,239.11 3,986,279.51 4,426,083.77 4,986,489.42 5,165,742.02 18,564,594.73

367
Table 7.4.2 Gross Domestic Product At 1990 Constant Basic Prices (=N=Million)
ACTIVITY SECTOR 2005 2006
Q1 Q2 Q3 Q4 Total Q1 Q2 Q3 Q4 Total Crop Production 36,568.58 48,097.50 63,020.31 58,492.02 206,178.40 39,237.64 51,727.35 67,649.95 63,007.31 221,622.25 Livestock 3,569.09 3,631.18 3,688.36 3,755.22 14,643.86 3,801.24 3,884.99 3,943.50 4,024.97 15,654.70 Forestry 742.87 748.50 754.17 759.81 3,005.35 788.40 793.18 799.27 805.37 3,186.22 Fishing 1,828.77 1,908.10 1,916.70 1,982.42 7,636.00 1,954.32 2,027.46 2,038.11 2,115.90 8,135.79 Coal Mining 0.03 0.03 0.03 0.03 0.12 0.03 0.03 0.03 0.03 0.13 Crude Petroleum & Natural Gas 33,248.19 30,733.62 35,762.76 36,600.95 136,345.54 33,329.55 28,382.20 33,589.94 34,891.88 130,193.57 Metal Ores 1.24 2.67 1.81 1.85 7.56 1.38 2.99 2.02 2.10 8.49 Quarrying & Other Mining 267.17 350.72 459.31 425.96 1,503.16 295.00 386.79 505.97 469.71 1,657.47 Oil Refining 172.20 171.26 171.69 171.62 686.77 189.46 188.43 188.89 188.82 755.60 Cement 103.97 108.33 97.32 88.21 397.83 115.68 120.98 108.94 98.08 443.69 Other Manufacturing 969.22 4,347.84 4,615.50 10,287.88 20,220.45 1,051.19 4,724.78 5,053.38 11,277.22 22,106.58 Electricity 3,447.55 4,540.39 5,947.26 5,504.67 19,439.86 3,603.50 4,744.65 6,219.70 5,776.58 20,344.44 Water 171.72 173.96 175.75 174.00 695.43 190.43 192.96 194.97 192.96 771.33 Building & Construction 2,264.67 1,978.90 1,968.02 2,332.89 8,544.48 2,558.64 2,235.32 2,222.41 2,638.42 9,654.79 Wholesale and Retail Trade 20,695.71 15,665.46 19,118.09 21,803.81 77,283.06 23,884.62 18,064.58 22,024.23 25,101.78 89,075.20 Hotel and Restaurants 554.76 487.19 569.54 543.86 2,155.35 625.43 550.13 642.10 615.95 2,433.61 Road Transport 3,251.65 3,256.93 3,403.02 3,474.31 13,385.91 3,475.80 3,482.77 3,639.56 3,721.38 14,319.51 Rail Transport & Pipelines 0.23 0.52 0.38 0.55 1.67 0.24 0.55 0.40 0.58 1.77 Water Transport 78.41 79.72 81.03 82.33 321.49 83.14 84.52 85.91 87.29 340.87 Air Transport 77.82 73.80 78.02 88.52 318.17 83.53 79.99 84.11 94.54 342.16 Transport Services 207.40 197.20 208.22 241.98 854.81 220.10 209.28 220.97 256.80 907.15 Telecommunications 1,769.25 1,896.66 2,027.04 2,158.72 7,851.66 2,355.50 2,553.58 2,730.95 2,927.86 10,567.90 Post 76.64 79.47 82.31 85.14 323.56 84.98 88.12 91.26 94.40 358.77 Financial Institutions 5,371.57 5,563.76 5,088.94 5,406.04 21,430.31 5,602.46 5,807.44 5,315.08 5,726.76 22,451.74 Insurance 175.21 177.44 179.67 181.90 714.21 194.60 197.43 200.08 202.84 794.94 Real Estate 1,922.14 1,951.71 1,980.94 2,010.81 7,865.61 2,145.85 2,179.18 2,211.92 2,247.01 8,783.96 Business Services (Not Health or education)
168.31 174.20 165.00 151.25 658.75 179.07 185.50 175.62 162.60 702.79
Public Administration 1,026.40 1,026.40 1,026.40 1,026.40 4,105.58 1,071.73 1,071.91 1,072.33 1,072.37 4,288.34 Education 241.13 241.13 241.13 241.13 964.53 267.11 267.11 267.11 267.11 1,068.42 Health 56.00 56.00 56.00 56.00 223.99 61.78 61.78 61.78 61.78 247.13 Private Non Profit Organisations 4.58 4.58 4.58 4.58 18.33 5.09 5.09 5.09 5.09 20.35 Other Services 912.67 926.50 940.54 954.79 3,734.51 1,009.51 1,024.81 1,040.34 1,056.10 4,130.76 Broadcasting 103.77 103.77 103.77 103.77 415.08 112.79 112.76 112.81 112.82 451.19
GDP Constant Basic Price 120,048.92 128,755.46 153,933.59 159,193.42 561,931.40 128,579.79 135,438.63 162,498.77 169,304.43 595,821.61

368
TABLE 7.4.3 Implicit Price Deflators 2005 2006 ACTIVITY SECTOR
Q1 Q2 Q3 Q4 Total Q1 Q2 Q3 Q4 Total Crop Production
2,050.79
2,050.79
2,050.79
2,050.79
2,050.79
2,373.55
2,383.55
2,393.55
2,393.55
2,387.68
Livestock
2,055.86
2,139.37
2,155.53
2,201.95
2,139.14
2,295.19
2,309.26
2,652.50
2,413.46
2,419.10
Forestry
2,055.86
2,055.86
2,055.86
2,055.86
2,055.86
2,469.78
2,349.69
2,243.10
2,163.44
2,305.59
Fishing
2,055.86
2,139.37
2,457.32
2,237.67
2,224.70
2,290.78
2,303.66
2,638.50
2,419.96
2,414.69
Coal Mining
337.02
337.02
269.27
- 1.72
235.40
346.79
346.79
221.31
- 1.77
228.28
Crude Petroleum & Natural Gas
4,055.08
4,497.46
4,055.08
4,055.08
4,154.80
5,258.75
5,732.55
5,197.19
5,323.48
5,363.50
Metal Ores
196.95
196.95
196.95
196.95
196.95
539.08
191.00
241.00
200.40
261.73
Quarrying & Other Mining
1,150.00
1,150.00
1,150.00
1,150.00
1,150.00
2,470.36
1,325.45
1,412.45
1,639.45
1,644.76
Oil Refining
4,758.83
3,773.70
4,221.29
4,155.84
4,228.10
5,579.63
4,424.59
4,949.38
4,872.64
4,957.36
Cement
1,855.39
2,264.16
2,234.55
2,205.45
2,137.07
2,238.00
2,472.00
2,580.39
3,467.39
2,657.65
Other Manufacturing
1,855.39
1,855.39
1,855.39
1,855.39
1,855.39
1,950.61
1,891.01
2,188.01
1,852.01
1,941.84
Electricity
143.55
143.55
143.55
143.55
143.55
263.95
219.55
198.55
150.55
201.40
Water
213.03
213.03
213.03
213.03
213.03
197.65
225.15
234.89
192.69
212.70
Building & Construction
2,417.41
2,475.75
2,560.35
2,643.02
2,525.44
2,478.60
2,596.20
2,619.60
2,678.20
2,592.83
Wholesale and Retail Trade
2,417.41
2,417.41
2,417.41
2,417.41
2,417.41
2,418.18
4,112.18
3,172.18
2,879.18
3,078.07
Hotel and Restaurants
2,055.86
2,139.37
2,155.53
2,201.95
2,137.94
2,342.11
2,315.11
2,424.53
2,379.99
2,367.34
Road Transport
2,708.86
2,708.86
2,708.86
2,708.86
2,708.86
2,656.00
3,025.86
2,819.26
3,115.26
2,906.81
Rail Transport & Pipelines
416.14
416.14
416.14
416.14
416.14
424.32
424.32
424.32
424.32
424.32
Water Transport
246.05
299.28
318.07
356.65
305.72
250.57
304.77
323.91
363.20
311.34

369
Air Transport 819.87 999.74 1,061.21 1,218.89 1,031.79 936.87 1,198.40 1,288.40 1,268.40 1,176.02 Transport Services
1,743.24
2,120.35
2,253.48
2,526.81
2,176.34
1,809.17
2,200.55
2,338.71
2,622.37
2,258.65
Telecommunications
486.44
486.44
486.44
486.44
486.44
1,601.55
1,541.55
1,561.55
1,512.55
1,552.06
Post
395.89
377.85
391.43
461.99
407.72
407.10
388.54
402.52
475.07
419.26
Financial Institutions
535.43
565.65
615.35
647.08
590.42
1,132.43
1,241.43
1,356.43
1,409.99
1,284.45
Insurance
535.01
565.21
614.86
646.56
591.01
941.01
1,054.01
1,040.01
1,149.01
1,047.06
Real Estate
7,106.14
7,633.21
9,615.91
10,181.77
8,655.28
7,148.14
7,677.21
9,670.91
10,261.77
8,711.15
Business Services (Not Health or education)
4,864.45
4,864.45
4,864.45
4,864.45
4,864.45
6,058.04
5,488.04
5,548.04
7,748.04
6,171.16
Public Administration
2,720.69
2,720.69
2,720.69
3,060.78
2,805.71
2,970.65
2,970.15
2,969.00
3,339.97
3,062.47
Education
2,618.20
2,618.20
2,618.20
2,945.48
2,700.02
2,694.65
2,694.65
2,694.65
3,031.48
2,778.86
Health
2,953.43
2,953.43
2,953.43
3,322.61
3,045.73
3,051.86
3,051.86
3,051.86
3,433.34
3,147.23
Private Non Profit Organisations
817.08
817.08
817.08
919.21
842.61
756.66
756.66
756.66
851.24
780.30
Other Services
3,283.28
3,133.45
3,246.26
3,831.53
3,376.95
3,755.23
3,583.86
3,712.89
4,382.28
3,862.37
Broadcasting
407.02
407.02
407.02
457.89
419.74
462.86
462.99
462.78
520.58
477.31
Implicit Price Deflator 2,640.27
2,640.16
2,549.65
2,561.98
2,593.24
3,100.24
3,267.96
3,068.63
3,051.16
3,115.80

370
TABLE 7.4.4 Gross Domestic Product At Current Basic Prices
Percentage Distribution (=N=Million)
ACTIVITY SECTOR 2005 2006 Q1 Q2 Q3 Q4 Total Q1 Q2 Q3 Q4 Total
Crop Production 23.66 29.02 32.93 29.41 29.02 23.36 27.86 32.47 29.19 28.50 Livestock 2.31 2.29 2.03 2.03 2.15 2.19 2.03 2.10 1.88 2.04 Forestry 0.48 0.45 0.40 0.38 0.42 0.49 0.42 0.36 0.34 0.40 Fishing 1.19 1.20 1.20 1.09 1.17 1.12 1.06 1.08 0.99 1.06 Coal Mining 0.00 0.00 0.00 0.00 0.00 0.00 0.00 0.00 0.00 0.00 Crude Petroleum & Natural Gas 42.54 40.66 36.95 36.39 38.87 43.97 36.76 35.01 35.96 37.61 Metal Ores 0.00 0.00 0.00 0.00 0.00 0.00 0.00 0.00 0.00 0.00 Quarrying & Other Mining 0.10 0.12 0.13 0.12 0.12 0.18 0.12 0.14 0.15 0.15 Oil Refining 0.26 0.19 0.18 0.17 0.20 0.27 0.19 0.19 0.18 0.20 Cement 0.06 0.07 0.06 0.05 0.06 0.06 0.07 0.06 0.07 0.06 Other Manufacturing 0.57 2.37 2.18 4.68 2.57 0.51 2.02 2.22 4.04 2.31 Electricity 0.16 0.19 0.22 0.19 0.19 0.24 0.24 0.25 0.17 0.22 Water 0.01 0.01 0.01 0.01 0.01 0.01 0.01 0.01 0.01 0.01 Building & Construction 1.73 1.44 1.28 1.51 1.48 1.59 1.31 1.17 1.37 1.35 Wholesale and Retail Trade 15.78 11.14 11.78 12.92 12.82 14.49 16.78 14.01 13.99 14.77 Hotel and Restaurants 0.36 0.31 0.31 0.29 0.32 0.37 0.29 0.31 0.28 0.31 Road Transport 2.78 2.60 2.35 2.31 2.49 2.32 2.38 2.06 2.24 2.24 Rail Transport & Pipelines 0.00 0.00 0.00 0.00 0.00 0.00 0.00 0.00 0.00 0.00 Water Transport 0.01 0.01 0.01 0.01 0.01 0.01 0.01 0.01 0.01 0.01 Air Transport 0.02 0.02 0.02 0.03 0.02 0.02 0.02 0.02 0.02 0.02 Transport Services 0.11 0.12 0.12 0.15 0.13 0.10 0.10 0.10 0.13 0.11 Telecommunications 0.27 0.27 0.25 0.26 0.26 0.95 0.89 0.86 0.86 0.88 Post 0.01 0.01 0.01 0.01 0.01 0.01 0.01 0.01 0.01 0.01 Financial Institutions 0.91 0.93 0.80 0.86 0.87 1.59 1.63 1.45 1.56 1.55 Insurance 0.03 0.03 0.03 0.03 0.03 0.05 0.05 0.04 0.05 0.04 Real Estate 4.31 4.38 4.85 5.02 4.67 3.85 3.78 4.29 4.46 4.12 Business Services (Not Health or education)
0.26 0.25 0.20 0.18 0.22 0.27 0.23 0.20 0.24 0.23
Public Administration 0.88 0.82 0.71 0.77 0.79 0.80 0.72 0.64 0.69 0.71 Education 0.20 0.19 0.16 0.17 0.18 0.18 0.16 0.14 0.16 0.16 Health 0.05 0.05 0.04 0.05 0.05 0.05 0.04 0.04 0.04 0.04 Private Non Profit Organisations 0.00 0.00 0.00 0.00 0.00 0.00 0.00 0.00 0.00 0.00 Other Services 0.95 0.85 0.78 0.90 0.87 0.95 0.83 0.77 0.90 0.86 Broadcasting 0.01 0.01 0.01 0.01 0.01 0.01 0.01 0.01 0.01 0.01
Total 100.00 100.00 100.00 100.00 100.00 100.00 100.00 100.00 100.00 100.00

371
Table 7.4.5 Gross Domestic Product At 1990 Basic Prices
Percentage Distribution (=N=Million)
ACTIVITY SECTOR 2005 2006 Q1 Q2 Q3 Q4 Total Q1 Q2 Q3 Q4 Total
Crop Production 30.46 37.36 40.94 36.74 36.69 30.52 38.19 41.63 37.22 37.20 Livestock 2.97 2.82 2.40 2.36 2.61 2.96 2.87 2.43 2.38 2.63 Forestry 0.62 0.58 0.49 0.48 0.53 0.61 0.59 0.49 0.48 0.53 Fishing 1.52 1.48 1.25 1.25 1.36 1.52 1.50 1.25 1.25 1.37 Coal Mining 0.00 0.00 0.00 0.00 0.00 0.00 0.00 0.00 0.00 0.00 Crude Petroleum & Natural Gas 27.70 23.87 23.23 22.99 24.26 25.92 20.96 20.67 20.61 21.85 Metal Ores 0.00 0.00 0.00 0.00 0.00 0.00 0.00 0.00 0.00 0.00 Quarrying & Other Mining 0.22 0.27 0.30 0.27 0.27 0.23 0.29 0.31 0.28 0.28 Oil Refining 0.14 0.13 0.11 0.11 0.12 0.15 0.14 0.12 0.11 0.13 Cement 0.09 0.08 0.06 0.06 0.07 0.09 0.09 0.07 0.06 0.07 Other Manufacturing 0.81 3.38 3.00 6.46 3.60 0.82 3.49 3.11 6.66 3.71 Electricity 2.87 3.53 3.86 3.46 3.46 2.80 3.50 3.83 3.41 3.41 Water 0.14 0.14 0.11 0.11 0.12 0.15 0.14 0.12 0.11 0.13 Building & Construction 1.89 1.54 1.28 1.47 1.52 1.99 1.65 1.37 1.56 1.62 Wholesale and Retail Trade 17.24 12.17 12.42 13.70 13.75 18.58 13.34 13.55 14.83 14.95 Hotel and Restaurants 0.46 0.38 0.37 0.34 0.38 0.49 0.41 0.40 0.36 0.41 Road Transport 2.71 2.53 2.21 2.18 2.38 2.70 2.57 2.24 2.20 2.40 Rail Transport & Pipelines 0.00 0.00 0.00 0.00 0.00 0.00 0.00 0.00 0.00 0.00 Water Transport 0.07 0.06 0.05 0.05 0.06 0.06 0.06 0.05 0.05 0.06 Air Transport 0.06 0.06 0.05 0.06 0.06 0.06 0.06 0.05 0.06 0.06 Transport Services 0.17 0.15 0.14 0.15 0.15 0.17 0.15 0.14 0.15 0.15 Telecommunications 1.47 1.47 1.32 1.36 1.40 1.83 1.89 1.68 1.73 1.77 Post 0.06 0.06 0.05 0.05 0.06 0.07 0.07 0.06 0.06 0.06 Financial Institutions 4.47 4.32 3.31 3.40 3.81 4.36 4.29 3.27 3.38 3.77 Insurance 0.15 0.14 0.12 0.11 0.13 0.15 0.15 0.12 0.12 0.13 Real Estate 1.60 1.52 1.29 1.26 1.40 1.67 1.61 1.36 1.33 1.47 Business Services (Not Health or education) 0.14 0.14 0.11 0.10 0.12 0.14 0.14 0.11 0.10 0.12 Public Administration 0.85 0.80 0.67 0.64 0.73 0.83 0.79 0.66 0.63 0.72 Education 0.20 0.19 0.16 0.15 0.17 0.21 0.20 0.16 0.16 0.18 Health 0.05 0.04 0.04 0.04 0.04 0.05 0.05 0.04 0.04 0.04 Private Non Profit Organisations 0.00 0.00 0.00 0.00 0.00 0.00 0.00 0.00 0.00 0.00 Other Services 0.76 0.72 0.61 0.60 0.66 0.79 0.76 0.64 0.62 0.69 Broadcasting 0.09 0.08 0.07 0.07 0.07 0.09 0.08 0.07 0.07 0.08
Total 100.00 100.00 100.00 100.00 100.00 100.00 100.00 100.00 100.00 100.00

372
TABLE 7.4.6 Gross Domestic Product at Current Basic Prices (=N=Million)
2005
ACTIVITY SECTOR Q1 Q2 Q3 Q4 Total Agriculture 876,188.78 1,120,272.12 1,434,521.13 1,342,216.35 4,773,198.38
1.1 Crop Production 749,944.00 986,377.88 1,292,413.04 1,199,547.32 4,228,282.24 1.2 Livestock 73,375.52 77,684.62 79,503.85 82,688.33 313,252.32 1.3 Forestry 15,272.37 15,388.12 15,504.64 15,620.67 61,785.79 1.4 Fishing 37,596.90 40,821.50 47,099.60 44,360.03 169,878.03
Solid Mineral 3,074.99 4,038.63 5,285.75 4,902.15 17,301.53 2.1 Coal Mining 0.10 0.10 0.08 0.00 0.28 2.2 Metal Ores 2.43 5.26 3.56 3.65 14.90 2.3 Quarrying & Other Mining 3,072.46 4,033.28 5,282.11 4,898.50 17,286.35
Crude Petroleum & Natural Gas 1,348,242.20 1,382,231.50 1,450,210.10 1,484,199.40 5,664,883.21 Manufacturing 28,106.61 89,584.92 95,057.44 199,957.63 412,706.60
4.1 Oil Refining 8,194.71 6,462.91 7,247.40 7,132.44 29,037.47 4.2 Cement 1,929.07 2,452.74 2,174.67 1,945.36 8,501.84 4.3 Other Manufacturing 17,982.84 80,669.26 85,635.36 190,879.83 375,167.29
Telecommunication & Post 8,909.83 9,526.49 10,182.59 10,894.30 39,513.20 5.1 Telecommunications 8,606.41 9,226.20 9,860.42 10,500.97 38,194.00 5.2 Post 303.42 300.29 322.17 393.32 1,319.20
Finance & Insurance 29,698.36 32,474.51 32,419.30 36,157.28 130,749.45 6.1 Financial Institutions 28,761.00 31,471.62 31,314.59 34,981.17 126,528.38 6.2 Insurance 937.36 1,002.89 1,104.71 1,176.11 4,221.07
Wholesale and Retail Trade 500,300.84 378,698.99 462,163.26 527,088.21 1,868,251.30 Buiiding and Construction 54,746.48 48,992.60 50,388.13 61,658.92 215,786.12 Others 320,345.34 333,532.06 384,547.30 411,424.62 1,449,849.32
Total GDP at current price 3,169,613.44 3,399,351.82 3,924,774.99 4,078,498.85 14,572,239.11
GDP at current price – Growth Rate %
Oil 1,348,242.20 1,382,231.50 1,450,210.10 1,484,199.40 5,664,883.21 Non – Oil 1,821,371.24 2,017,120.32 2,474,564.89 2,594,299.45 8,907,355.90
Oil Growth 16.60 42.69 41.64 35.07 33.36 Non – Oil Growth 23.49 24.24 26.14 23.35 24.35
Contribution to GDP in (%) Agriculture (%) 27.64 32.96 36.55 32.91 32.76 Solid Mineral (%) 0.10 0.12 0.13 0.12 0.12 Crude Petroleum & Natural Gas (%) 42.54 40.66 36.95 36.39 38.87 Manufacturing (%) 0.89 2.64 2.42 4.90 2.83 Telecommunication & Post (%) 0.28 0.28 0.26 0.27 0.27 Finance & Insurance (%) 0.94 0.96 0.83 0.89 0.90 Wholesale and Retail Trade 15.78 11.14 11.78 12.92 12.82 Building and Construction 1.73 1.44 1.28 1.51 1.48 Others (%) 10.11 9.81 9.80 10.09 9.95
Sectoral Growth (%) Agriculture 21.37 21.47 24.51 21.19 22.27 Solid Mineral -6.86 28.19 68.04 41.93 32.57 Crude Petroleum & Natural Gas 16.60 42.69 41.64 35.07 33.36 Manufacturing 20.74 18.71 19.20 17.05 18.15 Telecommunication & Post 82.50 82.82 83.09 82.94 82.85 Finance & Insurance 26.99 26.99 27.02 27.00 27.00 Wholesale and Retail Trade 25.73 28.75 26.97 23.04 25.86 Building and Construction 25.85 29.86 31.65 32.38 29.93 Others 24.77 28.25 31.09 31.86 29.20 Overall Growth (Quarterly & Annual) 20.46 31.13 31.46 27.37 27.70
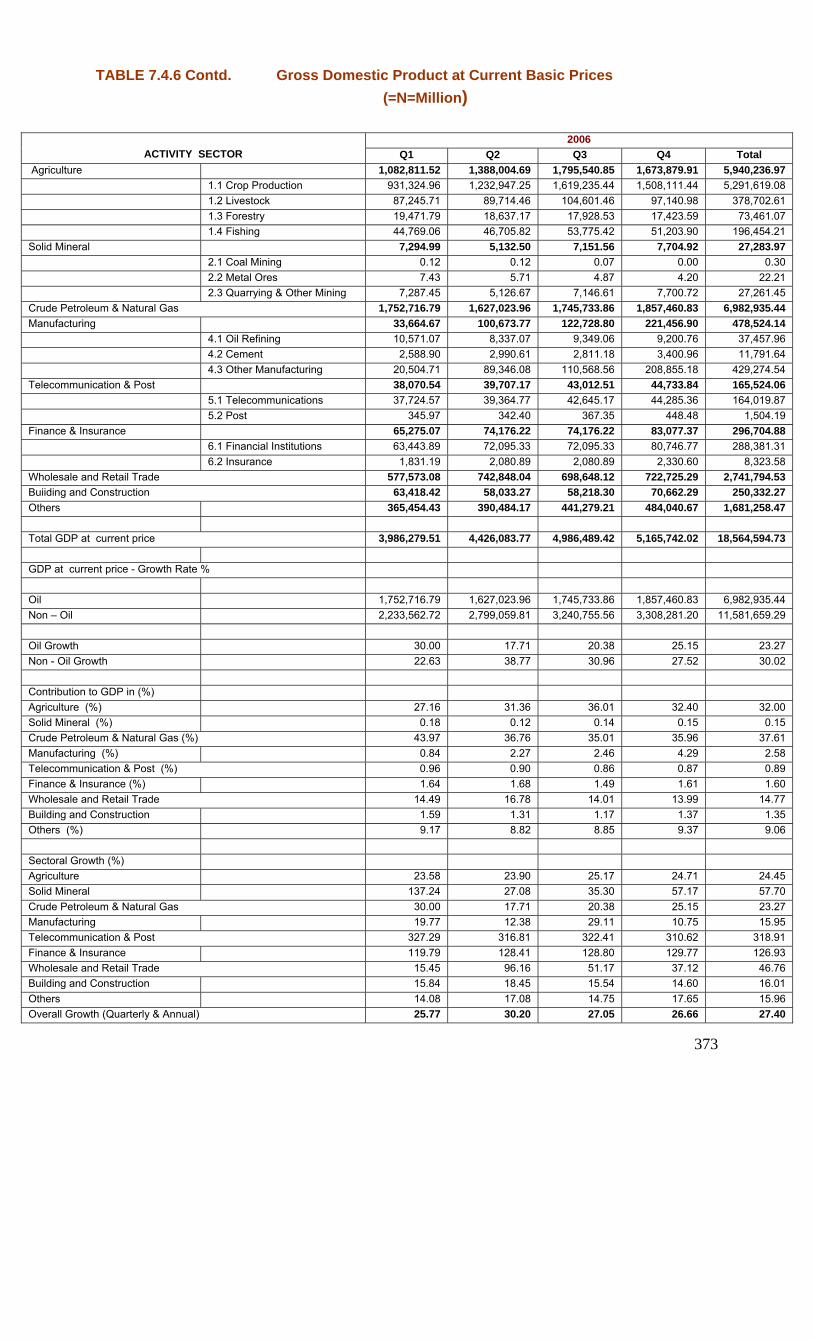
373
TABLE 7.4.6 Contd. Gross Domestic Product at Current Basic Prices (=N=Million)
2006
ACTIVITY SECTOR Q1 Q2 Q3 Q4 Total Agriculture 1,082,811.52 1,388,004.69 1,795,540.85 1,673,879.91 5,940,236.97
1.1 Crop Production 931,324.96 1,232,947.25 1,619,235.44 1,508,111.44 5,291,619.08 1.2 Livestock 87,245.71 89,714.46 104,601.46 97,140.98 378,702.61 1.3 Forestry 19,471.79 18,637.17 17,928.53 17,423.59 73,461.07 1.4 Fishing 44,769.06 46,705.82 53,775.42 51,203.90 196,454.21
Solid Mineral 7,294.99 5,132.50 7,151.56 7,704.92 27,283.97 2.1 Coal Mining 0.12 0.12 0.07 0.00 0.30 2.2 Metal Ores 7.43 5.71 4.87 4.20 22.21 2.3 Quarrying & Other Mining 7,287.45 5,126.67 7,146.61 7,700.72 27,261.45
Crude Petroleum & Natural Gas 1,752,716.79 1,627,023.96 1,745,733.86 1,857,460.83 6,982,935.44 Manufacturing 33,664.67 100,673.77 122,728.80 221,456.90 478,524.14
4.1 Oil Refining 10,571.07 8,337.07 9,349.06 9,200.76 37,457.96 4.2 Cement 2,588.90 2,990.61 2,811.18 3,400.96 11,791.64 4.3 Other Manufacturing 20,504.71 89,346.08 110,568.56 208,855.18 429,274.54
Telecommunication & Post 38,070.54 39,707.17 43,012.51 44,733.84 165,524.06 5.1 Telecommunications 37,724.57 39,364.77 42,645.17 44,285.36 164,019.87 5.2 Post 345.97 342.40 367.35 448.48 1,504.19
Finance & Insurance 65,275.07 74,176.22 74,176.22 83,077.37 296,704.88 6.1 Financial Institutions 63,443.89 72,095.33 72,095.33 80,746.77 288,381.31 6.2 Insurance 1,831.19 2,080.89 2,080.89 2,330.60 8,323.58
Wholesale and Retail Trade 577,573.08 742,848.04 698,648.12 722,725.29 2,741,794.53 Buiiding and Construction 63,418.42 58,033.27 58,218.30 70,662.29 250,332.27 Others 365,454.43 390,484.17 441,279.21 484,040.67 1,681,258.47
Total GDP at current price 3,986,279.51 4,426,083.77 4,986,489.42 5,165,742.02 18,564,594.73
GDP at current price - Growth Rate %
Oil 1,752,716.79 1,627,023.96 1,745,733.86 1,857,460.83 6,982,935.44 Non – Oil 2,233,562.72 2,799,059.81 3,240,755.56 3,308,281.20 11,581,659.29
Oil Growth 30.00 17.71 20.38 25.15 23.27 Non - Oil Growth 22.63 38.77 30.96 27.52 30.02
Contribution to GDP in (%) Agriculture (%) 27.16 31.36 36.01 32.40 32.00 Solid Mineral (%) 0.18 0.12 0.14 0.15 0.15 Crude Petroleum & Natural Gas (%) 43.97 36.76 35.01 35.96 37.61 Manufacturing (%) 0.84 2.27 2.46 4.29 2.58 Telecommunication & Post (%) 0.96 0.90 0.86 0.87 0.89 Finance & Insurance (%) 1.64 1.68 1.49 1.61 1.60 Wholesale and Retail Trade 14.49 16.78 14.01 13.99 14.77 Building and Construction 1.59 1.31 1.17 1.37 1.35 Others (%) 9.17 8.82 8.85 9.37 9.06
Sectoral Growth (%) Agriculture 23.58 23.90 25.17 24.71 24.45 Solid Mineral 137.24 27.08 35.30 57.17 57.70 Crude Petroleum & Natural Gas 30.00 17.71 20.38 25.15 23.27 Manufacturing 19.77 12.38 29.11 10.75 15.95 Telecommunication & Post 327.29 316.81 322.41 310.62 318.91 Finance & Insurance 119.79 128.41 128.80 129.77 126.93 Wholesale and Retail Trade 15.45 96.16 51.17 37.12 46.76 Building and Construction 15.84 18.45 15.54 14.60 16.01 Others 14.08 17.08 14.75 17.65 15.96 Overall Growth (Quarterly & Annual) 25.77 30.20 27.05 26.66 27.40

374
TABLE 7.4.7 Gross Domestic Product At 1990 Constant Basic Prices(=N=Million)
2005 ACTIVITY SECTOR Q1 Q2 Q3 Q4 Total
Agriculture 42,709.30 54,385.29 69,379.54 64,989.47 231,463.61
1.1 Crop Production 36,568.58 48,097.50 63,020.31 58,492.02 206,178.40 1.2 Livestock 3,569.09 3,631.18 3,688.36 3,755.22 14,643.86 1.3 Forestry 742.87 748.50 754.17 759.81 3,005.35 1.4 Fishing 1,828.77 1,908.10 1,916.70 1,982.42 7,636.00
Solid Mineral 268.44 353.42 461.15 427.84 1,510.85 2.1 Coal Mining 0.03 0.03 0.03 0.03 0.12 2.2 Metal Ores 1.24 2.67 1.81 1.85 7.56 2.3 Quarrying & Other Mining 267.17 350.72 459.31 425.96 1,503.16
Crude Petroleum & Natural Gas 33,248.19 30,733.62 35,762.76 36,600.95 136,345.54 Manufacturing 1,245.40 4,627.43 4,884.51 10,547.71 21,305.05
4.1 Oil Refining 172.20 171.26 171.69 171.62 686.77 4.2 Cement 103.97 108.33 97.32 88.21 397.83 4.3 Other Manufacturing 969.22 4,347.84 4,615.50 10,287.88 20,220.45
Telecommunication & Post 1,845.89 1,976.13 2,109.34 2,243.85 8,175.22 5.1 Telecommunications 1,769.25 1,896.66 2,027.04 2,158.72 7,851.66 5.2 Post 76.64 79.47 82.31 85.14 323.56
Finance & Insurance 5,546.78 5,741.20 5,268.61 5,587.94 22,144.52 6.1 Financial Institutions 5,371.57 5,563.76 5,088.94 5,406.04 21,430.31 6.2 Insurance 175.21 177.44 179.67 181.90 714.21
Wholesale and Retail Trade 20,695.71 15,665.46 19,118.09 21,803.81 77,283.06 Building and Construction 2,264.67 1,978.90 1,968.02 2,332.89 8,544.48 Others 12,224.55 13,294.00 14,981.57 14,658.95 55,159.07 Total GDP at 1990 constant price 120,048.9
2 128,755.46 153,933.59 159,193.42 561,931.40
5.32 5.88 6.79 7.68 6.51 GDP at 1990 constant price - Growth Rate %
Oil 33,248.19 30,733.62 35,762.76 36,600.95 136,345.54 Non – Oil 86,800.73 98,021.83 118,170.83 122,592.47 425,585.86
Oil Growth -1.97 -1.51 1.38 3.76 0.50 Non - Oil Growth 8.41 8.43 8.55 8.91 8.59
Contribution to GDP in (%) Agriculture (%) 35.58 42.24 45.07 40.82 41.19 Solid Mineral (%) 0.22 0.27 0.30 0.27 0.27 Crude Petroleum & Natural Gas (%) 27.70 23.87 23.23 22.99 24.26 Manufacturing (%) 1.04 3.59 3.17 6.63 3.79 Telecommunication & Post (%) 1.54 1.53 1.37 1.41 1.45 Finance & Insurance (%) 4.62 4.46 3.42 3.51 3.94 Wholesale and Retail Trade 17.24 12.17 12.42 13.70 13.75 Building and Construction 1.89 1.54 1.28 1.47 1.52 Others (%) 10.18 10.32 9.73 9.21 9.82
Sectoral Growth (%) Agriculture 6.84 7.01 7.08 7.21 7.06 Solid Mineral 9.51 9.53 9.54 9.55 9.53 Crude Petroleum & Natural Gas -1.97 -1.51 1.38 3.76 0.50 Manufacturing 9.12 8.98 9.77 9.88 9.61 Telecommunication & Post 29.36 29.42 29.65 29.93 29.61 Finance & Insurance 2.84 2.84 2.86 2.85 2.85 Wholesale and Retail Trade 11.95 13.82 14.18 14.22 13.51 Building and Construction 12.05 12.10 11.78 12.41 12.10 Others 7.43 7.44 7.40 7.51 7.45 Real Growth (Quarterly & Annual) 5.32 5.88 6.79 7.68 6.51

375
TABLE 7.4.7 (Contd) Gross Domestic Product At 1990 Constant Basic Prices (=N=Million)
2006 ACTIVITY SECTOR Q1 Q2 Q3 Q4 Total
Agriculture 45,781.60 58,432.97 74,430.84 69,953.54 248,598.95 1.1 Crop Production 39,237.64 51,727.35 67,649.95 63,007.31 221,622.25 1.2 Livestock 3,801.24 3,884.99 3,943.50 4,024.97 15,654.70 1.3 Forestry 788.40 793.18 799.27 805.37 3,186.22 1.4 Fishing 1,954.32 2,027.46 2,038.11 2,115.90 8,135.79
Solid Mineral 296.41 389.81 508.03 471.84 1,666.09 2.1 Coal Mining 0.03 0.03 0.03 0.03 0.13 2.2 Metal Ores 1.38 2.99 2.02 2.10 8.49 2.3 Quarrying & Other Mining 295.00 386.79 505.97 469.71 1,657.47
Crude Petroleum & Natural Gas 33,329.55 28,382.20 33,589.94 34,891.88 130,193.57 Manufacturing 1,356.33 5,034.19 5,351.22 11,564.13 23,305.87
4.1 Oil Refining 189.46 188.43 188.89 188.82 755.60 4.2 Cement 115.68 120.98 108.94 98.08 443.69 4.3 Other Manufacturing 1,051.19 4,724.78 5,053.38 11,277.22 22,106.58
Telecommunication & Post 2,440.49 2,641.71 2,822.21 3,022.26 10,926.67 5.1 Telecommunications 2,355.50 2,553.58 2,730.95 2,927.86 10,567.90 5.2 Post 84.98 88.12 91.26 94.40 358.77
Finance & Insurance 5,797.05 6,004.87 5,515.16 5,929.60 23,246.68 6.1 Financial Institutions 5,602.46 5,807.44 5,315.08 5,726.76 22,451.74 6.2 Insurance 194.60 197.43 200.08 202.84 794.94
Wholesale and Retail Trade 23,884.62 18,064.58 22,024.23 25,101.78 89,075.20 Building and Construction 2,558.64 2,235.32 2,222.41 2,638.42 9,654.79 Others 13,135.10 14,252.99 16,034.72 15,730.98 59,153.79 Total GDP at 1990 constant price 128,579.79 135,438.63 162,498.77 169,304.43 595,821.61
7.11 5.19 5.56 6.35 6.03 GDP at 1990 constant price - Growth Rate % Oil 33,329.55 28,382.20 33,589.94 34,891.88 130,193.57 Non – Oil 95,250.23 107,056.43 128,908.82 134,412.55 465,628.04
Oil Growth 0.24 -7.65 -6.08 -4.67 -4.51 Non - Oil Growth 9.73 9.22 9.09 9.64 9.41
Contribution to GDP in (%) Agriculture (%) 35.61 43.14 45.80 41.32 41.72 Solid Mineral (%) 0.23 0.29 0.31 0.28 0.28 Crude Petroleum & Natural Gas (%) 25.92 20.96 20.67 20.61 21.85 Manufacturing (%) 1.05 3.72 3.29 6.83 3.91 Telecommunication & Post (%) 1.90 1.95 1.74 1.79 1.83 Finance & Insurance (%) 4.51 4.43 3.39 3.50 3.90 Wholesale and Retail Trade 18.58 13.34 13.55 14.83 14.95 Building and Construction 1.99 1.65 1.37 1.56 1.62 Others (%) 10.22 10.52 9.87 9.29 9.93
Sectoral Growth (%) Agriculture 7.19 7.44 7.28 7.64 7.40 Solid Mineral 10.42 10.30 10.17 10.29 10.28 Crude Petroleum & Natural Gas 0.24 -7.65 -6.08 -4.67 -4.51 Manufacturing 8.91 8.79 9.55 9.64 9.39 Telecommunication & Post 32.21 33.68 33.80 34.69 33.66 Finance & Insurance 4.51 4.59 4.68 6.11 4.98 Wholesale and Retail Trade 15.41 15.31 15.20 15.13 15.26 Building and Construction 12.98 12.96 12.93 13.10 12.99 Others 7.45 7.21 7.03 7.31 7.24

376
Appendix II
NATIONAL BUREAU OF STATISTICS (NBS), CENTRAL BANK OF NIGERIA (CBN) AND NATIONAL COMMUNICATION COMMISSION
(NCC) COLLABORATIVE SURVEY ON SOCIO-ECONOMIC ACTIVITIES IN NIGERIA 2006
2.0 SAMPLE DESIGN FOR GHS AND NASS (PRIVATE FARMERS)
Introduction:
The sample design for the survey is based on the National Integrated Survey of Household (NISH) developed by National Bureau of Statistics (NBS). The NISH design employed a replicated sampling design that is technique by which many sample (replicates) were selected independently from a population such that each replicate sample represents the population. Essentially, the NISH sample design is a 2-stage replicated and rotated cluster sample design with Enumeration Areas (EAs) as first stage sampling unit or Primary Sampling Unit (PSU) and Housing Units the second stage sampling units (secondary sampling units). Generally, for each state of the Federation, the NISH Master Sample is made up of 120 EAs drawn in12 replicates. A replicate consists of 10 EAs.
Selection Procedures: The EAs demarcated by the National Population Commission (NpopC) for the 1991 Population Census served as the primary Sample Frame for the design.
First Stage Selection:
Sixty EAs were selected with equal probability from the list of EAs in each state of the federation and 30 EAs for FCT, Abuja. The selected EAs cuts across rural and urban sectors. The study EAs for the collaborative survey were drawn from replicates 7,8,9,10,11 and 12 of the master sample of each state.
Second Stage Selection: In each selected EA, a listing of housing units was carried out. The result provided the frame for the second stage selection. Ten housing units were selected systematically in each EA after the completion of the listing exercise. Thereafter, all the households within the selected HUs were interviewed using GHS questionnaire. In the NASS (Private Farmers), a total of 32,850 Farming Housing Units (FHUs) drawn from 2,190 EAs were selected for interview for this survey. In each state, 900 farming housing units drawn from 60EAs, were selected for studies. Four hundred and fifty farming housing units from 30 EAs were selected for study in FCT, Abuja. In each EA, 5 FHUs were studied for crop farming, 5FHUs were covered for livestock and 5FHUs for fishery
Estimation Procedures: Let the probability of selecting the EA be fj and the probability of selecting the housing unit be fk. Then the product f = fjfk = 1 where fj = n and fk = h Wj k N H.

377
For GHS: ˆ n h Yi= N ∑ H ∑ X ijk n j=1 h k=1 n h = N H ∑ ∑ Xijk
n h j=1 k=1
n h = W ijk ∑ ∑ X ijk (Note: W ijk = N . H )
j = 1 k=1 n h Where: ˆ Yi = Estimate for states
N = Total Number of EAs in ith state n = Selected number of EAs in state H = Total number of Housing Units listed in the jth EA h = Selected number of Housing Units in the jth EA. X ijk = Value of the element in the kth housing unit of jth EA in i th state. W ijk = Weight of the element in kth housing unit of the jth EA in ith state.
For NASS (Private Farmers) ˆ n m Yi = N ∑ FH ∑ X ijk n j=1 m k=1 n m = N FH ∑ ∑ X ijk n m j=1 k=1 n m = W ijk ∑ ∑ X ijk j=1 k=1
Where Yi = Estimate for states N = Total number of EAs in the ith State n = Selected number of EAs in the ith State FH = Total number of farming housing units listed. m = Selected number of farming housing units
X ijk = Value of the element in the kth housing unit of jth EA in the ith state.
W ijk = Weight of the element in kth housing unit of the jth EA in the ith state.
National Estimate:
^ 37 ^ YN = Σ Yi i=1
^ ^ where YN is the National Estimate and Yi is the Estimate for states .

378
Variance Estimate (Jackknife Method) Estimating variances using the Jackknife method will require forming replicate from the full sample by randomly eliminating one sample cluster [Enumeration Area (EA) at a time from a state containing k EAs, k replicated estimates are formed by eliminating one of these, at a time, and increasing the weight of the remaining (k-1) EAs by a factor of k/(k-1). This process is repeated for each EA. For a given state or reporting domain, the estimate of the variance of a rate, r, is given by k Var(r ) = (Se)2 = 1 Σ (ri – r)2 k(k-1) i=1 where (Se) is the standard error, k is the number of EAs in the state or reporting domain. r is the weighted estimate calculated from the entire sample of EAs in the state or reporting domain.
ri = kr - (k - 1)r(i), where r(i) is the re-weighted estimate calculated from the reduced sample of k-1 EAs. To obtain an estimate of the variance at a higher level, say, at the national level, the process is repeated over all states, with k redefined to refer to the total number of EAs (as opposed to the number in the states).

379
Appendix III 3.0 SAMPLE DESIGN FOR NATIONAL INTEGRATED SURVEY OF
ESTABLISHMENT Introduction:
Designing an efficient sample for establishment surveys requires a broad understanding of the sectors in the economy and practical experience in sampling techniques. The final sample selection for this collaborative survey is arrived at through combinations of experiences in establishment surveys by both the Central Bank of Nigeria (CBN), National Communication Commission (NCC) and the National Bureau of Statistics (NBS).
The Establishment frame used for the selection:
In order to have a broad-based list of business and industrial establishments, the establishment frames from the Central Bank of Nigeria and National Bureau of Statistics were merged together. The merged frame was cleaned and validated. The cleaned and validation of the frame involve the following:
(i) Elimination of duplications (ii) Removing death or moribund establishments from the frame (iii) Filling in missing information where feasible.
This exercise is made possible through the combined efforts of the Economic Survey and Census Division, the National Accounts Division and the Methodology Division of NBS.
Samples of 2,750 were selected from a frame of 15,556 from 14 sectors of the economy namely:
(i) Agriculture, Hunting and Forestry (163) (ii) Fishing (10) (iii) Mining and Quarrying (75) (iv) Manufacturing including Petroleum Oil and Gas (769) (v) Building & Construction (137) (vi) Wholesale and Retail Trade (450) (vii) Hotel and Restaurants; (155) (viii) Organized Road Transport, (200) (ix) Financial Intermediation (233) (x) Private Professional Services (558)
Selection Parameters: The following parameters are considered in the allocation of establishments to each sector and state.
(i) Contribution of each sector to the Gross Domestic Products (GDP) (ii) Number of establishment in each sector by state. (iii) A prior knowledge of sectoral performance in the economy. Selection Procedure: Basically, the sample design used for this survey was a two-level Probability Proportion to size (PPs) in which the contribution of each sector to the GDP formed the basis of allocation at the first level while the basis of allocation at the second level was the number of establishments in each sector. A priori (purposive) allocation was also used to complement and boost the efficiency of the design.

380
Overall Sample Size: The overall sample of establishments selected for this collaborative survey was 2,750. In arriving at this sample size, account was taken of the constraints imposed by limitation of resources, the need to ensure a manageable and controllable sample structure and the three important levels at which data are required for planning purposes, viz National, Zonal and state levels but basically, the estimates would be at national level. Estimation Procedure: If the sample of ‘n’ establishments is allocated to each sector with probabilities proportional to their sizes (contribution to GDP), say
Pi = Mi and M0 = ∑Mi
Mo then the unbiased estimate of population (all establishments) total is given by:
n ^ 1 ∑ yi ypps = n i=1 Pi
and the estimate of the variance is given by: ^ n ^
V(ypps) = 1 ∑ Pi[ yi - ypps]2
n i=1 Pi
The unbiased estimator of the variance of the above estimator is given by:
ˆ n 2 ˆ
V (ypps) = 1 [ ∑ yi - nypps2 ]
n(n – 1) i=1 Pi

381
Appendix IV
4.0 LIST OF CONCEPTS AND DEFINITIONS ON NATIONAL INTEGRATED SURVEY OF HOUSEHOLD (NISH)
(i) Household Facilities:
These are the facilities available in the dwelling, such as toilets and kitchen, etc. Major source of lighting, drinking water and fuel most commonly used for cooking, are also included.
(ii) Household A household consists of a person or a group of persons who live together in the same house or compound sharing the same house keeping arrangements and catered for as one unit.
(iii) Housing Unit
A housing unit is a unit of accommodation, which is occupied by one or more households.
(iv) House Keeping
These are activities which a person engages in within the household and which does not attract any payment or any payment or any form of remuneration.
(v) Literacy
A person is literate if he can read and write in any language, and can carry out simple activities such as writing letters or engage in simple conversation in a language.
(vi) Economy Activity
This is a form of work of services rendered by a person in order to contribute to the national accounts and are a component of the gross domestic product (GDP).
(vii) Occupation This refers to the type of work, trade or profession that a person does to earn a living. Examples are: (a) Executive, Managers, Senior Officials including those who
decide policies or plan, direct and coordinate the policies and activities of enterprises/establishments or their internal departments or sections.
(b) Professionals which require high level of professional
knowledge and experience in the field of physical and life sciences or social sciences and humanities. E.g. computer programmer, engineer, doctor, teacher, etc.
(c ) Technicians and Associate Professionals are those who carry
out technical work requiring technical knowledge and experience in the same fields as professionals, but at a lower skill level.
(d) Clerks are those whose main task require the knowledge and
experience necessary to organize, store, compute and retrieve information. E.g. Office Secretary, Library Clerk, Cashier, Telephone Operators, etc.

382
(e) Service Workers/Shop and Market Sales Workers are those
people who provide services related to travel, house-keeping, catering, personal care, protection of individuals and property, services related to maintaining law and order, or selling goods in shops or at market. E.g. travel guide, cook, child-care workers, police officer, shop assistant, security guard etc.
(f) Skilled Agriculture and Fishery Workers are those whose task
require the knowledge and experience necessary to produce farm, forestry and fishery products. E.g. Poultry Producers, markets gardeners, loggers, fishery workers, subsistence farmers etc.
(g) Craft and Related Trade Workers are those whose task
requires the knowledge and experience of skilled traders or handicrafts, including an understanding of materials and tools to the used and of all stages of the production process. E.g. miner, carpenter, painter, welder, electrical mechanic, glassmaker, handcraft worker, baker, butcher, tailor etc.
(h) Plant machine Operators and Assemblers are those whose
task requires the knowledge and experience to operate and monitor large scale and often highly automated industrial machinery and equipment. E.g. wood processing plant operator, printing machine operator, electronic equipment assembler, and bus driver crane operator etc.
(i) Elementary Occupations involve, mostly simple and routine task
using hand-held tools and in some cases considerable physical strength. E.g. janitor, messenger, labourer, garbage collector etc.
(viii) Status in Employment
This gives an indication of the nature of a person’s working situation. (a) Employees
These are workers with employment contracts (explicit or implicit, written or oral), which give them a basic remuneration in cash (in form of wages, salaries, bonuses, commission from sales, piece rates etc) or in kind (in form of food, fuel, housing or training). These include paid apprentices and paid trainees, casual and seasonal workers, employees of producers’ cooperative, etc. whether in the private or public sector.
(b) Employers These include those who work on their own account or with one or a few partners and they may engage, on a continuous or regular basis, one or more persons to work for them in their business as employees. Their business may be a corporation or a household or unincorporated enterprise.
(c ) Own-Account Workers These include those who work on their own account or with one or more partners and do not engage any employee on a continuous or regular basis. However, they may engage employees as long as it is not on a regular or continuous basis and they may work with the help of (unpaid) contributing family workers.

383
(d) Members of Producers’ Cooperatives These are those who work in a cooperative environment, producing goods and services, in which each member takes part on an equal footing with other members in determining the organization of production, sales and other work, etc.
(e) Contributing Family Workers
These are those who work in a market-oriented establishment operated by a relation living in the same household who is not a partner in the business. They include young persons who work without pay in a business operated by a relation (e.g. Uncle, grandmother) and do not necessarily live in the same household.
(f) Others This is the residual category of workers who could not be classified under any of the previously mentioned groups.

384
Appendix V
5.0 LIST OF CONCEPTS AND DEFINITIONS FOR NATIONAL INTEGRATED SURVEY OF ESTABLISHMENT (NISE)
1.0 HOTELS AND RESTAURANTS (i) Number of Persons Engaged:
Include working proprietors and active partners, managers and directors of corporation working for pay, unpaid family workers, apprentices and others who work in the establishment for at least one-third of the normal work time without regular pay as well as paid employees.
(ii) Number of Paid Employees (Total Employment)
Include persons working in the establishment and receiving pay, as well as persons working away from the establishment who are paid by and under the control of the establishment) excluding home workers). These include all workers whether part-time, on paid sick leave or training.
(iii) Operatives:
These include cooks, stewards, bar attendants, drivers, cleaners, security personnel, etc.
(iv) Lodgers and Lodger-Nights:
Lodgers are paying guests lodging for the night in the hotel. Lodger-nights are number of night spent by lodgers in the hotel in a time period. For Example, if a hotel has 20 beds and lodgers occupied 18 beds in a night, the lodger-night for this day is 18. The same calculation must be carried out for each day in a month.
(v) Income from Accommodation:
This is the income received from room accommodation.
(vi) Cost of Goods Sold: The total value of all goods for which ownership has been changed to others.
(vii) Stock/Inventories:
These comprise the value of all stocks owned by the company and held by or under the control of the establishment. Excluded are materials owned by others but held by the establishment for processing. Stocks acquired from others should be valued at “Purchaser’s prices”. (Book values are acceptable).Give details of the value of stocks/inventors at the end of each quarter.
MANUFACTURING (i) Kind of Activity
This is to show the type of activity e.g. Manufacturing or industrial activity.
(ii) LEVEL OF EMPLOYMENT (a) Number of Persons Engaged:
Include working proprietors and active partners, managers and directors of corporation working for pay, unpaid family workers, apprentices and other who work in the establishment for at least one-third of the normal work time regular pay as well as paid employees.

385
(b) Number of Paid Employees (Total Employment): Include persons working in the establishment and receiving pay, as well as persons working away from the establishment who are paid by and under the control of the establishment (excluding home workers). These include all workers whether part-time, on paid sick leave or training.
(c ) Wages and Salaries and Supplementary Benefits: Include compensation paid top workers.
(iii) Operatives: These relates to employees who are directly engaged in production in contrast to overhead activities of the establishment e.g. persons engaged in fabricating, processing or assembling, warehouse-men, truck drivers, maintenance workers etc.
(iv) Cost of Operation:
This is the total cost of materials, parts, components, containers, suppliers etc. purchased; purchased fuels, cost of contract and commission work done for you by others; electricity generated for own use and other operating expenses.
Cost of production should not include Compensation of Employees.
(v) Production: Quarterly output of principal product is requested under this item. Description of Product:
List important goods, which were produced during the quarter. This refers to unit of measurement of Quantity which should be in standard form, e.g. metric tons, litres, metres, kilogram, etc.
Output Value: Enter value of goods produced during the quarter. Validation should be at ex-factory price excluding charges for transportation or delivery and any discounts, rebates allowed to the buyer, but including such taxes as excise duty and sales tax.
(vi) Installed Production Capacity:
Enter installed or rated capacity of your plant and machinery (per quarter) for each principal product. This is expected to be above, or equal to, your quarterly output, the latter, if you are producing to capacity and the former if you are producing below capacity.
(vii) Stock/Inventories:
These comprise the value of all stocks owned by the company and held by or under the control of the establishment. Excluded are materials owned by others but held by the establishment for processing. Stocks acquired from others should be valued at “purchaser’s prices”. (Book value are acceptable). Give details of the value of stocks/investors at the end of each quarter.

386
PRIVATE PROFESSIONAL SERVICES 1. Kind of Professional Activity:
This is a specialised kind of vocation such as “legal profession”, “medical profession”, “Real Estate Profession”, etc.
2. Professional Employees:
Include employees whose qualifications are registered with a government recognised professional association such as:
(a) Nigeria Bar Association (b) Nigeria Medical Association (c) COREN
3. Sub-Professional Employees:
Include employees who have completed studies beyond the secondary level or above but who are not qualified to be listed as professionals.
4. Clerks and other Workers:
Include employees whose work support that of professionals and sub-professional employees.
5. Wages and Salaries and Supplementary Benefits:
Include wages and salaries and supplementary benefits paid to workers.
6. Stock/Inventories: These comprise the value of all stocks owned by the company and held by or under the control of the establishment. Excluded are materials owned by others but held by the establishment for processing. Stocks acquired from others should be valued at “purchaser’s prices”. (Book values are acceptable). Give details of the value of stocks/investors at the end of each quarter.
MINING & QUARRYING
1. Kind of Activity: This is to show the type of activity e.g. Mining, Milling, Quarrying.
2. Number of Persons Engaged:
Include working proprietors and active partners, managers and directors of corporation working for pay, unpaid family workers, apprentices and others who work in the establishment for at least one-third of the normal working time without regular pay as well as paid employees.
3. Number of Paid Employees (Total Employment):
Include persons working in the establishment and receiving pay, as well as persons working away from the establishment who are paid and under the control of the establishment (excluding home workers). These include all workers, part-time, on paid sick leave or training.
4. Wages and Salaries and Supplementary Benefits:
Include wages and salaries and supplementary benefits paid to workers.

387
5. Operatives: This relates to employees who are directly engaged in production in contrast to overhead activities of the establishment e.g. persons engaged in fabricating, processing or assembling, warehouse-men, truck drivers, maintenance workers, etc.
6. Cost of Production:
This is the total cost of materials, parts, components, containers, suppliers, etc. purchased fuels, cost of contract and commission work done for you by others; electricity generated for own use and other operating of expenses.
7. Production:
Monthly output of principal product is requested under this item.
Description of Product: List important goods, which were produced during the quarter. This refers to unit of measurement of Quantity which should be in standard form, e.g. metric tons, litres, metres, kilogram, etc.
Output Value: Enter value of goods produced during the quarter. Validation should be at ex-factory price excluding charges forB transportation or delivery and any discounts, rebates allowed to the buyer, but including such indirect taxes as excise duty and sales tax.
8. Stock/Inventories: These comprise the value of all stocks owned by the company and held by or under the control of the establishment. Excluded are materials owned by others but held by the establishment for processing. Stocks acquired from others should be valued at “purchaser’s prices”. (Book values are acceptable). Give details of the value of stocks/investors at the end of each quarter.
ROAD TRANSPORT OPERATORS 1. Kind of activity:
This includes road transportation of goods and passengers.
2. Number of Persons Engaged: This include working proprietors and active partners, managers and directors of corporation working for pay, unpaid family workers, apprentices and others who work in the establishment for at least one-third of the normal work time without regular pay as well as paid employees.
3. Number of Paid Employees (Total Employment):
Include persons working in the establishment and receiving pay, as well as persons working away from the establishment who are paid by and under the control of the establishment (excluding home workers). These include all workers whether part-time, on paid sick leave or training.
4. Operatives (Labour & Service Workers):
This relates to employees who are directly engaged in transportation in contrast to overhead activities of the establishment e.g. drivers, mechanic, conductors, etc.
5. Wages and Salaries and Supplementary Benefits:
Include wages and salaries and supplementary benefits.

388
6. Stock/Inventories:
These comprise the value of all stocks owned by the company and held by or under the control of the establishment. Excluded are materials owned by others but held by the establishment for processing. Stocks acquired from others should be valued at “purchaser’s prices”. (Book values are acceptable).
Give details of the value of stock/investors at the end of each quarter.
WHOLESALE & RETAIL 1. Number of Persons Engaged:
This include working proprietors and active partners, managers and directors of corporation working for pay, unpaid family workers, apprentices and others who work in the establishment for at least one-third of the normal work time without regular pay as well as paid employees.
2. Number of Paid Employees (Total Employment):
Include persons working in the establishment and receiving pay, as well as persons working away from the establishment who are paid by and under the control of the establishment (excluding home workers). These include all workers whether part-time, on paid sick leave or training.
3. Operatives:
These are shop assistants, sales attendants, driver(s) etc. 4. These wages and salaries and supplementary benefits.
5. (i) Sales: These are the total receipts.
(ii) Other Incomes: These include discount granted,
bonuses, etc
((iii) Cost of Goods Sold:These include total payment for all goods bought for resale.
(iv) Other Costs: These include total payment for rent, electricity transportation, rates, etc
These should not include Compensation of Employees
6. Stock/Inventories:
These comprise the value of all stock owned by the company and held by or under the control of the establishment. Excluded are materials owned by others but held by the establishment for processing. Stocks acquired from others should be valued at “purchaser’s prices”. (Book values are acceptable). Give details of the value of stocks/investors at the end of each quarter.
BUILDING & CONSTRUCTION
1. Kind of Activity: This is to show the type of activity e.g. Building, Civil Engineering or other Construction.
2. Number of Persons Engaged:
This include working proprietors and active partners, managers and directors of corporation working for pay, unpaid family workers,

389
apprentices and others who work in the establishment for at least one-third of the normal work time without regular pay as well as paid employees.
3. Number of Paid Employees (Total Employment):
Include persons working in the establishment and receiving pay, as well as persons working away from the establishment who are paid by and under the control of the establishment (excluding home workers). These include all workers whether part-time, on paid sick leave or training.
4. Artisans: These are skilled workers
5. Wages and Salaries and Supplementary Benefits:
Include wages and salaries and supplementary benefits paid to workers
6. Number of Construction Work Started and Number Completed: (i) A building is deemed to have started if in addition to site
preparation, the foundation of the building is laid.
(ii) Other projects are roads, bridges, ports and harbours, inland waterways, canals, railways, airway, stadia, etc.
(iii) If buildings and other projects are started or completed in other
states besides the state in which the firm is located, details of the states and the number of buildings or projects started or completed should be shown in a separate list, and attached to the questionnaire.
7. Value of Work Done (GROSS):
Include receipts from all construction activities done for an independent owner, investor and the value of construction on your own account. This is the total value of work done during the quarter(s).
8. Other Income Received:
Include receipt from hire of plants and machinery, sales of plants in the same condition as purchased, fixed assets and other receipt excluding receipts from construction work.
9. Cost of Materials, Supplies, etc:
Include materials that are physically incorporated in the construction work, etc. such as Wall and Decking materials, timber and wood, bitumen, laterite, granites, etc. used in construction work. Others include petrol and other fields for vehicles, cost of electricity purchased during the quarter from NEPA, etc.
10. Stock/Inventories:
These comprise the value of all stocks owned by the company and held by or under the control of the establishment. Excluded are materials owned by others but held by the establishment for processing. Stocks acquired from others should be value at “purchaser’s prices”. (Book values are acceptable). Give details of the value of stocks/investors at the end of each quarter.