revista vol.i 2011 final
TRANSCRIPT

Journal of Marine Technology and Environment Vol.I, year 2011

ISSN 1844-6116

JOURNAL OF MARINE TECHNOLOGY AND ENVIRONMENT YEAR IV, 1/2011 ISSN 1844 – 6116 JOURNAL OF MARINE TECHNOLOGY AND ENVIRONMENT
This Journal has been founded in 2008 as a biannual publication of Constanta Maritime University/ROMANIA
TOPICS
• Marine Science and Engineering • Marine Environmental Issues • Marine Renewable Energy and Sustainability • Maritime Safety • Marine Chemistry • Marine Corrosion and Material Science • Ship Design, Building Technologies • Ocean Engineering • Advanced Technologies for MET • Advances in numerical methods for marine engineering • Algorithms for multidisciplinary problems in marine engineering
and other related topics Editor in Chief Feiza MEMET (Constanta Maritime University/ROMANIA) Associate Editors Prof. Dumitru DINU, Ph.D. (Constanta Maritime University/ROMANIA) Prof. Nicolae BUZBUCHI, Ph.D. (Constanta Maritime University/ROMANIA) Prof. Ricardo Rodriguez - MARTOS DAUER, Ph.D. (Departament de Ciencia I Enginyeria Nautiques/Universitat Politecnica de Catalunya/SPAIN) Prof. Osman Kamil SAG, Ph.D. (Piri Reis University/TURKEY) Prof. Suleyman OZKAYNAK, Ph.D. (Piri Reis University/TURKEY) Prof. Boyan Kirilov MEDNIKAROV, Ph.D. (Naval Academy ”Nikola Y Vaptsarov”/BULGARIA) Prof. Amable LOPEZ, Ph.D. (Universidad Politecnica de Madrid/SPAIN) Prof.Takeshi NAKAZAWA, Ph.D. (World Maritime University/SWEDEN) Prof. Razvan TAMAS, Ph.D. (Constanta Maritime University/ROMANIA) Prof. Radu MIHALCEA, PH.D. (University of Illinois at Chicago/USA) Prof. Gheorghe SAMOILESCU, Ph.D. (“Mircea cel Batran” Naval Academy/ROMANIA) Prof. Remus ZAGAN, Ph.D. (“Ovidius” University of Constanta/ROMANIA) Prof. Adriana Teodora MANEA, Ph.D. (“Ovidius” University of Constanta/ROMANIA) Prof. Ab. Saman BIN ABD KADER (Universiti Teknologi Malaysia) Prof. Kiril Tenekedjiev (Naval Academy”Nikola Y.VAPTSAROV”/BULGARIA) Editorial Secretary Ass .Prof. Alexandra RAICU, Ph.D. (Constanta Maritime University/ROMANIA) Ass. Prof. Louis DUMITRACHE, Ph.D. (Constanta Maritime University/ROMANIA) Ass. Prof. Liviu STAN, Ph.D. (Constanta Maritime University/ROMANIA) Ass. Prof. Mihaela BARHALESCU, Ph.D. (Constanta Maritime University/ ROMANIA)

JOURNAL OF MARINE TECHNOLOGY AND ENVIRONMENT
Secretariate: Toma Anisoara Radu Mirela Scientific Board Cornel PANAIT (Constanta Maritime University/ROMANIA) Paul BOCANETE (Constanta Maritime University/ROMANIA) Eugen BARSAN (Constanta Maritime University/ROMANIA) George CARUNTU (Constanta Maritime University/ROMANIA) Emil OANTA (Constanta Maritime University/ROMANIA) Darie TUDOR (Constanta Maritime University/ROMANIA) Laurentiu Claudiu MANEA (“Ovidius” University of Constanta/ROMANIA) Titi TURCOIU (Romanian-American University/ROMANIA) Marin NEDEV (Naval Academy”Nikola Y. VAPTSAROV”/BULGARIA) Chavdar ALEXANDROV (Naval Academy”Nikola Y.VAPTSAROV/BULGARIA) Marcel la CASTELLS i SANABRA (Departament de Ciencia i Enginyeria Nautiques/Universitat Politecnica de Catalunya/ SPAIN) Santiago ORDAS JIMENES (Departament de Ciencia i Enginyeria Nautiques/Universitat Politecnica de Catalunya/SPAIN) Francesc Xavier MARTINEZ DE OSES (Departament de Ciencia i Enginyeria Nautiques/Universitat Politecnica de Catalunya/ SPAIN) Teresa J.LEO (Universidad Politecnica de Madrid/ SPAIN) Miguel Angel HERREROS (Universidad Politecnica de Madrid/ SPAIN) Michael BALDAUF (World Maritime University/SWEDEN) Nikolay Angelov ANGELOV (Naval Academy “Nikola Y Vaptsarov”/BULGARIA) Blagovest Chanev BELEV (Naval Academy “Nikola Y Vaptsarov”/BULGARIA) Ivan Enchev IVANOV (Naval Academy “Nikola Y Vaptsarov”/BULGARIA) Nikolai Zhelev KOLEV (Naval Academy “Nikola Y Vaptsarov”/BULGARIA) Dimitar Svetlozarov GUEORGUIEV (Technical University of Varna/BULGARIA) Bohos Rupen APRAHAMIAN (Technical University of Varna/BULGARIA) Wan Mohd Norsani B. WAN NIK (University Malaysia Terengganu/MALAYSIA) Sulaiman OLADOKUN Olanrewaju (University Malaysia Terengganu/MALAYSIA)
JOURNAL ADDRESS Journal of Marine Technology and Environment
Constanta Maritime University, 104, Mircea cel Batran Street, 900663, Constanta, Romania
Tel: +40 241 664 740/ 107 Fax: +40 241 617 260 E-mail: [email protected]
http://cmu-edu.eu/jmte/
EDITURA NAUTICA Constanta Maritime University
Constanta Maritime University, 104, Mircea Cel Batran Street, 900663, Constanta, Romania

CONTENTS
1.
INFLUENCE OF POWER SOURCE PARAMETERS IN INDUCTION HEATING OF BEARING BUSHINGS OF SHIP PROPELLER SHAFTS 1APRAHAMIAN BOHOS, 2STREBLAU MAIK, 3MARINOVA MARIA 1,2,3Technical University, Varna, Bulgaria …………………………………………
9
2.
SUSTAINABLE DEVELOPMENT PROGRAM AT THE FACULTY OF NAUTICAL STUDIES OF BARCELONA. NAUTICAL ENGINEERING EDUCATION 1CASTELLS M., 2MARTÍN A., 3ORDAS S, 4AGUILAR S., 5SOLÉ M. 1,2,3,4,5Universitat Politècnica de Catalunya, Spania...........................................
17
3.
MILITARY PROMOTIONS OF NAUTICAL TEACHERS BY THE END OF THE 18TH CENTURY: REWARD FOR MERITS OR A MEANS TO CONTROL NAUTICAL SCHOOLS? 1DELGADO JUAN JOSE RIOS, 2DELGADO ENRIQUE RIOS, 3SAAVEDRA MARIA JOSE ESPINOZA 1Universitat Politècnica de Catalunya and Captain, 2Architect and columnist, 3Translator Universidad de Salamanca, Spania…………………………………
21
4.
DAMAGE STABILITY CRITERIA IN AIRCRAFT CARRIERS 1FERNÁNDEZ RODRIGO PÉREZ, 2JOSÉ MARÍA RIOLA RODRÍGUEZ 1,2Escuela Técnica Superior de Ingenieros Navales, Spania……………………
27
5.
TOTAL CELL COUNT, SINGLE CELL BIOMASS AND GROWTH RATE IN MARINE MICROCOSMS SUPPLEMENTED WITH GASOLINE AND GASOLINE-ENRICHED MARINE POPULATIONS 1,3GHITA,SIMONA, 2,3ARDELEAN IOAN 1Constanta Maritime University, 2Institute of Biology Bucharest, 3Ovidius University Constanta, Romania……………………………………………………..
39
6.
THE USE OF MAGNETIC FLUIDS TO OBTAIN AND BUILD SEALS GRIGORESCU LUCIAN Constanta Maritime University, Romania……………………………...................
47
7.
THE INFLUENCE OF FACTORS ACTING ON THE FRICTION POWER LOSSES IN MECHANICAL SEALS WITH SLIDING RINGS GRIGORESCU LUCIAN Constanta Maritime University, Romania………………………………………….
51
8.
CONSIDERATIONS ABOUT THE 'GREEN SHIP' CONCEPT – A SOLUTION TO MINIMIZE MARINE POLLUTION GROSAN NICOLAE Constanta Maritime Universiy, Romania............................................................
57

9.
ANALYSIS OF BLACK SEA POLLUTION – RISKS, CONSEQUENCES AND MEASURES MIHAILOVICI CRISTINA-STELIANA Department Ciencia I Enginyeria Nautiques University, Universitat Politecnica Catalunya, Spania……………………………………………………………………
65
10.
AN ASPECT OF MAINTAINING R-22 SYSTEMS IN REFRIGERATED TRANSPORTATION. THE SELECTION OF R404A MEMET FEIZA Constanta Maritime University, Romania………………………………………….
71
11.
COLLABORATIVE LEARNING FOR COMPETENCE DEVELOPMENT 1PRASAD RAJENDRA, 2BALDAUF MICHAEL, 3NAKAZAWA TAKESHI 1,2,3World Maritime University Malmö, Suedia…………………………………….
77
12.
DEFINING THE SHIP MAGNETIC PERFORMANCE BY MEANS OF PASSAGE CHARACTERISTICS 1SAMOILESCU GHEORGHE, 2MARIN GEORGIANA, 3SERGHEI RADU 1Mircea cel Batran Naval Academy, Constanta, 2Research Center For Navy, Constanta, Romania, 3Zodiac Company, Romania...........................................
93
13.
MODELING THE ELECTROMAGNETIC FIELD INTRUSION 1SAMOILESCU GHEORGHE, 2MARIN GEORGIANA, 3RADU SERGHEI 1Mircea cel Batran Naval Academy, Constanta, 2Research Center For Navy, Constanta, 3Zodiac Company, Constanta, Romania.........................................
97
14.
IMPROVEMENT OF THE ENERGY EFFICIENCY OF VESSELS AS A MEASURE FOR THE REDUCTION OF GREENHOUSES GASES EMISSION FROM SEA SHIPPING 1SIN MIHAELA, 2F.XAVIER MARTÍNEZ DE OSES 1,2Universitat Politècnica de Catalunya, Spania…………………………………..
103
15.
EMISSIONS OF GREEN HOUSE GAS OF SHIPS IN PORT IN JOHOR PORT(MALAYSIA) 1SULAIMAN O., 2SHAMILA A., 3HANIS WAHAB M., 4SAMAN AB., 5SAHARUDDINA.H. 1,5Maritime Technology Department, University Malaysia Terengganu, 2,3,4 Marine Technology Department, University Teknologi, Malaezia…………..
113
16.
SUBSYSTEM RISK AND RELIABILITY ANALYSIS FOR COLISSION AVERSION: A CASE OF PROPULSION FAILURE CONTRIBUTION FACTOR 1SULAIMAN O., 2KADER A.S.A., 3SAHARUDDIN A.H. 1,3Maritime Technology Department, University Malaysia Terengganu, 2Marine Technology Department, University Teknologi, Malaezia……………
121
17.
STADY-STATE OPERATING MODES OF ROTARY POSITIVE DISPPLACEMENT PUMPS AND MOTORS. PART I. OPERATING PROCESSES MODELLING TOMOV PEICHO Department of Ship Power Plants by N. Y. Vaptsarov Naval Academy, Bulgaria …………………………………………………………..........................
131
18.
STADY-STATE OPERATING MODES OF ROTARY POSITIVE DISPPLACEMENT PUMPS AND MOTORS PART II. REAL AND MODELLING EXPERIMENT 1TOMOV PEICHO, 2NIKOLOVA MARIYA, 1TODOROV TIHOMIR 1Department of Ship Power Plants by N. Y. Vaptsarov Naval Academy, Bulgaria, 2Department of Mathematics and Computer Science by N. Y. Vaptsarov Naval Academy, Bulgaria………………………………………………
137
19.
ENVIRONMENTAL IMPACT OF TRANSPORT AND TENDENCIES FOR DEVELOPMENT OF SUSTAINABLE TRANSPORT IN BULGARIA 1TONEVA-ZHEYNOVA DANIELA, 2MEDNIKAROV BOYAN, 3NIKOLOVA NATALIA, 4TENEKEDJIEV KIRIL 1Technical University – Varna, Bulgaria,2,3,4Nikola Vaptsarov Naval Academy, Varna, Bulgaria………………………………………………………………………
143
20.
PROTECTION AGAINST MARINE CORROSION OF ALUMINIUM ALLOY A6061: EIS AND SEM-EDS APPROACHES 1WAN NIK W.B., 2O. SULAIMAN, 3K.B. SAMO, 4M.F. AHMAD, 5R. ROSLIZA 1,2,3Maritime Technology Department, Faculty of Maritime Study and Marine Science, 4Engineering Science Department, Faculty of Science and Technology, Universiti Malaysia Terengganu, 5TATi University College, Teluk Kalong, Malaezia……………………………………………………………………
151


JOURNAL OF MARINE TECHNOLOGY AND ENVIRONMENT
9
INFLUENCE OF POWER SOURCE PARAMETERS IN INDUCTION HEATING OF BEARING BUSHINGS OF SHIP PROPELLER SHAFTS
1APRAHAMIAN BOHOS, 2STREBLAU MAIK, 3MARINOVA MARIA
1,2,3Technical University, Varna, Bulgaria
Alongside the existing classical methods of volume heating of the bearing bushings for installation on propeller shafts the possibility of heat treatment using low-frequency induction heating is very newsy and hopeful.
A major disadvantage of most methods of heating is the large energy consumption and the emergence of unacceptable temperature differences in the detail, leading to the appearance of various defects in its structure. This requires a detailed examination of the processes using the method of induction heating.
Keywords: induction heating, bearing bushing, propeller shaft, stern tube, model
1. INTRODUCTION The main propeller shaft bearings support and hold the propulsion shafting in alignment.
They are divided into two general groups: the main line shaft bearings (spring bearings), and the stern tube and strut bearings [1].
The hole in the hull structure for accommodating the propeller shaft to the outside of the hull is called the stern tube. The propeller shaft is supported in the stern tube by two bearings - one at the inner end and one at the outer end of the stern tube, called stern tube bearings. At the inner end of the stern tube there is a stuffing box containing the packing gland (Fig. 1) which is generally referred to as the stern tube gland. The stern tube gland seals the area between the shaft and stern tube but allows the shaft to rotate. The stuffing box is flanged and bolted to the stern tube. Its casing is divided into two compartments - the forward space which is the stuffing box proper, and the after space, provided with a flushing connection, designed to maintain a positive flow of water through the stern tube for lubricating, cooling and flushing.
The stern tube bushing is a hollow brass cylinder (Fig. 2) with an outside diameter equal to the inside diameter of the stern tube. There are usually two bushings, one of which is inserted in the after end and the other in the forward end of the stern tube. A flange is cast on one end of the after bushing which shoulders up against the outboard end of the stern tube and is fastened to it by tap bolts. The forward bushing has no flange but is feather keyed to the stern tube to keep it from turning with the shaft. The inboard end of the forward bushing serves as a shoulder for the packing in the stuffing box [2].

JOURNAL OF MARINE TECHNOLOGY AND ENVIRONMENT
10
Figure 1: Exemplary stern tube construction with stern tube bearing
Figure 2: Different types of brass bushings Currently there are various methods for low-temperature heating of parts of non-ferrous
alloys in order to alter their linear dimensions. In the assembly of the bearing bushings on the propulsive shafts a necessary precondition for them is the heating to a certain extent. Heating can be done in an induction system, in which compared to other methods, lower power consumption, higher quality final product at an adjustable heat speed are effectuated.
The purpose of this paper is to give a recommended range for the frequency of the power source and the power output in the detail by examining their influence on the distribution of the temperature field in the volume of the heated bushing and consideration of the process efficiency.
The configuration of the considered system cylindrical inductor – non-ferrous detail (brass bushing) with dimensions is shown on Fig. 3.

JOURNAL OF MARINE TECHNOLOGY AND ENVIRONMENT
11
Figure 3: Configuration of the system cylindrical inductor –brass bushing and
dimensions of the detail in millimeters
The variety of configurations of the processed details define as uneconomic the process of experimental investigation. Currently the large opportunities of process modeling are widely used [3] [4].
2. THEORETICAL MODEL Two-dimensional model is used, which considers both the electromagnetic and thermal
problem [5]. The simulation of the electromagnetic processes is accomplished using harmonic electromagnetic analysis described by the following differential equation:
( )coilJAA Tj
•••
=⋅⋅⋅+×∇×∇ γωμ1
, (1)
and boundary condition - zero magnetic potential within the model. As a source is set the current density inside the inductor.
The thermal problem is simulated by transient thermal analysis described by the following differential equation:

JOURNAL OF MARINE TECHNOLOGY AND ENVIRONMENT
12
( ) ( ) ( ) VqTtTTcT +∇⋅∇=∂∂⋅⋅ λρ (2)
where:
( )•
•
⋅⋅⋅=⋅= 222
21
21 ATJqV γω
γ (3)
The boundary condition, ensuring coherence of equation (2) is the requirement of Dirichlet, specified on the boundary of the model. The conditions setting the radiant heat in the model are ignored as the heating component is fully shielded from the inducer, and the space around the detail is closed. On the bordering environmental surface of the inductor natural convective heat transfer is set.
3. THEORETICAL INVESTIGATION With the above model the following theoretical studies have been conducted:
1. In the power output range of P = 1 - 3 kW in the workpiece the changes in the process efficiency depending on the frequency of the power source are studied;
2. Under the same conditions the temperature field longitudinally along the workpiece depending on the frequency of the supply voltage is examinated;
3. In amending the power and the frequency the time for heating-up the workpiece is monitored.
The obtained results are presented graphically in Figures 2 to 6:
Figure 2: The process efficiency depending on the frequency of the power source

JOURNAL OF MARINE TECHNOLOGY AND ENVIRONMENT
13
Figure 3: Temperature distribution longitudinally along the workpiece at power output in the detail 1kW.
Figure 4: Temperature distribution longitudinally along the workpiece at power output
in the detail 2kW.
Figure 5: Temperature distribution longitudinally along the workpiece at power output
in the detail 3kW.
JOURNAL OF MARINE TECHNOLOGY AND ENVIRONMENT
14
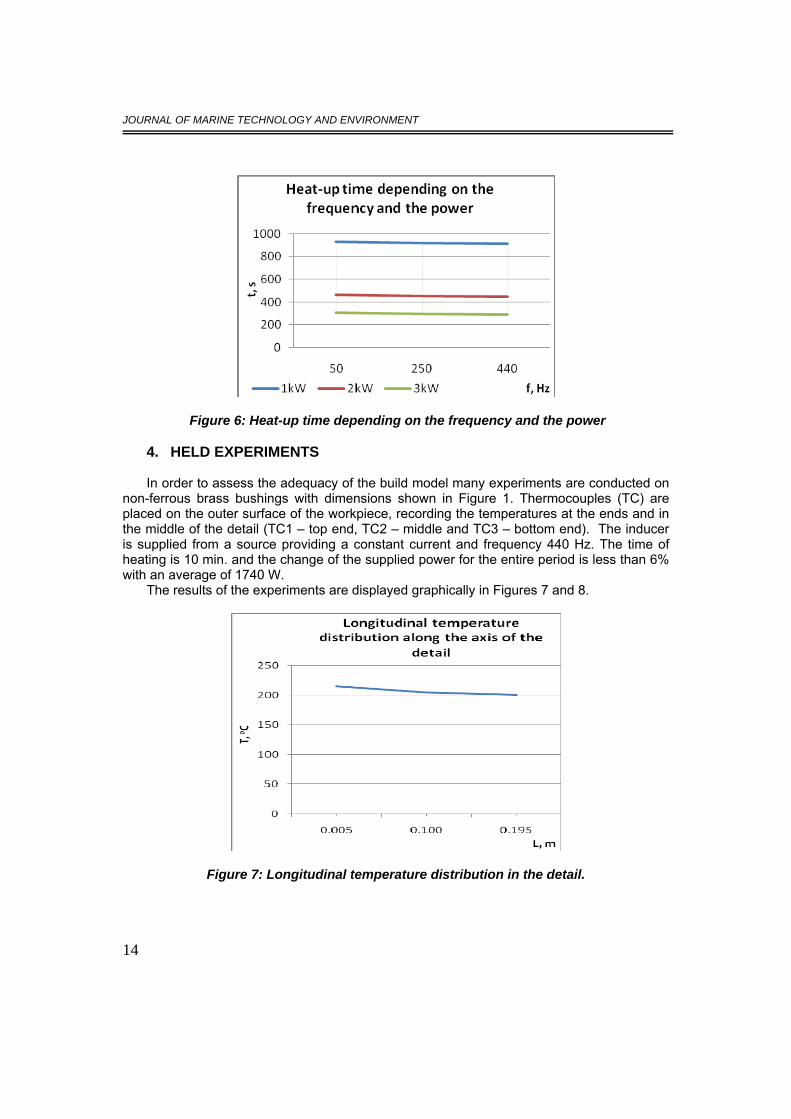
Figure 6: Heat-up time depending on the frequency and the power
4. HELD EXPERIMENTS In order to assess the adequacy of the build model many experiments are conducted on
non-ferrous brass bushings with dimensions shown in Figure 1. Thermocouples (TC) are placed on the outer surface of the workpiece, recording the temperatures at the ends and in the middle of the detail (TC1 – top end, TC2 – middle and TC3 – bottom end). The inducer is supplied from a source providing a constant current and frequency 440 Hz. The time of heating is 10 min. and the change of the supplied power for the entire period is less than 6% with an average of 1740 W.
The results of the experiments are displayed graphically in Figures 7 and 8.
Figure 7: Longitudinal temperature distribution in the detail.

JOURNAL OF MARINE TECHNOLOGY AND ENVIRONMENT
15
Figure 8: Temperature changes on the surface of the workpiece as a function of the time.
5. CONCLUSIONS A comparison between the results obtained by the experiments and by investigation of
the model using the results of the transient heating process is shown on Figures 9 to 11.
Figure 9: Change of the temperature in the top end of the exterior surface of the workpiece.
Figure 10: Change of the temperature in the middle of the exterior surface of the workpiece
JOURNAL OF MARINE TECHNOLOGY AND ENVIRONMENT
16
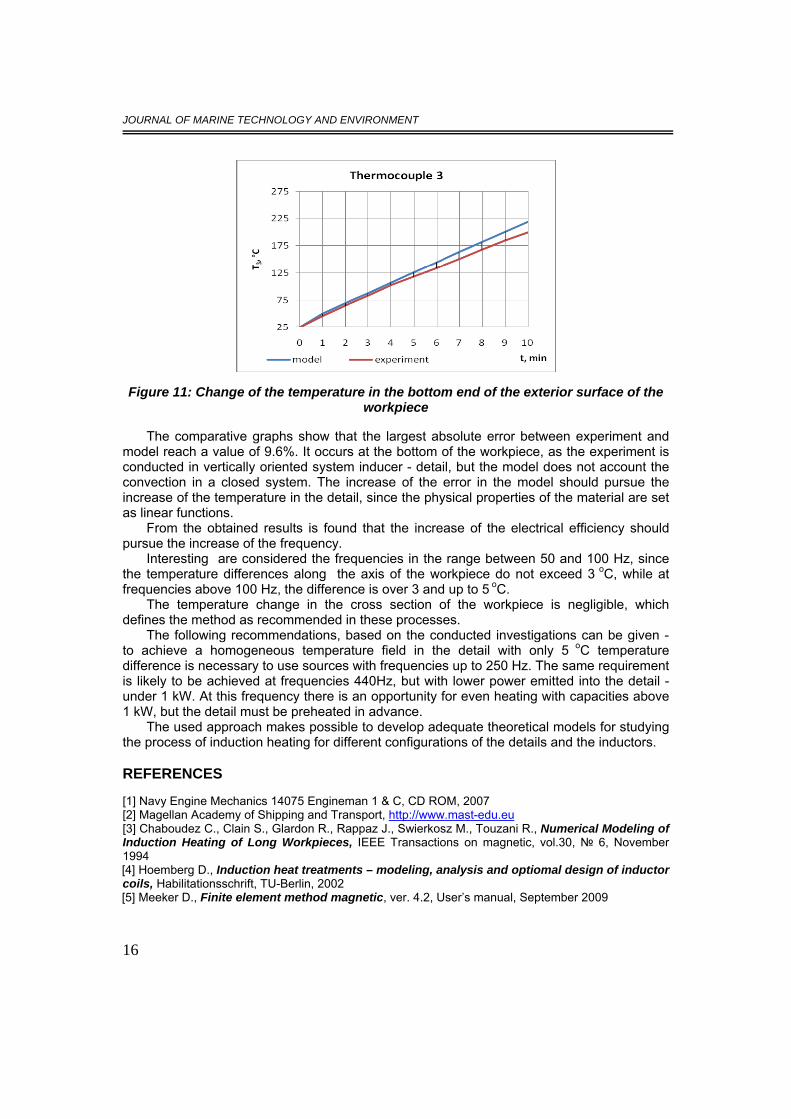
Figure 11: Change of the temperature in the bottom end of the exterior surface of the
workpiece
The comparative graphs show that the largest absolute error between experiment and model reach a value of 9.6%. It occurs at the bottom of the workpiece, as the experiment is conducted in vertically oriented system inducer - detail, but the model does not account the convection in a closed system. The increase of the error in the model should pursue the increase of the temperature in the detail, since the physical properties of the material are set as linear functions.
From the obtained results is found that the increase of the electrical efficiency should pursue the increase of the frequency.
Interesting are considered the frequencies in the range between 50 and 100 Hz, since the temperature differences along the axis of the workpiece do not exceed 3 oC, while at frequencies above 100 Hz, the difference is over 3 and up to 5 oC.
The temperature change in the cross section of the workpiece is negligible, which defines the method as recommended in these processes.
The following recommendations, based on the conducted investigations can be given - to achieve a homogeneous temperature field in the detail with only 5 oC temperature difference is necessary to use sources with frequencies up to 250 Hz. The same requirement is likely to be achieved at frequencies 440Hz, but with lower power emitted into the detail - under 1 kW. At this frequency there is an opportunity for even heating with capacities above 1 kW, but the detail must be preheated in advance.
The used approach makes possible to develop adequate theoretical models for studying the process of induction heating for different configurations of the details and the inductors. REFERENCES
[1] Navy Engine Mechanics 14075 Engineman 1 & C, CD ROM, 2007 [2] Magellan Academy of Shipping and Transport, http://www.mast-edu.eu[3] Chaboudez C., Clain S., Glardon R., Rappaz J., Swierkosz M., Touzani R., Numerical Modeling of Induction Heating of Long Workpieces, IEEE Transactions on magnetic, vol.30, 6, November 1994 [4] Hoemberg D., Induction heat treatments – modeling, analysis and optiomal design of inductor coils, Habilitationsschrift, TU-Berlin, 2002 [5] Meeker D., Finite element method magnetic, ver. 4.2, User’s manual, September 2009

JOURNAL OF MARINE TECHNOLOGY AND ENVIRONMENT
17
SUSTAINABLE DEVELOPMENT PROGRAM AT THE FACULTY OF NAUTICAL STUDIES OF BARCELONA. NAUTICAL ENGINEERING
EDUCATION
1CASTELLS M., 2MARTÍN A., 3ORDAS S, 4AGUILAR S., 5SOLÉ M.
1,2,3,4,5Universitat Politècnica de Catalunya, Spania
Nautical engineering education institutions play an important role and are a key tool in the future sustainable maritime transport and naval world. This paper addresses the role of nautical engineering education in the learning and implementation of the competence of sustainability and social commitment (SSC) in the Nautical Faculty of Barcelona and presents results of the first year of the implementation of the environmental program STEP2015 at the Universitat Politècnica de Catalunya.
Keywords: Nautical, Engineering education, Sustainable development
1. INTRODUCTION
Higher education is essential if we want to achieve sustainable development and therefore social progress. Higher education introduces sustainability concepts in very much part of curricula in engineering education. Nowadays, many university of the European Higher Education Area are making important changes in their curricula and degree requirements [1].
The Universitat Politència de Catalunya (UPC) [2] is one of the most prestigious universities in Europe and has the commitment to train graduates and has made significant efforts to integrate the sustainability in their professional activity, incorporate disciplines of the social sciences and humanities, promote multidisciplinary teamwork and stimulate creativity and critical thinking.
As many other universities around the world, Universitat Politècnica de Catalunya has been proactive in the last years to convert its commitments towards sustainable development into actions [3]. It had committed itself to the Copernicus Declaration [4] and had adopted its own UPC Environmental Declaration [5].
The STEP 2015 Program [6] is one of the answers that the UPC has prepared to reach this challenge. One of the objectives of the STEP2015 program is develop the conceptual bases, identify concrete referring and to develop practical tools for the future graduates on sustainability and social commitment topics.
The Faculty of Nautical Studies of Barcelona (Faculty) [7] belongs to the Universitat Politècnica de Catalunya. The integration of the Faculty of Nautical Studies in the UPC allowed for the introduction in 1995 of the Diploma in Naval Architecture (Ship Systems and Propulsion), which is complementary to the Diplomas in Maritime Navigation and Naval Engineering, Degrees in Nautical Studies and Maritime Transport and Naval Engineering.

JOURNAL OF MARINE TECHNOLOGY AND ENVIRONMENT
18
The Faculty has participated in the STEP2015 program and some of the activities developed and results obtained are presented in this paper.
2. ACTIVITIES DEVELOPED TO PROMOTE SUSTAINABILITY IN NAUTICAL ENGINEERING EDUCATION
In the STEP2015 program developed at the Faculty of Nautical Studies of Barcelona in the year 2010, the Faculty has had an active position in regard the perspective of the introduction of the development sustainable in all curricula.
In February 2010, there was constituted a work team that took in charge the development and the implementation of activities related on the promotion of sustainability and social commitment at the Faculty. The above mentioned group was formed by four permanent members and by collaborators and volunteers, both members of the Faculty.
In order to be able to harmonize criteria inside the frame of the program STEP2015 of the Universitat Politècnica de Catalunya, the work team took part in several meetings of work together with team members of the other faculties and schools of the UPC.
Fruit of the different meetings, our Faculty discussed the strategies that adopted for accelerating the transformation of the university towards a sustainable university, which include following actions:
• Two sessions to integrate the generic competences, sustainability and social commitment in the new curricula.
• Maritime Transport and Naval Sustainable Industry workshop. The meeting room of the Faculty was full of students and all showed a special interest in each of the conferences. The result was very positive.
• To involve the maximum number of students on sustainable subjects, there was a competition to design the “sustainable Christmas card 2010”.
• During the Christmas holidays, the modelship “San Carlos” (the flagship of our Faculty), which is in the hall, was illuminated by the light generated by static bicycle, prepared for the occasion by professors and students of the Faculty.
• Create a new database that contains topics related to the maritime and naval sustainable and social commitment.
• Create a prize to the best sustainable final project. Students incorporate sustainable concepts in their work and acquire a sustainable mentality.
• A special flag related on sustainability and social commitment topics was designed and nowadays is present in all official acts.
3. SUSTAINABLE QUESTIONNARIES
In order to learn further about the knowledge of our community related to the
sustainability and social commitment topics, the STEP2015 work team surveyed the members of the community from students to professors.
Two different models (students and professors) of questionnaire were sent via email from October 15th to November 3rd of the year 2010 to each group of our community.
A total of 19 professors out of 60 answered back the questionnaire and just 52 out of 600 students did it.
The results of these questionnaires are going to be introduced as follow: Previous knowledge and awareness on the sustainability topics and study materials. A 95% of surveyed professors are aware of sustainability and 5% answer negatively,
somehow a similar result appears when surveying students, a 90% are aware and a 10% are not.

JOURNAL OF MARINE TECHNOLOGY AND ENVIRONMENT
19
The study material has a crucial importance in the learning process, when surveying professors if they include any topic related to sustainability and Social Commitment in their course material, a 67% of them answer affirmatively and the rest a 33% negatively.
Even though a 68% of students consider appropriated the inclusion of these topics in their curriculum, there are 24% who believe they are not necessary. Just the 8% doesn’t answer or doesn’t know. On the other hand, asking the same to the staff, a 78% answer positively and 17% negatively. The rest (5%) doesn’t know/doesn’t answer. 1. Sustainability and social commitment diffusion
The 72% of the surveyed professors want more diffusion from Barcelona Tech’s Direction, 2% don’t want any diffusion and a 26% is not available. Regarding the students answer to this same question, a 74% agrees with this initiative, while a 12% does not agree and a 14% answer doesn’t know/doesn’t answer.
Faculty staff was also asked if they find interesting that activities related to SSC are performed at college: most of them (94%) finds it interesting, and only a 6% doesn’t. Similar percentiles came from students: a 92% said “Yes”, a 4% “No” and the other 4% answered doesn’t know/doesn’t answer.
When asked for their predisposition in order to participate in these activities, 67% respond “Yes”, and 16% “No” and the rest doesn’t know/doesn’t answer. Once again, students answered the same way: a 72% would do it, in front of a 12% who wouldn’t. Up to the 18% answered doesn’t know/doesn’t answer. 2. Evaluation criteria for the SSC (Sustainability and Social Commitment) topics
A 31% of surveyed staff believes these two concepts should be independently evaluated. 39% refuse this idea, while the 28% doesn’t know/doesn’t answer. When surveying the student population a 28% of them agree with separate evaluation of these subjects. But a 32% think the opposite, and there are a 40% of them. The evaluation criteria is unknown by 82% of staff. Only a 12% know about it, and a 6% doesn’t know/doesn’t answer. Accordingly, a 90% of students ignore the evaluation criteria of SSC. A 6% knows how it works, and 4% doesn’t know/doesn’t answer. 3. Involvement in SSC (Sustainability and Social Commitment)
A 91% of staff agrees that it is interesting to implement the SSC in current degree’s curriculum. A 6% don’t agree with it, and the rest doesn’t know/doesn’t answer. Less percentile of students agrees with the implementation (68%). A 24% admits it is not interesting and 8% N doesn’t know/doesn’t answer.
A 71% of staff thinks that is viable the introduction of SSC concepts into their courses materials. A 17% thinks not, and the other 12% doesn’t know/doesn’t answer. From the point of view of surveyed students, just a 56% of students think it is viable. Another 38% does not think so and a 6% answered doesn’t know/doesn’t answer.
The 58% of professors has been involved in projects related to SSC and the rest has not. According to the student survey, a 62% of them have been involved in this kind of projects. A 14% does not.
An 83% of surveyed staff would like to participate on projects related to SSC. An 11% don’t and the rest doesn’t know/doesn’t answer. In the case of students, a 62% also would like it, a 14% would not.
Finally, the questionnaire asked to the students if they think that professors would easily accept to introduce sustainability and social commitment materials in their course. A 28% said yes, a 32% no and 40% didn’t know.
JOURNAL OF MARINE TECHNOLOGY AND ENVIRONMENT
20
4. CONCLUSIONS
Universitat Politècnica de Catalunya has developed and implemented a solid methodology to carry out its environmental commitments through environmental planning since 1996.
Questionnaires can not represent the opinion of the entire community of the Faculty of Nautical Studies of Barcelona due to the fact that the global participation on the questionnaire barely surpasses a 20%. Nevertheless, it was higher participation than the expected.
The results show a background on sustainability and social commitment on both groups, students and professors. Obviously, there is a growing concern about the impact of our engineering education and activity over the environment. Moreover, both groups are interested to involve themselves into projects related on SSC. This is one of the most interesting and positive conclusions of the questionnaire.
Answers of both, professors and students, seem to agree on the importance of the teaching material and the inclusion in some SSC topics in different levels of this competence. Even though, some professors do not see a faceable viability of introducing SSC topics in their teaching material. In fact, most of students are doubtful whether professors will be eager to do so.
Furthermore, it is important to point out the fact that around 90% of the surveyed teachers don’t know the evaluation criteria for SSC competences. Thus, it is necessary to increase the information in this aspect.
This questionnaire shows how important is for us spreading the sustainability and social commitment. The diffusion of any idea or topic makes it more popular and known by more population. Therefore, it is big issue in our community as well. Also, results show that the sustainability competence is poorly defined.
To sum up, this questionnaire and actions realized during 2010 tell us how our community feels about the topics treated and could be used as a guide to take further actions for the STEP program and developing the guidelines for the incorporation of sustainable development in our studies. We hope the concern about sustainability and social commitment will grow in the future thanks to this project.
In general, there still are some barriers in their reorientation of engineering education to sustainability, but there is no doubt that the inclusion of sustainability and social commitment into the teaching curricula is a key issue and it is necessary work in this item. REFERENCES [1]. Edwards, M et al. Engineering educations and competences for sustainability education in Spain. International Conference on Engineering Education – ICEE 2007 [2]. Universitat Politècnica de Catalunya. Barcelona-Tech. www.upc.edu [3]. Didac Ferrer-Balas, Jordi Bruno, Mireia de Mingo and Ramon Sans. Advances in education transformation towards sustainable development at the Technical University of Catalonia, Barcelona. International Journal of Sustainability in Higher Education.Vol. 5 No. 3, 2004 [4]. CRE (1992), “Copernicus Charter”. www.copernicus-campus.org/ [5]. UPC (1996), UPC Environmental Declaration, UPC, Barcelona. [6]. STEP2015. http://www.upc.edu/sostenible2015/step[7]. Faculty of Nautical Studies of Barcelona website. www.fnb.upc.edu [8]. David Banister et al. European transport policy and sustainable mobility. 2000

JOURNAL OF MARINE TECHNOLOGY AND ENVIRONMENT
21
MILITARY PROMOTIONS OF NAUTICAL TEACHERS BY THE END OF THE 18TH CENTURY: REWARD FOR MERITS OR A MEANS TO
CONTROL NAUTICAL SCHOOLS?
1DELGADO JUAN JOSE RIOS, 2DELGADO ENRIQUE RIOS, 3SAAVEDRA MARIA JOSE ESPINOZA
1Universitat Politècnica de Catalunya and Captain, 2Architect and columnist, 3 Translator
Universidad de Salamanca, Spania
By the end of the 18th century the Spanish nautical school teachers were military promoted as a means to reward their devotion to teaching and their input as cosmographers. These well-deserved promotions were also a way to acknowledge their taking part in several military conflicts during which teachers had defended the Spanish Crown. However, the following paper will discuss the fact that some of these promotions were used by the Escuelas Particulares (Private Schools) and the Real Junta Particular de Comercio (Royal Particular Joint Trade Board) of Barcelona as a tool which allowed teachers to become members of the Spanish Royal Navy.
Keywords: history study, nautical history, S. XVIII, Spain.
1. INTRODUCTION The Spanish Royal Navy (Real Armada) was pivotal for the Spanish Crown throughout
the 18th century. It was in charge of maintaining the control over the Spanish Empire in the American and Phillipine colonies. It also performed a double role; on the one hand it watched over the trade routes among such colonies and the metropolis and on the other, it confronted their long-time rival and the most powerful fleet at that period: the British Army.
However, the Spanish maritime presence was not only attached to this type of warships. The Spanish trade was vey important, specially in areas such as Catalonia, where this activity was open to new international markets: the North-European and the American.
As it has been stated before, the Spanish fleet was capital for the Empire, not only from the trading point of view but also from a military perspective. That the Spanish Army and the merchant navy had the need to update was an undeniable fact. As a result, nautical studies also needed to be upgraded and standardized, as they were the way to maritime excellency.
This need paved the way to the blooming of new nautical schools throughout the Spanish Crown. So much so that at that time three different types, each and every with its own characteristics, coexisted.

JOURNAL OF MARINE TECHNOLOGY AND ENVIRONMENT
22
2. NAUTICAL SCHOOLS IN SPAIN IN THE 18TH CENTURY The different nautical schools in the 18th century can be classified according to their link
to the Spanish Royal Navy. In a first group we categorise those which had a direct bond to the Army. They were
primarily conceived to train officers for the Army, although in some cases, such as the Escuelas de los Departamentos (Departamental Schools) , officers of the merchant navy were also trained. Falling into this category we find the Real Academia de Cavalleros Guardias-Marinas (Royal Academy of Midshipmen) of Cádiz, founded in 1717 [1] ; the Escuelas de Pilotos de los tres Departamentos de la Armada (School of Officers from the Three Departments of the Army) [2] (Cádiz, Cartagena and el Ferrol), created in 1751 [3] ; and the Reales Academias de Guardias-Marinas (Royal Academies of Midshipmen) of Cartagena and el Ferrol, dating from 1776 [4].
A second group, with more autonomy, trained military or merchant sailors but never leaving aside a solid training deeply rooted in Christian values. Within this group we mention the Real Colegio de San Telmo (Royal School of St. Telmo) of Málaga, founded 19th March 1787 [5] and its counterpart school founded 17th June 1681 [6].
Finally, we find a group with the greatest amount of autonomy with regards to the Army, also known as ‘private schools’. Here merchant sailors were trained mainly, although training was also possible for Army members, however in a minor proportion. The Nautical School of Barcelona, founded in 1769 [7] under the tutelage and sponsorship of the Royal Particular Joint Trade Board of Barcelona, shared many similarities with private schools, in spite of sponsorship. That is the reason why it is included among the private schools instead of being a part of another group.
Graphic 1: Portrait of Sinibaldo de Mas. First director of the Nautical School of
Barcelona and honorary officer of the Royal Spanish Navy.

JOURNAL OF MARINE TECHNOLOGY AND ENVIRONMENT
23
Leaving aside the overseas private schools we can name the following schools located in the Spanish peninsula: the School of Bilbao, founded in 1740 [8]; the School of de Arenys de Mar, created in 1779 [9] ; the School of Mataró, which saw the light of day in 1781; the School of Coruña, dating from 1790 [10]; the School of Santander, also founded in 1790 [11]; the School of Gijón, founded in 1792 [5] and finally the School of Alicante, from a later period 1799 [12]. We should bear in mind that in this list we have included the Escuela de Náutica de Barcelona which, as already mentioned, was founded in 1769 [7]. By the end of the 18th century nautical schools were also created in the overseas territories not only in America, but also in the Philippines
3. MILITARY PROMOTION OF SCHOOL TEACHERS. EXAMPLES OF PROMOTION OF THE NAUTICAL SCHOOL TEACHER OF ESCUELA DE NÁUTICA DE BARCELONA AND OF TEACHERS FROM OTHER PRIVATE SCHOOLS We consider that the military promotions we are about to mention are fully justified and
they meant a great honour for teachers, as they were an award to their great work granted by the King and the Spanish Royal Army.
Sinibaldo Mas, first teacher and director of the Escuela Náutica de Barcelona, achived the ranks of Alférez de Fragata de la Real Armada and Piloto Honorario (Second lieutenant of frigate and honorary officer) of his Majesty thanks to his activities as defensive privateer during the internacional conflict against the British Empire in 1779, whose origin dates back to 1773, after the Independence War of the American colonies. However, this was not his only remarkable activity, as his work as a cosmographer was also very relevant.
Some archives from the Departamento de Cartagena (Cartagena Department) dated 13th February 1784 [13] confirmed that this rank was fairly granted. The promotion was issued on the 29th February 1784 [14].
The rest of promotions were granted as a reward to their work in the Escuela de Barcelona, something customary in the nautical schools of the time, where most teachers were granted similar promotions. For instance, the San Telmo professors (those in charge of Maths and Art of Navigation) were considered as cosmographers and therefore were awarded with the Piloto Primero honorario de la Armada [First Honorary Officer of the Army] (Art. 218 [15]) title; or the first Professor of the Real Colegio de San Telmo, Mr. Francisco Pizarro who was granted the promotion of Alférez de Fragata (Second lieutenant of frigate) 15th April 1791 [16].
Sinibaldo Mas was granted the rank of Alférez de Navío (Warship Second Lieutenant) 29th of May 1792, as well as happened to the first teachers of the schools from Coruña and Santander. The reason for this reward was the ‘zeal and interest’ with which these First Teachers performed their task. [17].
Later on he was awarded the promotion of Teniente de Fragata (Lieutenant of Frigate), as we can elicit from the (General State of the Army) Estado General de la Armada de 1795-1796 [18], although there’s no written justification for this promotion on record.
Manuel Sans, second teacher of the Escuela de Barcelona, also enjoyed some promotions throughout his career. In 1796 the court decided to award him with the title and honour of Primer Piloto de la Real Armada (First Officer of the Royal Army), as he himself reported on the 6th of April 1806 [19], in his application to sit for the chair of First Teacher and director of the Escuela de Náutica de Barcelona.
The teacher of the Officer School of Arenys de Mar, Joseph Baralt was awarded with a mention of Piloto honorario y Alférez de Fragata (Honorary officer and Frigate Second Lieutenant) the 4th of January 1785, also thanks to his teaching abilities [21].

JOURNAL OF MARINE TECHNOLOGY AND ENVIRONMENT
24
The teacher of the Escuela de Pilotos de Mataró, Mr. Joseph Bassó, was awarded the title of Primer Maestro (First teacher), as it can be seen in a document dated from 1st of May 1790, in which it is explained in detail that he was going to receive a salary in accordance with this new position, from the 27th of march 1790 [20] onwards. Thanks to his teaching devotion he was promoted to Alférez de Fragata (Second Lieutenant of Frigate) on november the 5th 1796.
4. XAVIER DE WINTHUYSEN’S ATTEMPT TO CONTROL PRIVATE SCHOOLS [22]. By the end of the century the Comandante en Jefe del Cuerpo de Pilotos (Chief
Commander of Officers), Xavier de Winthuysen, carried out an amendment of nautical schools to standardise their functioning and unify every study method into a single one. He also wanted to unify all the different governing systems of these educational institutions.
As it is stablished by the first article of his amendment called “Instrucción para la Disciplina, estudios y exámenes, sobre que deben arreglarse las Escuelas particulares de Náutica” (Training for Discipline, studies and exams on which Nautical Private Schools should be based) [23], the optional part was under Mr. Winthuysens’ wing in his capacity of Comandante en Jefe del Cuerpo de Pilotos. This control was approved by a Royal decree of 8th of July 1787.
The change of directive was an unsuccessful attempt. Until then the Escuela de Náutica de Barcelona had been sponsored by the Real Junta de Comercio de Barcelona and Winthuysen wanted the Real Junta to keep on promoting the center whilst at the same time it were under the Army’s control. The Junta de Comercio considered that this control was entitled to them, as they were going to keep on paying for all the expenses.
Another important fact is that Xavier de Winthuyssen stablished in article 4 that only Army officers could be teachers of private schools. If this directive was followed, the Army would hold the control of the schools due to the fact that teachers would be military men.
Although teachers could perform their task thanks to military promotions granted as a reward to their task, the idea was that their successors were military men unable to keep on sailing but able to perform teaching activities. In the particular case of the Escuela de Náutica de Barcelona, it wasn’t eventually so. The successor of Sinibaldo Mas, first teachers and director of the Escuela Náutica de Barcelona, was Agustín Canellas [24]. In fact, it was the Spanish court the one in charge of appointing his successor and not the Army on the 14th of November 1806 [25].
Acccording to article 7, consul or governing bodies should warn if there was a need to replace any teacher so that they sent teachers to fill the vacancy posts.
As these articles were opposed to the interests of the Junta de Comercio de Barcelona, this institutions requested the King’s intervention. On October 16th 1791 [26] the Winthuysen amendments were put on hold through a Real Orden (Royal Decree) of the Real Junta de Comercio y Moneda del Reino (Royal Trade Board and Coin of the Realm). The King had decided that no change whatsoever should take place and the respect for the prevailing system should continue.
The Junta de Comercio (Trade Board) of Barcelona kept a tight rein over the Escuela de Barcelona but Winthuysen forced his educational amendment and unified every study method of Nautical Schools.

JOURNAL OF MARINE TECHNOLOGY AND ENVIRONMENT
25
5. CONCLUSIONS
The Spanish Crown granted promotions to teachers of Nautical Schools for their military and cosmographical merits as well as their teaching abilities. However, these promotions were not isolated. Some officers of private trade were also awarded with similar rewards thanks to their cooperation in military confrontations through privateering.
Obviously, military honours of this kind would also be granted to Army military men for their brilliant career. Whatever their case may be, promotions were fully justified, they were merit-related and were used to award excellency for a well-performed task.
A funny fact is that military promotion used to be for people coming from well-off families, in most cases noblemen or gentlemen, whilst teaching promotion or promotions related to trade were not for the elite. For example, Sinibaldo Mas became the founder, director and teacher of the Escuela de Náutica de Barcelona thanks to his capability and effort in spite of his very humble background. He had to fight very hard to even being able to get access to nautical studies.
Winthuysen’s idea was that school teachers were the only ones capable of imparting classes in private schools, which facilitated the entrance of military men in these institutions. Obviously Winthuysen used this directive to control schools.
Promotions were received by teachers throughout their career in a justified way but the existence of a rule forcing teachers to be on hold of a military rank makes us doubt whether these would have occurred hadn’t it been for this aforementioned directive.
In any case, the intention of Xavier de Winthuysen did not translate into practice as some unruly schools, such as the one from Barcelona, kept on blooming.
We have also commented that the Army did not decide the successors in all cases, therefore Winthuysen’s amendment did not prevail in his try to control succession.
However, the Army attempts to control such schools did not end here. They insisted on their effort using different means, such as inspections.
To conclude we would like to highlight the parallelism between the conflicts of authority in the 18th century and the conflict of interests we suffer from nowadays. The problem we depict in this paper is recurrent throughout history, not only in educational institutions but also in other types of governing bodies. Stakeholders have always resorted to law amendments to justify, from the legal point of view, the hold of a certain amount of authority that otherwise wouldn’t have been possible, or they have always tried to resort to other types of means to achieve their aims.
REFERENCES [1]. IBAÑEZ, I. y LLOMBART, J. La formación de pilotos en la Escuela de Náutica de Bilbao, siglos XVIII y XIX. Unti Museoa-Museo Naval. San Sebastián. pág 747 [2]. También llamadas, coloquialmente, escuelas departamentales. [3]. ARROYO RUIZ-ZORRILLA, R. ( 1989 ) Apunte para una historia de la enseñanza de la Náutica en España. Dirección General de la Marina Mercante. Madrid. 260 p. [4]. CERVERA PERY, J. ( 1979 ) La Marina de la Ilustración (Resurgimiento y Crisis del poder Naval ). E. S. M. Madrid. pág. 56 [5]. ARROYO RUIZ-ZORRILLA, R. op. cit. pág. 88 [6]. ARROYO RUIZ-ZORRILLA, R. op. cit. pág. 56 . [7]. RÍOS DELGADO, J. J. ( 2009 ) El funcionamiento de los primeros años de la Escuela de Náutica de Barcelona bajo la dirección de Sinibaldo Mas y factores socio-económicos que motivaron su creación. Tesis doctoral UPC Barcelona págs. 146-162 [8]. IBAÑEZ, I. y LLOMBART, J. op. cit. pág. 747 [9]. PONS I GURI, J. M. ( 1993 ) Estudi dels Pilots. Curial. Barcelona. pág. 13

JOURNAL OF MARINE TECHNOLOGY AND ENVIRONMENT
26
Arxiu Históric Fidel Fita en Arenys de Mar. Sección General III. Escola Nàutica. Legajo 247-24 (13-D-a-3) [10]. PALMER MARQUÉS, F. J. ( 2002) Apuntes de Historia de las enseñanzas náuticas en Mallorca (1802-2002 ) Instituto Social de la Marina. Palma de Mallorca. pág. 37 [11]. ARROYO RUIZ-ZORRILLA, R. op. cit. pág. 103 [12]. ARROYO RUIZ-ZORRILLA, R. op. cit. pág. 106 [13]. Archivo Museo Don Álvaro de Bazán ( AMAB ) En Viso del Marqués (Ciudad Real) Expediente Sinibaldo Mas. Legajo 620-713 Fol. 19-20 [14]. AMAB Expediente Sinibaldo Mas. op. cit. Fol. 16 [15]. Archivo Histórico Naval del Archivo de Cartagena ) AHNAC ( 1788 ) Ordenanzas Para el Real Colegio de San Telmo de Sevilla. Imprenta de Blas Román Madrid 120 pág. P-2-G, Legajo 35- [16]. AMAB Fondo Colegio de San Telmo Legajo 985 (1791) Ascenso a Alférez de Fragata a Don Francisco Pizarro. 1er Catedrático de San Telmo [17]. AMAB Fondo Colegio de San Telmo. Legajo 1020. ( Aranjuez, 29 de mayo de 1792 ) Conferiendo grado de Alferez de navio a los 1os Maestros de las Escuelas Nauticas de Santander, La Coruña, Barcelona. Asuntos Particulares de Pilotos. Legajo 3374. ( 29 de mayo de 1792 ) 1os Maestros de las Escuelas de náutica de Santander, La Coruña y Barcelona todos tres Alférez de Fragata. Concede S.M. grados de Alférez de Navío, a propuesta del Comandante en Xefe de Pilotos dela Armada que ha recomendado su particular mérito. [18]. Biblioteca del Museo Marítimo de Barcelona ( BMM) Armada Real ( 1795-1796 ) Estado Generales de la Armada Imprenta Real. Madrid. R. 35532 (46 ) Reg. 9707 pág. 98 [19]. AMAB Fondo Asuntos Particulares ( 1806) Ynstancias para la Maestría de la Escuela de náutica de Barcelona. Legajo 1026 [20]. AMAB Sección PILOTOS Leg 3389(4) Bassó, Joseph [21]. AMAB Sección PILOTOS Leg 3389(4) Baralt, Joseph [22]. Brigadier Del Cuerpo De Guardia-Marinas, Y Comandante En Jefe Del Cuerpo De Pilotos E Inspector De Todas Las Escuelas De Náutica De España. [23]. Instrucción para la Disciplina, estudios y exámenes, sobre que deven arreglarse las Escuelas particulares de Náutica.” Biblioteca de Catalunya en Barcelona ( BC ) Junta de Comercio Legajo XXVII doc.43 fols. 6-9 [24]. Brother Agustín Canellas, Trinitarian, retired lecturer expert in Arts and Theology, member and censor of the Royal Academy of Natural Sciences and Arts of Barcelona, first teacher and director of the Nautical School of Barcelona, took the baton from Sinibaldo Mas. [25]. BC Legajo XXVII Junta de Comercio Legajo XXVII doc. 57 fol 13. [26]. AMAB Asuntos Legislativos Pilotos. Leg. 3375 ( 3 Nov 92 ) Sobre informes por D. Franco Xavier de Winthuysen de su Revista General de las Escuelas de Náuticas.

JOURNAL OF MARINE TECHNOLOGY AND ENVIRONMENT
27
DAMAGE STABILITY CRITERIA IN AIRCRAFT CARRIERS
1FERNÁNDEZ RODRIGO PÉREZ, 2JOSÉ MARÍA RIOLA RODRÍGUEZ
1,2Escuela Técnica Superior de Ingenieros Navales, Spania
The International Maritime Organization (IMO) agreements are not always appropriate for the majority of aircraft carriers, so that the military mission demand solutions in the design and operation that are not fully compatible with the philosophy of the conventions “IMO” and prescriptive solutions. Separate rules of the Classification Societies of the conventions “IMO”, to apply to warships create a vacuum that can lead to confusion. This confusion can be misinterpreted and as a result there can be a drop in safety standards. Stability in case of collision is a critical theme to maintain buoyancy in ships. These aspects are even more critical given the increasing size of the boats and the growing number of passengers and crews onboard. Both experience and performed studies demonstrate that the most dangerous issue for the ships with closed deck is the impact of an accumulation of water on the deck. The studies have clearly shown that the residual freeboard of the ship and the height of the waves in a specific sea area influence in a very relevant manner the amount of water that could be accumulated after a clash. The article concludes by presenting a series of comparisons between the criteria used by both, leading to some interesting conclusions as to the current criteria used by the navy. This can be enormously improved with a few minor changes, to maintain the integrity of its basic approach, and increase the similarities with the criterion of “IMO”, such as the calculation of water on deck out in the Stockholm Agreement.
Keywords: Damage stability criteria, Aircraft Carriers, Naval Engineering.
1. INTRODUCTION To avoid duplication, gaps and shortcomings in safety, it is important for the navies to
work together with the Classification Societies in the development of effective and sustainable arrangements. Thus, development of rules for warships Naval Ships Rules by various Classification Societies is the most important contribution to work in this area. The idea of cooperation to make an international convention for the safety of life at sea (SOLAS) goes back to the nineties. In September 1998, Classification Societies of the Member States of the North Atlantic Treaty Organization (NATO) met to establish links with their own “NATO”. This meeting established the Naval Ship Classification Association (NSCA), in May 2002, and the cooperation was defined according to the following terms of reference: promote safety standards at sea, promote measures to protect the marine environment, promote and develop common operating standards, undertake “R&D” to support the above

JOURNAL OF MARINE TECHNOLOGY AND ENVIRONMENT
28
and communicate the views of the partnership agreements and the “NSCA”. The philosophy of the “SOLAS” is applicable to merchant ships, and is not fully transferable to a warship. An aircraft carrier has requirements for acoustic signature, electromagnetic signature, signature radar, electronic warfare, antisubmarine warfare and it demonstrates that a ship is not civil.
Fig. 1. Spanish aircraft carrier SOURCE: www.fotos-coches.com/portaaviones.htm
2. DESIGN DATA SHEET The criteria to evaluate adequate damage stability performance according “DDS 079-1”
are based on the “Figure 2”. A reduction of the righting arm equal to (0.05·cosθ) is included in the righting arm curve to account for unknown unsymmetrical flooding or transverse shift of loose material. Beam wind heeling arm curve is calculated with the same method as used for intact stability calculations, but considering a beam wind velocity of around 32-33 (knots) as defined in “DDS 079-1” (Naval Ship Engineering Centre, 1975). The damage stability is considered satisfactory if the static equilibrium angle of heel “θc”, point “C” without wind rolling effects does not exceed 15 (º). The limit angle “θ1” of the damage righting arm curve is 45 (º) or the angle at which unrestricted flooding into the ship would occur, whichever is less.
Fig. 2. Damage stability criteria The criterion is considered fulfilled if the reserve of dynamic stability “A1” is not less than
(1.4·A2), where “A2” extends “θr” to windward as shown in the “Figure 2”. The tendency during recent decades in surface naval ship design was to assess and minimize susceptibility through detailed signature management. For the naval architect it is usually enough to assess the adequacy of its design with respect to vulnerability through the use of the damaged stability requirements introduced by the various navies, such as those used by the US Navy and the UK Ministery of Defence, (MoD).

JOURNAL OF MARINE TECHNOLOGY AND ENVIRONMENT
29
Based on the concept of the damage function used in the theory of defence analysis, the fraction of the target assumed to be damaged within a radius r from the impact point is assumed to follow the well-known log-normal distribution given by the “Equation 1” (Przemieniecki, 1994):
( ) dr
r
r= r
r•
⎥⎥⎥⎥
⎦
⎤
⎢⎢⎢⎢
⎣
⎡
•
⎟⎠⎞
⎜⎝⎛
−••••
− ∫0 2
2
2
lnexp
211d
βα
βπ
(1)
Where “RSK” is the sure kill radius which means that [d(RSK) = 0.98], “RSS” is the sure save radius which means [d(RSS) = 0.02] and “zSS” constant equal to (1.45222).
SKSS RR = •α (2)
⎟⎟⎠
⎞⎜⎜⎝
⎛
•=
SK
SS
SS RR
zln
221β (3)
The damage extent ranges of naval ships may result from test analysis, analysis of data
from actual engagements, empirical formulas linking the damage range with the type and the weight of the warhead or from the use of damage lengths defined in current deterministic damage stability regulations for naval ships.
Fig. 3. Damage extent on aircraft carrier profile In the later case a first approximation of the “RSS” can be taken according to “NES-109”
and “DDS-079” and it would be (0.15·L), see “Figure 3” (Boulougouris and Papanikolaou, 2004). The “RSK” has been assumed equal to (0.02·L)
3. NAVAL SHIP CODE In addition to navies, Classification Societies through the “NSCA” have a standing
invitation to attend the meetings of the specialist team as active participants. The specialist team is tasked with the development of a Naval Ship Code (NSC) that will provide a cost-effective framework for a naval surface ship safety management system based on and benchmarked against “IMO” conventions and resolutions. The Specialist Team has established a Goal Based Approach to the development of the “NSC” and is now developing each chapter in turn. This folder in the “NAS” library contains the latest documents including “NSC” chapters, related guidance and records of meetings. The “NSC” adopts a goal based approach. The basic principle of a goal based approach is that the goals should represent the top tiers of the framework, against which ship is verified both at design and construction stages, and during ship operation. This enables the “NSC” to become prescriptive if appropriate for the subject, or remain at a high level with reference to other standards and their assurance processes. The goal based approach also permits innovation by allowing alternative arrangements to be justified as complying with the higher level requirements. The

JOURNAL OF MARINE TECHNOLOGY AND ENVIRONMENT
30
increasing width of the triangle as the “NSC” descends through the tiers implies an increasing level of detail.
4. THE STOCKHOLM AGREEMENT The Stockholm Agreement was established in the context of resolution of the fourteen
“SOLAS” of the “IMO” in 1995, and authorized government contractors to enter into such commitments if they believe that the predominant sea conditions and other conditions require specific local stability in a certain sea area. In short, these rules are complementary to the rules “SOLAS-90”, with the addition of technical specifications to explicitly take into account the risk of accumulation of water on the car deck. The introduction of the Stockholm Agreement is closely associated with three unprecedented stops in the history of damage stability/survivability assessment: • Water on deck was explicitly taken into account for the first time. This is remarkable in
view of the knowledge that 85 (%) of all deaths with ferry accidents relate to car deck flooding.
• The effect of waves, and this is even more remarkable, was explicitly taken into account also for the first time.
• It paved the way to the introduction of performance-based standards for assessing the damage survivability of ships. All three steps represent gigantic improvements in the approach to addressing ferry
safety but any potential benefits will have to be balanced against any likely costs that might be incurred through the introduction of inappropriate standards.
5. APPLICATION IN AIRCRAFT CARRIERS Nowadays, in both practical navigation and shipyard technical offices, stability tests in
load and sea conditions, as in working or faulty conditions, are performed with software packages that starting from the ship design are able to quickly computed the required data. This research focuses on evaluating the configuration of warships, with empty deck that could be an aircraft carrier, using the working and faulty stability “FORAN” modules, in particular Architecture-Project subsystem property of “SENER Ingeniería y Sistemas”. The approach taken to perform the analysis has been the following: In the “FSURF” module, shapes, decks and walls are defined. Then, “VOLUME” module defines ship volumes and computes their volumetric capacity. The “LOAD” and “FLOOD” allow visualization of the detailed requirements generated from the stability requirement chosen, and also enables data entry to compute minimum “GM’s”. Inside last the modules, it is possible to check the most common standard stability criteria and a user define criteria obtaining if necessary the limiting “KG” values.
The chosen ship for this analysis is an aircraft carrier with the dimensions shown in “Table 1”, with two propellers shaft; which has a double bottom with a height upper to a tenth of the beam (B/10), where “B” is beam to the scantling draft. To find these dimensions, a database with other aircraft carriers of similar characteristics has been used.
Table 1. Main dimensions of the “ACCC” project
Eslora entre perpendiculares 300.00 (m) Manga de diseño 75.00 (m) Calado de diseño 12.00 (m) Puntal de diseño 25.00 (m)
Coeficiente de Bloque 0.43 Coeficiente de la Maestra 0.71

JOURNAL OF MARINE TECHNOLOGY AND ENVIRONMENT
31
Fig. 4. Visualization of “ACCC” project with the “FORAN System” design module
The ship that we have selected, that we have called “ACCC”, has a minimum draft 9.03 (m) and a maximum draft 14.22 (m). We need to define the increments between both of the drafts. In this case, the number of the increments will be two. We have defined trim equal to zero. Both, ship and configuration have been evaluated with high degree of detail in order to achieve equivalent comparisons. The fact of placing a longitudinal bulkhead below the deck number three has not been random. By designing the compartment layout in this way, a bigger number of faulty conditions and higher number of possible combinations are achieved.
Fig. 5. Midship section of the “ACCC” project 6. RESULTS IN THE AIRCRAFT CARRIER The establishment of an international maritime law, especially regarding safety, is a long
process that is not without difficulties, it requires a lengthy period of research and analysis, consensus and ratification by a sufficient number of countries. Its implementation is not always possible in older ships. The first result is that ships can coexist for years, with two standards widely depending on their seniority or banner, as happens with the well-known case of oil tankers without double hull as the “Prestige”. However, despite the remarkable technical and legislative effort that are carried out by “IMO” or the major advances in the safety convention “SOLAS”. Aircraft carriers are exempt from these rules and do not exist. In the naval field, there are not organization equivalent to “IMO” to understand the international level about the safety of such vessels. Traditionally, the aircraft carriers are taking the rules of “IMO” exists that do not interfere with naval objectives and adapting them to the extent as far as possible. Then the calculations are made on intact to see if the aircraft carrier,

JOURNAL OF MARINE TECHNOLOGY AND ENVIRONMENT
32
“ACCC”, complies with the stability intact, and that if not fulfilled, the values were obtained at the end of the study would be worthless
Table 2. “ACCC” project criteria Criteria number Description
1 “GZ” of 0.2 (m) between 30º and 90º 2 “DN” of 55.0 (mm.rd) between 0º and 30º 3 “DN” of 90.0 (mm.rd) between 0º and 40º 4 “DN” of 30.0 (mm.rd) between 30º and 40º 5 “GM” > 0.150 (m) 6 Angle for which a maximum “GZ” is obtained > 25º 7 “IMO” weather criterion
Table 3. Limit values for the “ACCC” project
Draft (m) DP (T) Criteria GZ (m) GM (m)
9.03 42511.5 7 11.352 2.518 10.75 50138.3 7 12.104 1.576 12.50 66453.2 7 12.442 0.854 14.22 78184.4 7 12.623 0.339
Where “TM” is middle draft in meters, “DP” is displacement in tons, “GM” is minimum
permissible metacentric height in meters and “KG” is permissible height of the centre of gravity in meters.
Fig. 6. Intact stability criteria curves for “ACCC” project according to “IMO”
The Stockholm Agreement
“SOLAS” implies safety, but by no means applicable to all types of vessel. Mainly because many of its rules are unworkable or unrealistic for the aircraft carriers. The criterion

JOURNAL OF MARINE TECHNOLOGY AND ENVIRONMENT
33
“SOLAS” begins by defining the extent of damage to consider. These dimensions, based on statistics of failure, are defined as a fault length equal to 3 (%) of the length plus three meters, a penetration of damage equal to (B/5) and a height of damage that goes from bottom to top without limit (Riola and Perez Fernandez, 2009).
The worst damage in “SOLAS”, considering water on deck, is composed of two compartments. The following is the “Table 4” with the data obtained with the “FLOOD” and its corresponding graph, “Figure 7”.
Fig. 7. Damage stability criteria curves for “ACCC” project according to “IMO”
Table 4. Worst damage according to “IMO” criteria for the “ACCC” project
MAXIMUM KG AND MINIMUM GM CALCULATION
Trim (m) Draft (m) Displacement (T) KGMÁX (m) GMMIN (m) 0 9.03 42511.5 13.345 2.435 0 10.75 50138.3 12.776 2.002 0 12.50 66453.2 12.322 1.567 0 14.22 78184.4 11.986 1.231
There are certainly some obvious weaknesses in the requirements of the Agreement and
this must be borne in mind when assessing roll on-roll off safety. The Stockholm Agreement was created on the presumption that a vessel designed, or modified, to “SOLAS ’90” standards ensures survival at sea states with Hs of only 1.5 (m). This was suggested in the face of uncertainty and lack of understanding of the phenomena involved. The evidence amassed so far and presented in the following suggests that this was a considerable underestimate. The maximum penalty of 0.5 (m) height of water on deck is ill based. United States Navy
The US Navy stability criteria are documented in the Design Data Sheet (DDS 079-1) (US Navy, 1975), which is divided into criteria for damage stability for both sideprotected and non-protected vessels. The “DDS 079-1” states that an angle of less than fifthteen degrees is required after damage for operational requirements. There is no mention of cross-flood

JOURNAL OF MARINE TECHNOLOGY AND ENVIRONMENT
34
systems except for in the side-protected vessels, which states that the maximum list shall not exceed twenty degrees and that arrangements exist for rapidly reducing the list to less than five degrees. The current stability criteria used by the US Navy were developed during and shortly after World War II (Sarchin and Goldberg, 1962). The following is the “Table 5” and its corresponding graph, “Figure 8”.
Fig. 8. Damage stability criteria curves for “ACCC” project according to US Navy
Table 5. Worst damage according to US Navy criteria for the “ACCC” project
MAXIMUM KG AND MINIMUM GM CALCULATION
Trim (m) Draft (m) Displacement (T) KGMÁX (m) GMMIN (m) 0 9.03 42511.5 15.034 1.045 0 10.75 50138.3 14.089 0.902 0 12.50 66453.2 13.501 0.771 0 14.22 78184.4 13.248 0.663
The “IMO” weather criteria considers wind with gusts and a roll-back angle which is
dependent on the ship’s static righting arm and other ship roll characteristics (International Maritime Organisation, 1994). The US Navy and other navies have not kept pace with “IMO” developments. They continue to rely on the empirical World War II criteria until the more sophisticated methods are developed and validated. Validation and acceptance of these new methods may take some time. Current naval ship can be greatly improved with a few small changes which maintain the integrity of their basic approach, and increase their commonality with the “IMO” criteria. British Royal Navy
The damage categories, in the “NSC”, are based on defined shapes:

JOURNAL OF MARINE TECHNOLOGY AND ENVIRONMENT
35
• Sphere. To be used for explosions. For explosions detonating against the outside of the hull, half the sphere to be used.
• Cube. To be used to define the volume directly affected by fire and which may change in shape to fit the compartment.
• Raking/grounding. To be used in the appropriate horizontal orientation to describe the extent of raking or grounding damage, the apex representing the maximum penetration.
• Collision. To be used in the correct vertical orientation to describe the extent of collision damage from the bow of another ship, the apex representing the maximum penetration.
Fig. 9. Longitudinal section in the “ACCC” project for the first flood The extent of the worst damage category is defined as damage category C, significant:
sphere with 10 (m) of radius, cube with 20 (m) of sides, raking/grounding with 40 (m) of length and 5 (m) of equal sides and collision damage with 40 (m) of height and 5 (m) of equal sides. The temperature is heat caused by initiating event assuming no other combustion.
Table 6. Worst damage according to British Navy criteria for the “ACCC” project
MAXIMUM KG AND MINIMUM GM CALCULATION Trim (m) Draft (m) Displacement (T) KGMAX (m) GMMIN (m)
0 9.03 42511.5 13.966 1.756 0 10.75 50138.3 13.338 1.444 0 12.50 66453.2 12.782 1.212 0 14.22 78184.4 12.342 0.996
Of these, there is one, raking/grounding, which is the worst of all, proof that our ship,
“ACCC” meets all known criteria, will not tolerate a failure of forty meters in length in the double bottom. Therefore, for comparison between the criteria, we will not use the failure of raking/grounding which was defined in the “NSC”. The last table is the “Table 6” with the data obtained with the “FLOOD” and its corresponding “Figure 10”.
JOURNAL OF MARINE TECHNOLOGY AND ENVIRONMENT
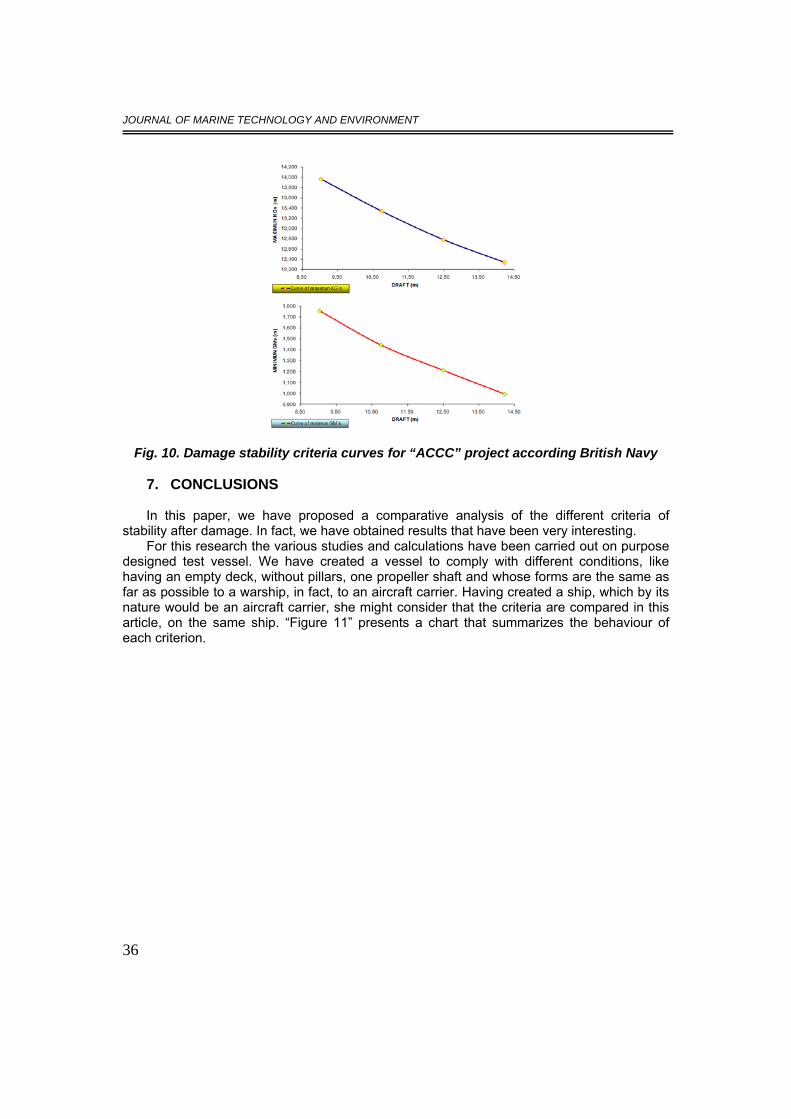
36
Fig. 10. Damage stability criteria curves for “ACCC” project according British Navy 7. CONCLUSIONS In this paper, we have proposed a comparative analysis of the different criteria of
stability after damage. In fact, we have obtained results that have been very interesting. For this research the various studies and calculations have been carried out on purpose
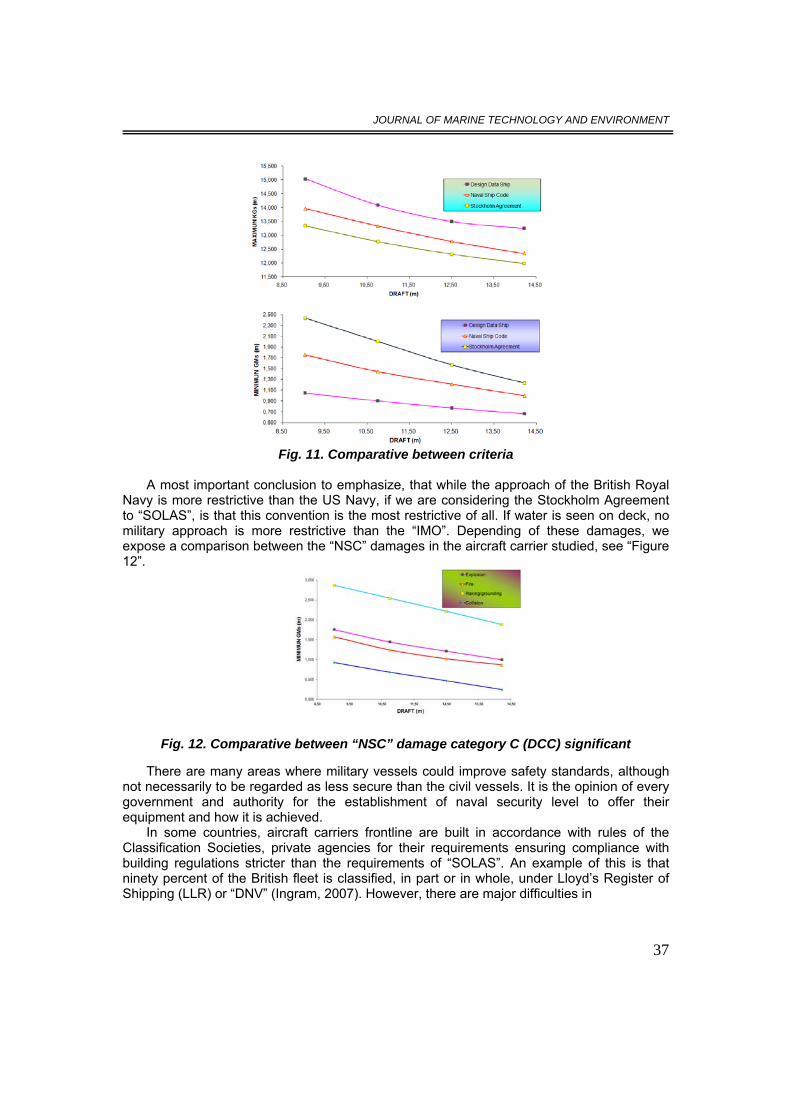
designed test vessel. We have created a vessel to comply with different conditions, like having an empty deck, without pillars, one propeller shaft and whose forms are the same as far as possible to a warship, in fact, to an aircraft carrier. Having created a ship, which by its nature would be an aircraft carrier, she might consider that the criteria are compared in this article, on the same ship. “Figure 11” presents a chart that summarizes the behaviour of each criterion.
JOURNAL OF MARINE TECHNOLOGY AND ENVIRONMENT
37
Fig. 11. Comparative between criteria
A most important conclusion to emphasize, that while the approach of the British Royal
Navy is more restrictive than the US Navy, if we are considering the Stockholm Agreement to “SOLAS”, is that this convention is the most restrictive of all. If water is seen on deck, no military approach is more restrictive than the “IMO”. Depending of these damages, we expose a comparison between the “NSC” damages in the aircraft carrier studied, see “Figure 12”.
Fig. 12. Comparative between “NSC” damage category C (DCC) significant There are many areas where military vessels could improve safety standards, although
not necessarily to be regarded as less secure than the civil vessels. It is the opinion of every government and authority for the establishment of naval security level to offer their equipment and how it is achieved.
In some countries, aircraft carriers frontline are built in accordance with rules of the Classification Societies, private agencies for their requirements ensuring compliance with building regulations stricter than the requirements of “SOLAS”. An example of this is that ninety percent of the British fleet is classified, in part or in whole, under Lloyd’s Register of Shipping (LLR) or “DNV” (Ingram, 2007). However, there are major difficulties in

JOURNAL OF MARINE TECHNOLOGY AND ENVIRONMENT
38
implementing all the rules of the Classification Societies at the naval field (Boral, Gurley Tar Becker and Humphrey, 2005); especially to establish a priority mission and capacity combat against security. It is important to distinguish the importance of the new rules “NSC”. As we have tried to reflect throughout the paper, the “NSC” has become the criterion of stability in damage than more is acclimating to the standards of the navies in the XXI century. For each type of vessel could be a priority for study in terms of damages of the “NSC”.
REFERENCES [1]. Athanassoulis, G. and Skarsoulis, M. – Wind and Wave Atlas of the North-Eastern Mediterranean Sea. NTUA-SMHL Publications, 1992. [2]. Boulougouris, E.K. and Papanikolaou, A.D. – Optimisation of the Survivability of Naval Ships by Genetic Algorithms. 3rd Int. Euro Conference on Computer Applications and Information Technologies in the Maritime Industries. COMPIT’04, 2004, Saguenay, Spain. [3]. Boral, P.; Gurley, G.; Tar Bake, E. and Humphrey, R. – Development of a NATO Naval Ship Code. Safety regulations and Naval Class II. London: The Royal Institution of Naval Architects, 2005. [4]. Ingram, T.J. – Application of commercial ship maintenance philosophy to naval ships. American Bureau of Shipping, 2007. [5]. Przemieniecki, J.S. – Mathematical Methods in Defense Analyses. 2nd Edition, American Institute of Aeronautics and Astronautics, 1994. [6]. Rahola, J. – The judging of the Stability of Ships and the Determination of the Minimum Amount of Stability. Transactions. Institute of Naval Arquitects, 1935. [7]. Riola, J.M. – Landing and carrier warships´ survivability basin test. Defense Department, 2003, Spain. [8]. Riola, J. M. and Pérez Fernández, R. – Estudio comparativo entre los criterios de estabilidad de la Armada Norteamericana, Británica y del SOLAS. 48º Congreso de Ingeniería Naval e Industria Marítima, 2009, Vigo, Spain. [9]. Sarchin, T.H. and Goldberg, L.L. – Stability and Buoyancy Criteria for the U.S. Naval Surface Ships. Trans. SNAME, Vol.70, pp. 418-458, 1962. [10]. Surko, S.W. – An Assessment of Current Warship Damaged Stability Criteria, Naval Engineers Journal, Vol.106, No.2, pp. 120-131, 1994. [11]. US Navy, Naval Ship Engineering Center – Design Data Sheet-Stability and Buoyancy of US Naval Surface Ships, DDS 079-1. US Navy, currently Naval Sea Systems Command, 1975, Washington, DC, EEUU.
JOURNAL OF MARINE TECHNOLOGY AND ENVIRONMENT
39
TOTAL CELL COUNT, SINGLE CELL BIOMASS AND GROWTH RATE IN MARINE MICROCOSMS SUPPLEMENTED WITH GASOLINE AND
GASOLINE-ENRICHED MARINE POPULATIONS
1,3GHITA SIMONA, 2,3ARDELEAN IOAN
1Constanta Maritime University, 2Institute of Biology Bucharest, 3Ovidius University Constanta, Romania
In this paper we present the results concerning some microbial parameters (total cell count, biomass and percentage growth rate) in marine microcosms supplemented with gasoline and gasoline-enriched marine populations. At the beginning of experiment, total cell population density was higher in microcosm supplemented with gasoline-enriched marine population and carbon / nitrogen source (gasoline (1% v/w) and ammonium nitrate (0.005% w/w)) as compared with the other microcosms, then a significant decrease in total cell population density was observed, due probably to gasoline consumption and/or to the significant bacteriolithic activity (litic bacteriophages and/or predatory bacteria). Our results argue that gasoline can sustain the growth of endogenous micorbiota as well as of previously gasoline-enriched marine populations, thus sustaining the further research on the use of gasoline-enriched marine populations for bioremediation of polluted sites (bioaugmentation)
Keywords: total cell count, biomass, nondefined- enriched consortia, gasoline
1. INTRODUCTION The quantification of microbial biomass in marine ecosystem cumulated with
determination of morphological and physiological parameters of this biomass are important in understanding the role of microorganisms in these ecosystems (Karl, 2002; Venter et al., 2004; DeLong and Karl, 2005; DeLong et al., 2007; Ducklow, 2008; Gasol et al., 2008; Kirchman, 2008; Liu et al., 2010; Kemp, 2010; Costello et al., 2010).
Taking into account the advantages of microcosms (Iturbe et al. 2003; Molina-Barahona et al., 2004) we started research on marine microbiota able to tolerate/oxidize gasoline (Ardelean et al. 2009a,b; Ghita and Ardelean, 2010b), a complex hydrocarbon mixture whose consumption by heterotrophic bacteria is under increase research (Jamison et al., 1975; Ridgway et al., 1990; Zhou and Crawford, 1995; Cunha and Leite, 1997; Solano-Serena, 1999, 2000; Röling et al., 2002, 2004; Moslemy et al., 2002; Goméz-De-Jesús et al., 2003; Sánchez et al., 2006; Teira et al., 2007; Genovese et al., 2008).
As the presence of bacteriovorus protist in bacterial microcosms induces a decrease in the total bacterial count and also causes other subtle changes in the remaining bacteria populations (Jürgens et al., 2000; Sherr et al., 1999, 2002; Vasques- Domninques et al., 2005) following the previous papers (Ardelean et al., 2009a; Ghita and Ardelean, 2010a) ‘‘protist-free’’ bacterial communities were used in this communication, as well.

JOURNAL OF MARINE TECHNOLOGY AND ENVIRONMENT
40
Furthermore, the use of large–scale inocula of hydrocarbon-degrading organisms to accelerate (intrinsec) bioremediation of contaminant environments is largely reported in literature as Bioaugmentation: the increase removing of pollution by the introduction of specific competent strains or consortia of microorganisms constructed either by combining a number of strains with known complementary degradative capabilities (defined consortia) or by direct enrichment procedures (nondefined consortia) (Budzinski et al., 1998; Sugiura et al., 1997; Venkateswaran et al., 1995).
The aim of this paper is to measure time- dependence of total cell count and biomass in four types of marine microcosms as compared with the control microcosms, the main achievement as compared with our previous papers (Ardelean et al., 2009 a, b; Ghita and Ardelean, 2010a; Ghita et al., 2010a) being the use of selected gasoline-oxidant populations which have been added to some microcosms.
2. MATERIALS AND METHODS 1. Water samples were collected in sterile bottles from the Black Sea (Tomis seaport at
0.5m depth; 44o10’42’’N; 28o39’36’’E) which was used for the microcosms setup done in Polyethylene transparent bottles. In our experiments, the microcosms (1L of natural sea water (plankton sample without sediment) filtered through 0.45 were kept at 18oC temperature and artificial illumination about two months (from December 2 to January 24), as previously shown (Ghita and Ardelean, 2010a).
2. Microcosms construction. The experimental variants were composed of the five types of marine microcosms: Black Sea natural sample- control (M3); control supplemented with gasoline (1% v/w) (M2), control supplemented with gasoline (1% v/w) and nutrients (ammonium nitrate 0.005% w/w) (M1), control supplemented with gasoline (1% v/w) and selected population (1 mL) (M4) and control supplemented with gasoline (1% v/w), nutrients (ammonium nitrate 0.005% w/w) and selected population – 1 mL (M5).
In order to monitor the changes in bacterial cell density ‘‘protist-free’’, bacterial communities were obtained by the filtration of natural sea water through a sterile 0.45 μm syringe filter (Millex, Millipore) to (completely) avoid the inclusion of heterotrophic nanoflagellates/protists in the filtrate (Cynar et al., 1985; Vazquez-Dominguez et al., 2005). The exclusion of heterotrophic nanoflagellates (as well as of larger potentially bacteriovorus eukaryotes) from these microcosms allow the measurement of total cell / prokaryotic count, when no prokaryotic cell are consumed by bacteriovorus microorganisms. However, it has to remember that 0.45mm filtration causes the exclusion from the microbial community of larger bacteria, which are, in general, in good metabolic status (Vazquez-Dominguez et al., 2005).
3. AOTC (acridine orange total count).Total cell count were done as previously shown (Ardelean et al., 2009 a,b; Ghita et al., 2010b; Ghita and Ardelean, 2010 a, b) in agreement with (Sherr et al., 2001; Fuhrman and Azam, 1980; Fry, 1990; Marie et al., 1997; Lebaron et al., 2001; Paul, 2001; Luna et al., 2002; Munn, 2004; Lunau et al., 2005; Manini and Danovaro, 2006; Falcioni et al., 2008; Kirchman, 2008). The images were taken with a digital camera (Sony DSC-P200, 7, 2 megapixels). For sizing and quantification we used two programs: Image J and CellC. ImageJ was the main software for measure the length of cells and the CellC software is the second software used in automated analysis of our microscopy images like cell enumeration and measurements of cell’s properties (size, shape, intensity) (Selinummi, 2008), as previously shown (Ardelean et al., 2009b, Ghita et al., 2010b).
4. Cell size and biomass was achieved using Image J program, on a sample of 150 cells- Linear cell dimenstions were converted to biovolume (the formulas below, and finally reporting the average for the five microcosms) it was claculated the corresponding biomass (Lee and Fuhrmann, 1987; Norland, 1993; Paul et al., 1999).

JOURNAL OF MARINE TECHNOLOGY AND ENVIRONMENT
41
For each bacteria counted was recorded morphological type (cocci and rhods). Each cell size was measured (diameter and length) by reference to the micrometer scale.
Volume calculation was performed by applying the followings formula V= (π/4) d2 (l-d/3) and V=πd3/6 for rhods and spherical cells, respectively (Sherr et al, 2001). Cell volume was converted in cell dry biomass using the formula mu=435xV0, 86 fg (Loferer-Krössbacher et al., 1998) as previously shown (Popoviciu and Ardelean, 2010).
5. Nondefined consortia. Selected population was obtained from previous microcosms (Ardelean et al, 2009b) by enrichment procedures (Ardelean and Ghita, manuscript in preparation). In order to avoid (excess) soluble organic nutrient contamination in M4 and M5 the selected populations were collected by filtration (0.22μm Millipore filters), suspended in sterile sea water from which 1mL was introduced in each microcosms (M4 and M5).
3. RESULTS AND DISCUSSION In figure 1 one can see the time-dependence evolution of total cell count in the five types
of marine microcosms.
Fig. 1. Time-dependence evolution of total cell count (acridine orange) in the five
types of marine microcosms, 1L 0.45μm filtered sea water each one: Black Sea natural sample- control (M3); control supplemented with gasoline (1%) (M2), control supplemented
with gasoline (1% v/w) and ammonium nitrate (0.005% w/w) (M1), control supplemented with gasoline (1% v/w) and selected population (1mL) (M4) and control supplemented with
gasoline (1% v/w), ammonium nitrate (0.005% w/w) and selected population – 1 mL (M5). As one can see in figure 1 the time evolution of the total cell count measured using
acridine orange as fluorochrom in the three microcosms without added selected cultures has the same shape as previously reported in similar experiments (Ardelean et al., 2009a; Ghita and Ardelean, 2010a), arguing that the higher total cell densities reached in microcosms supplemented with either gasoline (M2) or gasoline and ammonium nitrate (M1) as compared with the control are correlated with the presence of these chemicals which can be used as nutrients by (some) of the natural microbiota.
As expected in the microcosms supplemented with selected gasoline-tolerant/oxidant populations, M4 and M5, total cell count is higher from the beginning of the experiment as compared with the three microcosms without added selected populations. Taking into account that total cell count per milliliter of the batch cultures of selected population is 2,53x10⁶ it is thus expected that 1mL of this population added to 1L microcosms would contribute to total cell count per milliliter of microcosms 4 or 5 by 2,53x103 cells. As one can see in figure 1 there are, however, differences of AOTC in M5 and M4 after cell additions,

JOURNAL OF MARINE TECHNOLOGY AND ENVIRONMENT
42
which can originate both in initial cell densities of each microcosms and in pipeting errors (which do not affect the overall experiment).
The experimental results thus obtained should be analyses in therm of growth rate for appropriate comparisons between the sets of data; the classical equation for calculating specific growth rate and generation time cannot be applied to these microcosms for several reasons (there is not a pure culture, the cultures are not during exponential growth; it is not clear if all the cells presented in each microcosms are capable of cellular growth and division, etc) (Brock, 1971). This is why we chose to simply calculate the procentual growth from one sampling time to another and to use the geometric mean of the percentage growth as it is well known that whenever we have percentage growth over a period of time, it is the geometric mean and not the arithmetic mean that makes sense (www.experiment-resources.com).
In the next table there are represented the procentual growth rate in the five microcosms calculated using the data on AOTC.
Table 1. The calculated percentage daily growth rates in the five microcosms
Percentage growth rate / day M1 M2 M3 M4 M5
6 days 5.14 4.83 1.77 5.49 28.5611 days 1.3 1.58 3.32 3.42 1.8418 days 4.57 6.05 1.20 0.5 -2.6139 days 0.2 0.79 0.56 -0.65 -1.6253 days -0.39 -0.55 -0.9 -0.58 -0.67
The daily percentage growth rate presented in table 1 were used to calculate the
geometric mean for the first 10 days, the results obtained being the following: M1 (2.58); M2 (2.76), M3 (2.42); M4 (4.33) and M5 (7.25).
The calculated percentage daily growth rates should be interpreted as the mean daily rate of growth of the bacteria over the period of 10 days, which means that if the strain of bacteria grew uniformly by the procentua percentage rates over the 10 days period, then starting with the initial densities in each microcosms they would reach in 10 days the densities experimentally determined in each microcosms.
The higher percentage growth reached in M5 as compared with M4 could be explained by the ability of microbial cells (endogenous microbiota plus added selected consortia) to utilize both types of nutrients, gasoline and ammonium nitrate in M5, and of only gasoline in M4. The same explanation with respect to nutrients seems to be valuable to explain the higher percentage growth rate (of only endogenous microbiota) in M1 (gasoline and ammonium nitrate) and M2 (gasoline).
The higher percentage growth reached in M5 and M4 as compared with M1 and M2, respectively could be explained by the presence in M5 and in M4 of already gasoline oxidizing cells which seems to remain active (at least some of them) and capable of cellular growth and division after the transfer into sea water supplemented with gasoline and ammonium nitrate.
The control (M3) where gasoline and nitrogen source were not added, has the lowest procentual growth rate of the endogenous microbiota.
An interesting aspect is the rather sharp decrease in AOTC in M4 and M5 toward the end of the experiment, reaching cell densities (AOTC) around the level of the other three microcosms, which actually reach a plateau. This sharp decrease could be due to the impossibility of the microcosms to sustain higher cell densities after the consumption of the

JOURNAL OF MARINE TECHNOLOGY AND ENVIRONMENT
43
added nutrients and /or to the higher bacteriovorus activity (Cunha and Leite, 1997; Vazquez –Dominguez et al., 2005), probably bacteriophages or predatory bacteria in our experiments, as the eukaryotic bacteriovorus have been eliminated by filtration (0.45 μm filters).
Another important parameter of the microbial community is the dimensions of the cells. In figure 2 there are presented time-dependence evolution of linear cell dimensions in the five types of marine microcosms.
Fig. 2. Time-dependence evolution of linear cell dimensions in the five types of marine microcosms; each point is the average obtained from measurements of 150
individual cells. For more details see Material and methods. As one can see in figure 2, the cell dimensions are rather low, with very small numerical
differences in time between the majority of the microcosms; the lowest cell size was observed in microcosms 2 (1,21±0,09 μm) and the largest in microcosms 4 (1,51±0,17 μm). The statistical significance- if any- of the small numerical differences is under investigations. However, we focus on the higher cell dimensions in microcosms 4, as compared with all others microcosms. We put forward that this results is due both to the presence of gasoline as extra carbon source and to the absence of extra nitrogen source which create an unbalance between carbon and nitrogen, thus promoting cellular growth as compared with cell division. The relationship between cell growth and the rate of cell divisions could be the explanation of the above presented results. Further measurements where the frequency of dividing cells will be experimentally determined would enable us to verify our working hypothesis. Based on the each cell dimentions and shape it was calculated celluar volume which was further converted to cell dry biomass. In figure 3 there are presented the results concerning the time evolution of the mean single- cell biomass in the five microcosms.
Fig. 3. Time-dependence evolution of single-cell biomass (fg) in the five types of marine microcosms. Each point is the average obtained from measurements and calculations of 150 individual cells. For more details see Material and methods.

JOURNAL OF MARINE TECHNOLOGY AND ENVIRONMENT
44
The lowest dry biomass was measured in M3 (164,34±36,4 fg) and the highest value in M4 (687,27±270,1 fg). As for cell dimensions, the time evolution of single cell biomass in the five microcosms deserves further experiments for a better understanding of its signification.
4. CONCLUSIONS
The introduction in microcosms 4 and 5 of gasoline- adapted microbial population is followed by a higher increase in total cell count as compared with the controls (1 and 2, respectively) and absolute control (M3), arguing that gasoline-adapted microbial population can utilize in the microcosms the gasoline as carbon source for growth and multiplication.
The higher increase in AOTC in M5 as compared with M4 argues that the addition of ammonium nitrate as nitrogen source (0.005%) can sustain the multiplication of prokaryotic populations.
The sharp decrease in AOTC mainly in M5 but also in M4 during the second half of the experiment, in the absence of bacteriovorus eukaryotes, could be related to shortcut in organic supply (gasoline consumption) and/or to the significant presence of litic bacteriophages or predatory bacteria, and deserves further attention.
The increase in AOTC of natural endogens microbiota in M2 and M1 follows the general shape previously obtained results with 0.45μm – filtered sea water (Ghita and Ardelean, 2010a; Ghita et al., 2010a)
These results are important for bioaugmentation studies in microcosms as an simplified experimental model for the sea.
REFERENCES [1].Ardelean I.I. et al. – Epifluorescent method for quantification of planktonic marine
prokaryotes, Proceedings of the 2nd International Symposium “New Research in Biotechnology” series F, Bucharest 2009, pp. 288-296, 2009a
[2].Ardelean I.I.et al. - Isolation of oxygenic phototrophic and oxic heterotrophic bacteria with potential for gasoline consumption, Proceedings of the 2nd International Symposium “New Research in Biotechnology” series F, Bucharest 2009, pp. 278-287, 2009b
[3].Bölter M. et al. – Enumeration and biovolume determination of microbial cells- a methodological review and recommendations for application in ecological research, Biology and Fertility of Soils, 36, pp. 249-259, 2002
[4].Brock T. D. - Microbial growth rates in nature, Bacteriology, Reviews 35, pp. 5-39, 1971 [5].Budzinski H. et al. - Aerobic biodegradation of alkylated aromatic hydrocarbons by a bacterial
community, Organic Geochemistry, 28, pp. 337– 348, 1998 [6].Costello M. J. et al. - A Census of Marine Biodiversity Knowledge, Resources, and Future
Challenges, PLoS ONE, 5, pp. 1-15, 2010 [7].Cunha C.D., Leite S.G.F. - Optimization of Some Environmental Conditions to Enhance
Gasoline Biodegradation in Soil Microcosms Bio-augmented with Pseudomonas putida, Annual Review of Microbiology, 28, pp. 129-134, 1997
[8].Cynar F.J. et al. - The detection and characterization of bacteria-sized protist in ‘‘protist-free’’ filtrates and their potential impact on experimental marine ecology, Microbial Ecology, 11, pp. 281–288, 1985
[9].DeLong E.F., Karl D.M. - Genomic perspectives in microbial oceanography, Nature, 437, pp. 336–342, 2005
[10].DeLong E. et al. – Microbial oceanography. Challenges and opportunities. The Agouron Institute: http://www.agi.org/publications.html., 2007
[11].Ducklow H. - Microbial services: challenges for microbial ecologists in a changing world, Aquatic Microbial Ecology, 53, pp. 13–19, 2008
[12].Falcioni T. et al. - Evaluating the flow-cytometric nucleic acid double-staining protocol in realistic situations of planktonic bacterial death, Applied and Environmental Microbiology, 74, pp. 1767-1779, 2008

JOURNAL OF MARINE TECHNOLOGY AND ENVIRONMENT
45
[13].Fry J.C. – Direct methods and biomass estimation, Methods in Microbiology, 22, pp. 41-85, 1990
[14].Fuhrman J.A., Azam F. - Bacterioplankton secondary production estimates for coastal waters of British Columbia, Antarctica and California, Applied and Environmental Microbiology, 39, pp. 1085–1095, 1980
[15].Gasol J.M. et al. - Towards a better understanding of microbial carbon flux in the sea, Aquat Microb Ecol 53, pp.21–38, 2008
[16].Genovese M. et al. - Bioremediation of benzene, toluene, ethylbenzene, xylenes-contaminated soil: a biopile pilot experiment, Journal of Applied Microbiology, 105, pp. 1694-1702, 2008
[17].Ghita S,. Ardelean, I.I. - Dynamics of marine bacterioplankton density in filtered (0.45 μm) microcosms supplemented with gasoline, Proceedings of the 3th International Conference on „Environmental and Geological Science and Engineering”” (EG’10), Published by WSEAS Press. pp: 93-98, 2010a
[18].Ghita S,. Ardelean, I.I. – Marine bacterioplancton density dynamics in microcosms supplemented with gasoline, Romanian Journal of Biology, Plant Biol, 55, pp. 55-61, 2010b
[19].Ghita S. et al. – The use of direct viable count method for quantification of bacteria in marine microcosms supplemented with gasoline, Proceedings of the 3nd International Symposium “New Research in Biotechnology” serie F, Bucharest 2010, pp. 204-212, 2010a
[20].Ghita S. et al. – Utilization of epifluorescence microscopy and digital image analysis to study some morphological and functional aspects of prokariotes, Ovidius University Annals of Biology-Ecology, 14, pp.137, 2010b
[21].Goméz-De-Jesús A. et al., - Biodegradation Of The Water-Soluble Gasoline Components In A Novel Hybrid Bioreactor, Engineering In Life Sciences, 3, pp. 306-312, 2003
[22].Iturbe R. et al. - Subsoil polluted by hydrocarbons in an out-of-service oil distribution and storage station in Zacatecas, Mexico, Environmental Geology, 44, pp. 608–620, 2003
[23].Jamison V.W. et al. - Biodegradation of High-Octane Gasoline, Developments in Industrial Microbiology, 16, pp. 305-312, 1975
[24].Jürgens K. et al. - Bacteria–flagellate coupling in microcosms experiments in the Central Atlantic, Journal of Experimental Marine Biology and Ecology, 245, pp. 127–147, 2000
[25].Karl D. M. - Hidden in a sea of microbes, Nature, 415, pp. 590–591, 2002 [26].Kemp P.F. - Eco-DAS VIII Symposium Proceedings. Waco, TX:American Society of Limnology
and Oceanography. doi:10.4319/ecodas.2010.978-0-9845591-1-4, 2010 [27].Kirchman D.L. - Microbial Ecology of the Oceans. John Wiley & Sons, NY, pp. 593, 2008 [28].Lebaron P. et al. - Does the high nucleic acid content of individual bacterial cells allow us to
discriminate between active cells and inactive cells in aquatic systems, Applied and Environmental Microbiology, 67, pp. 1775-1782, 2001
[29].Lee S., Fuhrman J.A. – Relationships between biovolume and biomass of naturally derived marine bacterioplancton, Applied and Environmental Microbiology, 53, pp. 1298-1303, 1987
[30].Liu J. - Effect of ocean acidification on microbial diversity and on microbe-driven biogeochemistry and ecosystem functioning, Aquatic Microbial Ecology, 61, pp. 291–305, 2010
[31].Loferer-Krössbacher M. et al. - Determination of bacterial cell dry mass by transmission electron microscopy and densitometric image analysis, Applied and Environmental Microbiology, 64, pp. 688-694, 1998
[32].Luna G.M. - High fraction of dead and inactive bacteria in coastal marine sediments: comparison of protocols and ecological significance, Applied and Environmental Microbiology, 68, pp. 3509-3513, 2002
[33].Lunau M. - An improved method for counting bacteria from sediments and turbid environments by epifluorescence microscopy, Applied and Environmental Microbiology, 7, pp. 961-968, 2005
[34].Manini E., Danovaro R. - Synoptic determination of living/dead and active/dormant bacterial fraction in marine sediments, FEMS Microbiology Ecology, 55, pp. 416-423, 2006
[35].Marie D. et al. - Enumeration and cell cycle analysis of natural populations of marine picoplankton by flow cytometry using the nucleic acid stain SYBR Green I, Applied and Environmental Microbiology, 63, pp. 186-193, 1997

JOURNAL OF MARINE TECHNOLOGY AND ENVIRONMENT
46
[36].Molina-Barahona L. et al. - Diesel removal from contaminated soils by biostimulation and supplementation with crop residues, Applied Soil Ecology, 27, pp. 165–175, 2004.
[37].Moslemy P. et al. - Biodegradation Of Gasoline By Gellan Gum-Encapsulated Bacterial Cells Biotehnol, Biotechnology and Bioengineering, 80, pp. 175-184, 2002
[38].Munn C.B. - Marine Microbiology: Ecology & Applications, BIOS Scientific Publishers, NY, pp.282, 2004
[39]. Norland S. – The relationship between biomass and volume of bacteria, In: Kemp PF, Sherr BF, Sherr EB, Cole JJ (eds) Handbook of methods in aquatic microbial ecology. Lewis Boca Raton, Fla, pp.303-307, 1993
[40].Paul E.A. et al. - The determination of microbial biomass, In: Robertson GP, Coleman DC, Bledsoe CS, Sollins P (eds) Standard soil methods for long-term ecological research. Oxford University Press, New York, pp. 291-317, 1999
[41].Paul J.H. - Methods in Microbiology, Volume 30: Marine Microbiology, Academic Press, San Diego, CA, pp: 666, 2001
[42].Popoviciu D.R., Ardelean I. – Changes in bacterial abundance and biomass in sandy sediment microcosm supplemented with gasoline, Ovidius University Annals of Biology-Ecology, 14, pp.139-145, 2010
[43].Ridgway H.D. et al. - Identification and Catabolic Activity of Well-Derived Gasoline-Degradind Bacteria from a Contaminated Aquifer, Applied and Environmental Microbiology, 56, pp. 3565-3575, 1990
[44].Röling W.F.M. et al. - Robust hydrocarbon degradation and dynamics of bacterial communities during nutrient-enhanced oil spill bioremediation, Applied and Environmental Microbiology, 68, pp. 5537-5548, 2002
[45].Röling W.F.M. et al. - Response of Archaeal communities in beach sediments to spilled oil and bioremediation, Applied and Environmental Microbiology, 70, pp. 2614-2620, 2004
[46].Sánchez O. et al. - Presence of opportunistic oil-degrading microorganisms operating at the initial steps of oil extraction and handling, International Microbiology, 9, pp.19-124, 2006
[47].Selinummi J. - On Algorithms for Two and Three Dimensional High Throughput Light Microscopy, Ph.D Thesis for the degree of Doctor of Technology, 2008
[48].Sherr B.F. et al. - Estimating abundance and single-cell characteristics of actively respiring bacteria via the redox dye CTC, Aquatic Microbial Ecology, 18, pp. 117–131, 1999
[49].Sherr B. et al. - Enumeration of total and highly active bacteria, Methods in Microbiology, 30, pp. 129-159, 2001
[50].Sherr E., Sherr B. - Significance of predation by protists in aquatic microbial food webs, Ant van Leeuwen, 81, pp. 293–308, 2002
[51].Solano-Serena F. et al. - Biodegradation of gasoline: kinetics, mass balance, fate of individual compounds, Journal of Applied Microbiology, 86, pp. 1008–1016, 1999
[52].Solano-Serena F. et al. - Selection of microbial populations degrading recalcitrant hydrocarbons of gasoline by culture headspace monitoring, Letters in Applied Microbiology, 30, pp. 19-22, 2000
[53].Sugiura K. et al. - Physicochemical properties and biodegradability of crude oil, Environmental Science & Technology, 31, pp. 45– 51, 1997
[54].Teira E. et al. - Dynamics of the hydrocarbon-degrading Cycloclsticus bacteria during mesocosm-simulated oil spills, Environmental Microbiology, 9, pp. 2551-2562, 2007
[55].Va´zquez-Domı´nguez E. et al. - Different marine heterotrophic nanoflagellates affect differentially the composition of enriched bacterial communities. Microbial Ecology, 49, pp. 474–485, 2005
[56].Venkateswaran K. et al. - Microbial degradation of resins fractionated from Arabian light crude oil. Canadian Journal Microbiology, 41, pp. 418– 424, 1995
[57].Venter J.C. et al. - Environmental genome shotgun sequencing of the Sargasso Sea, Science 304, pp. 66–74, 2004
[58].Zhou E., Crawford R.L. - Effects of oxygen, nitrogen and temperature on gasoline biodegradation in soil, Biodegradation, 6, pp. 127-140, 1995
[59]. www.experiment-resources.com

JOURNAL OF MARINE TECHNOLOGY AND ENVIRONMENT
47
THE USE OF MAGNETIC FLUIDS TO OBTAIN AND BUILD SEALS
GRIGORESCU LUCIAN
Constanta Maritime University, Romania
Magnetic fluids, sometimes called “ferro-fluids” are a new category of synthetic materials combining fluid properties with magnetic properties of solids. They are colloidal suspension of ferromagnetic particles into a basic liquid. Magnetic ultrafine particles (30-160A0) are integrated in a basic liquid by means of surface-active substances, which create an elastic coating (layer) around each particle and, with thermal agitation, ensure the stability of suspension even in the highly non-uniform magnetic fields
Keywords: magnetic liquids, ferro-fluids, ferromagnetic fluid seals, magnetic liquid ring
1. GENERAL PRESENTATION The magnetic fluid seals, also called “ferro-fluids”, are based on the possibility to
maintain in the space of magnetic fluids by the action of a magnetic field.
Fig.1.The principle scheme of seals with magnetic liquid

JOURNAL OF MARINE TECHNOLOGY AND ENVIRONMENT
48
Since polar components have toothed profiles, the magnetic field between the shaft and polar components has a non-uniform distribution and the magnetic fluid is gathered in the highly intense magnetic field zones and forms “rings” of liquid (see Fig. 1b) which achieves the sealing of the shaft, with much lower friction than the mobile contact sealing case.
Each “magnetic liquid ring” supports a pressure difference of (0,02-0,06)MPa, depending on the saturated magnetization of the fluid and the intensity of magnetic field in the air gap.
A liquid ring forms a level of sealing. The number of magnetic liquid rings can be determined with the help of the relation below:
([ )]21
21
BBMppz
s −−
= (1)
where:
1p = sealing pressure;
2p =environmental pressure;
sM = saturated magnetization of the magnetic fluid;
1B = the maximum magnetic induction;
2B = the minimum magnetic induction. The number of sealing levels (N) – and the width of the polar components is determined
with (2) relation
N = (1,5……2) z (2)
The maximum pressure difference is in proportion with the number of polar pieces if the permanent magnet ensures the necessary magnetic flux and the shaft is not saturated from a magnetic point of view .
If the seal is subjected to a certain pressure difference, the magnetic liquid rings act as safety valves, some of the them are successively pierced and the inter annular space is pressurized. In this way, the pressure difference is uniformly distributed on the sealing levels (rings), the rest remaining as reserve.
2. EXPERIMENTAL DATA Magnetic fluid with about 1018 particle /cm3 is a quasi-homogenous liquid, strongly
magnetic, so that the magnetic volume force is in proportion with the fluid magnetization and the magnetic field gradient.
The magnetization reaches 80kA/m value, depending on magnetic particle concentration dispersed into the base liquid.
Mechanical, thermal, electrical and chemical properties of magnetic fluids are similar to the base liquid, with some difference produced by magnetic particle.
For the magnetic fluids, liquids with reduced vapor pressure value are used. Table No.1 presents the basic characteristics of some magnetic fluids, obtained by the Research Center for Hydrodynamics, Cavitation, and Magnetic Liquids in Polytechnic University of Timisoara.

JOURNAL OF MARINE TECHNOLOGY AND ENVIRONMENT
49
Table 1 The base liquid Indicator Saturated
magnetization (ka/m) Boiling temperature
of the base liquid Diester LMDOA 31,8 478 Diester LMDOS 31,8 521 Mineral oil LMTR-30 35,8 -
3. CONCLUSIONS 3.1. This type of sealing which uses magnetic fluid is used to seal gases e.g. at helium
compressors in freezing technique, in vacuum pumps of electronics industry or in radioactive gases sealing. They cannot be used for liquids sealing, but can be used if are combined with mechanical sealing.
Fig. 2 presents a sealing device with magnetic fluid
Fig. 2. Sealing device with magnetic liquid, provided with bearings.
1,2 -polar pieces manufactured from magneitc materials, 3-case manufactured of magnetic
materials, 4- nuts of magnetic materials, 5- permanent magnet, 6,7,8- “O” rings, 9- lid of magnetic material, 10-shaft, 11- nipple, 12- machinery wall, 13- elastic ring, 14- bearing.
3.2 Recommended pressures are:10-6(10-8) torr÷1,5 bar; 10-6 torr÷6 bar; 10-6 torr 10 ÷bar. 3.3. It can run at high speeds 20÷30.000 rot/min. 3.4. No maintenance is required for at least 5 years. 3.5. Friction power losses are very low. They can be determined by relation (3).
[W] (3) 22121045,3 dnNPf ⋅⋅⋅⋅⋅= − η
where:

JOURNAL OF MARINE TECHNOLOGY AND ENVIRONMENT
50
η = dynamic viscosity of magnetic fluid, (Pa s⋅ ); N= number of sealing rings; N= shaft speed (rot/min); D= shaft diameter (mm).
3.6. Fluid losses are practically nules. 3.7. For special cases, we can use combinations of magnetic fluids seals with “classical”
seals (mechanical, centrifugal, etc.).
REFERENCES [1]. CRISTEA, V.,s.a. - Etansari, Editura Tehnica, Bucuresti, 1973 [2]. DRĂGHICI,I.,s.a. - Îndrumar de Proiectare în Constructia de Masini, vol.II, Editura Tehnica, Bucuresti, 1982 [3]. DRAGHICI,I.,CRISTEA,V. - Etansari-Atlas, Universitatea din Brasov, 1980 [4]. GRIGORESCU,L.,s.a. - Etansari, Editura Nautica, Constanta, 2009 [5]. JINESCU,V. - Utilaj Tehnologic pentru Industriile de Proces vol.4, Editura Tehnica Bucuresti, 1989 [6]. “Catalog de Etansari Magneto-Fluinice”, Universitatea Politehnica Timisoara, 2008 [7]. “Catalog Etansari cu Lichide Magnetice”, S.C. ROSEAL – Odorheiul Secuiesc, Romania

JOURNAL OF MARINE TECHNOLOGY AND ENVIRONMENT
51
THE INFLUENCE OF FACTORS ACTING ON THE FRICTION POWER LOSSES IN MECHANICAL SEALS WITH SLIDING RINGS
GRIGORESCU LUCIAN
Constanta Maritime University, Romania
In terms of users of such mechanical packing, the value of lost friction power and the factors contributing to the increase or decrease of this power is of maximum interest.
Keywords: friction power, influence factors; friction torque; sliding rings; friction regime
1. GENERAL PRESENTATION
The power lost by friction ( ) can be calculated by relation (1). fN
ω⋅= ff MN [W] (1)
where: ω - shaft rotating velocity (s-1);
fM - total torque ( ). mN ⋅
The total torque is given by relation (2). fM
haf MMM += [ mN ⋅ ] (2)
where:
aM - the friction torque of the active surfaces of the sliding rings ( mN ⋅ );
hM - the friction torque between rotating components of mechanical seal and auxiliary fluid (blocking fluid) ( mN ⋅ ).
The torque “ ” is determined as (3). aM
[2/2 μπ ⋅⋅⋅⋅= ama pbdM mN ⋅ ] (3)
where: b – the active surface width of the sliding rings (m);
2dDdm
+= is mean diameter of sliding rings (m);

JOURNAL OF MARINE TECHNOLOGY AND ENVIRONMENT
52
D – major diameter of the sliding rings (m); d – minor diameter of the sliding rings (m); μ - friction coefficient;
ap - axial contact pressure (Pa), depending on the type of sliding ring material and on the hydraulic loading rate (k).
The torque Mh depends on the rotating ring speed and on the auxiliary liquid flow type (laminar or turbulent). This type of flow depends on the packing construction. At high speeds, Mh has important values, but at low speeds it is negligible.
The torque Ma is the most important for the total moment Mf calculation. It yields the thermal loading of sliding ring surface, and on this loading the existence of lubricating- cooling film in the sealing slot depends, the wear and thermal deformations.
The laminar flow of liquid in the sealing space reduces the value of Mh, but does not allow the removal of heat produced by Ma.
In the turbulent flow case, the elimination of the heat produced by Ma and Mh is favored, and the heat transfer coefficient is increased.
2. EXPERIMENTAL DATA The factors influencing losses of friction power are: 2.1. Friction regime 2.2. Sliding rings temperature 2.3. Flow regime 2.1. Friction regime: Based on the hydraulic loading rate (k) and operating conditions, in the sealing slot
(interstitium) all the states of friction can appear, from the fluid friction to dry friction. •In the fluid friction case, the dynamic viscosity of the auxiliary fluid (which ensures the
lubrication and cooling of sliding rings) has an important influence upon the friction regime. The wear is very small, and the influence of materials type is practically nil. The friction coefficient has small values, 005,0≤μ .
For heavy operating conditions (high pressures, temperatures and sliding speeds), it is recommended to use hydrodynamic, hydrostatic or thermo-hydrodynamic type of sealing. These types have sliding rings of elliptic shape or eccentric rings with radial or elliptical grooves. The use of this type of seals presents the advantage of friction coefficient decrease when sealing pressure increases.
Figure 1 presents a comparison between two values of friction coefficientμ , for sliding rings with or without radial grooves.
Fig. 1. Comparative test between a mechanical sealing with sliding rings with or
without hydro-dynamic radial grooves; Dw=100mm;k=1;metal carbide/coal; water;va=1.25m/s[4].

JOURNAL OF MARINE TECHNOLOGY AND ENVIRONMENT
53
From Fig. 1 it results that the friction coefficient ( μ ) for the sliding rings without grooves is constant up to a sealing pressure pa=35 bar, after this point, μ becomes unstable, based on the partially dry friction, caused by lubricant film vaporization. On the other hand, for the sealing with radial grooves on the sliding rings, the friction coefficient continuously decreases, when the sealing pressure increases.
For the mixed friction regime, the dynamic viscosity of the auxiliary fluid has some influence, but the anti-friction properties of the sliding ring materials are manifested. The small wear is produced and friction coefficient is 03,0005,0 ÷=μ . The presence of radial or elliptical shape grooves on the sliding ring surface produce a lubricating field.
Fig. 2 presents the valves of friction coefficient ( μ ) for different values of “c/b” rate, of the grooves, on the sliding rings surface, as a function of sealing pressure: c- is the height of the groove; b- is the width of the ring.
Fig .2. The influence of c/b ratio on the friction coefficient, number of nuts =4; electro
graphite/ quenched steel; oil SAE;va=4.2m/s[7].
If c/b=0, there is a limit friction up to sealing pressure p= 50 bar. If the sealing pressure increases, the friction coefficient μ has un unstable behavior,
having high values for partially dry friction. If c/b 0 the value of friction coefficient ≠ μ decreases with the increase of sealing
pressure. • For limit friction regime the dynamic viscosity of auxiliary liquid has no influence upon
the friction behavior. This behavior is determined only by the ring’s material selection and the type of lubricating –cooling fluid. The friction coefficient is 15,003,0 ÷=μ .
Figures 3, 4 and 5 present the friction curves for water, diesel motor fuel and Mobil Artic oil, as function of axial pressure (pa), for some combinations of rings materials, for a sliding speed of . smva /5=
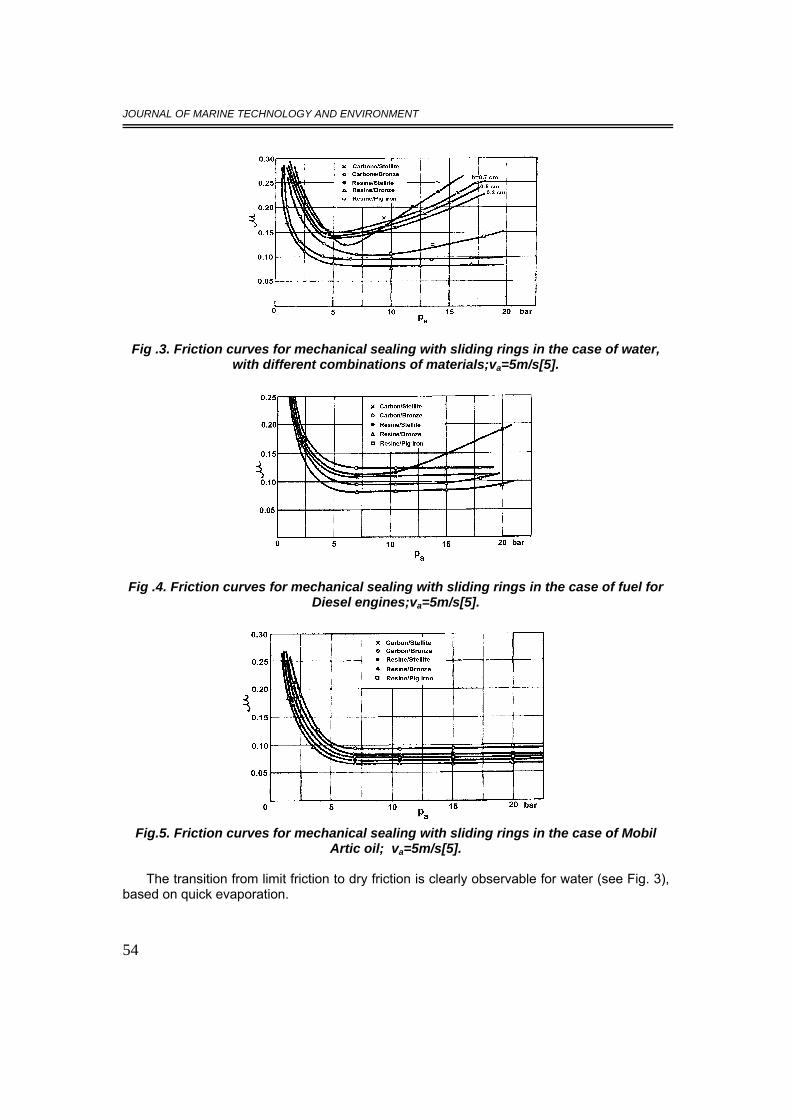
JOURNAL OF MARINE TECHNOLOGY AND ENVIRONMENT
54
Fig .3. Friction curves for mechanical sealing with sliding rings in the case of water, with different combinations of materials;va=5m/s[5].
Fig .4. Friction curves for mechanical sealing with sliding rings in the case of fuel for Diesel engines;va=5m/s[5].
Fig.5. Friction curves for mechanical sealing with sliding rings in the case of Mobil
Artic oil; va=5m/s[5]. The transition from limit friction to dry friction is clearly observable for water (see Fig. 3),
based on quick evaporation.

JOURNAL OF MARINE TECHNOLOGY AND ENVIRONMENT
55
For the Diesel fuel oil (see Fig. 4) the minimum value of friction coefficient corresponds to pa=6.5 bar for all rings materials combinations, except the sliding rings of synthetic resin. In this case, the increase of pa produces an increase of μ . The friction curves for Mobil Artic oil (see Fig. 5) shows that the critical temperature for the oil vaporization was not reached.
• The influence of dry friction regime is important especially in the damage case. The selection of sliding rings material is the main subject for this case. The wear depends on loading and the type of materials. The couple of two rings present the tendency to welding. Friction coefficient is 8,015,0 ÷=μ .
The dry friction sometimes leads to a degradation of sliding rings if the material couple does not have the appropriate properties for work-running in the damage conditions.
Carbon/metal combination has 3,01,0 ÷=μ and plastic/metal combination has μ =0,5. For plastics, we find the increase of friction coefficient when contact axial pressure and slipping speed increases, but for synthetic carbon rings, the friction coefficient increase as friction of the same parameters.
Plastics are not appropriate materials for dry running conditions (damage conditions) because they have a low conductivity and do not allow heat removal from sealing slot. For damage running conditions, we recommend, for the sliding rings carbon and graphite, with or without metallic oxides impregnation. 2.2. The influence of sliding rings temperature: The temperature of sliding rings is directly related to heat, produced by the active
surface friction of these rings and the friction between seal’s components and auxiliary fluid or sealing fluid.
Because of temperature increasing, the lubricating – cooling film is partially evaporated and as a consequence, an important wear an thermal deformation of sliding ring scar faces is produced. Also, the working temperature of the sliding rings can be overcame, producing some degradation forms, as welding, thermal cracking and other forms of failure.
For some materials combinations, in Table. No. 1 the allowable temperatures are presented:
Table 1[4] No. Material combinations T(C0) 1. Stellite layer 700 2. Stellite layer 520 3. Chrome carbide 547 4. Chrome carbide/ tools
steel 382
5. Hard chrome/ tools steel 316 6. Wolfram carbide rings 195
The analysis of these temperatures shows that only materials No. 4,5,6 can be used
because only for these temperatures the lubricant – cooling film does not vaporize. 2.3. The influence of flow regime:
The torque Mh is the result of turbulent flow of the auxiliary fluid and of “washing” fluid, inside the case of the packing.
The value of torque Mh depends on rotating ring speed and the auxiliary liquid flow. This flow depends on the sealing construction, i.e. if the shaft rotates or the casing is rotating
JOURNAL OF MARINE TECHNOLOGY AND ENVIRONMENT
56
The centrifugal force favors the turbulent flow. At low rotating speeds, Mh is negligible. At high rotating speeds and high viscosity of liquid (e.g. for gear oil ), the torque Mh increases and it is possible that Mh>Mf for low pressures. For the refrigerating solutions sealing and for liquefied gases, when is necessary to keep a minimum heat exchange, Mh must be kept to a minimum value. For this, the shaft is rotating and the packing is in stationary position.
Some analysis [4] showed that, beginning at 50 m/s sliding speed, the power loss produced by turbulence can overcome the power loss by friction between ring’s surface. The power loss produced by turbulent flow of water, can determined by (4) relation [4].
(4) 16,3
128,2
1 LDCnCN ⋅⋅⋅⋅= where:
1D - rotating liquid cylinder diameter;
1L - axial length of the rotating liquid cylinder; n - rotating speed;
21 ,CC - constants. From relation (4) it results that the power loss produced by turbulence of “water rings”
(N) increase proportionally with the cube of slipping speed and with fourth grade of rotating liquid cylinder diameter is in direct proportion with axial length of the cylinders.
3. CONCLUSIONS For the decrease of the friction coefficient, we use hydrodynamic, hydrostatic and
thermo-hydrodynamic sealing, having sliding rings of elliptic or eccentric shape or radial and elliptical grooves.
Sliding rings of plastic material are not recommended for high axial pressures and high sliding speeds, because , in the case of dry friction (damage running) they do not allow heat removal.
The amount of heat, produced by friction, has a major influence upon durability and reliability of the sealing. If the sliding ring are better cooled, the packing is more reliable.
The correct selection of material combination for the sliding rings and an appropriate design for packing is extremely important.
For high temperatures it is necessary to provide an additional system of cooling, by increasing the auxiliary liquid circulation.
If the torque Mh has a high value and it is not possible to ensure the additional cooling of auxiliary liquid, it is necessary to reduce the friction heat by the turbulent flow of the auxiliary liquid.
The turbulence is an important factor of power loss. REFERENCES [1]. CRISTEA, V. - Etansari, Editura Tehnica Bucuresti 1973 [2]. GRIGORESCU, L. - Contributii privind cresterea durabilitatii si fiabilitatii etansarilor mecanice axiale cu inele de alunecare în industria petrochimica, Tezǎ de doctorat, Univeristatea Maritima Constanta, 2007 [3]. GRIGORESCU,L, ş.a. - Etansari, Editura Nautica, Constanta,2009 [4]. MAYER,E. - Garnitures mécaniques d’etancheité,Paris Dunond,1977 [5]. MAYER,E. - Belastete axiale Gleitringdichtungen, Düsseldorf,VDI-Verlag GmbH,1977 [6]. MAYER,E. - Der Einsatz neuartiger Glaitringdichtungen in modernen Kraftwerksanlagen 5,Dresden1974,Section 4

JOURNAL OF MARINE TECHNOLOGY AND ENVIRONMENT
57
CONSIDERATIONS ABOUT THE 'GREEN SHIP' CONCEPT - A SOLUTION TO MINIMIZE MARINE POLLUTION
GROSAN NICOLAE
Constanta Maritime Universiy, Romania
About 90% of goods exchanges are performed on maritime way. There is involved a large number of ships such as cargo, tankers, containers, bulkcarriers, passengers’ vessel, which must satisfy the commercial needs. All of these requirement, depends in a great measure of the oil consumption. The Green Ship term refers to the ideal ship regarding the marine pollution control. There are two aspects with common applications regarding Green Ship term: - The first aspect is looking for: the applied measures which are considered for the quality of the fuel, replacement of the classic fuel with high sulphur content, designed values of the naval engines where the burn process is completed, the other kind of fuels for engine propulsion, ballast treatment or zero ballast, recycling of the sewages and for new ship’s hull paints without any TBT. - The second aspect of Green Ship term is looking for the vessel propelled by other methods than classic, named non-conventional procedures or unconventional methods, where the main engine is replaced by electrical motors, solar cells, sails elevated at certain altitude (kite), fixed and mobile sails with solar cells incorporated. Is the Green Ship the ideal concept and ideal ship which can reduce the marine pollution at minimal level in the nearest future?
Keywords: environment, pollution, maritime, green ship
1. INTRODUCTION The maritime activity is one of the main arm of the transport industry with negative
contribution on the natural Earth ecosystem. About 90% of goods exchanges are performed on maritime way. There are involved a
great number of ships as cargo, tankers, containers, bulk carriers, passengers’ vessel, which must satisfy the commercial needs as comfort, delivered time, transport capacity, cruising speed. All of these requirements, in the great measure, depends the oil consumption.
All of this kind of vessels, having in view that used the oil for propulsion, release a lot of quantities of fired and unfired gases. The maritime transport process generated garbage, residual waste, sewage, rest of cargo. The mixed water with oil from engine’s bilge is not always passed through bilge separator and the value of discharged effluent exceeds the required limits.
The Green Ship expression is make mention of ideal ship, from the point of view of marine pollution control. This name is given to any ship or company involved in marine

JOURNAL OF MARINE TECHNOLOGY AND ENVIRONMENT
58
transport or operation, included the shipyards, which contributed in any ways at pollution reduction and marine environment protection.
There are two aspects with common applications regarding Green Ship term: - The first aspect is looking for: the applied measures which are considered for the
quality of the fuel, replacement of the classic fuel which great sulphur content, design values of the naval engine where the burn process to be complete, the others kind of fuels for engine propulsion, ballast treatment or zero ballast, recycling of the seweages and for new ship’s hull paints without any TBT.
- The second aspect of Green Ship term is looking for the vessel propelled by other methods than classic, named non-conventional procedures or unconventional methods, where the main engine is replaced by electrical motors, solar cells, sails elevated at certain altitude (kite), fixed and mobile sails with solar cells incorporated.
The technical research and investigation regarding the ideal ship for pollution reduction started long time before the Green Ship term. The problems looking for engine with less fuel consumption, with good burning process in firing chamber, supplying the electrical energy from ashore during ship’s stay in port, delivered the residual waters, sewages and garbage to shore facilities, recovering of exhaust gases and using them for making an inert atmosphere or heating the sanitary water, using of bilge separators with automatic stop device in case of overload the value of discharge effluent, the double hull of vessels, special of the tanker ships, was attempts partly successful.
The Green Ship concept is installed and have application on the existing item: the ship which polluted the marine environment and the atmosphere.
2. THE GREEN SHIP ASPECTS a) The first aspect of the Green Ship concept is regarding to the improvements of
existing ship or to the new ship under construction in ship yards. One of the main pollution source from ship is the main engine, more distinct the
propulsion and auxiliary engine. All this engines are consumers of fuel which during the burn process releases the carbon, nitrogen and sulphur oxides: CO, NOx, SOx. The modification carry in of an engine are looking to: construction improvements for total fuel burning, the lubrication biodegradable agents, washing and treatment of exhaust gases before release, recycling of exhaust gases, mixed propulsion mechanical-electrical, reducing of energy consumption, systems for treatment and recycling of grey waters, modification of propulsion engine for using of liquefied gases as main source of fuel.
There is a tight connection between the construction of propulsion engine and the kind of used fuel. The problem is if the new modifications brought to the diesel engine will expand same propulsion power by using some fuels with low sulphur content or which have an ideal combustion composition.
Some existing projects, already in practice in Green Ship projects, make reference to cutting down of CO emissions with 30% and 90% for SOx and NOx emission, in one relative short period having as standard the pollution emission of 2007 year.
The project’s developments inside of Green Ship expect a very good co-operation between the manufacturers, producers of naval engine and ships builders and marine technical development centers.
There are in the world some projects regarding the ideal ship aspect, looking for reduction of pollutant substances as CO, NOx, SOx and also looking for ballast water treatment, using of incinerators with minimal pollution risk, monitoring and management of mixture water-oil from engine bilges, garbage management on board of ship.

JOURNAL OF MARINE TECHNOLOGY AND ENVIRONMENT
59
Such as mentioned above, in Green Ship Project are concerned all companies involved in shipping world: ship’s designers, builders, naval equipment manufacturers, owners, charterers, port authorities, crewing companies, naval fuel producers.
Between them must be a total co-operation for the application of all measures to carry out the Green Ship and each of them must face up some responsibilities:
- the ship’s designers and ship’s builders: reducing of the materials during ship’s construction, reducing of the energy consumption, reducing of the toxic materials used, effective use of execution equipments and installation, restyling of ship’s hull to get more speed and implicit cutting off the fuel consumption, lay out of the still and efficiency propulsion systems.
- the owners, crewing companies and ship’s personnel: a good and efficient management for application of requirements and rules regarding pollution
- naval equipment builders: the projection and achievement of the efficient equipment with less energy consumption and low pollution risk ( boilers, generators, air condition systems, etc.)
- fuel oil producers: fuels with low content of sulphur as international and SECA requirements, fuels from other sources and materials with a low grade of pollutant agents after burning, as biodegradable fuels.
Fig. 1. Pollutant emissions from naval engines b) The second aspect of the Green Ship concept is in relation with the new propulsion
methods but anyway old, through so-called “non-conventional”. The unconventional propulsion methods are considered any others than “classic”
propulsion, in context that “classic“ means using of main engine. The tests regarding ship propulsion by wind and sails or application of solar power accumulated in battery pack, tests done years ago, was abandoned because the measurements for environmental protection wasn’t so exigently. The test was counted adventurous attempts of the technical research, without any economical and practical final execution.
Today, when the environmental protection is a global problem, we turn over and go back at the moment when the non-conventional ships were considered only “ships of the future”.
- ships towed by kite (sail elevated at certain altitude): for the very small vessel is possible only by using the kite for propulsion but for cargo ships is necessary mixed propulsion, kite and engine. Anyway, the consumption of fuel is less so the level of pollution

JOURNAL OF MARINE TECHNOLOGY AND ENVIRONMENT
60
is low. The kite is under computers control and his position is changed for the best incidence wind angle.
- kitenergy generator , able to convert wind energy into electricity on board, together with electric propellers, so that the ship propulsion can be obtained not only directly, through the towing forces exerted by the kite’s cables, but also indirectly, thanks to the action of the propellers. Electricity can be supplied to the propellers by a battery pack, and the batteries can be recharged with the electric energy generated by the kitenergy generator itself.
- ships propelled by solar cells and rigid/mobile sails: the solar energy and wind power are collected by sails. The sails, which are mobile or inflexible, are covered by solar cells.
- electric propulsion of ship: by using the electric motors instead of diesel motors the benefit is great, the level of atmospheric pollution is strong dropped. A great advantage is that the position of the electric motors is wherever, in any place on board, not on the same line with stern tube shaft line.
3. ACTUAL MEASUREMENTS AND PROCEDURES REGARDING POLLUTION REDUCTION FROM NAVAL ENGINES 1. Measurements regarding used fuels In marine transport there are used different kind of fuels: Marine Gas Oil MGO (for
generators, auxiliary motors), Marine Diesel Oil MDO (MGO+HFO), Intermediate Fuel Oil IFO (+ MDO and – MGO), Medium Fuel Oil MFO (+IFO and – MGO), Heavy Fuel Oil HFO (for main propulsion engine).
The graduation of marine fuels is dependent on cinematic viscosity, measure unit Centistoke:
• IFO 380: max viscosity 380 cSt • IFO 180 : max viscosity 180 cSt • LS 380: sulphur content less than 1.5%, max viscosity 380 cSt • LS 180 : suplhur content less than 1.5%, max viscosity 180 cSt • MDO : low viscosity up to 12 cSt • MGO : made from distillate only a) SOx emission reduction: fuels with low sulphur content, dual combustion system (HFO
at sea, LNG near coast), scrubbers and purifiers, fresh water adduction and low pollutant chemicals, gases interception systems (special when the vessel is along side), energy supply from ashore.
b) NOx emission reduction: new systems regarding chamber fuel injection, selective catalytic reduction, disposal of gases after treatment, electronic control of the cam shaft and turbines, control of all valves and improve the combustion process.
c) CO emission reduction: running speed reduction, mixed propulsion systems (solar cells, wind energy, mobile and inflexible sails), energy supply from ashore (“Cold ironing” system), using of hydrogen as fuel.
The present research is looking for alternative solutions to replace the naval fuels as biodegradable fuels, hydrogen, synthetic fuels, natural gases.
- the biodegradable fuels is made from the vegetable as soya, palm, sun flower, rape, recycled cooking oil, tallow.
- the natural gases are bases on methane (CH4), are less pollutant, more weak that the air and riskless regarding combustion. - the hydrogen is not a primary source of energy and is product from fossil fuels or by water electrolytic refining process.

JOURNAL OF MARINE TECHNOLOGY AND ENVIRONMENT
61
2. Methodes regarding engine bilge separator All ships are fitted with engine bilge separator with automatic stop device when the value
of discharged effluent is more than imposed value. The value of less pollutant effluent is considered 15 ppm but there are few condition for discharging over board, as: vessel to be underway, at enough distance from ashore, etc. The bilge separator of last generation have possibilities to realize the value of effluent less than 5ppm
The principle of bilge separator used different procedures: deposition in gravity field, centrifugal field, lamination, plate’s collecting and aeration. The waters from engine bilge are mixed petroleum products with different density (fuel oil, diesel oil, lubs,etc.) from 0.80 to 0.98 t/m³. The sea water density is 1.015 - 1.030 t/m³. The difference between them (oil and sea wqater) is 0.040 – 0.130 t/m³.
This density difference is keystone of engine bilge separator. Deposition in gravity field is the final phase of separation process. Is the physical
process when take place deposition in phases through differenced action of gravity. Segregation in gravity - centrifugal field is the procedure through carry out the grouping,
the congestion of oil particles. He combined action of gravity and centrifugal process, the both components (water and oil) are throw down.
Plates collecting/congestion: the residual particles acceded to the plane or conical plates. At contact with the plates surface the particles are congested.
Aerating is the process of forced gravity separation. The oil particles acceded to the air bubbles which increased buoyancy. The bilge separators which used this process, had the air sprayer which facilitate the connection between the oil particles and air bubbles.
3. Oil filters On the line of engine installations there are different types of filters, according with
sensitivity of filtration. The filters are classified based by automation grade of cleaning operation as follows: - manual filters: the filtering element is manually removed, cleaned and replaced or exchanged, - self clearing filters: the filters remain in position, without to take out for cleaning, - automatic filters: the filters is alternate- self cleaning or continue self cleaning type, Based the type of filtered element, the filters are: - area filters: most used in naval sector; - volume filters: used by diesel oil small capacity engine. There are two system of filtration: - complete: all fuel quantity is passed through filtering system than to engine - by pass: part of fuel/oil is going to filters and part is remit to lubrication system (if it
is oil filters) or to precombustion tank. The centrifugal filters, most used on „by pass” system, have an rotor with high speed
revolutions. Because of centrifugal force, the mass of liquid is pushed to extremities and the foregin bodies are restrained on rotor. The cleaned liquid is sent to the tank or direct in system and the foreign bodies from rotor are automatically removed. The advantage of this kind of filter is that not necessary to be replaced and not block up.
4. Methodes regarding desing/building - double hull ship The building of double hull vessel was a necessity, special for the tankers. The double
hull means the out hull (classic hull) and another one, inside of the first hull with same configuration and structure. The scope of double hull is to protect the cargo holds in case of collision or hull plate’s cracks. The double hull is more efficiently than double bottom

JOURNAL OF MARINE TECHNOLOGY AND ENVIRONMENT
62
because is covered all ship’s body while double bottom protected only the lower part of ship’s hull.
An inconvenience of double hull is that the ship’s stability can be affected by metacentric height reduction (high gravity center).
As arrise that a good solution, the double hull ship can created some problems, having in view the complexity of design and structure, in cas eyhe operation and maintenence aren’t at high standards.
The following condition must be kept to gain of double hull protection: - maintenences of the ship at high standards, general maintenence abd special the
space between the hulls - ship’s operations only by specialised personel - design and construction only under supervision of classification society 4. THE UNCONVENTIONAL METHODS FOR SHIP’S PROPULSION Improperly named „non-conventional”, these methodes aren’t used the propulsion force
of main engine or are utilized in combination with main engine. Part of these methods was a navigational base in the past (example sail navigation). Looking for new ways of propulsion, towards to reduce the marine water and air pollution, this kind of methods is considered „unpollutant”.
There are some advantages and inconveniences regarding nonconventional propeler ways:
- from strict point of view of pollution: no any pollution; - from economical point of view: if the terms „ pollution reduction” is not assumed,
the owners don’t like to lost of the speed, loading capacity or any other delay during operation.
a) Sail raised at certain altitude ( „Kite” principle) Propulsion used the sail raised at certain altitude is based on the kite principle, used
succesful in sport and recreation areas. The small vessels as yachts, fishing boats used this methode for increase the speed, in
connection with classic sail or propulsion engine which isn’t working at full capacity. Using of the kite situated to fore part of ship, isn’t concern the posibilities of cargo holds
operation because the kite is raised from the telescopic mast placed foreward, so aren’t the classic masts fixed on main deck. The methods have application on existing ships and the costs are at minimal rate relative with fuel price.
The kite is raised at variable altitudes, between 150-500 meters from sea level, where the wind speed is about 50% more. Acting of high of raising and wind speed is selected the shape of kite such as the propulsion effect to be at maximum value.
The kite area is possible to be between 150 – 500 m2 or more and the power, based on kite area, is possible to be equivalent of 5000 KW engine power.
The necessary time for kite launching is 10-20 minutes and the launching and recovery maneuver is easy.
b) Fixed/mobile sails covered by solar cells New energy sources as solar, wind, wave energy means total antipollution sources. The research beginning from the fact that the small vessel can use successful the non-
conventional sources and is looking for new solutions to be extended at cargo vessel. The new concept regarding ship’s design is based on: - using of solar, wind, wave energy and combustion cells;

JOURNAL OF MARINE TECHNOLOGY AND ENVIRONMENT
63
- improvement of transport capacity and reduction of energy consumption of each transport unit;
- exclusion of ballast water transport. The atmospheric pollution sources are removed by use of the new energy sources as
stated above in connection with hydrogen combustion batteries. The materials used are more light that classic steel. The aluminum and composite
thermoplastic materials give up few advantages, as: easy maintenance, less weight, endurance, recycling.
The energy from non-conventional sources is altered on board of ship as propulsion energy.
- Solar energy: photovoltaic panels fixed on rigid/mobile sails on main deck of ship. When not in use, the sails are swing out and had possibilities to be turn on dependent on sun position. The solar energy can be use instant or store up.
- Wind energy: use direct for propulsion by sails fixed on deck, the sails are made from composite materials, are rigid on vertical axe and had possibility to trim to best favorable position of wind.
- Wave energy: the energy of waves is transformed in any others energy type by combined relative motion of waves, ship and fins (“Orcelle”project). The fins also had propulsion function, operated by waves energy, electrical or mechanical energy from board sources.
- Combustion batteries: about 50% of used energy is from combustion batteries which operate using principle of combination between oxygen and hydrogen. The generated energy is for propulsion system, fins and others consumers as fresh water generator, heating system, etc.
The propulsion methods by using the fixed/mobile sails or solar panels are various, with different forms or disposal places but the running principles are same, based on alteration of external energy from sun and wind to electric energy for propulsion of engine, steering systems and others electric equipments.
From pollution reduction of marine environment point of view, this system is considered from zero degree class, more accurate in Green Ship class.
c) Electric motors Electric propulsion system, in the most of the cases, used the electric motors. At classic
ships, the propeller is direct operated by diesel engine using the fuel. For electric propulsion, the current generators transmit the power direct to the propeller, in absence of naval engine. All electric necessities from on board are covered.
The block diagram of the electric propulsion is defined as follows: - Diesel motor or natural gas motor - Timming sincro generators - Power transformers - Frequency converters - synchronous motor (inductive) - Propulsion system (“azipod”type) - Others consumers (pumps, winches, illumination, etc.) The Diesel electric propulsion system have the following advantages: - fuel consumption reduction and easy maintenence - reduction of space system disposal - low noises and swingings - location of electric motors anyplace on board, connection with propeller shaft by
cables not by axle in line

JOURNAL OF MARINE TECHNOLOGY AND ENVIRONMENT
64
- pollutant gases are reduced because the combustion take place only in generators and not also in main engine.
Because is not used enymore the classic propulsion system, integrate propeller and rudder, the propulsion system „azipod”type is an advantage and the design of the ship’s hull, special in the aft part, is modified, enlarge the cargo capacity of ship.
Having in view that the pollutant emmisions are more depressed, the ships propelled by Diesel electric motors are part of Green Ship concept. The constant speed of Diesel electric propelled ships generated low pollutant gases of NOx, SOx and CO that the Diesel engine with variable speed.
The level of noises and oscillation are depressed, the engine area also is reduced that means more location for passengers or cargo.
5. CONCLUSIONS The environment protection becomes more important in the last period of time. The
shipping industry and maritime transport are ones of most pollutant sector in the present. In the same time is almost impossible to concept the world commerce without maritime transport. Been considered to be the cheapest way of transport, the maritime transport have it own disadvantages, one of them being the pollution.
To satisfy the actual and prognosed future trend in shipping will be necessary to develop new, innovative and less pollutant technology for ship propulssion. There are few steps in this way, some shipping companies starts to develop and apply alternative and hybrid propulsion systems, like solar energy, wind energy, or electric engines. All these concepts are at a very beginning period and will be necessary some times untill will be the major ship propulsions.
The Green World concept include the Green Ship concept. To realize this concept will be necessary more than new propulsion systems, will be necessary a new design for ships and their destination. Less pollutant can mean less cargo capacity, but will be a cost for a good cause, a more healty and friendly environment.
REFERENCES [1]. Houska B. – Optimal control of Towing Kites , Optimization in Engineering [2]. Radan D. – Power Electronic Convertors for Ship, Part of the NTNU project “All Electric Ship” [3]. Lloyd’s Register Fairplay, July 2009 [4]. Reduction of risks from ship kites through attention zones, “The Motorship” Magazine, 2008

JOURNAL OF MARINE TECHNOLOGY AND ENVIRONMENT
65
ANALYSIS OF BLACK SEA POLLUTION – RISKS, CONSEQUENCES AND MEASURES
MIHAILOVICI CRISTINA-STELIANA
Department Ciencia I Enginyeria Nautiques University, Universitat Politecnica
Catalunya, Spania
Many tanker accidents produced in the Black sea caused oil pollution, while coastal industries continue to discharge waste products directly, with little or no treatment. This in correlation with huge industrial activity in the area, shipping and offshore oil exploration created critical environmental state, and all aesthetic beauty has disappeared from this area, making place for the ugly site of tremendous pollution. Black Sea pollution has increased in recent years because of heavy rains, which led to the transportation of large quantities of silt, and because of the overflow in the Danube of chemicals (pesticides and fertilizers) used in Germany and Austria. Meanwhile, the abandoned vessels along the Danube and Black Sea coast are a permanent source of pollution with heavy metals. This paper aims to show the role of the EMSA Agency which is able to provide pollution response and operational and technical assistance, but especially the responsibility of all who work in the maritime field: companies, people, associations and governments.
Keywords: pollution, risks, accidents, oil sticks, EMSA, resources, CoMSBlack, EMCIP, CLEANSEANET
1. INTRODUCTION The Black Sea is widely recognized as one of the regional seas most damaged by
human activity. Almost one third of the entire land area of continental Europe drains into this sea. It is an area, which includes major parts of seventeen countries, thirteen capital cities and some 160 million persons. The major European rivers, the Danube, Dnieper and Don, discharge into this sea while its only connection to the world's oceans is the narrow Bosphorus Strait.
The Turkish Straits represent the main seaway connecting the Black Sea with the Agean Sea and Mediterranean Sea.
In addition to approximately 50 000 vessel transits through the Strait each year, there is a high level of local traffic engaged in trade across the Strait, and along the south coast of the Black Sea–more oil transport. The Strait is characterized by a narrow navigation channel with strong local currents. These conditions pose significant challenges to navigation. The margins of error are slim and the failure of any component of the onboard navigation or propulsion systems can quickly lead to potentially catastrophic results.

JOURNAL OF MARINE TECHNOLOGY AND ENVIRONMENT
66
(Source: http://earthobservatory.nasa.gov)
The Black Sea is very sensitive to any type of pollution be it from routine discharge
during normal vessel operations or accidental pollution from mishaps involving ships, particularly oil tankers.
In a period of only three decades (1960's-1980's), the Black Sea has suffered the catastrophic degradation of a major part of its natural resources. Particularly acute problems have arisen as a result of pollution, a catastrophic decline in commercial fish stocks, a severe decrease in tourism and an uncoordinated approach towards coastal zone management.
Mismanagement, degradation and possible destruction of marine and coastal ecosystems within the Black Sea represent a serious risk to the economic, social and environmental well-being of the region. Increasing human activities in coastal and marine areas and a lack of commitment to intergovernmental, multi-sectorial approaches to marine and coastal management suggest that the situation could worsen with time.
2. RISKS AND POLLUTION The Black Sea is: ¨a sea area known for its fragile marine environment, and it plays a
vital role in enabling waterborne trade across Central Europe and beyond, linking to the Danube river, major oil ports and high-density marine traffic chokepoints such as the Bosphorus and Kerch Strait. The Black Sea is surrounded by countries that either export oil or facilitate the transit of oil, and so a risk of a major oil spill exists, most recently illustrated by a major oil pollution incident in the Kerch Strait in November 2007.¨2
Traditional shipping and oil transportation routes are more exposed to the impacts of oil-polluted discharges from tankers and other vessels than other areas.
A number of dramatic events show the vulnerability of making optimistic prognosis about decreasing oil pollution at the regional and global levels.
Oil pollution is reflected so very badly upon the polluter, who may be caught up in all sorts of criminal sanctions, whether the pollution was an accident or not. The pressure is very much on the shipping industry to play its part. Currently levels of oil pollution are not high in the open Black Sea but are unacceptable in many coastal areas and river mouths. Oil enters the environment as a result of accidental and operational discharges from vessels, as well as through land based sources. According to Black Sea scientists, every year about 30,000 tons of oil enters the sea from domestic sewage plants, 15,500 tons from industry and 53,000 tons flows down the Danube River.

JOURNAL OF MARINE TECHNOLOGY AND ENVIRONMENT
67
The total annual discharge, some 98,500 tons, represents wastage of nearly 15 million dollars at current world prices to which should be added the environmental damage. Oil spillsfrom accidents at sea (averaging 110 tons/year) are relatively small compared with the sources identified above.
The threat of a major oil spill is always present and increasing however, as a result of
increased tanker traffic requiring the construction of new oil terminals. It would have disastrous impacts on sensitive marine and coastal areas.
Another problem is the discharge of insufficiently treated sewage, which results in the
presence of microbiological contaminants. Such discharges constitute a threat to public health and in some cases pose a barrier to the development of sustainable tourism and aquaculture. Some Black Sea countries are trying to improve waste treatment but many of the existing treatment plants are not working properly.
The Black Sea is full of other pollutants such as toxic metals and agrochemicals. Heavy
metals, such as cadmium, copper, chromium and lead, are usually associated with waste from heavy industry and the ash remaining from burning coal for generating electricity. Pesticides are mostly introduced through rivers and streams discharging from agriculture. However, as a result of economic decline the use of these substances has decreased considerably and no longer presents a major hazard in the sea, except where there use was very intensive in the past.
These different chemicals have caused an overproduction of phytoplankton, which block
light from reaching the sea grasses and algae, thus making a huge damage to marine life. 3. ORGANIZATIONS AND POLLUTION-FIGHTING MEASURES
To enable the most effective response to a marine pollution incident, states must identify
their priorities and establish a detailed response plan before incidents occur. The Black Sea Commission fights against the pollution in itself through a series of
measures instruments and processes. One of them is the Convention on the Protection of the Black Sea against Pollution
which was signed in Bucharest in April 1992, and ratified by all six legislative assemblies of the Black Sea countries in the beginning of 1994. This convention has three specific Protocols: the control of land-based sources of pollution, dumping of waste and joint action in the case of accidents.
The European Maritime Safety Agency (EMSA) has an important role in the process to
develop and implement collaborative projects within and outside EU Member States. The Agency is working with Member States and the European Commission to develop a
common methodology for investigating maritime accidents. It also facilitates co-operation and, where appropriate, provides support to Member States in activities concerning investigations related to serious maritime accidents. In addition, it provides technical support to the European Commission in proposing legislation relating to maritime accident investigation and is creating an EU maritime accident database.

JOURNAL OF MARINE TECHNOLOGY AND ENVIRONMENT
68
This database will become a core element of the European Marine Casualty Information Platform (EMCIP) provided by EMSA. EMCIP shall serve as a central tool for the exchange of information and the processing of data related to marine accidents and incidents. It will contain data obtained by the public investigation authorities of the Member States and, for the first time in Europe, marine accident data will be collected, grouped and analyzed under a common taxonomy. This will allow the Member States, EMSA and the European Commission to gain an overview of the current situation with respect to accidents and incidents and to identify trends and risks on the basis of objective, reliable and comparable information.
EMSA regularly reports on the structure of investigation arrangements around Europe
and maintains a list of initial points of contact for marine accident investigation in each Member State. Investigation reports from Member State investigation authorities are sent to EMSA for registering and analysis in order to identify issues of common European interest.
Accordingly, EMSA has developed the CLEANSEANET service, a satellite based
monitoring system for marine oil spill detection and surveillance in European waters. The service provides a range of detailed information including oil spill alerts to Member States, rapid delivery of available satellite images and oil slick position.
The service aims to strengthen operational pollution response for accidental and deliberate discharges from ships and assist Coastal States to locate and identify polluters in areas under their jurisdiction.
The EMSA CLEANSEANET satellite service offers all EU Coastal Member States,
Iceland and Norway (hereafter referred to as Coastal States) a near real time (NRT) marine oil spill detection service by using radar satellite imagery acquired by the Envisat and Radarsat SAR satellites. The service is free of charge to all Coastal States and it covers all European sea areas.
The analyzed satellite imagery is available to the relevant Coastal State operational
contact points within 30 minutes after satellite overpass. In the case of a detected oil slick, an alert message is delivered to the operational contact point. The alert message can be transmitted via a phone call, an e-mail, a telefax or an SMS, depending on which alert means the Coastal State has defined.
Each Coastal State has access to the CLEANSEANET service through the dedicated
CSN Browser. This web map interface tool allows the viewing of all low resolution images, together with oil spill detection analysis results, wind information and other additional information. The CSN browser also includes a list of the ordered satellite scenes. High resolution images are delivered by EMSA.
The satellite images are downloaded using antennae in Norway, Italy and Portugal. The
data is processed and analyzed to detect possible oil slicks. An alert report is produced for every planned image to inform the Coastal States on the results of the analysis, i.e. whether possible oil slicks are detected or not. In case slicks are detected, the affected Coastal State immediately receives an alert to enable the Coastal State to take quick actions in order to verify and quantify the slick and to identify the potential source. The complete process, from satellite overpass to the alert, takes a maximum of 30 minutes.
In the case of a major oil spill disaster in European seas and adjacent waters, EMSA,
through the CleanSeaNet service, is co-operating with the International Charter (Space and

JOURNAL OF MARINE TECHNOLOGY AND ENVIRONMENT
69
Major Disasters) for the rapid access to satellite imagery and information products over the areas affected by or at risk of serious pollution.
This cooperation, in recognition of EMSA’s operational role and competency in the
provision of satellite imagery for marine oil spill monitoring and detection in Europe, will ensure the fast and efficient delivery to EMSA of all relevant satellite images and information products made available through the framework of the Charter. In the case of a major oil spill disaster in European seas or adjacent waters, EMSA will act as a co-ordination point, using in-house expertise and contractual arrangements with satellite operators and service providers to rapidly download information to ground stations in Europe and to further process and analyze the data.
The Cooperative Marine Science Programe for the Black Sea (CoMSBlack) was formed
in 1991 as a non-governmental organization to help coordinate the marine science and monitoring efforts in the Black Sea. CoMSBlack will serve as an advisory body to the national, multinational, and international governments and agencies that have an interest in the Black Sea environmental status. The programe includes all the Black Sea riparian countries, and will operate through a Steering Committee in which two institutes of the United States also are represented. The role of this programe will be to provide the highest quality of integrated and co-ordinated scientific studies and results, as well as appropriate monitoring programes, to assure that the management and policy decisions are based on the best possible science.
4. CONCLUSIONS
Plans and projects are required both for search and rescue and for marine pollution in the Black sea. Industry, governments and scientists need to collaborate in this respect.
The fact that accidental pollution from ships is reducing year by year, when there are more ships at sea carrying very much more oil, says something for the achievement of this intention.
The industry is both better and preventing oil spills, and better organised at minimising its effects. The tanker sector is in the process of investing more than USD 140 billion in new, technically advanced double-hulled tankers, while the number of tankers involved in accidents continues to reduce year on year. But all ships carry some oil aboard and efforts are made to ensure that accidents do not happen. New designs of containerships have been configured so that fuel oil tanks are kept well away from the ship’s side and bottom, so that a low impact accident will not release oil into the sea.
A number of measures of a more technical nature are available to Black sea states for the purpose of protecting biodiversity from maritime traffic.
There is still more to do. Design of oily water separation equipment is progressing fast, as are concepts which are aimed at making ships entirely “self-contained”, hugely reducing the risks of any accidental spill when oil or oily wastes are being handled aboard ship. Good shipping participates in environmental audits to ensure that its precautions against pollution are up to speed. Training has a major role to play in this, not least for the technical aspects of safe and pollution-free ship operation.
Statistical evidence shows that all these initiatives are having an effect on the reduction of pollution. But statistics, while useful evidence, are secondary to the reality of clean beaches and good water quality in the marine environment.

JOURNAL OF MARINE TECHNOLOGY AND ENVIRONMENT
70
REFERENCES [1] EMSA Report 2009: http://www.emsa.europa.eu[2] CLEANSEANET: http://cleanseanet.emsa.europa.eu[3] Black Sea Web Project Web Site. Strategic Action Plan for the Rehabilitation and Protection of the Black Sea: http://www.blackseaweb.net [4] Bonnemains, Jacky. "Peche aux fut toxiques dans la mer Noire" Liberation (April 17, 1990)[5] NASA Earth Observatory: http://earthobservatory.nasa.gov [6] The Black Sea Non-Governmental Organization Network (BSNN) Web Site. Commitment to the Black Sea: http://bseanetwork.org/Black_sea.htm [7] GEF, 1997. Black Sea Transboundary Diagnostic Analysis. UNEP, New York, 142 pages. ISBN: 9211260752[8] Black Sea Environmental Internet Node Web Site. United Nations Environment Programe DEWA/GRID-Europe: http://www.grid.unep.ch

JOURNAL OF MARINE TECHNOLOGY AND ENVIRONMENT
71
AN ASPECT OF MAINTAINING R-22 SYSTEMS IN REFRIGERATED TRANSPORTATION. THE SELECTION OF R404A
MEMET FEIZA
Constanta Maritime University, Romania
Refrigerated transport is essential for our society due to the need to preserve and protect food, drugs or medical supplies during transportation, to the benefit of the people worldwide. Since many HCFCs are powerful greenhouse gases, the replacement of these refrigerants in refrigerated transportation asks efforts done to select the correct refrigerant for this application. In this respect, this paper deals with challenges and solution for this issue. The classical criteria to be considered when choosing a refrigerant are: thermophysical properties, technological, economic, safety and environmental aspects. It is seen as a solution for the replacement of HCFC22 (R22), the refrigerant belonging to the HFC family, R404A. R404A is a chlorine free chemical. It permits the maintenance of the existing R22 equipment, this being an economic advantage, especially in time of crisis. It is made a thermo – energetical comparison between R22 and R404A, resulting that R404 is suitable for refrigerated transport.
Keywords: refrigerated transport, retrofitting, refrigerant.
1. INTRODUCTION Perishable goods like vegetables, fruits, meat or fish are at risk of suffering damage
during their transportation, cooling being essential to avoid deterioration and market loss. Refrigerated transport, which is designed to carry perishable freight at specific temperatures, is an important activity in the European Union, having in view that this part of the word is known as the second exporter and the first importer of fruit and vegetables. An important aspect is the preference of the European consumer for out of season products, leading to an intensification of long distance transportation of perishables.
Worldwide are approximately 1 million refrigerated road vehicles and about 500.000 container units, road, rail, air or water transport (shipping or river transport) being means of perishable transportation [Garcia, 2008].
Since the mid of 80’s, this sector registered a transition from using ozone depleting chemicals, like CFCs, to less or non ozone depleting refrigerants like HCFCs and HFCs. Other ozone friendly refrigerants like ammonia, hydrocarbons and carbon dioxide are met in fewer applications.

JOURNAL OF MARINE TECHNOLOGY AND ENVIRONMENT
72
2. TRENDS FOR NEW REFRIGERATION TECHNOLOGY A sector that indicates a high potential for technological innovation is the refrigerated
transport, since in many cases, currently are in use refrigerants belonging to the HCFC family like: HCFC 22 (or R22), R401A, R401B, R409A. The main innovative trend in this respect is the HCFC phase out.
International regulations ask the acceleration of the HCFCs phase – out, since 2007. These refrigerants are gases with low ozone depletion potential, which were introduced on the market as transitional replacements for CFCs. Developing countries should freeze the HCFC production and consumption at their 2009 – 2010 level by 2013, and phase – out these compounds by 2030. It is permitted a percent of 2, 5 for existing equipments, till 2040. Regarding developed countries, their phase out schedule suffered also an acceleration of 10 years to completely eliminate HCFC production and consumption by 2020, the allowed percent for existing equipments being of 0,5.
The accelerated phase – out of HCFCs facilitates the adoption of ozone and climate friendly technologies, which are close related to:
- the replacement of HCFCs with non or low GWP refrigerants, - the improvement of the energy efficiency of the equipment, - the design improvement of the old system and insulating foam, - integrated strategies and management plans. More frequently are discussed the existing R22 transport refrigerating systems because
this HCFC is more present in transport application, but we should not forget that all HCFC’s and blends containing HCFC’s follow the same legislation, and they must be treated in the same way.
The alternatives for R22, chosen depending on the type of the system are: - NH3 – a refrigerant suitable for large plants, but a special attention is paid to its
toxicity, being needed special additional safety requirements; - CO2 and dry ice – are able to maintain the cold chain during the entire distribution
chain, from production to the end used; involved in airline catering allows the maintenance of a constant low temperature for a long time, without resulting any residues;
- HCFs – are the best alternative for the systems in which NH3 is not suitable; these refrigerants offer the best solution for accomplish the requirements of the refrigerating transportation due to their availability on the market, energy efficiency, low toxicity, cost, safety, etc.
3. THE ENVIRONMENTAL CHALLENGE
3.1. OZONE DEPLETION The use of CFC and HCFC refrigerants is directly connected to the destruction of
stratospheric ozone. Worldwide regulation aiming the phase-out of the production and consumption of these compounds led to the initiation of solving the ozone depletion challenge, even if the negative effect of the release to the atmosphere of stable, chlorine containing compounds will be part of our existence for some time.
The role of the ozone layer is to protect the Earth against ultra – violet radiation, element essential for life, but deadly in overdose. The high level of the international concern related to this issue determined the initiation of a major agreement: the Montreal Protocol. According

JOURNAL OF MARINE TECHNOLOGY AND ENVIRONMENT
73
its directions, the manufacture, sale and use of chlorinated refrigerants are scheduled for phased out.
Table 1 give values of the effect on the ozone layer of some refrigerants, measured by ODP (Ozone Depletion Potential), for the refrigerants most encountered in the refrigerated transportation.
Table 1: The impact of some refrigerants on the ozone layer Family of refrigerants Main refrigerants ODP
CFCs CFC 11 CFC 12
1 1
HCFCs HCFC 22 0,05 HFCs HFC 134a
HFC 404A HFC 407C HFC 410A
0
Natural refrigerants R717 (ammonia) R744 (carbon dioxide)
Hydrocarbons 0
3.2. GLOBAL WARMING
It is a reality of our existence that the Earth is warming at an unprecedented level
because of carbon dioxide emissions resulted from human activities. The consequences of the global warming are alarming: the melting of the polar ice caps, an importing rising of sea level, extreme weather phenomena, erosion, desertification, disappearance of many species. Refrigerated transport and refrigeration itself, have their contribution, measured by Global Warming Potential (GWP), coming from the direct release of refrigerants having high GWP, and from the release of carbon dioxide resulted from the fuel combustion needed to produce power to drive refrigerating and air conditioning equipments.
Direct release of refrigerants represents about 2% of total equivalent carbon dioxide release, while the refrigerating and air conditioning industry is responsible of about 20% of the registered global warming.
The global warming challenge is expressed by the following desideratum: - the minimization of the demand for mechanical cooling, - the efficiency improvement in order to diminish the power consumption, - the leakage diminishing, - the development of new refrigerants offering high efficiency and low global warming
potential. In table 2 is seen the effect of the global warming of some refrigerants often met in the
refrigerated transportation. Table 2
Family of refrigerants Main refrigerants GWP CFCs CFC 11
CFC 12 7750 10890
HCFCs HCFC 22 1810 HFCs HFC 134a
HFC 404A HFC 410A
1430 3900 2100
Natural refrigerants R717 (ammonia) R744 (carbon dioxide)
Hydrocarbons
<1 1 20
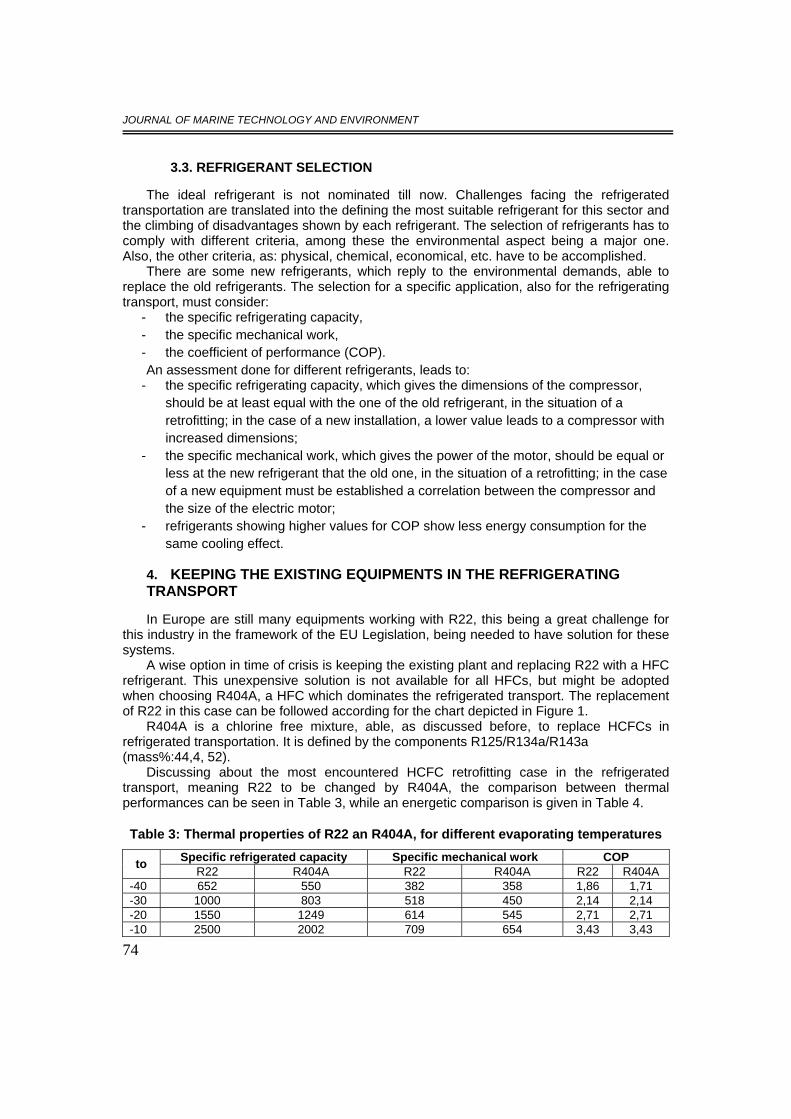
JOURNAL OF MARINE TECHNOLOGY AND ENVIRONMENT
74
3.3. REFRIGERANT SELECTION The ideal refrigerant is not nominated till now. Challenges facing the refrigerated
transportation are translated into the defining the most suitable refrigerant for this sector and the climbing of disadvantages shown by each refrigerant. The selection of refrigerants has to comply with different criteria, among these the environmental aspect being a major one. Also, the other criteria, as: physical, chemical, economical, etc. have to be accomplished.
There are some new refrigerants, which reply to the environmental demands, able to replace the old refrigerants. The selection for a specific application, also for the refrigerating transport, must consider:
- the specific refrigerating capacity, - the specific mechanical work, - the coefficient of performance (COP). An assessment done for different refrigerants, leads to:
- the specific refrigerating capacity, which gives the dimensions of the compressor, should be at least equal with the one of the old refrigerant, in the situation of a retrofitting; in the case of a new installation, a lower value leads to a compressor with increased dimensions;
- the specific mechanical work, which gives the power of the motor, should be equal or less at the new refrigerant that the old one, in the situation of a retrofitting; in the case of a new equipment must be established a correlation between the compressor and the size of the electric motor;
- refrigerants showing higher values for COP show less energy consumption for the same cooling effect.
4. KEEPING THE EXISTING EQUIPMENTS IN THE REFRIGERATING TRANSPORT In Europe are still many equipments working with R22, this being a great challenge for
this industry in the framework of the EU Legislation, being needed to have solution for these systems.
A wise option in time of crisis is keeping the existing plant and replacing R22 with a HFC refrigerant. This unexpensive solution is not available for all HFCs, but might be adopted when choosing R404A, a HFC which dominates the refrigerated transport. The replacement of R22 in this case can be followed according for the chart depicted in Figure 1.
R404A is a chlorine free mixture, able, as discussed before, to replace HCFCs in refrigerated transportation. It is defined by the components R125/R134a/R143a (mass%:44,4, 52).
Discussing about the most encountered HCFC retrofitting case in the refrigerated transport, meaning R22 to be changed by R404A, the comparison between thermal performances can be seen in Table 3, while an energetic comparison is given in Table 4.
Table 3: Thermal properties of R22 an R404A, for different evaporating temperatures Specific refrigerated capacity Specific mechanical work COP to R22 R404A R22 R404A R22 R404A
-40 652 550 382 358 1,86 1,71 -30 1000 803 518 450 2,14 2,14 -20 1550 1249 614 545 2,71 2,71 -10 2500 2002 709 654 3,43 3,43

JOURNAL OF MARINE TECHNOLOGY AND ENVIRONMENT
75
Table 4: Deviation of specific energy consumption – comparison between R22 and R404A
to oC tc oC Deviation, % -10 50 16,2 -20 45 14,2 -30 40 11,3 -40 35 10,6
Fig.1 Chart of the R22 replacement with R404A
5. CONCLUSIONS Refrigerated transport is an important link in the cold chain; its goal being to deliver to
the consumer, wherever he is, safe and high quality perishable good(food products, pharmaceutical products, plants).

JOURNAL OF MARINE TECHNOLOGY AND ENVIRONMENT
76
International regulations determined this sector to face the challenge resulted from the need of replacing hydrochlorofluorocarbons (HCFCs), Ozone Depleting Substances frequently use as refrigerants.
HCFCs currently in use in refrigerated transport are: R22, R404A, R401B, and R409A. This paper discussed specific issues related to the environmental protection. It is wise to replace R22 with R404A due to the possibility of keeping the existing plant. The adoption of R404A is based on an environmental, thermal and energetical analysis.
REFERENCES [1]. Garcia Espinoza J.P., Campagna E. – What to do with R-22 in existing system?, XIII European
Conference Latest Technologies in Refrigeration and Air Conditioning, I – II Session, June, 2009, Milan, Italy
[2]. Garcia L.R. – Development of monitoring applications for refrigerated perishable goods transportation, Ph.D. thesis, 198 pp, Universidad Politecnica de Madrid, 2008, Spain
[3]. Shen J., Liu B. – Status and progress of cold storage chain, Journal of Refrigeration, Vol. 20, No. 130, December, 2009, China
[4]. TEAP 2010 PROGRESS REPORT, 113 pp, May 2010, available at: www.unep.ch/ozone/Assessment_Panels/TEAP/Reports/TEAP_Reports/teap-2010-progress-report volume1-May2010.pdf
[5]. United Nation Industrial Development Organization – Preparing for HCFC phase – out: Fundamentals of uses, alternatives, implications and funding for Article 5 countries, 199pp, 2009, Vienna, Austria

JOURNAL OF MARINE TECHNOLOGY AND ENVIRONMENT
77
COLLABORATIVE LEARNING FOR COMPETENCE DEVELOPMENT
1PRASAD RAJENDRA, 2BALDAUF MICHAEL, 3NAKAZAWA TAKESHI
1,2,3World Maritime University Malmö, Suedia
Notwithstanding the remarkable progress made in the reduction of accidents involving ships, its personnel, shore facilities and the marine environment the accidents of disastrous consequences still occur with loss of valuable life and damage to property. One of the accident causation factors, as identified by safety investigations of accidents and aetiological research, points to the deficiency in the competence of shipboard personnel. Although minimum standards of seafarers’ competence have been specified and internationally agreed through the implementation of International Convention on Standards of Training, Certification and Watch-keeping of Seafarers (STCW), there still exists a wide diversity in the global maritime education and training (MET) standards. While the convention gives some guidelines on the standards of necessary competence and its assessment, it is silent on the actual contents and the method of delivery of curricula. Prevailing methods of MET and its assessment engender conditions that do not promote appreciation of deep learning and comprehension of taught material. This paper looks at various features of collaborative learning methods with a view to examine feasibility of its application to MET and possible advantages driven from its application to enhance competence of seafarers.
Keywords: Maritime Training and Education, Collaborative Learning, STCW, Human Element, Accident causation
1. INTRODUCTION International trade heavily depends on shipping but the public at large, generally
oblivious of the role that shipping transportation plays in its daily life, comes to thinks about shipping only when a major accident is highlighted by the media and in majority of cases accusing shipboard operators for the disastrous consequences. Different researchers have quoted varying figures of accidents caused by human error that occurred in different industries e.g. in a report by Timpe incidents caused by failure of human actions are quoted as 33% in chemical industry, 52% in nuclear, 66% in space exploration, 70% in aviation as well as in maritime traffic and a figure of 90% of all kinds of accidents has been quoted as caused by human failures (Timpe et al, 2002). American Bureau of Shipping, having carried out an analysis of 350 reports of ship accidents gathered from Australian Transportation Safety Bureau, Transportation Safety Board of Canada and Marine Accident Investigation Board of the UK, has concluded that respectively 85%, 84% and 82% of reported accidents were caused by human error (Baker et.al. 2005). It is a common place today to come across statements affirming that 80% of the maritime casualties are directly attributed to human errors (Boisson, 1999) holding operators’ actions or inactions as the prime cause of incidents and accidents. In any socio-technical industrial unit the front line operators are obviously at the centre stage inevitably interacting with technology and the work environment at the

JOURNAL OF MARINE TECHNOLOGY AND ENVIRONMENT
78
human-machine interface. It is through this interaction that the technology, environment and their organizations are put to use to provide affordable products and services. At the same time however the operators, for various reasons, are liable to commit errors that may lead to incidents of varying proportions with their consequences ranging from minor injuries and property damages to catastrophes.
Many definitions of an accident are purported in the industrial safety literature by e.g. (Bird et al 1982); (Senders et.al. 1991); (Mill, 1992); (Reason, 1997); (Sagen, 1999); (Hollnagel, 2004); (Stranks, 2007) etc. to name a few. Commonality of various factors within these definitions of an accident, whether specifically mentioned or not, is that an accident is an unintended, undesirable and unexpected incident of greater severity with its consequences leading to loss of life, major personal injury, damage to property, damage caused to the environment or loss of productivity with high economic repercussions for which there appeared to be no causes prior to its occurrence. Some researchers consider that the inclusion of the term ‘unexpected’ in the definition of an accident is of lesser significance since an operator at times may take some deliberate actions, for whatever legitimate or illegitimate reasons, which may lead to an accident. This refers to an operator’s tendency of taking risks in spite of having conscious knowledge of the prevailing imperfect conditions and/or situations that may lead to an incident or an accident. It could be argued that taking such risks is a reflection of the risk taker’s perception of prevailing situation and his/her confidence that the odds are against an accident happening thus implying that he/she really did not, at the time of taking such action, foresee the consequences that ultimately did occur (Bird et al 1982). Such ability to perceive the outcomes resulting from their actions directly reflects on the knowledge, experience and cognitive competence of the operators. Under normal working conditions the operators can generally manage well by adherence to the prescribed procedures, but due to the uncertainties of dynamic operating conditions they must appropriately modify their actions to find a good balance between the system capabilities and the operational needs (Hollnagel, 2004). Adapting to the changing situations is the hallmark of an operator’s competence. Well trained and experienced seafarers can avoid a disaster by compensating for defects in or damage to their ship or its equipment but no design or equipment can compensate for their erroneous actions or inactions (Morrison, 1997).
2. HUMAN ELEMENT IN ACCIDENT CAUSATION Substantial amount of aetiological research concerning accidents in the aviation,
railways, offshore, refineries, chemical and manufacturing industries has been done to examine the role of human error. The researchers are unanimous in their findings that the errors committed by the front line operators have their genesis in human factors related to technical, organizational, environmental and personnel components of a socio-technical system. Literature on accident causation research is overwhelming in emphasising the role of human element at different levels of management hierarchy in a socio-technical system. Research has affirmed that numerous organisational and personal factors prevalent in the hierarchical echelons of an industrial unit have a contributory role in shaping responses of operators at the human-machine interface, the sharp end, virtually predisposing the operators at the sharp end to commit errors, mistakes or violations of rules and procedures that may lead to accidents (Dekker, 2006). Such conclusions are however based on the presuppositions that operators at the sharp end possess the requisite knowledge, understanding and skills to operate the technical systems as well as to take appropriate actions to suitably control the unsafe situations that may develop during the course of operations. In majority of cases such presuppositions are well founded as evidenced by the

JOURNAL OF MARINE TECHNOLOGY AND ENVIRONMENT
79
performance behaviour of the operators at the sharp end with their actions compensating for the system deficiencies, exhibiting confidence or even resorting to short cuts to take well calculated risks. That however would be a generalisation and there are numerous instances to support the contrary. Background theoretical knowledge is the foundation on which an operator’s professional competence is built.
The paper looks at the role of professional knowledge in safety of operations, reviews the reasons for its prevailing diversity in MET curricula standards, explores the prevailing methods of curricula delivery and the role that collaborative learning methods can play in enhancing learning to support seafarers’ competence.
3. HUMAN FACTORS AT THE SHARP- END – EMPIRICAL STUDIES Competence of seafarers is undoubtedly one of the paramount elements in the
operational safety of ships. It is the basic human factor that is responsible for causing human error as well as for its avoidance. Research has shown that out of 80% of the human errors, commonly stated as being responsible for accidents, 20% are under the control of operators (Bea, 1999). This control essentially relies on operators’ professional knowledge, skills, proficiency, experience, capabilities, aptitude and attitude. A study of investigation reports of maritime accidents, available on the websites of six national authorities, namely the Australian Transportation Safety Bureau (ATSB); Transportation Safety Board Canada (TSB); Danish Maritime Authority (DMA); Marine Accident Investigation Branch UK (MAIB) and the National Transportation Safety Board USA (NTSB) was carried out. Out of a total of 724 reports posted on these websites 113 reports of accidents in the machinery spaces of commercial ships greater than 500 gt and with installed propulsion power in excess of 750 kW, discounting the accidents on fishing vessels, were identified and further analysed. The analysis indicates that deficiencies in generic marine engineering knowledge, seamanship knowledge as well as specific knowledge and training concerning the machinery and engineered systems of the ships involved in accidents are amongst the causation factors in 19.4% of the cases (Prasad et al, 2010). A similar study has also been conducted by Uchida in which he analysed court judgement reports of enquiries into accidents in machinery spaces of merchant ships of similar types and sizes. He has concluded 20.7% of accidents attributed to human error related causes are due to knowledge-based mistakes (Uchida 2004).
These conclusions are further substantiated with the opinions expressed by a number of technical superintendents when personal interviews were held with them. The interviewed superintendents from different ship-owning and ship-operating companies are erstwhile seafarers and are now based ashore. Engaged in technical management of ships they are responsible for monitoring ships’ performance, assessing the technical status of ships, providing resources and shore technical support to the shipboard staff. They are also responsible for investigating accidents on ships operating under their supervision to determine the likely causes and to take remedial actions. In all 25 superintendents were interviewed in the early part of the year 2010. Their work locations are in India, Singapore, Malaysia, UAE, Sweden and Norway with the following regional distribution:
• 12 superintendents working for 6 shipping companies in India; • 6 superintendents working for 3 shipping companies in Singapore; • 4 superintendents working for 4 shipping companies in Sweden; • 1 superintendent each from shipping companies in Malaysia, Norway and the
UAE

JOURNAL OF MARINE TECHNOLOGY AND ENVIRONMENT
80
Opinion of each superintendent was obtained specifically on the probable causes of one breakdown or accident of serious nature that occurred on any ship under his supervision and for which he had the responsibility to investigate. In all 22 of them reported of such instances ranging from fire, flooding, black-out, stoppage of engines, severe damage to machinery/equipment and severe injury in the machinery spaces on board their vessels. The analysis of the 30 most probable causes narrated by then for these accidents revealed that:
• Causes related to the technical factors like design, poor materials, poor quality
of fuel and the age of the vessel were accounted for 36.6 % of the causes for these accidents
• Causes related to the mistakes by the engineering staff, non-following of procedures and personal factors accounted for the remaining 63.4 % of accidents
Further they were also asked to express their opinion on the factors that may be
generally contributing to the machinery malfunctions, incidents and accidents. Based on their opinions expressed by them it is noted that:
• 18 % of the factors are under the control of the shore management • 82 % factors are attributed to the shipboard management
From further analysis it is noticed that out of the 82 % ship board management factors
70 % are relate to the individual factors of the shipboard engineering staff with the following break up:
• 34 % relate to the deficiency of professional knowledge, skills, training and
experience • 36 % relate to negative attitudinal attributes of the engineering staff.
4. INTERNATIONAL CONCERNS REGARDING PROFESSIONAL STANDARDS There are a lot of ongoing international discussions about concerns. These concerns are
mainly profound and seriously and therefore have to be into consideration. Within this chapter some selected aspects of the discussions are summarized and adressed.
a) Professional Competence Competence is a personal trait that has its foundation in a person’s basic knowledge,
comprehensive understanding of related subjects, proficiency in professional tasks and experience in those tasks. This notwithstanding, an operator must also have the willingness to make most appropriate use of his/her knowledge and skills in a manner prescribed by the company management under its operational policies. S/he should be willing to use his/her ingenuity to modify responses demanded by the dynamic operating environments. Thus competence is a complex amalgam of knowledge, understanding, skills, abilities and attitudes. Adequacy of all these attributes is essential to perform the allocated tasks in safe and efficient manner and they are not mutually exclusive. Background knowledge of the constructional features of ship structure, equipment and engineered systems, their operating principles and interrelationship of these systems with the work environment are the most basic human factors on which all other ship operating competences are built. Competence is developed through practice and experience in application of knowledge to reach the requisite

JOURNAL OF MARINE TECHNOLOGY AND ENVIRONMENT
81
level of proficiency. Seafarers, being the operators at the human-machine interface in a socio-technical system need to be well equipped with appropriate cognitive as well as physical dexterity.
b) Efforts for Establishing Minimum Standards of Competence In the aftermath of number of accidents with disastrous consequences the seafarers’
competence has been rightly placed on top of the international agenda for safe, efficient and environment friendly ship operations. Need for adequate knowledge and skills, commensurate with ever-growing shipboard technology, has been aptly emphasized in recent years. International Maritime Organization (IMO), indentifying the need for minimum global standards of competence for seafarers, addressed this issue through its International Convention on Standards of Training Certification and Watch-keeping for Seafarers adopted in 1978 (STCW 78) and to be implemented by the member states through their respective national legislations. Driven by the outcomes of investigations into spate of ship accidents in the late 1980s and early 1990s, which re-emphasised the role of human error as one of the major contributing factors, the maritime community through the IMO responded with a quick revision of the STCW Convention in the year 1995. Modifications in the provisions of this convention were intended to make it more effective by bringing about specificity in the standards of competence and accountability of implementing authorities. The recent amendments adopted in May 2010, based on the ship operational experiences, advancing technology and lacunae due to implementation anomalies further highlights the global concerns on seafarers’ competence standards and training requirements.
c) in Global Standards of MET Country Specific Needs: STCW Convention in its mandatory Code A specifies number of
essential competencies and their standards in terms of knowledge, understanding and proficiency which have been specified at three shipboard management levels tabulated along seven shipboard functions. However these tables fall short of specifying the actual contents and the expected depth of coverage of various study subjects necessary to form a teaching syllabus of the MET curricula. The competency tables can best be seen as intending to provide a yardstick for the final result of MET (Prasad, 2002). Learning objectives within the framework of each specified competence are set on the basis of operational demands of the indigenous shipping fleets and the types of ships there in. These country specific inputs to MET curricula obviously contribute to a wide diversity in the global context. Some shipping companies themselves may be involved in providing inputs to the curricula either through their national maritime administrations or directly conveying their needs to the MET institutions for short term courses for updating knowledge and skills of existing seafarers and/or for long term inputs for education and training of prospective seafarers.
Changing Shipboard Technology: The MET curricula also keep changing overtime in line with the changing shipboard technology, albeit slow in comparison to the rate at which the technology advances. There is always a persistent gap between the static model of curricula standards and the dynamic nature of competence model demanded by rapidly changing shipboard technology. It is evidenced by the high demand for proactive training measures e.g. training in electronic chart display and information system (ECDIS) for navigators and training in automation and control systems for marine engineers as short term measures to bridge this gap till long term measures are implemented by incorporating necessary changes in the MET curricula. Material and human resource constraints are the main detriments for delays in updating the curricula demanded by the growing technology.
Globalisation and Crew Mobility: Cost cutting measures through present pattern of multinational crewing for a large part of the shipping industry is characterised by seafarers

JOURNAL OF MARINE TECHNOLOGY AND ENVIRONMENT
82
serving on ships registered under different flag states than their own. 65% of the world fleet have adopted multinational crewing strategies, with about 10% of the fleet staffed with crew composed of five or more nationalities (Kahvechi et.al.,2002; Lane, 1996). Some sources also indicate as many as 15 or 16 nationalities on a single ship and in case of a large cruise ship there may be as many as 40 nationalities amongst the crew (Short, 2010). Such globalisation has not only introduced a broad social and ethnic diversity it has also resulted in crew with varying and inadequate competence standards on board ship (IMO, 2002). Seafarers educated and trained under different MET systems evidently possess varied level of competence yet they are required to work together in a team. This pattern of shipboard manning has also accentuated the need of additional social skills on part of the seafarers.
5. PROFESSIONAL COMPETENCE OF SEAFARERS This chapter is to introduce and to discuss the three main aspects of the professional
competence. a) Competence Development Acquisition of necessary skills toward a particular profession greatly depends on the
interest and aptitude of an incumbent embarking on that profession. Such interest normally results from the past exposure towards the fascinating features, characteristic information and related social influences during formative years of schooling. MET institutions do not exercise any control on this attitudinal aspect of the prospective incumbents to the seafaring profession especially at the present times when they are finding it hard to fill up the training seats. Even in those places where the applicants seeking admission in MET institutions outnumber the available seats it is only in a few rare cases that this personal attribute of incumbents is given some consideration by putting them through psychometric tests as part of the institutional selection or recruiting process. The attitudinal attributes towards seafaring profession are usually developed during the process of MET. The formative years in the MET process are extremely influential in arousing interest and developing positive attitude towards seafaring profession. The MET institutions have a responsibility to create congenial conditions that facilitate this process. Three essential requirements for acquisition of knowledge, skills and development of right attitudes are:
• Curriculum that offers appropriate subject contents in a suitably organized
manner to arouses interest towards marine profession • Delivery of the curriculum in a manner that is congenial to understanding, deep
learning and helps development of physical and mental dexterity • Assessment methods that assess students’ abilities to perform through
application of learnt material Developing prospective seafarers with requisite competence demands their acquiring
specified knowledge and skills during their academic learning period. It is incumbent on the MET institutions to structure the curricula based on the end result of the MET process specified in the mandatory code of the STCW Convention as a bare minimum. The main thrust of this convention is from the view point of operational safety. Thus the three academic components of MET curricula are:
• Basic academic subjects in the form of fundamental scientific principles to
provide foundation for the technical subjects and supporting humanities • Engineering subjects related to the shipboard technical systems

JOURNAL OF MARINE TECHNOLOGY AND ENVIRONMENT
83
• Procedures for safe and efficient operations and maintenance of shipboard systems
STCW Convention emphasises structured and documented programmes for training and
assessment that needs to be covered by a quality standard system to ensure consistency and reliability. While minimum education and training standards in the form of expected competences do provide some, though limited, guidance on the standards of curriculum contents, there is no mention of the methods of curricula delivery that ensures acquisition of knowledge, enhancement of understanding or development of skills.
b) Transfer of Learning to the Work Environment MET philosophy is based on the belief that once the students acquire the minimum
specified knowledge and practical skills in the class room, laboratories, workshops and during onboard training they will be able to apply the learnt behaviour in the actual work situation on board and will be able to appropriately modify it to the changing operational demands. It is a fundamental assumption that whatever knowledge and skills are acquired in the learning situation are retained in a trainee’s repertoire and are usefully applied in the work situation when required (Leberman, et al 2006). The transfer of learnt material to the work situation requires retrieval of learning that occurred in the learning situation. This retrieval is achieved more easily if the information provided in the learning situation was comprehensively understood. There is a better likelihood of transfer of learning when information provided in learning situation is understood and transformed into knowledge and concepts rather than learning that is committed to rote memorization. The transfer of learning to work situation is context sensitive i.e. it may be transferred with relative ease if the learning situations were identical to the work situation. Learning that occurs during on-board training, in the laboratories through practical exercises and simulated conditions is more easily transferred than the one that merely comes from class room lectures (Cunningham et al 2004).
c) Transformation of Knowledge in the Learning Environment Concomitant with specifying necessary subjects/contents and the intended level of their
coverage in the MET curricula, the process of curricula implementation is of equal importance. The process of curricula delivery needs to ensure that the students achieve a comprehensive understanding of the fundamental concepts of engineering, interrelationship of these concepts to the ship engineered systems, national and international regulatory requirements, shipboard administrative organization and the social needs demanded by the peculiarities of work environment on board. The process needs to be such as to ensure that deep understanding of the subject matter is attained. While the mandatory Code of STCW Convention provides guidelines on the methods of assessment of competence e.g. examination, use of practical demonstrations and use of simulators for assessment etc., it is silent on the methods of curricula delivery for competence development. It is the prerogative of MET institutions to implement the procedures and methods of curricula delivery best suited to them for their convenience of its delivery. Consequently there is a wide variety of curricula delivery methods amongst MET institutions. Some rely entirely on classroom lectures while others utilise techniques ranging from class room lectures to a good mix of practical exercises in laboratories, training on simulators, ‘ship-on-campus’ (with actual ship structure and associated equipment erected ashore), training on board training ships and/or on commercially operating ship. There is of course a specific requirement in the STCW Code that the instructors, supervisors and the assessors are appropriately qualified which does imply that they possess the necessary skills to implement appropriate procedures to affect students’ learning.
JOURNAL OF MARINE TECHNOLOGY AND ENVIRONMENT
84
Most prevalent, conveniently employed, most economic and conventional method of teaching is to impart learning by transfer of information from the teacher to the students through lectures. Unfortunately the students or trainees in a classroom are normally construed to be passive empty receptacles to be filled with knowledge provided by the teacher (Cox, 2009). Knowledge is not something that can be transferred from a teacher to a learner solely through talks and visual aids. What a teacher provides to the learners is information that needs to be transformed to knowledge by the learner. Acquisition of knowledge is a creative process where a learner makes meaning out of the information he/she receives from a teacher or other sources. The learner forms his/her own concepts through a process of critical thinking, analysing new information in relation with his/her existing knowledge and adding or modifying existing concepts. S/he may even discard old concepts if they become untenable in light of critical analysis of new information.
6. THE PROCESS OF LEARNING AND THE INFLUENCING FACTORS In order to further develop the concept of collaborative learning it is necessary to
systematically identify and define the existing other approaches and learning methods and moreover to discuss the corresponding influencing factors.
a) Surface learning versus Deep Learning Delivery of curricula through lectures to give the relevant information to the students is
the conventional and most common method of teaching. With its numerous advantages notwithstanding, this method normally focuses on short term perspective of learning, with the students aiming at completing the course and passing examinations. It prompts the students to resort to learning individual concepts in fragmented manner confining them to surface learning (Reynolds, 1994). Research over half a century espouses that readymade knowledge cannot be transferred to the students and that the students have to create their own knowledge through understanding of new information and its assimilation with reference to their existing knowledge repertoire (Barkley et al, 2005). This requires an active involvement of the students in the process of learning. This active involvement is by way of critical thinking where the learner has to interpret and correlate the new information with that already available in his/her psyche leading to comprehension and deep learning. Students’ asking questions and clarifying their doubts is an indication of critical thinking, unfortunately however, this activity is very limited in the classroom settings. To arouse interest and thinking process the teachers normally resort to questioning the students but it is generally noticed that asking question especially in a large class may usually result in a silence or response by only a few volunteers and mostly the same students every time (Felder et al, 1994). Concentration and consequently the involvement of students in the class also diminishes with time leading to cognitive dissociation and the students may mentally wander off in spite of their physical presence in the class.
b) Student-centred learning Deep learning requires the students to play a bigger role in the process of their own
learning. Engagement in deep learning process through critical thinking also inculcates in the students the skills of learning. This requires a shift from the conventional teacher-centred model of education that views the teachers as active contributors and students as passive receptacles of knowledge to the one that is student-centred model where the students are the centre of focus and are actively involved in the learning process. The onus of learning is on the students and they are made responsible for their own learning. This approach is reported to be much more effective in providing high level cognitive skills, attitudes and behaviour, normally beyond the reach of traditional education model. As the students are responsible for their learning they have the ownership of their learning process and the learning achievements driven from it rendering intrinsic motivation as against extrinsic

JOURNAL OF MARINE TECHNOLOGY AND ENVIRONMENT
85
motivation that is normally generated due to fear of failure or enticement of rewards, the hallmark of traditional teaching/learning process (Brown et al, 1988). Students’ active participation in the process of learning augments their skills of learning and helps them develop attributes of lifelong learners. Acquiring learning skills has a lifelong implication of educational process and an essential element in professional lives of people. ‘Learning to learn’ skills need to be developed during one’s general and professional education through exposure to deep learning strategies by involving learners in locating, retrieving and interpreting information and constructing own meaning and new knowledge. Acquisition of such skills guides professionals in perceiving the current and unfolding situations in the right earnest diminishing chances of errors in decision making process.
c) Group-Based Learning Learning process in which the students work together in small groups and actively
involve themselves to seek relevant information on a particular subject matter or a problem for its solutions are characterised as ‘group-based’ learning methods. Group-based learning process promotes interaction amongst students through co-operation as against competitive or individualistic interaction amongst them (Johnson et al, 1988). The main premise of group-based learning is based on the belief that learning is a social process and consequently it reinforces the view that use of a social setting like a group of learners is expected to be more effective in comparison with individualistic approaches. It is based on the belief that students can learn from each other when interacting in a group and that knowledge is constructed in a social process. When engaged in group work a synergy develops amongst the interacting students and the learning that occurs amongst all to them often surpasses what can be learnt individually (Cullen, 2008). Working in a group not only enhances learning but it also contributes to the social and political demands of the society as the “belief about society is that a central role of education is to prepare citizens to perpetuate a democratic social order” (Reynolds, 1994, p 24). While the group work amongst students contributes to learning and enhancement of cognitive attributes of learners through critical thinking it also “contributes to development of interpersonal skills and other non-cognitive factors that are valued in careers and citizenship” (Barkley et al, 2005, p 16).
Group-based learning methods significantly differ from the traditional teacher-centred or lecture-centred methods in class room settings. Group-based learning processes put onus of learning on the learners who need to collaborate with each other in searching, assimilating and jointly evaluating relevant information for comprehensive understanding of the subject matter thus fostering deep learning. It is a constructivist approach to learning where group members construct, reinforce or modify their concepts about the subject matter together by pooling in and utilising their repertoire of knowledge, experience and skills. There is a significant shift of emphasis in the role of a teacher or instructor from ‘teacher as experts and custodian of knowledge’ to teacher as a ‘manager, a facilitator or an expert designer of intellectual experiences for students’ helping student to enhance their own learning (Smith, 1992; Reynolds, 1994).
Collaborative Learning: Number of group-based learning techniques in variety of formats have been utilised by
educators and researchers. They fall under the common umbrella term of ‘collaborative learning’ (Smith, 1992). Some of these methods go under the names such as T – groups, cooperative learning, games and simulations, role plays, discussion groups, action learning, guided designs, problem based learning, case studies, writing groups, peer teaching, debates, workshops etc. The collaborative learning techniques significantly differ from each other on the basis of their objectives set out for the group work, structure of groups, group organization, responsibilities put on individual group members, extent of teacher involvement, knowledge of the outcome from group deliberations, assessments and in-class time or out-of class time built around the group work. The structure of group work may

JOURNAL OF MARINE TECHNOLOGY AND ENVIRONMENT
86
involve collaboration of group members in short spells ranging from a few minutes to entire lecture period or may even extend to whole term, a semester or a year. Collaborative learning bases itself on Vygotsky’s theory of ‘zone of proximal development’ that relates to the ‘distance between the level of actual development as determined by independent problem solving and the level of potential development as determined through problem solving under adult guidance or in collaboration with more capable peers’ (Dillenbourg et al, 1996). It is characterised by joint intellectual efforts of students in a group with or without involvement of their teacher or the instructor. Implementing group work in curricula delivery can help augment learning in the changing scenario of increased flexibility, recognition of the need for lifelong learning and inculcating the skills of learning by providing increased autonomy to the learner. There is a considerable overlap amongst the applications of collaborative learning formats that are applied in various educational disciplines and professional fields. A right choice on the selection of a particular format would depend on the objectives set forth for the particular model of collaborative learning commensurate with the particular educational discipline and the academic level of members forming the group.
Whatever be the format for collaborative interaction the process demands that members are actively engaged in the process of learning with each other through discussions, putting forward their points of view on the topic of discussion, reflecting based on their understanding of subject matter, disagreeing, defending their opinion, receiving others’ view points, reaching consensus, drawing conclusions or finding solutions to problems depending on the preset targets for the collaborative group-work. Collaborative process provides opportunities to make creative use of controversies generated from the divergent views of group members thus expanding their social and intellectual horizons (Sharan, 1992). The structures of collaborative learning model vary from highly structured formats, with the teacher controlling the process, to more flexible formats providing the group members freedom of their own control and supervision of the group work.
Cooperative learning: In any form of collaborative learning the onus of learning is on the students and they are
responsible for their own learning. Cooperative learning, one of the variants of collaborative learning, adopts a more structured format of group work for learning. Although many scholars and educators have used the terms collaborative learning and cooperative learning interchangeably to mean the same thing there are some who insist on distinction between the two (Barkley et al, 2005). Panitz, for example, distinguishes collaboration as a philosophy of integration not only in the classroom but it also suggests a way of generally dealing with people, on the other hand cooperation is a structure of integration that is designed for achieving a preset goal (Panitz, 1997). Principally in both of these group-learning formats the students are required to work together towards achieving common learning goals through sharing of information and supporting each other. The cooperative learning format is more structured wherein the teacher or the instructor retains his/her dual role, as in traditional class room setting, i.e. of a subject matter expert as well as of the controlling authority of the learning process. Teacher’s role in cooperative learning method entails designing and assigning the group learning tasks, providing and managing resources, managing time, guiding the students and monitoring that they do not stray away from the tasks as well as of monitoring the progress of the groups. Johnson brothers, the pioneers in the in the implementation and research of cooperative learning, affirm five essential elements for accomplishment of common goals by the group members through a cooperative learning endeavour (Johnson et al, 1991). These five elements are:
• Positive interdependence. It is the essence of cooperation wherein each group
member is obliged to rely on one another for achievement of the set goals.

JOURNAL OF MARINE TECHNOLOGY AND ENVIRONMENT
87
Failure of any one in doing his/her part has a negative consequence for the whole group, ‘float together or sink together’.
• Individual accountability. All the group members are accountable for doing their share of work and for achieving mastery in all the material to be learnt, ‘no hitchhiking’.
• Face to face positive interaction. Although some of the work may be done individually some must be done interactively with the group members providing feed back to each other, challenging one another’s conclusions and most importantly, teaching and encouraging one another.
• Appropriate use of collaborative skills. Group members are encouraged and helped to develop and practice trust building, leadership, decision making, communication and conflict management.
• Group processing. Group members set the group goals. Periodically assess the progress achieved as a team and to identify changes they need to make to function more effectively in future.
Design of the supporting lecture material, the tasks to be assigned, guidance and monitoring of group work has to be such as to ensure that all the five elements are appropriately addressed. It is incumbent on the teacher/instructor to circulate around the groups to see that each member in each group is participating and that group members are on the right course commensurate with the aims and goals of the exercise. Assessment of the cooperative learning exercise is an important element to evaluate effectiveness and to implement corrective modifications. Assessment has to be based in relation to the objectives that are set for the cooperative exercise. The form of assessment will depend on whether the cooperative group work is arranged to improve upon the knowledge, skills and/or attitudes and accordingly it should include drill-and-practice items, critical thinking items and or social skills items as appropriate. It is extremely difficult to assess the significance of elements such as positive interdependence and individual accountability when the combined work of a group is assessed as a whole. Individual assessment of the group members is therefore more suitable for evaluation of these specific elements.
d) Positive Achievements Experience through implementation of the collaborative leaning techniques as well as
the research carried out to evaluate effectiveness of this learning method indicates a positive achievement in the cognitive and social attributes of the students (Barkley et al, 2005). Johnson, Johnson and Smith, on the basis of 68 comparative studies involving students above the age of 18 years, have stated that there was a substantial improvement in grade scores, rising from 50 percentile to 69 percentile, when learning collaboratively as against when learning individually in a competitive set up (Johnson et al 2007). In a further research, involving 158 studies employing eight different formats of cooperative learning, they have concluded that although there are variations in the levels of positive achievement all show a gainful effect (Johnson et al, 2000). An earlier a review based on 29 studies at the elementary and secondary grades levels indicated positive achievement effects in 63 % cases with 32.6 % cases indicating no improvement and in 4.4 % cases even indicating negative trend (Slavin, 1983).
Response from the students who have gone through the experience of collaborative learning is equally supportive of the gains achieved in learning. Reporting a retrospective evaluation based on 67 responses received from the senior students of chemical engineering class who underwent an experimental course delivered through collaborative learning method Felder has stated that 92% students had rated the course more instructive than their other courses of same discipline delivered in conventional manner; the remaining 8% rated the course as equally instructive and none rated it as less instructive (Felder et al, 1994).
JOURNAL OF MARINE TECHNOLOGY AND ENVIRONMENT
88
Our own preliminary study at the World Maritime University has indicated higher achievement of grades by the students who participated in group learning as compared to those who worked individually. The exercises were conducted involving seven students in their final semester this year who had chosen an elective subject of technical nature comprising two modules. All of the students had technical background except one, however that student too was a science graduate and over the past three semesters had acquired substantial technical knowledge. These students were divided into two sets, of four and three students respectively and were alternately put through ‘individual learning’ and ‘group learning’ exercises. For each learning exercise the students were given a one page text related to a part of subject previously covered through lectures. There was a different text for each exercise but all the seven students got the same text for each exercise. Each learning exercise was of 30 minutes duration in which one set of students worked individually and those in the other set worked in a group. The students working individually had to read, comprehend and assimilate the contents of the text on their own using their lecture notes, handouts and other reading material. Those working in the group had to discuss the text, to understand with the help of others, sharing their knowledge based on their understanding of the text, lecture notes, handouts and other reading material to reach common understanding of the concepts. After each exercise they were assessed individually through a common written test, specific to each exercise. Each test had the same format, comprising some objective type short answer questions and a long essay type question. In order to eliminate the element of subjectivity, possibly due to the individual background knowledge in the subject, the groups were formed by random selection through lottery. Secondly the exercises were arranged in such a way that the students who worked individually for the first exercise worked in a group in the next. Consequently each set of students worked twice individually and twice collaboratively.
Analysis of grades obtained from the assessment of written tests indicated that in three out of four assessments the average of grades of students who worked in groups were higher in relation to the average of grades of the students who worked individually. As the students went through the group learning and individual learning exercises alternately, it is also noted that their performance based on the average of grades of the same set of students was better after group learning compared to their average of grade performance after individual learning. Although this sample of only four exercises, which forms part of our preliminary study, is too small to reach a firm conclusion the indicated trend conforms to the results of other studies mentioned earlier.
7. APPLICATION TO THE MET ENVIRONMENTS Prime objective of MET is to develop young seafarers with adequate competence for
efficient operations of ship and shipboard equipment with safety of life, ship and the environment as the primary concern. As operators, the seafarers are at the human-machine interface and responsible for safe operations under normal operating conditions and emergency conditions that may develop. At the same time however they are also entrusted with performing managerial tasks of tactical planning in line with company’s strategic plans and implementation of such plans with the efficient use of material, time and human resources. Consequently in addition to the technical competence they need to possess managerial skills as well as social skills to work as an effective team. They need to be socially competent to effectively communicate, negotiate, discuss and manage possible conflicts if and when they arise.
One of the competences requirements for seafarers at management level, that has been included in the STCW Code, specifies ‘knowledge of personal management, organization and training on board’. Personal management is a vast subject and in the absence of

JOURNAL OF MARINE TECHNOLOGY AND ENVIRONMENT
89
specificity of learning objectives and lack of guidance in the STCW Code the setting up of learning objectives and the curricula contents are solely dependent on the course developer’s perception of needs, his/her experience & background, personal preferences and national regulations on crew employment. Secondly only possessing specific knowledge in personal management is not sufficient to be competent in the use of that knowledge. Competence means proficiency in use of fundamental knowledge through application, practice and experience.
Collaborative learning techniques which necessitate working in groups inevitably provide opportunities to develop and practice social skills as the group members have to involve themselves in discussing, expressing their understanding of subject matter, agreeing/disagreeing, putting forward their points of view, defending their opinion without being offensive, respecting others’ points of view, resolving conflicts, reaching consensus and drawing conclusions or finding solutions to problems. These interactions which are essential part of group work provide the group members with self awareness of their own strengths and weaknesses in their power of expression and opportunities for its improvement. They get a first hand practical experience of barriers to communication which is a fundamental detriment in effective team work. Thus application of collaborative learning in the MET institutions would provide multiple benefits of deep learning, enhancing skills of learning, inculcating attributes of lifelong learners and developing social skills.
a) Preferable Stage for Application of Collaborative Learning In majority of cases the incumbent student body to the MET institutions are young
graduates from secondary schools generally their age ranging from 16 to 18 years and in all likelihood having no or a minimal exposure to group-based learning. More often than not they are expected to be used to rote learning. The curricula for MET are designed in a way that they learn fundamental scientific principles and gradually taken to master the professional engineering subjects. Prior to their entry to MET they have studied a very wide spectrum of subjects and may have limited experience in application of basic scientific principles. If collaborative learning techniques have to be implemented in the MET institutions the students must be suitably and gradually prepared for it. Collaborative learning can be implemented at any stage of the MET studies as equally successful use of collaborative learning at primary, secondary ant tertiary education levels has been recorded in number of studies (Barkley et al 2005). Group-based learning methods are more time consuming and in view of the time and resources constraints in practically all MET institutions it may be economically preferable to implement it in the later stages of MET. It is expected to be more useful once the students have completed their foundation studies and have acquired basic knowledge of scientific theories, equipment design, working principles etc. and are in the process of learning about the shipboard engineered systems, their operation and management. Application of collaborative learning at later stages will be more beneficial as they would have gained sufficient knowledge of design and working principles of equipment and will be able to contribute better to each other’s learning.
b) Cooperative Learning – the Preferable Choice As mentioned earlier cooperative learning is a structured version of group-based
learning technique that is controlled by the teacher or instructor. The incumbents to the MET are young secondary school graduates who in all likelihood have not been exposed to academic group learning. In majority of cases students at school level are used to strict control of the teachers/instructors in the class room settings. They would need to gradually develop skills of self regulation in learning. Regulated activities in cooperative learning can provide the necessary platform for their gradual indoctrination.
Expected outcome of the MET process is that the students attain mastery in number of specified competencies in accordance with their shipboard functional areas at operational level. As the MET prepares the students for shipboard operations the specified compe-
JOURNAL OF MARINE TECHNOLOGY AND ENVIRONMENT
90
tencies are oriented towards operating procedures that take into account all the relevant rules, regulations, industry norms and practices. This means the students need to learn specific or recommended procedures to carryout the shipboard tasks. In view of this specificity it is more suitable to adopt cooperative learning methodology in MET. The cooperative learning methodology is more structured, controlled and the exercises are so designed that the group work learning outcome is oriented towards closed ended outcomes known to the teacher.
Composition of groups is a determining factor in effectiveness of cooperative learning methodology. Number of members in a group may vary from minimum of two to as many as eight or ten. Groups with fewer members than three or four are deprived in variety of view and ideas as well as team emotions. On the other hand bigger groups with over five members find it difficult to manage their time and to ensure involvement of every member. Four or five students in a group for cooperative learning exercises are considered as optimum (Johnson et al, 2007). Composition of cooperative learning groups on the basis of heterogeneous ability level is important. It has been observed that a group of students with mixed intellectual level perform better overall as the weaker students gain from the brighter ones and the brighter ones in turn gain a better understanding teaching the weaker ones. Forming groups with all stronger students together or all weaker students together does not augur well for collaboration as students in such groups have been found to have only cursory communications (Felder et al, 1994). Composition of groups also needs consideration from the gender and ethnic diversity where applicable.
c) Transformation of Knowledge in the Learning Environment Most part of MET constitutes technical education and training which is founded on the
scientific facts and principles. Although collaborative learning can be applied for delivery of scientific facts and principles but the time and efforts required by this method for learning of such topics outweighs the benefits.
Portion of curricula to be delivered through collaborative learning would consume time and other resources and consequently the remainder part of curricula would need changes in view of lesser time available. Innovative initial work is needed to design the delivery structure, assignments, and assessments, methodology of guiding and controlling groups and monitoring their progress. To bring about changes in well set and operating system is a difficult task.
Teachers and instructors in MET institutions are old maritime professionals and may have limited exposure to innovative teaching and learning processes. They may believe that the best way of delivering knowledge is the way they acquired it.
There is always scepticism about the success of a new and untried system and unfounded fear in the minds of teachers/instructors of losing the control of the class.
8. SUMMARY AND CONCLUSIONS It is a common place to come across statements in the maritime as well as other
industries operating socio-technical systems that 80% of all accidents are caused, at lease in part, by errors committed by humans at different levels of hierarchy. Erroneous actions of operators at the human-machine interface, the seafarers on board, are amongst the contributory causes for 20% of accidents resulting from deficiency in knowledge of their ships, shipboard technical systems and the specific work environments.
Competence of seafarers is the most prominent human factor and a deficiency in competence is detrimental to shipboard safety. Seafarers of mixed nationalities who have been educated and trained under varying standards of education and training are required to work together as a cohesive team on board internationally trading ships. Although minimum standards of competence have been laid down in the STCW Convention there is no specific

JOURNAL OF MARINE TECHNOLOGY AND ENVIRONMENT
91
mention of either the actual contents or level of their coverage or of the methods of curricula delivery. Prevailing methods of curricula delivery and assessments prompt the seafarers to resort to surface learning.
Deep comprehensive learning is necessary for understanding of working principles of shipboard engineered systems to operate them efficiently and safely in normal conditions and in emergency situations.
Involvement of students in the process of deep and comprehensive learning through critical thinking also renders in the learns the skills of learning necessary for accurate perception from the available parameters and work environments, ability to make right decisions and suitably modifying responses demanded by the changing operational situations.
Collaborative learning techniques have been found to be much more effective in enhancing learning and application of these in the MET institutions will help achievement of required competence and inculcate in the prospective seafarers the skill of learning as well as social skills, all the more necessary for effective team work in the present day ship manning arrangements. Skills of learning will provide them with the ability to make use of the learning opportunities constantly meted out in the shipboard work environment.
REFERENCES [1] Timpe, K.-P., Kolrep, H., 2002, “The man-machine system as an interdisciplinary subject”,
Publisher: Symposion, Düsseldorf, Germany (German: K.-P. Timpe, T. Jürgensohn & H. Kolrep, “Man-Machine-Systemtechnics”, Symposion, Düsseldorf, Germany)
[2] Baker, C. C., McCafferty, D. B., “Accident Database Review of Human –Element concerns: What do the results mean for the Classification”, Paper presented at the Human factors in Ship Design, Safety and Operation, 23-24 Feb 2005, Royal Institute of Naval Architects, London
[3] Boisson P., 1999, “Safety at sea policies – regulations and international law”, Bureau Veritas, [4] Bird, F.E.Jr. and Loftus, R.G., 1982, “Loss control management”, International Loss Control Institute
Press, U.S.A. [5] Senders, J. W., Moray, N. P., 1991, “Human error: cause, prediction and reduction; analysis and
synthesis”, Lawrence Erlbaum Associates, Publishers Hillsdale, NJ, U.S.A. [6] Mill, R. C., 1992, “Human factors in process operations”, Institution of Chemical Engineers,
Warwickshire, U.K. [7] Reason, J., 1997, “Human Error”, Cambridge University Press, U.K. [8] Sagen, A., 1999, “The ISM Code in practice”, AIT Otta, AS Norway. [9] Hollnagel E., 2004, “Barriers and accident prevention”, Ashgate Publishing Ltd. U.K. [10] Stranks, J., 2007, “Human factors and behavioural safety”, Butterworth-Heinemann, U.K. [11] Morrison W.S.G., 1997, “Competent crews – safer ships”, World Maritime University [12] Dekker, S., 2006, “Field guide for error investigation”, Ashgate Publishing, U.K. [13] Bea, R. G., “Human and organizational factors in quality and reliability of engineered systems”,
paper presented at seminar Managing Safety in Hazardous Processes, SHE Pecific Pty, Melbourne, Australia, 26 November, 1999.
[14] Prasad, R., 2010, “Competence bases MET and the role of group-learning methods” Scientific Journal of Maritime Research, Croatia, vol 24, December 2010
[15] Uchida, M., 2004, “Analysis of human error in marine engine management”, International Association of Maritime Universities, AGA No.5, Tasmania, Australia. [16] Prasad, R., 2002, Report of “METNET project” under the Thematic Network funded by the European
Commission transport RTD programme of 5th framework programme, 1999-2002 [17] Kahvechi, E. et al, 2002, “Transnational seafarer communities”, Seafarers International Research
Centre (SIRC) for Safety and Occupational Health, University of Whales, Cardiff, U.K. [18] Lane, T., 1996, “Crewing the worlds merchant ships”, Seafarers Internal Research Centre (SIRC)
for Safety and Occupational Health, 1996, University of Wales, Cardiff, UK [19] Short, R., 2010, “Quest for quality seafarer”, paper presented at Seafarers and Crew Management
Conference, Singapore, Sept. 27-29, 2010

JOURNAL OF MARINE TECHNOLOGY AND ENVIRONMENT
92
[20] IMO, 2002, “IMO Guidelines for formal safety assessment (FSA) for use in the rule-making process”, MSC/Cir.1023, MEPC/Cir 392 April 2002, IMO , London
[21] Leberman, S., McDonald, L., Doyle, S., 2006, “Transfer of learning: participants perspective of adult education and training”, Ashgate Publishing, U.K.
[22] Cunningham, I., Dawes, G, Bannett, B., 2004, “Handbook of work based learning”, Ashgate Publishing UK, retrieved 02.07.2010 http://site.ebrary.com/lib/wmulib/
[23] Cox, C., 2009, “Ensuring quality in MET”, proceedings of IMLA 17 Conference, Accra, Ghana, 7-10 September 2009, pp 88-98,
[24] Reynolds, M., 1994, “Groupwork in education and training: ideas in practice”, Routledge Falmer, NY, U.S.A.
[25] Barkley, E.F., Cross, P., Maor, C. H., 2005, “Collaborative learning techniques; A handbook for college”, Jossey-Bass, CLPD, University of Adelaide, Australia, retrieved 30. 06. 2010. http://www.adelaide.edu.au/clpd/resources/leap
[26] Felder, R. M., Brent, R., 1994, “Cooperative learning in technical courses: Procedures, pitfalls and payoffs”, ERIC Document Production Service Report ED 377038 (1994), retrieved 06. 12. 2010, http://www4.ncsu.edu/unity/lockers/users/f/folders/public/Papers/Coopreport.html
[27] Brown, G., Atkins, M., 1988, “Effective teaching in higher education”, Methuen & Co. U.K. [28] Johnson R.T., Johnson D.W., 1988, “Cooperative learning”, In Context Quarterly Journal of Context
Institute, retrieved 06. 09. 2010 http://www.context.org/ICLIB/IC 18/Johnson.htm [29] Cullen, R., 2008, “Creating mindset for collaboration”, The Teaching Professor, periodical, Magna
Publications, U.S.A., April 2008, [30] Smith, B. L., MacGregor, J. T., 1992, “What is collaborative learning”, National Centre for Post
Secondary Teaching, Learning and Assessment, Pennsylvania, retrieved 06. 04. 2010 http://google.com/search [31] Dillenbourg P., Baker, M., Blaye, A., O’Malley, 1996, “The evolution of research in collaborative
learning”, in Learning in Human Machine: towards interdisciplinary science, Oxford, Elsevier, retrieved 02. 11. 10, http://scholar.google
[32] Sharan,Y., Sharan, S., 1992, “Expanding cooperative learning through group investigation”, Teachers College Press, NY U.S.A.
[33] Panitz, T., 1996, “Collaborative versus cooperative learning – A comparison of the two concepts which will help us understand the underlying nature of interactive learning”, retrieved 05.07.2010 http://home.capecod.net/-tpanitz/tedsarticles/coopdefinition.htm,
[34] Johnson D.W., Johnson, R.T., Smith K.A., 1991, “Cooperative learning: increasing college Faculty instructional productivity”, ASHE-ERIC Higher Education Report No.4, 1991, George Washington University, U.S.A.
[35] Johnson, D.W., Johnson, R.T., Smith, K., 2007, “State of cooperative learning in post secondary and professional setting”, Education Psychology Review, Vol. 19, No. 1, Springer Science + Business Media, LLC, Printed on line 3 January 2007, retrieved 10. 12. 2010
http://www.springerlink.com/content/ [36] Johnson, D.W., Johnson, R.T., Stanne, M. B., 2000, “Cooperative learning methods: A meta
analysis”, retrieved 28. 06. 2010, http://www.co-operation.org/pages/cl-methods.html [37] Slavin R.E., 1983, “When does cooperative learning increase student achievement?”
Psychological Bulletin, vol. 94, No.3, 1983

JOURNAL OF MARINE TECHNOLOGY AND ENVIRONMENT
93
DEFINING THE SHIP MAGNETIC PERFORMANCE BY MEANS OF PASSAGE CHARACTERISTICS
1SAMOILESCU GHEORGHE, 2MARIN GEORGIANA, 3SERGHEI RADU
1Mircea cel Batran Naval Academy, Constanta, 2Research Center For Navy, Constanta,
Romania, 3Zodiac Company, Romania
Defining the necessary level of protection for the ship in order to fulfil its operational purpose is a prerequisite in ship magnetic signature analysis and in adopting the appropriate method of reduction. In the study of ship magnetic field it is vital to thoroughly establish its components for an accurate assessment by using several efficiency indicators chosen precisely on the basis of those components. This paper performs the analysis of the passage characteristic of a medium sized special ship on the basis of its longitudinal magnetic characteristic. Furthermore, the results acquired through Fourier harmonic expansion are compared to the measured values. The time differential of the passage characteristic is also significant in this way. Therefore the possibility of passage characteristic control and implicitly the ship protection against magnetic mines emerges by means of complete knowledge of the ship’s magnetic field and adjusting the speed when transiting a mine danger area.
Keywords: ship magnetic characteristic, passage characteristic
1. INTRODUCTION Although ship magnetic signature reduction is a common desideratum, the necessary
protection degree is defined by means of the ship’s operational role [3]. An important aspect of the issue lies in completely establishing the ship magnetic field components and selecting those elements that can be used as performance indicators for the assessment of the ship magnetic field. Some relevant indicators in ship magnetic field analysis are the normal measurement depth, the passage characteristic, the longitudinal, transversal and vertical magnetic characteristics.
2. PASSAGE CHARACTERISTIC
The magnetic performance analysis essentially begins with the determination of the tools through which to perform the analysis. The normal measurement depth is the underwater level for which the magnetic field of a ship with its magnetic protection equipment (degaussing equipment) on does not exceed a threshold [2].
The passage characteristic describes the temporal variation of the ship’s magnetic field component, given the assumption that the ship travels on a constant course, with constant speed. Herein after there are described several aspects of this evolution, giving as example the case of a medium sized special ship.
The ship traveling on a constant course and at constant speed is characteristic to the operation of special ships in specific mission areas. Such missions require an optimal speed

JOURNAL OF MARINE TECHNOLOGY AND ENVIRONMENT
94
and for that the operator must know the passage characteristic of his ship. Of primary concern are the passage characteristics related to the longitudinal characteristics, as the ship’s drift is usually omitted. The longitudinal passage characteristic computation relies on the knowledge of the emperimentally procured longitudinal magnetic characteristic.
- x2
xN
yK
y
y1 =ctx
x
z = hn = ct
fk(x)
fk (xi)
fk (xi)
fk (x1)fk (x2)fk (x3)
fk (x1)fk (x2)
Fig. 1. The longitudinal magnetic characteristic
In the figure above there is illustrated the longitudinal magnetic characteristic fK(x)
correlated with the measurement plane, no matter the field component it describes. The range between two consecutive measurement points Δx is constant, hence it appears that the period Δt of time in which the ship having the speed V = ct covers this range is: N
NVxt Δ
=Δ (1)
Having determined the value of Δt, the passage characteristic fK(t) can be traced for constant speed V =ct. N
3. APPLICATION OF PASSAGE CHARACTERISTICS The prime use of these characteristics lies in ship differentiation according to the first
harmonics of those characteristics’ harmonic expansion. The Fourier trigonometric and harmonic expansion of the experimentally determined functions is thoroughly described in the technical literature [1]. In this case, the Fourier expansion of the passage characteristic function fK(t) can be achieved considering that the expansion of the ship magnetic field XN may be expressed as:
NNN TVX ⋅= (2) where TN denotes the conventional period corresponding to the ship magnetic field impact on the considered point.
The abscissa x , for which the field value is fi K(x ), has a corresponding angle xi i expressed in radians and herein computed:
iN
i xX
x π2= (3)
The above equation can be moreover stated as:
iN
i tT
x π2= (4)
⋅ tprovided that x = V , where ti N i i denotes the period in which the ship travels at constant speed through the distance corresponding to the x abscissa. i
The conventional pulsation of the main harmonic ω [rad/sec] is further computed: 0

JOURNAL OF MARINE TECHNOLOGY AND ENVIRONMENT
95
NTπω 2
0 = (5)
ii tx 0ω= (6) therefore: Using the equations above the Fourier trigonometric expansion of the passage
characteristic fK(t) is obtained:
( ) (∑=
++=m
nnnk tnbtna
atf
100
0 sincos2
ωω ) (7)
where the expansion coefficients are expressed as:
( )∑=
=s
iik tf
Sa
10
2 (8)
( )∑=
=s
iiikn tntf
Sa
10cos2 ω (9)
( )∑=
=s
iiikn tntf
Sb
10sin2 ω 10)
S denoting the number of points in which the values of fK(x) are measured. Given the scanty practical abilities in our country, the number of measurement points on the ship’s longitudinal alignment is very low.
Provided the case of a medium sized special ship with its magnetic protection equipment on, set on D = 0o magnetic course, having the following dimensions: the overall length mL= 120m, the beam (width) Bmax = 11m and the draft T = 4,3m, the longitudinal characteristic fK(x) = Hz(x) was experimentally determined for the specific values of y = 0,00 m and the depth z = hn = 9m. For this particular ship with the speed of VN = 18 Nd = 9 m/s, there following passage characteristics were computed and illustrated (figure 2):
- the effective passage characteristic Hz(t); - the approximative passage characteristic Hza(t), computed by considering the first five
harmonics of the Fourier expansion. For the ship described above the measurements were described by the expansion of the
ship magnetic field XN = 180m and the number of measurement points S = 16; the subsequent data was obtained: the conventional period of impact TN = 20s, the pulsation of the main harmonic ω0 = 0,314 rad/s, the period of Δt = 1,333 s, the characteristics (magnitude and frequency) of the first harmonic A = 4,6646 mOe and fo1 o = 0,05 Hz, respectively. It can be noticed that the pulsation of the main harmonic ωo depends on the ship’s dimensions and speed, whereas the corresponding magnitude acquires important values for the ships with high mechanical performances.
Taking into consideration the first five harmonics of the Fourier expansion, the approximative passage characteristic preserves the properties of the effective one and describes it with an adequate accuracy for practical purposes. Both characteristics present an equal number of critical points nz = 4.
It is known that the transducers in magnetic mines are tuned to very low frequencies correlated to the type of ship for which the mine is designed [2]. Therefore it may be infered that by knowing the magnetic field elements of one’s own ships in the plane of a specific depth and imposing the speed, those ships can be differentiated among others by selecting the main harmonic. This aspect may be practically applicable for the control of port entrance.
In the area of ship protection against induction channel mines, a particular interest resides in the time derivatives dHz/dt related to the longitudinal passage characteristics. The computation of the vertical component derivative for several speed values heads towards determining the safe navigation speed of a vessel provided the knowledge of the navigation area depth and the mine sensitivity.

JOURNAL OF MARINE TECHNOLOGY AND ENVIRONMENT
96
5 10 150
0
- 5
5
10
- 10
- 15
- 20t(s)
Hz[
mO
e]
hn = 9.00m, y= 0.00, Vn = 9.0 m/s
AFOREABAFT20
Approximative characteristic
Effective characteristic
Fig. 2. The effective and approximate passage characteristics
The gradient expression of the vertical component Hz on the longitudinal axis can be
used for determining the dHz/dt parameter:
HzVdt
dHzxN grad≅ (11)
Therefore the time derivatives of the ship magnetic field components, at constant speed
V ctN = , resemble the gradient variation of the respective component along the regarded axis. It is advisable to use the gradient values related to the longitudinal and transversal magnetic characteristics as a ship magnetic field performance indicator.
4. CONCLUSIONS A ship’s magnetic signature can be described through several elements: the maximum
values of the magnetic field obtained as a result of superposition of the permanent, the induced and the degaussing cooils magnetisations. Another indicator is the number of turning points of the magnetic chracteristics, thus determining the gradient values on the respective axes. The ship passage characteristic relates to the ascertainment of the ship’s speed in the operations area, according to depth, for the purpose of avoiding mine danger.
The magnetic performance is imposed in the palne of the safety depth, each ship having an unique magnetic signature that distincts it from other ship in the same class. This paper validates the possibility of using the longitudinal magnetic characteristics for ship differentiation. The ship motion parameters are related to the magnitude and frequency of the first harmonics of the passage characteristics Fourier expansion. That is a practical aspect for adopting adequate speed and course when passing through a mine danger area.
The ship magnetic status being tightly related to its missions, the completion of repeated evaluations at optimal periods is imposed in order to constantly maintain the imposed performance.
REFERENCES [1]. Antoniu S.I. – Chestiuni speciale de electrotehnică, Romanian Academy, pp.23-97,1956, [2]. Barbu M.– Câmpurile fizice ale navelor. Acţiuni şi contraacţiuni, Military, pp.167-235, 1990 [3]. Desormiere M.B.– La protection magnetique des navires contre le danger mines, Th. Sintra, 1992 [4]. Ianovschi T.M. – Zemnoi magnetism, vol. II, Leningrad University, pp. 153-179, 1963 [5]. Nanu D. –Automatizări electrice navale, Muntenia & Leda, pp.278-289, 2001

JOURNAL OF MARINE TECHNOLOGY AND ENVIRONMENT
97
MODELING THE ELECTROMAGNETIC FIELD INTRUSION
1SAMOILESCU GHEORGHE, 2MARIN GEORGIANA, 3RADU SERGHEI
1Mircea cel Batrân Naval Academy, Constanta, 2Research Center For Navy, Constanta, 3Zodiac Company, Constanta, Romania
In the scope of modeling the intrusion of the electromagnetic field in the human body an analysis of the electric parameters of the biologic environment is conducted. There are also introduced various examples issued from experiments regarding the human body response to electromagnetic field effects.
Keywords: electromagnetic field, human body, intrusion depth, specific resistance
1. INTRODUCTION Every day exposure to electromagnetic radiations has proved increasingly harmful. The
scope of this paper is to conduct an analysis of the electric parameters of the biologic environments with respect to their effects on the human body.
2. THE ELECTRIC PARAMETERS OF BIOLOGIC ENVIRONMENTS The tissues gradually deteriorate and alter their electric properties starting from the
moment of excitation [3, 4, 5]. Measurements have proved that after approximately one day of low frequency exposure, the dramatic decrease of the metabolism rate leads to the destruction of the cell membrane, thus decreasing the disruptive voltages. At high frequency, the variation rate of the initial values is lower because the tissues electric properties depend on the water and protein content.
The information gathered from the measurement of the dielectric parameters of various biological environments shall be illustrated in tables [1, 6, 7]. Table 1 illustrates the specific resistance of several tissues.
TABLE 1. THE SPECIFIC RESISTANCE OF TISSUES ρ(Ω.CM) Frequency (MHz)
Tissue 0,1 0,3 1 3 10 30 100 Liver 220-540 220-480 210-420 200-350 180-270 160-220 150-195 Spleen 250-500 250-460 230-380 180-240 150-170 125-145 110-140 Kidney 145-260 140-250 130-215 115-170 105-158 100-155 Lung 165-200 161-193 150-180 135-165 114-148 105-141 100-140 Brain 440-830 430-780 420-700 390-605 300-460 230-360 200-300 Muscle 172-240 170-230 165-200 160-185 150-170 140-160 130-155 Cardiac muscle 185-242 180-240 178-230 163-200 145-175 138-170 136-168

JOURNAL OF MARINE TECHNOLOGY AND ENVIRONMENT
98
Researcher H. P. Schwan has improved the methods of measuring the electric parameters of biological environments – table 2 illustrates some of these results.
Table 2. The Dielectric Constant And Conductivity Of Several Types Of Tissues At 37°C
Frequency (MHz) 50 100 700 3000 8500
ε′a) Dielectric constant (the real part ) Muscle 85-97 71-76 52-53 45-48 40-42 Cardiac muscle 50-55 Liver 88-93 76-79 42-51 42-43 34-38 Spleen 135-140 100-101 Kidney 119-132 87-92 50-53 Lung 34 Brain 110-114 81-83 Adipose tissue 11-13 3.9-7.2 3.5-4.5 Marrow 6.8-7.7 4.2-5.8 4.4-5.4 b) Conductivity σ (mS/cm) Muscle 6.8-8.85 12.7-13.7 21.7-23.3 83.3 Cardiac muscle 10.5-12.8 Liver 5.13-5.79 5.59-6.49 8.8-11.8 20-20.4 58.8-66.7 Spleen 6.62-7.81 Kidney 6.9-11.1 1.3-1.32 Lung 2.22-3.85 7.69 Brain 4.76-5.26 5.13-5.56 Adipose tissue 0.4-0.59 1.11-2.27 2.7-4.17 Marrow 0.2-0.36 1.16-2.25 1.67-4.76
Table 3. The Inductivity (ε) And Penetration (δ) At 37°C
f = 1 GHz f = 3 GHz f = 10 GHz Tissue
δ (cm) δ (cm) δ (cm) ε ε ε Muscle 48-59 2.8 46-53 1.36 35-42 0.4
Liver 46-55 3.5 42-43 1.44 34.38 0.4
Lung 35 4.3
Spleen 50-54 2.5 46 38-42 0.4
Kidney 43-46 3.6 47.5 1.4 30-37 0.5
Brain – white matter 38-44 3.9 33-41 1.6 25 0.33
Brain – grey matter 45-51 4.0 44 1.79 40 0.34
Integral blood 58-67 2.9 55-56 1.76 45-52 0.38
Marrow 4.3-7.3 18 4.2-5.8 1.4
Bone 8 30 7.5 7 8 1.4
Adipose tissue 3-7.5 20 4.7 8.5 3.5-4 2.9 Table 3 illustrates the results obtained by H. Herrick and K. Oswald for various tissues
and organs. The measurement results for brain tissue are relevant in studies regarding the absorption level of microwave energy in tissues in special cases (e.g. the studies regarding the mobile phones induced effect on brain).
The measurements of dielectric coefficients for frequencies up to 18 GHz have determined results similar to the ones for low frequency, thus confirming the method validity. The measurements at even higher frequencies (40-54 GHz or 85-90 GHz) have confirmed

JOURNAL OF MARINE TECHNOLOGY AND ENVIRONMENT
99
the data obtained at 18 GHz, the source of errors being the resonance effect at frequencies comparable to cellular dimensions [3].
3. A COMPARATIVE ANALYSIS BETWEEN HUMAN DIMENSIONS AND
WAVELENGTH When performing an analysis of the biological effects of radiofrequency radiations, the
energy wavelength and its ratio relative to the physical dimensions of the item subjected to that radiation became essential factors. It has been determined that for every significant effect emerging due to radiation, the item’s physical dimension must be equivalent to at least a tenth of the radiation wavelength. Table 4 draws a parallel between the propagated energy wavelength and the equivalent number of wavelengths for a person of 1.7 meters high. Table 4. Comparison Between Wavelength And The Equivalent Number For A Person
1.7 Meters High Frequency
(MHz) Wavelength
(m) Equivalent number of
wavelength 3 100 0.017
30 10 0.17 300 1 1.7
3000 0.1 17 10000 0.03 56.6
The human body is similar to a vertical reception antenna. Its height, considered as a
wavelength depends on the radiation frequency and polarization. The higher the frequency of the incident energy, the more the wavelength progressively decreases, thus the human body parts dimensions become more significant in computing the number of equivalent electric wavelengths.
The human body is a tridimensional mass, having the following attributes: length, width, and height. By comparing again the physical characteristics of the human body to those of the reception antenna band, one can draw the following conclusion: when the body is thus oriented so that its dimensions are parallel to the energy polarization plane, the effects are far more obvious by comparison to the case of the body assuming other positions [2].
The characteristics of the cumulative biological effects exposures are: - the prevalence of some very low magnetic fields of (0.1÷0.2)μT, present in the domestic
environment, as well as in occupational environments due to common appliances and installations;
- the quasi-permanent character that determines the designations of background field, equivalent to the average exposure of a person;
- possible biological actions which can lead to genetic mutations, cancer over time. The significant characteristic parameter in the case of the cumulative effect exposures is
the magnetic field dose, accumulated by human bodies throughout large intervals of time. The domestic dose corresponds to an average exposure to 0.13 μT, which, in the case of a common individual, not additionally exposed during working hours, leads to an annual value of: 0.13 μT x 8760 h/year = 1.14 x 10³ μT x h/year = 1140 mT x h/year
The characteristics of the acute biological effects exposures are: - the temporary action of magnetic fields exceeding the order of a few mT, characteristic
to some occupational environments (e.g. the vicinity of induction furnaces); - the acute biological effects arise by exceeding a critical value of the magnetic field
intensity and they wear off with the disappearance of the field; - determining the limits of the instantaneous action which, if not exceeded, assure the
avoidance of acute biological effects. The World Health Organization and the

JOURNAL OF MARINE TECHNOLOGY AND ENVIRONMENT
100
international Commission for Non-Ionizing Radiations Protection (ICNIRP) have established those limits;
- the existence of a monotonous increasing dependency between the intensity of the magnetic field at which the exposure occurs and its biological effects. The characteristic parameter in the case of the acute biological effects is the density of
the current induced in the human body by the external variable magnetic field. The expression of the admissible limits is in terms of the values of the induced current density. The relation between the inducing magnetic field B and the induced currents densities J is described by electromagnetic induction law and the conduction law:
J = σE (1)
where σ is the body conductivity.
4. THE EXPOSURE OF THE HUMAN FACTOR TO THE MAGNETIC FIELD The fields generated by domestic appliances, including the ones on board ships,
typically have high magnetic induction values for small ranges, within which are the users. The manufacturers of domestic and office appliances face the issue of electromagnetic pollution, which has a greater impact on population than transportation and electrical energy distribution systems.
All the considerations regarding the biological effects due to magnetic and electric fields of industrial frequency must take into account an assessment of the daily exposure of the population. In order to attain this assessment – the exposure to industrial frequency fields of the people in the occupational environments (the personnel working on the electric lines and stations), an inspection platform has been developed. This consists of electric and magnetic fields sensors attached to the inspected item, the device for measuring the level of exposure and the main post (the reception unit, a PC and video equipment).
Fig. 1. The magnetic field distribution for the occupationally exposed human factor
The system allows the graphic representation of the measured field levels, real-time overlapping them on the TV image of the subject, displaying the process, and recording it on video tape. Figure 1 illustrates the distribution of the magnetic field (μT) in the case of a worker set in two positions, near a high voltage network.
Table 5 presents an estimation of the exposure times for a person in the electric occupational environment (personnel for electric lines and stations) in various positions and exposure doses cumulated in one year. The annual domestic dose is 1140 mT x h / year.

JOURNAL OF MARINE TECHNOLOGY AND ENVIRONMENT
101
Table 5. The Exposure Doses Cumulated In One Year For The Personnel Working On Power Systems
Setting
In contact (L<1m) At distance
At the ground(15-20)m
(5-6)m Connected activities
Power lines not under tension
Total
Power lines
Period/ h/year 20 300 370 700 210 1600
Power lines
Dose/ μT/year 3100 9440 890 90 0 13520
Power stations
Period/ h/year 12 244 294 1050 0 1600
Power stations
Dose/ μT/year 8550 30620 16320 140 0 55630
The data in table 5 lead to the following conclusions:
- The total annual dose may be computed accordingly: For a person working on power lines:
Dt = Do + Dd = 13520 + (8760 - 1600) x 0.13 = 14450 nT x h/year = 14mT x h/year (2) Therefore, the dose is 13 times higher comparing to a person not exposed
occupationally (1.14 mT x h/ year). For a person working on power stations:
Dt = Do + Dd = 55630 + (8760 - 1600) x 0,13 = 55560 μT x h/year = 56mT x h/year (3) So the dose is 50 times higher compared to a person not exposed occupationally.
- The total annual dose is practically determined only by the activities in the immediate vicinity of the power system and is stored in time intervals – these intervals, summed up represent 43% and 34% of the entire occupational duration for the power lines and the power stations, respectively. - A certain threshold effect may render obvious which assumes there needs to be established an hourly dose that describes a person’s exposure in an intense field area in a relatively short interval.
For a person working “in contact” with a power line, the value of the hourly dose is 155 μT x h, approximately 1200 times higher than the domestic hourly dose. For a person working “in contact” with a power station, the value of the hourly dose is 713 μT x h, approximately 5000 times higher than the domestic hourly dose. - In the case of the personnel working on power systems, both types of exposure and both biological effects emerge:
Storing higher doses of magnetic fields than an average person by means of repeated short-term exposures to high intensity magnetic fields in the occupational environment; Relatively short-term exposures to magnetic fields of intensity near or above the maximum allowed value in order to avoid biological effects [3].
The pathological consequences of the effects generated by the overexposure of live biological structures to electromagnetic fields have long represented an issue for bio-medical researchers and the manufacturers of devices based on generating and processing the microwaves (e.g. the radar systems on navy ships).
In the case of the irradiation with high power density microwaves, it is obvious that the immediate effect, consisting in warming the exposed area and eventually burns, is extremely harmful. A high-density level is considered able to generate a thermal effect, meaning to increase the temperature of the live biological structure with at least 0.1°C, warmth that the organism’s thermal regulating mechanisms cannot suppress.

JOURNAL OF MARINE TECHNOLOGY AND ENVIRONMENT
102
Low power electromagnetic fields do not generate perceptible warmth of the irradiated biologic layer or, if they do, the organism’s thermal regulating mechanisms can easily suppress it.
The low power electromagnetic radiations are constantly in our vicinity. Herein are included: stray fields from the cooking ovens or microwave industrial furnaces, radiations from medical devices with radiofrequency fields, military radar equipment on board ships, in ports or airports, meteorological and traffic departments, mobile phones, broadcasting stations and other sources of electromagnetic radiations. There are two main types of exposure to low power density electromagnetic fields: residential exposure and occupational exposure.
In the case of the residential exposure to electromagnetic fields, a person is subjected to it because of the actual conditions of the place he/ she inhabits, including the ship’s living spaces. The presence of electromagnetic fields from the electric system and working electric devices is a source of residential exposure, as well as the presence of power lines near inhabited spaces or the working radar systems onboard ships.
Characteristic to residential exposure is that the subject permanently comes under the influence of the medium power density electromagnetic fields while at home (in cabin), not even aware of his/ her exposure to radiation.
In the occupational exposure, the subject is carrying out his/ her occupation or duty. This includes the operators of devices whose operation relies on generating and working with electromagnetic fields: radar operators, personnel working near the transmitting parts of the telecommunications and television systems or handling the medical equipment based on the transmission of radio waves, etc. The occupational exposure may occur at higher levels of power density than the ones in the case of the residential exposure, but its action is limited in time. The subject is aware of the radiation, undertakes the occupational hazard of working in these conditions, and is instructed which safety rules to abide in order to minimize the consequences of the occupational exposure.
5. CONCLUSIONS Modern man does not stand a chance of inhabiting a different environment than the one
he had involuntary created for himself, an environment literally saturated with artificial electromagnetic radiations. REFERENCES [1]. Calotă S.V. et al. – Studiu privind expunerea profesională la radiaţii neionizante de înaltă
frecvenţă şi riscul pentru sănătate (Study on the occupational exposure to high frequency non-ionizing radiations and the health hazard), Institute of Public Health, 1998
[2]. Gary C. – Les effects biologiques des champ magnétiques. Que peut dire l`électricien à ce sujet?, Energetica, vol. 2-B, 1993
[3]. Ianoz M. – Biological and Health Ejfects of Electromagnetic Fields, Lausanne Polytechnic University, 2004
[4]. Mataluno G. – Le radiozioni elettromagnetiche a bordo, Rivista marittima, vol CXXI – December, 1988
[5]. Morgan D.– A handbook for EMC. Testing and measurement, Peter Peregninus Ltd. U.K., 1994
[6. Zamfirescu M. et al.– Efecte biologice ale radiaţiilor electromagnetice de radiofrecvenţă şi microunde (The biological effects of radiofrequency and microwave electromagnetic radiations), Medical, 2000
[7]. ***– Expunerea umană la câmpuri electrice şi magnetice de frecvenţă industrială (Human exposure to industrial frequency electric and magnetic fields), National standard project SR EN 50166-1, IRS, (corresponding to EN 50166-1/1994).

JOURNAL OF MARINE TECHNOLOGY AND ENVIRONMENT
103
IMPROVEMENT OF THE ENERGY EFFICIENCY OF VESSELS AS A MEASURE FOR THE REDUCTION OF GREENHOUSES GASES
EMISSION FROM SEA SHIPPING
1SIN MIHAELA, 2F.XAVIER MARTÍNEZ DE OSES
1,2Universitat Politècnica de Catalunya, Spania
As all we know, pollution is a serious actual problem that affects our society. Maritime transport is responsible of part of that pollution and with this purpose; measure to be taken in the logistical and maritime transport field is to reduce ships emissions. Air pollution is not the only problem, but greenhouse gas emissions too, mainly in the case of maritime transport pollutants as NOx and SOx gasses. This article tries to do a quick view on the last measures took by the International Maritime Organization (IMO) in order to reduce greenhouse gas emissions of shipping. An energy efficiency index for ships was created by the Marine Environment Protection Committee (MEPC) to improve their energy efficiency and then reduce fuel consumption. This index was developed in voluntary interim guidelines established in last sessions of the MEPC among 2009 and 2010, and can be applied to both new designs and ships in operation. Nowadays is just a voluntary measure that whatever ship-owner could take and verify, but until its approval there is for the moment no sanction if the results are not the expected ones by the guidelines. A description of the above mentioned guidelines will be exposed.
Keywords: energy efficiency of ships, greenhouse gas emission
1. INTRODUCTION In a highly environment conscious scenario, with an international regulation restricting
the emission levels from ships at member part ports, but possibly existing a more restrictive local law. The concern of fleet adaptation to the new requirements is not only technical but also economical and logistics. From one side there are different technical alternatives, affording to comply with the regulations in force. Without major changes on board, the owner can decide to use low sulfur content fuels, and can carry out slight and inexpensive modifications in the main engine, to reduce the levels of nitrogen oxides.
But what is posing this paper also, is the balance between the need to use oil derivates with an everyday better quality, due to environmental questions, and at the same time that the economic balance would be positive. In the long term the environment factor has an elevated cost for the producer (now the owner), and finally that cost will be charged in the following commercial chain step, the costumer. In the other hand and mainly in coastal navigation, maybe in the future it would be possible the establishment of new regulations controlling and penalizing high rates of CO2 emissions, question not dealt in MARPOL yet, but that is the base on which different protocols for climate change are based. In 2008, the expert group from the International Maritime Organization, modified their previous estimations on the world merchant fleet, fixing them in 1,120 millions of tons of CO per year, 2

JOURNAL OF MARINE TECHNOLOGY AND ENVIRONMENT
104
produced by the worlds fleet, what means the 4.5% of the planet emissions. In the opinion of this working group, this figure is three times the contribution that was initially estimated, and of course those were not accounted in the objectives to fight against the climate change. The report “Maritime transport and the climate change challenge TD/B/C.I/MEM.1/2, from United Nations, pointed out that other pollutants coming from the transport activity, and specifically navigation, are increasing quicker than the expected CO2 growing (estimated in an additional 30% in 2020), like the soot and sulfur oxides, that would increase more than the 30% in the next decade. Both pollutants, contribute to the acid rain and to a wide variety of breath diseases, including the lung cancer. In fact the World Health Organization (2005) has established in 60,000 the number of deaths every year due to the pollution derived from the world’s merchant fleet.
Despite this situation, most of the world administrations have sub estimated up to now, the marine traffic contribution to the greenhouse effect. European Union, has minimized this fact confirming that this one, contributes to less than 2% of the total CO , emissions, a reason because those never have been contemplated in the national estimations. In this sense we should keep in mind, that recently there are exploring initiatives to correct the previous situation, being one example the recommendations contained in the proposal of report “On the strategic objectives and recommendations for the maritime transport policy in the EU towards 2018” (EU Parliament 2010), complaining that the Copenhagen Summit on Climate Change could not agree conclusions to reduce emissions of maritime navigation, but introducing valid criteria to reach that objective. So we can conclude that the contribution of Maritime transport on the greenhouse gases emission, has been recognized by the worlds’ administrations, and this is going to put a superior pressure on the owners to begin to use cleaner fuels and more efficient engines. In the other hand it is possible that EU could include the shipping industry within the CO emissions market.
2
2 2. CONTRIBUTION OF MARITIME TRANSPORT TO GREENHOUSE
EFFECT GASES CO emissions from ships are directly proportional to the bunker consumption, for all
uses, id est propulsion, auxiliary services, heating or others. The consumption estimates and then the emissions of greenhouse effect gases, varies in the time, because the better definition of scenarios and the improvement on the modeling techniques. In the following graphic, it is showed that the estimations on the greenhouse effect gases coming from maritime sector represent from the 1.6% to 4.1% of the world CO2 emissions coming from bunker burning. IMO estimations for the international maritime transport from 2007 to 2050, are pointing an increase from 2.4% to 3%.
2
Graphic 1: Range of typical CO2 efficiencies for various cargo carriers in g CO2 per Ton and kilometer. Source based on IMO study on greenhouse gases emissions from
maritime traffic 2008 (OMI 2008).
JOURNAL OF MARINE TECHNOLOGY AND ENVIRONMENT
105
Maritime transport represented in 2005, the 10% of the greenhouse gases emissions of the transport sector, which were headed by the road transport with the 73% of total contribution (IEA 2005).
In absolute figures the greenhouse gases emissions coming from maritime transport are very important, in relative terms show that ships are much more efficient than other transport modes, implying a specific consumption per ton of freight carried much lower than the other modes. CO is created in all the combustion processes and thus is produced in big quantities in the maritime transport, being those directly proportional to the fuel consumption. Maybe the best way to reduce CO emissions would be to improve the energetic performance of ships.
2
2
In order to reduce greenhouse gas (GHG) emission from international shipping, the Marine Environment Protection Committee (MEPC) from IMO proposed take some measures involving the design phase of the new ships, helping to improve their fuel efficiency too. The measures had been reviewed in a number of sessions from the MEPC and almost approved in the last one, the 61st session of the MEPC, celebrated on September 2010 in London.
In the 59st session (July 2009) of the IMO’s Marine Environment Protecion Committee (MEPC) a package of interim and voluntary technical and operational measures was agreed as one of the first steps of the implementation of the Energy Efficiency Design Index (EEDI) for the objective of greenhouse gas emissions reduction. These measures were used as trial purpose until they were refined in the new session of the MEPC (60st session on March 2010).
The measures include: - Interim guidelines on the method of calculation, and voluntary verification, of the
Energy Efficiency Design Index for new ships: To stimulate innovation and technical development of the elements those have influence in the energy efficiency of a ship in its design phase.
- Guidance on the development of a Ship Energy Efficiency Management Plan, for new and existing ships and a guidelines for voluntary use of the Ship Energy Efficiency Operational Indicator for new and existing ships, which enables operators to measure the fuel efficiency of a ship.
The 61st session of the MEPC (September 2010) was due to finalize technical aspect of the EEDI and agree the detail of its mandatory application, along with the Ship Energy Efficiency Management Plan (SEEMP), but proponents do not obtained the consensus approval.
So, the mandatory energy efficiency rules could be adopted for new ships, this year but measures come into force in 2013. If made mandatory, ship-owners could be penalized if they do not meet minimum fuel efficiency standards for their vessel type. It’s a process needed for adoption to be possible at the next MEPC meeting next July (2011).
3. DESCRIPTION OF THE PACKAGE OF TECHNICAL AND OPERATIONAL REDUCTION MEASURES FOR SHIPS AGREED BY MEPC 59
If the entire fleet of the world trade applies the measures proposed to increase the
efficiencies that involve reducing fuel consumption, save money and decrease environmental impacts for individual ships, the results will be very importants for the reduction of global carbon emissions.

JOURNAL OF MARINE TECHNOLOGY AND ENVIRONMENT
106
3.1 GUIDANCE FOR THE DEVELOMPMENT OF A SHIP ENERGY EFFICIENCY MANANGEMENT PLAN (SEEMP) The purpose of the SEEMP is to establish a mechanism for a company or a ship to
improve the energy efficiency of a ship’s operation. SEEMP should be adjusted to the main characteristics and need of individual companies and ships in order to develop the performance of ongoing environmental of its vessel in the way that any onboard administrative burden will be minimum.
APPLICATION
The SEEMP try to improve a ship’s energy efficiency through four steps plus an extra voluntary one:
1) PLANNING:
Is the most important stage of the SEEMP that includes the current status of the ship energy usage and the future improvement of ship energy efficiency.
a. The ship – Specific measures:The method to improve ship efficiency depends of the ship type, cargoes, routes and other factors, because not all measures can be applied to all ships or under different operating conditions. In the first place, the specific measures for the ship should be identified as a list to be implemented.
b. The company – Specific measures: It is recommended that a company also establish an energy management plan for its fleet to reach the most improvement expected. And a good coordination between stakeholders (operators, ports and traffic management service) should exist.
c. The human resource development: To provide the necessary training to the personnel both on shore and on board is another important thing.
d. The goal setting: It’s a voluntary part, It serves as signal of reference to be conscious and to improve the measures for the energy efficiency.
2) IMPLEMENTATION a. Establishment of an implementation system: It is necessary to have a
system where tasks and assignation of them to qualified personnel are defined.
b. Implementation and record-keeping: The planned measures should follow the implementation system. Record-keeping for the implementation of each measure is beneficial for self-evaluation at a later stage.
3) MONITORING The energy efficiency of a ship should be monitored by an international standart method
as the Energy Efficiency Operational Indicator (EEOI) that was developed by the Organization for operational ships for collecting data. A Rolling Average Index of the EEOI values may be calculated to monitor energy efficiency of the ship over time.
4) SELF-EVALUATION AND IMPROVEMENT
This is the final phase of this plan and should produce meaningful feedback for the coming first stage (of the improvement cycle). In this part the effectiveness of the planned

JOURNAL OF MARINE TECHNOLOGY AND ENVIRONMENT
107
measures and implementation is evaluated to find out which procedures of ship energy management should be developed.
Another step, but just for voluntary application, is the reporting or review of the results of this manangement plan:
5) VOLUNTARY REPORTING / REVIEW Some shipowners/operators may wish to make public the results of the actions they
have taken in their SEEMP and how have impacted in their ship efficiency. Some national Administrations, may wish to recognize their efforts. GUIDANCE ON BEST PRACTICES FOR FUEL-EFFICIENT OPERATION OFSHIPS
In the search of efficiency there are many parties envolved and should consider all apropiate measures in their operations, both individually and collectively, to get it.
‐ Some Fuel-Efficient Operations: a) Improved voyage planning: Differents software tools are available for
planning the optimum route to improve the efficiency and executing voyages too
b) Weather routing: This parameter has a high potential for efficiency saving on specific route. It may also increase fuel consumption for a given voyage.
‐ Speed optimization: This can produce significant savings. It means the speed at which the fuel used per ton-mile is at a minimum level for that voyage. Possible adverse consequences of slow speed operation should be taken into account (increased vibration and soot). May need to be taken into account that it is necessary to coordinate arrival times in port with the availability of loading/discharge tools, berths, etc.
‐ Optimized shaft power: Operations at constant shaft rpm can be more efficient than continuously adjusting speed through engine power. The selection of the propeller may be decisive for the design of the ship and the use of rudder and heading control systems (autopilot) are more effective for the bridge team and can achieve significant fuel savings. A hull maintenance and a cleaner and more polish propeller may not be forgotten in order to increase fuel efficiency.
‐ Optimized ship handling: There are many factors that influence the optimization of the ship. Trim and ballast may be varied for achieve different load levels for which the vessel operates at different speeds.
‐ Waste heat recovery: A system to use thermal heat losses from the exhaust gas for either electricity generation or additional propulsion is used too.
‐ Fuel type: Use of emerging alternative fuels may be considered as a CO2 reduction method but availability will often determine the applicability.
‐ Other measures: The development of computer softwares for the calculation of fuel consumption, the establishment of emissions to optimize operations, and the establishment of goal for improvement and tracking of progress may be considered.
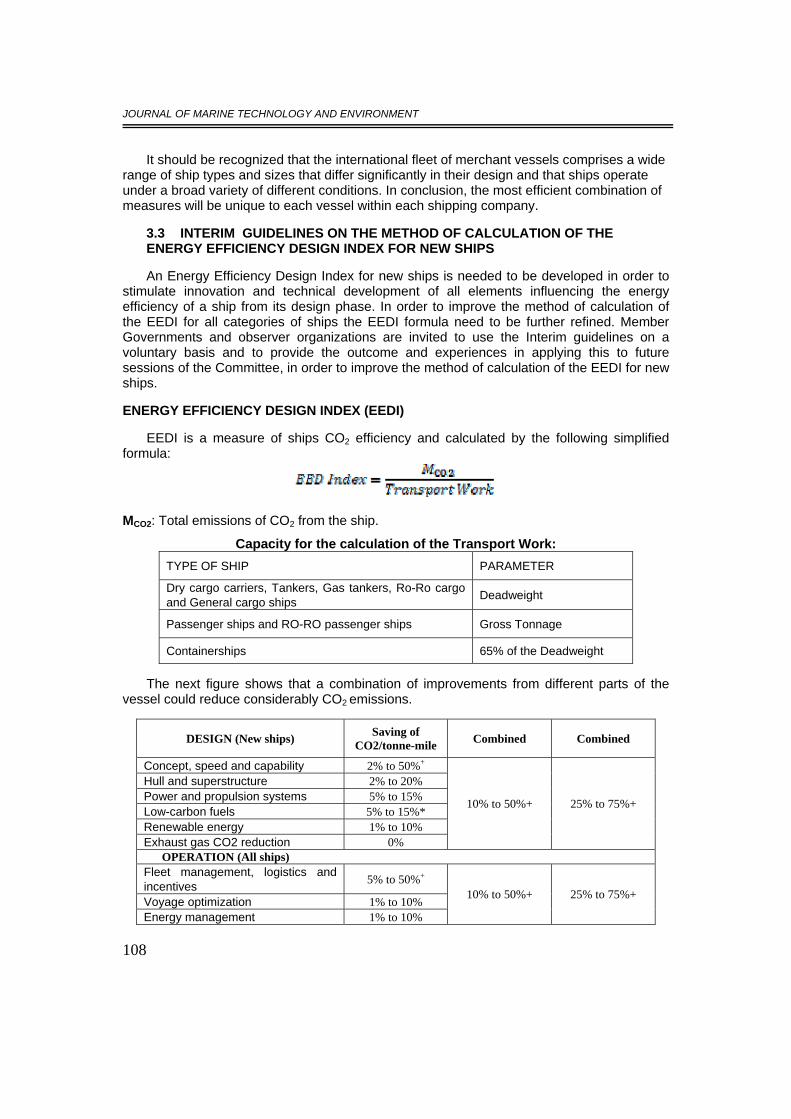
JOURNAL OF MARINE TECHNOLOGY AND ENVIRONMENT
108
It should be recognized that the international fleet of merchant vessels comprises a wide range of ship types and sizes that differ significantly in their design and that ships operate under a broad variety of different conditions. In conclusion, the most efficient combination of measures will be unique to each vessel within each shipping company.
3.3 INTERIM GUIDELINES ON THE METHOD OF CALCULATION OF THE ENERGY EFFICIENCY DESIGN INDEX FOR NEW SHIPS
An Energy Efficiency Design Index for new ships is needed to be developed in order to
stimulate innovation and technical development of all elements influencing the energy efficiency of a ship from its design phase. In order to improve the method of calculation of the EEDI for all categories of ships the EEDI formula need to be further refined. Member Governments and observer organizations are invited to use the Interim guidelines on a voluntary basis and to provide the outcome and experiences in applying this to future sessions of the Committee, in order to improve the method of calculation of the EEDI for new ships.
ENERGY EFFICIENCY DESIGN INDEX (EEDI)
EEDI is a measure of ships CO2 efficiency and calculated by the following simplified formula:
MCO2: Total emissions of CO2 from the ship.
Capacity for the calculation of the Transport Work: TYPE OF SHIP PARAMETER
Dry cargo carriers, Tankers, Gas tankers, Ro-Ro cargo and General cargo ships Deadweight
Passenger ships and RO-RO passenger ships Gross Tonnage
Containerships 65% of the Deadweight
The next figure shows that a combination of improvements from different parts of the vessel could reduce considerably CO2 emissions.
DESIGN (New ships) Saving of CO2/tonne-mile Combined Combined
Concept, speed and capability 2% to 50%+
Hull and superstructure 2% to 20% Power and propulsion systems 5% to 15% Low-carbon fuels 5% to 15%* Renewable energy 1% to 10% Exhaust gas CO2 reduction 0%
10% to 50%+ 25% to 75%+
OPERATION (All ships) Fleet management, logistics and incentives 5% to 50%+
Voyage optimization 1% to 10% Energy management 1% to 10%
10% to 50%+ 25% to 75%+

JOURNAL OF MARINE TECHNOLOGY AND ENVIRONMENT
109
Potential reductions of CO2 emissions by using existing technology and practices + Reductions at this level would require reductions of operational speed. * CO2 equivalent, based on the use of LNG. Source: Second IMO GHG Study 2009
3.4 GUIDELINES FOR VOLUNTARY USE OF THE SHIP ENERGY EFFICIENCY OPERATIONAL INDICATOR (EEOI)
The Committee indentified and developed the mechanisms needed to achieve the
limitation or reduction of GHG emissions from international shipping and they also developed a methodology to describe the GHG efficiency of a ship in terms of GHG emission indicator for that ship.
These guidelines explain the concept of an indicator for the energy efficiency of a ship in operation, expressed as the CO2 emitted per unit of transport work and are used to assist shipowners, ship operators and parties concerned in the evaluation of the performance of their fleet with regard to CO2 emissions. CO2 emitted from ships is directly related to the consumption of bunker fuel oil, the EEOI can also provide useful information on a ship’s performance with regard to fuel efficiency.
The objectives of the Guidelines for the use of EEOI are: How a ship’s CO2 performance should be measured How the index could be used to promote low-emission shipping in order
to help limit the impact of shipping on global climate change.
FORMULA
The Energy Efficiency Operational Indicator is defined as the ratio of mass of CO2 (M) emitted per unit of transport work.
DEFINITIONS
Fuel Consumption: FC all fuel consumed at sea and in port or for a voyage period in question.
Distance sailed: The actual distance sailed in nautical miles for the voyage or period in question.
Voyage: The period between the point of departure from a port to the point of departure from the next port.
Ship and Cargo types: The guidelines are applicable for all ships performing transport work.
‐ Ships: Dry cargo carriers, Tankers, Gas tankers, Containerships, Ro-Ro cargo ships, General cargo ships, Passenger ships including Ro-Ro passenger ships.
‐ Cargo: All gas, liquid and solid bulk cargo, general cargo, containerized cargo (including the return of empty units), break bulk, heavy lifts, frozen and chilled goods, timber and forest products, cargo carried on freight vehicles, cars and freight vehicles on ro-ro ferries and passengers.
JOURNAL OF MARINE TECHNOLOGY AND ENVIRONMENT
110
ESTABLISHING ENERGY EFFICIENCY OPERATIONAL INDICATOR (EEOI)
EEOI should represent the energy efficiency of the ship operation in a period which represents the overall trading pattern of the vessel.
Steps to follow:
1) Define the period for which the EEOI is calculated 2) Define data sources for data collection 3) Collect data 4) Convert data to appropriate format 5) Calculate EEOI
GENERAL DATA RECORDING AND DOCUMENTATION PROCEDURES
The collection of data from ships should include the distance travelled, the quantity and type of fuel used, and all fuel information that may affect the amount of carbon dioxide emitted.
MONITORING AND VERIFICATION
Elements for establishing procedures for monitoring could include:
Identification of operations/activities with impact on the performance Identification of data sources and measurements that are necessary, and
specification of the format Identification of frequency and personnel performing measurements Maintenance of quality control procedures for verification procedures
The results could be used as indicators of the System’s success and reliability and to correct actions or for the operation’s improvement.It is recommended that monitoring of an EEOI be carried out by shore staff, utilizing data from existing required records.
ROLLING AVERAGE INDICATOR
The rolling average indicator is a tool for the ship energy efficiency management and should be calculated using the minimum period of time or a number of voyages that is statistically relevant.
DATA
For voyage or period data on fuel consumption/cargo carried and distance sailed in a continuous sailing pattern should be collected.
3.5 INTERIM GUIDELINES FOR VOLUNTARY VERIFICATION OF THE ENERGY EFFICIENCY DESIGN INDEX
In order to promote uniform use of the Interim Guidelines on the method of calculation of the energy efficiency design index for new ships a method for voluntary verification of the energy efficiency design index for new ships was developed.

JOURNAL OF MARINE TECHNOLOGY AND ENVIRONMENT
111
PROCEDURES FOR VERIFICATION
Voluntary EEDI verification should be conducted on two stages:
1) Preliminary verification at the design stage
An application for the verification and an EEDI Technical File with the necessary information (the relevant characteristics of the ships engine, the propulsion system and the calculated value of the Attained EEDI) for the verification and other relevant documents should be submited to a verifier by a shipowner.
2) Final verification of the attained EEDI at sea trial
Prior to the sea trial, a shipowner should submit the application for the verification of EEDI together with the final displacement table and the measured lightweight.
The verifier should attend and confirm:
Propulsion and power supply system Draft and trim Sea conditions Ship speed Shaft power of the main engine
The shipbuilder should develop power curves obtained as a result of the sea trail and the estimated power curves at the design stage. In case differences are observed, the Attained EEDI should be recalculated.
ISSUANCE OF THE EEDI VERIFICATION REPORT
The verifier should issue the Report on the Preliminary Verification of EEDI after it verified the attained EEDI at design stage and after the sea trial.
4. CONCLUSIONS The interim guidelines that were exposed in this article are just for voluntary users
because there are not already in force and therefore who applies these guidelines could not be sanctioned if he doesn’t reach the established results. These rules are expected to be in force in the next session of the MEPC.
A singular ship will have a little significant improvement of his efficiency energy and less contribution to the environment pollution but if all the international fleet takes the same measures then, a valuable contribution to reducing global carbon emissions will become aware. Even so, international shipping is not the only responsible of the environment pollution and GHG emission, but else it has just 2,7 % of the CO2 global emission (global CO2 emission graphic) so, it is necessary that the other activities or sectors that have an important impact on the global environment take measures in order to do something about the global warming and greenhouse gases emission.
In the next figure, it can be seen the CO2 emissions of the different sectors and activities of the global level:
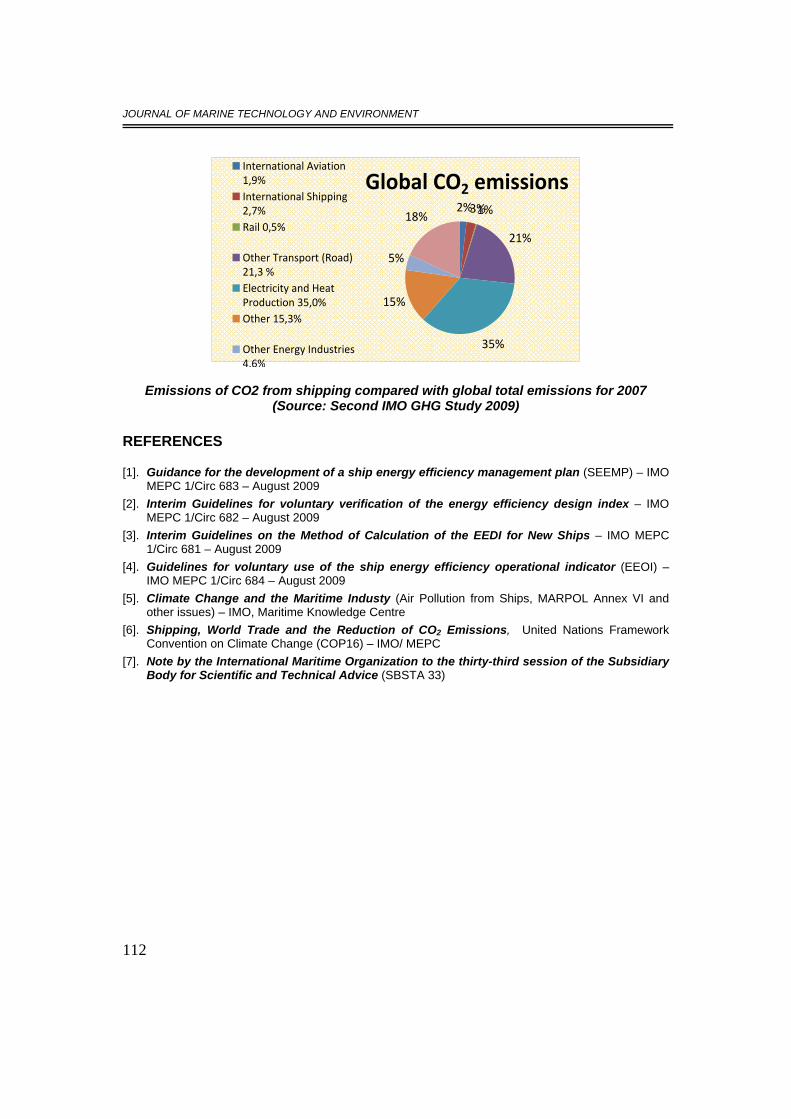
JOURNAL OF MARINE TECHNOLOGY AND ENVIRONMENT
112
Global CO2 emissions2%3%1%
21%
35%
15%
5%
18%
International Aviation1,9%International Shipping2,7%Rail 0,5%
Other Transport (Road)21,3 %Electricity and HeatProduction 35,0%Other 15,3%
Other Energy Industries4,6%
Emissions of CO2 from shipping compared with global total emissions for 2007
(Source: Second IMO GHG Study 2009)
REFERENCES
[1]. Guidance for the development of a ship energy efficiency management plan (SEEMP) – IMO MEPC 1/Circ 683 – August 2009
[2]. Interim Guidelines for voluntary verification of the energy efficiency design index – IMO MEPC 1/Circ 682 – August 2009
[3]. Interim Guidelines on the Method of Calculation of the EEDI for New Ships – IMO MEPC 1/Circ 681 – August 2009
[4]. Guidelines for voluntary use of the ship energy efficiency operational indicator (EEOI) – IMO MEPC 1/Circ 684 – August 2009
[5]. Climate Change and the Maritime Industy (Air Pollution from Ships, MARPOL Annex VI and other issues) – IMO, Maritime Knowledge Centre
[6]. Shipping, World Trade and the Reduction of CO2 Emissions, United Nations Framework Convention on Climate Change (COP16) – IMO/ MEPC
[7]. Note by the International Maritime Organization to the thirty-third session of the Subsidiary Body for Scientific and Technical Advice (SBSTA 33)

JOURNAL OF MARINE TECHNOLOGY AND ENVIRONMENT
113
EMISSIONS OF GREEN HOUSE GAS OF SHIPS IN PORT IN JOHOR PORT(MALAYSIA)
1SULAIMAN O., 2SHAMILA A., 3HANIS WAHAB M., 4SAMAN AB., 5SAHARUDDINA.H.
1,5Maritime Technology Department, University Malaysia Terengganu, 2,3,4 Marine
Technology Department, University Teknologi Malaysia
Emission of GHG is linked to ship machineries. Ship traffics increase in port has possible increase of gaseous emissions and particulate pollutants in port. Present emission index in port areas are estimated from surrounding industries and airports. Ship is about port and port is about ships, therefore emission in port is predominantly from ships machineries. This study investigated the associated problem of green house gas in Johor Port. This paper present result of computation of emission from port related activities emissions estimation. The result can be use as part of Green House inventory data base.)
Keywords: GHG, Emissions, Inventory, Vessels, Johor Port, power
1. INTRODUCTION In the era of logistics and global supply chains, the fast and efficient movement of goods
is an economic imperative. Investments are currently being deployed to modernize and expand ports and intermodal facilities in order to accommodate growing cargo volumes. Growing ship traffic and machineries in ports will add to local air quality problems and global climate change risks unless ship and machineries emissions are further controlled [172]. Air pollution from shipping activities is a growing problem that is drawing increased attention around the world. Local and regional air quality problems associated with ship and machineries gaseous emissions are a concern because of their public health impacts. Exposure to air pollution is linked to a host of health risks including premature death, cancer, heart and respiratory diseases.
Air pollutant emissions in port currently remain unregulated. The inventories of air pollutants have usually been made on a port mainly for general administrative purposes and public information. Systematic data published for the use of the scientific community is rather scarce [4, 9] Therefore this study attempts to investigate the emissions of gaseous and particulate pollutants in Johor Port.
This study focuses on the emissions concentration of pollutants consisting parameters like SO2, NO2, CO, CO2 and PM10 carried out in Johor Port. Emissions sources can come from a lot of categories, so this study will only focus on board vessel source categories. The emission parameters will be monitored using portable air sampler and toxic gas probe. In order to compile the air emission inventory and to estimate the emission rates, mathematical equation from the Unites States Environmental Protection Agency will be used [2, 14].
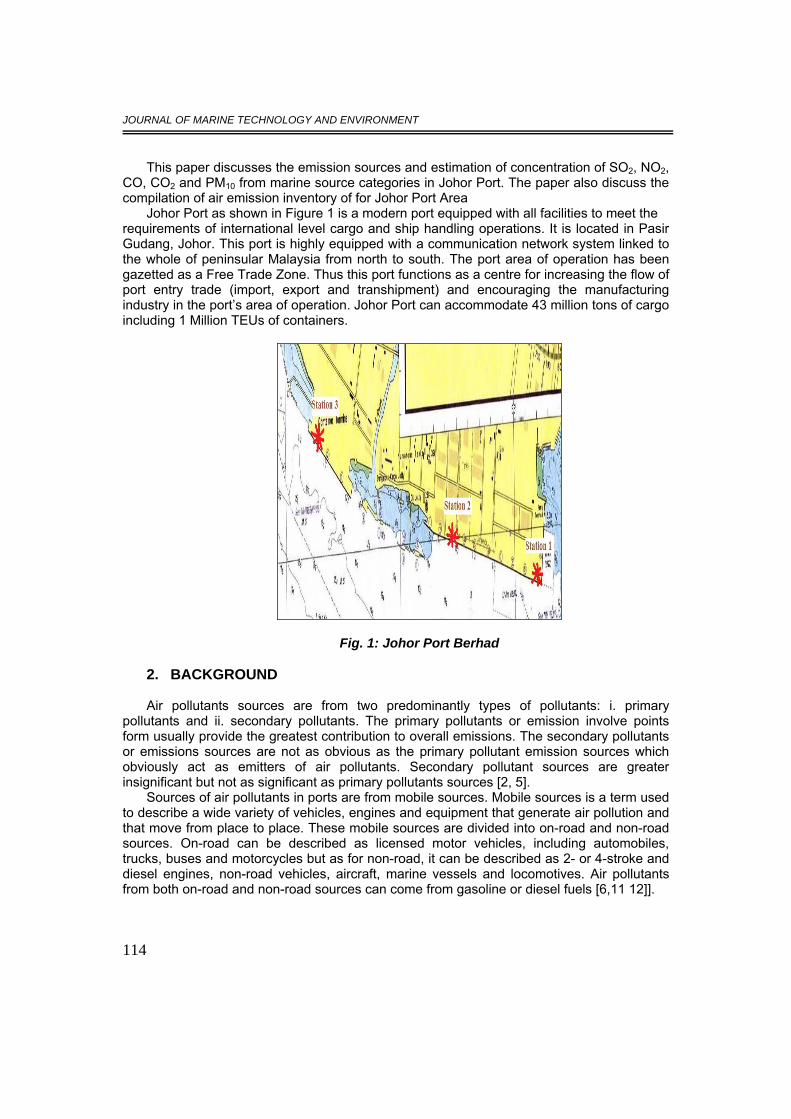
JOURNAL OF MARINE TECHNOLOGY AND ENVIRONMENT
114
This paper discusses the emission sources and estimation of concentration of SO2, NO2, CO, CO2 and PM10 from marine source categories in Johor Port. The paper also discuss the compilation of air emission inventory of for Johor Port Area
Johor Port as shown in Figure 1 is a modern port equipped with all facilities to meet the requirements of international level cargo and ship handling operations. It is located in Pasir Gudang, Johor. This port is highly equipped with a communication network system linked to the whole of peninsular Malaysia from north to south. The port area of operation has been gazetted as a Free Trade Zone. Thus this port functions as a centre for increasing the flow of port entry trade (import, export and transhipment) and encouraging the manufacturing industry in the port’s area of operation. Johor Port can accommodate 43 million tons of cargo including 1 Million TEUs of containers.
Fig. 1: Johor Port Berhad 2. BACKGROUND
Air pollutants sources are from two predominantly types of pollutants: i. primary
pollutants and ii. secondary pollutants. The primary pollutants or emission involve points form usually provide the greatest contribution to overall emissions. The secondary pollutants or emissions sources are not as obvious as the primary pollutant emission sources which obviously act as emitters of air pollutants. Secondary pollutant sources are greater insignificant but not as significant as primary pollutants sources [2, 5].
Sources of air pollutants in ports are from mobile sources. Mobile sources is a term used to describe a wide variety of vehicles, engines and equipment that generate air pollution and that move from place to place. These mobile sources are divided into on-road and non-road sources. On-road can be described as licensed motor vehicles, including automobiles, trucks, buses and motorcycles but as for non-road, it can be described as 2- or 4-stroke and diesel engines, non-road vehicles, aircraft, marine vessels and locomotives. Air pollutants from both on-road and non-road sources can come from gasoline or diesel fuels [6,11 12]].

JOURNAL OF MARINE TECHNOLOGY AND ENVIRONMENT
115
Port emissions are generated by marine vessels and by land-based sources at ports. Marine emissions come primarily from diesel engines operating on ocean going vessels, harbour vessels, dredges and other vessels operating within a port area (Ang and Olson, (2004). Emissions of gaseous and particulates contribute significantly to the total emissions from the transportation sector [5, 6]. Key compounds emitted from the shipping sector are sulphur dioxide (SO2), nitrogen dioxide (NO2), carbon oxides (CO, CO2), particulate matters (PM) (Eyring et al., 2007). Normally, there are two types of engines on a ship: the main engines propel the vessel while navigating and manoeuvring arre powered by the auxiliary engines that supply electricity for other functions [7, 9].
As shown in Figure 2, numbers of vessel entering Johor Port decreases from year 2007 to 2008.Emission inventory is a list of the amount of pollutants from all sources entering the air in a given time period. The boundaries of the area are fixed [9, 10]. An emissions inventory is also best understood as an estimate of the quantity of pollutants that a group of sources produce in a given area, over a prescribed period of time (ENVIRON International Corporation, 2008).
Fig.2: Johor Port Vessel Statistic year 2007 until mid 2009 3. DATA ACQUISITION PROCESS
The monitoring of emission parameters of pollutant such as sulphur dioxide (SO2),
nitrogen dioxide (NO2), carbon oxides (CO, CO2) was conducted using Gray Wolf Direct Sense TOX PPC Kit and TSI-IAQ Calc equipment. Particulate matter contributes less than 10 μm (PM10) was monitored using Mini Vol Portable Air Sampler. The frequency of sampling was carried out once a month and it is conducted until three sets of data are collected. Three sampling points were chosen on each port. The criteria of sampling points consider the emissions from vessels, is placed as near as possible to the vessels emissions sources in port area and lastly the sampling points that were chosen are installation are made on the on the pier/wharf/dock.

JOURNAL OF MARINE TECHNOLOGY AND ENVIRONMENT
116
For ocean going vessel, emission specific quantification, the emissions estimation methodology can be graphically broken down into steps which are used to estimate the ocean-going vessel emissions which can be use to compile air emission inventory (see Figure 3). Survey data is provided by Johor Port authority according to what are the information needed for this study and the technical literature consist of emission factors, load factors and fuel correction factors follows United States Environmental Protection Agency (U.S. EPA, 1999) and Entec 2007.
Fig. 3: Ocean-Going Vessels Emission Estimation Flow Chart
In this study, basic equations that will be use to estimate harbour vessels emissions is:
Emission (E) = MCR x Act x LF x EF x FCF (1)
Where;E = emission in (g/year) but converted to (tons/year) by dividing by 453.6 g/pound and 2000 pounds/ton, MCR = maximum continuous rated engine power, (kW), Act = activity, (hr/year),LF = load factor, (unitless),EF = emission factor, (g/kW.hr),FCF = fuel correction factor
4. RESULTS AND DISCUSSIONS Below are the marine air emission quantification studies, the study of air pollutants
concentration in Johor Port which is compared with Recommended Malaysian Air Quality Guidelines (RMAQG). The result of emission estimation for each pollutant in Johor Port area from port activities source are presented.
4.1. AIR POLLUTANTS CONCENTRATION IN JOHOR PORT Based on the study of air pollutants concentration in Johor Port, RMAQG was used in
this study for standards comparison purposes. As for gaseous concentration (SO2, NO2, CO, CO2) one hour averaging time was used while for particulate (PM10) 24 hour averaging time are used. The summaries are shown in Table 1.

JOURNAL OF MARINE TECHNOLOGY AND ENVIRONMENT
117
Table 1: Summary Table of Sampling Result *Gaseous not detected
From this table, it is observed that the highest NO2 detected in sampling station 2 with a
concentration of 0.18 ppm exceeding the RMAQG limits of 0.17 ppm by 5.9 percent while other gaseous at station 1, 2 and 3 are still within the RMAQG limits. Basically, the limits of NO2 at station 2 exceeded due to heavy operation (cargo loading and unloading) during the sampling work.
4.2. EMISSIONS INVENTORY The 2007 and 2008 emissions for Johor Port are summarized in this section. Emissions
estimate for each pollutant are presented by mode which is at ‘manoeuvring’ and ‘hotelling’. Table 2 presents emissions estimate for year 2007 and Table 3 presents the emission estimate for year 2008.
Table 2: Year 2007 Emissions Estimate by Mode in Johor Port (kT yr-1)
Table 3: Year 2008 Emission Estimate by Mode in Johor Port (kT yr-1)

JOURNAL OF MARINE TECHNOLOGY AND ENVIRONMENT
118
Based on the inventory presented above, manoeuvring mode emits less emission than hotelling mode due to the activity period. For vessel manoeuvring in Johor Port, the average duration for manoeuvring period (inbound and outbound) are 4 hours while what makes hotelling emits greater emission are due to the average hotelling period of 9.6 hours which are used in computing the inventory which is far longer than the manoeuvring mode period.
Main reduction in the number of vessel are due to economic downturn starting in mid 2008 which affect the business of shipping worldwide and the numbers of vessels are closely related to the amount of emission that are emitted. They are indirectly, affect the amount of emission sources from seaport that are emitted within port area as shown in Table 2 and 3. The decreasing of seaport total emission by approximately 10 percent in the year 2008 is influenced by the reason stated above and does not relate to any emissions reduction approach. Perhaps, the amount of emission will continue to grow when the economy starts to improve if none reduction approach are being considered.
Emission sources concentration of sulphur dioxide (SO2), nitrogen dioxide (NO2), carbon oxides (CO, CO2) and particulate matter contribute less than 10 μm (PM10) in port were obtained. From the results obtained and based on the comparison with Recommended Malaysian Air Quality Guidelines (RMAQG), NO2 concentration surprisingly exceed the limit by 5.9 percent in sampling station 2 while other gaseous at station 1, and 3 are still within the recommended guidelines. The results clearly shows that major pollutants contributor in Johor Port are oxides of nitrogen (NOx) and sulphur dioxide (SO2) with a percentage value of 60 and 28 percent for ship hostelling and manoeuvring mode. Other pollutants contribute are below than 10 percent for both modes.
Based on the results obtained from sampling, it can be seen that NO2 produce some high values of concentration even though two from station 1 and 3 are still below the limits. There is concern about this. As for station 2, the NO2 values exceeds the limits mainly are caused by pack vessels in operation is high NO2 values were recorded during sampling work, during cargo loading and unloading heavy operation period. Apart from that, gaseous emission like SO2 and CO has very low concentration values low emission. The biggest factor causing such value is because of strong wind which depletes the concentration abruptly. Besides, the equipment used are not very sensitive to gaseous substance during outdoor sampling. Theoretically, SO2 and CO should be at certain value when there is an emission. As for particulates and carbon dioxide, the value recorded does not differ as much and the particulates are well below the limits of 24-hour averaging time when compared to RMAQG.
BENFIT OF EMISSON QUANTIFICATION
Emission database of engine characteristics of naval and commercial vessels would be
invaluable for IMO growing data for technical code for new machineries and harmonization of emission control laws in the pipelines. This study will record the emission data from ships plying Malaysian ports and the result is useful for port control operation limit definition, regulation on ship machineries. The research will input in deduction of emission impact to the community, engine manufacturing technical code and emission input to decision support for retrofitting systems for existing ships. This pilot study would leads to develpment of:

JOURNAL OF MARINE TECHNOLOGY AND ENVIRONMENT
119
i. Comprehensive data base system for emision released from ship. ii. Models for ship emision inventory in Malaysia and Europe in order to meet national
communication to FCCC to deal with challenge pose by data. iii. The formulation of rules, regulations, guidelines and policies for emision regulation
from ships. iv. The development of local expertise for national, regional and international centre of
reference. v. Meeting IMO deadline for Energy Efficiency Design Index (EEDI), Ship Energy
Efficient Management Plan (SEEMP) and Ship Energy Efficiency Operational indicator (SEEOI).
In addition to the above emission quantification will:
i. Input into worldwide focus of machineries exhaust gas emission law by IMO and possible local implementation
ii. Input into emission limits requirement for adoption of development and adaptation to new energy and retrofitting technology
iii. Provide solution anticipated to maintenance of ship life cycle at average of 25 years iv. Regulatory preparedness for control of NOx and Sox, HC, CO and particulate
matter v. Consideration for fuel use, design and operational issues.
Green house gas release is very linked to machinery combustion. Inseperability of
energy, environment and technology couple with reactive challenge of climate change, GHG is putting presure to all industry to find new source of energy or retrofiting system to conserve energy. This effort also required monitoring of emision from the ship to impliment new IMO regulation in support of multdimentional effort to preserve the planet for the right of future generation. The research is highly needed for decision support by regulators, machineries manufacturers, IMO port control, ship aquisation, insurance and other ship and shiping operation. The project will lead the effort for other developing nation to follow road to new cleaner technolofy opportunity and compliance rich in doctrine of sustanability. Emsion quantification will help prety well with environmetal and regulatory agencies and will complement their effort to prevent health hazard and environmetal damages.
5. CONCLUSIONS
Based on the study conducted, several conclusions can be made as follows:-
The Johor Port ocean-going vessels emission inventory shows that manoeuvring mode contributes NOx(60%), VOC(2%), CO(5%), SO2(27%), PM10(3%) and PM2.5(3%) while hotelling mode contributes NOx(60%), VOC(2%), CO(4%), SO2(28%), PM10(3%) and PM2.5(3%). NOx emissions from OGVs are relatively high because most marine engines operate at high temperature and pressures without effective reduction technologies. Besides, SO2 emissions are high because of the high average sulphur content (2.5%) of marine fuels used by most OGVs within Johor Port boundaries.
Given uncertainties in all emissions inventories, the best estimate for carbon dioxide (CO2) of the base year of 2007-2008 in Johor Port, is within the bounded range of 500,000-750,000 kilo tons per year (kT yr-1).

JOURNAL OF MARINE TECHNOLOGY AND ENVIRONMENT
120
REFERENCES
[1] Ang, J. and Olson (2004). Port Emission Inventories and Modelling of Port Emissions forUse in State Implementation Plans (SIPs). White Paper No. 3. [2] Bradstreet, J. W. (2004). Handbook of Hazardous Air Pollutants. Crest Publishing House. [3] Corbett, J. J. and Fishbeck, P. S. (1997). Ship Air Emissions: Estimation and Regulation. Science, Vol. 278, No. 5339, Pg 823-824. [4] Corbett, J. J., Wang, C., Winebrake, J. J. and Green, E. (2007). Allocation and Forecasting of Global Ship Emissions. Clean Air Task Force. [5] Corbett, J. J. (2004). Verification of Ship Emission Estimates with Monitoring Measurements to Improve Inventory and Modelling. California Air Resources Board and California Environmental Protection Agency. [6] Dong, C., Huang, K. L., Chen, C. W., Lee, C. W., Lin, H. Y. and Chen, C. F. (2002). Estimation of Air Pollutants Emission from Ships in the Kaohsiung Harbor Area. AAQR- 2002-03. [7] Eyring, V., Corbett, J. J., Lee, D. S. and Winebrake, J. J. (2007). Brief summary of the impact of ship emissions on atmospheric composition, climate and human health. International Maritime Organization. [8] Entec UK Limited (2007). Ship Emissions Inventory-Mediterranean Sea. Final Report. ENVIRON International Corporation (2008). Port of Oakland 2005 Seaport Air Emissions Inventory. Air Sciences. [9] Friedrich, Heinen, F., Kamakate, F. and Kodjak, D. (2007). Air Pollution and Greenhouse Gas Emissions from Ocean-going Ships. The International Council on Clean Transportation. [10] Gupta, A. K., Patil, R. S. and Gupta, S. K. (2002). Emissions of Gaseous and Particulate Pollutants in a Port and Harbour Region in India. Kluwer Academic Publishers. Environmental Monitoring and Assessment 80: 187-205. [11] Poirier, M. B. (2007). Inventory and Literature Review of Mobile Source Air Toxics in the Rochester Metropolitan Statistical Area. Center for Environmental Information. [12] Saxe, H. and Larsen, T. (2004). Air pollution from ships in three Danish Ports. Elsevier Ltd.Atmospheric Environment, Vol. 38, Issue 24, Pg. 4057-4067. [13] Stern, A. C., Boubel, R. W., Turner, D. B. and Fox, D. L. (1984). Fundamentals of Air Pollution. Academic Press, Inc. 2nd Edition. [14]U.S. EPA (1999). National Emission Inventory Documentation and Data. Final Version 3.0

JOURNAL OF MARINE TECHNOLOGY AND ENVIRONMENT
121
SUBSYSTEM RISK AND RELIABILITY ANALYSIS FOR COLISSION AVERSION: A CASE OF PROPULSION FAILURE CONTRIBUTION
FACTOR
1SULAIMAN O., 2KADER A.S.A., 3SAHARUDDIN A.H.
1,3Maritime Technology Department, University Malaysia Terengganu, 2Marine Technology Department, University Teknologi Malaysia
The world of water support our planet and its vast resources need to be fully utilized to benefit human activities in a sustainable manner. Inland water transportation represent the cleanest mode of transportation, this benefit indicate potential rise for coastal transportation, choice towards mitigation of climate change, meeting logistics for short sea and supply vessel operation for growing large vessel, expanding deep-sea operation and floating production units. Coastal water transportation operation attract high probability and consequence of accident which make reliability requirement for the design and operability for safety and environmental protection very necessary. This paper discuss stakes in design and operability in coastal water and mitigation option that can be provided to prevent coalition through analysis of propulsion failure subsystem risk and reliability modelling leading to collision accident scenario. One way to ensure reliability of the design work is to analysis subsystem level scenario. This paper present result of propulsion failure subsystem scenario analsysis for Malaysia River Langat.
Keywords: risk, reliability, marine, vessel, waterway
1. INTRODUCTION
Marine transportation service provide substantial support to various human activities, its important has long been recognized with cross boundary regulation activities by International Maritime Organization (IMO) through regulatory lesson that could be instrumental to the quest for recent environmental regulation to cut air polution for advancement of human civilization. Thus, most IMO regulatory work are not mandatory on coastal transportation, the clear cut advantage of inland transportation over other mode of transportation including short sea service for evolving deep sea activities, mitigation of recent GHG environmental problem, make it one of the candidate for alternatives renewable option of doing things and this forseen potential rise in use coastal transportation in the near future. The criticality of transportation operation within the coastline and prohibitive nature of occurrence of accident due to high consequence and losses that comes with it has equally made it imperative and necessary to design sustainable, proactive based, efficient and reliable coastal transportation system that take into consideration environmental aspect of navigation channel, vessels and other integrative purpose of water resources in a system based holistic model, since a sustainable inland water system cannot stand a alone (Guedes, 2001&IMO, 2004).

JOURNAL OF MARINE TECHNOLOGY AND ENVIRONMENT
122
Waterways accident falls under scenario of collision, fire and explosion, flooding, grounding. Collision carries the highest percentage more frequent and it is cause by (Roeleven et al 1995): loss of propulsion
i. loss of navigation system ii. other accident from the ship or waterways.
This paper discuss result of reliability propulsion failure model to prevent, and control collision and protect the environmental which is proponents of consequence of collision where assessment, evaluation of risk and goal base life cycle model will account for elements that will optimize design, existing practice, innovative entity and facilitate decision support for policy accommodation for evolving coastal transportation regime. Figure 1 show the main stakeholder that are more likely involve in transporation and subsequent decision for case of collision.
Fig.1: Collsion Risk
2. SUBSYSTEM ANALYSIS: THE CASE OF COLLISION EMANATING FROM LOSS OF PROPULSION
Scenario and components of risk analysis should start with system definition that define functional hazard analysis, preliminary safety assessment and system safety assessment, this could be preceded with torough system functionality and standard matching. Figure 2 give a simple description of propulsion system.
Fig. 2: Propulsion system descriptions

JOURNAL OF MARINE TECHNOLOGY AND ENVIRONMENT
123
Prediction of the reliability of the propulsion and steering gear of a ship is done by combinatory analysis of qualitative system description that consider the propulsion, the steering and the electrical power network, which are combined into the entire system with quantitative analysis of Propulsion failure. The analysis could also include maintainability to reduce the failure rate. The propeller is key part of engine motion mechanic, propeller failure can lead to immobilization of whole propulsion system navigation system and consequential uncontrollability of ship motion. The propeller is design to transform rotational energy transmitted through propeller shaft into a pressure difference over the propeller blades which accelerate and maintain the speed of the vessel. Figure 3 depict major cause of machineries failure leading to propulsion failure (Calhill, 1983 & IMO, 2006).
Fig.3: Cause of machinery failure
The analysis towards selection of propulsion system should begin with system
description follow by matching of functional and regulatory requirement. Functional requirement of propulsion system should include(Murphy, 1996):
i. Operational components: normal speed, manoeuvring operation condition,
life period of operation, period for maintenance, period in harbour, full power sailing time, period for port operation, period in ice sailing, crew for maintenance band planning.
ii. System components: main diesel engine, clutch, gear, shaft line, controllable pitch propeller and spare parts tool.
iii. Both series and parallel probability model can be incorporate as depicted in the following equation

JOURNAL OF MARINE TECHNOLOGY AND ENVIRONMENT
124
= 1-(1- ) + (1- ) +.....+ (1- ) = ...(for parallel structural part) (2.1) and
= 1+ .....+ = .... (For series part) (2.2)
A typical system selection could be a diesel electric unit following system components where by operation order require that the two diesel engine could be used when high power is required and they gear can be decouple there is need for is maximum power.
Table 1: Risk accept acceptability
Quantification Serenity Occurrence Detection RPN =SXOXD
current failure that can result to death failure, performance of mission
Catastrophic(10) 2 10 200
failure leading to degradation beyond accountable limit and causing hazard critical (7) 2 5 70 controllable failure leading to degradation beyond acceptable limit Major(5) 4 2 20 nuisance failure that do not degrade system overall performance beyond acceptable limit Minor(1) 6 2 12
Risk = S x O x D (2.3)
HAZID and HAZOP involve identifying hazard that can result to propulsion failure, While HAZOP deal with combination of causes and measure that deal which identified hazards. HAZID associated with propeller failure could facilitate using guideword related to “what if”. FMEA and FMECA involves inductive method to determine equipment functionality, failure mode, cause of failure consequence, impact, reliability, safety, cost and quality of system components. FMEA uses standardized form that account for qualitative measure of failure rate and severity level. FMECA is advance FMEA where critically of failure is quantitatively account for reliability and maintainability of the system. Analysis of FMCEA should provide answer to system description, possible failure and mode of failure, cause of failure effect of failure, severity of consequence and reliability data, specify assessment method for detection status and mitigation of unwanted effects towards reduction and elimination ((Kite 1996, Ahvejarhi, 2001 & Emi, 1997). Criticality quantification can be done by applying: C= ∑ .T (2.4)

JOURNAL OF MARINE TECHNOLOGY AND ENVIRONMENT
125
Where: E= Failure consequence probability of failure mode i , L = occurrence likelyhood of failure mode i, Number of failure mode of the item which fall under particular severity class, T=Duration of application of mission place.
Frequency calculation through Fault tree analysis (FTA) could model top down differentiation of event to branches of member that cause them or participated in the causal chain action and reaction, it is a systematic holistic inclusion of components involved in particular events or failure like propulsion failure, or loss of navigation function. Cumulative FTA analyses leads to scenario generation using minimum cut set cause modelling where highly probable cut set will satisfy the condition that :(Frequency of a minimal cut set) > (Total accident frequency)/4
This towards limit definition. Logic combinatory of gate couple with series and parallel
system arrangement is used to determine the probability. In this case the probability for propulsion failure for the main cut set is 0.0324 as show though alternative relex software model.
Fig. 4: Fault three analyses for propulsion failure

JOURNAL OF MARINE TECHNOLOGY AND ENVIRONMENT
126
Fig. 5: Fault three analysis for sub contribution factor to propulsion failure
Subsystem consequence analysis can be done through event three analysis ( ETA), this involve inductive binary method that describe the relation between initiating event and the events that describe the possible consequence. Here, each level in the chain of event leading to consequence consist of two mutually exclusive dichotomy whose probability of success or failure is estimated through leading branches.
Fig. 6: Event three analyses for propulsion failure consequence
Events probability can be calculated and each effect should be deal with according to
potential of occurrence for major accident. For accident consequence leading to major damage the the probability is calculated as ( 0.4 x 0.5 x 0.9).

JOURNAL OF MARINE TECHNOLOGY AND ENVIRONMENT
127
The result of frequency and consequence probability analysis is observed from influence diagram, the result is checked with risk index shown in Table 3 and 4, this is followed by risk acceptability criteria under ALARP principle.whose analysis is followed with cost control option using cost of averting fatality index (ICAF).
Table 2:Frequency accepatbilty
FREQUENCY CLASSES QUANTIFICATION
Very unlikely once per 1000 year or more likely
Remote once per 100- 100 year
Occasional once per 10- 100 year
Probable once per 1- 10 years
Frequent more often than once per year
Table 3: Consequence acceptability Serenity Quantification Occurrence Detection RPN
catastrophic
current failure that can result to death failure, performance of mission 1 2 9
critical
failure leading to degradation beyond accountable limit and causing hazard 3 4 7
Major
controllable failure leading to degradation beyond acceptable limit 4 6 5
Minor
nuisance failure that do not degrade system overall performance beyond acceptable limit 7 8 2
The consequence could further be broken down into effect for ship, human safety, oil
spill and ecology.
3. ALARP PRINCIPAL, RISK ACCEPTABILITY CRITERIA AND RISK CONTROL OPTION
Risk acceptability criteria established in many industries and regulations to limit the risk. Risk is never acceptable, but the activity implying the risk may be acceptable due to benefits safety, fatality, injury, individual and societal risk, environment, economy. perception regarding acceptability.The rationality may be debated, societal risk criteria are used by increasing number of regulators( Skong 2005 & Soars, 2001).

JOURNAL OF MARINE TECHNOLOGY AND ENVIRONMENT
128
Fig. 7: Influence diagram
This followed by influence diagram risk control option and sustainability balancing of cost
benefit towards recommendation for efficient, reliable and effective decision. The influence diagram shown in figure showing the frequency of accidents involving N or
more fatalities may be established in similar ways as individual or societal risk criteria. The FN criteria are given as straight lines in a log-log plot, with inclination N-1 or N-2. For risks in the Unacceptable/ Intolerable risk region, the risks should be reduced at any cost. The risks should be reduced to a level .as low as reasonably practicable. (ALARP). Within this range Cost Effectiveness Assessment (CEA) or Cost Benefit Assessment may be used to select reasonably practicable risk reduction measures.
4 RISK ANALYSIS CONSIDERATIONS
In addition to a sound process, effective models and a robust risk framework, there are other considerations that should factor into the design of an effective risk assessment process. These items include the use and availability of data, the need to address human factors topics of interest, and approaches to treating uncertainty in risk analysis.
Data required for risk work includes information on traffic patterns, the environment
(weather, sea conditions, and visibility), historical and current operational performance data, and human performance data. The models intended for use are highly dependent on appropriately selected databases that accurately represent the local situation and the effectiveness of the models, however, will reflect any data limitations. Therefore creative procedures are required to develop the requisite data and relationships, the model by using expert judgments, worldwide data and data from other areas (e.g., the North Sea), making assumptions about the similarity of operations in the concerned area elsewhere, and making assumptions about how behaviour in one aspect of operations (e.g., company management quality) and/or one parameter (e.g., loss of crew time) correlates with another area (e.g., operations safety) (Kite, 1996).
Care is required with the use of worldwide data, however, as much of those data are
influenced by location or environmental conditions. As for mechanical failure they are independent of location. In fact, however, mechanical failures often depend on factors like duty cycles or maintenance procedures, which, in turn, depend on the particular service in which the vessel is employed.

JOURNAL OF MARINE TECHNOLOGY AND ENVIRONMENT
129
On the other hand, however, electronic access to worldwide casualty data such as the Paris MOU, U.K. Marine Accident Investigation Board (MAIB), and IMO Port State Detention databases makes possible access to worldwide casualty statistics that were not available in 1996. In addition, a large number of small-scale, localized incidents occur that, with few exceptions, are not tracked by marine safety authorities. American Bureau of Shipping has begun an effort to identify precursors or leading indicators of safety in marine transportation Expert judgments can be used to fill gaps and augment weather data; however, even when attempts are made to minimize errors from expert judgments, the data are inherently subject to distortion and bias. Thus, with an extensive list of required data, there are limits that available data can place on the accuracy, completeness, and uncertainty in the risk assessment results.
Uncertainty is always part of system behaviour, two common uncertainties are: aleatory
uncertainty (the randomness of the system itself) and epistemic uncertainty (the lack of knowledge about the system). Aleatory uncertainty is represented by probability models that give probabilistic risk analysis its name, while epistemic uncertainty is represented by lack of knowledge concerning the parameters of the model. In the same manner that addressing aleatory uncertainty is critical through probabilistic risk analysis, addressing epistemic uncertainty is critical to allow meaningful decision-making. Simulation offers one best option to cover extreme case uncertainty beside probability(Pate, 1996).
Human Factors Modelling consider distributive, large-scale systems with limited physical
oversight, assessing the role of human and organizational performance on levels of risk in the system is important; especially as such error is often cited as a primary contributor to accidents. Expert judgments give judgments about the likelihood that failures would occur in specific situations can be use to quantify human reliability input in risk process, where evaluation of baseline escort scenario, and comparing the baseline to a set of scenarios of interest. Timelines, roles, and response scenarios can also be analysed. A flexible critical path and slack analysis can be performed, as input to the system simulation. [9, 14].
A safety culture questionnaire which assesses organizational and vessel safety culture and climate, can be administered to provide quantitative and qualitative input to the safety culture analysis. The results of the human factors modelling and analysis can be a set of response timelines for escorted and unescorted scenarios, as well as for various scenarios of interest. Analysis of the results can provide important standalone information such as bottlenecks, hazards, redundancy, and response timelines. The results can also provide important human factors input to the system simulation.
Alternative to a system-wide scenario based probabilistic risk assessment which offers deep knowledge of escort requirements and tug performance is simulation that permits analysis of the system-wide impacts of various risk reduction interventions or tug escort scenarios [17]. Where a geographic analysis of the results is possible, meaning risk reduction interventions and tug escort alternatives can be considered from a geographic and system-wide perspective, an analysis not possible with a scenario-based analysis. Such a system-wide representation of risk would be quite helpful in studying risk with and without tug escorts, or in studying a pre-positioning question with varying tug response times and distances.

JOURNAL OF MARINE TECHNOLOGY AND ENVIRONMENT
130
5. CONCLUSIONS
Following irreparable and economic loses of traditional reactive action against accident and incessant system failure, institutions are evolving with proactive top down system based approach that account for all the risk associated with system lifecycle protect the environment, prevent accident and those that cannot be prevented and protected should be control under risk based design and operability platform. Development of novel method to address each contributing factor to accident is very important. The potential for within Inland water is great and there is need to implement IMO rule making model to mitigate accident risk.
Collision risk is much common and propulsion failure is one of the contributing factors. Preceding system description and hazard identification, Fault tree and event three is utilized to determine risk index of propulsion failure and interpolation of the index into ALARP influence diagram provide decision support for cost control option towards sustainable, reliable, efficient propulsion technology design and operability signature. The method provide valuable and effective decision support tool for application of automated safety analysis that can be used to facilitate inclusion of reliability and safety as part of the iterative design processes for new and innovative marine engineering designs, eventually resulting in safer, more reliable products.
REFERENCES [1] Ahvejarvi H. (2001).Failure Mode Effect Analysis of automation systems of ships. Marine
Technology. 14:4, 1977, 367-374 [2] Cahill R.A. . Collisions and Their Causes. Fairplay Publications, London, England, 1983 [3] Emi, H. et al . An Approach to Safety Assessment for Ship Structures, --- ETA analysis of engineroom fire, Proceedings of ESREL ’97, International Conference on Safety and Reliability, Vol. 2, 1997 [4] Guedes Soares, C., A. P. Teixeira, Risk Assessment in Maritime Transportation Reliability Engineering and System Safety, 74:3, 299-309.2001 [5] International Convention for the Safety of Life at Sea, (SOLAS), International Maritime Organization (IMO), Consolidated Edition, London, 2004 [6] International Maritime Organisation (IMO): Amendments to the Guidelines for Formal Safety
Assessment (FSA) for Use in the IMO Rule Making Process, MSC – MEPC.2/Circ 5 (MSC/Circ.1023 – MEPC/Circ.392), 2006
[7] Kite-Powell, H. L., D. Jin, N. M. Patrikalis, J. Jebsen, V. Papakonstantinou. Formulation of a Model for Ship Transit Risk. MIT Sea Grant Technical Report, Cambridge, MA, 96-19.1996
[8] Murphy, D.M. & M.E. Paté-Cornell.,The SAM Framework: A Systems Analysis Approach to Modeling the Effects of Management on Human Behavior in Risk Analysis, Risk Analysis, 16:4,
501-515, 1996 [9] Pate-Cornell, M.E., Uncertainties in Risk Analysis: 6 Levels of Treatment. Reliability Engineering and System Safety. 54:2-3, 95-111,1996 [10] Roeleven, D., M. Kok, H. L. Stipdonk, W. A. de Vries, Inland Waterway Transport: Modeling the Probabilities of Accidents. Safety Science. 19:2-3, 191-202.1995 [11] Skjong, R., Vanem, E. & Endersen, O. (2005): Risk Evaluation Criteria, SAFEDOR Report of marine accident, 2005 [12] Soares, N. C., A. P. Teixeira. (2001). Risk Assessment in Maritime Transportation. Reliability
Engineering and System Safety. 74:3, 299-309, 2001 [13] Stamatis. A.H. Failure Mode Effect Analsysis from theory to execution. ASQ. pg. 112-169, 2004

JOURNAL OF MARINE TECHNOLOGY AND ENVIRONMENT
131
STADY-STATE OPERATING MODES OF ROTARY POSITIVE DISPLACEMENT PUMPS AND MOTORS.
PART I. OPERATING PROCESSES MODELLING
TOMOV PEICHO
Department of Ship Power Plants by N. Y. Vaptsarov Naval Academy, Bulgaria
The paper presents a mathematical model which describes the operating modes of rotary positive displacement pumps and motors. The model is worked out by considering the commutative processes taking place in the chambers formed by the moving and the stationary parts of the machine, which in particular can be pistons and barrels. The obtained analytic dependency enables the assessment of the performance parameters variability during steady-state operating mode of the hydraulic unit.
Keywords: Commutation, Rotary Hydraulic Machines, Pressure and Flow Fluctuations
1. INTRODUCTION The principle of operation of positive displacement pumps and motors is discrete, so the
displacement chambers formed by the pistons and barrels are connected in succession to the high and low pressure ports. Thus a local process of transient pressure equalization takes place in the chambers. The transient process induces periodic fluctuations in the low and high pressure regions of the displacement pump or motor. "Dynamic variation" under steady-state mode occurs, which is the major object of the research. This paper is a natural extension of the theoretical and experimental work elaborated in [6], [7] and [8].
2. MODELLING THE OPERATING PROCESSES
The classical steady-state operating mode of a hydraulic displacement pump or motor takes into account only the so called geometric displacement variation. It has the following form:
( )( )1
,
;)(
⎪⎩
⎪⎨⎧
Δ=
=
pWM
WQ
ϕ
ωϕ
where: Q -flow; M -theoretic torque; W -displacement; ω -angular speed;
pΔ -pressure drop.
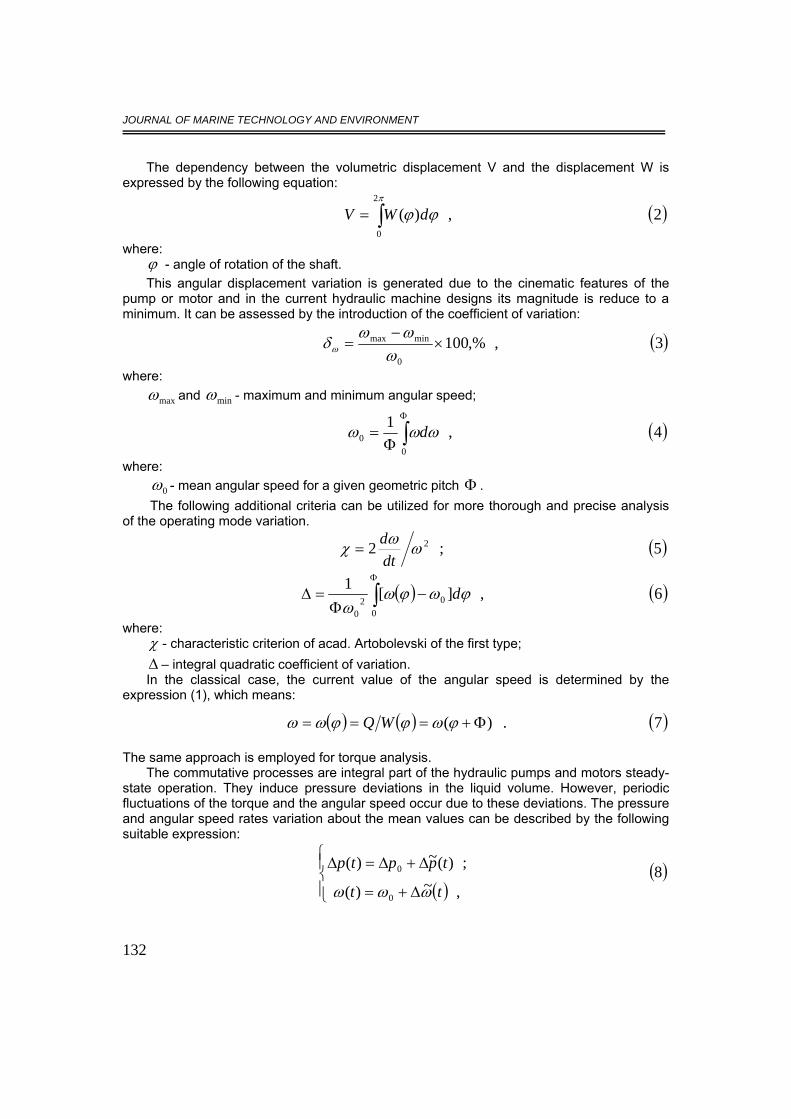
JOURNAL OF MARINE TECHNOLOGY AND ENVIRONMENT
132
The dependency between the volumetric displacement V and the displacement W is expressed by the following equation:
( )2,)(2
0∫=π
ϕϕ dWV
where: ϕ - angle of rotation of the shaft. This angular displacement variation is generated due to the cinematic features of the
pump or motor and in the current hydraulic machine designs its magnitude is reduce to a minimum. It can be assessed by the introduction of the coefficient of variation:
( )3,,%1000
minmax ×−
=ωωω
δω
where:
maxω and minω - maximum and minimum angular speed;
( )4,1
00 ∫
Φ
Φ= ωωω d
where: 0ω - mean angular speed for a given geometric pitch Φ . The following additional criteria can be utilized for more thorough and precise analysis
of the operating mode variation.
( )5;2 2ωωχdtd
=
( ) ( )6,][1
002
0∫Φ
−Φ
=Δ ϕωϕωω
d
where: χ - characteristic criterion of acad. Artobolevski of the first type; Δ – integral quadratic coefficient of variation. In the classical case, the current value of the angular speed is determined by the
expression (1), which means:
( ) ( ) ( )7.)( Φ+=== ϕωϕϕωω WQ
The same approach is employed for torque analysis. The commutative processes are integral part of the hydraulic pumps and motors steady-
state operation. They induce pressure deviations in the liquid volume. However, periodic fluctuations of the torque and the angular speed occur due to these deviations. The pressure and angular speed rates variation about the mean values can be described by the following suitable expression:
( )( )8
,~)(
;)(~)(
0
0
⎪⎩
⎪⎨⎧
Δ+=
Δ+Δ=Δ
tt
tpptp
ωωω

JOURNAL OF MARINE TECHNOLOGY AND ENVIRONMENT
133
In these equations, the mean value is designated with "0" subscript and the symbol "~" designates the term, which expresses the value fluctuations. This fluctuation term incorporates also the deviations caused by cinematic features of the pump or motor ( dtdϕω = ).
2.1. PUMP OPERATING MODES The equation, which describes the shaft motion, has the following form:
[ ] )9(,)(1fE
P
MtpWMJdt
d−Δ−=
ω
where:
PJ -generalized moment of inertia;
EM -driving torque;
fM - nonlinear drag in the hydraulic pumps and motors. In the vast majority of the cases, an asynchronous motor is employed as a primer mover.
In this case, the linear approximation of the driving torque would have the following form [3]:
( ) ( )10,nc
cnEE MMM
ωωωω
ω−−
==
where:
nM - nominal torque;
cω - "synchronous" angular speed. We can rewrite this equation by taking into account (8) and (10):
( )11,~)~(0
0 ωωω
ωωωΔ−=
−Δ+−
= BMMMnc
cnE
where:
;.00 constMM
nc
cn =
−−
=ωωωω
nc
nMB
ωω −= - coefficient.
The equation describing the drag contains one linear term and a fluctuation term. It has the following form:
( ) ( ) ( )12,~~0 tpWctcMpWccM ffff Δ+Δ+=Δ+≈ ωω
where:
;.000 constpWccM ff =Δ+= ω c -coefficient of active resistance;
fc - drag coefficient. By substituting expressions (8), (11) and (12) in (9) and rewriting it, we get the following
form:

JOURNAL OF MARINE TECHNOLOGY AND ENVIRONMENT
134
( )[ ] ( )13.~~~~1~000 pWccMppWBM
Jdtd
ffp
Δ−Δ−−Δ+Δ−Δ−=Δ ωωω
The mean rate in a steady-state condition is defined as a sum of the following terms:
( )14,0000 =−Δ− fMpWM By assuming that this mean rate is equal to zero the expression (13) will contain only terms describing the performance parameters fluctuation and it can be rewritten in the form:
( )15)(~)1()(~)(~
tpcWtcBdt
dJ fp Δ+−=Δ++Δ ωω
This expression (15) represents first order nonhomogeneous linear differential equation and it is solved under "zero" initial conditions t=0 and 0~ =Δω . After converting the expression by means of the Laplace Transformation it can be rewritten in the following form:
( ) ( ) (16;)(~~1 11 spKsST Δ=Δ+ ω )
(17) where:
( )cBJT p +=1 ,s – time constant;
cBcW
K f
+
+−=
)1(1 - gain coefficient;
S –Laplace complex variable. It is obvious that the output, which is the angular speed ( )sω~Δ , relates aperiodically to
the input, which is the pressure . )(~ spΔ 2.2. MOTOR OPERATING MODE
The equation describing the shaft motion has the following form:
[ ] ( )18,)(1fc
M
MMtpWJdt
d−−Δ=
ω
where:
cM - load torque. The general load torque dependency [3] is:
( ) ( )19,),(~),( 0 ωϕωωϕ cccc MMMM Δ+==
0cM is a mean value and it is determined from the static characteristics of the motor under specified constant angular speed of the shaft. It is expressed in the following form:
( )∫Φ
Φ=
00 ,1 ϕωϕ dMM cc
The following load torque dependencies are also commonly put into practice:
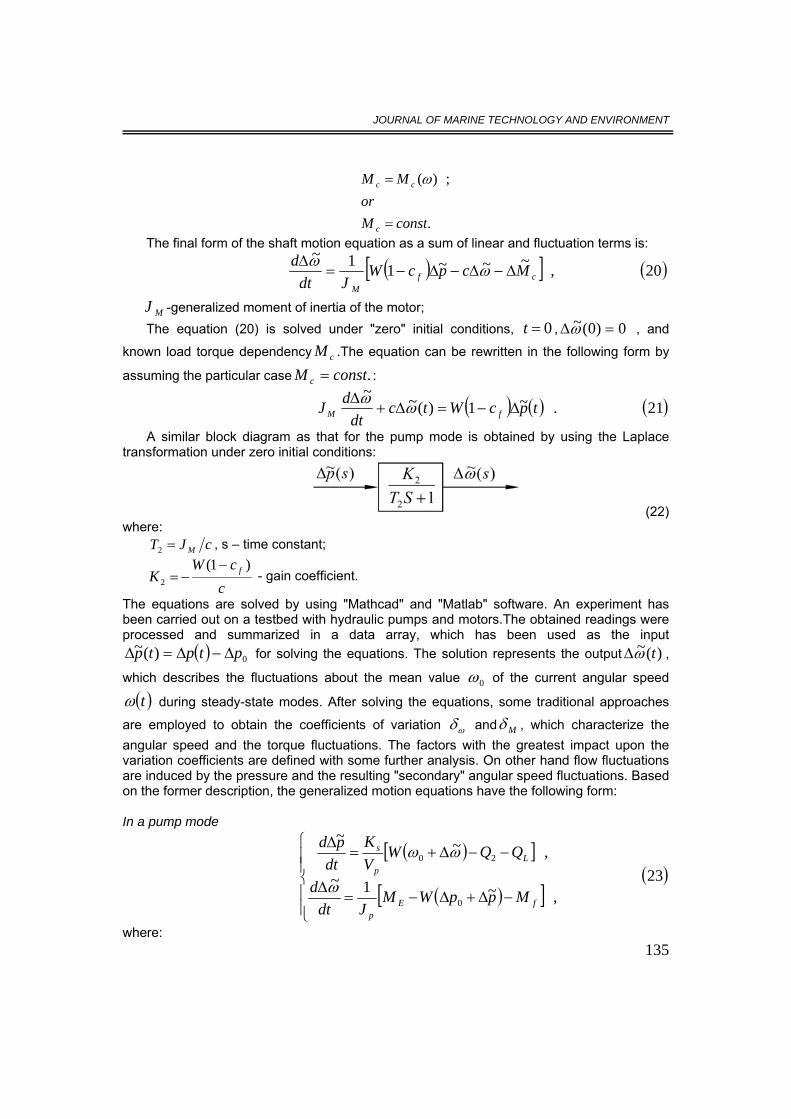
JOURNAL OF MARINE TECHNOLOGY AND ENVIRONMENT
135
.
;)(
constMor
MM
c
cc
=
= ω
The final form of the shaft motion equation as a sum of linear and fluctuation terms is:
( )[ ] ( )20,~~~11~cf
M
McpcWJdt
dΔ−Δ−Δ−=
Δ ωω
MJ -generalized moment of inertia of the motor; The equation (20) is solved under "zero" initial conditions, 0=t , 0)0(~ =Δω , and
known load torque dependency .The equation can be rewritten in the following form by
assuming the particular case : cM
.constM c =
( ) ( ) ( )21.~1)(~~tpcWtc
dtdJ fM Δ−=Δ+Δ ωω
A similar block diagram as that for the pump mode is obtained by using the Laplace transformation under zero initial conditions:
(22) where: cJT M=2 , s – time constant;
ccW
K f )1(2
−−= - gain coefficient.
The equations are solved by using "Mathcad" and "Matlab" software. An experiment has been carried out on a testbed with hydraulic pumps and motors.The obtained readings were processed and summarized in a data array, which has been used as the input
( ) 0)(~ ptptp Δ−Δ=Δ for solving the equations. The solution represents the output )(~ tωΔ ,
which describes the fluctuations about the mean value 0ω of the current angular speed
( )tω during steady-state modes. After solving the equations, some traditional approaches
are employed to obtain the coefficients of variation ωδ and Mδ , which characterize the angular speed and the torque fluctuations. The factors with the greatest impact upon the variation coefficients are defined with some further analysis. On other hand flow fluctuations are induced by the pressure and the resulting "secondary" angular speed fluctuations. Based on the former description, the generalized motion equations have the following form: In a pump mode
( )[ ]
( )[ ]( )23
,~1~
,~~
0
20
⎪⎪⎩
⎪⎪⎨
⎧
−Δ+Δ−=Δ
−−Δ+=Δ
fEp
Lp
s
MppWMJdt
d
QQWVK
dtpd
ω
ωω
where:

JOURNAL OF MARINE TECHNOLOGY AND ENVIRONMENT
136
sK - adiabatic bulk modulus;
2Q - flow at the pump outlet;
- leakage loss; LQ
EM - driving torque (applied to the pump shaft). In a motor mode
( )[ ]
( )[ ]( )24
,~1~
,~~
0
01
⎪⎪⎩
⎪⎪⎨
⎧
−−Δ+Δ=Δ
Δ−Δ+−=Δ
fCM
LM
s
MMppWJdt
d
QWQVK
dtpd
ω
ωω
where:
1Q - flow at the motor inlet. The obtained systems of equation for pump and motor modes describe the
interconnected pressure and angular speed fluctuations during stady-state modes and the resulting fluctuations of the torque and the flow through the hydraulic machine. They can be solved directly or as described obove by taking into account only the variation terms. REFERENCES [1]. Asherman I. – Izmerenie davleney v aksialno-porshnevoy mashine s celue optimizacie razpredelitelnovo uzla. V-ta Nacionalna konferenciya po hidravlika i pnevmatika Kazanlak, 1988, s.311 321.; [2]. Gösele R. – Volumenstromschwankungen hydrostatischer Pumpen. Vergleich von Theorie und praktischen Verhalten. O+P (Ölhydraulik und Pneumatik) 23, 1979, Nr.5, 371-376. [3]. Minchev N., V. Jivkom, K. Enchev, P. Stoyanov – Teoriya na mashinite I mechanizmite. D. I. "Technika". S., 1991; [4]. Olems L. – Investigations of the temperature behaviour of the piston cylinder assembly in axial piston pumps. Inernational Journal of Fluid Power. 1 (2000) 1 pp. 27-38.; [5]. Spielmann M. – Zustandsmodelle hydraulischer Antriebselemente.Forschungsbericht Nr.15/96. Meβ-, Steuer- und Regelungstechnik, 1-23.; [6]. Todorov T., P. Tomov, M. Vasilev – Izsledvane na proces komutaciya pri aksialno-butalni rotacionni hidromashini. "trans & MOTAUTO'06". Volume 2, 25-28 Oct. 2006, Varna, c.78,78A-B.; [7]. Tomov P., M. Nikolova. – Izsledvane na komutacionnite procesi pri obemni rotacionni hidromashini. Sp. "Mechanika na Mashinite" 83. Seriya FH. Kniga 4, TU-Varna, 2009,s.19-22.. [8]. Tomov P., T. Todorov, M. Vasilev – Eksperimentalno izsledvane na komutacionnite procesi pri aksialno-butalni rotacionni hidromashini. Morski nauchen forum "Korabna energetika". Tom 1, Varna, 2006, c25-31.;
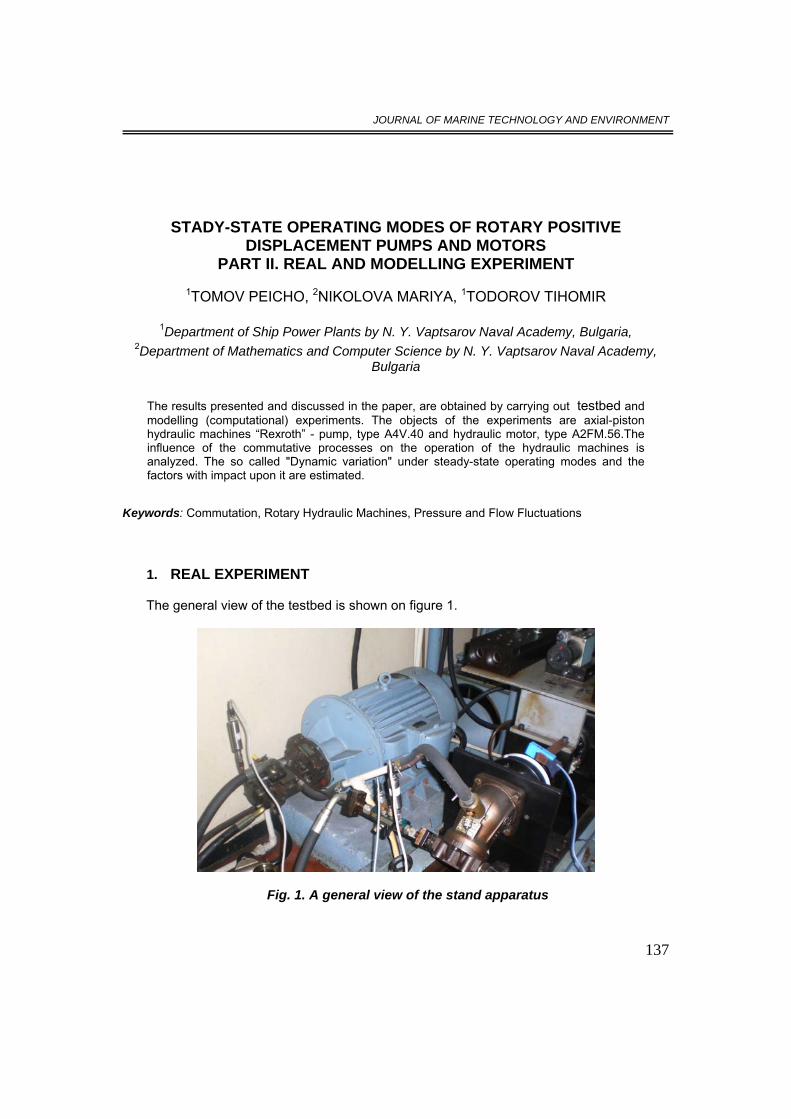
JOURNAL OF MARINE TECHNOLOGY AND ENVIRONMENT
137
STADY-STATE OPERATING MODES OF ROTARY POSITIVE DISPLACEMENT PUMPS AND MOTORS
PART II. REAL AND MODELLING EXPERIMENT
1TOMOV PEICHO, 2NIKOLOVA MARIYA, 1TODOROV TIHOMIR
1Department of Ship Power Plants by N. Y. Vaptsarov Naval Academy, Bulgaria, 2Department of Mathematics and Computer Science by N. Y. Vaptsarov Naval Academy,
Bulgaria
The results presented and discussed in the paper, are obtained by carrying out testbed and modelling (computational) experiments. The objects of the experiments are axial-piston hydraulic machines “Rexroth” - pump, type A4V.40 and hydraulic motor, type A2FM.56.The influence of the commutative processes on the operation of the hydraulic machines is analyzed. The so called "Dynamic variation" under steady-state operating modes and the factors with impact upon it are estimated.
Keywords: Commutation, Rotary Hydraulic Machines, Pressure and Flow Fluctuations
1. REAL EXPERIMENT The general view of the testbed is shown on figure 1.
Fig. 1. A general view of the stand apparatus
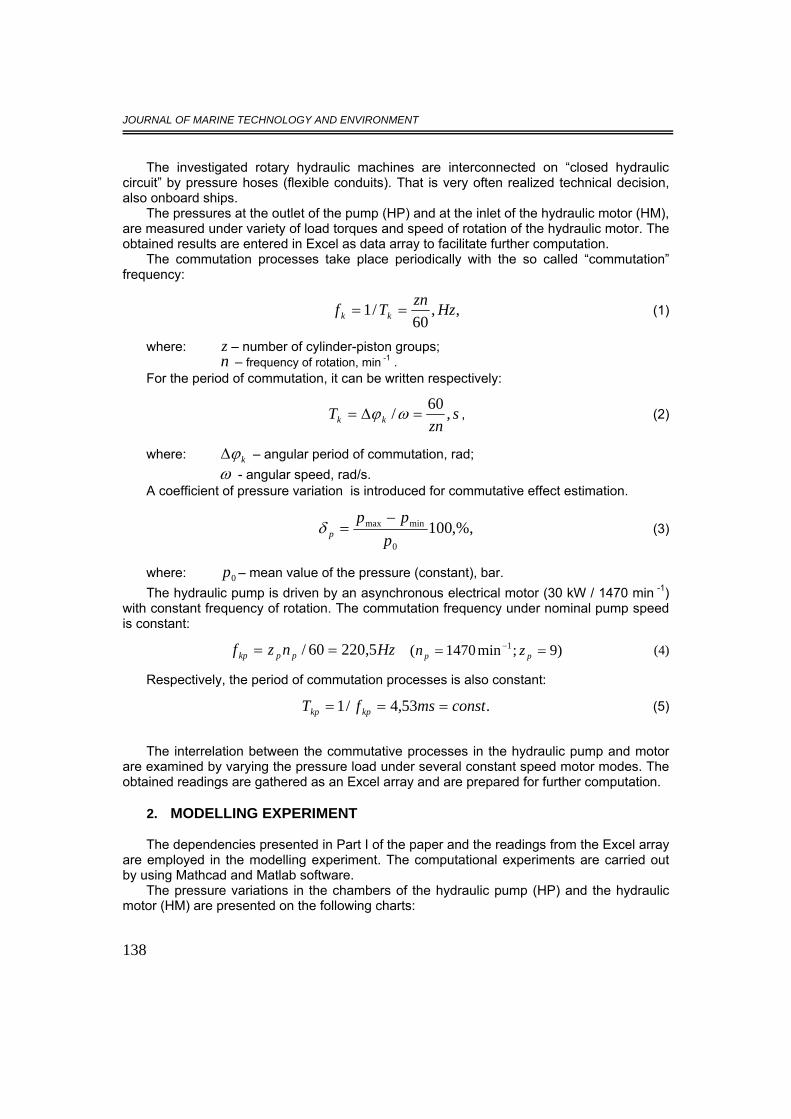
JOURNAL OF MARINE TECHNOLOGY AND ENVIRONMENT
138
The investigated rotary hydraulic machines are interconnected on “closed hydraulic circuit” by pressure hoses (flexible conduits). That is very often realized technical decision, also onboard ships.
The pressures at the outlet of the pump (HP) and at the inlet of the hydraulic motor (HM), are measured under variety of load torques and speed of rotation of the hydraulic motor. The obtained results are entered in Excel as data array to facilitate further computation.
The commutation processes take place periodically with the so called “commutation” frequency:
,,60
/1 HzznTf kk == (1)
where: – number of cylinder-piston groups; z – frequency of rotation, minn -1 . For the period of commutation, it can be written respectively:
szn
T kk ,60/ =Δ= ωϕ , (2)
where: kϕΔ – angular period of commutation, rad; ω - angular speed, rad/s. A coefficient of pressure variation is introduced for commutative effect estimation.
,%,1000
minmax
ppp
p−
=δ (3)
where: – mean value of the pressure (constant), bar. 0pThe hydraulic pump is driven by an asynchronous electrical motor (30 kW / 1470 min -1)
with constant frequency of rotation. The commutation frequency under nominal pump speed is constant:
Hznzf ppkp 5,22060/ == (4) )9;min1470( 1 == −pp zn
Respectively, the period of commutation processes is also constant:
.53,4/1 constmsfT kpkp === (5)
The interrelation between the commutative processes in the hydraulic pump and motor
are examined by varying the pressure load under several constant speed motor modes. The obtained readings are gathered as an Excel array and are prepared for further computation.
2. MODELLING EXPERIMENT
The dependencies presented in Part I of the paper and the readings from the Excel array
are employed in the modelling experiment. The computational experiments are carried out by using Mathcad and Matlab software.
The pressure variations in the chambers of the hydraulic pump (HP) and the hydraulic motor (HM) are presented on the following charts:
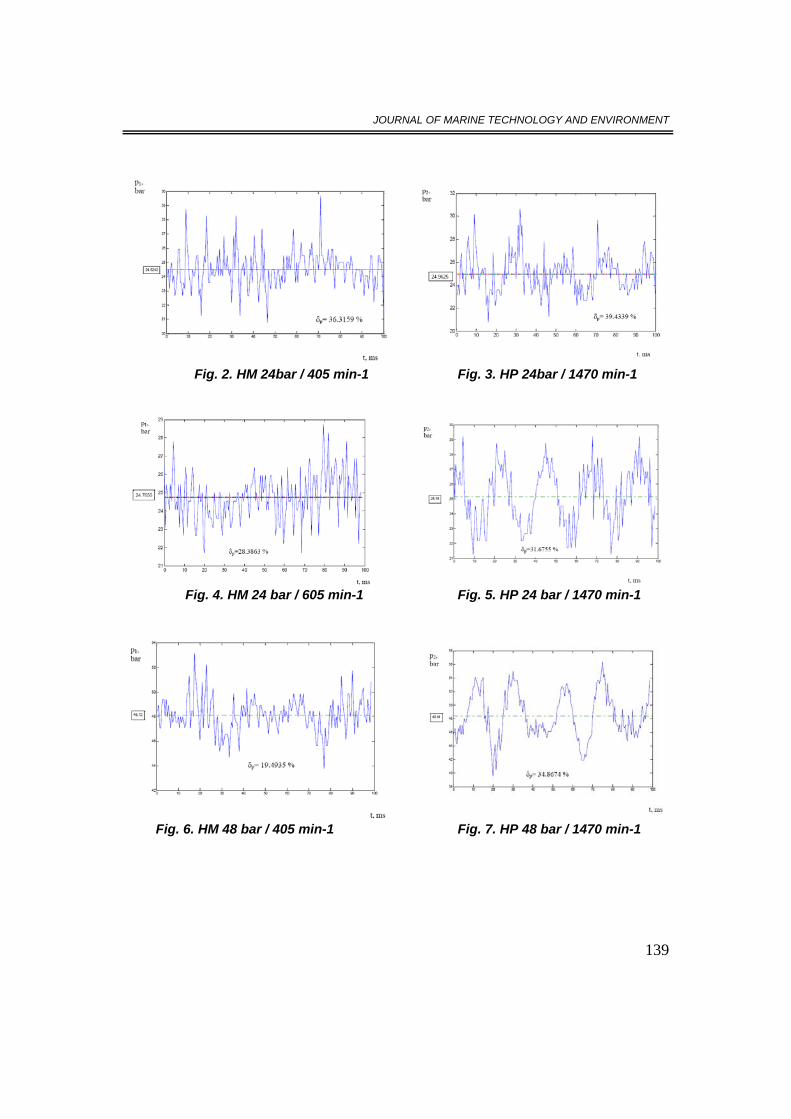
JOURNAL OF MARINE TECHNOLOGY AND ENVIRONMENT
139
Fig. 2. HM 24bar / 405 min-1 Fig. 3. HP 24bar / 1470 min-1
Fig. 4. HM 24 bar / 605 min-1 Fig. 5. HP 24 bar / 1470 min-1
Fig. 6. HM 48 bar / 405 min-1 Fig. 7. HP 48 bar / 1470 min-1

JOURNAL OF MARINE TECHNOLOGY AND ENVIRONMENT
140
Fig. 8. HM 50 bar / 605 min-1 Fig. 9. HP 50 bar / 1470 min-1
Fig. 10. HM 100 bar / 205 min-1 Fig. 11. HP 100 bar / 1470 min-1
Fig. 12. HM 100 bar / 405 min-1 Fig. 13. HP 100 bar / 1470 min-1
Fig. 14. HM 100 bar / 605 min-1 Fig. 15. HP 100 bar / 1470 min-1
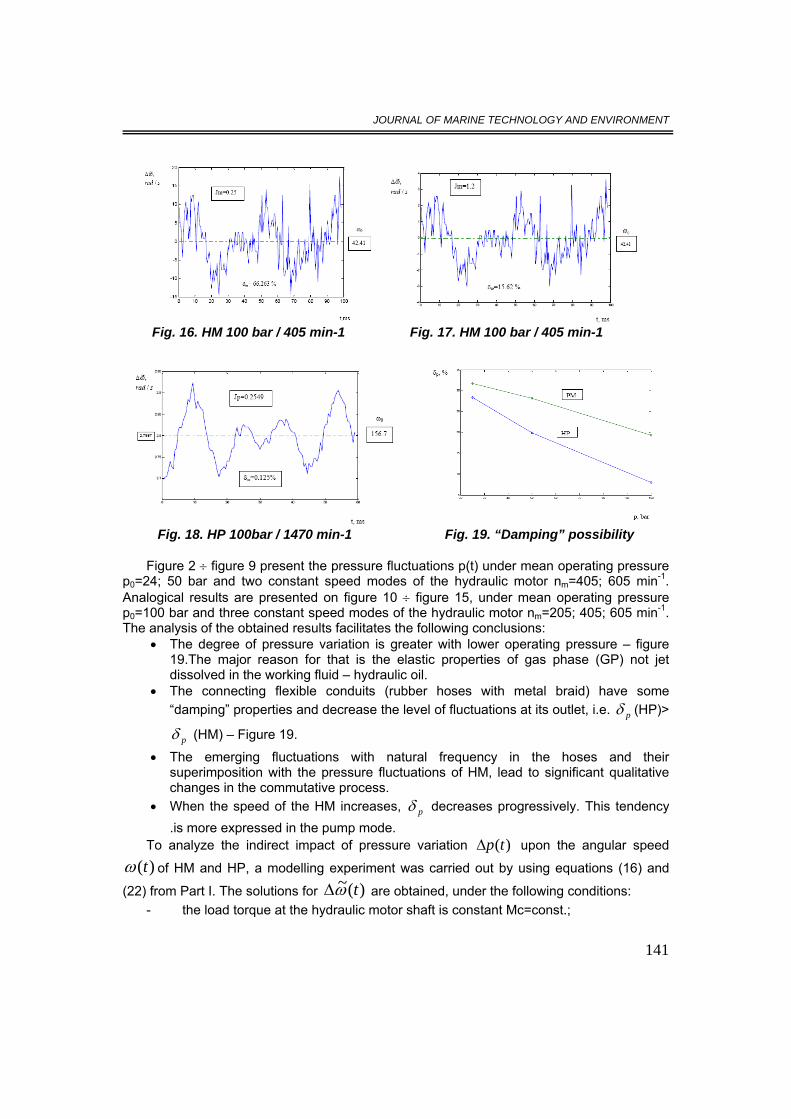
JOURNAL OF MARINE TECHNOLOGY AND ENVIRONMENT
141
Fig. 16. HM 100 bar / 405 min-1 Fig. 17. HM 100 bar / 405 min-1
Fig. 18. HP 100bar / 1470 min-1 Fig. 19. “Damping” possibility
Figure 2 ÷ figure 9 present the pressure fluctuations p(t) under mean operating pressure
p0=24; 50 bar and two constant speed modes of the hydraulic motor nm=405; 605 min-1. Analogical results are presented on figure 10 ÷ figure 15, under mean operating pressure p0=100 bar and three constant speed modes of the hydraulic motor nm=205; 405; 605 min-1. The analysis of the obtained results facilitates the following conclusions:
• The degree of pressure variation is greater with lower operating pressure – figure 19.The major reason for that is the elastic properties of gas phase (GP) not jet dissolved in the working fluid – hydraulic oil.
• The connecting flexible conduits (rubber hoses with metal braid) have some “damping” properties and decrease the level of fluctuations at its outlet, i.e. pδ (HP)>
pδ (HM) – Figure 19.
• The emerging fluctuations with natural frequency in the hoses and their superimposition with the pressure fluctuations of HM, lead to significant qualitative changes in the commutative process.
• When the speed of the HM increases, pδ decreases progressively. This tendency .is more expressed in the pump mode.
To analyze the indirect impact of pressure variation )(tpΔ upon the angular speed
)(tω of HM and HP, a modelling experiment was carried out by using equations (16) and
(22) from Part I. The solutions for )(~ tωΔ are obtained, under the following conditions: - the load torque at the hydraulic motor shaft is constant Mc=const.;

JOURNAL OF MARINE TECHNOLOGY AND ENVIRONMENT
142
- the hydraulic pump (HP) is driven by a three-phase, asynchronous electrical motor and the Kloss's formula is employed for modelling the driving torque.
- the initial conditions .for solving the tasks are equal to zero, i.e. for 0=t , 0)0(~ =Δω .
Two solutions are obtained for the hydraulic motor (HM) by employing two stage modification of the generalized moment of inertia: JM=0.25; 1.2 kgm2. The results are shown on figure 16 ÷ figure 17. One solution is obtained for the pump (HP) by employing specified moment of inertia: Jp=0.2549, kgm2. The result is shown on figure 18. The operating pressure is Pn=100 bar. The analysis of the results of the modeling experiment facilitates the following conclusions:
• The pressure variation )(~ tpΔ has considerable, indirect impact upon the angular
speed variation ωδ by means of the hydraulic machine output torque and hence the flow through the machine;
• For successful fluctuations dampening in the “classical” way, it is necessary the value the moment of inertia Jp to be increased.
• It is obvious that the type of the load torque dependency or the driving torque dependency, applied to the shaft of the rotary hydraulic machine influences considerably the angular speed variation coefficient ωδ .
3. CONCLUSIONS The commutation processes, equaling the pressure in the precise couples (in particular
the cylinder/piston groups) of the rotary displacement hydraulic machines are inevitable and harmful, since they:
- cause highfrequency pressure fluctuations, at stady-state mode of operation; - affect considerably the noise level and the unevenness of operation by means of
these fluctuations; - reduce considerably the service life of hydraulic machines; - make difficult the positioning of the hydraulic motors as well as the precise
execution of given governing mode (in particular adjustment). There are two ways of solving this problem: “classical” mechanic – by increasing the
moment of inertia; the second is hydraulic – by dampening the pressure fluctuation )(~ tpΔ .
REFERENCES [1]. Asherman I. – Izmerenie davleney v aksialno-porshnevoy mashine s celue optimizacie razpredelitelnovo uzla. V-ta Nacionalna konferenciya po hidravlika i pnevmatika Kazanlak, 1988, s.311 321.; [2]. Gösele R. – Volumenstromschwankungen hydrostatischer Pumpen. Vergleich von Theorie und praktischen Verhalten. O+P (Ölhydraulik und Pneumatik) 23, 1979, Nr.5, 371-376. [3]. Spielmann M. – Zustandsmodelle hydraulischer Antriebselemente. Forschungsbericht Nr.15/96. Meβ-, Steuer- und Regelungstechnik, 1-23.; [4]. Todorov T., P. Tomov, M. Vasilev – Izsledvane na proces komutaciya pri aksialno-butalni rotacionni hidromashini. "trans & MOTAUTO'06". Volume 2, 25-28 Oct. 2006, Varna, c.78,78A-B.; [5]. Tomov P., M. Nikolova. – Izsledvane na komutacionnite procesi pri obemni rotacionni hidromashini. Sp. "Mechanika na Mashinite" 83. Seriya FH. Kniga 4, TU-Varna, 2009,s.19-22.. [6]. Tomov P., T. Todorov, M. Vasilev – Eksperimentalno izsledvane na komutacionnite procesi pri aksialno-butalni rotacionni hidromashini. Morski nauchen forum "Korabna energetika". Tom 1, Varna, 2006, c25-31.;

JOURNAL OF MARINE TECHNOLOGY AND ENVIRONMENT
143
ENVIRONMENTAL IMPACT OF TRANSPORT AND TENDENCIES FOR DEVELOPMENT OF SUSTAINABLE TRANSPORT IN BULGARIA
1TONEVA-ZHEYNOVA DANIELA, 2MEDNIKAROV BOYAN, 3NIKOLOVA NATALIA, 4TENEKEDJIEV KIRIL
1Technical University – Varna, Bulgaria,2,3,4Nikola Vaptsarov Naval Academy, Varna,
Bulgaria
Sustainable transport is a key trend in the European policy towards sustainable development. It concerns important indicators, such as socio-economic development, sustainable production and consumption, climate change and energy, sustainable transport, natural resources, and many others. The study analyzes the impact of transport over the environment in the context of sustainable transport in Bulgaria. The study does not comment the problems related to social and economical impact of transport, and focuses on rail, road, inland waterway and air transport. The main indicators employed are energy consumption related to GDP, and greenhouse gas emissions. Comparisons are made with four other European member states.
Keywords: Sustainable transport, sustainable development, greenhouse gas emissions, energy consumption
1. INTRODUCTION The problems of sustainable development and the strategies for its realization have been
discussed in many official documents of European importance. In 2001, the European Council adopted a Strategy for sustainable development in Goteborg. In 2004, the European Commission proposed an action plan for sustainable development, which was approved in 2005 by the European Parliament. A key objective in all those documents is environmental protection, or “Safeguard the earth's capacity to support life in all its diversity, respect the limits of the planet's natural resources and ensure a high level of protection and improvement of the quality of the environment. Prevent and reduce environmental pollution and promote sustainable consumption and production to break the link between economic growth and environmental degradation” [1].
The common European understanding is that the sustainable development indicators spread over all main aspects of the development of countries around the world, namely: socio-economic development, sustainable production and consumption, social inclusion, demographic changes, public health, climate change and energy, sustainable transport, natural resources, global partnership, good governance.
This paper uses official public data to analyze the transport impact on the environment in Bulgaria, and to make important comparisons with other EU member states. On that basis, it

JOURNAL OF MARINE TECHNOLOGY AND ENVIRONMENT
144
is possible to outline some important conclusions that indicate both the bottlenecks in sustainable transport, and the existing potentials for improvement.
2. ANALYSIS OF MAIN PARAMETERS IN SUSTAINABLE TRANSPORT Sustainable transport is a key challenge of the EU Sustainable Develepment Strategy
(EU SDS). The strategy's objective is to ensure that our transport systems meet society's economic, social and environmental needs whilst minimizing their undesirable impacts on the economy, society and the environment. The object of this analysis is the impact of transport over the environment in the context of sustainable transport. The study does not comment the problems related to social and economical impact of transport.
Sustainable transport’s prime indicator is the energy consumption of transport, which is strongly related to gross Domestic Product (GDP). The analysis and assessment of the following transport impacts is important: emissions of ozone precursors from transport, emissions of particulate matter from transport and average CO2 emissions per km from new passenger cars. These parameters correspond to the more general indicator of greenhouse gas emissions by transport. All different types of transport (road, rail, inland waterway and air) are analyzed, but maritime and pipeline transport.
The energy structure of consumption in Bulgaria is characterized by strong dominance of road transport over the other types of transport. This is due to the sharp increase in the number of private cars and the structural changes in the sector in the transition period from planned to market economy.
The total consumption of energy from transport, as well as the energy consumption on transport modal split is given on fig. 1.
0
500
1000
1500
2000
2500
3000
2000 2001 2002 2003 2004 2005 2006
total
road transport
rail transport
inland waterways
air transport
Fig. 1. Energy consumption of transport in Bulgaria by types of transport
(in tones oil equivalent – TOE).

JOURNAL OF MARINE TECHNOLOGY AND ENVIRONMENT
145
As it can be seen from fig. 1, for the aforementioned period Bulgaria has showed sustainable tendency towards increase of energy consumption by transport.
The data provided by the Executive Agency of Environment of Bulgaria to the European Environmental Agency [5, 3] show zero energy consumption by the inland waterway transport. That indicates a possibility for unintentional decrease in the values of total energy consumption on transport, calculated as toe. Due to the lack of credible data on the energy consumption for the inland waterway transport in Bulgaria, as well as its negligibly small share in the total passenger and cargo transport, this study shall not analyze inland waterways transportation. As the data shows, the energy consumption of the transport sector in Bulgaria shows a sustainable increase.
The transport analysis in Bulgaria from the point of view of the environmental impact, according to the adopted practice, will be performed according to the parameters of several other European countries – Greece, Austria, Hungary and the Czech Republic. Main demographic and macroeconomic parameters of those countries are given in table 1.
Table 1. Comparative data (valid for 2007)
Country Area, km2 Population (in mln) Density,
p/km2GDP/people, thousands
Bulgaria 110 910 7, 640 69 12,251 Greece 132 000 11,210 84 28,273 Austria 83 858 8,309 99 45,185 Hungary 93 030 10,064 109 17,405 Czech Republic 78 866 10,307 130 18,000
0100020003000400050006000700080009000
10000
2000 2001 2002 2003 2004 2005
Bulgaria GreeceAustria HungaryCzech Republic
Fig. 2. Total energy consumption by transport, TOE

JOURNAL OF MARINE TECHNOLOGY AND ENVIRONMENT
146
The graphics for total energy consumtion from transport (by TOE) of the analyzed countries (see fig. 2) shows that Bulgaria has the lowest values on these parameters, whereas Greece has the highest ones. The energy consumption in Bulgaria is mainly caused by road transport. A comparison between the energy consumption on road transport in the selected EU countries is given on fig. 3.
0
1000
2000
3000
4000
5000
6000
7000
8000
9000
10000
2000 2001 2002 2003 2004 2005 2006
BulgariaGreeceAustriaHungaryCzech Republic
Fig. 3. Energy consumption by road transport (in TOE)
Considering the high energy consumption, it is reasonable to expect a high
environmental impact of transport. It ranks second in atmospheric air pollution after power industry, and part of the emission are toxic. Main courses of toxicity are exhaust gases, of which most significant are carbon dioxide, hydrocarbons, and nitrous oxides.
The emission of greenhouse gases from transport indicates the status and trend in the emission from transport (road, rail, inland waterway and domestic aviation) of the greenhouse gases regulated by the Kyoto Protocol (fig. 4). Only three gases are relevant in the context of transport – carbon dioxide, methane, and nitrous oxide, and these have been aggregated according to their relative global warming potentials.
The statistics of the European Commission on the same indicator shows the following regarding the member states: for the period 1995-2005, EU15 has showed a trend in greenhouse gas emissions from transport. [6] Whilst in 1995, these states (15) have

JOURNAL OF MARINE TECHNOLOGY AND ENVIRONMENT
147
generated 761003.88 thousand tones CO2 euqivalent, in 2005 the amount was 874202,62 (or a trend of 113198,74 thousand tones CO2 equivalent for 10 years).[5] The growth for the period 2000-2005 alone is 38160,08 thousand tones СО2 equivalent or nearly 34% of the total trend. For the same period, the EU27 member states have indicated a trend of 145243.09, and in 1995 alone the total was 838841.03 thousand tones СО2 equivalent, whereas in 2005 – 984084 thousand tones СО2 equivalent. Bulgaria reported 6931.33 thousand tones СО2 equivalent in the zero year 1995 and reached 8208.22 in 2005 (or a growth of 1276.89 thousand tones СО2 equivalent). For the period 2000-2005 alone, the growth is by 2247.69 thousand tones СО2 equivalent. Belgium had 22634.09 thousand tones СО2 equivalent in 1995, and 26549.53 thousand tones СО2 equivalent in 2005 (or an increase by 3915.44 thousand tones СО2 equivalent).
0
5000
10000
15000
20000
25000
30000
2000
2001
2002
2003
2004
2005
2006
2007
2008
Bulgaria GreeceAustria HungaryCzech Republic
Fig. 4. Greenhouse gas emissions from transport in thousand tones CO2 equivalent
Figure 5 shows similar data for the emissions from road transport alone. There is an
evident positive trend in all five analyzed countries, with highest valyes for the Czech Republic and Austria. The lead emissions from road transport in Bulgaria are negligibly small
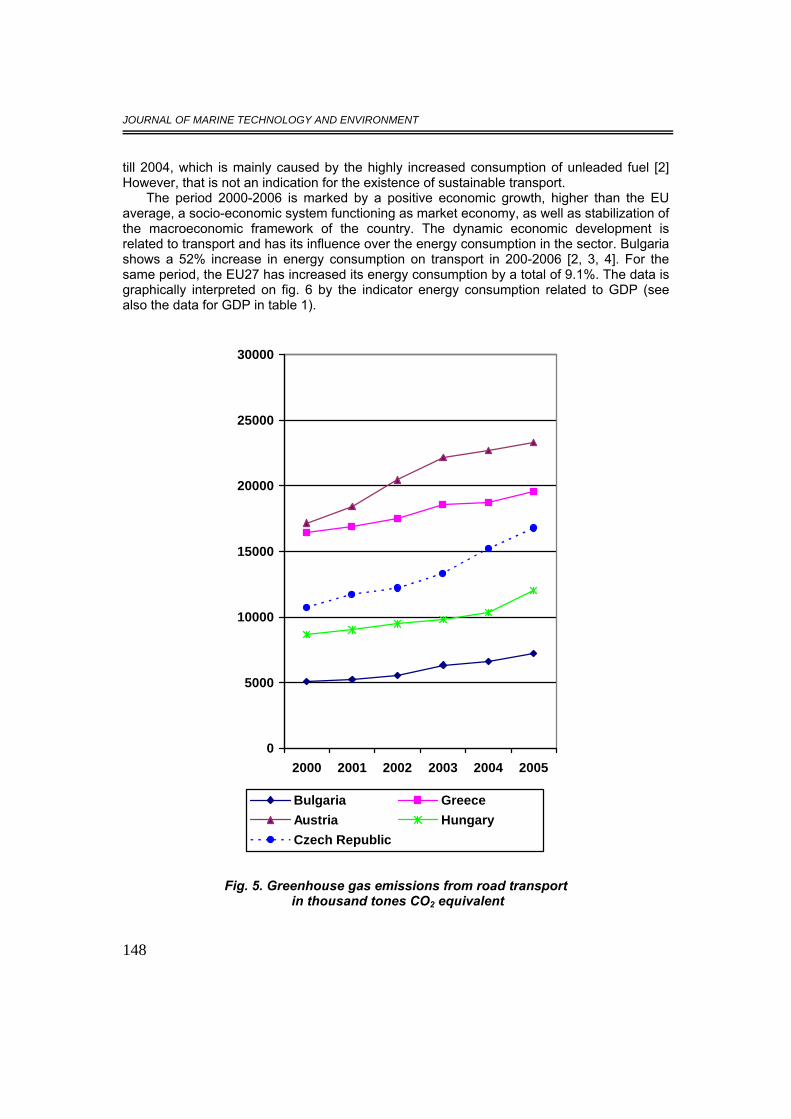
JOURNAL OF MARINE TECHNOLOGY AND ENVIRONMENT
148
till 2004, which is mainly caused by the highly increased consumption of unleaded fuel [2] However, that is not an indication for the existence of sustainable transport.
The period 2000-2006 is marked by a positive economic growth, higher than the EU average, a socio-economic system functioning as market economy, as well as stabilization of the macroeconomic framework of the country. The dynamic economic development is related to transport and has its influence over the energy consumption in the sector. Bulgaria shows a 52% increase in energy consumption on transport in 200-2006 [2, 3, 4]. For the same period, the EU27 has increased its energy consumption by a total of 9.1%. The data is graphically interpreted on fig. 6 by the indicator energy consumption related to GDP (see also the data for GDP in table 1).
0
5000
10000
15000
20000
25000
30000
2000 2001 2002 2003 2004 2005
Bulgaria GreeceAustria HungaryCzech Republic
Fig. 5. Greenhouse gas emissions from road transport in thousand tones СО2 equivalent

JOURNAL OF MARINE TECHNOLOGY AND ENVIRONMENT
149
859095
100105110115120125
2000 2001 2002 2003 2004 2005 2006 2007
BulgariaGreeceAustriaHungaryCzech Republic
Fig. 6. Energy consumption of transport (with exception of maritime and pipeline)
relative to GDP, Index 2000=100 3. CONCLUSIONS The evaluation of progress since 2000 based on the headline indicators shows a rather
mixed picture: -Changes since 2000 are clearly favourable for GDP per capita and resource productivity
for EU25 [5, 6]. - Moderately favourable changes for energy consumption of transport; The trends in the development of sustainable transport in the EU requires transport
polymodality. It is strongly recommended to increase the share of rail transport for both cargo and passengers. Unfortunately, in the last 20 year s, Bulgaria shows a decrease in the share of rail transport in favor or roads. Rail is considered to have a much softer impact on the environment, lower emissions of greenhouse gases (calculated as thousand tones СО2 equivalent), and lower prime cost for cargo.As paradoxical as it may seem, in the years of transition from planned to marker economy, the total length of rail road has decreased, as well as the average speed, the absolute quantity, and the share of rail transport in the movement of cargo.
Bulgaria has increased the use of diesel fuel from 759 tousand tones in 2000 by 144,2 tousand tones on 2006. This is mainly caused by the automobile transport. The increase in the energy consumption by the road transport is naturally accompanied by the change in the structure of fuels used. Together with that, the efforts to comply with the EU Directive from 2003 to increase the use of biofuel has led to an increase in its consumption in road transportation.
The energy consumption by the road transport, based on the work of internal combustion engines and the use of conventional fossil fuel, totals to more than 90% of the structure of the total energy consumption in the sector. Combined with the average age of the vehicles in the country (modernization of vehicles is one of the steps in sustainable development), it

JOURNAL OF MARINE TECHNOLOGY AND ENVIRONMENT
150
assumes high pollution of the environment [5](according to data from the Executive Agency “Environment”, and from Coordination and Information-Analytical activities office of the Ministry of Internal Affairs of Bulgaria from 2006, some 26% of the vehicles are more than 20 years old, and just 17.7% are aged not more than 10 years. [2, 7] The level of modernization of the cargo vehicles is overall positive, and the newly registered ones comply with the requirements for toxic gas emissions and noise).
The air transport is not sufficiently developed, even though the data of the National Statistics Institute and EUROSTAT showed that the price per km for passengers is the lowest. Inland waterway passenger transport is practically destroyed. REFERENCES [1]. ANNEX 10117/06, Brussels, 06.2006 [2]. Transport and environment in Bulgaria- present and future, Ministry of Transport of Republic Bulgaria, 2007 [3]. National Report on State of Environment, EAE, Ministry of environment and water, 2006[4]. National Report on State of Environment, EAE, Ministry of environment and water, 2007 [5]. European Environmental Agency, Buletin, 2007, 2008, 2009 [6]. EUROSTAT [7]. Development Strategy - Transport in Bulgaria 2007-2013, MT, 2008

JOURNAL OF MARINE TECHNOLOGY AND ENVIRONMENT
151
PROTECTION AGAINST MARINE CORROSION OF ALUMINIUM ALLOY A6061: EIS AND SEM-EDS APPROACHES
1WAN NIK W.B., 2O. SULAIMAN, 3K.B. SAMO, 4M.F. AHMAD, 5R. ROSLIZA
1,2,3Maritime Technology Department, Faculty of Maritime Study and Marine Science,
4Engineering Science Department, Faculty of Science and Technology, Universiti Malaysia Terengganu, 5TATi University College, Teluk Kalong, Malaysia
Seawater is inherently chemically aggressive. Marine structural material used in seawater handling is subjected to varying degree of corrosion depending upon nature and operational conditions. A study was undertaken to investigate the effect of seawater on aluminium corrosion. Natural honey has been evaluated as a corrosion inhibitor for aluminium alloy in seawater by electrochemical measurement and surface morphology examination. The effect of natural honey on the charge transfer resistant is measured at various concentrations. EIS studies showed that there was significant increase in overall resistant after addition of natural honey. The inhibition efficiency increases with increase in inhibitor concentration. The nature of adsorption of natural honey on the metal surface has also been examination. The analysis of SEM and EDS confirmed formation of precipitates of natural honey on the metal surface, which reduced the overall corrosion reaction.
Keywords: Aluminium alloy; EIS; Adsorption; SEM, EDS
1. INTRODUCTION Corrosion is a fundamental process playing an important role in economics and safety,
particularly for metals. Apparently, corrosion cannot be avoided, but its severity can be prevented. Corrosion is measured by the ability of the respective metal atom to oxidize. The varying ability of a metal to lose its electrons and form a positive ion is essential in understanding the ranges of metals that are capable of corroding.
Many researchers have studied aluminium corrosion by variety of methods. Some use gravimetric and optical microscopy while others use electrochemical impedance Spectroscopy (EIS) (Barhalescu and Sabau, 2010; Rosliza and Wan Nik, 2010). EIS is a non-destructive method that has many advantages over other traditional electrochemical measuring methods. EIS has been successfully used to investigate corrosion. This method provides important mechanistic and kinetic information which enables understanding of the characteristics of the system under investigation (Badawi et al., 1999), and also provides data about processes occurring at corroding metal surfaces (Treacy et al., 1999). From appropriate electrical equivalent circuits, representative parameters of corrosion process can be extruded.
This paper presents the results of the study for the corrosion of unprotected aluminium alloy in seawater and efficacy of natural product as corrosion resistance of this alloy against corrosion at room temperature.

JOURNAL OF MARINE TECHNOLOGY AND ENVIRONMENT
152
2. EXPERIMENTAL RESEARCH The aluminium alloy used for this study was AA6061. The metal has the following
chemical composition (wt); Si (0.40%), Fe (0.7%), Cu (0.15%), Mn (0.15%), Mg (0.80%), Cr (0.04%), Zn (0.25%), Ti (0.15%) and Al (remainder). Two types of experiments were conducted: field test and laboratory test. The field test was conducted at boat jetty as shown in Figure 1.
Fig. 1. Field test conducted at boat jetty For the laboratory test, actual seawater was used but conducted in Maritime
Technology Laboratory. The inhibitor used was natural honey collected freshly from the nest of bees. Freshly seawater solution was used in all the experiments. All the experiments were conducted at room temperature (27ºC).
For the electrochemical test, the preparation of working electrode before measurements is the same as described before (Rosliza et al., 2008a). The coupons were immersed in a 3 liters beaker containing the respective solution with and without the inhibitor. The samples were immersed in seawater for 120 days and withdrawn every 10 days for reweighing to ascertain the weight loss.
All electrochemical measurements were accomplished with Autolab frequency response analyzer (FRA) coupled to an Autolab potentiostat connected to a computer. The working electrode (WE) was in the form of a square cut so that the flat surface was the only surface in the electrode.
Impedance measurements were conducted over a frequency range of 5 x 10⁵ Hz down to 5 x 10⁻³ Hz. The scanning rate was 10 mV/min. Data were presented as Nyquist plots. Scanning electron microscopy (SEM), model JSM-6390LA was used to examine the specimen surface before and after immersion in seawater.

JOURNAL OF MARINE TECHNOLOGY AND ENVIRONMENT
153
3. RESULTS AND DISCUSSION Nyquist plots of aluminium alloy in the present and the absence of various
concentrations of natural honey are given in Figure 2. As can been seen from the figure, the impedance diagrams show single capacitive semicircles, showing that the corrosion process was mainly charge-transfer controlled. The general shape of the curves is very similar for all the samples and this is maintained throughout the whole test period, indicating that almost no change in the corrosion mechanism occurred either due to the inhibitor addition (Rosliza et al., 2008a). Similar results have been reported in the literature for the corrosion of aluminium in aggressive media (Rosliza et al., 2008a; Rosliza et al., 2008b; Yurt et al., 2006).
0
10000
20000
30000
40000
50000
60000
70000
80000
90000
0 10000 20000 30000 40000 50000 60000 70000 80000 90000
Z' (Ohm)
-Z"
(Ohm
)
0 ppm200 ppm400 ppm600 ppm800 ppm1000 ppm
Fig. 2. Nyquist plots for AA6061 in seawater at various concentrations of natural
honey The results from Table 1 shows that there are increasing Rct values with addition
inhibitor as compared to that of without inhibitor. The values of Rct increase with increasing of inhibitor concentration. It should be noted that whilst Rct values increase with addition of inhibitor, the capacitance, Cdl values decrease indicating the formation of a surface film. Effective corrosion resistance is associated with high Rct and low Cdl values (Yagan et al, 2006).
Table 1:Rct and IE (%) of AA6061 in seawater obtained using impedance method
c (ppm) Rct (kΩcm2) IE (%)
0 11.76 - 200 33.10 64.48 400 36.06 67.40 600 57.12 79.41 800 76.39 84.61 1000 119.84 90.19

JOURNAL OF MARINE TECHNOLOGY AND ENVIRONMENT
154
Process of adsorption occur when a liquid or gas accumulates on the surface of a solid or liquid, forming a molecular or atomic film. Adsorption is usually described through isotherms and corrosion inhibition of metals by organic compounds results from the adsorption of molecules and ions at the surface of metal (Maayta et al., 2004). The adsorption of inhibitor on a metal surface depends on the nature as well as the surface charge of the metal, the adsorption mode, its chemical structure, and the type of the electrolyte solution (Sherif et al., 2006).
The Langmuir adsorption isotherm was found to fit well with the experimental data. This isotherm is based on assumption that all adsorption sites are equivalent and the particle binding occurs independently from nearby sites being occupied or unoccupied. It is clear that the adsorption obtained agrees with the findings reported by other researchers as mentioned previously, in which the degree of adsorption by natural honey (Etre et al., 1998; Etre et al., 2000) on ferrous metals follows the Langmuir isotherm.
The inhibitor adsorbs on aluminium alloy as a result a thin film is formed on the aluminium alloy to retard the corrosion. Thus, in this case, natural honey worked as filming inhibitors to control the corrosion rate. Instead of reacting with or removing an active corrosive species, filming inhibitors function by strong adsorption and decrease the attack by creating a barrier between the metal and their environment (Rosliza et al., 2008b).
The values of the inhibition efficiency, IE (%) from the EIS tests were calculated using the following equation (Rosliza et al., 2008a):
IE (%) = 100 ⎟⎟⎠
⎞⎜⎜⎝
⎛ −
ct
ctct
RRR
''
(1)
The values of IE (%) for the samples at various concentrations of inhibitor are given in Table 1. The inspection of Table 1 reveals that IE of natural honey increase with the inhibitor concentrations ranges from 200 to 1000 ppm. The maximum value of IE was 90.19% for the concentration of 1000 ppm. The adsorption of natural honey on AA6061 surface would take place through all these functional groups. The simultaneous adsorption of the three functional groups forces the natural honey molecule to be horizontally oriented at the aluminium alloy surface (Radojcic et al., 2008). As the inhibitor concentration increases the part of the metal surface covered by inhibitor molecule increases leading to an increase in IE.
Figure 3 shows the specimen surfaces after immersed in seawater at jetty up to 120 days. Comparing to other metals, aluminium is very less prone to corrosion. However, the figure shows gradual change of corrosion to our aluminium samples. As expected, the metal gradually corrodes with immersion time.
Figure 4 depicts the SEM of specimen surface after 120 days immersed in seawater with addition of 600 ppm of natural honey in laboratory. It can be seen that the flakes in the surface of specimen are much decreased as compared to that in Figure 3. The specimen is covered with the inhibitor molecules giving a protection against corrosion, where a thin layer developed on the specimen surface.

JOURNAL OF MARINE TECHNOLOGY AND ENVIRONMENT
155
Fig. 3. Specimen surface after immersion in seawater at boat jetty
Fig. 4. SEM of specimen surface after immersed in seawater with present of 600 ppm of natural honey
Figure 5 corresponds to the SEM (a) and EDS elemental mapping (b) of specimen
surface after 120 days immersed in seawater with the present of 1000 ppm of natural honey. These micrographs show the existence of carbon (due to the carbon atoms of the natural honey) and these molecules covered the surface of specimen.
(a)

JOURNAL OF MARINE TECHNOLOGY AND ENVIRONMENT
156
(b)
Fig. 5. SEM of specimen surface immersed in seawater with the present of 1000 ppm of natural honey
4. CONCLUSIONS The corrosion studies of the AA6061 aluminum alloy have been carried out at two
different environments exposed to seawater. The results indicate that natural honey is an effective corrosion inhibitor for AA6061 in seawater. EIS measurements clarified that the corrosion process was mainly charge-transfer controlled and no change in the corrosion mechanism occurred due to the inhibitor addition in seawater. The values of Rct increase with addition of inhibitor indicating the formation of a surface film. Morphology study elucidated that the development of thin film on the specimen immersed in seawater with presence of natural honey.
REFERENCES [1]. Badawi W.A. et al. – Electrochemical behaviour and corrosion inhibition of Al, Al-6061 and Al-Cu
in neutral aqueous solutions, Corros. Sci., 41, pp. 709-727, 1999 [2]. Barhalescu M., Sabau A. – Corrosion resistance of the layers obtained by electrical sparking
with aluminium and bronze electrode, Journal of Marine Technology and Environment, II, pp. 24-29, 2010
[3] Etre A.Y. et al. - Natural honey as corrosion inhibitor for metals and alloys. II. C-steel in high saline water, Corros. Sci., 42, pp. 731-738, 2000
[4] Etre A.Y.- Natural honey as corrosion inhibitor for metals and alloys. I. Copper in neutral aqueous solution, Corros. Sci., 40,pp. 1845-1850, 1998
[5] Maayta A.K. et al. - Inhibition of acidic corrosion of pure aluminum by some organic compounds, Corros. Sci., 46, pp. 1129-1140, 2004
[6] Radojcic I. et al. - Natural honey and black radish juice as tin corrosion inhibitors, Corros. Sci., 50 pp. 1498-1504, 2008
[7] Rosliza R., Wan Nik W.B. – Improvement of corrosion resistance of AA6061 alloy by tapioca starch in seawater, Current Applied Physics, 10, pp. 221-229, 2010
[8] Rosliza R. et al. - Electrochemical properties and corrosion inhibition of AA6061 in tropical seawater, Colloids Surf. A, 312, pp. 185-189, 2008a
[9] Rosliza R. et al. - The effect of inhibitor on the corrosion of aluminum alloys in acidic solutions, Mat. Chem. Phys., 107, pp. 281-288, 2008b
[10] Sherif E.M. et al. - Corrosion of copper in aerated acidic pickling solutions and its inhibition by 3-amino-1,2,4-triazole-5-thiol, Colloid Inter. Sci., 306, pp. 96-104, 2006
[11] Treacy G.M. et al. - Monitoring the corrosion behaviour of the chromate-passivated aluminum alloy 2014 A-T6 by electrochemical impedance spectroscopy during salt fog exposure, Surf. Coating Tech., 114, pp. 260-268, 1999
[12] Yagan A. et al. - Corrosion inhibition by poly (N-ethylaniline) coatings of mild steel in aqueous acidic solutions, Prog. Organic Coatings, 57, pp. 314-318, 2006
[13] Yurt A. et al. - Electrochemical and theoretical investigation on the corrosion of aluminum in acidic solution containing some Schiff bases, Applied Surf. Sci., 253, pp. 919-925, 2006


For Authors Are edited scientific papers in topics, written in English. Papers are selected after a peer review. Each participant is allowed to send maximum 2 papers as first author. Authors should make sure that the manuscripts submitted are ready for refereeing. The papers that are to be published must bring scientific contributions to the journal. The papers also have to contain the results of some of your work. It is strongly recommended an even number of pages, no longer than 6-10 pages. The papers that do not respect the publishing conditions and which are not integrated in the thematic of this journal will be rejected from the start by the Editorial Board. Authors submitting an article affirm that the same manuscript is not concurrently submitted to another publication. The authors are entirely responsible for the content of their papers.
PUBLISHED SINCE 2008
ISSN:1844-6116 ON LINE SINCE: 2008
PUBLISHED BY: Editura Nautica/ Constanta Maritime University