newtrendsinassetmanagement - thierry...
TRANSCRIPT
Foundations of portfolio managementThe risk management revolution
Smart beta & factor investingAlternative risk premia
Other topics
New Trends in Asset Management
Thierry Roncalli?
?Professor of Finance, University of Evry, France
7th JIAO-JI Afterwork
Shanghai Jiao Tong University Alumni / Tongji University Shanghai Alumni
Skema Business School, October 13, 2016
Thierry Roncalli New Trends in Asset Management 1 / 67

Foundations of portfolio managementThe risk management revolution
Smart beta & factor investingAlternative risk premia
Other topics
For institutional investors (pension funds, insurance companies,sovereign wealth funds, etc.)
This is the end of the traditional asset management
The quantitative asset management has definitively taken the power
Thierry Roncalli New Trends in Asset Management 2 / 67

Foundations of portfolio managementThe risk management revolution
Smart beta & factor investingAlternative risk premia
Other topics
Figure: Janus Henderson
Source: The Economist (2016).
Thierry Roncalli New Trends in Asset Management 3 / 67

Foundations of portfolio managementThe risk management revolution
Smart beta & factor investingAlternative risk premia
Other topics
Markowitz (1952)Tobin (1958)Sharpe (1964)Jensen (1969)Portfolio optimization and active management
The efficient frontier
“the investor does (or should)consider expected return adesirable thing and variance ofreturn an undesirablething”(Markowitz, 1952).We consider a universe of nassets. Let µ and Σ be thevector of expected returns andthe covariance matrix of returns.We have:
maxµ(x) = µ>xu.c. σ (x) =
√x>Σx = σ?
There isn’t one optimal portfolio, but a set of optimal portfolios!
Thierry Roncalli New Trends in Asset Management 4 / 67

Foundations of portfolio managementThe risk management revolution
Smart beta & factor investingAlternative risk premia
Other topics
Markowitz (1952)Tobin (1958)Sharpe (1964)Jensen (1969)Portfolio optimization and active management
The tangency portfolio
Tobin (1958) introduces therisk-free rate and shows that theefficient frontier is a straightline.
Optimal portfolios are acombination of the tangencyportfolio and the risk-free asset.
Separation theorem (Lintner,1965).
There is one optimal (risky) portfolio!
Thierry Roncalli New Trends in Asset Management 5 / 67

Foundations of portfolio managementThe risk management revolution
Smart beta & factor investingAlternative risk premia
Other topics
Markowitz (1952)Tobin (1958)Sharpe (1964)Jensen (1969)Portfolio optimization and active management
The market portfolio theory
Sharpe (1964) develops the CAPM theory.
If the market is at the equilibrium, the prices of assets are such thatthe tangency portfolio is the market portfolio (or the market-capportfolio).
Avoids assumptions on expected returns, volatilities and correlations!
The risk premium depends on the beta:
πi = µi − r = βi (µM − r)
where:βi = cov (Ri ,RM)
var(RM)
Thierry Roncalli New Trends in Asset Management 6 / 67

Foundations of portfolio managementThe risk management revolution
Smart beta & factor investingAlternative risk premia
Other topics
Markowitz (1952)Tobin (1958)Sharpe (1964)Jensen (1969)Portfolio optimization and active management
Passive management vs active management
How to measure the performance of active management?
RF (t) = α+βRM (t) +ε(t)
The rise of cap-weighted indexationJensen (1969): no alpha in mutual equity fundsJohn McQuown (Wells Fargo Bank, 1971)Rex Sinquefield (American National Bank, 1973)
Thierry Roncalli New Trends in Asset Management 7 / 67

Foundations of portfolio managementThe risk management revolution
Smart beta & factor investingAlternative risk premia
Other topics
Markowitz (1952)Tobin (1958)Sharpe (1964)Jensen (1969)Portfolio optimization and active management
Portfolio optimization and active managementFor active management, portfolio optimization continues to make sense.
However...“The indifference of many investment practitioners tomean-variance optimization technology, despite its theoreticalappeal, is understandable in many cases. The major problemwith MV optimization is its tendency to maximize the effects oferrors in the input assumptions. Unconstrained MV optimizationcan yield results that are inferior to those of simpleequal-weighting schemes” (Michaud, 1989).�� ��Are optimized portfolios optimal?
⇒ The mean-variance approach is certainly the most aggressiveactive management model.
Thierry Roncalli New Trends in Asset Management 8 / 67

Foundations of portfolio managementThe risk management revolution
Smart beta & factor investingAlternative risk premia
Other topics
MotivationsWhich risk factors?Risk parity portfoliosWhat is the original risk parity strategy
The emergence of risk parity
The rise of heuristic approachesDon’t be sensitive to expected returnsEW, MV, ERC, MDP, etc.
The rise of risk parity portfoliosThe place of risk management in asset managementBe sensitive to Σ and not to Σ−1
Capturing risk premia in a balanced portfolio
Thierry Roncalli New Trends in Asset Management 9 / 67

Foundations of portfolio managementThe risk management revolution
Smart beta & factor investingAlternative risk premia
Other topics
MotivationsWhich risk factors?Risk parity portfoliosWhat is the original risk parity strategy
How to be sensitive to Σ and not to Σ−1?
MVO portfolios are of the following form: x? ∝ f(Σ−1
).
The important quantity is then the information matrix I = Σ−1.
If we consider the following example: σ1 = 20%, σ2 = 21%, σ3 = 10% andρi,j = 80%, we obtain the following eigendecomposition:
Covariance matrix Σ Information matrix IAsset / Factor 1 2 3 1 2 3
1 65.35% −72.29% −22.43% −22.43% −72.29% 65.35%2 69.38% 69.06% −20.43% −20.43% 69.06% 69.38%3 30.26% −2.21% 95.29% 95.29% −2.21% 30.26%
Eigenvalue 8.31% 0.84% 0.26% 379.97 119.18 12.04% cumulated 88.29% 97.20% 100.00% 74.33% 97.65% 100.00%
6 6
12.04≡ 1/8.31%Reverse order of eigenvectors
Thierry Roncalli New Trends in Asset Management 10 / 67

Foundations of portfolio managementThe risk management revolution
Smart beta & factor investingAlternative risk premia
Other topics
MotivationsWhich risk factors?Risk parity portfoliosWhat is the original risk parity strategy
How to be sensitive to Σ and not to Σ−1?
Figure: PCA applied to the stocks of the FTSE index (June 2012)
Thierry Roncalli New Trends in Asset Management 11 / 67

Foundations of portfolio managementThe risk management revolution
Smart beta & factor investingAlternative risk premia
Other topics
MotivationsWhich risk factors?Risk parity portfoliosWhat is the original risk parity strategy
Risk allocationLet x = (x1, . . . ,xn) be the weights of n assets in the portfolio. LetR(x1, . . . ,xn) be a coherent and convex risk measure. We have:
R(x1, . . . ,xn) =n∑
i=1xi ·
∂R(x1, . . . ,xn)∂ xi
=n∑
i=1RCi (x1, . . . ,xn)
Let b = (b1, . . . ,bn) be a vector of budgets such that bi ≥ 0 and∑ni=1 bi = 1. We consider two allocation schemes:1 Weight budgeting (WB)
xi = bi2 Risk budgeting (RB)
RCi = bi ·R(x1, . . . ,xn)
Thierry Roncalli New Trends in Asset Management 12 / 67

Foundations of portfolio managementThe risk management revolution
Smart beta & factor investingAlternative risk premia
Other topics
MotivationsWhich risk factors?Risk parity portfoliosWhat is the original risk parity strategy
Original risk parity with the volatility risk measureLet Σ be the covariance matrix of the assets returns. We assume that therisk measure R(x) is the volatility of the portfolio σ (x) =
√x>Σx . We
have:∂R(x)∂ x = Σx√
x>Σx
RCi (x1, . . . ,xn) = xi ·(Σx)i√x>Σx
n∑i=1
RCi (x1, . . . ,xn) =n∑
i=1xi ·
(Σx)i√x>Σx
= x> Σx√x>Σx
= σ (x)
The risk budgeting portfolio is defined by this system of equations:
RCi (x) = xi ·(Σx)iσ (x) = bi ·σ (x)
Thierry Roncalli New Trends in Asset Management 13 / 67

Foundations of portfolio managementThe risk management revolution
Smart beta & factor investingAlternative risk premia
Other topics
MotivationsWhich risk factors?Risk parity portfoliosWhat is the original risk parity strategy
An example
Illustration3 assetsVolatilities are respectively 30%,20% and 15%Correlations are set to 80% betweenthe 1st asset and the 2nd asset,50% between the 1st asset and the3rd asset and 30% between the 2nd
asset and the 3rd assetBudgets are set to 50%, 20% and30%For the ERC (Equal RiskContribution) portfolio, all theassets have the same risk budget
Absolute Relative
1 50.00% 29.40% 14.70% 70.43%
2 20.00% 16.63% 3.33% 15.93%
3 30.00% 9.49% 2.85% 13.64%
Volatility 20.87%
Absolute Relative
1 31.15% 28.08% 8.74% 50.00%
2 21.90% 15.97% 3.50% 20.00%
3 46.96% 11.17% 5.25% 30.00%
Volatility 17.49%
Absolute Relative
1 19.69% 27.31% 5.38% 33.33%
2 32.44% 16.57% 5.38% 33.33%
3 47.87% 11.23% 5.38% 33.33%
Volatility 16.13%
ERC approach
Asset WeightMarginal
Risk
Risk Contribution
Asset WeightMarginal
Risk
Risk Contribution
Weight budgeting (or traditional) approach
Asset WeightMarginal
Risk
Risk Contribution
Risk budgeting approach
Thierry Roncalli New Trends in Asset Management 14 / 67
Foundations of portfolio managementThe risk management revolution
Smart beta & factor investingAlternative risk premia
Other topics
MotivationsWhich risk factors?Risk parity portfoliosWhat is the original risk parity strategy
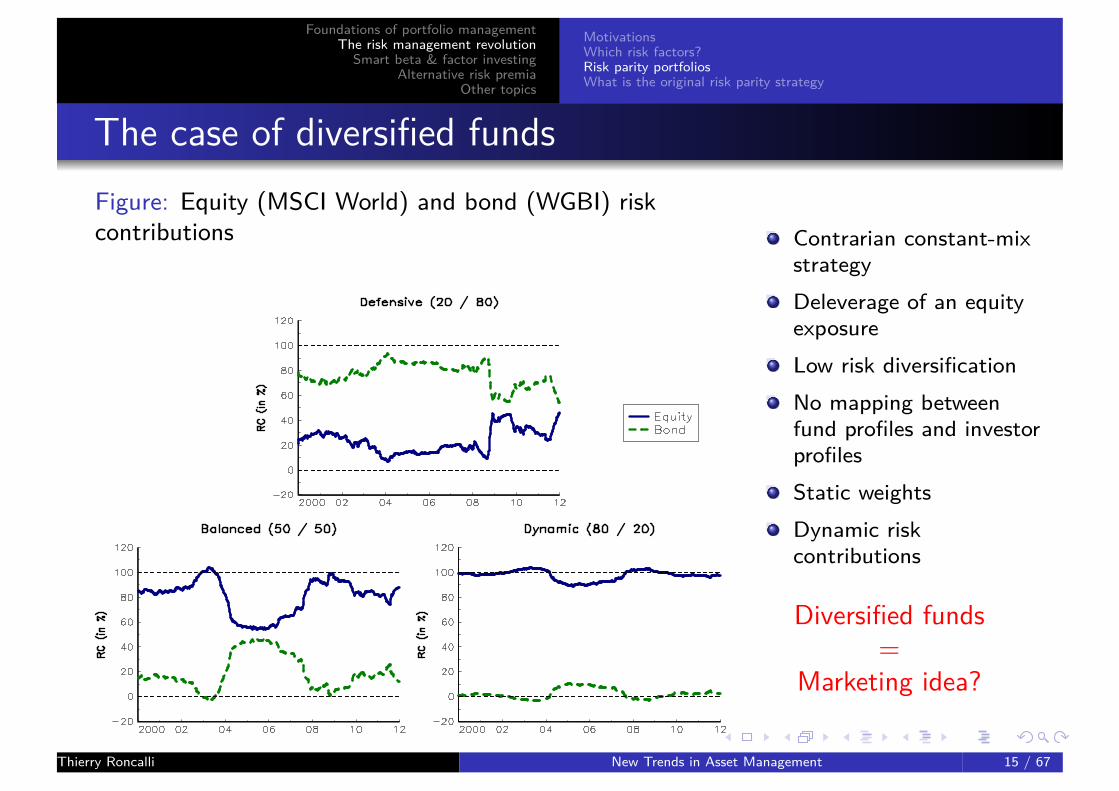
The case of diversified fundsFigure: Equity (MSCI World) and bond (WGBI) riskcontributions Contrarian constant-mix
strategyDeleverage of an equityexposureLow risk diversificationNo mapping betweenfund profiles and investorprofilesStatic weightsDynamic riskcontributions
Diversified funds=
Marketing idea?
Thierry Roncalli New Trends in Asset Management 15 / 67

Foundations of portfolio managementThe risk management revolution
Smart beta & factor investingAlternative risk premia
Other topics
MotivationsWhich risk factors?Risk parity portfoliosWhat is the original risk parity strategy
Reducing volatility and maximizing diversificationThe ERC portfolio is the solution of this optimization program:
x? = argmin 12x>Σx
u.c.
∑n
i=1 lnxi ≥ κ1>x = 1x ≥ 0
⇒ Trade-off between volatility reduction and weight diversification.
The ERC portfolio is located between MV and EW portfolios:
xi = xj (EW)∂xi R(x) = ∂xj R(x) (MV)RCi = RCj (ERC)
and we have:σ (xmv)≤ σ (xerc)≤ σ (xew)
Thierry Roncalli New Trends in Asset Management 16 / 67

Foundations of portfolio managementThe risk management revolution
Smart beta & factor investingAlternative risk premia
Other topics
MotivationsWhich risk factors?Risk parity portfoliosWhat is the original risk parity strategy
What is the original risk parity strategy
Equity smart betaStock volatilityrisk measureERC Eurostoxx50 Index, etc.
4
Bond smart betaCredit volatilityrisk measureRB EGBI Index,etc.
4
Diversified fundsAsset volatilityrisk measureNaive risk parityfunds.
4
⇒ The original risk parity strategy is a portfolio allocation approach toharvest risk premia across or within asset classes in the most efficient way.�� ��Risk parity = risk premium parity = diversification
Thierry Roncalli New Trends in Asset Management 17 / 67

Foundations of portfolio managementThe risk management revolution
Smart beta & factor investingAlternative risk premia
Other topics
MotivationsWhich risk factors?Risk parity portfoliosWhat is the original risk parity strategy
. . . and what it is not
Absolute return strategyAll Weather Fund (Bridgewater Associates)Risk parity funds: AQR, Invesco, Lyxor, Raiffeisen, etc.
8
⇒ The original risk parity strategy is NOT an absolute returnstrategy.
Thierry Roncalli New Trends in Asset Management 18 / 67

Foundations of portfolio managementThe risk management revolution
Smart beta & factor investingAlternative risk premia
Other topics
The rationale for factor investingA subset of smart betaFact and fantasiesNew paradigms for the equity active management
What is the rationale for factor investing?
How to define risk factors?Risk factors are common factors that explain the variance of expectedreturns
1964: Market or MKT (or BETA) factor1972: Low beta or BAB factor1981: Size or SMB factor1985: Value or HML factor1991: Low volatility or VOL factor1993: Momentum or WML factor2000: Quality or QMJ factor
Factor investing is a subset of smart (new) beta
Thierry Roncalli New Trends in Asset Management 19 / 67

Foundations of portfolio managementThe risk management revolution
Smart beta & factor investingAlternative risk premia
Other topics
The rationale for factor investingA subset of smart betaFact and fantasiesNew paradigms for the equity active management
What is the rationale for factor investing?
At the security level, there is a lot of idiosyncratic risk or alpha:
Common IdiosyncraticRisk Risk
GOOGLE 47% 53%NETFLIX 24% 76%MASTERCARD 50% 50%NOKIA 32% 68%TOTAL 89% 11%AIRBUS 56% 44%
Source: Cazalet and Roncalli (2014)
Thierry Roncalli New Trends in Asset Management 20 / 67

Foundations of portfolio managementThe risk management revolution
Smart beta & factor investingAlternative risk premia
Other topics
The rationale for factor investingA subset of smart betaFact and fantasiesNew paradigms for the equity active management
What is the rationale for factor investing?
Jensen (1968):α =−fees
Hendricks et al. (1993) – Hot Hands in Mutual Funds:
cov (αt ,αt−1)> 0
where:αt = R (t)−βMRM (t)
⇒ The persistence of the performance of active management is due to thepersistence of the alpha
Thierry Roncalli New Trends in Asset Management 21 / 67

Foundations of portfolio managementThe risk management revolution
Smart beta & factor investingAlternative risk premia
Other topics
The rationale for factor investingA subset of smart betaFact and fantasiesNew paradigms for the equity active management
What is the rationale for factor investing?
Grinblatt et al. (1995) – Momentum investors versus Valueinvestors
“77% of mutual funds are momentum investors”Carhart (1997):
cov (αt ,αt−1) = 0
where:
αt =R (t)−βMRM (t)−βSMBRSMB (t)−βHMLRHML (t)−βWMLRWML (t)
⇒ The (short-term) persistence of the performance of active managementis due to the (short-term) persistence of the performance of riskfactors
Thierry Roncalli New Trends in Asset Management 22 / 67

Foundations of portfolio managementThe risk management revolution
Smart beta & factor investingAlternative risk premia
Other topics
The rationale for factor investingA subset of smart betaFact and fantasiesNew paradigms for the equity active management
What is the rationale for factor investing?
Figure: Alpha decreases with the number of holding assets
Source: Cazalet and Roncalli (2014)Thierry Roncalli New Trends in Asset Management 23 / 67

Foundations of portfolio managementThe risk management revolution
Smart beta & factor investingAlternative risk premia
Other topics
The rationale for factor investingA subset of smart betaFact and fantasiesNew paradigms for the equity active management
What is the rationale for factor investing?
Figure: What proportion of return variance isexplained?
Source: Cazalet and Roncalli (2014)
How many bets are there in largeportfolios of institutional investors?1986 Less than 10% of institutional
portfolio return is explained bysecurity picking and markettiming (Brinson et al., 1986)
2009 Professors’ Report on theNorwegian GPFG: Risk factorsrepresent 99.1% of the fundreturn variation (Ang et al.,2009)
Thierry Roncalli New Trends in Asset Management 24 / 67

Foundations of portfolio managementThe risk management revolution
Smart beta & factor investingAlternative risk premia
Other topics
The rationale for factor investingA subset of smart betaFact and fantasiesNew paradigms for the equity active management
What is the rationale for factor investing?
What lessons can we draw from this?Idiosyncratic risks and specific bets disappear in (large) diversifiedportfolios. Performance of institutional investors is then exposed to riskfactors.
Alpha is not scalable, but risk factors are scalable.
⇒ Risk factors are the only bets that are compatible with diversification.
Thierry Roncalli New Trends in Asset Management 25 / 67

Foundations of portfolio managementThe risk management revolution
Smart beta & factor investingAlternative risk premia
Other topics
The rationale for factor investingA subset of smart betaFact and fantasiesNew paradigms for the equity active management
A subset of smart beta
Table: Definition of Smart Beta
Risk Factor Market Risk Factor Other Risk Factors
Beta Traditional Beta Alternative Betas(Old Beta) (New Betas)
CW, EW, SMB, HML, WML,Smart Beta MDP, ERC BAB, QMJ
MV
Thierry Roncalli New Trends in Asset Management 26 / 67

Foundations of portfolio managementThe risk management revolution
Smart beta & factor investingAlternative risk premia
Other topics
The rationale for factor investingA subset of smart betaFact and fantasiesNew paradigms for the equity active management
Facts and fantasies
Main factRisk factors are a powerful tool to understand the cross-section of(expected) returns.
4
Thierry Roncalli New Trends in Asset Management 27 / 67

Foundations of portfolio managementThe risk management revolution
Smart beta & factor investingAlternative risk premia
Other topics
The rationale for factor investingA subset of smart betaFact and fantasiesNew paradigms for the equity active management
Facts and fantasies
FactCommon risk factors explain more variance than idiosyncratic risks indiversified portfolios.
Some risk factors are more relevant than others, for instance SMB,HML and WML.
Risk premia are time-varying and low-frequency mean-reverting. Thelength of a cycle is between 3 and 10 years.
The explanatory power of risk factors other than the market riskfactor has declined over the last few years, because Beta has beenback since 2003.
4Thierry Roncalli New Trends in Asset Management 28 / 67

Foundations of portfolio managementThe risk management revolution
Smart beta & factor investingAlternative risk premia
Other topics
The rationale for factor investingA subset of smart betaFact and fantasiesNew paradigms for the equity active management
Facts and fantasies
FactLong-only and long/short risk factors have not the same behavior.This is for example the case of BAB and WML factors.
Risk factors are local, not global. It means that risk factors are nothomogeneous. For instance, the value factors in US and Japan cannotbe compared (distressed stocks versus quality stocks).
Factor investing is not a new investment style. It has been largelyused by asset managers and hedge fund managers for a long time.
4
Thierry Roncalli New Trends in Asset Management 29 / 67
Foundations of portfolio managementThe risk management revolution
Smart beta & factor investingAlternative risk premia
Other topics
The rationale for factor investingA subset of smart betaFact and fantasiesNew paradigms for the equity active management
Facts and fantasies
Main fantasyThere are many rewarded risk factors.
8
Thierry Roncalli New Trends in Asset Management 30 / 67

Foundations of portfolio managementThe risk management revolution
Smart beta & factor investingAlternative risk premia
Other topics
The rationale for factor investingA subset of smart betaFact and fantasiesNew paradigms for the equity active management
Facts and fantasies
FantasyRisk factors are not dependent on size. It is a fantasy. Some riskfactors present a size bias, like the HML risk factor.
HML is much more rewarded than WML.
WML exhibits a CTA option profile. This is wrong. The option profileof a CTA is a long straddle whereas WML presents some similaritiesto a short call exposure.
Long-only risk factors are more risky than long/short risk factors.This is not always the case. For instance, the risk of the long/shortWML factor is very high.
8Thierry Roncalli New Trends in Asset Management 31 / 67

Foundations of portfolio managementThe risk management revolution
Smart beta & factor investingAlternative risk premia
Other topics
The rationale for factor investingA subset of smart betaFact and fantasiesNew paradigms for the equity active management
Facts and fantasies
FantasyHML is riskier than WML. It is generally admitted in finance thatcontrarian strategies are riskier than trend-following strategies.However, this is not always the case, such as with the WML factor,which is exposed to momentum crashes.
Strategic asset allocation with risk factors is easier than strategicasset allocation with asset classes. This is not easy, in particular in along-only framework. Estimating the alpha, beta and idiosyncraticvolatility of a long-only risk factor remains an issue, implying thatportfolio allocation is not straightforward.
8
Thierry Roncalli New Trends in Asset Management 32 / 67

Foundations of portfolio managementThe risk management revolution
Smart beta & factor investingAlternative risk premia
Other topics
The rationale for factor investingA subset of smart betaFact and fantasiesNew paradigms for the equity active management
Facts and fantasies
Figure: WML does not exhibit a CTA option profile
Source: Cazalet and Roncalli (2014)
Thierry Roncalli New Trends in Asset Management 33 / 67

Foundations of portfolio managementThe risk management revolution
Smart beta & factor investingAlternative risk premia
Other topics
The rationale for factor investingA subset of smart betaFact and fantasiesNew paradigms for the equity active management
Facts and fantasies
Figure: Value, low beta and carry risk factors are not orthogonal
Source: Cazalet and Roncalli (2014)Thierry Roncalli New Trends in Asset Management 34 / 67

Foundations of portfolio managementThe risk management revolution
Smart beta & factor investingAlternative risk premia
Other topics
The rationale for factor investingA subset of smart betaFact and fantasiesNew paradigms for the equity active management
A new opportunity for active managers
Active management does not reduce to stock pickingUnderstanding the diversification of equity portfoliosStock investing � Sector investing � Factor investingNew tactical products
Thierry Roncalli New Trends in Asset Management 35 / 67

Foundations of portfolio managementThe risk management revolution
Smart beta & factor investingAlternative risk premia
Other topics
The rationale for factor investingA subset of smart betaFact and fantasiesNew paradigms for the equity active management
A new opportunity for active managers
Figure: Heatmap of risk factors (before 2008)
2000 2001 2002 2003 2004 2005 2006 2007 2008
Value
25.5%
Value
6.2%
Momentum
-3.3%
Value
66.9%
Low Beta
31.1%
Size
32.1%
Momentum
39.1%
Momentum
10.1%
Low Beta
-40.9%
Size
23.9%
Momentum
-1.7%
Low Beta
-6.8%
Size
40.6%
Value
30.4%
Value
31.5%
Size
34.3%
Market
2.7%
Momentum
-41.4%
Quality
9.5%
Low Beta
-2.0%
Value
-18.7%
Momentum
27.5%
Momentum
30.1%
Quality
27.9%
Low Beta
31.5%
Quality
1.8%
Market
-43.6%
Low Beta
6.2%
Size
-7.5%
Size
-18.9%
Low Beta
23.9%
Quality
29.5%
Momentum
26.5%
Value
25.5%
Low Beta
-1.0%
Size
-49.0%
Market
-2.2%
Quality
-9.1%
Quality
-26.0%
Quality
19.9%
Size
28.7%
Low Beta
26.1%
Quality
24.1%
Size
-4.4%
Quality
-53.9%
Momentum
-2.3%
Market
-15.5%
Market
-30.7%
Market
15.3%
Market
12.2%
Market
26.1%
Market
19.6%
Value
-9.0%
Value
-63.6%
Source: Richard and Roncalli (2015)
Thierry Roncalli New Trends in Asset Management 36 / 67
Foundations of portfolio managementThe risk management revolution
Smart beta & factor investingAlternative risk premia
Other topics
The rationale for factor investingA subset of smart betaFact and fantasiesNew paradigms for the equity active management
A new opportunity for active managers
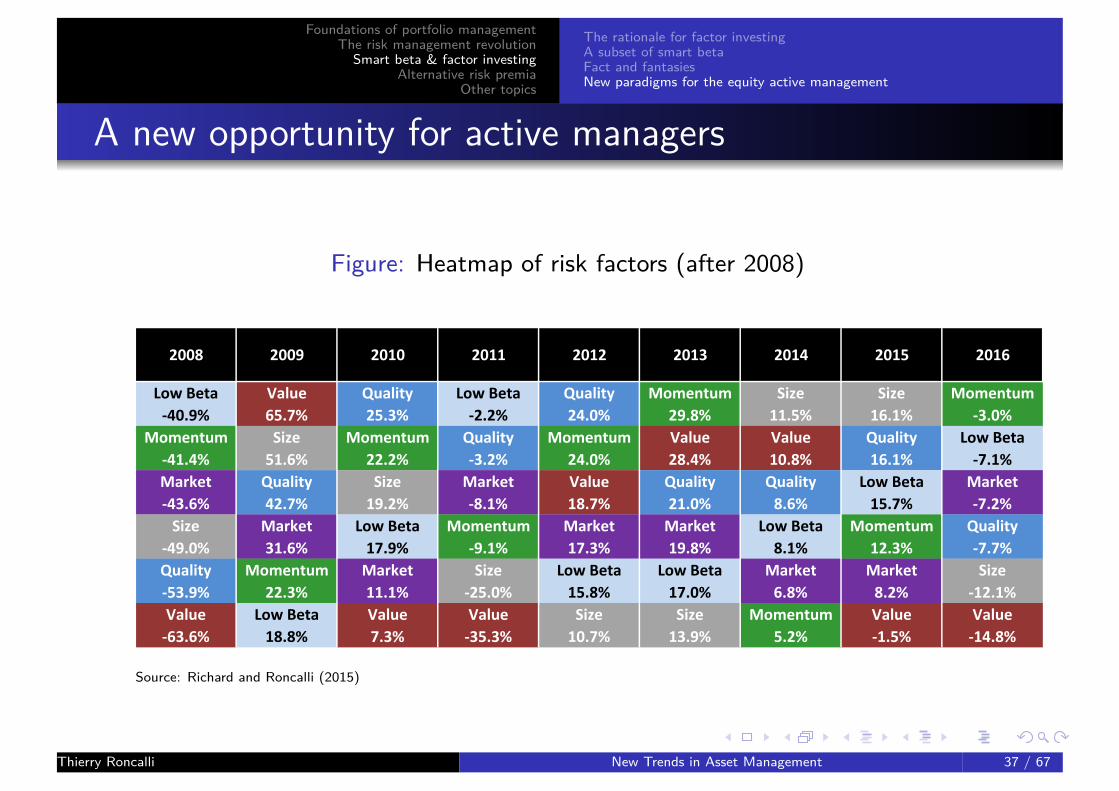
Figure: Heatmap of risk factors (after 2008)
2008 2009 2010 2011 2012 2013 2014 2015 2016
Low Beta
-40.9%
Value
65.7%
Quality
25.3%
Low Beta
-2.2%
Quality
24.0%
Momentum
29.8%
Size
11.5%
Size
16.1%
Momentum
-3.0%
Momentum
-41.4%
Size
51.6%
Momentum
22.2%
Quality
-3.2%
Momentum
24.0%
Value
28.4%
Value
10.8%
Quality
16.1%
Low Beta
-7.1%
Market
-43.6%
Quality
42.7%
Size
19.2%
Market
-8.1%
Value
18.7%
Quality
21.0%
Quality
8.6%
Low Beta
15.7%
Market
-7.2%
Size
-49.0%
Market
31.6%
Low Beta
17.9%
Momentum
-9.1%
Market
17.3%
Market
19.8%
Low Beta
8.1%
Momentum
12.3%
Quality
-7.7%
Quality
-53.9%
Momentum
22.3%
Market
11.1%
Size
-25.0%
Low Beta
15.8%
Low Beta
17.0%
Market
6.8%
Market
8.2%
Size
-12.1%
Value
-63.6%
Low Beta
18.8%
Value
7.3%
Value
-35.3%
Size
10.7%
Size
13.9%
Momentum
5.2%
Value
-1.5%
Value
-14.8%
Source: Richard and Roncalli (2015)
Thierry Roncalli New Trends in Asset Management 37 / 67
Foundations of portfolio managementThe risk management revolution
Smart beta & factor investingAlternative risk premia
Other topics
Skewness risk premia & market anomalies��HHValueCarry and momentum everywhereThe puzzle of skewness aggregation
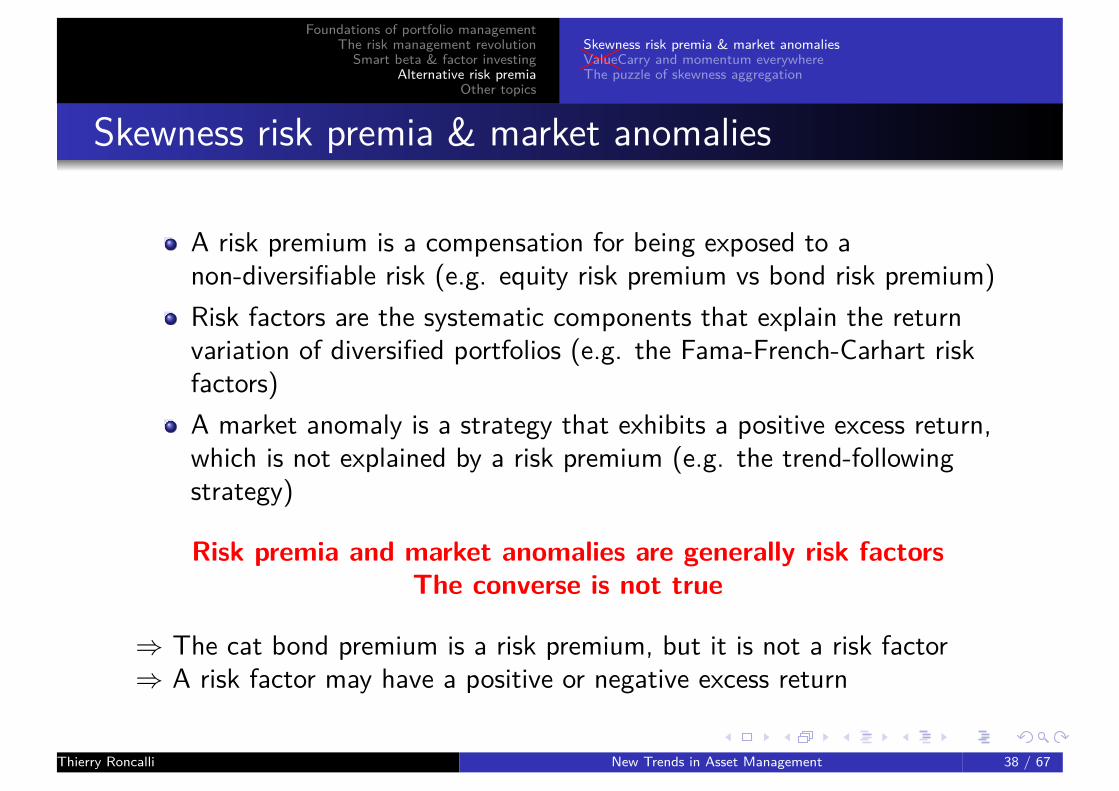
Skewness risk premia & market anomalies
A risk premium is a compensation for being exposed to anon-diversifiable risk (e.g. equity risk premium vs bond risk premium)Risk factors are the systematic components that explain the returnvariation of diversified portfolios (e.g. the Fama-French-Carhart riskfactors)A market anomaly is a strategy that exhibits a positive excess return,which is not explained by a risk premium (e.g. the trend-followingstrategy)
Risk premia and market anomalies are generally risk factorsThe converse is not true
⇒ The cat bond premium is a risk premium, but it is not a risk factor⇒ A risk factor may have a positive or negative excess return
Thierry Roncalli New Trends in Asset Management 38 / 67
Foundations of portfolio managementThe risk management revolution
Smart beta & factor investingAlternative risk premia
Other topics
Skewness risk premia & market anomalies��HHValueCarry and momentum everywhereThe puzzle of skewness aggregation
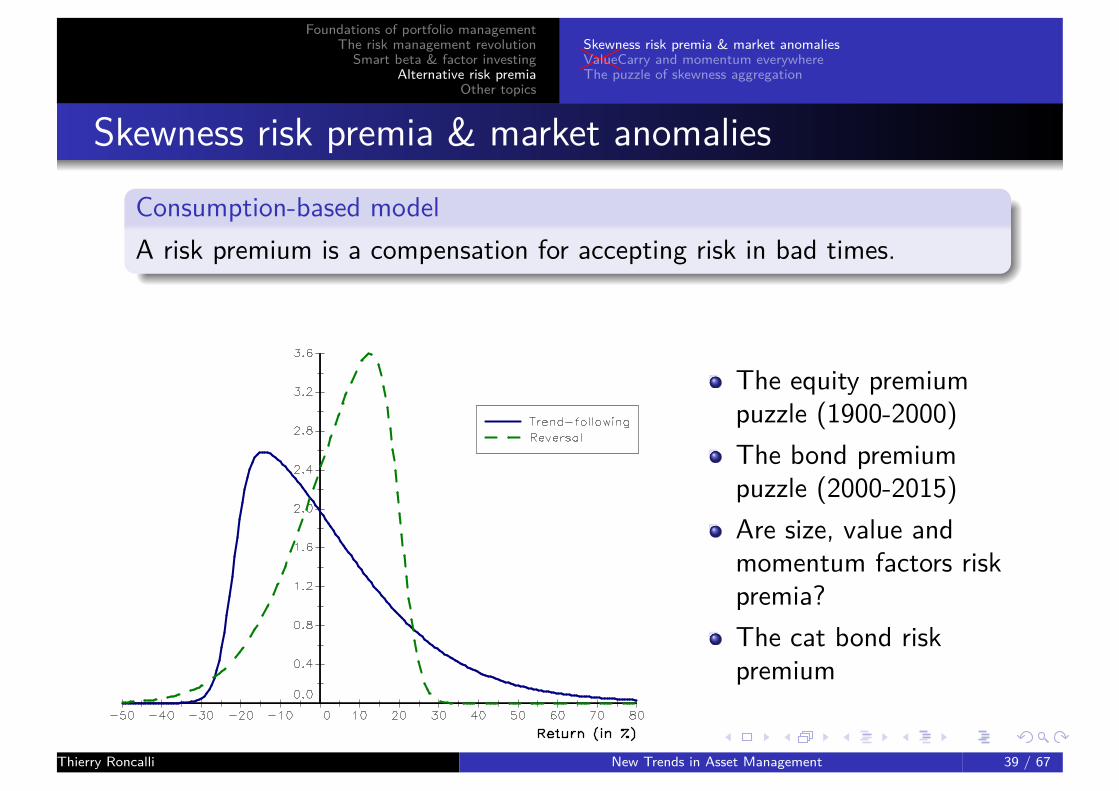
Skewness risk premia & market anomalies
Consumption-based modelA risk premium is a compensation for accepting risk in bad times.
The equity premiumpuzzle (1900-2000)The bond premiumpuzzle (2000-2015)Are size, value andmomentum factors riskpremia?The cat bond riskpremium
Thierry Roncalli New Trends in Asset Management 39 / 67
Foundations of portfolio managementThe risk management revolution
Smart beta & factor investingAlternative risk premia
Other topics
Skewness risk premia & market anomalies��HHValueCarry and momentum everywhereThe puzzle of skewness aggregation
Skewness risk premia & market anomalies
Characterization of alternative risk premiaAn alternative risk premium (ARP) is a risk premium, which is nottraditional
Traditional risk premia (TRP): equities, sovereign/corporate bondsCurrencies and commodities are not TRP
The drawdown of an ARP must be positively correlated to bad timesRisk premia 6= insurance against bad times(SMB, HML) 6= WML
Risk premia are an increasing function of the volatility and adecreasing function of the skewness
In the market practice, alternative risk premia recovers:1 Skewness risk premia (or pure risk premia), which present high
negative skewness and potential large drawdown2 Markets anomalies
Thierry Roncalli New Trends in Asset Management 40 / 67

Foundations of portfolio managementThe risk management revolution
Smart beta & factor investingAlternative risk premia
Other topics
Skewness risk premia & market anomalies��HHValueCarry and momentum everywhereThe puzzle of skewness aggregation
Skewness risk premia & market anomalies
Figure: Which option profile may be considered as askewness risk premium?
����XXXXLong call (risk
adverse)(((
((hhhhhShort call(marketanomaly)
����XXXXLong put
(insurance)Short put
⇒ SMB, HML,���XXXWML,���XXXBAB,���XXXQMJThierry Roncalli New Trends in Asset Management 41 / 67

Foundations of portfolio managementThe risk management revolution
Smart beta & factor investingAlternative risk premia
Other topics
Skewness risk premia & market anomalies��HHValueCarry and momentum everywhereThe puzzle of skewness aggregation
����XXXXValueCarry and momentum everywhere
Figure: Mapping of ARP candidates
Risk Factor Equities Rates Credit Currencies Commodities
FRB FRB
TSS TSS
CTS CTS
Liquidity Amihud liquidity Turn-of-the-month Turn-of-the-month Turn-of-the-month
Cross-section Cross-section Cross-section Cross-section
Time-series Time-series Time-series Time-series
Time-series
Variance
PPP
Economic model
Carry Carry
Term structure Term structure
Buyback
Merger arbitrage
Growth Growth
Low volatility Low volatility
Quality Quality
Size Size
Value Value
Time-series Time-series
FRB
Time-Series
Value
CarryCarry
FRB
Time-series
Momentum
Dividend Futures
High Dividend Yield
Reversal
Volatility
Event
Carry
Value Value
Thierry Roncalli New Trends in Asset Management 42 / 67

Foundations of portfolio managementThe risk management revolution
Smart beta & factor investingAlternative risk premia
Other topics
Skewness risk premia & market anomalies��HHValueCarry and momentum everywhereThe puzzle of skewness aggregation
����XXXXValueCarry and momentum everywhere
Figure: Graph database of bank’s proprietary indices
Commodities
Carry
Liquidity
Momentum
Volatility Credit
Event
Equities
Growth
Low Vol
Quality
Reversal
Value
Rates
Currencies
Multi-Asset
Size
Thierry Roncalli New Trends in Asset Management 43 / 67
Foundations of portfolio managementThe risk management revolution
Smart beta & factor investingAlternative risk premia
Other topics
Skewness risk premia & market anomalies��HHValueCarry and momentum everywhereThe puzzle of skewness aggregation
����XXXXValueCarry and momentum everywhere
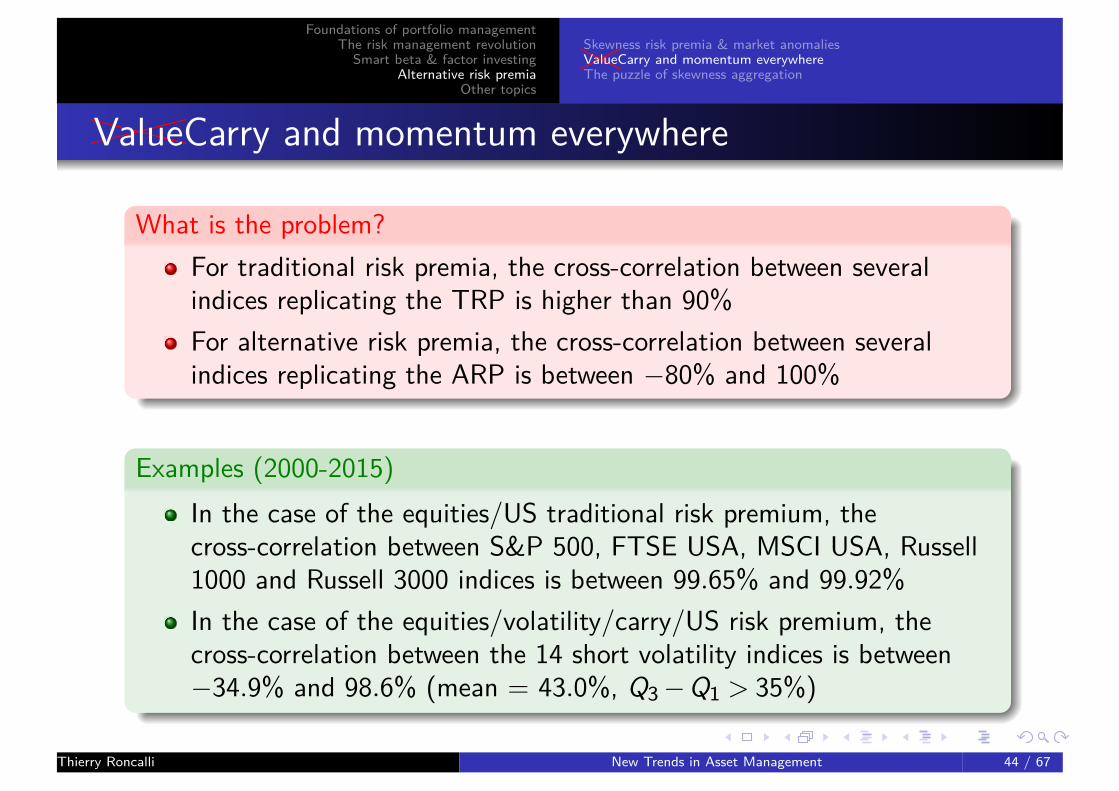
What is the problem?For traditional risk premia, the cross-correlation between severalindices replicating the TRP is higher than 90%For alternative risk premia, the cross-correlation between severalindices replicating the ARP is between −80% and 100%
Examples (2000-2015)In the case of the equities/US traditional risk premium, thecross-correlation between S&P 500, FTSE USA, MSCI USA, Russell1000 and Russell 3000 indices is between 99.65% and 99.92%In the case of the equities/volatility/carry/US risk premium, thecross-correlation between the 14 short volatility indices is between−34.9% and 98.6% (mean = 43.0%, Q3−Q1 > 35%)
Thierry Roncalli New Trends in Asset Management 44 / 67

Foundations of portfolio managementThe risk management revolution
Smart beta & factor investingAlternative risk premia
Other topics
Skewness risk premia & market anomalies��HHValueCarry and momentum everywhereThe puzzle of skewness aggregation
����XXXXValueCarry and momentum everywhere
The identification protocolStep 1 Define the set of relevant indices (qualitative due diligence).
Step 2 Given an initial set of indices, the underlying idea is to find thesubset, whose elements present very similar patterns. For that, we usethe deletion algorithm using the R2 statistic:
Rk,t = αk +βkR(−k)t +εk,t ⇒ R2
k
Step 3 The algorithm stops when the similarity is larger than a giventhreshold for all the elements of the subset (e.g. R2
k > R2min = 70%).
Step 4 The generic backtest of the ARP is the weighted average of theperformance of the subset elements
Thierry Roncalli New Trends in Asset Management 45 / 67

Foundations of portfolio managementThe risk management revolution
Smart beta & factor investingAlternative risk premia
Other topics
Skewness risk premia & market anomalies��HHValueCarry and momentum everywhereThe puzzle of skewness aggregation
����XXXXValueCarry and momentum everywhere
Illustration with the equities/volatility/carry/US risk premium
Barclays (BXIISVUE)90.2%Citi (CIISEVCU) 92.4%Citi (CIISEVWU) 97.0%JP Morgan (AIJPSV1U)93.4%SG (SGIXVPUX) 94.9%
Thierry Roncalli New Trends in Asset Management 46 / 67
Foundations of portfolio managementThe risk management revolution
Smart beta & factor investingAlternative risk premia
Other topics
Skewness risk premia & market anomalies��HHValueCarry and momentum everywhereThe puzzle of skewness aggregation
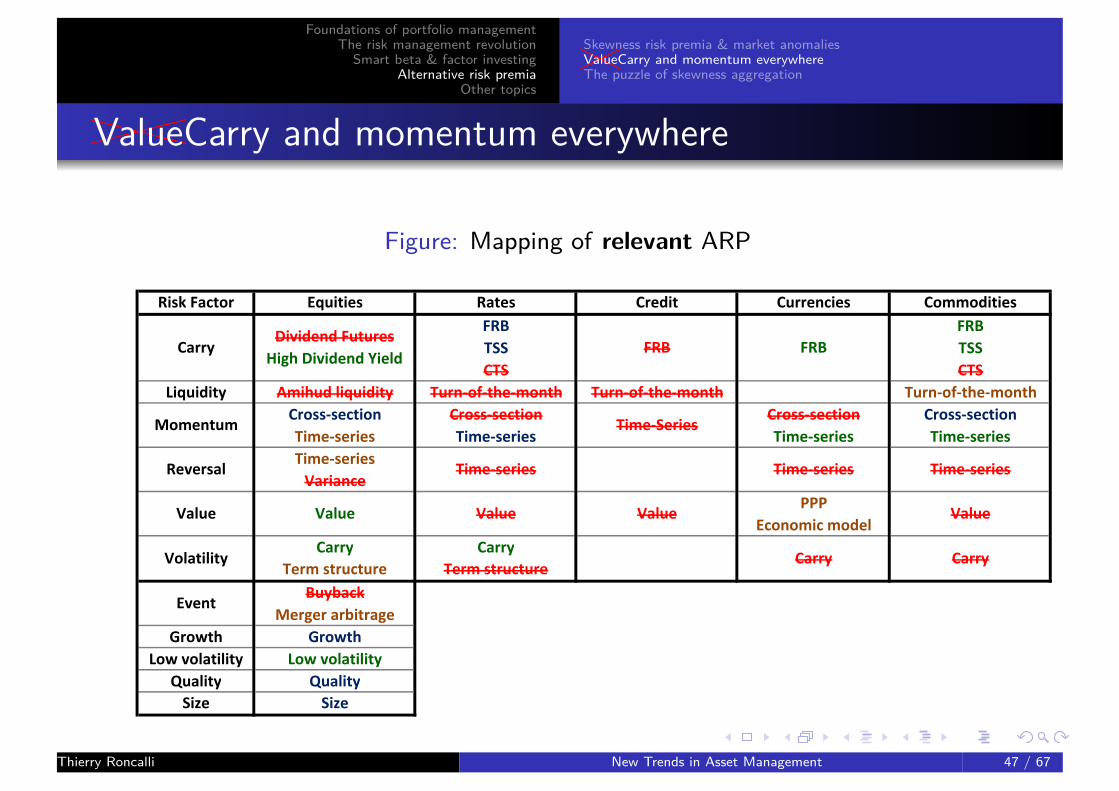
����XXXXValueCarry and momentum everywhere
Figure: Mapping of relevant ARP
Risk Factor Equities Rates Credit Currencies Commodities
FRB FRB
TSS TSS
CTS CTS
Liquidity Amihud liquidity Turn-of-the-month Turn-of-the-month Turn-of-the-month
Cross-section Cross-section Cross-section Cross-section
Time-series Time-series Time-series Time-series
Time-series
Variance
PPP
Economic model
Carry Carry
Term structure Term structure
Buyback
Merger arbitrage
Growth Growth
Low volatility Low volatility
Quality Quality
Size Size
Volatility Carry Carry
Event
Reversal Time-series Time-series Time-series
Value Value Value Value Value
CarryDividend Futures
High Dividend YieldFRB FRB
Momentum Time-Series
Thierry Roncalli New Trends in Asset Management 47 / 67

Foundations of portfolio managementThe risk management revolution
Smart beta & factor investingAlternative risk premia
Other topics
Skewness risk premia & market anomalies��HHValueCarry and momentum everywhereThe puzzle of skewness aggregation
����XXXXValueCarry and momentum everywhere
���XXXValue Carry and momentum everywhereSome ARP candidates are not relevant (e.g. liquidity premium inequities, rates and currencies; reversal premium using variance swaps;value premium in rates and commodities; dividend premium; volatilitypremium in currencies and commodities; correlation premium;seasonality premium.)Hierarchy of ARP
Equities value, carry, low volatility, volatility/carry, momentum, quality, growth,size, event, reversal
Rates volatility/carry, momentum, carryCurrencies carry, momentum, value
Commodities carry, momentum, liquidityCarry recovers different notions: FRB, TSS and CTS
Thierry Roncalli New Trends in Asset Management 48 / 67

Foundations of portfolio managementThe risk management revolution
Smart beta & factor investingAlternative risk premia
Other topics
Skewness risk premia & market anomalies��HHValueCarry and momentum everywhereThe puzzle of skewness aggregation
The skewness puzzle
ARP are not all-weather strategies:Extreme risks of ARP are high and may be correlatedAggregation of skewness is not straightforward
Skewness aggregation 6= volatility aggregationWhen we accumulate long/short skewness risk premia in a portfolio, thevolatility of this portfolio decreases dramatically, but its skewness riskgenerally increases!
⇒ Skewness diversification 6= volatility diversification
Thierry Roncalli New Trends in Asset Management 49 / 67

Foundations of portfolio managementThe risk management revolution
Smart beta & factor investingAlternative risk premia
Other topics
Skewness risk premia & market anomalies��HHValueCarry and momentum everywhereThe puzzle of skewness aggregation
The skewness puzzle
Figure: Skewness aggregation of L/S alternative risk premia
Source: HPRZ (2016)
Thierry Roncalli New Trends in Asset Management 50 / 67

Foundations of portfolio managementThe risk management revolution
Smart beta & factor investingAlternative risk premia
Other topics
Skewness risk premia & market anomalies��HHValueCarry and momentum everywhereThe puzzle of skewness aggregation
The skewness puzzle
Figure: Skewness aggregation in the case of the bivariate log-normal distribution
Source: HPRZ (2016)
Thierry Roncalli New Trends in Asset Management 51 / 67

Foundations of portfolio managementThe risk management revolution
Smart beta & factor investingAlternative risk premia
Other topics
Skewness risk premia & market anomalies��HHValueCarry and momentum everywhereThe puzzle of skewness aggregation
The skewness puzzle
Figure: Cumulative performance of US bonds, US equities and US short volatility
Source: BKR (2016)
Thierry Roncalli New Trends in Asset Management 52 / 67

Foundations of portfolio managementThe risk management revolution
Smart beta & factor investingAlternative risk premia
Other topics
Skewness risk premia & market anomalies��HHValueCarry and momentum everywhereThe puzzle of skewness aggregation
The skewness puzzle
Figure: Comparison of Gaussian and mixture models
Thierry Roncalli New Trends in Asset Management 53 / 67

Foundations of portfolio managementThe risk management revolution
Smart beta & factor investingAlternative risk premia
Other topics
Skewness risk premia & market anomalies��HHValueCarry and momentum everywhereThe puzzle of skewness aggregation
The skewness puzzle
Figure: Comparison of the carry allocation
Thierry Roncalli New Trends in Asset Management 54 / 67

Foundations of portfolio managementThe risk management revolution
Smart beta & factor investingAlternative risk premia
Other topics
Skewness risk premia & market anomalies��HHValueCarry and momentum everywhereThe puzzle of skewness aggregation
Volatility hedging versus skewness hedging
Table: Volatility and skewness risks of risk-based portfolios (weekly model)
Portfolio MV MV ERC MES
Model Gaussian Jump model(full sample) Normal Mixture Mixture
Bonds 63.26% 36.05% 52.71% 100.00%Equities 2.23% 0.00% 10.36% 0.00%Carry 34.51% 63.95% 36.93% 0.00%σ (x) 2.62% 2.33% 2.75% 4.17%γ1 −2.75 −19.81 −6.17 0.00
Source: BKR (2016)
The arithmetics of skewness
−(36.05%×0.17+0%×0.44+63.95%×5.77) =−19.81
Thierry Roncalli New Trends in Asset Management 55 / 67

Foundations of portfolio managementThe risk management revolution
Smart beta & factor investingAlternative risk premia
Other topics
The lost generation of value investorsThe diversification enigmaThe impact of low/negative interest ratesThe rise of robo-advisorsThe liability dilemma
The lost generation of value investors
The value of value investorsA value strategy exhibits a high skewness risk (' default risk)Markets need value investors in order to exist, because they are theonly investors who are able to reverse the market (in a bull market,but more important in a bear market)Value investors also provide liquidityMarkets have to reward value investors
Since 2008The equity market has not rewarded value investorsThe bond/credit market has rewarded value investorsWho are the value investors in illiquid markets?
⇒ The number of value investors decreases dramatically!Thierry Roncalli New Trends in Asset Management 56 / 67

Foundations of portfolio managementThe risk management revolution
Smart beta & factor investingAlternative risk premia
Other topics
The lost generation of value investorsThe diversification enigmaThe impact of low/negative interest ratesThe rise of robo-advisorsThe liability dilemma
The diversification enigma
Consider a portfolio with 2 assets: R = x1R1 + x2R2. We have:
var(R) = x21σ21 + x22σ22 +2x1x2ρσ1σ2
Best solution in terms of volatility diversificationLong-only portfolios:
ρ=−1
Long/short portfolios:ρ= 0
⇒ Long/short portfolio management can not mimick long-only portfoliomanagement
The notion of diversification is not universal
Thierry Roncalli New Trends in Asset Management 57 / 67
Foundations of portfolio managementThe risk management revolution
Smart beta & factor investingAlternative risk premia
Other topics
The lost generation of value investorsThe diversification enigmaThe impact of low/negative interest ratesThe rise of robo-advisorsThe liability dilemma
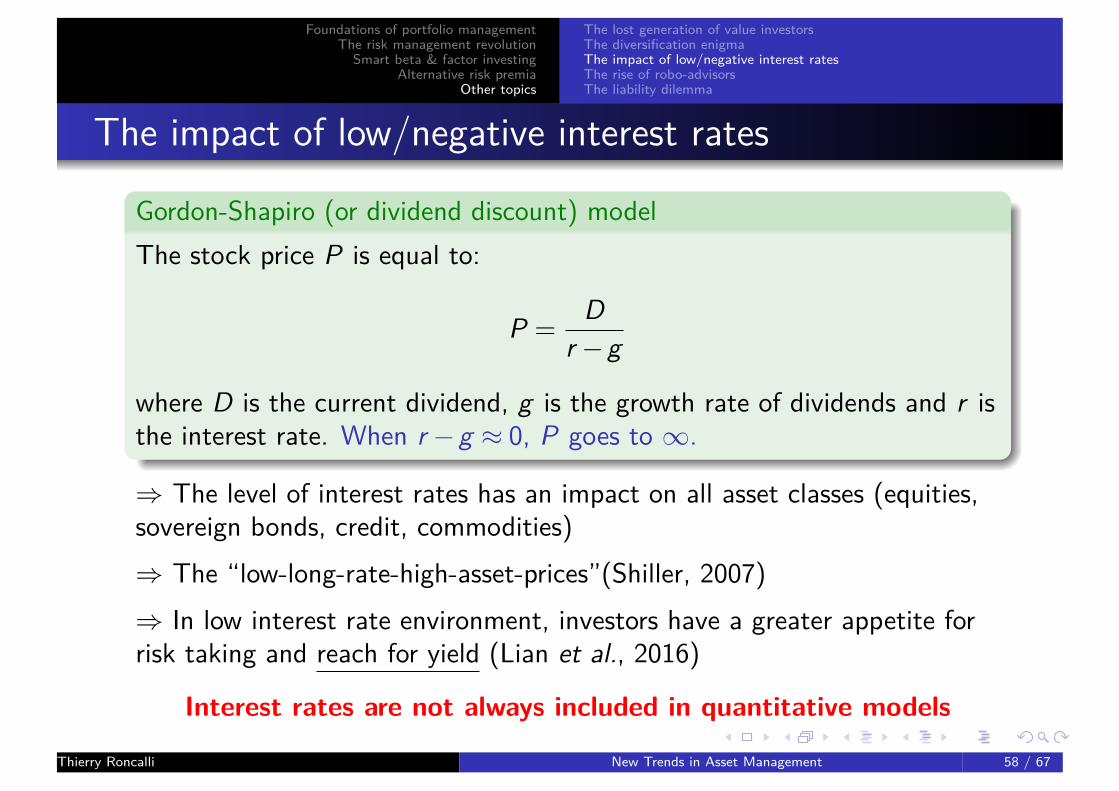
The impact of low/negative interest rates
Gordon-Shapiro (or dividend discount) modelThe stock price P is equal to:
P = Dr −g
where D is the current dividend, g is the growth rate of dividends and r isthe interest rate. When r −g ≈ 0, P goes to ∞.
⇒ The level of interest rates has an impact on all asset classes (equities,sovereign bonds, credit, commodities)⇒ The “low-long-rate-high-asset-prices”(Shiller, 2007)⇒ In low interest rate environment, investors have a greater appetite forrisk taking and reach for yield (Lian et al., 2016)
Interest rates are not always included in quantitative models
Thierry Roncalli New Trends in Asset Management 58 / 67
Foundations of portfolio managementThe risk management revolution
Smart beta & factor investingAlternative risk premia
Other topics
The lost generation of value investorsThe diversification enigmaThe impact of low/negative interest ratesThe rise of robo-advisorsThe liability dilemma
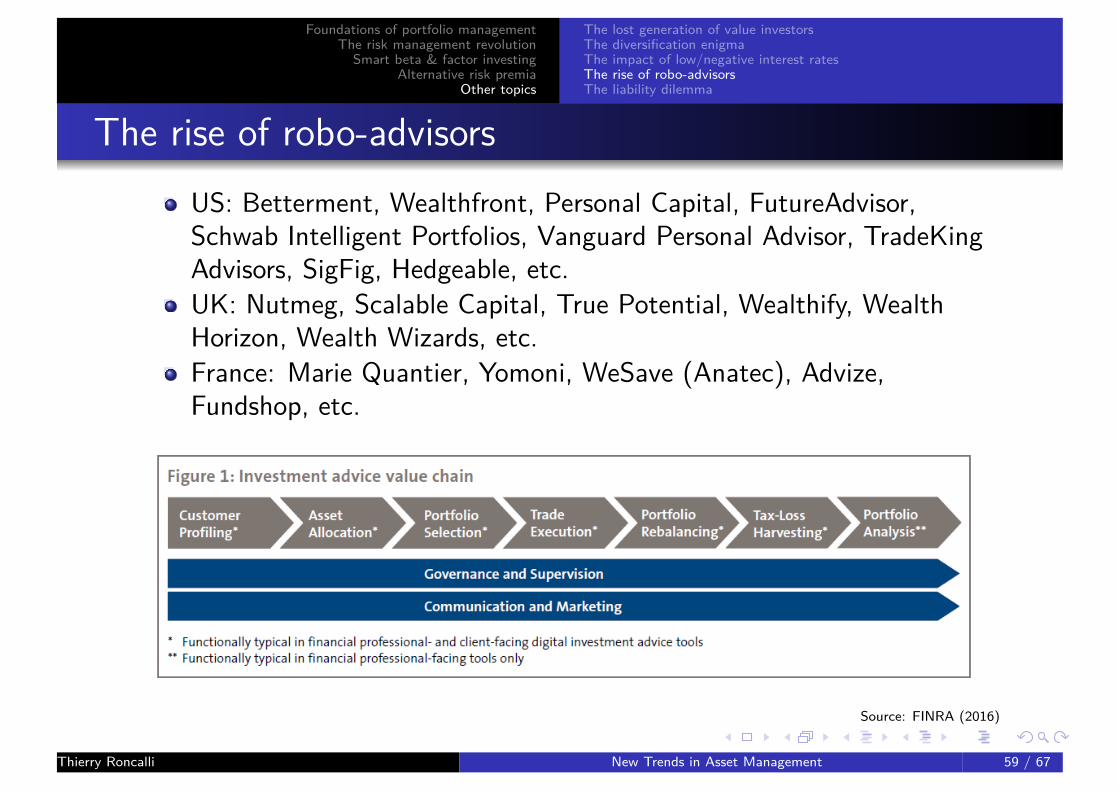
The rise of robo-advisorsUS: Betterment, Wealthfront, Personal Capital, FutureAdvisor,Schwab Intelligent Portfolios, Vanguard Personal Advisor, TradeKingAdvisors, SigFig, Hedgeable, etc.UK: Nutmeg, Scalable Capital, True Potential, Wealthify, WealthHorizon, Wealth Wizards, etc.France: Marie Quantier, Yomoni, WeSave (Anatec), Advize,Fundshop, etc.
Source: FINRA (2016)
Thierry Roncalli New Trends in Asset Management 59 / 67

Foundations of portfolio managementThe risk management revolution
Smart beta & factor investingAlternative risk premia
Other topics
The lost generation of value investorsThe diversification enigmaThe impact of low/negative interest ratesThe rise of robo-advisorsThe liability dilemma
The rise of robo-advisors
The response of the quantitative asset management forindividual/household investors
Mass customization (Martellini, 2016)
The problem of distribution costs:
retrocession payments⇒ fee-based models?
Thierry Roncalli New Trends in Asset Management 60 / 67

Foundations of portfolio managementThe risk management revolution
Smart beta & factor investingAlternative risk premia
Other topics
The lost generation of value investorsThe diversification enigmaThe impact of low/negative interest ratesThe rise of robo-advisorsThe liability dilemma
The liability dilemma
Liabilities change portfolio managementTarget-date funds (TDF)Liability-driven investment (LDI)Goal based investing (GBI)
This is one of the big challenge of (quantitative) asset management
Thierry Roncalli New Trends in Asset Management 61 / 67

Foundations of portfolio managementThe risk management revolution
Smart beta & factor investingAlternative risk premia
Other topics
The lost generation of value investorsThe diversification enigmaThe impact of low/negative interest ratesThe rise of robo-advisorsThe liability dilemma
The liability dilemma
Figure: Allocation of the Fidelity ClearPath R© 2045 Retirement Portfolio
Source: www.fidelity.ca.Thierry Roncalli New Trends in Asset Management 62 / 67

Foundations of portfolio managementThe risk management revolution
Smart beta & factor investingAlternative risk premia
Other topics
The lost generation of value investorsThe diversification enigmaThe impact of low/negative interest ratesThe rise of robo-advisorsThe liability dilemma
References I
Ang, A., Goetzmann, W., and Schaefer, S.Evaluation of Active Management of the Norwegian GPFG.Norway: Ministry of Finance, 2009.
Brinson, G.P., Hood, L.R., and Beebower, G.L.Determinants of Portfolio Performance.Financial Analysts Journal, 42(4), 1986.
Bruder, B., Kostyuchyk, N. and Roncalli, T. (BKR)Risk Parity Portfolios with Skewness Risk: An Application to Factor Investing andAlternative Risk Premia.SSRN, www.ssrn.com/abstract=2813384, 2016.
Carhart, M.M.On Persistence in Mutual Fund Performance.Journal of Finance, 52(1), 1997.
Thierry Roncalli New Trends in Asset Management 63 / 67

Foundations of portfolio managementThe risk management revolution
Smart beta & factor investingAlternative risk premia
Other topics
The lost generation of value investorsThe diversification enigmaThe impact of low/negative interest ratesThe rise of robo-advisorsThe liability dilemma
References II
Cazalet, Z., and Roncalli, T.Facts and Fantasies About Factor Investing.SSRN, www.ssrn.com/abstract=2524547, 2014.
Financial Industry Regulatory Authorithy (FINRA).Report on Digital Investment Advice.www.finra.org, March 2016.
Grinblatt, M., Titman, S. and Wermers, R.Momentum Investment Strategies, Portfolio Performance and Herding: A Study ofMutual Fund Behavior.American Economic Review, 85(5), 1995.
Hamdan, R., Pavlowsky, F., Roncalli, T. and Zheng, B. (HPRZ)A Primer on Alternative Risk Premia.SSRN, www.ssrn.com/abstract=2766850, 2016.
Thierry Roncalli New Trends in Asset Management 64 / 67

Foundations of portfolio managementThe risk management revolution
Smart beta & factor investingAlternative risk premia
Other topics
The lost generation of value investorsThe diversification enigmaThe impact of low/negative interest ratesThe rise of robo-advisorsThe liability dilemma
References III
Hendricks, D., Patel, J. and Zeckhauser, R.Hot Hands in Mutual Funds: Short-Run Persistence of Relative Performance.Journal of Finance, 48(1), 1993.
Lian, C., Ma, Y., and Wang, C.Low Interest Rates and Risk Taking: Evidence from Individual InvestmentDecisions.SSRN, www.ssrn.com/abstract=2809191, 2016.
Maillard, S., Roncalli, T. and Teïletche, J.The Properties of Equally Weighted Risk Contribution Portfolios.Journal of Portfolio Management, 36(4), 2010.
Markowitz, H.Portfolio Selection.Journal of Finance, 7(1), 1952.
Thierry Roncalli New Trends in Asset Management 65 / 67

Foundations of portfolio managementThe risk management revolution
Smart beta & factor investingAlternative risk premia
Other topics
The lost generation of value investorsThe diversification enigmaThe impact of low/negative interest ratesThe rise of robo-advisorsThe liability dilemma
References IV
Martellini, L.The Rise of the Robo-Advisors.EDHEC-Risk Institute, 2016.
Michaud, R.The Markowitz Optimization Enigma: Is Optimized Optimal?Financial Analysts Journal, 45(1), 1989.
Roncalli, T.Introduction to Risk Parity and Budgeting.Chapman & Hall/CRC Financial Mathematics Series, 2013.
Sharpe, W.F.Capital Asset Prices: A Theory of Market Equilibrium under Conditions of Risk.Journal of Finance, 19(3), 1964.
Thierry Roncalli New Trends in Asset Management 66 / 67

Foundations of portfolio managementThe risk management revolution
Smart beta & factor investingAlternative risk premia
Other topics
The lost generation of value investorsThe diversification enigmaThe impact of low/negative interest ratesThe rise of robo-advisorsThe liability dilemma
References VShiller, R.J.Low Interest Rates and High Asset Prices: An Interpretation in terms of ChangingPopular Economic Models.National Bureau of Economic Research, 13558, 2007.
Sironi, P.From Robo-Adviors to Goal Based Investing and Gamification.Wiley, 2016.
Tibshirani, R.Regression Shrinkage and Selection via the Lasso.Journal of the Royal Statistical Society B, 58(1), 1996.
Tobin, J.Liquidity Preference as Behavior Towards Risk.Review of Economic Studies, 25(2), 1964.
Varian, H.Big Data: New Tricks for Econometrics.SSRN, 2013.
Thierry Roncalli New Trends in Asset Management 67 / 67