nhs england board paper · 5 ons place local area into one of eight supergroup areas based on their...
TRANSCRIPT
OFFICIAL
Page 1 of 20
Paper: PB.29.03.2018/09
NHS ENGLAND – BOARD PAPER
Title: “Scene setter” on current trends in health inequalities
Lead Director: Steve Powis, National Medical Director Jane Cummings, Chief Nurse Neil Churchill, Director for Experience, Participation and Equalities
Purpose of Paper: This paper:
outlines NHS England’s obligations and strategic approach to tackling health inequalities;
summarises the evidence as to the scale of the challenge, including what do we know about the emerging trends of reduced growth in life expectancy and how we compare internationally;
describes the specific interventions in relation to our signature national programmes on reducing/tackling health inequalities;
identifies how the NHS contributes as an employer through its spending and the economic impact of NHS as a polluter;
identifies how do we address these emerging inequalities as well as long-standing inequalities in resource allocations; and
outlines next steps.
The Board invited to:
Note NHS England’s approach and our focus on priority actions.

OFFICIAL
Page 2 of 20
The Role of NHS England in relation to health inequalities
1. NHS England has continued to focus on a range of work programmes with the aim of addressing health inequalities in line with the objectives set out in the Next Steps on the NHS Five Year Forward View (FYFV) and the criteria set by the Secretary of State. NHS England also has a legal duty to `have regard to reduce health inequalities’, as required by the Health and Social Care Act 2012.
2. NHS England has the capacity to tackle health inequalities in three ways:
As a system leader, in collaboration with other parts of the health and care system;
In delivering our priority programmes set out in the Five Year Forward View; and
Through the effective discharge of our commissioning functions. This includes the way we directly commission services, support and assure CCG commissioning, the work we do on incentives, and in publication of tools and resources to support delivery.
3. However, there are some specific challenges, including the fact that NHS England’s
functions will have limited impact in isolation; at least as important will be collaborative actions with partner organisation, including Public Health England (PHE), local government and partnerships between public services and the voluntary sector.
What the Evidence Tells Us
4. Overall life expectancy and healthy life expectancy remain relatively stable1:
Life expectancy at birth for England as a whole remained the same in 2014-16 as in 2013-15 for both sexes: 79.5 years for males and 83.1 years for females2.
Latest data for 2014-16 indicates a fall in healthy life expectancy in England for both sexes. For males, it fell to 63.3 years, having been 63.4 years in the previous two time periods. For females, it fell to 63.9 years, from 64.1 years in 2013-15. However, for neither sex were these falls statistically significant.
Since 2001, there has been a general improvement in the age-standardised mortality rate. However, since 2011 the rate fluctuated more and the rate of improvement seems to be less than in the period from 2001 to 2011.
5. Inequalities in life expectancy and healthy life expectancy are nearly all worsening3:
1 What’s new in the February PHOF update? PHE Feb 2018. Currently available at
https://publichealthmatters.blog.gov.uk/2018/02/07/whats-new-in-the-february-phof-update/. Also Office for National Statistics, Health state life expectancies, UK: 2014 to 2016, 7 December 2017. Currently available at https://www.ons.gov.uk/peoplepopulationandcommunity/healthandsocialcare/healthandlifeexpectancies/bulletins/healthstatelifeexpectanciesuk/2014to2016 2 Life expectancy at birth and selected older ages, ONS, 23 March 2018, data release has PHE’s 2017 figures of 79.6 years
for males and 83.2 years for females. These figures are provisional, rounded to one decimal place, and do not include the statistical uncertainty (which is larger than three year averages). With these caveats considered, comparing 2017 to 2014 suggests that central estimates of life expectancy in 2015-2017 will remain the same for females, but may increase by around 0.03 years for males. Currently available at https://www.ons.gov.uk/peoplepopulationandcommunity/birthsdeathsandmarriages/deaths/datasets/lifeexpectancyatbirthandselectedolderages

OFFICIAL
Page 3 of 20
The Slope Index of Inequality (SII) for male life expectancy in England in 2014-16 was 9.3 years, greater than 2010-12 (9.1 years). For females, the SII for life expectancy at birth was 7.3 years in 2014-16, which was significantly greater than 2010-12 (6.8 years).
Healthy life expectancy at birth among the most deprived males in England was 51.9 years, compared with 70.4 years among the least deprived, almost two decades of life in “Good” health less. For females the figures are 51.8 years and 70.7 years respectively, again approaching two decades of life in “Good” health less.
In 2011-2013, the SII in male healthy life expectancy at birth stood at 18.6 years, but this had increased by half a year to 19.1 years in 2014-2016. For females, this was 19.1 years in 2011- 2013, which remained unchanged in 2014-2016.
Deaths caused by heart disease, stroke and cancers made up half of the gap in life expectancy between the most and least deprived quintiles in England in 2012-14. Differential smoking rates between socioeconomic groups significantly contribute to this.
Figure 1: Number of deaths and directly age-standardised mortality rate, England, 2001-16 Source: Office for National Statistics (ONS)
Figure 2: Gain in life expectancy at birth in UK by sex. The year 2001-2006 on the x-axis reflects the gains between 2001-2003 and 2004-2006, and similarly years 2011-2016 between 2011-2013 and 2014-2016. Source: ONS
3 What’s new in the February PHOF update? (see previous footnote) and ONS “Health state life expectancies by national
deprivation deciles, England and Wales: 2014 to 2016” Released on 1 March 2018 Currently available here : https://www.ons.gov.uk/peoplepopulationandcommunity/healthandsocialcare/healthinequalities/bulletins/healthstatelifeexpectanciesbyindexofmultipledeprivationimd/englandandwales2014to2016 and Public Health England, Health Profile for England, 13 July 2017. Currently available at: https://www.gov.uk/government/publications/health-profile-for-england/chapter-4-european-comparisons
OFFICIAL
Page 4 of 20
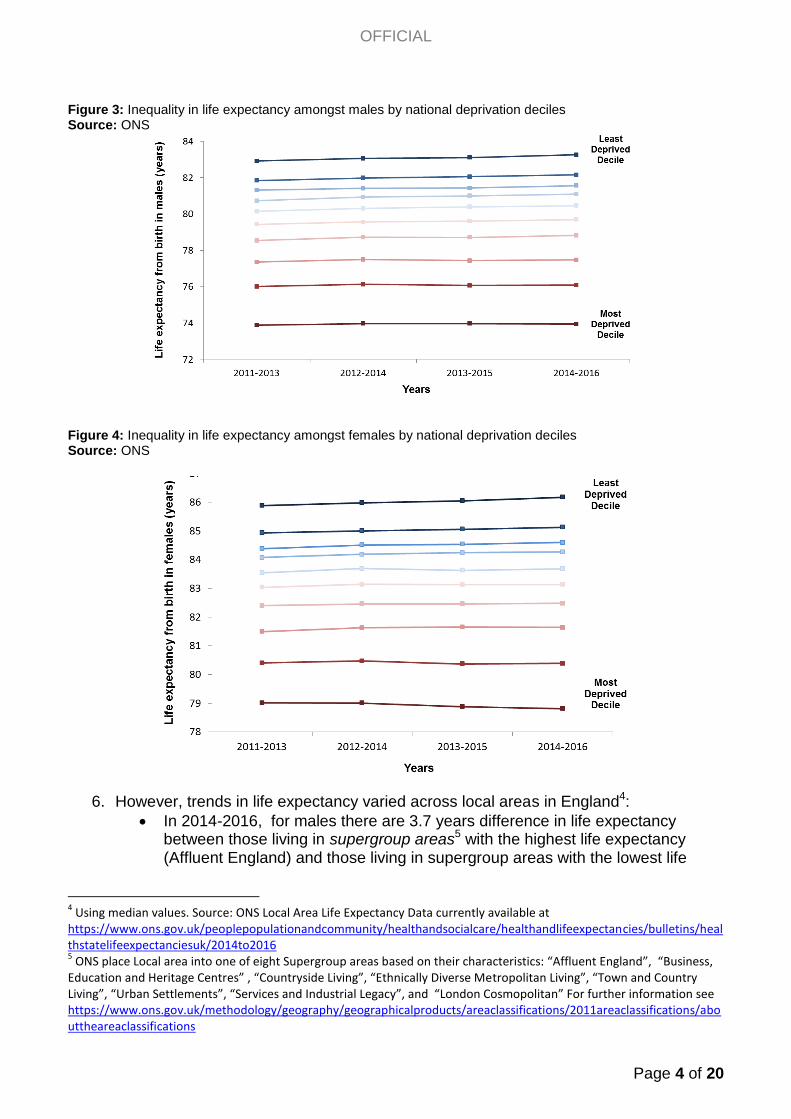
Figure 3: Inequality in life expectancy amongst males by national deprivation deciles Source: ONS
Figure 4: Inequality in life expectancy amongst females by national deprivation deciles Source: ONS
6. However, trends in life expectancy varied across local areas in England4:
In 2014-2016, for males there are 3.7 years difference in life expectancy between those living in supergroup areas5 with the highest life expectancy (Affluent England) and those living in supergroup areas with the lowest life
4 Using median values. Source: ONS Local Area Life Expectancy Data currently available at
https://www.ons.gov.uk/peoplepopulationandcommunity/healthandsocialcare/healthandlifeexpectancies/bulletins/healthstatelifeexpectanciesuk/2014to2016 5 ONS place Local area into one of eight Supergroup areas based on their characteristics: “Affluent England”, “Business,
Education and Heritage Centres” , “Countryside Living”, “Ethnically Diverse Metropolitan Living”, “Town and Country Living”, “Urban Settlements”, “Services and Industrial Legacy”, and “London Cosmopolitan” For further information see https://www.ons.gov.uk/methodology/geography/geographicalproducts/areaclassifications/2011areaclassifications/abouttheareaclassifications

OFFICIAL
Page 5 of 20
expectancy (Services and Industrial Legacy). For females the difference is 3.0 years.
Trends show that Services and Industrial Legacy local areas in the North East, the North West and Yorkshire and Humber have shorter life expectancy than for England as a whole. For the latest data point 2014-2016 this gap was about 1.7 years for males and 1.6 years for females. Central estimates suggest in recent years there has been a widening of this gap.
For the Country Living supergroup for both males and females life expectancy has been and continues to be about a year longer than for England as a whole. For the latest data point 2014-2016 this was about 0.9 years longer for males and 0.8 years longer for females.
However, for the latest data point 2014-2016, for males the bottom 25% of Country Living local areas have fallen below England.
Central estimates suggest people living in Services and Industrial Legacy areas in the North have a lower life expectancy than people living in Services and Industrial Legacy areas in other parts of the country. For males, the difference in medians is 0.8 years and for females, the difference is 1.0 year.
Figure 5: Average Percentage Change
6 in Life Expectancy by Supergroup (2011-13 to 2014-16)
Source: ONS
7. The general trend of the gains in life expectancy at birth slowing is not an English only phenomenon7:
With the exception of Japan, increases in life expectancy between 2010 to 2016 are lower than between 2005 to 2010.
Among the 28 countries of the EU, in 2015, the UK was ranked 10th for male life expectancy and 17th for female.
Life expectancy in the UK is increasing more slowly than the EU average, for both males and females.
6 A percentage change for each local area is calculated and then a non-weighted average of those changes calculated
7 Global burden of disease 2016. Currently available at http://ghdx.healthdata.org/gbd-2016 and Health Profile for
England 2017.

OFFICIAL
Page 6 of 20
Table 1:
8. The NHS Outcomes Framework (NHS OF) indicators show stark health inequalities8:
The under 75 mortality rate for cancer and the infant mortality rate are more than twice as high for the most deprived area compared to the least deprived area.
In 2015 there were 105 more under 75 year old deaths per 100,000 population from cancer in the most deprived area compared with the least deprived area.
The under 75 mortality rate for cardiovascular disease is more than five times higher for the most deprived area compared to the least deprived area.
In 2015 there were 109 more under 75 year old deaths per 100,000 population from cardiovascular disease in the most deprived area compared with the least deprived area.
The morbidity related to this mortality is reflected in the indicator for unplanned hospitalisation for chronic ambulatory care sensitive conditions which is nearly four times higher for the most deprived area compared with the least deprived area.
8 NHS Digital Indicator Portal, with analysis of SII from Department of Health and Social Care. Currently available at
https://indicators.hscic.gov.uk/webview/
Percentage Changes in Life Expectancy at Birth - International and Regional Comparisions
2005-2010 2010-2016
England 1.64% 0.62%
North East England 1.80% 0.63%
North West England 1.67% 0.76%
South East England 1.62% 0.49%
Scotland 1.69% 0.89%
Wales 1.14% 0.50%
Australia 1.11% 0.61%
Canada 1.37% 0.74%
France 1.37% 0.98%
Germany 1.14% 1.00%
Italy 1.11% 0.61%
Japan 1.10% 1.21%
Netherlands 1.64% 0.99%
New Zealand 1.25% 0.74%
Norway 1.12% 1.23%
Sweden 1.24% 0.61%
Source
Global Burden of Disease
http://ghdx.healthdata.org/gbd-2016
% change

OFFICIAL
Page 7 of 20
9. The NHS OF inequality indicators are not showing improvement:
7 of the 10 NHS OF indicators for health inequalities (for which data is available for the last 2 years) show noticeable increases9, while 3 show no noticeable change.
The largest relative increases for inequality are in inequality in infant mortality rates, the perception of access to GP services and under 75 mortality rates for cardiovascular disease.
9 NHS England currently adopt a rule where a change of 1% or more represents a notable increase in inequality and a
change of -1% or a more negative percentage a noticeable decrease in inequality. A percentage change greater than -1% but less than 1% is regarded as no noticeable change.
RII measure Latest Year
*Inequality in life expectancy indicators is not comparable with other indicators due to the different methods for calculating the RII
Table 2. NHS Outcomes Framework Indicators for Health Inequalities
Relative index of Inequality for the latest year
Using the Index of Multiple Deprivation for 2015
Access to GP services
% reporting good experience of making appointments 1.13
(2016/2017)
Emergency admissions for acute conditions that should not usually require hospital admission
Indirectly standardised rate per 100,000 population 2.14
(2015/2016)
Patient experience of GP services
% reporting good experience 1.09
(2016/2017)
Health-related quality of life for people with long-term conditions
Health status score (score 0-1) 1.23
(2016/2017)
Unplanned hospitalisation for chronic ambulatory care sensitive conditionsIndirectly standardised rate (ISR) per 100,000 population
3.90
(2015/2016)
Under 75 mortality rate from cancer
Directly age-standardised mortality rate (DSR) per 100,000 population 2.19
(2015)
Infant mortality
Rate per 1,000 live births 2.40
(2015)
Life expectancy at 75 - females
Years of life0.21*
(2013/2015)
Under 75 mortality rate from cardiovascular disease
Directly age-standardised mortality rate (DSR) per 100,000 population5.41
(2015)
SII divided by
mean
most divided by
least deprived
most divided by
least deprived
most divided by
least deprived
Potential years of life lost (PYLL) from causes considered amenable to healthcare - adults Directly standardised PYLL rate (DSR) per 100,000 population indicator not updated
Life expectancy at 75 - males
Years of life0.25*
(2013-2015)
most divided by
least deprived
SII divided by
mean
least divided by
most deprived
most divided by
least deprived
most divided by
least deprived
least divided by
most deprived
least divided by
most deprived

OFFICIAL
Page 8 of 20
10. However, more recent data do suggest some improvements10:
The CCG Improvement and Assessment Framework (IAF) indicator for health inequalities shows that between financial years 2015-16 and 2016-17, there was a statistically significant reduction in health inequalities for chronic ambulatory care sensitive and urgent care sensitive conditions.
Increasing Access to Psychological Therapies referral rates increased for all ethnic groups and were higher for Black Caribbean than for White British. Relatively high referral rates and growth in referral rates to IAPT for this group is good news given historic rates of hospital treatment.
Our broad approach
11. The life expectancy gap can in part be influenced by healthcare interventions. NHS England aims to bring to the fore the voices of those experiencing the greatest health inequalities in developing our approaches, including through a partnership with 21 voluntary, community and social enterprise (VCSE) sector organisations, the Health and Wellbeing Alliance, who reach into a wide range of communities. There is a range of activity underway across our organisation to reduce health inequalities in access to, outcomes from, and experience of, healthcare services.
Cancer
12. There has been an increase in cancer incidence across the UK as a whole, with age-standardised rates increasing by 13% since the 1990s and 7% over the last decade.
10
CCG Improvement and Assessment Framework (IAF) Indicator on Health Inequalities Currently available at https://www.england.nhs.uk/wp-content/uploads/2017/11/ccg-technical-annex-2017-18-v1-1.pdf https://www.england.nhs.uk/publication/ccg-iaf-data-extract/
Previous Year Latest Year % Change
SII values for previous and latest year are to 3 s.f.
Percentage changes are rounded to 1 d.p
Key Percentage change greater than 1% Percentage change greater than -1% but less than 1%
Patient experience of GP services % reporting good experience
7.26
(2015/2016) 7.19
(2016/2017) -0.9% Access to GP services % reporting good experience of making appointments
8.03
(2015/2016) 8.80
(2016/2017) 9.6%
Unplanned hospitalisation for chronic ambulatory care sensitive conditions Indirectly standardised rate (ISR) per 100,000 population
1010
(2014/2015) 1010
(2015/2016) -0.2%
Emergency admissions for acute conditions that should not usually require hospital admission Indirectly standardised rate per 100,000 population
951
(2014/2015) 965
(2015/2016) 1.5%
Infant mortality Rate per 1,000 live births
2.72 (2014)
3.06
(2015) 12.5% Health-related quality of life for people with long-term conditions Health status score (score 0-1)
0.155
(2015/2016) 0.153
(2016/2017) -0.8%
103 (2014)
105
(2015) 2.0%
Under 75 mortality rate from cardiovascular disease Directly age-standardised mortality rate (DSR) per 100,000 population
103 (2014)
109
(2015) 5.7% Under 75 mortality rate from cancer Directly age-standardised mortality rate (DSR) per 100,000 population
Life expectancy at 75 - females Years of life
2.70 (2012-2014)
2.80
(2013/2015) 3.7%
Potential years of life lost (PYLL) from causes considered amenable to healthcare - adults Directly standardised PYLL rate (DSR) per 100,000 population
This indicator has not been updated for 2 years
Life expectancy at 75 - males Years of life
2.80
(2012-2014) 2.87
(2013-2015) 2.5%
Table 3. NHS Outcomes Framework Indicators for Health Inequalities
Percentage change over the last 2 years for each indicator Slope Index of Inequality using the Index of Multiple Deprivation for 2015

OFFICIAL
Page 9 of 20
This was driven by large increases in female cancer incidence (up 16% and 9% respectively since the 1990s). However, since 2014 both male and female age-standardised rates have started to fall (2015 for England only). In addition, overall cancer survival has continued to improve year-on-year.
13. However, cancer incidence varies by deprivation, by ethnicity and sex:
70% more lung and cervical cancers are diagnosed in the most deprived areas and 25%more liver and stomach cancers. However, fewer breast, prostate and melanomas are diagnosed – these are more likely to be diagnosed amongst less deprived populations.
Most cancers have higher incidence rates for white males and females than for people who are black, minority and ethnic (BME), except prostate, stomach, liver and myeloma (highest rate for black population).
There are significant differences in premature cancer mortality rates between men and women. In 2012-14, there were 157.7 deaths per 100,000 population amongst males, a statistically significant gap of 31.1 deaths per 100,000 population when compared with the rate in females (126.6 deaths per 100,000 population).
14. There is emerging evidence on how issues such as deprivation, social isolation, self-
efficacy and mental health impact on a person’s ability to cope and their quality of life after cancer treatment, as well as on survival. .
15. The National Cancer Programme is making significant progress in reducing
preventable cancers, increasing cancer survival and improving patient experience and quality of life by 2020. All of these areas play an important part in narrowing the gap on health inequalities. The national cancer programme is embedding the requirement to consider health inequalities in its operational planning, thereby ensuring teams plan their projects with a health inequalities lens.
16. This whole-system approach will improve the health inequalities experienced across
the social gradient. Part of this work includes projects that will help to keep focus on the most disadvantaged:
What we know What we do
Early Diagnosis
Overall: patients in the most deprived CCGs (bottom quintile by average IMD score) are about 5%age points less likely to be diagnosed at stage 1 & 2 (2016). Screening: Patients in the most deprived areas are somewhat less likely to be diagnosed through screening than those in the least deprived areas: with the difference ranging from by 2%age points (colorectal, 2011-2015) to 5%age points (breast). Black patients are considerably less likely to be diagnosed through screening (by 11%age points for colorectal cancer, compared to white patients, and 7%age points for cervical
PHE are developing a National Screening Inequalities Strategy: This will support commissioners and other partners to reduce inequalities in screening programmes. When published we will look to develop an NHS England plan to review and implement actions for commissioners.
Piloting low dose CT scanning in CCGs with the lowest lung cancer survival rates: There is evidence of a strong association between deprivation and lung cancer mortality, with rates of mortality much higher among the most deprived. We will be addressing inequalities with an initial focus on introducing low dose CT scanning where lung cancer survival rates are at their lowest.
National implementation of rapid diagnosis pathways for lung, prostate, and colorectal: We are mandating implementation of best practice timed pathways across three tumour types. This will help to tackle variation by driving up standards in diagnosis no matter where a

OFFICIAL
Page 10 of 20
cancer, 2006 – 2015 respectively). Emergency presentation: For almost all cancers, patients in the most deprived areas are more likely to be diagnosed through emergency presentations. Among more common cancers, the cancers with the highest difference in the likelihood of being diagnosed through emergency presentations between the least and most deprived quintile include: colorectal 9%, NHL, stomach, pancreas 8%, bladder, oesophagus 6%, as well as lung, and cervix 5%. This corresponds to a lower likelihood of being diagnosed following GP referral.
patient is treated. These are three of the most common cancers and are more likely to occur in the most deprived (lung) and BME communities (prostate); with colorectal cancer often diagnosed later in Black patients.
Patient Experience
Patients from a BME background report less positive overall experience of their cancer care, albeit at an overall positive level (8.3/10 compared to 8.8/10 for White patients in the 2016 Cancer Patient Experience Survey). In particular, black patients report less positive experience with regard of accessing services, while Asian patients report less positive experience with regard to waiting for treatment.
A focus on the reduction of health inequalities is written into the Cancer Programme’s business planning with a commitment from all workstreams to consider how each project will reduce these in particular in relation to ethnicity and socioeconomic deprivation.
17. The Programme will continue to support Cancer Alliances, with a major focus of their
work being on understanding and reducing variation – currently about 6 percentage points between the Alliances with the highest and lowest rates of patients diagnosed at stage 1 & 2 - and embedding improvement. Alliances are currently working on personalised plans and funding agreements, which include setting trajectories on key outcomes, from which we will be able to see the impact on variation across the country.
18. The Programme has also taken on board discussions from the Empowering People
and Communities Taskforce Roundtable in December 2017 discussed at the last board meeting to expand the work on engaging with communities affected by cancer.
Mental Health
19. Deprivation has been identified as both a significant factor in and consequence of mental health problems, and therefore understanding, measuring and taking practical steps to address socio-economic inequalities in relation to mental health is an important part of the programme (such as supporting people with mental illness to find and retain meaningful employment).
20. In addressing inequalities we also need to pay particular consideration to the
experience of intersectional discrimination e.g. how people may experience multiple disadvantages as a result of their sexuality, age and race.
21. There are also significant geographical inequalities in access to mental health care
that the Five Year Forward View is taking steps to address. For example, in 2015/16

OFFICIAL
Page 11 of 20
fewer than 15 per cent of localities provided effective specialist community perinatal services for women with severe or complex conditions. By 2020/21, all women who need it should be able to access this care, wherever they live in England (an additional 30,000 people).
22. The programme seeks to make a significant contribution to closing these gaps with a
clear set of ambitious and commitments. Access to Psychological Therapies
23. Psychological therapies are effective for older people, and so increasing the number of older people in Improving Access to Psychological Therapies (IAPT) services is likely to not only improve the mental health of those receiving treatment but also have a positive impact on national performance against the 50% IAPT recovery standard. Access for people over 65 is increasing year on year, but growing slowly, and most access falls within the 65-75 age range. One in five over-65s is affected by depression but despite IAPT services being open to all adults, older people, especially those aged 65+, are underrepresented amongst those accessing these services. During 2015/16, only 7% of the 953,522 patients referred to IAPT services who entered treatment were aged 65 and over. This is despite over-65s accounting for almost 23% of the adult population.
24. Analysis at a national level (Quarter 4 206/17) shows that recovery outcomes for BME
groups are below white British levels (47.3% BME vs. 51.8% of White British in November 2017).
25. To address this the Older Adults and BME Quality Premium has been introduced:
Age and BME vs white Briton specific mental health metrics are now included as a subset of the mental health dashboard.
The programme is now convening an Older Adults External Advisory Group to review progress.
Suicide Prevention
26. By 2020/21, the Five Year Forward View for Mental Health (MHFYFV) set the ambition that the number of people taking their own lives will be reduced by 10% nationally compared to 2016/17 levels (from 4820 in 2015 to 4340 in 2020/21). The National Suicide Prevention Strategy and its refresh (published in January 2017) outlined a need to target particular high risk groups and this can be broken down into: those who self-harm (and attend A&E); those with mental health problems (within secondary services); and men and co-morbidities, in particular middle-aged men (who do not attend services). All STPs should also be delivering against an STP-wide multi-agency suicide prevention plan. Of the £ 5 million of transformation funding available in 2018/19, over £4m has been allocated to priority STP footprints that have either significantly higher suicide rates in middle-aged men (aged 45–49) or a high age-standardised rate.
Severe Mental Illness (SMI)
27. The life expectancy for people with SMI is 15–20 years lower than the general population, one of the greatest health inequalities in England. There is a 65% point gap between the employment rates of people being supported by specialist mental health services who have more severe health problems and the general population.

OFFICIAL
Page 12 of 20
This disparity in health outcomes is partly due to physical health needs being overlooked, therefore to achieve the FYFV goal of reducing premature mortality for people with severe mental illness (SMI), we have has committed to ensuring that by 2020/21 280,000 people have their physical health needs met, this will be achieved by improving access to and the quality of physical health checks and follow up interventions. In practice this equates to ensuring that approximately 60% of people on the General Practice (GP) SMI register receive a comprehensive physical health assessment and follow-up care. This goal is to be delivered across both primary and secondary care. Delivery in secondary care has been incentivised by the development of a CQUIN. To support delivery in primary care, funds have been made available in CCG baselines and the requirement for investment reiterated in Refreshing NHS Plans for 2018/19.
28. In addition, as smoking is the largest avoidable cause of premature death, with more
than 40% of adults with SMI smoking, NHS England has supported PHE’s delivery of the ‘preventing ill health by risky behaviours – alcohol and tobacco CQUIN’ and programme of work to support Mental Health Trusts to become smoke free - an audit of MH Trust’s smoke free status is planned. This support is jointly delivered through PHE and the NHS England nursing directorate.
Diabetes
29. In relation to type 2 diabetes, different patient groups are affected unequally and there are large differences concerning gender, age and race. Socio-economic status (SES) may influence access to and quality of care, social support and availability of community resources. It may also influence diabetes-related knowledge, communication with providers, treatment choices and the ability to adhere to recommended medication, exercise and dietary regimens.
30. The Diabetes Prevention Programme has been developed by NHS England and
attendance rates have been significantly higher for individuals from Asian, African-Caribbean, mixed and other ethnic groups compared to individuals from white European groups. We would ordinarily expect 17,000 per 100,000 people attending to be BME, but estimates suggest the figure will actually be 22,000, an extra 5,000 compared to what would be expected. This suggests that the programme is reaching those who are both at greater risk of developing Type 2 diabetes and who typically access healthcare less effectively.
31. The latest ROI analysis for the Diabetes Prevention Programme suggests that over 20
years, £1.1 billion of monetised health benefits will accrue to the DPP. It is estimated that 17% of the pre-diabetes population in England are BME. If those attending the Diabetes Prevention Programme were representative of the population, we would therefore expect £0.19 billion or £190million of monetised health benefits to accrue to the BME group over 20 years as a result (17% of the total £1.1bn benefit). However, we know that those from BME are currently overrepresented in those attending the DPP – 22%. Based on this proportion, we would therefore expect £0.24 billion or £240million of monetised health benefits to accrue to the BME group over 20 years as a result – that is an extra £50 million of benefit to the BME group compared to what would be expected.
OFFICIAL
Page 13 of 20
Primary Care
32. Assurance of the core requirements of CCGs to deliver the commitments, as set out
in the planning guidance, is monitored through quarterly assurance meetings. This is supported by evidence from the undertaking of an equality and health inequality impact assessment and supporting action plan, to address any issues identified and actions to resolve them. NHS England has:
Produced a practical interactive resource: Improving Access for all: reducing inequalities in access to general practice services; to support commissioners and providers meet their statutory duties on inequalities, and provide advice and guidance to support their delivery of the specific core requirement on addressing inequalities in access. This was published in July 2017. This was developed in conjunction with various groups such as those from BME and LGBT communities, as well as other identified ‘Inclusion Health’ groups such as asylum seekers and refugees, to ensure that extended access proposals are assessed for adverse impact and positive opportunities.
Developed an Equality and Health Inequalities Analysis (EHIA) for the improving access to general practice services policy. This analysis considered those groups with protected characteristics under the Equality Act 2010 and also those who are within NHS England’s “Inclusion Health” definition. Our aim is to publish this as part of the support materials being published alongside Refreshed NHS Plans 2018/19.
Been working on a series of new case studies looking at addressing inequalities. These will be published in the spring.
33. Some pilot schemes (Morecambe, Warrington and West Wakefield) have targeted
projects at seldom heard groups or areas of socio-economic deprivation. Another widespread strategy has been to target patient groups amongst which there is a known high demand for primary care services, for example the frail and elderly (Darlington, DCIoS and Herefordshire), children and young people (DCIoS, Herefordshire and Slough) and those with complex or long term conditions (BHR and Workington). More work will be done with these pilots over the next few months to gather evidence on these initiatives.
Prison Health
34. In commissioning services in prisons, there is a well understood correlation between limited access to health services and health inequalities which is a correlation for people in the criminal justice system. There are also higher levels of substance misuse in this population (According to a MOJ survey, most offenders (79%) reported having taken illegal drugs at some point in their lives) in relation to the general population and the ONS Psychiatric Morbidity survey describes 72% of adult male and 71% of female prisoners may have 2 or more mental disorders (e.g. personality disorder, psychosis, anxiety and depression, substance misuse); 20% have 4 or more mental disorders. People in prison were more likely to be living with long term conditions and as approximately 87% of the offender population have a nicotine dependency as against 19% of the general population therefore, smoking related diseases is prevalent amongst the population.
35. As such, this particular patient population will have significant health issues and will
be burdened by a number of inequalities, health inequalities being one of them. Every commissioned service will have a Health Needs Assessment to scope the particular

OFFICIAL
Page 14 of 20
needs of the patient population and ensure that the subsequent service specification against which health providers are contracted against are fit for purpose and will meet the needs of this population.
36. In September 2017, David Lammy MP released his Independent review into the
treatment of and outcomes for, Black Asian and Minority Ethnic individuals in the Criminal Justice System (CJS). This report highlighted the significant over representation in our prison populations with 25% of the prison population coming from BME backgrounds (relative to BME men and women making up 14% of the population) and that their treatment at the hands of the CJS often left people distrustful of authority. It is likely, therefore, that in relation to patient populations within the estate, they may not seek health care at the earliest opportunity which could have the potential to further marginalising an already underserved group. The health services that are commissioned are responsive to health presentations prevalent for this community and ensure screening and immunisation services are relevant and developed across the estate.
37. Specific action to tackle health inequalities include:
Developing BBV opt out services across the estate in addition to improving uptake of TB screening and the physical health checks programme targets individuals 10 years younger than physical health check target groups in the community as it is generally recognised that people in prison physically present as 10 years older than their chronological age
A significant piece of work has been done, alongside colleagues in specialised commissioning, in improving the mental health service offer for people in prisons and securing a more transparent, consistent and timely secure hospital transfer for seriously mentally ill patients.
In relation to substance misuse and dual diagnosis, NHS England has developed a revised and improved substance misuse specification which identifies and describes the required management and critical issues in relation to psychoactive substance misuse and the attendant wider health impact of such use.
Maternity `One quarter of all deaths under the age of one would potentially be avoided if all births had the same level of risk as those to women with the lowest level of deprivation’
38. Better Births, the report of the National Maternity Review was published in February 2016 and set out a clear vision for maternity services across England to become safer, more personalised, kinder, professional and more family-friendly. Implementing the vision set out in Better Births is being undertaken by the Maternity Transformation Programme with an overarching ambition to improve safety of maternity care, alongside personalisation and choice.
39. The programme is working through 44 Local Maternity Systems working on
Sustainability and Transformation Partnership (STP) footprints. During the last year, they have produced local strategies setting out how they plan to plan to deliver overall vision for improved safety and greater personalisation and choice. This gives us a good understanding of how we will be able to reduce health inequalities through the programme.

OFFICIAL
Page 15 of 20
40. Local Maternity Systems have specifically been asked to meet a number of deliverables, including:
Improving the safety of maternity care so that by 2020/21 all services have reduced rates of stillbirth, neonatal death, maternal death and brain injury during birth by 20% and are on track to make a 50% reduction by 2030. We know that stillbirths, neonatal deaths, maternal deaths and serious brain injuries are statistically more likely to occur with women living in areas of multiple deprivations and with women from BME backgrounds. Action to tackle these poor outcomes is therefore likely to disproportionately improve care for disadvantaged families and reduce health inequalities.
Improving choice and personalisation of maternity services so that all pregnant women have a personalised care plan, and that most women have continuity of clinician caring for them. We know that a more individualised approach to care makes a difference in particular to disadvantaged women who are less likely to find standard services work for them. We also know that some women may derive a disproportionately greater benefit from continuity of carer. In particular, caseload midwifery appears to confer increased benefit and reduced harmful outcomes for women with complex social factors.
Impact of personalisation on health inequalities
41. Personalisation can be defined as people having the knowledge skills and confidence to make choices and have control over decisions that affect their own health and wellbeing within a system that harnesses the expertise, capacity and potential of people, families and communities in delivering better outcomes. Giving people more choice and control and enabling them to focus on what is important to them will help reduce health inequalities as more people will be able to meet their needs in ways that work for them.
42. NHS England’s Personalised Care Programme, as part of its universal personalised
care model, supports the implementation of a range of evidence based approaches which will reduce inequality in particular integrated personal commissioning, personal health budgets, health literacy and social prescribing.
43. Integrated Personal commissioning and personal health budgets both give individuals
the greatest level of control over their health and wellbeing. Centred around personalised care and support planning that focuses on what is important to people can help to promote equality and reduce inequalities for people by enabling people to choose health and wellbeing services and care that better meet their individual preferences and cultural needs. In the case of personal health budgets or integrated personal budgets this includes choosing their own personal assistants. This year the IPC programme expanded to involve 17 areas across the country covering 40 CCGs, delivering 27,497 care plans across IPC and personal health budgets so far in 2017/18. The number of personal health budgets has risen by 200% in the last two years with 22,895 people having a personal health budget in England in the first nine months of 2017/18.
44. Although anyone could have limited health literacy, people with limited financial and
social resources are more likely to do so. In turn, limited health literacy can reduce opportunities for people in vulnerable and disadvantaged groups to develop the capabilities needed to be actively involved in decisions about their health and care, meaning that they have the poorest health outcomes. Increasing health literacy awareness and practice therefore has the potential to help reduce health inequalities.
OFFICIAL
Page 16 of 20
45. Social prescribing schemes enable GPs to refer people with wider social needs to
link workers, who give time, develop shared plans and practically connect people with community support, such as debt counselling and bereavement support groups. Around the country, there is an emerging picture that this approach works well for people who use the NHS the most and who have complex lives. By connecting with community groups, people receive support and develop their confidence/ skills, volunteering and building community resilience. Healthy London Partnership is working in partnership with the Greater London Authority, and is developing a Health Inequality Strategy for London. This will put social prescribing at the heart of the strategy, supporting all local authorities and CCGs to develop social prescribing connector schemes, in order to support people around the wider determinants of health, connecting them to community support. The aim is to spread social prescribing across the whole of London.
Working with STPs
46. During 2018/19 we are working to further align our work to more directly support transformation in the local health and care system using continuous improvement to streamline our activity, and work even more closely with Public Health England and NHS Improvement to enable staff to directly help Integrated Care Systems (ICS), Sustainability and Transformation Partnerships (STPs) and local systems with their work. As part of their sustainable transformation planning, a number of STPs have drilled down and identified stark health inequalities, experienced by identified communities and groups, as one of the crucial challenges that need to be tackled. This has involved applying a health inequalities lens when identifying local population needs.
47. Other STPs have built upon longstanding insight and expertise across their patch in tackling health inequalities and have thereby extended their proposals to tackle health inequalities as an integral way to achieve their wider aims. Blackpool and Fylde Coast ACS estimates that 3% of their population cohort consumes approximately 46% of their public service resource. The STP has undertaken a series of ‘enquiries’ with specific groups around why they access services in the way they do and what would help them. This enquiry work, use of patient activation methodology and consequent reconfiguration of support to these intensive service users has been successful in terms of potential and actual cost savings with significant reductions in hospital use. Their ‘community orientation toward primary care’ workstream has pioneered enquiry and focus work with young parents involved in contact with the child protection system, a frail elderly population with multiple and complex needs and other seldom heard and disadvantaged groups. As a sub-cohort are the ‘frail elderly’ with complex challenges in managing their LTCs. A combination of enhanced and extended primary care and significant involvement of generic support workers has been piloted with success. Reconfiguration of community services (mental health, therapies, wellbeing support) is underway.
Newcastle is one of the 20 per cent most deprived districts/unitary authorities in England, with about 29 per cent (13,800) of children living in low income families. Life expectancy for both women and men is lower than the England average. Within Newcastle, the difference in life expectancy is 13.1 years lower for men and 10.9 lower for women in the most deprived areas compared to the least. The STP has set out an ambition to reduce the premature mortality gap between the STP area and England by half by 2021 by focusing on cancer, cardiovascular disease and respiratory disease.

OFFICIAL
Page 17 of 20
Adjustments in Finance Allocations Allocations formula to CCGs
48. The allocations formula includes an adjustment for unmet need and health inequalities. This component has two functions. First, it supports the policy aim of reducing health inequalities. Second, it has the more technical role of adjusting for unmet need – the main allocation formula is based on systematic variations in delivered, or met, need. If there is unmet need that is not in proportion to meet need then this adjustment is required to deliver equal access for equal need. The technical measure used for this adjustment, as recommended by the Advisory Committee on Resource Allocations, is based on the Standardised Mortality Ratio for those under 75 years of age. The size of the adjustment is a matter of judgement. It is set by the NHS England board and is set at 10% for core CCG allocations, 15% for primary medical care and 5% for specialised services.
49. We do not separate out the financial value of the adjustment in a CCG’s actual
funding (currently estimated to be around £1.8bn), nor do we ring-fence this amount for specific types of expenditure. It would be technically difficult to do so; and given the range of factors relevant to health inequalities and unmet need, one would expect CCGs to spend this in a range of different ways. We will work with NHS Clinical Commissioners to review the use of the adjustment in commissioning decisions.
GMS contract and the Quality and Outcomes Framework
50. The Carr-Hill formula, which is currently the basis for the global sum payment to practices under the GMS contract, contains an “additional needs” index. This targets towards practices with higher Standardised Mortality Ratios for those aged under 65 years and higher Standardised Limited Long-Standing Illness, as measured in 1998-2000. This still results in higher funding for more deprived practices. However, the measure and the weight attributed to them cannot be updated and have remained the same since 2004. Recent academic research11 suggests that the Carr-Hill formula does not reflect the current burden of morbidity. There is potential for this formula to be revised to take more explicit account of health inequalities. Discussions with the BMA around the approach to a funding formula review are ongoing.
51. The Quality and Outcomes Framework (QOF), introduced in 2004, incentivises
nationally specified indicators of good quality care for patients with long term conditions. A recent literature review12 found that the gap in achievement of QOF indicators between richer and poorer areas had narrowed in the first few years of operating the scheme. However, since then QOF had not further reduced inequalities in processes of care by age, comorbidity, gender or deprivation.
52. In the review of QOF that is currently taking place, we are considering how we can
build on the strengths of the current scheme and address its limitations, including how we address the plateau in achievement. In particular, we have commissioned research to understand which patients receive care according to NICE guidelines
11
Chronic morbidity, deprivation and primary medical care spending in England 2015-16: a cross-sectional spatial analysis, Kontopantelis et al. BMC Medicine (2018) 12
Review of the Quality and Outcomes Framework in England, Forder et al, PRUCOMM, December 2016
OFFICIAL
Page 18 of 20
when incentives are in place and when they are removed. We need to be careful about whether retirement of indicators to make space for incentivising different activities disproportionately impacts some patient groups.
The social, economic and environmental impact of the NHS in local communities
53. The NHS directly contributes to the nation’s economy, as both a healthcare provider and major economic player in its own right. By helping the population stay healthy, the health service increases labour productivity: one estimate suggests that for every £1 spent on the NHS, at the margin, around 93p in increased production in the wider economy is generated.13
54. From a local perspective, the NHS is a vital employer in many areas of the country –
although is more valuable to some local economies than others. Broadly speaking, England’s more deprived communities rely most heavily on NHS jobs. In Blackpool, for example, the health sector accounts for around 15% of GVA and employs around 1 in 5 people locally.14
55. Having a decent job has a positive impact on a person’s health15. As such, the NHS
contributes health not only through the services it provides, but also as a major employer in some of England’s most deprived communities. There is evidence to suggest that a more systematic approach to widening access to NHS careers make sense from an operational and a community perspective. Recent research commissioned by HEE suggests a return on investment of between 14% and 21% (£5.4 - £5.8m over five years) for trusts that deliver employability programmes at scale, thanks to avoided talent management costs and increased productivity.16
56. A report from National Voices and Social Enterprise UK in December 2017 showed that these examples of good practice tend to be small in scale and are by no means standard practice across the NHS. We have begun work with partners to explore how much potential exists within the local NHS to leverage more social value in employment, procurement, real estate and the environment.
13
. Includes unpaid production (including domestic work, child care and volunteering). Excluding unpaid production, each £1 spent at the margin generates 63p in direct contribution to GDP through reduced sickness absence. 14
BRES. Health jobs based on Standardised Industrial Classification 2007 (SIC07) 15
Is work good for your health and wellbeing, Waddell and Burton (2006) 16
ROI due to avoided talent management costs and increased productivity. Modelling undertaken by Accenture (as yet unpublished). The findings are currently being tested with a number of NHS trusts.
At Guy’s and St Thomas’, the trust offers work experience, traineeships and direct recruitment to young people in their local area from disadvantaged or under-represented groups who may not have had this opportunity otherwise. In other areas, social value is being used through contracts to support apprenticeships, volunteering opportunities or improving environmental sustainability.
In Bury the local authority has set social value targets for its banking provider (Barclays). As a result, Barclays is delivering work experience, apprenticeships, digital support for start-ups and digital training for older people as part of its contract (an estimated £400,000 worth of additional community value). In Greater Manchester, the city council applies a 20% social value weighting to all contracts, meaning that all organisations bidding have to give social value serious consideration when putting tenders together.
OFFICIAL
Page 19 of 20
57. Although there has been some work to raise the profile of social value as part of commissioning within the NHS, this has only had a limited impact to date. During 2018/19 NHS England will be working with commissioners to better understand the barriers to including social value in contracts and to support ways to reduce health inequalities through better use of the Social Value Act.
Air pollution impacts of travel on health inequalities
58. The NHS has its economic and physical presence concentrated in the areas of poorest health and is also often the largest local employer, estate and reason for road traffic. There is a potential to directly address the causes of health inequalities through the way we deliver healthcare; e.g. air pollution from health related travel or green space on the health estate. Health related travel makes up 3.5-5% of all road miles. As highlighted in the 2017 CMO’s report17, the mortality effects alone of health related travel cost at least 9,600 QALYs and £773m to the economy18 each year.
59. For example, Manchester and Nottingham both have poor air quality19 and low
healthy life expectancy. The acute trusts in each city have estimated travel footprints of almost 80million miles each. In 2015 air pollution in Nottingham was associated with 6.4% of mortality and 1,556 life years lost. Travel related to Nottingham University Hospital was associated with up to 4% of these life years lost, at an economic cost of £3.3m. Manchester Universities FT recently evidenced that their work on sustainable travel had avoided over £870K in economic costs.
60. There is considerable scope to reduce the health impacts of healthcare activity, such
as travel, in areas already experiencing high levels of health inequalities; with social, economic and environmental co-benefits. Organisations should calculate their travel impact baseline with the Health Outcome of Travel Tool20 and, as recommended in the CMO’s report, embed this into their mandatory Sustainable Development Management Plans; maximising positive impacts on the wider determinants of health through the way care is delivered
Next steps
61. We recognise there is more to do to systematically address inequalities, set out how we improve and measure the impact of our programmes in this area, and also better support local commissioners and providers in their work. We will therefore:
Review the existing NHS Outcomes Framework Indicators with a view to developing indicators that can be used operationally at CCG/STP/ACO level to bring about change in the NHS for key business priorities in Next Steps in the Five Year Forward View;
Draw on the latest evidence to identify existing inequalities across each of our FYFV programme areas and make more specific commitments in each of our FYFV priority areas on the progress we will make in reducing these health inequalities from the 19/20 planning round;
17
https://www.gov.uk/government/publications/chief-medical-officer-annual-report-2017-health-impacts-of-all-pollution-what-do-we-know 18
https://www.sduhealth.org.uk/delivery/measure/health-outcomes-travel-tool.aspx 19 http://www.who.int/phe/health_topics/outdoorair/databases/cities/en/ 20
https://www.sduhealth.org.uk/delivery/measure/health-outcomes-travel-tool.aspx

OFFICIAL
Page 20 of 20
Co-produce resources with experts by experience that support commissioners and services providers to tackle and reduce inequalities;
Ensure commissioners and service providers have the tools needed in this area working with PHE, NHS Improvement and STPs;
Work with the RightCare Programme to provide commissioners and service providers with detailed information about how to identify and work towards addressing existing inequalities in their local areas;
Develop examples of positive practice that outline the operations of services and organisations that are reducing health inequalities in their local areas;
Work with NHS Clinical Commissioners to review the use of the adjustment formula for unmet need and health inequalities in commissioning decisions; and
Explore the potential for the NHS to contribute more to the local economy, through employment practices and approaches to procurement work with STPs and local areas on their Sustainable Development Management Plans with the aim of maximising positive impacts on the wider determinants of health through the way care is delivered.
SUMMARY
62. We have made positive progress in fulfilling our legal duties to reduce health inequalities and have made health inequalities a high priority in implementing the NHS Five Year Forward View. Nonetheless, inequalities remain and are in evidence between groups of people with different characteristics, and across geographies.
63. The Board is invited to note this “scene setting” paper, and support further action
planning to help reduce inequalities in health.