nhs r&d hta programme - inicio grimshaw, re thomas ... hta reports may be freely reproduced for...
TRANSCRIPT
Effectiveness and efficiency of guideline dissemination and implementation strategies
JM Grimshaw, RE Thomas, G MacLennan, C Fraser, CR Ramsay, L Vale, P Whitty, MP Eccles, L Matowe, L Shirran, M Wensing, R Dijkstra and C Donaldson
Health Technology Assessment 2004; Vol. 8: No. 6
HTAHealth Technology AssessmentNHS R&D HTA Programme
February 2004

How to obtain copies of this and other HTA Programme reports.An electronic version of this publication, in Adobe Acrobat format, is available for downloading free ofcharge for personal use from the HTA website (http://www.hta.ac.uk). A fully searchable CD-ROM isalso available (see below).
Printed copies of HTA monographs cost £20 each (post and packing free in the UK) to both public andprivate sector purchasers from our Despatch Agents.
Non-UK purchasers will have to pay a small fee for post and packing. For European countries the cost is£2 per monograph and for the rest of the world £3 per monograph.
You can order HTA monographs from our Despatch Agents:
– fax (with credit card or official purchase order) – post (with credit card or official purchase order or cheque)– phone during office hours (credit card only).
Additionally the HTA website allows you either to pay securely by credit card or to print out yourorder and then post or fax it.
Contact details are as follows:HTA Despatch Email: [email protected]/o Direct Mail Works Ltd Tel: 02392 492 0004 Oakwood Business Centre Fax: 02392 478 555Downley, HAVANT PO9 2NP, UK Fax from outside the UK: +44 2392 478 555
NHS libraries can subscribe free of charge. Public libraries can subscribe at a very reduced cost of £100 for each volume (normally comprising 30–40 titles). The commercial subscription rate is £300 per volume. Please see our website for details. Subscriptions can only be purchased for the current orforthcoming volume.
Payment methods
Paying by chequeIf you pay by cheque, the cheque must be in pounds sterling, made payable to Direct Mail Works Ltdand drawn on a bank with a UK address.
Paying by credit cardThe following cards are accepted by phone, fax, post or via the website ordering pages: Delta, Eurocard,Mastercard, Solo, Switch and Visa. We advise against sending credit card details in a plain email.
Paying by official purchase orderYou can post or fax these, but they must be from public bodies (i.e. NHS or universities) within the UK.We cannot at present accept purchase orders from commercial companies or from outside the UK.
How do I get a copy of HTA on CD?
Please use the form on the HTA website (www.hta.ac.uk/htacd.htm). Or contact Direct Mail Works (seecontact details above) by email, post, fax or phone. HTA on CD is currently free of charge worldwide.
The website also provides information about the HTA Programme and lists the membership of the variouscommittees.
HTA

Effectiveness and efficiency of guideline dissemination andimplementation strategies
JM Grimshaw,1* RE Thomas,1 G MacLennan,1
C Fraser,1 CR Ramsay,1 L Vale,1,2 P Whitty,3
MP Eccles,4 L Matowe,1† L Shirran,1 M Wensing,5
R Dijkstra5 and C Donaldson6‡
1 Health Services Research Unit, University of Aberdeen, UK2 Health Economics Research Unit, University of Aberdeen, UK3 Department of Epidemiology and Public Health, University of Newcastle
upon Tyne, UK4 Centre for Health Services Research, University of Newcastle upon Tyne, UK5 Centre for Quality of Care Research, University of Nijmegen,
The Netherlands6 Department of Community Health Sciences, University of Calgary, Canada
* Corresponding author. Current affiliation: Clinical Epidemiology Programme, OttawaHealth Research Institute and Center for Best Practices, Institute of Population Health,University of Ottawa, Canada
† Current affiliation: Department of Pharmacy Practice, Faculty of Pharmacy, KuwaitUniversity, Kuwait
‡ Current affiliation: Centre for Health Services Research, University of Newcastle uponTyne, UK
Declared competing interests of authors: none
Published February 2004
This report should be referenced as follows:
Grimshaw JM, Thomas RE, MacLennan G, Fraser C, Ramsay CR, Vale L, et al.Effectiveness and efficiency of guideline dissemination and implementation strategies.Health Technol Assess 2004;8(6).
Health Technology Assessment is indexed in Index Medicus/MEDLINE and Excerpta Medica/EMBASE.

NHS R&D HTA Programme
The NHS R&D Health Technology Assessment (HTA) Programme was set up in 1993 to ensure that high-quality research information on the costs, effectiveness and broader impact of health
technologies is produced in the most efficient way for those who use, manage and provide care in the NHS.
Initially, six HTA panels (pharmaceuticals, acute sector, primary and community care, diagnostics and imaging, population screening, methodology) helped to set the research priorities for the HTAProgramme. However, during the past few years there have been a number of changes in and aroundNHS R&D, such as the establishment of the National Institute for Clinical Excellence (NICE) and the creation of three new research programmes: Service Delivery and Organisation (SDO); New andEmerging Applications of Technology (NEAT); and the Methodology Programme.
The research reported in this monograph was identified as a priority by the HTA Programme’sMethodology Panel and was funded as project number 94/08/29.
The views expressed in this publication are those of the authors and not necessarily those of the Methodology Programme, HTA Programme or the Department of Health. The editors wish toemphasise that funding and publication of this research by the NHS should not be taken as implicitsupport for any recommendations made by the authors.
Methodology Programme Director: Professor Richard LilfordHTA Programme Director: Professor Tom WalleySeries Editors: Dr Ken Stein, Professor John Gabbay, Dr Ruairidh Milne
and Dr Rob RiemsmaManaging Editors: Sally Bailey and Caroline Ciupek
The editors and publisher have tried to ensure the accuracy of this report but do not accept liabilityfor damages or losses arising from material published in this report. They would like to thank thereferees for their constructive comments on the draft document.
ISSN 1366-5278
© Queen’s Printer and Controller of HMSO 2004
This monograph may be freely reproduced for the purposes of private research and study and may be included in professional journals provided that suitable acknowledgement is made and the reproduction is not associated with any form of advertising.
Applications for commercial reproduction should be addressed to HMSO,The Copyright Unit, St Clements House, 2–16 Colegate, Norwich, NR3 1BQ.
Published by Gray Publishing, Tunbridge Wells, Kent, on behalf of NCCHTA.Printed on acid-free paper in the UK by St Edmundsbury Press Ltd, Bury St Edmunds, Suffolk.
Criteria for inclusion in the HTA monograph seriesReports are published in the HTA monograph series if (1) they have resulted from work commissioned for the HTA Programme, and (2) they are of a sufficiently high scientific quality as assessed by the referees and editors.
Reviews in Health Technology Assessment are termed ‘systematic’ when the account of the search,appraisal and synthesis methods (to minimise biases and random errors) would, in theory, permitthe replication of the review by others.
M

Objectives: To undertake a systematic review of theeffectiveness and costs of different guidelinedevelopment, dissemination and implementationstrategies. To estimate the resource implications ofthese strategies. To develop a framework for decidingwhen it is efficient to develop and introduce clinicalguidelines.Data sources: MEDLINE, Healthstar, CochraneControlled Trial Register, EMBASE, SIGLE and thespecialised register of the Cochrane Effective Practiceand Organisation of Care (EPOC) group.Review methods: Single estimates of dichotomousprocess variables were derived for each studycomparison based upon the primary end-point or themedian measure across several reported end-points.Separate analyses were undertaken for comparisons ofdifferent types of intervention. The study also exploredwhether the effects of multifaceted interventionsincreased with the number of interventioncomponents. Studies reporting economic data werealso critically appraised. A survey to estimate thefeasibility and likely resource requirements of guidelinedissemination and implementation strategies in UKsettings was carried out with key informants fromprimary and secondary care.Results: In total, 235 studies reporting 309comparisons met the inclusion criteria; of these
73% of comparisons evaluated multifacetedinterventions, although the maximum number ofreplications of a specific multifaceted intervention was11 comparisons. Overall, the majority of comparisonsreporting dichotomous process data observedimprovements in care; however, there wasconsiderable variation in the observed effects bothwithin and across interventions. Commonly evaluatedsingle interventions were reminders, dissemination ofeducational materials, and audit and feedback. Therewere 23 comparisons of multifaceted interventionsinvolving educational outreach. The majority ofinterventions observed modest to moderateimprovements in care. No relationship was foundbetween the number of component interventions andthe effects of multifaceted interventions. Only 29.4% of comparisons reported any economic data.The majority of studies only reported costs oftreatment; only 25 studies reported data on the costsof guideline development or guideline disseminationand implementation. The majority of studies usedprocess measures for their primary end-point, despitethe fact that only three guidelines were explicitlyevidence based (and may not have been efficient).Respondents to the key informant survey rarelyidentified existing budgets to support guidelinedissemination and implementation strategies. In
Health Technology Assessment 2004; Vol. 8: No. 6
iii
© Queen’s Printer and Controller of HMSO 2004. All rights reserved.
Abstract
Effectiveness and efficiency of guideline dissemination andimplementation strategies
JM Grimshaw,1* RE Thomas,1 G MacLennan,1 C Fraser,1 CR Ramsay,1 L Vale,1,2
P Whitty,3 MP Eccles,4 L Matowe,1† L Shirran,1 M Wensing,5 R Dijkstra5 andC Donaldson6‡
1 Health Services Research Unit, University of Aberdeen, UK2 Health Economics Research Unit, University of Aberdeen, UK3 Department of Epidemiology and Public Health, University of Newcastle upon Tyne, UK4 Centre for Health Services Research, University of Newcastle upon Tyne, UK5 Centre for Quality of Care Research, University of Nijmegen, The Netherlands6 Department of Community Health Sciences, University of Calgary, Canada* Corresponding author. Current affiliation: Clinical Epidemiology Programme, Ottawa Health Research Instituteand Center for Best Practices, Institute of Population Health, University of Ottawa, Canada† Current affiliation: Department of Pharmacy Practice, Faculty of Pharmacy, Kuwait University, Kuwait‡ Current affiliation: Centre for Health Services Research, University of Newcastle upon Tyne, UK

general, the respondents thought that onlydissemination of educational materials and short(lunchtime) educational meetings were generallyfeasible within current resources. Conclusions: There is an imperfect evidence base tosupport decisions about which guideline disseminationand implementation strategies are likely to be efficient under different circumstances. Decisionmakers need to use considerable judgement about howbest to use the limited resources they have for clinicalgovernance and related activities to maximisepopulation benefits. They need to consider the
potential clinical areas for clinical effectivenessactivities, the likely benefits and costs required tointroduce guidelines and the likely benefits and costs as a result of any changes in provider behaviour.Further research is required to: develop and validate a coherent theoretical framework of healthprofessional and organisational behaviour and behaviourchange to inform better the choice of interventions inresearch and service settings, and to estimate theefficiency of dissemination and implementationstrategies in the presence of different barriers andeffect modifiers.
Abstract
iv

Health Technology Assessment 2004; Vol. 8: No. 6
v
List of abbreviations .................................. vii
Executive summary .................................... ix
1 Introduction ............................................... 1Background ................................................ 1Aims of study .............................................. 2Structure of this report ............................... 2
2 Systematic review of guideline dissemination and implementation strategies: aims and methods .................... 3Aims ............................................................ 3Methods ...................................................... 3
3 Systematic review of guideline dissemination and implementation strategies: details of included studies ....... 11Results of literature searches ...................... 11Methodological quality of included studies ......................................................... 11Other methodological issues ...................... 12Details of participants ................................ 13Details of interventions .............................. 14
4 Systematic review of guideline dissemination and implementation strategies: results ....................................... 17Evaluations of single interventions against no-intervention control groups .................. 17Evaluations of single interventions againstintervention control groups ....................... 24Evaluations of multifaceted interventions .............................................. 24
5 Systematic review of guideline dissemination and implementation strategies: economic evaluations and costanalyses ...................................................... 43Structure for the economic evaluation ofguideline implementation .......................... 43Methods ...................................................... 44Results ........................................................ 45Discussion ................................................... 47Conclusions ................................................ 51
6 Estimating the feasibility and likely resource requirements of guidelinedissemination and implementation strategies in UK settings ........................... 53Methods ...................................................... 53Results ........................................................ 53Relative use of resources for the differentstrategies ..................................................... 59Discussion ................................................... 59
7 Discussion ................................................... 61Principal findings of the study ................... 61Strengths and weaknesses .......................... 62Meaning of the study: possible mechanismsand implications for clinicians or policy makers ........................................................ 64Unanswered questions and future research ...................................................... 66
Acknowledgements .................................... 69
References .................................................. 71
Appendix 1 Statistical considerations ....... 73
Appendix 2 Development of search strategies ..................................................... 79
Appendix 3 HTA guidelines data abstractionchecklist ...................................................... 83
Appendix 4 Bibliographic details of included papers .......................................... 103
Appendix 5 Details of included studies .... 117
Appendix 6 Results table ........................... 237
Appendix 7 Interview brief: interventions toimplement clinical guidelines .................... 335
Health Technology Assessment reportspublished to date ....................................... 341
Health Technology Assessment Programme ................................................ 349
Contents


Health Technology Assessment 2004; Vol. 8: No. 6
vii
© Queen’s Printer and Controller of HMSO 2004. All rights reserved.
A&F audit and feedback
ANOVA analysis of variance
ARIMA autoregressive integrated movingaverage
CBA controlled before and after(study)
CCT controlled clinical trial
C-CCT cluster allocated controlledclinical trial
CF C Fraser
C-RCT cluster randomised controlledtrial
D done
DGH district general hospital
Edmat educational materials
Edmeet educational meetings
EPOC Cochrane Effective Practice andOrganisation of Care (group)
Fin financial
GM G MacLennan
IQR interquartile range
IT information technology
ITS interrupted time series (study)
JG JM Grimshaw
LCP local consensus processes
LM L Matowe
LS L Shirran
ME MP Eccles
MRC Medical Research Council
MW M Wensing
NA not applicable
NC not clear
ND not done
NICE National Institute for ClinicalEffectiveness
NS not significant
OL opinion leaders
Org organisational
Outreach educational outreach
Patmed patient mediated
P-CCT patient allocated controlledclinical trial
PCG Primary Care Group
P-RCT patient randomised controlledtrial
Profoth other professional
PW P Whitty
Reg regulatory
Rem reminders
RCT randomised controlled trial
R&D research and development
RD R Dijkstra
RT RE Thomas
S significant
SIGN Scottish IntercollegiateGuidelines Network
SMD standardised mean difference
Struc structural
U of AE unit of analysis error
WHO World Health Organization
List of abbreviations
All abbreviations that have been used in this report are listed here unless the abbreviation is well known (e.g. NHS), or it has been used only once, or it is a non-standard abbreviation used only in figures/tables/appendices in which case the abbreviation is defined in the figure legend or at the end of the table.


BackgroundClinical practice guidelines are an increasinglycommon element of clinical care throughout theworld. Such guidelines have the potential toimprove the care received by patients bypromoting interventions of proven benefit anddiscouraging ineffective interventions. However,the development and introduction of guidelinesare not without costs. In some circumstances, thecosts of development and introduction are likely tooutweigh their potential benefits. In othercircumstances, it may be more efficient to adoptless costly but less effective dissemination andimplementation strategies. Local healthcareorganisations have relatively few resources forclinical effectiveness activities and policy makersneed to consider how best to use these tomaximise benefits.
ObjectivesThe aims of the study were:
� to undertake a systematic review of theeffectiveness and costs of different guidelinedevelopment, dissemination andimplementation strategies
� to estimate the resource implications ofdifferent development, dissemination andimplementation strategies
� to develop a framework for deciding when it isefficient to develop and introduce clinicalguidelines based upon the potential costs andbenefits of the targeted clinical activity and theeffectiveness and costs of guidelinedevelopment and introduction.
MethodsSystematic review of the effectivenessand efficiency of guidelinedissemination and implementationstrategiesData sources MEDLINE (1966–1998), Healthstar (1975–1998),Cochrane Controlled Trial Register (4th edition1998), EMBASE (1980–1998), SIGLE (1980–1988)
and the specialised register of the CochraneEffective Practice and Organisation of Care(EPOC) group were searched using a goldstandard search strategy developed fromhandsearches of key journals. The search strategywas 93% sensitive and 18% specific.
Study selection (inclusion criteria)� Types of study design: randomised controlled
trials, controlled clinical trials, controlled beforeand after studies and interrupted time series
� types of participant: medically qualified healthcareprofessionals
� types of intervention: guideline dissemination andimplementation strategies
� types of outcome: objective measures of providerbehaviour and/or patient outcome.
Data extraction (and assessment of validity)Two reviewers independently abstracted data onthe methodological quality of the studies (usingthe Cochrane EPOC group’s methodologicalquality criteria), characteristics of study setting,participants, targeted behaviours andcharacteristics of interventions. Studies reportingeconomic evaluations and cost analyses werefurther assessed against the British Medical Journal guidelines for reviewers of economicevaluations.
Data synthesisSingle estimates of dichotomous process variables(e.g. proportion of patients receiving appropriatetreatment) were derived for each studycomparison based upon the primary end-point (asdefined by the authors of the study) or the medianmeasure across several reported end-points. Anattempt was made to reanalyse studies withcommon methodological weaknesses. Separateanalyses were undertaken for comparisons ofsingle interventions against ‘no-intervention’controls, single interventions against controlsreceiving interventions, multifaceted interventionsagainst ‘no-intervention’ controls and multifacetedinterventions against controls receivinginterventions. The study also explored whetherthe effects of multifaceted interventions increasedwith the number of intervention components. Foreach intervention, the number of comparisonsshowing a positive direction of effect, the median
Health Technology Assessment 2004; Vol. 8: No. 6
ix
© Queen’s Printer and Controller of HMSO 2004. All rights reserved.
Executive summary

effect size across all comparisons, the medianeffect size across comparisons without unit ofanalysis errors, and the number of comparisonsshowing statistically significant effects werereported. A planned meta-regression analysiscould not be undertaken owing to the largenumber of different combinations of multifacetedinterventions.
Survey of estimating the feasibility and likely resource requirements ofguideline dissemination andimplementation strategies in UK settings Telephone interviews were conducted with keyinformants from primary and secondary care.
Results (research findings)Systematic review of the effectivenessand efficiency of guidelinedissemination and implementationstrategiesIn total, 235 studies reporting 309 comparisonsmet the inclusion criteria. The overall quality ofthe studies was poor. Seventy-three per cent ofcomparisons evaluated multifaceted interventions,although the maximum number of replications ofa specific multifaceted intervention was 11comparisons. Overall, the majority of comparisonsreporting dichotomous process data (86.6%)observed improvements in care; however, therewas considerable variation in the observed effectsboth within and across interventions. Commonlyevaluated single interventions were reminders (38comparisons), dissemination of educationalmaterials (18 comparisons) and audit andfeedback (12 comparisons). There were 23comparisons of multifaceted interventionsinvolving educational outreach. The majority ofinterventions observed modest to moderateimprovements in care. For example, the medianabsolute improvement in performance acrossinterventions was 14.1% in 14 cluster randomisedcomparisons of reminders, 8.1% in four clusterrandomised comparisons of dissemination ofeducational materials, 7.0% in five clusterrandomised comparisons of audit and feedbackand 6.0% in 13 cluster randomised comparisons ofmultifaceted interventions involving educationaloutreach. No relationship was found between thenumber of component interventions and theeffects of multifaceted interventions.
Only 29.4% of comparisons reported anyeconomic data. Eleven reported cost-effectiveness
analyses, 38 reported cost consequence analyses(where differences in cost were set againstdifferences in several measures of effectiveness)and 14 reported cost analyses (where some aspectof cost was reported but not related to benefits).The majority of studies only reported costs oftreatment; only 25 studies reported data on thecosts of guideline development or guidelinedissemination and implementation. The majorityof studies used process measures for their primaryend-point, despite the fact that only threeguidelines were explicitly evidence based (and maynot have been efficient). Overall, the methods ofthe economic evaluations and cost analyses werepoor. The viewpoint adopted in economicevaluations was only stated in ten studies. Themethods to estimate costs were comprehensive inabout half of the studies, and few studies reporteddetails of resource use. Owing to the poor qualityof reporting of the economic evaluation, data onresource use and cost of guideline development,dissemination and implementation were notavailable for most of the studies; only four studiesprovided sufficiently robust data for abstraction.
Survey of estimating the feasibility and likely resource requirements ofguideline dissemination andimplementation strategies in UK settings Respondents rarely identified existing budgets tosupport guideline dissemination andimplementation strategies and made frequentcomments about using ‘soft money’ or resourcesfor specific initiatives to support such activities. Ingeneral, the respondents thought that onlydissemination of educational materials and short(lunchtime) educational meetings were generallyfeasible within current resources.
Conclusions: implications forhealthcare and recommendationsfor researchThere is an imperfect evidence base to supportdecisions about which guideline dissemination andimplementation strategies are likely to be efficientunder different circumstances. Decision makersneed to use considerable judgement about howbest to use the limited resources they have forclinical governance and related activities tomaximise population benefits. They need toconsider the potential clinical areas for clinicaleffectiveness activities, the likely benefits and costsrequired to introduce guidelines and the likelybenefits and costs as a result of any changes in
Executive summary
x

provider behaviour. Further research is requiredto: develop and validate a coherent theoreticalframework of health professional andorganisational behaviour and behaviour change toinform better the choice of interventions in
research and service settings, and to estimate theefficiency of dissemination and implementationstrategies in the presence of different barriers andeffect modifiers.
Health Technology Assessment 2004; Vol. 8: No. 6
xi
© Queen’s Printer and Controller of HMSO 2004. All rights reserved.


BackgroundClinical practice guidelines are an increasinglycommon element of clinical care throughout theworld. Health systems are investing substantialresources in the development and introduction ofclinical guidelines in the belief that they willinform clinical practice promoting effective andcost-effective healthcare. In the UK, the NationalInstitute for Clinical Effectiveness (NICE) and theScottish Intercollegiate Guidelines Network(SIGN) have been established to develop nationalevidence-based guidelines.
Such guidelines have the potential to improve thecare received by patients by promotinginterventions of proven benefit and discouragingineffective interventions.1 However, thedevelopment and introduction of guidelines arenot themselves without costs. In somecircumstances, the costs of development andintroduction are likely to outweigh their potentialbenefits. In other circumstances, it may be moreefficient to adopt less costly but less effectivedissemination and implementation strategies.
Local healthcare organisations have relatively fewresources for clinical effectiveness activities andpolicy makers need to consider how best to usethese to maximise benefits. To make informedjudgements, policy makers need to consider arange of factors. First, what are the potentialclinical areas for clinical effectiveness activities?These may reflect national or local priorities. Policymakers should consider the prevalence of thecondition, whether there are effective and efficienthealthcare interventions available to improvepatient outcome, and whether there is evidencethat current practice is suboptimal. Second, whatare the likely benefits and costs required tointroduce guidelines? Policy makers need toconsider the likely effectiveness of differentdissemination and implementation strategies forthe targeted condition in their settings and theresources required to deliver the differentdissemination and implementation strategies.Third, what are the likely benefits and costs as aresult of any changes in provider behaviour?
Despite the current interest in guidelines, thereremains uncertainty about the likely effectiveness
of different guideline dissemination andimplementation strategies and resources requiredto deliver them. The recent Effective Health Carebulletin2 identified seven systematic reviews ofdifferent guideline dissemination andimplementation strategies.3–9 In general, thesystematic reviews observed that disseminationand implementation of guidelines could lead tochanges in professional behaviour. The EffectiveHealth Care bulletin4 on implementing guidelinesconcluded that they were more likely to beeffective if they take into account localcircumstances, are disseminated by an activeeducational intervention and are implemented bypatient specific reminders. Oxman and colleagues5
concluded that there are “no magic bullets” forprovider behaviour change; a range ofinterventions can lead to provider behaviourchange, but no single intervention is alwayseffective for changing behaviour. Wensing andcolleagues8 concluded that multifacetedinterventions combining more than oneintervention tended to be more effective but maybe more expensive. However, many of thesereviews failed to account for methodologicalweaknesses in the primary studies (such aspotential unit of analysis errors) and tended to usevote-counting techniques (see Appendix 1 forfurther discussion of these issues). As a result, theyprovide little information about the likely effectsizes of different interventions and how this mightvary, for example, across different settings,different targeted groups and different clinicalactivities. None of them considered the resourcesrequired to deliver the intervention or the likelyefficiency of the interventions. As a result,purchasers and providers have little to guide themabout when it would be worthwhile to devoteresources to guideline development andintroduction for specific clinical problems.
The study aimed to develop a framework fordeciding when it is worthwhile to develop andintroduce clinical guidelines, based upon thepotential costs and benefits of the targeted clinicalactivity, the current levels of activity (and thuspotential for health gain), and the likelihood thatthe development and introduction of clinicalguidelines will incur such costs and achieve suchbenefits.
Health Technology Assessment 2004; Vol. 8: No. 6
1
© Queen’s Printer and Controller of HMSO 2004. All rights reserved.
Chapter 1
Introduction
Aims of studyThe aims of the study were:
� to undertake a systematic review of theeffectiveness and costs of different guidelinedevelopment, dissemination andimplementation strategies
� to estimate the resource implications ofdifferent development, dissemination andimplementation strategies
� to develop a framework for deciding when it isefficient to develop and introduce clinicalguidelines based upon the potential costs andbenefits of the targeted clinical activity and theeffectiveness and costs of guidelinedevelopment and introduction.
Structure of this reportChapter 2 discusses the methods of the systematicreview of guideline dissemination and
implementation strategies. Appendices 1–3provide additional details of the statisticalmethods used, development of search strategiesand data checklist. Chapter 3 describes thecharacteristics of the included studies. Chapter 4describes the results of the systematic review.Appendices 4–6 include bibliographic details ofincluded studies, tables of the characteristics ofincluded studies and results. Chapter 5 describesthe methods and results of a review of economicevaluations and cost analyses of guidelineimplementation strategies undertaken by theincluded studies. Chapter 6 describes the results oftelephone interviews with key informants aboutthe feasibility of using different dissemination and implementation strategies and factors thatmight influence the resources required to deliverthem. Chapter 7 discusses the results of the studyand its strengths and limitations, and presents the main conclusions and recommendations of the study.
Introduction
2

AimsThe aims of the review were:
� to identify rigorous evaluations of theintroduction of clinical guidelines into medicalpractice
� to estimate the effectiveness of guidelinedissemination and implementation strategies topromote improved professional practice.
MethodsThe study followed the methods proposed by theCochrane Effective Practice and Organisation ofCare (EPOC) group.10
Selection criteria for studiesStudies were selected for inclusion if they met thefollowing criteria.
Study design� Randomised controlled trials (RCT), involving
either individual randomisation at the level ofthe patient (P-RCT) or cluster randomisation atthe level of professional, practice or healthcareorganisation (C-RCT)
� controlled clinical trials (CCT), involving eitherindividual allocation at the level of the patient(P-CCT) or cluster allocation at the level ofprofessional, practice or healthcare organisation(C-CCT)
� controlled before and after (CBA) studies� interrupted time series (ITS) designs.
Further details describing these study designs andthe rationale for including them in the review canbe found in the statistics appendix (Appendix 1).
Participants� Medically qualified healthcare professionals.
If the guidelines were aimed at multiprofessionalgroups or other healthcare professionals, studies
were included only if the results for medicalhealthcare professionals were reported separatelyor medical healthcare professionals representedmore than 50% of the targeted population. Studiesevaluating the introduction of guidelines targetingundergraduate medical students, patients or thegeneral public were excluded.
InterventionsFor the purpose of this review, the broad definitionof clinical guidelines as “systematically developedstatements to assist practitioner decisions aboutappropriate health care for specific clinicalcircumstances”11 was adopted. Studies thatevaluated an intervention that was considered bythe reviewers to meet the above criteria, regardlessof whether the term ‘guideline’ was explicitlymentioned, were included in the review.
Outcomes� Objective measures of provider behaviour
and/or patient outcome.
Studies that use aggregate self-report data onprovider behaviour, e.g. ‘do you usually measurepatients’ blood pressure during visits?’ wereexcluded. Studies that evaluated only medicalprofessionals’ satisfaction and/or knowledge wereexcluded.
Search strategyElectronic searches Electronic searches were undertaken of thefollowing databases:
� MEDLINE (1966–1998) � Healthstar (1975–1998)� Cochrane Controlled Trial Register (4th edition
1998)� EMBASE (1980–1998)� SIGLE (1980–1988)� the EPOC specialised register.
Details of the search strategies used and theirdevelopment are given in Appendix 2.
Health Technology Assessment 2004; Vol. 8: No. 6
3
© Queen’s Printer and Controller of HMSO 2004. All rights reserved.
Chapter 2
Systematic review of guideline dissemination and implementation strategies: aims and methods

Bibliographies of previous systematic reviewsIn addition, the reviewers checked the referencelists of 51 systematic reviews of professionalbehaviour change strategies identified in theEffective Health Care bulletin on ‘Getting evidenceinto practice’.2
There was no restriction on language ofpublication.
Screening of search resultsRT and CF screened the search results to identifypotentially relevant studies. Hard copies ofpotentially relevant studies were obtained andassessed against the inclusion criteria of the review by RT and LS. Disagreements were resolved by consensus in discussion with JG.
Data abstraction and qualityassessment (see Appendix 3 for thedata abstraction checklist)Two reviewers (RT and one of RD, ME, JG, LM,GM, LS, MW, PW) independently abstracted dataon:
� study design� methodological quality of the studies (using
the EPOC methodological quality criteria; see Box 1)
� participants (characteristics of professionals,including clinical speciality, level of training, age,years since graduation, proportion of eligibleproviders participating in study; characteristicsof patients, including clinical problem, age,gender, ethnicity; numbers of patients,providers, practices/hospitals/communitiesparticipating in the study)
� study settings (reimbursement system, setting ofcare, academic status, country)
� targeted behaviours� characteristics of interventions (characteristics
of clinical guidelines, whether a gap analysishad been undertaken13 and type of intervention(see below for further details)
� study results (see below for further details).
Classification of interventionsDissemination and implementation strategies wereclassified according to a taxonomy of professional,organisational, financial and regulatoryinterventions that was developed by EPOC (seeBox 2 for categories of professional interventions).The majority of interventions targeted professionals.There were also some interventions targetingpatients (e.g. patient-mediated interventions,patient financial incentives); given the small
number of these interventions, they were collapsedinto one category called patient directedinterventions. Similarly, all organisational andprofessional financial interventions were collapsedinto single categories (organisational andfinancial, respectively)
Derivation of study effect sizes (see Appendix 1for further details)A study could report one or all of the followingend-points: dichotomous process of care variable(e.g. proportion of patients receiving appropriatetreatment); continuous process of care variable(e.g. number of prescriptions issued by providers)dichotomous outcome of care (e.g. proportion ofpatients who have stopped smoking) andcontinuous outcome of care (e.g. mean symptomscore). Data were abstracted on each type of end-point. Where studies reported more than onemeasure of each end-point, the primary measure(as defined by the authors of the study) or themedian measure was abstracted. For example, ifthe comparison reported five dichotomous processof care variables and none of them was denotedthe primary variable, then the effect sizes for thefive variables were ranked and the median valuewas taken.
The hypothesised direction of effect differedbetween studies, with some studies expecting anincrease in outcome and others expecting adecrease. In all cases the effect size wasstandardised so that a positive difference betweenpostintervention percentages or means was a goodoutcome.
The type of data abstracted varied by studydesign. For C-RCTs, P-RCTs, CCTs and CBAs data were abstracted on baseline performance,postintervention performance, absolute differencein postintervention performance, and significancelevel for absolute difference in postinterventionperiod (and relative difference in postinterventionperformance and standardised mean differencefor continuous data only). For ITS, data wereabstracted on the change in slope and level. The reviewers attempted to reanalyse those ITS studies that either were analysedinappropriately or did not report comparableresults (see below and Appendix 1 for furtherdetails).
Where comparable data could not be abstracted,usually because of the complexity of the design oranalysis, the results were summarised in prose inthe results table (Appendix 6) and separately inthe text (Chapter 4).
Systematic review of guideline dissemination and implementation strategies: aims and methods
4

Health Technology Assessment 2004; Vol. 8: No. 6
5
© Queen’s Printer and Controller of HMSO 2004. All rights reserved.
BOX 1 Cochrane EPOC methodological quality criteria
1. Quality criteria for RCTs and CCTs
(a) Concealment of allocation
DONE Unit of allocation was institution, team or professional and any random process explicitly described,e.g. use of random number tables, OR unit of allocation was patient or episode of care and someform of centralised randomisation scheme, an on-site computer system or sealed opaque envelopesused
NOT CLEAR Allocation procedure not described explicitly OR unit of allocation was patient or episode of careand reported use of ‘list’ or ‘table’, ‘envelopes’ or ‘sealed envelopes’ for allocation
NOT DONE Use of alternation, such as reference to case record numbers, dates of birth, day of the week or anyother such approach OR unit of allocation was patient or episode of care and reported use of anyallocation process that is entirely transparent before assignment, such as an open list of randomnumbers or assignments OR allocation was altered by investigators, professionals or patients.
(b) Follow-up of professionals (protection against exclusion bias)
DONE Outcome measures for ≥ 80% of professionals randomised (Do not assume 100% follow-up unlessstated explicitly)
NOT CLEAR Not specified
NOT DONE Outcome measures for < 80% of professionals randomised
(c) Follow-up of patients or episodes of care
DONE Outcome measures for ≥ 80% of patients randomised or patients who entered the trial (Do notassume 100% follow-up unless stated explicitly)
NOT CLEAR Not specified
NOT DONE Outcome measures for < 80% of patients randomised or patients who entered the trial.
(d) Blinded assessment of primary outcome(s)a (protection against detection bias)
DONE Stated explicitly that primary outcome variables were assessed blindly OR outcome variables areobjective, e.g. length of hospital stay, drug levels assessed by a standardised test
NOT CLEAR Not specified.
NOT DONE Outcomes not assessed blindly.
(e) Baseline measurement
DONE Performance or patient outcomes measured prior to the intervention, and no substantial differencespresent across study groups
NOT CLEAR Baseline measures not reported, or unclear whether baseline measures are different across studygroups
NOT DONE Differences at baseline in main outcome measures likely to undermine the postinterventiondifferences, e.g. differences between groups before the intervention similar to those foundpostintervention.
(f) Reliable primary outcome measure(s)b
DONE Two or more raters with agreement ≥ 90% or kappa ≥ 0.8 OR outcome assessment is objective,e.g. length of hospital stay, drug levels assessed by a standardised test
NOT CLEAR Reliability not reported for outcome measures obtained by chart extraction or collected by anindividual
NOT DONE Two or more raters with agreement < 90% or kappa < 0.8.
(g) Protection against contamination
DONE Allocation by community, institution or practice and unlikely that control group received theintervention
NOT CLEAR Professionals allocated within a clinic or practice and possible that communication betweenexperimental and control group professionals could have occurred
NOT DONE Likely that control group received the intervention, e.g. cross-over trials or if patients rather thanprofessionals were randomised.
2. Quality criteria for controlled before and after (CBA) designs
(a) Baseline measurement
DONE Performance or patient outcomes measured before the intervention, and no substantial differencespresent across study groups
continued

Systematic review of guideline dissemination and implementation strategies: aims and methods
6
BOX 1 Cochrane EPOC methodological quality criteria (cont’d)
NOT CLEAR Baseline measures not reported, or unclear whether baseline measures are different across studygroups
NOT DONE Differences at baseline in main outcome measures likely to undermine the postinterventiondifferences, e.g. differences between groups before the intervention similar to those foundpostintervention.
(b) Characteristics of study and control
DONE Characteristics of study and control providers are reported and similar
NOT CLEAR It is not clear, e.g. characteristics are mentioned in the text but no data are presented
NOT DONE There is no report of characteristics either in the text or a table OR if baseline characteristics arereported and there are differences between study and control providers.
(c) Blinded assessment of primary outcome(s)a (protection against detection bias)
DONE Stated explicitly that primary outcome variables were assessed blindly OR outcome variables areobjective, e.g. length of hospital stay, drug levels assessed by a standardised test
NOT CLEAR Not specified
NOT DONE Outcomes were not assessed blindly.
(d) Protection against contamination
DONE Allocation by community, institution or practice and unlikely that control group received theintervention
NOT CLEAR Professionals allocated within a clinic or practice and possible that communication betweenexperimental and control group professionals could have occurred
NOT DONE Likely that control group received the intervention, e.g. cross-over trials or if patients rather thanprofessionals were randomised.
(e) Reliable primary outcome measure(s)b
DONE Two or more raters with agreement ≥ 90% or kappa ≥ 0.8 OR outcome assessment is objective,e.g. length of hospital stay, drug levels assessed by a standardised test
NOT CLEAR Reliability not reported for outcome measures obtained by chart extraction or collected by anindividual
NOT DONE Two or more raters with agreement < 90% or kappa < 0.8
(f) Follow-up of professionals (protection against exclusion bias)
DONE Outcome measures for ≥ 80% of professionals randomised (Do not assume 100% follow-up unlessstated explicitly)
NOT CLEAR Not specified
NOT DONE Outcome measures for < 80% of professionals randomised.
(g) Follow-up of patients
DONE Outcome measures for ≥ 80% of patients randomised or patients who entered the trial (Do notassume 100% follow-up unless stated explicitly)
NOT CLEAR Not specified
NOT DONE Outcome measures for < 80% of patients randomised or patients who entered the trial.
3. Quality criteria for ITSs
Protection against secular changes
(a) The intervention is independent of other changes
DONE The intervention occurred independently of other changes over time
NOT CLEAR Not specified (will be treated as NOT DONE if information cannot be obtained from the authors)
NOT DONE Reported that the intervention was not independent of other changes in time.
(b) There are sufficient data points to enable reliable statistical inference
DONE At least 20 points are recorded before the intervention AND the authors have done a traditionaltime series analysis (ARIMA model) (or a post hoc analysis can be done)
OR at least 3 points are recorded pre- and postintervention AND the authors have done a repeatedmeasures analysis (or a post hoc analysis can be done)
continued

Health Technology Assessment 2004; Vol. 8: No. 6
7
© Queen’s Printer and Controller of HMSO 2004. All rights reserved.
BOX 1 Cochrane EPOC methodological quality criteria (cont’d)
OR at least 3 points are recorded pre- and postintervention AND the authors have used ANOVA ormultiple t-tests (or a post hoc analysis can be done) AND there are at least 30 observations per datapoint
NOT CLEAR Not specified, e.g. number of discrete data points not mentioned in text or tables (treated as NOTDONE if information cannot be obtained from the authors)
NOT DONE Any of the conditions above are unmet.
(c) Formal test for trend (complete this section if authors have used ANOVA modelling)
DONE Formal test for change in trend using appropriate method is reported (e.g. see Cook andCampbell)12 (or can be redone)
NOT CLEAR Not specified (will be treated as NOT DONE if information cannot be obtained from the authors)
NOT DONE Formal test for change in trend has not been done.
Protection against detection bias
(d) Intervention unlikely to affect data collection
DONE Reported that intervention itself was unlikely to affect data collection, e.g. sources and methods ofdata collection were the same before and after the intervention
NOT CLEAR Not specified (treated as NOT DONE if information cannot be obtained from the authors)
NOT DONE Intervention itself was likely to affect data collection, e.g. any change in source or method of datacollection reported.
(e) Blinded assessment of primary outcome(s)a
DONE Stated explicitly that primary outcome variables were assessed blindly OR outcome variables areobjective, e.g. length of hospital stay, drug levels assessed by a standardised test
NOT CLEAR Not specified (treated as NOT DONE if information cannot be obtained from the authors)
NOT DONE Outcomes were not assessed blindly.
(f) Completeness of data set
DONE Data set covers 80–100% of total number of participants or episodes of care in the study
NOT CLEAR Not specified (will be treated as NOT DONE if information cannot be obtained from the authors)
NOT DONE Data set covers less than 80% of the total number of participants or episodes of care in the study.
(g) Reliable primary outcome measure(s)b
DONE Two or more raters with agreement ≥ 90% or kappa ≥ 0.8 OR outcome assessment is objective,e.g. length of hospital stay, drug levels assessed by a standardised test
NOT CLEAR Reliability not reported for outcome measures obtained by chart extraction or collected by anindividual (will be treated as NOT DONE if information cannot be obtained from the authors)
NOT DONE Two or more raters with agreement < 90% or kappa < 0.8.
a Primary outcome(s) are those variables that correspond to the primary hypothesis or question as defined by the authors. Inthe event that some of the primary outcome variables were assessed in a blind fashion and others were not, score eachseparately on the back of the form and label each outcome variable clearly.
b In the event that some outcome variables were assessed in a reliable fashion and others were not, score each separately onthe back of the form and label each outcome variable clearly.
ANOVA, analysis of variance; ARIMA, autoregressive integrated moving average.
Reanalyses of studies (see Appendix 1 for furtherdetails)Within-group pre–post comparisonsFor C-RCTs, P-RCTs, CCTs and CBAs, an attemptwas made to reanalyse the across grouppostintervention comparison if studies onlyreported or analysed within-group pre–postcomparisons. If reanalysis was not possible, thepoint estimates for the across-grouppostintervention comparison was reported withoutany estimate of the statistical significance.
Potential unit of analysis errorsIn many C-RCT studies the practitioner wasrandomised but during the statistical analysesindividual patient data were analysed as if therewas no clustering within practitioner. C-RCTstudies that do not account for clustering duringanalysis have ‘unit of analysis errors’.14 Althoughthe point estimate of effect is unlikely to be
biased, the p-values are likely to be artificiallyextreme and confidence intervals overly narrow,increasing the chances of spuriously significantfindings and misleading conclusions.15 If C-RCTshad potential unit of analysis errors, the reviewersattempted to reanalyse the trial using cluster leveldata. If reanalysis was not possible the pointestimates were reported without any estimate ofthe statistical significance.
ITS studiesFor ITS studies, each study was reanalysed (wherepossible) using time series regression methods (seeAppendix 1). Data were derived from tables ofresults presented in the original studies. Whereinformation on individual values was reportedgraphically only, data were derived by measuringeach data point manually. This was done using aflatbed scanner to obtain a digital image of thegraph. The images were then imported into a
Systematic review of guideline dissemination and implementation strategies: aims and methods
8
BOX 2 Classification of professional interventions from EPOC taxonomy
� Distribution of educational materials: distribution of published or printed recommendations for clinical care, includingclinical practice guidelines, audiovisual materials and electronic publications. The materials may have been deliveredpersonally or through mass mailings.
� Educational meetings: healthcare providers who have participated in conferences, lectures, workshops or traineeships.
� Local consensus processes: inclusion of participating providers in discussion to ensure that they agreed that the chosenclinical problem was important and the approach to managing the problem was appropriate.
� Educational outreach visits: use of a trained person who met with providers in their practice settings to giveinformation with the intent of changing the provider’s practice. The information given may have included feedback on theperformance of the provider(s).
� Local opinion leaders: use of providers nominated by their colleagues as ‘educationally influential’. The investigatorsmust have explicitly stated that their colleagues identified the opinion leaders.
� Patient-mediated interventions: new clinical information (not previously available) collected directly from patients andgiven to the provider, e.g. depression scores from an instrument.
� Audit and feedback: any summary of clinical performance of healthcare over a specified period. The summary may alsohave included recommendations for clinical action. The information may have been obtained from medical records,computerised databases or observations from patients.The following interventions are excluded:– provision of new clinical information not directly reflecting provider performance which was collected from patients,
e.g. scores on a depression instrument, abnormal test results. These interventions should be described as patientmediated
– feedback of individual patients’ health record information in an alternative format (e.g. computerised). Theseinterventions should be described as organisational.
� Reminders: patient- or encounter-specific information, provided verbally, on paper or on a computer screen, which isdesigned or intended to prompt a health professional to recall information. This would usually be encountered throughtheir general education, in the medical records or through interactions with peers, and so remind them to perform oravoid some action to aid individual patient care. Computer-aided decision support and drugs dosage are included.
� Marketing: use of personal interviewing, group discussion (‘focus groups’), or a survey of targeted providers to identifybarriers to change and subsequent design of an intervention that addresses identified barriers.
� Mass media: (1) varied use of communication that reached great numbers of people including television, radio,newspapers, posters, leaflets and booklets, alone or in conjunction with other interventions; (2) targeted at the populationlevel.
� Other: other categories to be agreed in consultation with the EPOC editorial team.

graphics package, gridlines applied and thecorresponding values read off. In some studies,derivation of data points from graphs was notpossible owing to the scales used. Time seriesregressions were undertaken to estimate two effectsizes for each ITS comparison. First, a change inthe level of outcome immediately after theintroduction of the intervention was estimated.This was done by extrapolating the preinterventionregression line to the first point postintervention.The difference between this extrapolated pointand the postintervention regression estimate forthe same point gave the change in level estimate.Further mathematical details are available fromthe authors. Second, a change in the slopes of theregression lines was estimated (calculated aspostintervention slope minus preinterventionslope). Both of these effect sizes were necessary forinterpreting the results of each study. For example,there could have been no change in the levelimmediately after the intervention, but therecould have been a significant change in slope.Reporting only the change in level estimate in thisexample would have misled the reader. Thedirection of effect was standardised so that apositive level or slope estimate was considered agood outcome and a negative estimate was a pooroutcome.
Data handling and managementAll included studies were given a uniqueidentifying number. Data were entered onto anAccess database. Any disagreements were resolvedby consensus.
Data synthesis and presentation Given the expected extreme heterogeneity withinthe review and the number of studies withpotential unit of analysis errors, there was no plan to undertake formal meta-analysis. Furtherdiscussion of this issue can be found in theanalytical framework section of Appendix 1.Previous qualitative systematic reviews ofimplementation strategies have largely used vote-counting methods that add up the number of positive and negative studies and concludewhether the interventions were effective on this basis.2,16 However, this method does notincorporate the precision of the estimate from primary studies, does not provide anestimate of the effect size of the intervention and has low statistical power. A more explicitanalytical framework was used within this review.
Separate analyses were undertaken for comparisonsof single interventions against ‘no-intervention’
controls (i.e. ‘usual care’ or control groups that didnot receive any interventions), single interventionsagainst ‘intervention’ controls (i.e. control groupsthat did receive an intervention), multifacetedinterventions against ‘no-intervention’ controlsand multifaceted interventions against ‘intervention’controls. For the multifaceted interventions,separate analyses were undertaken forcombinations including educational outreach and combinations with more than fourcomparisons. The reviewers also explored whetherthe effects of multifaceted interventions increasedwith the number of components. Although theoriginal plan was to undertake a metaregressionanalysis to estimate the effects of differentinterventions, the number of differentcombinations of multifaceted interventionsevaluated proved problematic (see Appendix 1 for further details).
Bibliographic details of the included studies arereported in Appendix 4, details of thecharacteristics of included studies (includingquality assessment) in Appendix 5 and the resultsof all comparisons in Appendix 6. Dichotomousprocess of care measures were used as the primaryeffect size for each comparison, for two pragmaticreasons: first, they were reported considerablymore frequently in the studies, and second,continuous process of care measures were lessstable. For example, a relative percentage change in a continuous measure depends on the scale being used: a comparison that shifts from a mean of 1 to 2 will show the same relative improvement as one that shifts from 25 to 50. To counter this standardised meandifferences were calculated where possible, but there were rarely enough data presented in the paper to do this. For completeness,dichotomous and continuous outcome results arealso reported.
For C-RCT, P-RCT, CCT and CBA comparisons,
� the number of comparisons showing a positivedirection of effect
� the median effect size across all comparisons� the median effect size across comparisons
without unit of analysis errors � and the number of comparisons showing
statistically significant effects
were reported (separately for each study design).This allows the reader to assess the consistency ofeffects across different study designs and acrosscomparisons where the statistical significance isknown.
Health Technology Assessment 2004; Vol. 8: No. 6
9
© Queen’s Printer and Controller of HMSO 2004. All rights reserved.

The paper also presents stacked bar charts ofestimates of dichotomous process measures (acrossall designs) against observed effect size,distinguishing between studies reportingsignificant effects, non-significant effects andstudies with unit of analysis errors. This allows thereader to assess the median and range of effectsizes across all studies.
To describe the size of effect (absolute differenceacross postintervention measures) for process
dichotomous measures, the following terms wereused:
� ‘small’ to describe effect sizes ≤ 5%� ‘modest’ to describe effect sizes > 5% and ≤ 10%� ‘moderate’ to describe effect sizes >10 and
≤ 20%� ‘large’ to describe effect sizes >20%.
For ITS comparisons, the significance of changesin level and slope is reported.
Systematic review of guideline dissemination and implementation strategies: aims and methods
10
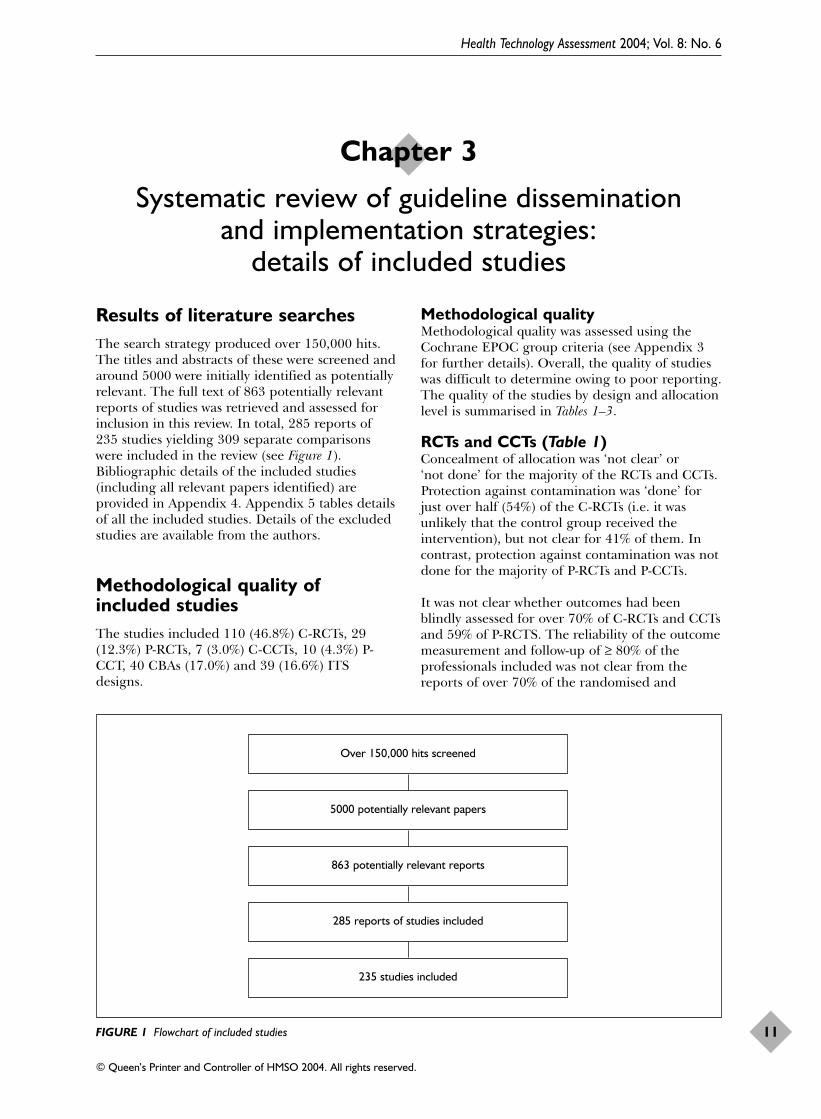
Results of literature searchesThe search strategy produced over 150,000 hits.The titles and abstracts of these were screened andaround 5000 were initially identified as potentiallyrelevant. The full text of 863 potentially relevantreports of studies was retrieved and assessed forinclusion in this review. In total, 285 reports of235 studies yielding 309 separate comparisonswere included in the review (see Figure 1).Bibliographic details of the included studies(including all relevant papers identified) areprovided in Appendix 4. Appendix 5 tables detailsof all the included studies. Details of the excludedstudies are available from the authors.
Methodological quality ofincluded studiesThe studies included 110 (46.8%) C-RCTs, 29(12.3%) P-RCTs, 7 (3.0%) C-CCTs, 10 (4.3%) P-CCT, 40 CBAs (17.0%) and 39 (16.6%) ITSdesigns.
Methodological qualityMethodological quality was assessed using theCochrane EPOC group criteria (see Appendix 3for further details). Overall, the quality of studieswas difficult to determine owing to poor reporting.The quality of the studies by design and allocationlevel is summarised in Tables 1–3.
RCTs and CCTs (Table 1)Concealment of allocation was ‘not clear’ or ‘not done’ for the majority of the RCTs and CCTs.Protection against contamination was ‘done’ forjust over half (54%) of the C-RCTs (i.e. it wasunlikely that the control group received theintervention), but not clear for 41% of them. Incontrast, protection against contamination was notdone for the majority of P-RCTs and P-CCTs.
It was not clear whether outcomes had beenblindly assessed for over 70% of C-RCTs and CCTsand 59% of P-RCTS. The reliability of the outcomemeasurement and follow-up of ≥ 80% of theprofessionals included was not clear from thereports of over 70% of the randomised and
Health Technology Assessment 2004; Vol. 8: No. 6
11
© Queen’s Printer and Controller of HMSO 2004. All rights reserved.
Chapter 3
Systematic review of guideline dissemination and implementation strategies:
details of included studies
FIGURE 1 Flowchart of included studies
Over 150,000 hits screened
5000 potentially relevant papers
863 potentially relevant reports
285 reports of studies included
235 studies included

controlled clinical trials. Follow-up of patients wasnot clear for 71% of C-RCTs. Measurement ofoutcomes at baseline and no differences atbaseline was done for 42% of C-RCTs and 14% ofC-CCTs.
CBAs (Table 2)The criterion ‘characteristics of study and controlsites reported and similar’ was not clear or notdone for 77.5% of CBAs and ‘outcomes measuredat baseline and no differences’ was not clear or notdone for 57.5% of CBAs. Protection againstcontamination was done for 62.5% of studies.
Blinded assessment of outcome, reliability ofoutcome measurement and follow-up of ≥ 80% ofpatients was not clear for over 75% of studies.Follow-up of ≥ 80% of professionals was not clearfor 67.5% of studies.
ITSs (Table 3) The intervention was deemed independent ofother changes in only 36% of the ITS studies anddeemed not to affect data collection in 92% ofstudies, but the completeness of the data set wasnot clear in 90% of studies. Sixteen (41%) of the39 ITS studies were analysed appropriately.Blinded assessment and reliable outcomes werenot clear for 14/39 (36%) of the ITS studies, butdone for the remainder.
Other methodological issuesSample size calculationsMost of the RCTs, CCTs and CBA studies did notreport a sample size calculation (135/196, 69%). In44 (22%) studies it was clear that a sample sizecalculation had been done and was fully reported,
Systematic review of guideline dissemination and implementation strategies: details of included studies
12
TABLE 1 Quality criteria for RCTs and CCTs
Criterion Done Not clear Not donen (%) n (%) n (%)
Concealment of allocation C-RCT 29 (26.4) 80 (72.7) 1 (0.9)P-RCT 4 (13.8) 24 (82.8) 1 (3.4)C-CCT 0 2 (28.6) 5 (71.4)P-CCT 0 0 10 (100)
Protection against contamination C-RCT 60 (54.5) 45 (41) 5 (4.5)P-RCT 0 5 (17.2) 24 (82.8)C-CCT 0 5 (71.4) 2 (28.6)P-CCT 0 0 10 (100)
Blinded assessment of outcome C-RCT 21 (19.1) 85 (77.3) 4 (3.6)P-RCT 11 (37.9) 17 (58.6) 1 (3.4)C-CCT 2 (28.6) 5 (71.4) 0P-CCT 2 (20.0) 8 (80.0) 0
Reliable outcome measure C-RCT 27 (24.5) 80 (72.7) 3 (2.7)P-RCT 3 (10.3) 26 (89.7) 0C-CCT 1 (14.3) 5 (71.5) 1 (14.3)P-CCT 0 10 (100) 0
Outcomes measured at baseline and no differences C-RCT 46 (41.8) 58 (52.7) 6 (5.5)P-RCT 9 (31.0) 20 (69.0) 0C-CCT 1 (14.3) 6 (85.7) 0P-CCT 0 10 (100) 0
Follow-up of professionals C-RCT 28 (25.5) 78 (70.9) 4 (3.6)P-RCT 0 29 (100) 0C-CCT 0 7 (100) 0P-CCT 1 (10) 9 (90) 0
Follow-up of patients C-RCT 29 (26.4) 78 (70.9) 3 (2.7)P-RCT 16 (55.2) 10 (34.5) 3 (10.3)C-CCT 4 (57.1) 3 (42.9) 0P-CCT 3 (30) 7 (70) 0

but 15 (34%) of these appeared to be retrospectivecalculations. In the remaining 17 studies it was notclear whether a sample size calculation had beendone.
Potential unit of analysis errorsPotential unit of analysis errors were present in themain analyses of 53% C-RCTs, 86% of C-CCTs and83% of CBAs.
Data points and intervals: ITS designsThe median numbers of data points before andafter the intervention for ITS studies were ten[interquartile range (IQR) 5–17] and 12 (IQR7–24), respectively. The interval between datapoints was 1 month in 64% of studies. Theminimum time interval was 5 days and themaximum was 1 year.
Data reportedProcess of care was measured in 95% of studies;67% of studies reported dichotomous processmeasures and 39% reported continuous processmeasures. Outcome of care was reported in 22% ofstudies; 14% reported dichotomous outcome
measures and 14% reported continuous outcomemeasures.
Twenty-nine per cent of studies reported economicdata (see Chapter 5 for further details).
Details of comparisonsSeventy-nine per cent of studies involved only onecomparison of an intervention group versuscontrol group, 13% involved two comparisons (e.g.three-arm C-RCT) and 8% involved three or morecomparisons.
In 69% of RCTs, CCTs and CBAs the controlgroup did not receive any intervention, in 22% thecontrol received a single intervention and in 10%the control received more than one intervention.
Details of participantsNumber of allocation units: RCTs,CCTs and CBAsThe number of allocation units in each studygroup was reported in 77% of the studies. The
Health Technology Assessment 2004; Vol. 8: No. 6
13
© Queen’s Printer and Controller of HMSO 2004. All rights reserved.
TABLE 2 Quality criteria for CBA studies
Criterion Done Not clear Not donen (%) n (%) n (%)
Characteristics of study and control reported and similar 9 (22.5) 17 (42.5) 14 (35.0)
Protection against contamination 25 (62.5) 14 (35) 1 (2.5)
Outcomes measured at baseline and no differences 17 (42.5) 16 (40.0) 7 (17.5)
Blinded assessment of outcome 6 (15) 31 (77.5) 3 (7.5)
Reliable outcome measure 6 (15) 34 (85) 0
Follow-up of professionals 12 (30) 27 (67.5) 1 (2.5)
Follow-up of patients 4 (10) 35 (87.5) 1 (2.5)
TABLE 3 Quality criteria for ITS designs
Criterion Done Not clear Not donen (%) n (%) n (%)
The intervention is independent of other changes 14 (36) 24 (61) 1 (3)
The intervention is unlikely to affect data collection 36 (92) 3 (8) 0
Blinded assessment of outcome 25 (64) 14 (36) 0
Reliable outcome measure 25 (64) 14 (36) 0
Completeness of data set 3 (7) 35 (90) 1 (3)
Analysed appropriately 16 (41) 11 (28) 12 (31)

remainder tended to report an overall numbertaking part in the study or the number of otherunits per study group, for example, practices wereallocated to study groups but the number ofindividual GPs per group was reported. Themedian number of allocation units per study armwas 18 (IQR 2–65). The studies that allocated tostudy arm by cluster (C-RCTs, C-CCTs, CBAs) hada median number of seven units per arm (IQR1–24). The median for non-cluster (P-RCTs, P-CCTs) studies was 113 (IQR 61–423).
Proportion of eligible providers orallocation units participatingThe percentage of eligible providers or allocationunits in the target sampling frame that participatedwas not clear in 186 (79%) studies. Where it wasreported, the median value was 80% (IQR 45–95%).
Setting and professionals The studies were conducted in 14 differentcountries: 71% were conducted in the USA, 11%in the UK, 6% in Canada, and 3% in Australia andThe Netherlands. The remaining studies wereconducted in Denmark, France, Germany, Israel,Mexico, New Zealand Norway, Sweden andThailand.
The most common setting was primary care (39%),followed by inpatient settings (19%) and generalistoutpatient or ambulatory care settings (althoughall of these studies were undertaken in the USAand may be equivalent to primary care) (19%).Thirty-six (15%) studies were based within mixedsettings, either inpatient and outpatient, at theinterface between settings, or a mix of community-and hospital-based care. The remaining studieswere set in nursing homes or long-term carefacilities (3%), emergency departments (2%),specialist outpatient care (1%) and a militarymedical clinic (0.4%). The setting was not clearfrom the reports of three (1%) studies.
Physicians or doctors alone were the target of theintervention in 174 (74%) of the studies; theremaining studies targeted physicians and otherhealth professionals and workers within theorganisations such as nurses, nurse practitioners,pharmacists, dieticians, physician’s assistants andoffice staff.
Most studies (57%) involved only one medicalspeciality, most commonly general practice orfamily medicine (24%).
The level of training of providers was not clearfrom the reports of 51% studies. Twenty-six per
cent involved both ‘fully trained’ providers andproviders ‘in training’, 14% targeted onlyproviders in training and 8% involved only fullytrained providers.
Details of interventionsCharacteristics of the clinicalguidelines The source of the guidelines was a nationalprofessional expert body or national governmentbody in 35% of studies, local clinicians in 30%;and 10% were from some other source. The sourceof the guidelines was not clear in 25% of studies.The composition of the guideline developmentgroup was not clear in 81% of studies. Theevidence base of the guideline recommendationswas not clear in 94% of studies. They appeared tobe based on good evidence in only 3% of studies.
The purpose of the recommendations wasappropriate management in 81% of studies, costcontainment in 4% and both appropriatemanagement and cost containment in 14%. Thepurpose was not clear or other in three (1%)studies.
An increase in established management was thenature of the desired change in 40% of studies. In25%, a modification in management was desired(i.e. an increased management frequency in oneactivity and a decrease in another) and a reductionin established management was required in 15% ofstudies. The nature of desired change was notclear in 11% of studies and combinations ofdesired change were required in 9%.
Targeted behavioursForty-seven per cent of studies targeted just onetype of provider behaviour. The single behaviourmost frequently targeted was general managementof the problem in 19% of studies, followed byprescribing in 14% of studies and test ordering in8%. The most frequently targeted behaviours incombination were prescribing (34% of studies),prevention (32% of studies), patient education andadvice (31% of studies), test ordering (23% ofstudies) and general management (23% ofstudies). Other targeted behaviours includeddiagnosis, discharge planning, financial,procedures, professional to patientcommunication, record keeping and referrals.
Intervention strategiesEighty-four of the 309 comparisons (27%) involveda study group receiving a single guideline
Systematic review of guideline dissemination and implementation strategies: details of included studies
14

implementation intervention strategy versus a ‘no-intervention’ or ‘usual care’ control group and 1%of comparisons involved single interventiongroups compared with a control group receiving asingle intervention. One hundred and thirty-six(44%) compared a group receiving a multifacetedintervention (>1 intervention) with a no-intervention or usual care control group.Multifaceted intervention groups were comparedwith a control group receiving an intervention (≥ 1intervention) for 85 (27%) of the comparisons.
The most frequent single intervention evaluatedagainst a no-intervention control was reminders in13% of all comparisons, followed by disseminationof educational materials in 6% of comparisons,audit and feedback in 4% of comparisons, andpatient-directed interventions in 3% ofcomparisons (Table 4).
The intervention strategy used most frequently aspart of multifaceted interventions was educationalmaterials (evaluated in 48% of all comparisons)(Table 5), followed by educational meetings (41%),reminders (31%), and audit and feedback (24%comparisons).
One hundred and seventeen studies (including136 comparisons) evaluated a total of 68 differentcombinations of interventions against a ‘no-intervention’ control group, and 61 studies(including 85 comparisons) evaluated 58 differentcombinations of interventions against a controlthat also received one or more interventions.
Health Technology Assessment 2004; Vol. 8: No. 6
15
© Queen’s Printer and Controller of HMSO 2004. All rights reserved.
TABLE 4 Single interventions versus ‘no-intervention’ controls
Intervention No. of comparisons
(% of total, 309)
Educational materials 18 (6)Educational meetings 3 (1)Consensus processes 0 (0)Educational outreach 1 (0.3)Opinion leaders 0 (0)Patient-directed interventions 8 (3)Audit and feedback 12 (4)Reminders 38 (13)Other professional 2 (1)
(including mass media and marketing)Financial interventions 0 (0)Organisational interventions 2 (1)Structural interventions 0 (0)Regulatory interventions 0 (0)
TABLE 5 Interventions used in multifaceted interventions
Intervention No. of comparisons
(% of total, 309)
Educational materials 147 (48)Educational meetings 126 (41)Consensus processes 16 (5)Educational outreach 35 (11)Opinion leaders 6 (2)Patient-directed interventions 56 (18)Audit and feedback 73 (24)Reminders 95 (31)Other professional 19 (6)
(including mass media and marketing)Financial interventions 12 (4)Organisational interventions 45 (15)Structural interventions 37 (12)Regulatory interventions 3 (1)


This chapter presents the results of the systematicreview of guideline dissemination andimplementation strategies. The results weresynthesised and reported in the followingstructured format (see also in Appendix 1,‘Analytical framework used in this review’):
� Evaluations of single interventions against ‘no-intervention’ control groups.
� Evaluations of single interventions against‘intervention’ control groups.
� Evaluations of multifaceted interventionsagainst ‘no-intervention’ controls:– all comparisons– multifaceted interventions incorporating
educational outreach– combinations of educational materials and
educational meetings– combinations of educational materials, and
audit and feedback– combinations of reminders and patient-
mediated interventions– combinations of educational materials,
educational meetings, and audit andfeedback
– combinations of educational materials,educational meetings and organisationalinterventions.
� Evaluations of multifaceted interventionsagainst ‘intervention’ controls:– all comparisons– multifaceted interventions incorporating
educational outreach– educational materials and reminders
compared with educational materials– educational materials, educational meetings
and reminders compared with educationalmaterials and educational meetings.
For each intervention above, study demographics,dichotomous process measures, continuous processmeasures, dichotomous outcome measures,continuous outcome measures, ITS results andsummary are reported. References to includedstudies denoted ‘A number’ are given in Appendix 4. The results for all comparisons arepresented in Appendix 6.
Evaluations of singleinterventions against no-intervention control groupsEighty-one studies (involving 84 comparisons)evaluated single interventions compared with ano-intervention control. There were nocomparisons evaluating educational outreach,local consensus processes, local opinion leaders,financial, structural or regulatory interventions asa single intervention.
Educational materialsEighteen studies (involving 18 comparisons)evaluated the effects of disseminating educationalmaterials, including seven C-RCTs (A15, A44, A60,A86, A140, A151, A168), two P-RCTs (A76, A91),two CBAs (A167, A198) and seven ITS (A19, A121,A167, A184, A188, A206, A234). One C-RCT(A140) also presented data on continuous processend-points based upon a CBA comparison. Eightstudies took place in the USA, four in the UK,three in Australia, two in Canada and one in TheNetherlands. The majority of studies were basedin primary care settings (n = 10). The targetedbehaviours were general management of a clinicalproblem in seven studies, prescribing in threestudies, prevention services in three studies, testordering in three studies and procedures in twostudies.
Results from RCT, CCT and CBA comparisonsDichotomous process measures (Figure 2). Fivecomparisons reported dichotomous process data,including four C-RCT comparisons (A15, A60,A151, A168) and one P-RCT comparison (A76).All C-RCT comparisons observed improvements incare; the median effect was +8.1% (range +3.6 to+17%) absolute improvement in performance.Two comparisons had potential unit of analysiserrors (A15, A60) and the significance of onecomparison could not be determined (A151). Theremaining comparison without a potential unit ofanalysis error observed an effect of +6% [notsignificant (NS)] (A168). The P-RCT comparisonobserved an absolute deterioration in care of–8.3% (NS).
Health Technology Assessment 2004; Vol. 8: No. 6
17
© Queen’s Printer and Controller of HMSO 2004. All rights reserved.
Chapter 4
Systematic review of guideline dissemination and implementation strategies: results

Continuous process measures. Five comparisonsreported continuous process data, including threeC-RCT comparisons (A44, A86, A151) and twoCBA comparisons (A140, A198). One C-RCTcomparison (A151) reported a +34.7% relativeimprovement in performance and a standardisedmean difference (SMD) of +0.25 (not significant).It was not possible to abstract comparable data fortwo C-RCT comparisons (A44, A86). Bothreported non-significant effects but onecomparison had a potential unit of analysis error(A86). The two CBA comparisons observed+77.3% (A140) and +100.3% (A198) relativeimprovements in performance. It was onlypossible to calculate an SMD for one comparison,+0.53 (A140). Both comparisons had potentialunit of analysis errors.
Dichotomous outcome measures. Two comparisonsreported dichotomous outcome data, includingone P-RCT (A91) and one CBA comparison(A167). The P-RCT comparison reported amedian effect of −4.6% absolute reduction inoutcome (NS). It was not possible to abstractcomparable data for the CBA comparison (A167),which reported a non-significant effect.
Continuous outcome measures. One C-RCTcomparison (A140) reported a median effect of
+17.1% relative improvement in outcome, SMD+0.86 (p < 0.05).
Results from ITS comparisonsSix comparisons were reanalysed using time seriesregression. The remaining comparison did notprovide sufficient data for reanalysis but hadundertaken time series regression of the change inslope (A121). Two comparisons reportedsignificant improvements in level (A19, A170);however, both also reported deterioration in slope(statistically significant for A170), suggesting adecay effect. One comparison reported asignificant deterioration in both level and slope(A234). The comparison that was not reanalysed(A121) observed a significant improvement inslope (data on change in level not reported).
SummaryThe majority of studies evaluating disseminationof educational materials observed improvementsin process of care. The effects were modest(absolute improvement across four C-RCTcomparisons +8.1%, range +3.6 to +17%, relativeimprovement in one C-RCT of +0.25 SMD). OneP-RCT comparison observed a deterioration incare. The statistical significance of two dichotomousprocess comparisons and one continuous processcomparison could be determined; none was
Systematic review of guideline dissemination and implementation strategies: results
18
0–10
1
2
3
4
5
6
7
8
9
10
11
12
13
14
0 10 20 30 40 50 60 70
U of AE
Not significant
Significant
Num
ber
of s
tudi
es
Absolute effect size (%)
FIGURE 2 Effect sizes observed in dichotomous process data in RCT, CCT and CBA comparisons of educational materials against a no-intervention control. U of AE: unit of analysis error

significant. Three of six ITS comparisons observedsignificant improvements in performance(although two also observed possible decayeffects), and one of the ITS comparisons observeda significant deterioration in performance. Onlyfour studies were conducted in UK settings. Theseresults suggest that educational materials mayhave a modest effect on guideline implementationthat may be short lived. However, the evidencebase is sparse and of poor quality.
Educational meetings Three C-RCTs (A86, A191, A202,) (involving threecomparisons) evaluated the effects of educationalmeetings against a no-intervention control. Onestudy took place in the USA, one in the UK andthe other in The Netherlands. Two studies werebased in primary care settings and one in aninpatient setting. General management was thetargeted behaviour of two studies and referrals ofthe other.
Results from RCT, CCT and CBA comparisonsDichotomous process measures. One C-RCTcomparison reported dichotomous process of careresults (A191); the median effect size was +1%absolute improvement in performance; however,there was a potential unit of analysis error.
Continuous process measures. One C-RCTcomparison reported continuous process measures(A202); the median effect was +27% relativeimprovement in performance. Insufficient datawere presented to calculate an SMD. Thecomparison also had a potential unit of analysiserror. It was not possible to abstract comparabledata for one C-RCT (A86) that reported non-significant effects but had a potential unit ofanalysis error.
Continuous outcome measures. One C-RCTcomparison reported continuous outcomemeasures (A191) and observed a median effect sizeof –3.6% relative change in performance.Insufficient data were presented to calculate anSMD and the comparison also had a potential unitof analysis error.
SummaryThere are relatively few evaluations of educationalmeetings against a no-intervention control. Theresults suggest that the effects, if any, are likely tobe small.
Audit and feedback Ten studies (involving 12 comparisons) evaluatedthe effects of audit and feedback, including seven
C-RCTs (A86, A125, A129, A130, A194, A209,A228,), one P-RCT (A174 – three comparisons),one CBA (A147) and one ITS (A75). Eight studiestook place in the USA and two in the UK. Fourstudies were based in a generalist outpatient orambulatory care setting, three in inpatientsettings, two in primary care settings, and thesetting was unclear in one study. The targetedbehaviour was general management in threestudies, prevention services in three studies, testordering in three studies and discharge planningin one study.
Results from RCT, CCT and CBA comparisonsDichotomous process measures (Figure 3). Sixcomparisons reported dichotomous process data,including five C-RCT comparisons (A129, A130,A194, A209, A228) and one CBA comparison(A147). All five C-RCT comparisons observedimprovements in care. Across all comparisons, themedian effect was +7.0% (range +1.3 to +16.0%)absolute improvement in performance. Threecomparisons had potential unit of analysis errors(A129, A194, A209). The two remainingcomparisons observed effects of +5.2% (NS)(A228) and +13% (p < 0.05) (A130). The CBAcomparison (A147) observed an absoluteimprovement in performance of +32.6%, thisstudy had a potential unit of analysis error.
Continuous process measures. Six comparisonsreported continuous process measures, includingthree C-RCT comparisons (A86, A125, A129) andone P-RCT comparison (A174 – threecomparisons). One C-RCT comparison (A129)observed +8.5% relative improvement inperformance, SMD +0.2; however, the study had apotential unit of analysis error. In two C-RCTcomparisons (A86, A125) it was not possible toabstract comparable data. The authors of bothstudies stated that the effects of audit andfeedback were not significant; however, there was apotential unit of analysis error in bothcomparisons.
Two out of three P-RCT comparisons (A174)observed improvements in care; across allcomparisons, the median effect was a +15.4%(range 0 to +20.3%) relative improvement inperformance. Insufficient data were provided tocalculate an SMD and the significance of thesecomparisons could not be determined.
Results from ITS comparisonsOne comparison (A75) was reanalysed using timeseries regression and observed a significant changein level but not in slope.
Health Technology Assessment 2004; Vol. 8: No. 6
19
© Queen’s Printer and Controller of HMSO 2004. All rights reserved.

Systematic review of guideline dissemination and implementation strategies: results
20
0–10
1
2
3
4
5
6
7
8
9
10
11
12
13
14
0 10 20 30 40 50 60 70
U of AE
Not significant
Significant
Num
ber
of s
tudi
es
Absolute effect size (%)
FIGURE 3 Effect sizes observed in dichotomous process data in RCT, CCT and CBA comparisons of audit and feedback against a no-intervention control
0–10
1
2
3
4
5
6
7
8
9
10
11
12
13
14
0 10 20 30 40 50 60 70
U of AE
Not significant
Significant
Num
ber
of s
tudi
es
Absolute effect size (%)
FIGURE 4 Effect sizes observed in dichotomous process data in RCT, CCT and CBA comparisons of patient-directed interventionsagainst a no-intervention control

SummaryAll studies evaluating audit and feedback observedimprovements in care. The effects were modest,with an absolute improvement across five C-RCTcomparisons of +7.0% (range +1.3 to +16.0%)and a relative improvement of +0.2 standardisedmean difference across one study. The statisticalsignificance of two process dichotomouscomparisons could be determined; one wasstatistically significant. One CBA comparisonobserved large absolute improvements inperformance (+32.6%), but had a unit of analysiserror. One ITS comparison observed a significantchange in level. Only two studies were conductedin UK settings, both of which targeted testordering. The results suggest that audit andfeedback may have a modest effect on guidelineimplementation.
Patient-directed interventionsSeven studies (involving eight comparisons)evaluated the effects of patient-directedinterventions, including four C-RCTs (A24, A111,A179 – two comparisons, A219) and three P-RCTs(A18, A34, A76). Six studies took place in the USAand one in Canada. Four studies were based inprimary care settings and three in generalistoutpatient or ambulatory care settings. Thetargeted behaviour was prevention services in fivestudies and general management of the problemin the remaining two.
Results from RCT, CCT and CBA comparisonsDichotomous process measures (Figure 4). Sixcomparisons reported dichotomous process data,including three C-RCT comparisons (A111, A179– two comparisons) and three P-RCT comparisons(A18, A34, A76). All three C-RCT comparisonsobserved improvements in care; the median effectsize was +20.8% (range +10.0 to +25.4%)absolute improvement in performance (however,all three comparisons had potential unit ofanalysis errors). All three P-RCT comparisonsreporting dichotomous process of care variablesobserved improvements in care. The median effect size was +1.0% (range 0.8 to +9.0%)absolute improvement in performance; thestatistical significance of one comparison could not be determined (A18) and the results of theother two comparisons were non-significant (A34,A76).
Continuous process measures. One C-RCTcomparison (A24) observed a median effect of–9.1% relative deterioration in performance andan SMD of -0.67; however, the study had apotential unit of analysis error.
Continuous outcome measures. Two C-RCTcomparisons (A24, A219) observed median effectsof +9.10% and +5.1% relative improvement inperformance and SMDs of +6.00 and +0.09;however, both comparisons had potential unit ofanalysis errors.
SummaryAll studies observed improvements in care. Theeffects were moderate to large. The medianabsolute effects were +20.8% (range +10.0 to+25.4%) across three C-RCT comparisons and+1.0% (+0.8 to +9.0%) across three P-RCTs. Theeffect sizes from the P-RCT comparisons mayunderestimate the effects of the intervention ifthere was a contamination effect (see Appendix 1).Consequently, greater weight should be given tothe C-RCTs. Unfortunately, all C-RCTs had unit ofanalysis errors. None of the studies was conductedin UK settings and the majority of the studiestargeted preventive services. These results suggestthat patient-mediated interventions may result inmoderate to large improvements in performance,especially when targeting preventive services.
RemindersThirty-eight studies (involving 38 comparisons)evaluated the effects of reminders against a no-intervention/usual care control, including 16 C-RCTs (A10, A38, A40, A47, A81, A111, A119,A128, A134, A135, A146, A156, A179, A180,A182, A209), nine P-RCTs (A13, A16, A34, A37,A42, A98, A133, A204, A207), two C-CCTs (A46,A189), eight P-CCTs (A90, A112, A142, A222,A223, A224, A225, A226), two CBAs (A101, A187)and one ITS (A12).
Thirty-four studies were conducted in the USA,two in Israel, one in Canada and one in Thailand.Fifteen studies (40%) were based in generalistoutpatient or ambulatory care settings, 11 (29%) inprimary care settings, eight in impatient settings,two in mixed settings, one in a specialistoutpatient setting and one in a military medicalcentre. The targeted behaviour was preventionservices in 19 studies, general management in 13studies, prescribing in three studies, and dischargeplanning, financial and procedures in theremaining three studies. Five studies wereconducted in the Regenstrief Institute (A133,A134, A135, A156, A209) and five in the CedersSinai Medical Center (A222, A223, A224, A225,A226).
Results from RCT, CCT and CBA comparisonsDichotomous process measures (Figure 5). Thirty-threecomparisons reported dichotomous process data,
Health Technology Assessment 2004; Vol. 8: No. 6
21
© Queen’s Printer and Controller of HMSO 2004. All rights reserved.

including 15 C-RCT comparisons (A10, A38, A40,A47, A81, A111, A119, A128, A134, A135, A156,A179, A180, A182, A209), eight P-RCTcomparisons (A13, A16, A34, A37, A98, A133,A204, A207), eight CCT comparisons (A46, A90,A112, A142, A222, A224, A225, A226) and twoCBA comparisons (A101, A187).
Twelve of 14 C-RCT comparisons reportedimprovements in care; the median effect was+14.1% (range –1.0 to +34.0%) absoluteimprovement in performance. Eleven comparisonshad potential unit of analysis errors; theremaining three comparisons (A119, A134, A135)observed a median effect of +20.0% (range +13to +20%); all were significant. Comparable datacould not be abstracted for one C-RCTcomparison (A10) that reported no significantchanges in overall compliance and had a potentialunit of analysis error.
Seven of eight P-RCT comparisons reportedimprovements in care; the median effect was+5.4% (range –1 to +25.7%). Three comparisonswere statistically significant (A13, A37, A207) andone study had a potential unit of analysis error(A133).
One C-CCT (A46) reported an absoluteimprovement in care of +4.3% but had a potential
unit of analysis error. Six of the seven P-CCTcomparisons reported improvements in care; themedian effect was +10.0% (range 0 to +40.0%)absolute improvement in care. Four comparisonswere statistically significant (A90, A142, A222,A224).
Two CBA comparisons (A101, A187) observedeffects of +3.6% and +10% absoluteimprovements in performance; both had potentialunit of analysis errors.
Continuous process measures. Ten comparisonsreported continuous process data, including twoC-RCT comparisons (A146, A182), one P-RCTcomparison (A207), one C-CCT (A189) and six P-CCT comparisons (A90, A112, A223, A224, A225,A226). One C-RCT comparison (A182) observed arelative improvement in performance of +16.7%;however, the SMD could not be calculated andthere was a potential unit of analysis error.Comparable data could not be abstracted for theother C-randomised comparison (A146). The P-RCT comparison observed a relative deteriorationin performance of –3.3% and –0.28 SMD;however, the significance of the comparison couldnot be ascertained.
The C-CCT (A189) observed a relativeimprovement in performance of +32.0% and an
Systematic review of guideline dissemination and implementation strategies: results
22
0–10
1
2
3
4
5
6
7
8
9
10
11
12
13
14
0 10 20 30 40 50 60 70
U of AE
Not significant
Significant
Num
ber
of s
tudi
es
Absolute effect size (%)
FIGURE 5 Effect sizes observed in dichotomous process data in RCT, CCT and CBA comparisons of reminders against a no-intervention control

SMD of +0.15; however, this was not significant.Five out of six P-CCT comparisons observedimprovements in performance; the median effectwas +5.7% (range –41.8 to +36.0%) relativeimprovement in performance. SMDs werecalculable for six comparisons. Improvements wereobserved in five of these comparisons; the medianeffect was +0.11 (range –0.81 to +0.22). Threecomparisons were statistically significant, oneobserved a relative deterioration in performanceof –41.8% (SMD –0.81) (A225) the other twoobserved relative improvements in performance of+25.7% (SMD +0.22) (A224) and +36% (SMDnot calculable) (A223).
Dichotomous outcome measures. Four comparisonsreported dichotomous outcome measures. One C-CRT (A182) observed an absolute improvementof 3% but had a potential unit of analysis error.Three CCT comparisons reporting dichotomousoutcome measures (A90, A225, A224) observedimprovements; the median effect was +1.9%(range +1.0 to +6.8%) absolute improvement inperformance. None of the effects was statisticallysignificant.
Continuous outcome measures. Four comparisonsreported continuous outcome data, including oneP-RCT comparison (A42) and three CCTcomparisons (A90, A225, A224). The P-RCTcomparison was designed to test equivalence andsuggested similar results for computer- andphysician-managed patients; however, there was apotential unit of analysis error. It was not possibleto abstract comparable data about the effect size.Two of the three CCT comparisons observedimprovements; the median effect was +1.9%(range –2.0 to +7.2%) relative improvement inperformance. The median SMD was +0.11 (range–0.07 to + 0.11). None of the studies wasstatistically significant.
Results from ITS comparisonsOne comparison (A12) was reanalysed using timeseries regression and observed positive statistically significant changes in both the leveland slope.
SummaryReminders were the most frequently evaluatedsingle intervention. The results were moderate.Improvements in dichotomous process measureswere observed in 28 out of 33 comparisons acrossall designs. Across all C-RCTs, the median effectsize was +14.1% (range –1.0 to +34.0%). Thestatistical significance of three C-RCT processdichotomous comparisons could be determined;
all were significant. Across all P-RCTs, the medianeffect was +5.4% (range –1 to +25.7%); three ofeight comparisons were statistically significant.Again, the difference in effect sizes between C-RCTs and P-RCTs suggests that there may be acontamination effect in P-RCTs (and P-CCTs). OneC-CCT observed an improvement of +4.3% buthad a potential unit of analysis error. Across all P-CCTs, the median effect was +10.0% (range +0to +40%); four of seven comparisons werestatistically significant. Two CBA comparisonsobserved effects of +3.6% and +10%; both hadunit of analysis errors. Reminders have beentested across a wide range of targeted behavioursand in a wide range of settings (although none ofthe studies was based in UK settings). Theseresults suggest that reminders may have amoderate effect on guideline implementation.
Other professional interventionsThree other studies (involving three comparisons)evaluated a professional intervention versus acontrol receiving no intervention or usual care,including two C-RCTs (A227, A86) and one P-RCT(A80).
One study was conducted in the USA, one inCanada and one in the UK. Two were based inprimary care settings, the other in an inpatientsetting. General management was the targetedbehaviour in two studies and referral in the thirdstudy.
One C-RCT comparison (A227) evaluated theprovision of nicotine replacement gum tophysicians and observed a +39.1% absoluteimprovement in performance (percentage ofpatients reporting that physicians mentionedsmoking) and +0.5% absolute improvement inoutcome (mean percentage per practice ceasedsmoking, 1 year prevalence). There was a potentialunit of analysis error in the dichotomous processanalysis and the significance of the dichotomousoutcome analysis could not be determined.
The other C-RCT comparison (A86) evaluated theeffects of interviewing GPs about outpatientreferrals. Comparable data could not beabstracted. The author states that the interventionhad no effect, there was a potential unit of analysiserror.
The P-RCT comparison (A80) evaluated the effectsof a rapid rule-out protocol in the management ofchest pain and observed a +71.8% relativeimprovement in performance and an SMD of+0.31 (statistically significant).
Health Technology Assessment 2004; Vol. 8: No. 6
23
© Queen’s Printer and Controller of HMSO 2004. All rights reserved.
Organisational interventionsTwo studies evaluated the effects of organisationalinterventions, including one C-RCT (A181) andone CBA (A93). One of the studies took place inthe USA, the other in The Netherlands. One wasbased in a primary care setting, the other in aninpatient setting. General management was thetargeted behaviour in one of the studies andprescribing in the other study.
The C-RCT comparison (A181) evaluated theeffects of continuity of care in diabetes in primarycare. It observed a +2.1% relative improvement inthe level of glycosylated haemoglobin; the SMDcould not be calculated and the study had apotential unit of analysis error.
The CBA comparison (A93) evaluated the effectsof clinical pharmacy services (revision ofprofessional role) on prescribing in an orthopaedicunit. They observed a –16.2% relativedeterioration in performance and an SMD of–0.21; however, the study had a potential unit ofanalysis error.
Evaluations of singleinterventions against interventioncontrol groupsThree studies involving three comparisonsevaluated single interventions against controlgroups that received interventions, including oneC-RCT comparison (A118) and two CBAcomparisons (A78, A210). Two studies were basedin the USA and one in Canada. Two were set inambulatory care settings and one in an inpatientsetting. Two targeted general management of aproblem and the third prescribing.
The C-RCT comparison (A118) evaluated whetherrequiring physicians to respond to computerreminders increased compliance compared withreminders alone. It observed 7% absoluteimprovement in the study group; however, therewas a potential unit of analysis error.
One CBA comparison (A78) compared educationalmaterials and reminders (control group). Therewas a –67% absolute deterioration in care in thestudy (educational materials) group; the study hada potential unit of analysis error.
The other CBA comparison (A210) comparedreminders and patient-directed intervention(control). There was a +5.6% absoluteimprovement in care in the study (reminders)
group; the study had a potential unit of analysiserror.
Evaluations of multifacetedinterventionsA total of 178 studies (including 222 comparisons)evaluated multifaceted interventions: 137comparisons (44.3%) evaluated 68 differentcombinations compared with a control group thatdid not receive an intervention, and 85 (27.5%)comparisons evaluated 55 different combinationscompared with a control group that also receivedan intervention. The maximum number ofcomparisons of the same combination ofinterventions against a no-intervention controlgroup was 11. The maximum number ofcomparisons of interventions against controlgroup that received an intervention was six. Thispresented considerable difficulties for the synthesisand interpretation of these studies. It was plannedoriginally to undertake a meta-regression analysisto estimate the effects of different interventions,but the number of multifaceted studies provedproblematic. Meta-regression allowing forinteraction effects between interventions was notpossible owing to the large number of additionalvariables required and because combinations ofsome interventions were highly correlated (seeAppendix 1 for further details). This sectiondescribes the results of comparisons of multifacetedinterventions against a control group that did notreceive interventions (no-intervention controls) andagainst control groups that did receive interventionsand summarises the results for differentcombinations of interventions with more than fivecomparisons. Finally, the study tested whether theeffectiveness of multifaceted interventionsincreases with the number of interventions.
Multifaceted interventions against no-intervention controlsA total of 117 studies (including 136 comparisons)evaluated 68 different combinations of interventions(including 26 combinations of two interventions,19 combinations of three interventions, 16combinations of four interventions and seveninterventions of five or more interventions) (Table6). The studies included 46 C-RCTs (A1, A9, A17,A22, A23, A24, A28, A31, A32, A39, A48, A51,A55, A56, A59, A64, A65, A85, A95, A96, A100,A102, A106, A111, A116, A117, A129, A137,A138, A141, A144, A149, A154, A158, A168,A183, A186, A192, A194, A196, A202, A208,A209, A219, A227, A235), 13 P-RCTs (A3, A16,A18, A21, A34, A53, A76, A103, A109, A123,
Systematic review of guideline dissemination and implementation strategies: results
24

A145, A163, A177), one C-CCT (A97), 27 CBAs(A5, A27, A49, A50, A54, A66, A69, A71, A74,A77, A83, A101, A110, A115, A127, A147, A160,A161, A167, A171, A172, A173, A175, A176,A178, A213, A216) and 30 ITS (A8, A11, A25,A26, A29, A41, A52, A58, A63, A68, A70, A73,A82, A87, A88, A107, A113, A124, A143, A150,A159, A164, A190, A195, A200, A201, A203,A217, A218, A231).
Eighty-two studies were undertaken in the USA, 16in the UK, six in Canada, five in Australia and theremaining eight in France, Mexico, New Zealand,The Netherlands, Norway, Sweden and Thailand.Forty-four studies were based within primary caresettings, 25 in mixed settings, 20 in inpatientsettings, 14 in generalist outpatient or ambulatorycare settings and 12 in nursing home or long-termcare facilities, accident and emergency settings,specialist outpatient clinics and a military medicalcentre. The setting was not clear in two studies.The targeted behaviour was general managementof a problem in 45 studies, prevention in 30studies, prescribing in 21 studies, test ordering in12 studies and procedures, financial managementand referral in the nine remaining studies.
Results from RCT, CCT and CBA comparisonsDichotomous process measures. Seventy-eightcomparisons (derived from 62 studies) evaluating49 different combinations of interventionsreported dichotomous process data, including 41C-RCT comparisons (A1 – two comparisons, A9,A17 – two comparisons, A23, A28 – twocomparisons, A31, A32 – two comparisons, A102,A55 – three comparisons, A48, A51, A56, A64,A65, A95, A111, A116, A117, A129 – twocomparisons, A137, A141, A144, A154 – twocomparisons, A168, A183, A186, A194, A196,A209, A227, A235, A208, A39), ten P-RCTcomparisons (A3, A16, A18 – two comparisons,A34, A76, A103, A123, A145, A177), one CCT
comparison (A97), 26 CBA comparisons (A5, A49,A50, A54, A66, A69 – four comparisons, A71,A101, A110, A115, A147, A160, A172, A171,A173, A175, A176 – four comparisons, A213, twocomparisons, A216). The majority of comparisonsevaluated combinations of two (n = 36), three (n = 25) or four (n = 10) interventions. Therewere few replications of evaluations for differentcombinations of interventions.
Table 7 summarises the median effect size of theabsolute improvement in performance acrossstudies for each combination of interventions.
Comparable data could not be abstracted for oneC-RCT (A208) and one CBA (A110). The C-RCTcomparison evaluated a combination ofeducational materials, educational meetings andorganisational interventions and observedsignificant improvements in care. The CBAcomparison evaluated a combination ofeducational materials, educational meetings, auditand feedback, and educational outreach andobserved a significant improvement in the use ofantibiotic prophylaxis in surgery.
Continuous process measures. Thirty comparisons(derived from 27 studies) reported continuousprocess data, including 18 C-RCT comparisons(A9, A22, A24, A56, A59, A85, A96, A100, A116,A129 – two comparisons, A138, A149, A158, A186,A192, A202, A208), three P-RCT comparisons(A109, A145, A177), one CCT (cluster) comparison(A97) and eight CBA comparisons (A27, A74, A77,A83 – three comparisons, A161, A178). Fourteencomparisons evaluated combinations of twointerventions, five comparisons evaluatedcombinations of three interventions, fourcomparisons evaluated combinations of fourinterventions and one comparison evaluated acombination of five interventions. Table 8summarises the median effect size of the relative
Health Technology Assessment 2004; Vol. 8: No. 6
25
© Queen’s Printer and Controller of HMSO 2004. All rights reserved.
TABLE 6 Summary of comparisons for multifaceted interventions against a no-intervention control group
No. of interventions No. of different No. of comparisons of Maximum no. of in multifaceted combinations of multifaceted interventions comparisons relating to interventions multifaceted interventions specific combination of
interventions
2 26 62 113 19 44 84 16 21 35 4 6 36 2 2 17 1 1
Total 68 136

Systematic review of guideline dissemination and implementation strategies: results
26
TABLE 7 Summary of comparisons of multifaceted interventions compared to no-intervention control groups reporting dichotomousprocess data
Combination of No. of Median % Range % absolute Study IDsinterventions comparisons absolute difference difference across
across studies studies
Two intervention combinationsA&F, Fin 1 6.7 NA A95A&F, LCP 1 –9 NA A194A&F, Outreach 2 13.7 +10 to +17.4 A55, A64A&F, Profoth 1 68 NA A123Edmat, A&F 2 7.4 +7.0 to +7.8 A69, A176Edmat, Edmeet 5 3.0 –3.0 to +10 A28, A55, A97,
A129, A154Edmat, Org 1 12.1 NA A103Edmat, Outreach 6 1.3 –5.6 to +13.1 A48, A49, A56,
A154, A172,A171
Edmat, Patmed 1 7.8 NA A76Edmat, Profoth 1 12 NA A168Edmat, Rem 1 1.1 NA A69Edmat, Org 1 5.0 NA A51Edmeet, Outreach 1 7.0 NA A144Edmeet, Rem 1 15.0 NA A175Org, Struc 1 45.0 NA A18Outreach, Org 1 2.2 NA A186Rem, A&F 2 9.2 +2.7 to +15.7 A32, A209Rem, Patmed 5 17.0 +1.3 to +25.1 A16, A31, A34,
A111, A147Rem, Struc 2 12.5 +8.0 to + 17.0 A177, A235
Three intervention combinationsEdmat, A&F, LCP 1 18.0 NA A176Edmat, Edmeet, A&F 3 43.0 +2.6 to +9.0 A23, A39, A129Edmat, Edmeet, Org 3 1.0 +0.4 to +6.3 A115, A213, A213Edmat, Edmeet, Outreach 3 11.0 +8.4 to +16.4 A65, A173, A196Edmat, Edmeet, Profoth 1 60.0 NA A227Edmat, Org, Struc 1 2.2 NA A69Edmat, Rem, A&F 2 26.0 +25.0 to + 27.0 A176, A176Edmat, Rem, Patmed 2 9.5 +5.6 to +13.4 A117, A137Edmat, Rem, Struc 1 11.1 NA A69Edmeet, A&F, LCP 2 24.0 +16.8 to +33.2 A102, A160Edmeet, Rem, A&F 1 –2.0 NA A18Edmeet, Rem, Patmed 2 23.5 +20.0 to +27.0 A17, A17Rem, A&F, Patmed 1 16.9 NA A32Rem, A&F, Struc 1 1.5 NA A183
Four intervention combinationsEdmat, Edmeet, A&F, Org 1 2.0 NA A116Edmat, Edmeet, A&F, Outreach 1 6.0 NA A55Edmat, Edmeet, A&F, Struc 1 0.3 NA A216Edmat, Edmeet, Profoth, Org 1 10.0 NA A50Edmat, Edmeet, LCP, Profoth 1 6.0 NA A71Edmat, Edmeet, Outreach, Patmed 1 –4.0 NA A28Edmat, Edmeet, Outreach, Profoth 1 2.2 NA A9Edmat, Edmeet, Rem, Org 1 4.0 NA A1Edmat, Rem, Outreach, Patmed 1 –2.0 NA A141Edmat, Rem, Patmed, Org, Struc 1 24.0 NA A3Rem, Fin, Org, Struc 1 54.0 NA A145Rem, Patmed, Org, Struc 1 8.9 NA A54
continued

Health Technology Assessment 2004; Vol. 8: No. 6
27
© Queen’s Printer and Controller of HMSO 2004. All rights reserved.
TABLE 7 Summary of comparisons of multifaceted interventions compared to no-intervention control groups reporting dichotomousprocess data (cont’d)
Combination of No. of Median % Range % absolute Study IDsinterventions comparisons absolute difference difference across
across studies studies
Five intervention combinationsEdmat, Edmeet, Patmed, Org, Struc 1 24.3 NA A101Edmat, Edmeet, Rem, A&F, Org 1 –2.0 NA A1Edmat, Edmeet, Rem, Org, Struc 1 19.6 NA A5
Six intervention combinationsEdmat, Edmeet, A&F, Patmed, 1 15.0 NA A66
Profoth, Fin
A&F: audit and feedback; Fin: financial; LCP: local consensus processes; Outreach: educational outreach; Profoth: otherprofessional; Edmat: educational materials; Edmeet: educational meetings; Org: organisational; Patmed: patient mediated;Rem: reminders; Struc: structural; NA: not applicable.
TABLE 8 Summary of comparisons of multifaceted interventions compared to no-intervention control groups reporting continuousprocess data
Combination of No. of Relative % SMD (range) Study IDsinterventions comparisons difference (range)
Two intervention combinationsA&F, Profoth 1 –17.2 NC A149
Edmat, A&F 2 +9.1 0.23 A178, A192(0 to +18.1)
Edmat, Edmeet 4 +18.75 0.09 A22, A97, A109, (+1.2 to +40.2) (+0.03 to +0.15) A129
Edmat, LCP 1 –38.6 NC A100
Edmat, Outreach 2 +15.7 NC A56, A161(+11.3 to +20.0)
Edmeet, Org 1 +245.0 NC A202
Org, Outreach 1 +5.5 NC A186
Rem, Struc 2 +130.9 NC A27, A177(+81 to +180.7)
Three intervention combinationsEdmat, Edmeet, A&F 3 +19.6 0.12 A74, A129, A158
(–13.1 to +400.0) (–2.1 to +0.45)
Edmat, Edmeet, Outreach 1 +24.0 NC A138
Four intervention combinationsEdmat, Edmeet, A&F, Org 1 +32.2 NC A116Edmat, Edmeet, Outreach, Profoth 1 +15.0 NC A9Edmat, Edmeet, Rem, Patmed 1 +23.1 1.5 A24Edmeet, Outreach, OL, Profoth 1 +1.7 NC A59Rem, Fin, Org, Struc 1 +7.6 4 A145
Five intervention combinationsEdmat, Edmeet, Rem, Patmed, Org 1 NC 2.5 A77
OL, opinion leaders; NC, not clear.

improvement in performance and SMD acrosscomparisons for each combination ofinterventions.
Comparable data could not be abstracted for sixcomparisons (A83 – three comparisons, A85, A96,A208). Two C-RCT comparisons (A85, A96)observed no significant effects. The third C-RCT(A208) observed a significant reduction in waitingtimes following referral. One CBA reported threecomparisons (A83). Two comparisons evaluatingcombinations of educational materials andmeetings observed significant increases in peakflow monitoring. The third comparison, evaluatinga combination of educational materials,educational meetings and reminders, observed asignificant increase in oral B2 antagonist use.
Dichotomous outcome measures. Fifteen comparisonsreported dichotomous outcome data, includingeight C-RCT comparisons (A9, A59, A64, A117,A141, A144, A183, A227), four P-RCTcomparisons (A21, A109, A163, A177), one CCTcomparison (A97) and two CBA comparisons (A66,A127). Six studies evaluated five combinations oftwo interventions, four studies evaluated fourcombinations of three interventions, three studiesevaluated three combinations of four interventionsand one study evaluated one combination of sixinterventions. Table 9 summarises the medianeffect size of the absolute improvement in
performance across comparisons for eachcombination of interventions. Comparable datawere not available for one C-RCT comparison(A117) that observed improvements in outcome.
Continuous outcome measures. Sixteen comparisons(derived from 15 studies) reported continuousoutcome data, including 11 C-RCT comparisons(A24, A59, A64, A85, A106, A116, A141, A219 –two comparisons, A235, A208), four P-RCTcomparisons (A53, A145, A163, A177) and oneCBA comparison (A173). Five comparisonsevaluated four combinations of two interventions,one comparison evaluated one combination ofthree interventions, five comparisons evaluatedfour combinations of four interventions and twocomparisons evaluated two combinations with fiveor more interventions. Table 10 summarises themedian effect size of the relative improvement inoutcome and SMD across comparisons for eachcombination of interventions.
Comparable data could not be abstracted for threeC-RCT comparisons (A85, A106, A208). All threecomparisons observed no significant effects of theintervention.
Results from ITS comparisonsThirty comparisons evaluated the effects ofmultifaceted interventions (A8, A11, A25, A26,A29, A41, A52, A58, A63, A70, A68, A73, A82,
Systematic review of guideline dissemination and implementation strategies: results
28
TABLE 9 Summary of comparisons of multifaceted interventions compared to no-intervention control groups reporting dichotomousoutcome data
Combination of interventions No. of Median % absolute Range % absolute Study IDscomparisons difference across difference across
studies studies
Two intervention combinationsA&F, Outreach 1 3 NA A64Edmat, Edmeet 2 11.5 10.0 to 13.0 A97, A109Edmeet, Outreach 1 –1 NA A144Rem, Org 1 21 NA A21Rem, Struc 1 8 NA A177
Three intervention combinationsEdmat, Edmeet, A&F 1 0.8 NA A127Edmat, Edmeet, Profoth 1 3.8 NA A227Edmeet, Org, Profoth 1 –8.3 NA A163Rem, A&F, Struc 1 –2.2 NA A183
Four intervention combinationsEdmat, Edmeet, Outreach, Profoth 1 –7 NA A9Edmat, Rem, Outreach, Patmed 1 –7 NA A141Edmeet, Outreach, OL, Profoth 1 0.1 NA A59
Six intervention combinationsEdmat, Edmeet, A&F, Patmed, 1 3 NA A66
Profoth, Fin

A87, A88, A107, A113, A124, A143, A150, A159,A164, A190, A195, A200, A201, A203, A217,A218, A231). Nineteen comparisons werereanalysed using time series regressions (A8, A11,A25, A41, A52, A70, A73, A82, A88, A113, A124,A143, A150, A164, A190, A201, A203, A218,A231) and comparable data were available fromthree comparisons (A29, A195, A217). Nineteen of21 comparisons observed improvements inchanges on level, nine comparisons werestatistically significant (A11, A25, A29, A70, A82,A88, A150, A217, A231) (Table 11). Fourteen of 21comparisons observed improvements in changesin slope; four comparisons were significant (A25,A29, A124, A190). One of seven comparisonsobserving deterioration in change in slope wasstatistically significant (A195).
Comparable data could not be abstracted andreanalysis undertaken for eight studies (A26, A58,A63, A68, A87, A107, A159, A200). One study(A200) presented data in control charts andreported significant improvements in care, but noquantification was given.
Additional analysesA number of comparisons evaluated discretecombinations of interventions (e.g. 11 comparisonsevaluated combinations of educational materialsand educational meetings). In this section, theresults of combinations of interventions that had
more than four comparisons are summarised.Twenty-three comparisons evaluating multifacetedinterventions including educational outreach wereidentified. Six additional combinations ofmultifaceted interventions had more than fourcomparisons, including: educational materials pluseducational meetings; educational materials plusaudit and feedback, reminders and patient-directed interventions; educational materials,educational meetings and audit and feedback;educational materials, educational meetings andaudit and feedback; and educational materials,educational meetings and organisationalinterventions.
Multifaceted interventions incorporatingeducational outreach Twenty-two studies (involving 23 comparisons)evaluated the multifaceted interventions includingeducational outreach against a no-interventioncontrol, including 14 C-RCTs (A9, A28, A48, A55– two comparisons, A56, A59, A64, A65, A138,A141, A144, A154, A186, A195), six CBAs (A49,A110, A161, A171, A172, A173) and two ITS(A195, A200).
Eleven different multifaceted interventionsincorporating educational outreach were evaluated,including four combinations of two interventions,one combination of three interventions, fivecombinations of four interventions and one
Health Technology Assessment 2004; Vol. 8: No. 6
29
© Queen’s Printer and Controller of HMSO 2004. All rights reserved.
TABLE 10 Summary of comparisons of multifaceted interventions compared to no-intervention control groups reporting continuousoutcome data
Combination of interventions No. of Relative % SMD (range) Study IDscomparisons difference (range)
Two intervention combinationsA&F, Outreach 1 0 0 A64
Rem, Struc 2 –0.4 0.115 A235, A177(–3.0 to +2.2) (–0.13 to +0.36)
Patmed, Profoth 1 32 A53
Edmeet, Org 1 19.4 A163
Three intervention combinationsEdmat, Edmeet, Outreach 1 13.9 2.375 A173
Four intervention combinationsEdmeet, Outreach, OL, Profoth 1 2.7 A59Edmat, Edmeet, Rem, Patmed 1 9.3 6.0 A24Rem, Fin, Org, Struc 1 2 A145Edmat, Rem, Outreach, Patmed 1 –1.4 A141Edmat, Edmeet, A&F, Org 1 0.1 A116
Five or more intervention combinationsEdmat, Edmeet, Rem, A&F, Org 1 0.9 0.003 A219Edmat, Edmeet, Rem, A&F, Patmed, 1 3 0.1 A219Profoth, Org

combination of six interventions. Commoncombinations included educational materials and educational outreach (eight comparisons),educational materials, educational meetings and educational outreach (four comparisons),audit and feedback and educational outreach (twocomparisons) and educational materials,educational meetings, audit and feedback andeducational outreach (two comparisons).
Twelve studies were conducted in the USA, four inthe UK, four in Australia and two in Sweden.Twelve studies were based in primary care settingsand five in nursing homes, the remaining studieswere based in mixed settings (two) and inpatientsettings (two), and in one the setting was not clear.Ten studies targeted prescribing, nine targetedgeneral management of a clinical problem, twotargeted prevention and one targeted procedures.
Results from RCT, CCT and CBA comparisonsDichotomous process measures. Eighteen comparisonsreported dichotomous process data, including 13
C-RCT comparisons (A9, A28, A55 – twocomparisons, A48, A56, A64, A65, A141, A144,A154, A186, A196) and five CBA comparisons(A49, A110, A171, A172, A173).
Eleven of the C-RCT comparisons observedimprovements in performance; the median effectwas +6.0% (range –4 to +17.4%) absoluteimprovement in performance. Statisticalsignificance could be determined for fivecomparisons (A28, A55, A56, A64); the medianeffect size across these studies was +10.0% (range–4 to +17.4%) absolute improvement inperformance (only one study observing a +17.4%absolute improvement in performance wasstatistically significant, A64). Seven studies hadpotential unit of analysis errors (A48, A65, A141,A144, A154, A186, A196) and the significance ofthe postintervention comparison could not bedetermined in one study (A9).
Two of four CBA comparisons (A49, A171, A172,A173) reporting dichotomous process of care
Systematic review of guideline dissemination and implementation strategies: results
30
TABLE 11 Summary of results of ITS comparisons of multifaceted interventions
Study Combination of interventions Study Change in Significance Change in SignificanceID reanalysed level slope
Two intervention combinationsA164 A&F, Org Yes + NS + NSA8 Edmat, Edmeet Yes + NS + NSA41 Edmat, Edmeet Yes + NS – NSA203 Edmat, Org Yes + NS + NSA150 Edmat, Org Yes + S – NSA195 Edmat, Outreach No – SA201 Edmat, Reg Yes + NS + NSA190 Legislation, Fin Yes – NS + SA218 Rem, Patmed Yes + NS – NSA88 Rem, Org Yes + S + NS
Three intervention combinationsA29 Edmat, A&F, Org No + S + SA11 Edmat, Edmeet, A&F Yes + S + NSA70 Edmat, Edmeet, A&F Yes + S – NSA217 Edmat, Fin, Org No + SA25 Edmat, Fin, Org Yes + S + SA124 Edmat, Mass media, Org Yes + NS + SA122 Edmat, Rem, Patmed Yes + NS + NSA82 Edmeet, A&F, LCP Yes + S + NSA73 Edmeet, A&F, Org Yes + NS + NS
Four intervention combinationsA231 Edmat, Edmeet, Rem, Org Yes + S – NSA143 Edmeet, Rem, A&F, Org Yes – NS + NS
Five intervention combinationsA52 Edmat, Edmeet, Rem, A&F, Org Yes + NS – NS
Comparable data were only available for 22 comparisons.Reg, regulatory; NS, not significant; S, significant.

results observed positive improvements inperformance. Across all studies the median effectwas +7.3 (range –5.6 to + 16.4%) absoluteimprovement in performance. All these studieshad potential unit of analysis errors. Comparabledata could not be abstracted for one study (A110)that reported significant improvements in use ofantibiotic prophylaxis in surgery.
Continuous process measures. Six comparisonsreported continuous process data, including fiveC-RCT comparisons (A9, A56, A59, A138, A186)and one CBA comparison (A161). All C-RCTcomparisons observed improvements inperformance; the median effect was +15.0%(range +1.7 to +24.0%) relative improvement inperformance. No studies reported sufficient datato calculate SMDs. One study had a potential unitof analysis error (A186) and the significance of thepostintervention comparison could not bedetermined in two studies (A9, A56). The remainingtwo studies were not statistically significant.
One CBA (A161) observed 11.3% relativeimprovement in performance. The SMD could notbe calculated and the study had a potential unit ofanalysis error.
Dichotomous outcome measures. Five C-RCTcomparisons reported dichotomous outcome data(A9, A59, A64, A141, A144); the median effect was–1.0% (range –7.0 to +3.0%) absoluteimprovement in outcome. Only two comparisonsobserved improvements in outcome. Three studieshad potential unit of analysis errors (A9, A64,A141) and the significance of one comparisoncould not be determined (A144). The remainingcomparison was not significant (A59).
Continuous outcome measures. Four comparisonsreported continuous outcome data, includingthree C-RCT comparisons (A59, A64, A141) andone CBA comparison (A173). The median effectof the C-RCT comparisons was 0% (range –1.4 to2.7%). The SMD could be calculated for onecomparison and was 0 (A64). Two comparisonshad potential unit of analysis errors (A64, A141)and the third comparison was not significant(A59). One CBA comparison (A173) observed a+13.9% relative improvement in outcome and anSMD of +2.8; however, the study had a potentialunit of analysis error.
Results from ITS comparisonsTwo studies reported continuous process data(A195, A200). One study reported statisticallysignificant improvements in performance (A195)
but could not be reanalysed. The second study(A200) displayed results as control charts; significantchanges were reported but no quantification wasgiven.
Additional analysesExploratory subgroup analyses were undertaken ofcomparisons evaluating combinations ofeducational materials and educational outreach(eight comparisons) and educational materials,educational meetings and educational outreach(four comparisons).
Educational materials and educational outreachEight studies evaluated the effects of educationalmaterials and educational outreach visits against ano-intervention control, including three C-RCTs(A48, A56, A154), four CBAs (A49, A161, A171,A172) and one ITS (A195). Six comparisonsreported dichotomous process data (includingthree C-RCT comparisons – A48, A56, A154 andthree CBA comparisons – A49, A171, A172).Improvements in care were observed in fourcomparisons; the median effect size was +1.2%(range –5.6 to +13.1%) absolute improvement inperformance. Five comparisons had potential unitof analysis errors and the remaining study wasnon-significant (A56). Both studies (A56, A161)reporting continuous outcome data observedimprovement in care but neither reportedsufficient data to calculate a standardised meaneffect size and the significance of the comparisonswas uncertain. One ITS comparison reportedsignificant improvements in performance butcould not be reanalysed (A195).
Educational materials, educational meetings andeducational outreachFour studies evaluated the effects of educationalmaterials, educational meetings and educationaloutreach visits against a no-intervention control,including three C-RCTs (A65, A138, A196) andone CBA (A173). Three comparisons reporteddichotomous process data (including two C-RCTcomparisons – A65, A196 and one CBAcomparisons – A173). Improvements in care wereobserved in all comparisons, the median effect sizewas +11.0% (range +8.4 to +16.4%) absoluteimprovement in performance. All comparisonshad potential unit of analysis errors. One C-RCTcomparison reported continuous process data andobserved a non-significant +24.0% relativeimprovement in performance; insufficient datawere provided to calculate an SMD (A138). OneCBA comparison reported continuous outcomedata observing a 13.9% relative improvement and
Health Technology Assessment 2004; Vol. 8: No. 6
31
© Queen’s Printer and Controller of HMSO 2004. All rights reserved.

an SMD of +2.38; the comparison had a potentialunit of analysis error (A173).
Relationship between number of interventionsand effect sizeExploratory analyses were undertaken todetermine whether the number of interventionsinfluenced the effectiveness of multifacetedinterventions including educational outreachcompared to a no-intervention control groupusing dichotomous process data. The medianeffect of combinations of two interventions was+4.6%, three interventions +11.0% and fourinterventions +0.1% (Table 12).
SummaryThe majority of studies evaluating multipleeducational outreach against a no-interventioncontrol observed absolute improvements inperformance of care. However, the effects weremodest, with absolute improvements of +6.0%(range –4 to +17.4%) across 11 C-RCTs and+7.3% (range –5.6 to +17.4%) across four CBAs.The statistical significance of five studies could becalculated, and only one was significant. Nostudies reporting continuous process measuresprovided sufficient information to calculate SMDs.Exploratory subgroup analyses suggested that:
� combinations of educational materials andeducational outreach may be relativelyineffective
� combinations of educational materials,educational meetings and educational outreachmay have modest to moderate effects
� there was no clear relationship between numberof interventions and effect size.
Four studies were conducted in the UK. Ten studiestargeted prescribing behaviours. These resultssuggest that multiple intervention strategiesincluding educational outreach may have a modesteffect on guideline implementation, especiallywhen targeting prescribing behaviours.
Combinations of educational materials andeducational meetingsTen studies (involving 11 comparisons) evaluatedcombinations of educational materials andeducational meetings, including five C-RCTs (A22,A28, A55, A129, A154), one P-RCT (A109), one C-CCT (A97), one CBA (A83 – two comparisons)and two ITS (A8, A41).
Seven studies (eight comparisons) were conductedin the USA, two in the UK and one in France. Fivestudies were based in primary care settings. Thetargeted behaviour was general management of aproblem in seven studies (eight comparisons).
Results from RCT, CCT and CBA comparisons Dichotomous process measures. Seven comparisonsreported dichotomous process data, including fourC-RCT comparisons (A28, A55, A129, A154), oneC-CCT comparison (A97) and two CBAcomparisons (A83). Three C-RCT comparisonsobserved improvements in care; the median effectwas +1.9% (range –3.0 to +5.0%) absoluteimprovement in care. Two comparisons hadpotential unit of analysis errors (A129, A154) andthe remaining two comparisons were non-significant. The C-CCT comparison observed anabsolute improvement of +10%; however, thestudy had a potential unit of analysis error.Comparable data could not be abstracted for the
Systematic review of guideline dissemination and implementation strategies: results
32
TABLE 12 Effectiveness of multifaceted interventions including educational outreach by number of interventions
No. of interventions Dichotomous process data (% absolute improvement in performance)
TwoNo. of studies 10Median effect +4.6Range –5.6 to +17.4
ThreeNo. of studies 3Median effect +11.0Range +8.4 to +16.4
FourNo. of studies 4Median effect +0.1Range –4.0 to +6.0

CBA comparisons; both reported significantincreases in peak flow monitoring (A83).
Continuous process data. Four comparisons reportedcontinuous process data, including two C-RCTcomparisons (A22, A129), one P-RCT (A109) andone C-CCT comparison (A97). The two C-RCTcomparisons observed relative improvements inperformance of +1.2% (A129) and 33.8% (A22).An SMD could only be calculated for onecomparison, +0.03 (A129). One comparison(A129) had a potential unit of analysis error andthe postintervention significance of the othercomparison could not be determined. The P-RCTcomparison observed a non-significantimprovement of 3.7%, but the SMD could not becalculated. The C-CCT comparison (A97)observed a relative improvement of +40.2%, withan SMD of +0.15; however, the study had apotential unit of analysis error.
Dichotomous outcome data. One C-CCT comparison(A97) observed an increase of +13.0% but had apotential unit of analysis error.
Results from ITS comparisonsTwo ITSs (A8, A41) observed no significantimprovements in care.
SummaryAll comparisons observed small to modestimprovements in process of care. The effects weresmall (absolute improvement across four C-RCTcomparisons +1.9%, range –3.0 to +5.0%) tomodest (one C-CCT comparison +10%). Twodichotomous process C-RCT comparisons werenon-significant. Two dichotomous process CBAcomparisons reported statistically significant results.One dichotomous process P-RCT comparison wasnon-significant. Two ITS comparisons were non-significant. Only two studies were conducted inUK settings. These results suggest that educationalmaterials and educational meetings incombination may have, at best, a small effect onguideline implementation. However, the evidencebase is sparse and of poor quality.
Combinations of educational materials andaudit and feedbackFour studies evaluated the effects of combinationsof educational materials and audit and feedback,including one C-RCT comparison (A192) andthree CBA comparisons (A69, A176, A178). Twostudies were based in the UK, one in Norway andone in the USA. Two studies were based ininpatient settings, one in family or general practiceand one in mixed settings. General management
was the targeted behaviour for two studies,whereas test ordering and prescribing were thebehaviours in the other two studies.
Results from RCT, CCT and CBA comparisons Dichotomous process data. Two CBA comparisonsreported dichotomous process data and observedimprovements of +7% (A176) and +7.8% (A69);both studies had potential unit of analysis errors.
Continuous process data. One C-RCT comparison(A192) observed a relative improvement of+18.1% and an SMD of 0.23. One CBAcomparison observed no change (0%) inperformance; the SMD could not be calculated.Both studies had potential unit of analysis errors.
SummaryThere were relatively few comparisons ofeducational materials and audit and feedback.Three of four comparisons observed improvementsin care. The effects were modest (median absoluteimprovement across two C-RCT comparisons of7.4%). These results suggest that effects are likelyto be modest.
Combinations of reminders and patient-directedinterventionsSix studies evaluated combinations of remindersand patient-directed interventions, including twoC-RCT comparisons (A31, A111), two P-RCTcomparisons (A16, A34), one CBA comparison(A147) and one ITS comparison (A218). Allstudies were conducted in the USA. Three studieswere based in primary care settings and three inambulatory care/outpatient settings. Generalmanagement was the targeted behaviour for allstudies.
Results from RCT, CCT and CBA comparisons Dichotomous process measures. Five comparisonsreported dichotomous process measures, includingtwo C-RCT comparisons (A31, A111), two P-RCTcomparisons (A16, A34) and one CBA comparison(A147). The two C-RCT comparisons observedabsolute improvements of +17.0% (A31) and+20.0% (A111), but both studies had potentialunit of analysis errors. The two P-RCTcomparisons observed absolute improvements of+1.3% (A34) and +6.0% (A16); neither wasstatistically significant. The CBA comparisonobserved an absolute improvement of +25.1% buthad a potential unit of analysis error.
Results from ITS comparisonsOne ITS comparison observed no significantimprovements in performance (A218).
Health Technology Assessment 2004; Vol. 8: No. 6
33
© Queen’s Printer and Controller of HMSO 2004. All rights reserved.

SummaryAll comparisons observed improvements inperformance. Effect sizes derived from two C-CRTcomparisons and one CBA comparison suggestmoderate to large effects (all comparisons hadpotential unit of analysis errors). Effect sizesderived from two P-RCTs were considerablysmaller and non-significant, probably due to acontamination effect. The results suggest thatcombinations of reminders and patient-directedinterventions may lead to moderate effects.
Combinations of educational materials,educational meetings, and audit and feedbackEight studies evaluated combinations ofeducational materials, educational meetings, andaudit and feedback, including four C-RCTs (A23,A158, A129, A39), two CBAs (A74, A127) and twoITS studies (A11, A70). Six studies were conductedin the USA and two in the UK. Three studies wereset in primary care settings, two in ambulatorycare/outpatient settings, two in inpatient settingsand one in a mixed hospital setting. Generalmanagement was the targeted behaviour in fourstudies and test ordering in four studies.
Results from RCT, CCT and CBA comparisons Dichotomous process measures. Three C-RCTcomparisons (A23, A129, A39) reporteddichotomous process data; the median effect was+3.0% (range +2.6 to +9.0%) absoluteimprovement in care. All three studies hadpotential unit of analysis errors.
Continuous process measures. Three comparisonsreported continuous process data. The two C-RCT comparisons observed +19.6% (A129) and +400% (A158) relative improvement inperformance. It was possible to calculate an SMDfor one study of +0.45 (A129). One study had apotential unit of analysis error (A129) and it wasnot possible to determine the statisticalsignificance in the other study (A158). One CBAcomparison (A74) observed –13.1% relativedeterioration in performance and had an SMD of–0.21. The study had a potential unit of analysiserror.
Dichotomous outcome measures. One CBAcomparison (A127) observed an improvement of+1.0%, but the study had a potential unit ofanalysis error.
Results from ITS comparisons Two comparisons (A11, A70) observed significantimprovements in level following the intervention.
SummaryThe observed effects were small (median absoluteimprovement across three C-RCT comparisons of+3.0%, relative improvement across one C-RCT+0.45 SMD). These results suggest thateducational materials, educational meetings, andaudit and feedback in combination may have, atbest, a small effect on guideline implementation.
Combinations of educational materials,educational meetings and organisationalinterventionsSix studies (seven comparisons) evaluatedcombinations of educational materials, educationalmeetings and organisational interventions,including one C-RCT (A208), two CBAs (A115,A213 – two comparisons) and three ITS (A63,A68, A87). Four studies were based in the USAand two in the UK. Four studies were set inprimary care settings. General management wasthe targeted behaviour in three studies,prescribing in two studies and test ordering in theother study.
Results from RCT, CCT and CBA comparisons Dichotomous process measures. Three CBAcomparisons (A115, A213 – two comparisons)reported dichotomous process data; the medianeffect was +1.0% (range +0.4 to +6.3%) absoluteimprovement in performance. All three studieshad potential unit of analysis errors.
Continuous process measures. One C-RCTcomparison (A208) reported a significant reductionin waiting times.
Continuous outcome measures. One C-RCTcomparison (A208) reported no significantdifferences in patient outcome.
Results of ITS comparisonsThree ITS comparisons were identified (A63, A68,A87). However, these had not been appropriatelyanalysed and it was not possible to reanalyse them.
SummaryThe observed effects were small (median absoluteimprovement across three CBA comparisons of+1.0%). These results suggest that educationalmaterials, educational meetings and organisationalinterventions in combination may have, at best, asmall effect on guideline implementation.
Multifaceted interventions againstintervention controlsSixty-one studies (including 85 comparisons)evaluated 58 different combinations of interventions
Systematic review of guideline dissemination and implementation strategies: results
34

(including 14 combinations of two interventions,19 combinations of three interventions, 14combinations of four interventions and 11combinations of five or more interventions) (Table 13). The maximum number of studiesevaluating a specific combination of studyinterventions against a specific combination ofcontrol interventions was six (Table 13).
The studies included 56 C-RCT comparisons (A2,A6, A7, A20 – three comparisons, A35, A36, A43,A45 – three comparisons, A57, A61 – threecomparisons, A62, A67, A72, A79 – twocomparisons, A84 – two comparisons, A92 – twocomparisons, A94 – two comparisons, A114, A120,A122 –two comparisons, A126, A132, A136 – twocomparisons, A139, A148, A152, A153 – twocomparisons, A155 – three comparisons, A157,A166, A169, A197, A212, A215, A219, A220, A221– two comparisons, A230 – two comparisons,A232), eight P-RCT comparisons (A30, A33, A104,A105, A193 – two comparisons, A204, A214), fiveC-CCT comparisons (A199 – two comparisons,A205, A211, A229), two P-CCT comparisons(A108, A165) and 14 CBA comparisons (A4 –three comparisons, A14 – two comparisons, A89,A99, A131 – three comparisons, A162, A185,A210, A233).
Forty-six studies took place in the USA, six inCanada, four in the UK, three in The Netherlands,and one each in France and Germany. Twenty-eight studies were based in primary care settings,16 in generalist outpatient or ambulatory caresettings, eight in inpatient settings, seven in mixedsettings and two in accident and emergency
settings. The targeted behaviour was generalmanagement in 27 studies, prevention in 27studies, prescribing in four studies, test orderingin two studies and discharge planning in onestudy.
Results from RCT, CCT and CBA comparisonsDichotomous process measures. Seventy-ninecomparisons (derived from 55 studies) evaluating49 different combinations of interventionsreported dichotomous process data, including 52C-RCT comparisons (A2, A6, A7, A20 – threecomparisons, A36, A43, A45 – three comparisons,A57, A61 – three comparisons, A62, A67, A72,A79 – two comparisons, A84 – two comparisons,A92 – two comparisons, A94 – two comparisons,A114, A120, A122 – two comparisons, A126, A132,A136 – two comparisons, A148, A153 – twocomparisons, A155 – three comparisons, A157,A169, A197, A212, A215, A219, A220, A221 – twocomparisons, A230 – two comparisons, A232),seven P-RCT comparisons (A30, A33, A104, A105,A193 – two comparisons, A204), five C-CCTcomparisons (A199 – two comparisons, A205,A211, A229), one CCT comparison (A165) and 14CBA comparisons (A4 – three comparisons, A14 –two comparisons, A89, A99, A131 – threecomparisons, A162, A185, A210, A233).
Table 14 summarises the median effect size of theabsolute improvement in performance acrossstudies for each combination of study and controlinterventions. Comparable data could not beabstracted for two CBA comparisons (A14 – twocomparisons) evaluating the effects of acombination of educational materials, educational
Health Technology Assessment 2004; Vol. 8: No. 6
35
© Queen’s Printer and Controller of HMSO 2004. All rights reserved.
TABLE 13 Summary of comparisons for multifaceted interventions against control groups that received interventions
No. of interventions No. of interventions No. of different No. of Maximum no. of in multifaceted in control group combinations of comparisons comparisons of specific interventions multifaceted combinations of study
interventions and control interventions
2 1 13 30 62 1 1 1
3 1 9 9 12 8 13 43 2 2 1
4 1 5 5 12 5 7 23 4 6 2
5 1 3 4 12 3 3 13 1 1 1
6 1 1 1 17 1 3 3 1
Total 58 85

Systematic review of guideline dissemination and implementation strategies: results
36
TABLE 14 Summary of comparisons of multifaceted interventions compared with controls that received interventions reportingdichotomous process data
Study interventions Control No. of Median effect Range % Study IDsinterventions studies size % absolute absolute
difference across difference across studies studies
Two study interventions compared with one control interventionA&F, LCP Edmat 1 –2.7 NA A122A&F, Outreach A&F 1 6 NA A99A&F, Patmed Patmed 1 9 NA A136Edmat, A&F Edmat 2 3.8 –17 to 24.6 A57, A185Edmat, A&F A&F 1 0.9 NA A221Edmat, Edmeet Edmeet 1 –1 NA A61Edmat, Edmeet Edmat 2 2 –5, 9 A230, A230Edmat, Rem Edmat 2 20.2 19 to 21.4 A157, A220Edmeet, A&F A&F 1 5.8 NA A89Edmeet, Org Edmat 1 8.7 NA A232Edmeet, Patmed Edmeet 1 10.3 NA A193Edmeet, Rem Edmeet 5 8.8 3.9 to 32 A43, A92, A92,
A148, A165Rem, A&F Rem 1 29.2 NA A120Rem, Patmed Patmed 2 12.3 3.6 to 21 A136, A210Rem, Patmed Edmeet 1 11 NA A61Rem, Patmed Rem 1 9.9 NA A211Rem, Struc Rem 1 2.8 NA A205Rem, Struc Patmed 1 2 NA A212
Two study interventions compared with two control interventionsEdmat, Outreach Edmat Outreach 1 –5.2 NA A169
Three study interventions compared with one control interventionEdmat, A&F, Outreach A&F 1 1.5 NA A221Edmat, Edmeet, OL Edmat 1 10.8 NA A122Edmat, Edmeet, Outreach Edmat 1 24.3 NA A153Edmat, Edmeet, Rem Profoth 1 23 NA A7Edmat, Rem, Profoth Profoth 1 2.6 NA A30Edmeet, A&F, Patmed Edmat 1 –0.3 NA A132Edmeet, Patmed, Org Edmeet 1 30.7 NA A104Edmeet, Rem, Patmed Edmeet 1 13.7 NA A193Rem, A&F, LCP LCP 1 0.5 NA A229
Three study interventions compared with two control interventionsEdmat, A&F, LCP Edmat, A&F 1 5.3 NA A2Edmat, Edmeet, A&F Edmat, Edmeet 1 3.1 NA A20Edmat, Edmeet, Patmed Edmat, Edmeet 1 2.8 NA A94Edmat, Edmeet, Rem Edmat, Edmeet 4 8.7 –2.7 to 34 A20, A45, A84,
A131Edmat, Patmed, Struc Edmat, Patmed 1 25 NA A162Rem, Patmed, Struc Rem, Patmed 1 10 NA A72Rem, Patmed, Struc Patdir, Struc 1 2 NA A204
Three study interventions compared with three control interventionsEdmat, Rem, Org Edmat, Rem, 1 13 NA A4
OrgEdmeet, Rem, A&F Edmeet, Rem, 1 4.4 NA A155
A&F
Four study interventions compared with one control interventionEdmat, Edmeet, A&F, Edmat 1 0.9 NA A79
OrgEdmat, Edmeet, A&F, Edmat 1 0 NA A215
Outreach
continued
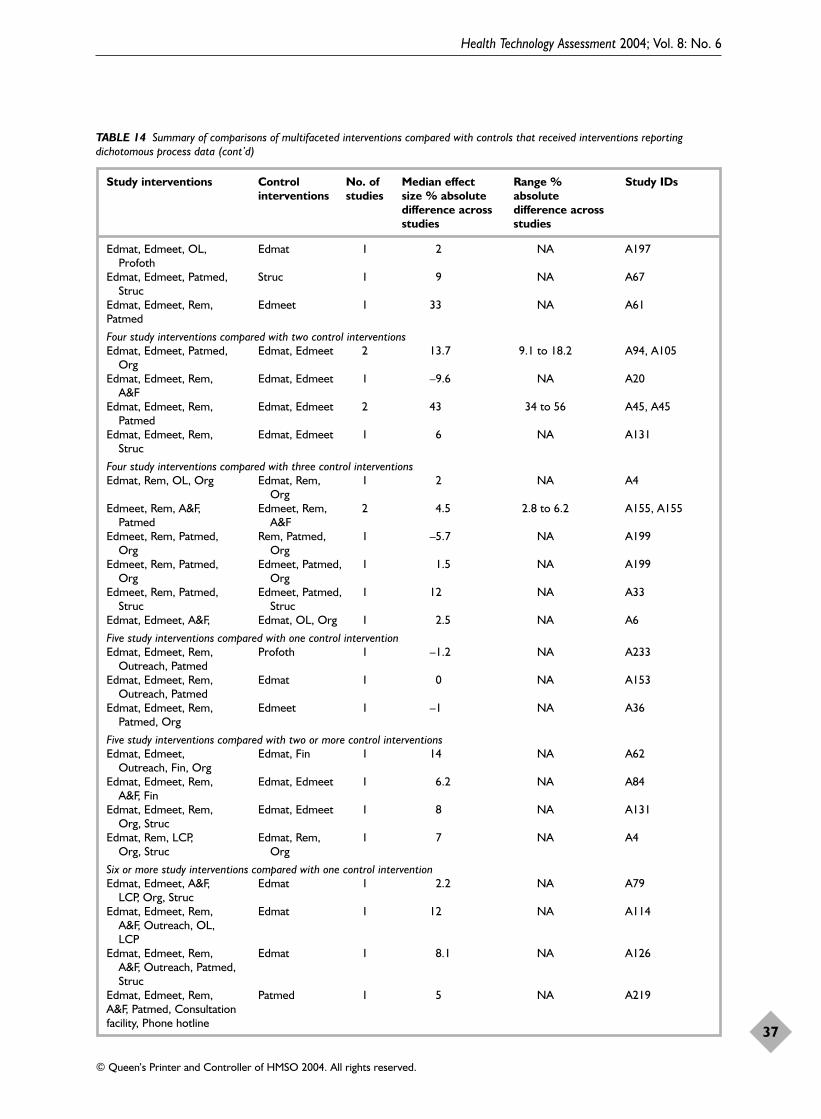
Health Technology Assessment 2004; Vol. 8: No. 6
37
© Queen’s Printer and Controller of HMSO 2004. All rights reserved.
TABLE 14 Summary of comparisons of multifaceted interventions compared with controls that received interventions reportingdichotomous process data (cont’d)
Study interventions Control No. of Median effect Range % Study IDsinterventions studies size % absolute absolute
difference across difference across studies studies
Edmat, Edmeet, OL, Edmat 1 2 NA A197Profoth
Edmat, Edmeet, Patmed, Struc 1 9 NA A67Struc
Edmat, Edmeet, Rem, Edmeet 1 33 NA A61Patmed
Four study interventions compared with two control interventionsEdmat, Edmeet, Patmed, Edmat, Edmeet 2 13.7 9.1 to 18.2 A94, A105
OrgEdmat, Edmeet, Rem, Edmat, Edmeet 1 –9.6 NA A20
A&FEdmat, Edmeet, Rem, Edmat, Edmeet 2 43 34 to 56 A45, A45
PatmedEdmat, Edmeet, Rem, Edmat, Edmeet 1 6 NA A131
Struc
Four study interventions compared with three control interventionsEdmat, Rem, OL, Org Edmat, Rem, 1 2 NA A4
OrgEdmeet, Rem, A&F, Edmeet, Rem, 2 4.5 2.8 to 6.2 A155, A155
Patmed A&FEdmeet, Rem, Patmed, Rem, Patmed, 1 –5.7 NA A199
Org OrgEdmeet, Rem, Patmed, Edmeet, Patmed, 1 1.5 NA A199
Org OrgEdmeet, Rem, Patmed, Edmeet, Patmed, 1 12 NA A33
Struc StrucEdmat, Edmeet, A&F, Edmat, OL, Org 1 2.5 NA A6
Five study interventions compared with one control interventionEdmat, Edmeet, Rem, Profoth 1 –1.2 NA A233
Outreach, PatmedEdmat, Edmeet, Rem, Edmat 1 0 NA A153
Outreach, PatmedEdmat, Edmeet, Rem, Edmeet 1 –1 NA A36
Patmed, Org
Five study interventions compared with two or more control interventionsEdmat, Edmeet, Edmat, Fin 1 14 NA A62
Outreach, Fin, OrgEdmat, Edmeet, Rem, Edmat, Edmeet 1 6.2 NA A84
A&F, FinEdmat, Edmeet, Rem, Edmat, Edmeet 1 8 NA A131
Org, StrucEdmat, Rem, LCP, Edmat, Rem, 1 7 NA A4
Org, Struc Org
Six or more study interventions compared with one control interventionEdmat, Edmeet, A&F, Edmat 1 2.2 NA A79
LCP, Org, StrucEdmat, Edmeet, Rem, Edmat 1 12 NA A114
A&F, Outreach, OL, LCP
Edmat, Edmeet, Rem, Edmat 1 8.1 NA A126A&F, Outreach, Patmed, Struc
Edmat, Edmeet, Rem, Patmed 1 5 NA A219A&F, Patmed, Consultation facility, Phone hotline
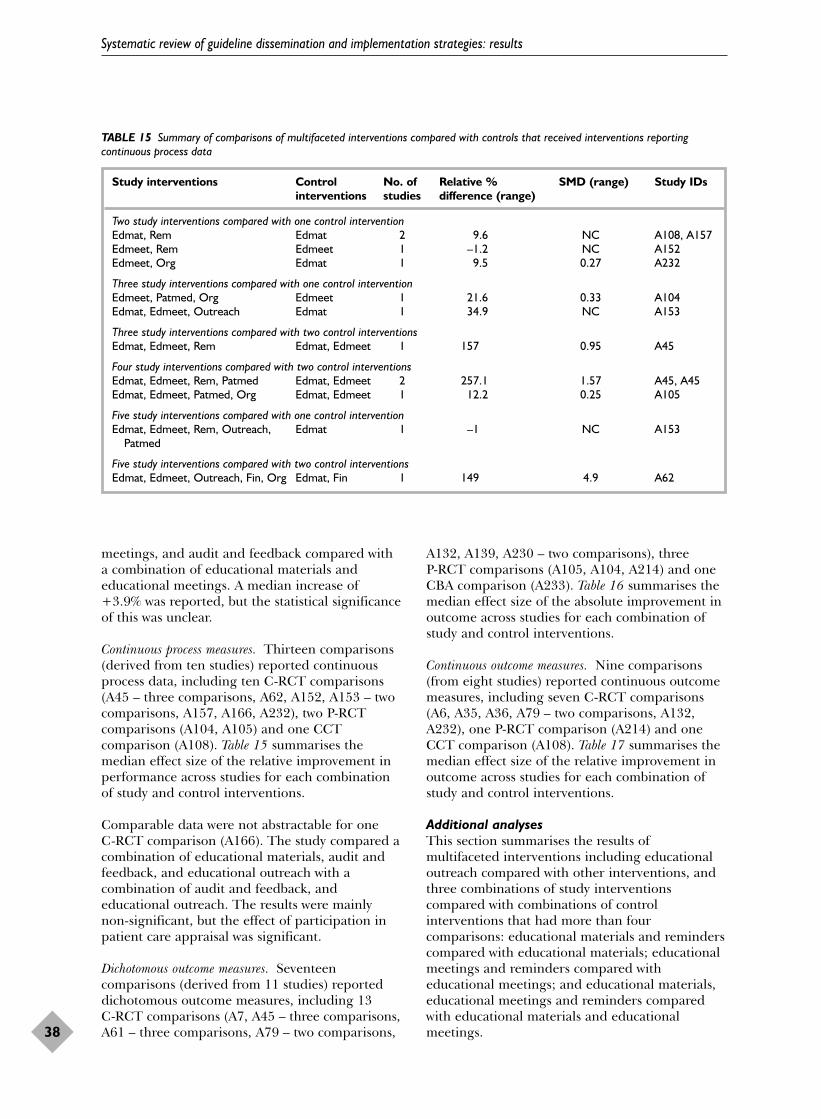
meetings, and audit and feedback compared witha combination of educational materials andeducational meetings. A median increase of+3.9% was reported, but the statistical significanceof this was unclear.
Continuous process measures. Thirteen comparisons(derived from ten studies) reported continuousprocess data, including ten C-RCT comparisons(A45 – three comparisons, A62, A152, A153 – twocomparisons, A157, A166, A232), two P-RCTcomparisons (A104, A105) and one CCTcomparison (A108). Table 15 summarises themedian effect size of the relative improvement inperformance across studies for each combinationof study and control interventions.
Comparable data were not abstractable for one C-RCT comparison (A166). The study compared acombination of educational materials, audit andfeedback, and educational outreach with acombination of audit and feedback, andeducational outreach. The results were mainlynon-significant, but the effect of participation inpatient care appraisal was significant.
Dichotomous outcome measures. Seventeencomparisons (derived from 11 studies) reporteddichotomous outcome measures, including 13 C-RCT comparisons (A7, A45 – three comparisons,A61 – three comparisons, A79 – two comparisons,
A132, A139, A230 – two comparisons), three P-RCT comparisons (A105, A104, A214) and oneCBA comparison (A233). Table 16 summarises themedian effect size of the absolute improvement inoutcome across studies for each combination ofstudy and control interventions.
Continuous outcome measures. Nine comparisons(from eight studies) reported continuous outcomemeasures, including seven C-RCT comparisons(A6, A35, A36, A79 – two comparisons, A132,A232), one P-RCT comparison (A214) and oneCCT comparison (A108). Table 17 summarises themedian effect size of the relative improvement inoutcome across studies for each combination ofstudy and control interventions.
Additional analysesThis section summarises the results of multifaceted interventions including educationaloutreach compared with other interventions, andthree combinations of study interventionscompared with combinations of controlinterventions that had more than fourcomparisons: educational materials and reminderscompared with educational materials; educationalmeetings and reminders compared witheducational meetings; and educational materials,educational meetings and reminders comparedwith educational materials and educationalmeetings.
Systematic review of guideline dissemination and implementation strategies: results
38
TABLE 15 Summary of comparisons of multifaceted interventions compared with controls that received interventions reportingcontinuous process data
Study interventions Control No. of Relative % SMD (range) Study IDsinterventions studies difference (range)
Two study interventions compared with one control interventionEdmat, Rem Edmat 2 9.6 NC A108, A157Edmeet, Rem Edmeet 1 –1.2 NC A152Edmeet, Org Edmat 1 9.5 0.27 A232
Three study interventions compared with one control interventionEdmeet, Patmed, Org Edmeet 1 21.6 0.33 A104Edmat, Edmeet, Outreach Edmat 1 34.9 NC A153
Three study interventions compared with two control interventionsEdmat, Edmeet, Rem Edmat, Edmeet 1 157 0.95 A45
Four study interventions compared with two control interventionsEdmat, Edmeet, Rem, Patmed Edmat, Edmeet 2 257.1 1.57 A45, A45Edmat, Edmeet, Patmed, Org Edmat, Edmeet 1 12.2 0.25 A105
Five study interventions compared with one control interventionEdmat, Edmeet, Rem, Outreach, Edmat 1 –1 NC A153
Patmed
Five study interventions compared with two control interventionsEdmat, Edmeet, Outreach, Fin, Org Edmat, Fin 1 149 4.9 A62

Health Technology Assessment 2004; Vol. 8: No. 6
39
© Queen’s Printer and Controller of HMSO 2004. All rights reserved.
TABLE 16 Summary of comparisons of multifaceted interventions compared with controls that received interventions reportingdichotomous outcome data
Study interventions Control No. of Median % Range % Study IDsinterventions comparisons absolute difference absolute difference
across studies across studies
Two study interventions compared with one control interventionEdmat, Edmeet Edmeet 2 –6.5 –1 to +14 A61, A139Edmat, Edmeet Edmat 2 –2 –3 to –1 A230, A230Edmat, Rem Edmat 1 7 NA A214Rem, Patmed Edmeet 1 20 NA A61
Three study interventions compared with one control interventionEdmat, Edmeet, Rem Profoth 1 –2 NA A7Edmeet, Patmed, Org Edmeet 1 20.4 NA A104Edmeet, A&F, Patmed Edmat 1 1.4 NA A132
Three study interventions compared with two control interventionsEdmat, Edmeet, Rem Edmat, Edmeet 1 6.4 NA A45
Four study interventions compared with one control interventionEdmat, Edmeet, A&F, Org Edmat 1 –0.9 NA A79Edmat, Edmeet, Rem, Edmeet 1 24 NA A61
Patmed
Four study interventions compared with two control interventionsEdmat, Edmeet, Rem, Edmat, Edmeet 2 3.5 +3.2 to +3.7 A45, A45
PatmedEdmat, Edmeet, Patmed, Edmat, Edmeet 1 21.7 NA A105
Org
Five study interventions compared with one control interventionEdmat, Edmeet, Rem, Profoth 1 –3.6 NA A233
Outreach, Patmed
Six study interventions compared with one control interventionEdmat, Edmeet, A&F, LCP, Edmat 1 2.2 NA A79
Org, Struc
TABLE 17 Summary of comparisons of multifaceted interventions compared with control interventions reporting continuous outcome data
Study interventions Control No. of Median % relative SMD Study IDsintervention comparisons difference across
studies (range)
Two study interventions compared with one control interventionEdmat, Rem Edmat 2 –8.2 (–16.3 to 0) –0.32 A108, A214Edmeet, Org Edmat 1 10 0.28 A232
Three study interventions compared with one control interventionEdmeet, A&F, Patmed Edmat 1 6.4 NC A132
Three study interventions compared with two control interventionsEdmeet, Patmed, Org Edmat, Edmeet 1 31.3 NC A35
Four study interventions compared with one control interventionEdmat, Edmeet, A&F, Org Edmat 1 NA A79
Five study interventions compared with one control interventionEdmat, Edmeet, A&F, OL, Org Edmat 1 6.1 NC A6Edmat, Edmeet, Rem, Patmed, Org Edmeet 1 –20 NC A36
Six study interventions compared with one control interventionEdmat, Edmeet, A&F, LCP, Org, Edmat 1 5.7 NA A79
Struc

Multifaceted interventions including educationaloutreach compared with other interventionsTen studies (involving 11 comparisons) evaluatedmultifaceted interventions including educationaloutreach against an intervention control, includingnine C-RCT comparisons (A62, A114, A126, A153– two comparisons, A166, A169, A215, A221) andtwo CBA comparisons (A99, A233). Six studies wereconducted in the USA, two in The Netherlands,one in Canada and one in the UK. The majorityof studies (n = 7) were based in primary caresettings. The targeted behaviour was prevention infive studies, general management of a problem inthree studies and prescribing in two studies. Allbut three comparisons had a single interventioncontrol. The most common control interventionwas dissemination of educational materials (n = 5).
Results from RCT, CCT and CBA comparisons Dichotomous process measures. Eight C-RCTcomparisons (A62, A114, A126, A153 – twocomparisons, A169, A215, A221) and two CBA comparisons (A233, A99) reporteddichotomous process measures. The median effectacross the eight C-RCTs was +4.5% (range –5.2 to+24.3%) absolute improvement in performance;five comparisons observed improvements in care.Three comparisons had potential unit of analysiserrors (A114, A153 – two comparisons) and thestatistical significance of one comparison could notbe determined (A114). Only one of the remainingcomparisons was statistically significant (A62). Thetwo CBA comparisons observed effects of –1.2%absolute deterioration in care (A233) and +6.0%absolute improvement in care (A99); both studieshad potential unit of analysis errors.
Five C-RCT comparisons (A114, A126, A153 – two comparisons, A215) evaluated multifacetedinterventions including educational outreachcompared with an educational materials control.Three out of five studies observed improvementsin care; across all studies, the median effect sizewas +8.1% (range 0 to +24.3%). Threecomparisons had potential unit of analysis errors(A126, A153 – two comparisons), one did not havesufficient data to determine significance (A114)and the remaining comparison was non-significant(A215).
One C-RCT comparison (A221) and one CBAcomparison (A99) evaluated multifacetedinterventions including educational outreachcompared with an audit and feedback control.Both observed improvements of care of +0.9%(NS) (A221) and +6.0% (potential unit of analysiserror) (A99).
Continuous process measures. Four C-RCTcomparisons reported continuous processmeasures (A62, A153 – two comparisons, A166).Across three comparisons (A62, A153 – twocomparisons), the median process continuouseffect was +34.9% (range –1 to +149.0%) relativeimprovement in performance. For twocomparisons insufficient data were reported tocalculate SMDs and the statistical significance ofthese comparisons was unclear (A153). The othercomparison (A62) observed an improvement of+149.0% and an SMD of 4.9 (p < 0.001).Comparable data could not be abstracted for theremaining C-RCT comparison (A166), whichreported mainly non-significant results, althoughthe effect on participation in patient careappraisal was significant.
Two C-RCT comparisons (A153 – two comparisons)evaluated multifaceted interventions includingeducational outreach compared with aneducational materials control, and observedrelative changes of –1.0% and +34.9%. Insufficientdata were reported to calculate SMDs and thestatistical significance of these comparisons wasunclear.
Dichotomous outcome measures. One CBA comparison(A233) observed an absolute deterioration of–3.6% in a dichotomous outcome measure;however, the study had a potential unit of analysiserror.
SummaryThe majority of studies evaluating multipleeducational outreach against an interventioncontrol observed absolute improvements inperformance of care. The effects were modest andless than those observed in comparisons ofmultiple interventions including educationaloutreach compared with a no-intervention control.Educational outreach appeared to be moreeffective than educational materials in three out offive comparisons and audit and feedback in twoout of two comparisons.
Educational materials and reminders comparedwith educational materials Four studies evaluated educational meetings andreminders compared with educational meetings,including two C-RCT comparisons (A157, A220),one P-RCT comparison (A214) and one CCTcomparison (A108). Two studies were based in theUSA, and one each in The Netherlands and theUK. Two studies were set in inpatient settings, onein mixed hospital settings, and one in an accidentand emergency department. General management
Systematic review of guideline dissemination and implementation strategies: results
40

was the targeted behaviour in two studies and testordering and discharge planning in the other twostudies.
Dichotomous process measures. Two C-RCTcomparisons reported dichotomous process dataand observed absolute improvements in process ofcare of +19% (potential unit of analysis error)(A220) and 21.4% (p < 0.05) (A157).
Continuous process measures. One C-RCT (A157)and one CCT (A108) comparison reportedcontinuous process measures and observed relativeimprovements in process of care of +6.2%(potential unit of analysis error) (A157) and+14.0% (NS) (A108). Neither study providedsufficient data to calculate the SMD.
Dichotomous outcome measures. One P-RCTcomparison (A214) observed an absoluteimprovement in patient outcome of +7.0%, butthe significance of the comparison was uncertain.
Continuous process measures. One P-RCTcomparison (A214) observed 0% relative changeand 0.0 SMD (non-significant). One CCTcomparison observed a relative deterioration inpatient outcome of –16.3% and an SMD of –0.32(NS).
SummaryThe combination of educational materials andreminders appears more effective than educationalmaterials alone.
Educational meetings and reminders comparedwith educational meetingsFive studies (involving six comparisons) evaluatededucational meetings and reminders comparedwith educational meetings, including five C-RCTcomparisons (A43, A92 – two comparisons, A148,A152) and one CCT comparison (A165). Allstudies were based in the USA, were set inambulatory care settings and targeted generalmanagement of a problem.
Dichotomous process measures. Five comparisons,including four C-RCT comparisons (A43, A92 –two comparisons, A148) and one CCT comparison(A165) reported dichotomous process data. All C-RCT comparisons observed improvements inperformance; the median effect size was +7.9%(range +3.9 to +32.0%) (three comparisons hadpotential unit of analysis errors, one hadinsufficient data to determine significance). TheCCT observed an improvement in performance of+24% (NS).
Continuous process measures. One CRCT (A152)comparison observed a relative deterioration of–1.2% in performance. Insufficient data wereprovided to calculate the SMD and the study hada potential unit of analysis error.
SummaryThe combination of educational meetings andreminders appears more effective than educationalmeetings alone.
Educational materials, educational meetings andreminders compared with educational materialsand educational meetingsFour studies evaluated educational materials,educational meetings and reminders comparedwith educational materials and educationalmeetings, including three C-RCT comparisons(A20, A45, A84) and one CBA comparison (A131).All studies were based in the USA and targetedgeneral management. Two studies were set inambulatory care settings, one in an inpatientsetting and one in a primary care setting.
Dichotomous process measures. All four comparisonsreported dichotomous process measures. Two ofthree C-RCT comparisons observed improvementsin performance; the median effect was +13.3%(range –2.7 to +34%) absolute improvement inperformance. Two comparisons had potential unitof analysis errors; the third comparison wasstatistically significant (A84). The CBA comparisonobserved an improvement of +4%; however, therewas a potential unit of analysis error.
Continuous process measures. One C-RCTcomparison (A45) observed a relativeimprovement of +157.0% and an SMD of +0.95(p < 0.05).
Dichotomous outcome measures. One C-RCTcomparison (A45) observed an absoluteimprovement of +6.4%, but the statisticalsignificance of this comparison could not bedetermined.
SummaryThe combination of educational materials,educational meetings and reminders appears moreeffective than educational materials andeducational meetings alone.
Does the effectiveness of multifacetedinterventions increase with the number ofinterventions?Table 18 reports the median effect sizes ofmultifaceted interventions by number of
Health Technology Assessment 2004; Vol. 8: No. 6
41
© Queen’s Printer and Controller of HMSO 2004. All rights reserved.

interventions in study and control groups. Figure 6illustrates the spread of effect sizes for increasingnumber of interventions in the study group, usingboxplots. Visually, there appeared to be norelationship between effect size and number ofinterventions. For studies with no-interventioncontrol groups, there was no statistical evidence ofa relationship between the number of
interventions used in the study group and theeffect size (Kruskal–Wallis test, p = 0.18). Inaddition, there was no evidence of a differencebetween studies that used multiple interventioncontrol groups and studies with multipleintervention study groups (Kruskal–Wallis test, p = 0.69).
Systematic review of guideline dissemination and implementation strategies: results
42
TABLE 18 Summary of median effect sizes for evaluations of multifaceted interventions by number of interventions in the study andcontrol arms
Median absolute effect size across studies (no. of studies)
No. of components No. of components in in study arm control arm 0 1 2 3
1 10.2 (n = 52) 5.3 (n = 4) – –2 7.4 (n = 36) 8.8 (n = 26) –5.2 (n = 1) –3 11.0 (n = 25) 10.8 (n = 9) 4.7 (n = 10) 8.7 (n = 2)4 4.0 (n = 11) 2.0 (n = 5) 13.7 (n = 6) 2.4 (n = 6)5 21.8 (n = 4) –0.5 (n = 4) 8.0 (n = 3) 8.0 (n = 1)6 15.0 (n = 1) 2.2 (n = 1) – –7 – 10.1 (n = 1) – –
–80%
–60%
–40%
–20%
0%
20%
40%
60%
80%
56N =1
632
463
284
16>4
Abs
olut
e ef
fect
siz
e
Number of interventions in treatment group
FIGURE 6 Effect sizes of multifaceted interventions by number of interventions

This chapter reviews the use of economic appraisalin evaluations of guideline dissemination andimplementation strategies. The aim is to determinethe frequency and methods of economic appraisalused and to summarise existing evidence on therelative efficiency of guideline dissemination andimplementation strategies and the costs ofguideline development, dissemination andimplementation. From this, conclusions will bedrawn about the strengths and weaknesses of theexisting economic analyses of guidelineimplementation and recommendations will bemade as to how such analyses can be improved.
The next section of this chapter briefly outlineshow an economic evaluation of guidelineimplementation strategies may differ from aneconomic evaluation of clinical interventions, andhighlights why an analyst may legitimately choosenot to include all stages of guideline disseminationand implementation in an economic evaluation.Following this, the methods and results of thereview of economic appraisals are presented and,in the final section, the strengths and weaknessesof the existing economic and cost analyses ofguideline implementation are discussed.
Structure for the economicevaluation of guidelineimplementationEconomic evaluation of guideline implementationstrategies should be based on the same basicprinciples as an evaluation of a standard healthtechnology (a new drug or a new type ofsurgery).17 A standard health technologyassessment limits itself to the consideration of thecosts and benefits of providing a treatment (e.g.administering drug A or drug B) and theconsequences of that treatment. The evaluation ofguideline implementation strategies is different inthat the breadth of costs and benefits that could beconsidered is wider. Determining whether theimplementation of a guideline is worthwhileinvolves determining whether the guideline itself
represents an efficient use of resources and themost efficient way of supporting practitioners toadopt the guideline.
There are three distinct stages in guidelinedevelopment and introduction could beconsidered in an economic evaluation:18
1. development of the guideline2. dissemination and implementation of the
guideline3. treatment effects and costs as a consequence of
behaviour change.
Although the structure of an economic evaluationof guideline implementation strategies couldinclude the costs and benefits from each of thethree stages, it may sometimes be legitimate todesign an economic evaluation of more limitedscope. Whether such limitations are appropriatedepends on what justification is given for thelimitation. Such justification should be explicit andsupported by appropriate evidence.
One legitimate reason to limit the evaluation tothe costs and benefits of changing practice may beif the guideline has already been shown torepresent efficient practice.19 Therefore, the costsand consequences of adopting therecommendations of the guideline need notnecessarily be assessed in a primary study if thepractice advocated by the guideline has beenshown to be efficient in the healthcare setting inwhich the implementation will take place and atthe desired scale of implementation.
A further reason for legitimately limiting thescope of the economic evaluation relates to theperspective the evaluation takes. If a societalperspective was adopted then all costs (includingthose that fall on the patient) and all benefits,such as those gained by health professionals interms of improved knowledge, job satisfaction thatmay arise during development, dissemination andimplementation of the guideline, should beconsidered.
Health Technology Assessment 2004; Vol. 8: No. 6
43
© Queen’s Printer and Controller of HMSO 2004. All rights reserved.
Chapter 5
Systematic review of guideline dissemination and implementation strategies:
economic evaluations and cost analyses

A final reason for not measuring some costs andbenefits is when the assumption can be made thattheir inclusion will not change the policy decision.For example, if it is believed, a priori, that aguideline will reduce the costs of treatment whilemaintaining or improving the outcomes ofpatients, it may be felt legitimate to exclude thecosts of development, dissemination andimplementation as they could not possibly cancelout any savings in treatment costs. However, thiswould limit the transferability of results to theapplication of the same implementation strategyfor a guideline addressing the same issues in asimilar setting.
The extent to which economic evaluations andcost analyses included in this review haveconsidered all costs and benefits from each stage isassessed as part of the review. Where relevant costsand benefits have been excluded, considerationwill be given to whether their exclusions arejustified on the basis of stated perspective,unimportance to final conclusions or previouswork showing that adoption of the guidelinerecommendation would be efficient.
MethodsSearch and selection criteriaThe economic evaluations and cost analysesincluded in this review were identified as part ofthe systematic review reported in Chapters 2–4.
Selection criteria for the review ofcost and economic analysesTwo reviewers identified any study that reportedinformation on cost. A second reviewer (L Vale)then determined whether the study reported adetailed cost analysis or an economic evaluation.Studies were defined as cost analyses if they failed to relate costs to effectiveness/benefits. A loose definition of economic evaluation was used in that studies had to report evidence oncosts and at least surrogate end-points foreffectiveness/benefits.
Review of methodological qualityIncluded studies in this section were assessedagainst the British Medical Journal guidelines forreviewers of economic evaluations (Box 3).20
These guidelines are designed to improve thequality of economic evaluations, and theirrecommendations cover three broad areasincluding study design, data collection, andanalysis and interpretation of results. If studiesonly reported cost analyses, they were not assessed
against the criteria relating to benefits. Thecriteria were used not as a scoring system, butrather as a means of summarising those aspects ofan economic evaluation that are generallyconsidered to be important.
Systematic review of guideline dissemination and implementation strategies: economic evaluations and cost analyses
44
BOX 3 Criteria used to assess the quality of economicevaluations and cost analyses
Design of economic evaluation1. Research question stated2. Importance of question stated3. Viewpoint of analysis stated and defined4. Rationale for choosing alternative programmes or
interventions compared stated5. Alternatives being compared clearly defined6. Form of economic evaluation used stated7. Choice of form of economic evaluation justified in
relation to question addressed
Data collection8. Source(s) of effectiveness estimates stated9. Details of design and results of effectiveness study
given 10. Details of methods of synthesis of estimates of health
effects given 11. Primary outcome measure(s) for economic evaluation
clearly stated12. Methods to value health states and other benefits
stated13. Details of subjects from whom valuations were
obtained given14. Productivity changes (if included) reported separately15. Relevance of productivity changes to study question
discussed16. Quantities of resources reported separately from
their unit costs17. Methods for estimation of quantities and unit costs
described18. Currency and price data recorded19. Details of currency and price adjustments for inflation
or currency conversion given20. Details of any model used21. Choice of model used and key parameters on which
it is based justified
Analysis22. Time horizon of costs and benefits stated23. Discount rate(s) stated24. Choice of rate(s) justified25. Explanation given if costs and benefits are not
discounted26. Details of statistical tests and confidence interval
given for stochastic data 27. Approach to sensitivity analysis given28. Choice of variable for sensitivity analysis justified29. Ranges of which variables are varied stated30. Relevant alternatives compared31. Incremental analysis reported32. Major outcomes presented in an aggregated as well
as a disaggregated form33. Answer to study question given34. Conclusions follow from data reported35. Conclusions accompanied by appropriate caveats

Review of resultsData were abstracted on resource use and cost ofguideline development, dissemination andimplementation, and summarised according to thetype of dissemination and implementationstrategies adopted.
ResultsStudies reporting cost analyses oreconomic evaluationsSixty-three of 235 (29.4%) studies (involving 78comparisons) reported either cost analyses oreconomic evaluations that attempted to assess thecosts or cost-effectiveness of different guidelineimplementation strategies (A3, A8, A10, A11, A12,A18 – three comparisons, A23, A29, A30, A32 –two comparisons, A41, A51, A52, A53, A55 – threecomparisons, A57, A61 – three comparisons, A63,A64, A72, A73, A82, A87, A93, A96, A100, A101 –two comparisons, A104, A106, A107, A109, A110,A112, A114, A120, A123, A129 – threecomparisons, A133, A142, A143, A144, A145,A147 – two comparisons, A154 – two comparisons,A158, A159, A164, A169, A179 – threecomparisons, A189, A196, A200, A203, A207,A208, A217, A221 – two comparisons, A223, A224,A226, A228, A229, A234).
General characteristics Characteristics of the included studies aredescribed in Table 19. The majority of the studieswere conducted in the USA and aimed to improvemanagement. Thirty-six studies tried to changeone behaviour and the remainder targeted severalbehaviours (to a maximum of six behaviours). Thestudy population always involved clinicians, but in14 studies other healthcare professionals wereinvolved (most commonly nurses).
Interventions evaluatedTable 20 describes the interventions evaluated. The majority of comparisons evaluatedmultifaceted interventions [58 of 78 comparisons(74%)] and the maximum number of behaviouralchange interventions employed was seven. Tenstudies evaluated reminders as a singleintervention.
Methodological quality of economic evaluationsDesign criteriaThe viewpoint adopted in the economic evaluationwas stated in ten studies (A3, A8, A23, A32, A57,A123, A145, A159, A208, A217) and justified infive (A23, A57, A159, A208, A217). Four studies
took the perspective of the health service (A23,A57, A159, A217), five studies took the perspectiveof the hospital or providers (A3, A8, A32, A217,A123) and one study took a societal perspective(A208).
Health Technology Assessment 2004; Vol. 8: No. 6
45
© Queen’s Printer and Controller of HMSO 2004. All rights reserved.
TABLE 19 General characteristics of included studies
Study Type No. of characteristic studies
Study design C-RCT 24P-RCT 10C-CCT 2P-CCT 5CBA 4ITS 18
Country of origin USA 45UK 11Canada 3Other 4
Rationale for study Improve management 36Cost containment 19Both management and 8cost containment
Targeted behaviour General management 24Patient education and 14advicePrescribing 28Preventive services 13Referrals 8Test ordering 24Other 18
Study population Physicians 49Physicians, nurses 3Physicians, nurses, 1pharmacistsPhysicians, nurses, 1pharmacists, otherPhysicians, nurses, other 2Physicians, unclear 1Physicians, other 6
TABLE 20 Interventions evaluated in economic evaluations andcost analyses
Intervention type No. of times used
Educational materials 29Educational meetings 25Consensus process 5Outreach visits 10Patient-mediated 3Audit and feedback 24Reminders 20Other 17Financial 4Organisational 10Structural 11

As a result of the inclusion criteria of thesystematic review, the alternatives being comparedwere clearly defined.
Only 12 of the 63 studies (19%) studies reportedthe form of economic evaluation used; ninestudies reported that they had undertaken cost-effectiveness analyses (A11, A23, A32, A104, A109,A114, A144, A145, A154) and three comparisonsreported that they had undertaken cost–benefitanalyses (A12, A221, A208). On further inspection,two of the studies that stated they had undertakena cost–benefit analysis appeared to haveundertaken cost–consequence analyses (presentingdifferences in cost set against differences in severalmeasures of effectiveness) (A221, A208) and onestudy appeared to have undertaken a cost analysis(A12). One study reported that it had undertakena cost analysis; however, on closer inspection, thisappeared to be a cost–consequence analysis (A57).
The remaining studies did not define the form ofeconomic evaluation undertaken. Thirty-fiveappeared to be cost–consequences analyses, twocost–effectiveness analyses and 13 were costanalyses, as they reported some aspect of cost (e.g.staff or material costs) but made no effort to relatecosts to benefits.
Thirty-eight studies reported costs of treatmentchanges as a result of guideline dissemination andimplementation and 11 reported costs of guidelinedissemination and implementation (A8, A10, A23,A32, A55, A120, A142, A158, A179, A228, A229).Two studies reported costs of guideline development,dissemination, implementation and treatment(A87, A208). Twelve studies reported costs of bothguideline dissemination and implementation andtreatment (A11, A29, A61, A64, A72, A114, A133,A196, A207, A221, A224, A226).
Thirteen studies that reported more than justtreatment costs could be defined ascost–consequence analyses, five as cost-effectivenessanalyses and seven as cost analyses.
Data collection criteriaSources of effectiveness estimatesAs a result of the inclusion criteria for the systematicreview, the sources of effectiveness estimates anddetails of the effectiveness study design were alwaysavailable. However, the methodological weaknessesof the primary studies often undermined theeffectiveness results. For example, the statisticalsignificance of benefits was uncertain in 20 C-RCTs, C-CCTs and CBAs that had potential unitof analysis errors (A10, A23, A34, A51, A57, A61,
A72, A77, A93, A96, A101, A106, A147, A154,A158, A179, A196, A207, A208, A228) and 11 ITSstudies were inappropriately analysed in thepublished reports (A11, A12, A41, A52, A73,A107, A143, A159, A164, A203, A234).
Primary end-point for economic evaluationIn many studies the primary end-point for theeconomic evaluation was not clearly stated. Onlyfive studies attempted to measure patientoutcomes or other economic measures of benefit(A104, A145, A208, A224, A226). The remainderrelied on process measures for their primary end-point. As discussed above, it is justifiable to focuson such intermediate end-points if the guidelinebeing evaluated has been shown to be efficient atthe target level of implementation. However, theeffectiveness evidence base for the vast majority ofguidelines evaluated in the systematic review wasuncertain (see Chapter 3).
Methods for estimation of costsThe methods used to estimate costs werereasonably comprehensive in 29 studies. The priceyear was given in only 13 studies (A10, A30, A32,A41, A52, A57, A73, A87, A101, A110, A158,A221, A234) and adjustments for inflation wereonly made in five (A29, A32, A57, A101, A226)(although this was not needed in four studiesowing to the short duration of the analyses – A57,A73, A110, A221). Only three provided details ofmethods, price year and adjustments for inflation(A32, A57, A101). One of these three looked at the cost of implementation only (A32) and theother two looked at some of the costs of treatmentonly.
Details of resource use for included costs wereprovided only in nine studies (A11, A30, A73, A87,A145, A147, A179, A208, A229). Five of thesefocused on treatment costs only (A11, A30, A73,A145, A147), two looked at the costs ofimplementation only (A179, A229) and two lookedat the costs from all three stages (A87, A208).These analyses were not comprehensive in termsof the costs considered, but one did attempt tobring uncosted resource use and unquantifiedbenefits into the decision-making process by usinga balance sheet approach (A208).
Overall, no study gave reasonably completeinformation on the estimation of cost and coveredall three relevant stages.
Details of model usedAll studies were based on primary data and nomodelling was performed.
Systematic review of guideline dissemination and implementation strategies: economic evaluations and cost analyses
46

Analysis criteria Discounting was not undertaken or mentioned forany of the economic evaluations in which datacollection on costs and benefits was longer than 12months. Only 16 studies reported some form ofsensitivity analysis on cost and cost-effectiveness(A3, A23, A29, A41, A82, A87, A101, A107, A114,A169, A184, A189, A208, A221, A224, A234). Inthe majority of cases the effect on results wasassessed by changes in a single variable (e.g. a costof a procedure) in one-way sensitivity analysis(A23, A29, A41, A82, A87, A101, A107, A114,A169, A189, A221). One study investigated theeffect of changes in personnel and salary level oncost-effectiveness (A179), one study investigatedthe effect of changing each aspect of costindependently (multiple one-way sensitivityanalysis) (A208) and three studies provided aconfidence interval around an estimate of costsaving (A3, A224, A234).
Incremental analysis of costs and effects or cost-effectiveness was not performed in nine of the 46analyses [the remaining three papers did notrequire incremental analysis as one was unknown(A73) and two detected no differences in eithercosts or effects (A100, A112)] where it wasappropriate (excluding the 14 cost analyses fromthis analysis) (A23, A63, A72, A104, A169, A179,A207).
In one study initially planned as a cost-effectiveness analysis, the implementation strategywas cost saving (A145). In all but 11 of the 38cost–consequences analyses it was concluded thatthe implementation strategy was efficient (A30,A53, A63, A100, A112, A129, A158, A208, A221,A226, A229). In five of these studies theimplementation strategy was more costly but nomore effective (A100, A112, A221, A226, A229).These conclusions must be treated with suspicion,as must the other conclusions about cost andefficiency, given the limitations in methodologyand reporting reported above.
Summary of resource and costestimates for guideline development,dissemination and implementationOwing to the generally poor quality of reportingof the economic evaluations, data on resource useand cost of guideline development, disseminationand implementation are not available for most ofthem. Four analyses provided reasonableinformation on resource use and on the methodsof cost estimation (A87, A179, A208, A229). Allbut two of these analyses reported resource useand cost in the implementation stage. These two
analyses covered all four stages (A87, A208).Details of these analyses are summarised in Tables 21a (details of studies), 21b (resource use inguideline development stage) and 21c (resourceuse in guideline dissemination andimplementation stage). Two studies used thepreparation and dissemination of educationalmaterials alongside educational meetings (A87,A208). The last study reported resource use foraudit and feedback.
The resource information reported for audit andfeedback may not be transferable to anothersetting, as the resource use refers to computer andstaff time and the study was conducted in the late1970s (A229). Since this time computer equipmenthas changed substantially.
DiscussionThe purpose of economic evaluation is to provideinformation with which to aid judgements aboutthe use of scarce resources. By identifying andcritiquing the available evidence systematically onguideline implementation strategies, this chapterhas sought to provide information to decision-makers and researchers to aid their decisions onhow best to get guidelines into practice. Althoughthe number of studies included in the review islarge, the multifaceted nature of many of theimplementation strategies adopted and themultitude of policy issues addressed precluded thepresentation of results on cost-effectiveness ofalternative implementation strategies in anymeaningful form. This problem was anticipated atthe outset of this study and for this reason data onresource use and costs of guideline development,dissemination and implementation were sought. Itwas felt that these data would be most useful forthose who are planning the implementation of aguideline in their own setting.
The quantity of usable data on resource use andcost was comparatively small given the number ofstudies included in the review. However, these datastill provide a valuable resource for researchersand have been shown to come from analyses of areasonable quality.
In general, the methodological quality of theincluded studies was poor. This finding is incommon with other reviews of economicevaluations21 and in part should be expected giventhe loose interpretation of what defines aneconomic evaluation. In another recentlycompleted review of economic evaluations the
Health Technology Assessment 2004; Vol. 8: No. 6
47
© Queen’s Printer and Controller of HMSO 2004. All rights reserved.

Systematic review of guideline dissem
ination and implem
entation strategies: economic evaluations and cost analyses
48
TABLE 21a Details of studies reporting resource consequences of guideline development, dissemination and implementation strategies
Study Intervention Behaviours targeted Setting
Gurwitz [A87] Distribution of educational materials, Prescription of H2 receptor antagonists Boston, USAeducational meetings, other professional (treatment of gastrointestinal disorders) Long-term care facilitybehavioural change (list of patients receiving in nursing-home patients Time of study: 1988–1990target therapy), financial interventions Costs in 1989 US dollars(changes to reimbursable products) Cost of providing financial change not stated
Thomas [A208] Distribution of educational materials, Guidelines for two urological problems: Grampian, Scotlandeducational meetings, organisational prostatism due to benign prostatic hyperplasia, Family practicechanges (open-access clinic) and microscopic haematuria in the general Time of study: 1995–1996
population Costs in UK poundsYear not stated, possibly 1995/6Costs of providing organisational change intervention
not stated
Rosser [A179] Reminders about requirement for a Influenza vaccination Ontario, Canadaprocedure/test Cervical screening Family practice
Blood pressure screening Time of study: 1984/5Tetanus boosters Unclear whether costs in US or Canadian dollars
Year that costs relate to not stated
Winickoff [A229] Reminders, audit and feedback, Management of hypertension Boston, USAlocal consensus process Primary care
Time of study unclear, but the study took 18 monthsCosts in 1979 US dollarsOnly costs of providing audit and feedback were reported
Data in bold identify the intervention on which resource use data are provided.

Health Technology Assessm
ent2004; Vol. 8: No. 6
49
© Q
ueen’s Printer and Controller of H
MSO
2004. All rights reserved.
TABLE 21b Resources used in the guideline development stage
Study Area of resource use Quantity of resource use Monetary cost for development costs
Gurwitz [A87] Literature review by MD/pharmacist 20 hours (also includes preparation of documentation which $650 (at $32.50/hour)should be considered as part of dissemination/implementation costs)
Thomas [A208] GP/nurse/clinician researcher time spent at 217 hours (163 leisure hours; 54 work hours) £1944 (work hours only); £9029 including meetings (including travel time) valuation of leisure time
Research staff preparing for development 182 hours £2676meetings
Travel costs Mileage or unit costs not reported, but 1998 UK Automobile £462Association cost per mile
Consumables Not detailed £3329
TABLE 21c Resources used in the dissemination and implementation stage
Study Cost-generating event Quantity of resources used Cost
Gurwitz [A87] Educational materials
Documentation preparation by MD/pharmacist See Table 21b See Table 21b
Review of medical records for documents by MD/pharmacist 25 hours $812.50
Printing costs Resource use not recorded, but materials required $200for 16 providers
Educational meetings
Preparation time for presentation by MD/pharmacist 5 hours $32.50
Group discussions attended by 16 members of staff and Time not stated Not costedMD/pharmacist
Thomas [A208] Educational materials
Consumables (printing folders) Resource use not detailed, but guideline was £2484disseminated to approximately 300 GPs and 74 practice managers
Time spent assembling and mailing the guidelines 24 hours £265
Postage of guidelines and letters/reminders Resource use not detailed but guideline was £430.85disseminated to approximately 300 GPs and 74 practice managers
continued

Systematic review of guideline dissem
ination and implem
entation strategies: economic evaluations and cost analyses
50
TABLE 21c Resources used in the dissemination and implementation stage (cont’d)
Study Cost-generating event Quantity of resources used Cost
Educational meetings
GP/nurse/clinician researcher time spent at meetings 111 hours, all of which were outside regular £0 as no work time forgone, but (including travelling time and postgraduate education working hours. This cost was spread over 74 £7024 if leisure time valuedallowance payment for GPs general practices and approximately 300 GPs
Research staff preparing for meetings 40 hours £517
Travel costs Mileage or unit costs not reported, but 1998 UK £304Automobile Association cost per mile
Rosser [A179]a Letter reminder to patients
Clerical time to prepare letter 1.7–5.77 minutes (depending on clinical area) $0.28–0.96
Physician time to sign letters 10 seconds $0.16
Stamps Not specified $0.32
Stationery Not specified $0.06
Repeated costs of above for 2nd reminder letter 84% patients required repeated mailing
Telephone reminder to patients
Clerical time to prepare patient documentation 0.33–2.8 minutes $0.06–0.48
Nurse time contacting patient 2.8 minutes $0.70
Cost of telephone calls Not specified Not specified
Repeat calls to patients 1.7–2.4 calls per patient Not specified
Physician time to explain need for test/procedure 0.25–1.70 minutes $0.25–1.70
Winickoff [A229] Computer time used to create reports from routine data for 90 hours $23002216 patients for 16 physician/nurse provider teams
Staff time to produce reports 5–10 hours $27.50–55.00
a Quantities of resource use and costs expressed are per patient.

criterion for inclusion stipulated that to beincluded a study had to present costingmethodology in the methods section and results ofthe economic evaluation in the results section.22
Had this criterion been applied in this review itwould have undoubtedly reduced the number ofincluded studies, but it is unlikely that the overallconclusion of generally poor methodology wouldhave changed.
It is perhaps surprising in a review of guidelineimplementation studies that relatively few studiesconsidered any costs other than those of treatmentand its consequences. In several cases thislimitation in scope would not be expected tochange the conclusions as the magnitude of costsavings provided by adopting recommendedpractice was so large (A52, A101, A143, A189,A203). Therefore, in such cases, othermethodological weaknesses aside, the evaluationwould have been fit for the purpose for which itwas designed. However, the results of suchevaluations are context specific and have limitedtransferability. Furthermore, in many cases whereit was concluded that implementation was costsaving, the inclusion of the costs of guidelinedevelopment, dissemination and actualimplementation could reverse the results.
The search strategy used to identify the includedstudies was devised with the intention ofidentifying those studies based on robust studydesigns. The study designs were chosen as it wasfelt that the data they could provide, if analysed
appropriately, would provide the most robust dataon effectiveness. As such data often help todetermine total costs and are integral to estimatesof efficiency, it is implicit that such studies shouldprovide the best data on which to base at leastsome parts of an economic analysis. It is possiblethat the search strategy did not identify somestudies that reported economic data separately orused data from robust study designs to modelefficiency.
ConclusionsThe paucity of data on the cost and efficiency ofguideline implementation strategies has beenshown in this review. In general, studies were ofpoor methodological quality and did not cover allstages of guideline introduction that may berelevant. While it is tempting to recommendfurther large-scale studies that can give unbiasedestimates of costs and effect for all stage ofguideline implementation, it is unlikely that inmany cases such studies will be practical, owing tostatistical issues relating to sample sizes.23 Morerealistic is the approach outlined by Mason andcolleagues.24 With this approach primary studiesshould concentrate on evaluating behaviouralchange and costs of development, disseminationand implementation of the guideline, whilemodelling exercises should use these data todetermine whether the guideline is efficient at thelevel of behaviour achieved or desired.
Health Technology Assessment 2004; Vol. 8: No. 6
51
© Queen’s Printer and Controller of HMSO 2004. All rights reserved.


MethodsA semistructured telephone survey of keyinformants in primary and secondary care settingswas conducted to assess the feasibility and possibleresource requirements of guideline disseminationand implementation strategies in the UK. Theoriginal intention had been to undertake focusgroups with key informants; however, it provedimpossible to arrange these within the studytimescale.
Informants were selected to represent a range ofviewpoints relevant to guideline implementationacross primary care, district general hospital andteaching hospital settings. They were selectedfrom a convenience sample of medicalpractitioners with experience of guidelineimplementation based predominantly in theNorthern and Yorkshire region of England. Eightindividuals were initially approached. One medicalpractitioner was a non-responder (a GP). Oneinvitee was unable to carry out the interview owingto other commitments, but he was replaced by acolleague meeting the same criteria. The finalseven informants were two full-time GPs, one ofwhom was a chair of a Primary Care Group (PCG)(GP1, GP2), one professor of general practice andpart-time GP (GP3), one district general hospital(DGH) consultant physician (DGH1), one seniorlecturer in medicine with beds in a district generalhospital consultant (DGH2), one district generalhospital associate medical director (DGH3) andone teaching hospital associate medicaldirector/clinical director (TH1).
The semistructured telephone interviews werecarried out by PW and lasted between 1 and 1.5hours. Concurrent notes were made during theinterviews, which were also audiotaped andtranscribed. Before the interview, respondentswere sent an interview brief (see Appendix 7) thatoutlined the interview questions and provideddescriptions of guideline dissemination andimplementation strategies to be considered (basedon the definitions of the Cochrane EPOC group;
see Box 1). It also gave examples of resource usereported in the systematic review of guidelinedissemination and implementation strategies.Views were sought on the factors that mightinfluence the resource use of each interventionstrategy, how far the respondent thought theinterventions were feasible within currentresources in their own setting, and respondents’views on feasibility throughout the UK.Respondents were also asked to rank theinterventions in order of how intensive resourceuse would be. As the interviews proceeded, itbecame clear that a wide definition of ‘resourceuse’ needed to be adopted and the full range ofissues related to the feasibility of the interventionswas explored.
The interviews were analysed thematically (fromthe written notes). Themes are backed up by asmall number of relevant quotes taken from theinterviews. The draft chapter was sent torespondents for amendment of their contributionsand as validation of the findings presented. Thepresentation of the results is organised by the sixbroad dissemination/implementation interventionsconsidered.
ResultsDistribution of educational materialsRespondents were asked to consider thedistribution of three different types of educationalmaterial:
� a laminated, single-sheet guideline sent to allrelevant practitioners with an introductory letter
� guidelines mailed to all members of relevantspecialist society and consumers associations;also published in national medical journals andspeciality bulletins
� educational video given to relevantsites/specialists.
The GP respondents did not envisage anyproblems with resources for distributing either
Health Technology Assessment 2004; Vol. 8: No. 6
53
© Queen’s Printer and Controller of HMSO 2004. All rights reserved.
Chapter 6
Estimating the feasibility and likely resource requirements of guideline dissemination and
implementation strategies in UK settings

laminated A4 sheets or copies of full guidelines(although all respondents commented that theywould not choose to distribute full guidelines).Purchasing videos was thought to be possible byall if drug company sponsorship were available.One GP (GP2) had experience of making a videolocally, funded by a research grant, but otherwisethis was thought to be neither possible (no accessto expertise) nor affordable.
At least two of the four secondary carerespondents considered that every strategy wouldneed ‘soft’ money (pharmaceutical company orhealth charity) to support it.
“District general hospitals just don’t have budgets forthis sort of thing” (DGH1).
One secondary care respondent (DGH2) hadexperience of producing a video locally funded byresearch money, through collaboration with anearby university, but acknowledged that mostDGHs would be unlikely to have access to suchfacilities.
The main resources identified by respondents werepostage costs if sent by external mail. Respondentsidentified a number of factors that could alsoinfluence the resources required (Box 4).
Educational meetingsRespondents were asked to consider four differenttypes of educational meeting:
� a series of 1-hour departmental lectures forrelevant practitioners
� a half-day conference for relevant practitioners,hosted by a local ‘expert’
� several intensive group educational sessions(over 2 hours), for small groups of relevantpractitioners
� one didactic 2-hour meeting for relevantpractitioners (given a choice of several sessionsbeing run at different venues) withpresentations from a local expert and peersinvolved in developing the guidelines ofinterest.
A key issue identified by primary care respondentsconcerned the time of day and length of meeting.They suggested that lunchtime and eveningmeetings would be much less costly as locum feesto release GPs are not required. However, locumfees would be required for meetings at othertimes, and for half-day or longer meetings. Wherelocum fees are required, the number of GPsattending the event will be the key determinant of
the resources required. GP2 illustrated this with anestimate that a single half-day event for 38 GPswould cost his PCG £4000 out of an annual GPeducation budget of £20,000. One respondentcommented that the traditional approach of 1-hour didactic lectures given by a local ‘expert’was often considered relatively inexpensive butthat this was:
“only true for the provider of the lecture, not for theaudience. The ‘opportunity costs’ of large numbers ofGPs attending a lecture [during daytime hours] areenormous” (GP1).
Time of day, length of the meeting and timeavailable are also issues in secondary care.Respondents thought that it would be possible forat least some staff to attend lunchtime meetings,but that it is more difficult to free staff for a half-day meeting (which might require cancellation ofoutpatient clinics or theatre lists). Depending onthe service involved, there may also be problemswith providing emergency cover. Where guidelinespotentially affect a large number of staff in arange of professions and specialities (e.g.prevention and management of deep veinthrombosis), these problems are compounded bythe need to arrange several sessions at differenttimes to accommodate shift patterns. Onerespondent noted:
Estimating the feasibility and likely resource requirements of guideline dissemination and implementation strategies
54
BOX 4 Factors influencing resource requirements fordistribution of educational materials
Printed materials• Number of pages (e.g. full guidelines versus a single
two-sided A4 sheet)• Number of copies• Frequency of revision of guidelines; therefore, the
number of times they need to be distributed• Labour involved in photocopying, assembling, and
stuffing and labelling envelopes• Opportunity costs of reading time • Availability and cost of a laminating machine
(approximately £50) for sending laminated two-sidedsheets
• Availability and cost of suitable software to produceprofessional, eye-catching single-sheet materials, andthe skills to use the software
Purchased educational videos• Cost (typical examples approximately £12)• Number required (distribution to individuals or groups)• Availability of audiovisual facilities for viewing the video• Opportunity costs of group viewing
Local development of educational videos• Clinical expertise • Scripting expertise• Filming expertise• Technical editing expertise

“there is no protected time available for us …. Andthere is no such thing as an audit half-day. The onlyway to organise sessions of any length is to cancelclinics” DGH1.
For all settings, the availability of ‘expert’ speakerswith adequate presentational and educationalskills, or of trained facilitators could be problematic.GP2 noted that there were only three GPs whocould facilitate such work in his PCG. For ongoinglocal educational programmes, the costs of trainingfacilitators in these skills and the availability offacilitators in local networks may be problematic.
A key difference for specialists working insecondary care is the relatively small number ofpeople who would be participants in a localeducational event targeted at their specialist area.Respondents thought that regional or nationalevents may be more appropriate. However,respondents noted that secondary care clinicianstend to work in multidisciplinary clinical teams,where there would be an expectation to holdregular educational meetings in-house.
In summary, 1-hour lectures (either as a singledidactic meeting or in a series) were consideredfeasible in both primary and secondary caresettings. In primary care, other educationalactivities would incur additional expenses, mostnotably costs for locums to cover GPs’ surgeries.
GP3 held the view that all of these activities arefeasible if available education budgets are tappedinto. One of the secondary care respondents whoalso works with primary care (DGH3) felt thatresources are more readily available in primarycare for these activities:
“badged under clinical governance, lifelong learning,etc. …. Whereas it is much more difficult insecondary care, particularly to persuade consultants tofree up a half-day.”
Respondents identified a number of factorscommon to both primary and secondary care thatinfluence the resources required (Box 5).
Educational outreach visitsRespondents were asked to consider threedifferent types of educational outreach:
� one-to-one visits by pharmacists (community orhospital as relevant to the setting) who havebeen trained as educators (> 2 days’ training).No more than two brief (less than half an hour)visits to all relevant practitioners
� visits to clinical or practice teams by a nursetrained as an educator (> 2 days’ training).Meetings last for at least an hour and occurseveral times
� a doctor trained as an educator (> 2 days’training). The doctor presents guidelines andspecific educational messages at 1-hourpresentations to services or groups of practices.In in-patient settings, this could besupplemented by participation of the doctor-educator on ward rounds.
Respondents recognised that educational outreachwas likely to be an expensive strategy and thoughtthat a key issue would be whether the topic wasconsidered to be a priority where additionalresources might be available; for example, moneymade available for the implementation of aNational Service Framework topic in England.
Primary care respondents recognised thateducational outreach was a less costly strategy forprimary care staff as it would be delivered in thepractice setting. Some suggested that the new PCGliaison pharmacists might be able to undertakeoutreach visiting as part of their role, althoughone respondent (DGH3) questioned the feasibilityof doing this if they could only manage infrequentvisits to the practices in their area. Onerespondent noted that the local PCG had decidedthey would need additional pharmacist posts toundertake this sort of work, estimating a need forup to three posts at approximately £40,000 perpost per annum. Using doctors in this role wasjudged much less feasible and would requirepayment for a fully trained GP to be released (full-time costs of up to £60,000 per annum). Theacademic GP respondent (GP3) who hadresearched the cost-effectiveness of educationaloutreach visiting by doctors, costed this as £583per practice in 1995 to implement a full set ofguidelines, using doctors paid on a clinicallecturer’s salary and including the costs ofPostgraduate Education Allowance.
Health Technology Assessment 2004; Vol. 8: No. 6
55
© Queen’s Printer and Controller of HMSO 2004. All rights reserved.
BOX 5 Factors influencing resource requirements foreducational meetings
• Location: in-house versus external• Distance from participants’ workplaces; cost of the
venue, including catering (for external venues)• Frequency of meetings• Length of meetings• Expert speaker fees• Group facilitator fees• Local availability of experienced group facilitators• Administration costs

There were two significant areas of discrepancy inrespondents’ views about the availability of nursesor doctors in hospital to undertake such roles. Twohospital respondents (DGH3, TH1) saw wardnurses, in particular, as too valuable to be sparedfor such activities, especially given recruitmentproblems for many acute inpatient nursingspecialities. DGH3 also disputed the feasibility ofthe strategy, questioning the credibility of nursesin this role with some doctors. Others (DGH1,DGH2) pointed out that this role is routinelyundertaken by specialist nurses (e.g. in diabetes,renal care, respiratory liaison, stroke), who areusually credible with doctors. DGH3 describeddoctors taking on this role as “cloud cuckoo land”,whereas other hospital respondents saw releasingjunior doctors as feasible (and more feasible thannursing staff).
The primary care view appeared to be thatresources for educational outreach visits are notroutinely available, but could be accessed via‘targeted’ funding (e.g. to implement a NationalService Framework) or otherwise from HealthAuthority-type funding (if successful in acompetitive bidding process). This was one areawhere possibly resources are more readily availablein secondary care, at least for pharmacists. Thismay be an example of redeployment of existingresources as DGH1, for example, commented thatthey had not thought of using clinical pharmacistsin this role.
One of the secondary care respondents (DGH2)felt that, for this strategy and for the next strategyconsidered (use of opinion leaders), the resourcesnot only were currently available but were beingdeployed. In DGH2’s hospital, lead consultants foreach speciality (stroke medicine, respiratorymedicine, diabetes, etc.) were identified as ‘leads’in these areas and expected to provide educationalinput for colleagues. However, DGH2acknowledged that this model may not begeneralisable to other DGHs:
“… you need to be able to take advice from colleaguesfor this sort of model to work ….”
DGH3 thought it unlikely that educationaloutreach could be a cost-effective strategy:
“… if educational outreach is to be used at all, itshould be for the ‘laggards’ who haven’t attended theother educational events you’ve provided.”
Factors influencing resources required foreducational outreach are summarised in Box 6.
Local opinion leadersRespondents were asked to consider two scenarios,both involving colleagues nominating peers asOLs:
� small number of OLs identified who undergo ashort period of training (< 1 day). Activitiesthey carry out may include providing coveringletters for guidelines mailed to colleagues,hosting an educational meeting, enhancingtheir ongoing educational contacts withcolleagues
� large number of OLs identified who undergo asubstantial period of training (minimum 2days). Activities they carry out may includeestablishing and leading task forces includingeducational activities and outreachprogrammes.
Respondents thought that there may be a‘threshold effect’, according to the number of OLsrequired and the amount of time that they wouldbe expected to contribute to the strategy: “bydefinition, opinion leaders are few and farbetween” (GP1). Primary care respondents notedthat one individual may be identified as an OL forseveral clinical areas, which would have a majorimpact on their time commitment (GP2). This isalso true for secondary care, where there may beonly one ‘specialist lead’ for a subject (e.g.diabetes), especially in DGHs. Identifying severalOLs may only be possible over a region, ratherthan locally. The time commitment could dictatewhether the OLs require paying: one respondentfelt strongly that being an OL for your colleaguesis an integral part of being a ‘specialist lead’(DGH2) and one of the GP respondents (GP3)could see this as an informal activity not requiringpayment. However, significant time commitment
Estimating the feasibility and likely resource requirements of guideline dissemination and implementation strategies
56
BOX 6 Factors influencing resource requirements foreducational outreach visits
• Location: in most cases, visits would be expected to beto practitioners in their own setting
• Frequency of visits• Length of visits (time implications of this for both the
receivers and the deliverers)• Delivered to individuals or groups• Number of outreach workers• Profession of outreach workers (availability of staff and
salary costs)• Costs of training the outreach workers• Costs of providing ‘freebies’ similar to those provided
by drug company representatives (lunch, pens, Post-itpads, etc.)
• Administrative time for setting up appointments

and extension of activity beyond local colleaguesand local area would, in both of these respondents’views, increase the likelihood that payment fortime would be required.
Although the first scenario was seen as morefeasible than the second owing to the numbersrequired, the primary care respondents appearedto see use of OLs as a less feasible strategy overall.A particular issue was the absence of easilyidentifiable OLs in primary care.
DGH1 identified a practical problem with thesestrategies in his setting: where a clinician has aspecial interest, a relevant OL needs to be broughtin from elsewhere. Alternatively, when that sameclinician acts as an OL for generalist colleagues(e.g. a diabetologist for other general physicians),then their time availability for the preparation anddelivery of educational activities becomes aproblem and would frequently be done out ofhours. The other DGH respondent (DGH2) took adifferent view, stating that all the ‘specialist leads’act as OLs for their colleagues, with all of thephysicians acting as OLs to each other. But this isonly possible when there is “… an open atmospherein terms of asking for and receiving advice.”
There were contrasting views on the identificationand training of OLs. TH1 commented that “… itwould be good to have a systematic way ofidentifying and using opinion leaders … but itisn’t a sufficient priority.” DGH3 suggested that itmight be possible to identify large numbers ofOLs in primary care, using clinical governanceleads from practices, but countered this byquestioning whether such a person, who isaccountable for clinical governance within apractice, could ever meet the definition of an OL.GP3 pointed out that, even though it may possibleto identify a larger number of OLs at regionallevel, it would be difficult to justify the time totrain them: “By definition, these are busy peoplewith little spare capacity”. DGH2, in contrast,suggested that training for local OL activity shouldnot be necessary: “Aren’t opinion leaders bynecessity good communicators, otherwise how canthey be recognised as influential by their peers?”
Factors influencing resources required for localOLs are summarised in Box 7.
Audit and feedbackRespondents were asked to consider four scenarios:
� regular, frequent (minimum weekly) electronicmail messages to practitioners, containing
computer-generated reports on compliance withguidelines over the previous recent weeks
� monthly paper reports to practitionerscontaining data on compliance with guidelinesand a comparison of performance withanonymous peers; data generated fromelectronic medical records
� monthly seminars where individual practitionersare given paper reports containing personalperformance in complying with guidelines,comparison of performance with anonymouspeers and a commentary from a ‘local expert’;data obtained from (manual) medical recordaudits
� quarterly departmental meetings wheredepartmental compliance with guidelines ispresented to the department, with commentaryfrom an external expert; data obtained from(manual) medical record audits.
The main resource factors identified related to themethods of information gathering (in particularwhether data had to be abstracted from manualrecords or routine computerised informationsystems). All agreed that data abstraction frommanual records is very resource intensive in termsof people required and time. Further datahandling and preparation of feedback are alsotime consuming and may require training for thestaff involved. Respondents recognised that theremay be staff available who can do all or some ofthese activities without needing additionalpayment (e.g. in secondary care, junior doctorscarrying out their required audit projects), butsuch staff may not be the best suited to carryingout these activities, especially without training(DGH2).
Where audit data are to be abstracted from acomputerised information system, the key factorinfluencing resources is whether a system isalready in place that can fulfil some or all of therequirements. Where it is, there are very fewadditional costs of providing feedback of auditdata. If not, the costs of purchase and installation
Health Technology Assessment 2004; Vol. 8: No. 6
57
© Queen’s Printer and Controller of HMSO 2004. All rights reserved.
BOX 7 Factors influencing resource requirements for localopinion leaders
• Number of OLs required• Costs of identifying and training the OLs• Payment for the OLs’ time• Opportunity costs of OLs’ time • Investment of time by the OL (i.e. preparation time out
of hours)• Costs of educational strategies used by the OLs
(educational meetings, etc.)
of a new system are substantial. The trainingimplications to ensure standardised data entry andappropriate use of a new system are alsosubstantial. Respondents suggested that currentlythere were few computerised information systemsthat could provide reliable and relevant feedback.Secondary care respondents considered manualdata abstraction to be the only feasible method ofproducing audit data currently.
Primary care respondents, while recognising thegreater availability of computerised systems,highlighted the limitations of current systems toprovide audit and feedback. DGH3 observed that“… though GPs usually have access to computers,they would not usually have systems to generateautomated reports”. GP1 and GP2 also expressedfrustration at the failure to achieve a minimumstandard of systems that could routinely provideclinical audit data. GP3 identified some exceptionsin primary care based around MIQUEST (whichenables interrogation and extraction of data fromdifferent types of GP practice systems using acommon query language),25 but noted that area-wide audits using MIQUEST software areuncommon and frequently funded from ‘soft’money.
Other resource factors were the frequency ofreports (although more so for manual record-based audits and where feedback is through agroup meeting) and whether feedback is throughreports to individual clinicians or requires a groupmeeting. There are the ‘opportunity costs’ of thetime commitment required by the meeting. Wherean ‘expert’ is expected to provide commentary onthe feedback, there may be a particular problem insustaining his or her time commitment andenthusiasm if this is expected over a series ofmeetings (DGH2).
Factors influencing resources required for auditand feedback are summarised in Box 8.
RemindersRespondents were asked to consider three scenarios:
� stickers (with spaces for recording appropriateclinical management actions) placed on medicalrecords by administrative staff. Additionalbrightly coloured ‘spots’ added byadministrative staff to records of patientsmeeting criteria that indicate a specificintervention is due or required
� computer-generated reports sent annually toclinicians by a central administrative system,detailing interventions/procedures undertakenduring the previous year and those apparentlyoverdue. Space for clinicians to completemissing information in procedures done duringthe year, to be returned to the administrator
� in the context of a computerised trackingand/or electronic record system, computer-generated ‘alerts’ and ‘messages’ to clinicians,derived from management guidelines. ‘Alerts’would be sent to clinicians every time a relevantevent happened to one of their patients; a‘message’ would be a prompt to appropriatemanagement action when the clinician opensthat patient’s electronic record.
Respondents raised issues relating to resourcesrequired to put stickers on notes relating toidentification of relevant patients and clericaltime. They also raised issues relating to thefeasibility of this strategy, especially if multiplestickers were used: “You forget what they’re for orstart ignoring them” (GP1). GP3 made the generalpoint that each general practice can manage amaximum of two guidelines per year, in terms ofboth the educational input required and thenumbers of reminders being generated, which hasclear implications for the widespread introductionof such reminder strategies.
Secondary care respondents suggested that stickerson manual records had not been fully explored intheir setting. DGH1 commented that “it would notbe possible to use medical record staff in our DGHfor such an activity. It might be possible to carryout for a small number of people in selectedclinical areas”. DGH2 also highlighted that carepathways frequently use reminders in the form ofstructured manual records containing promptsand tick-boxes.
Respondents raised similar issues about the useand functionality of information systems forreminders to those raised in the discussions aboutaudit and feedback. Primary care respondentsthought that computer generation of annual orlow-frequency reports containing reminders wouldnot necessarily need additional resources, assystems exist for selected conditions (e.g. diabetes
Estimating the feasibility and likely resource requirements of guideline dissemination and implementation strategies
58
BOX 8 Factors influencing resource requirements for audit andfeedback
• Costs of data abstraction• Costs of data preparation and handling• Costs of preparing feedback reports• Costs of disseminating reports• Frequency of reports• Additional associated activities, e.g. educational
meetings
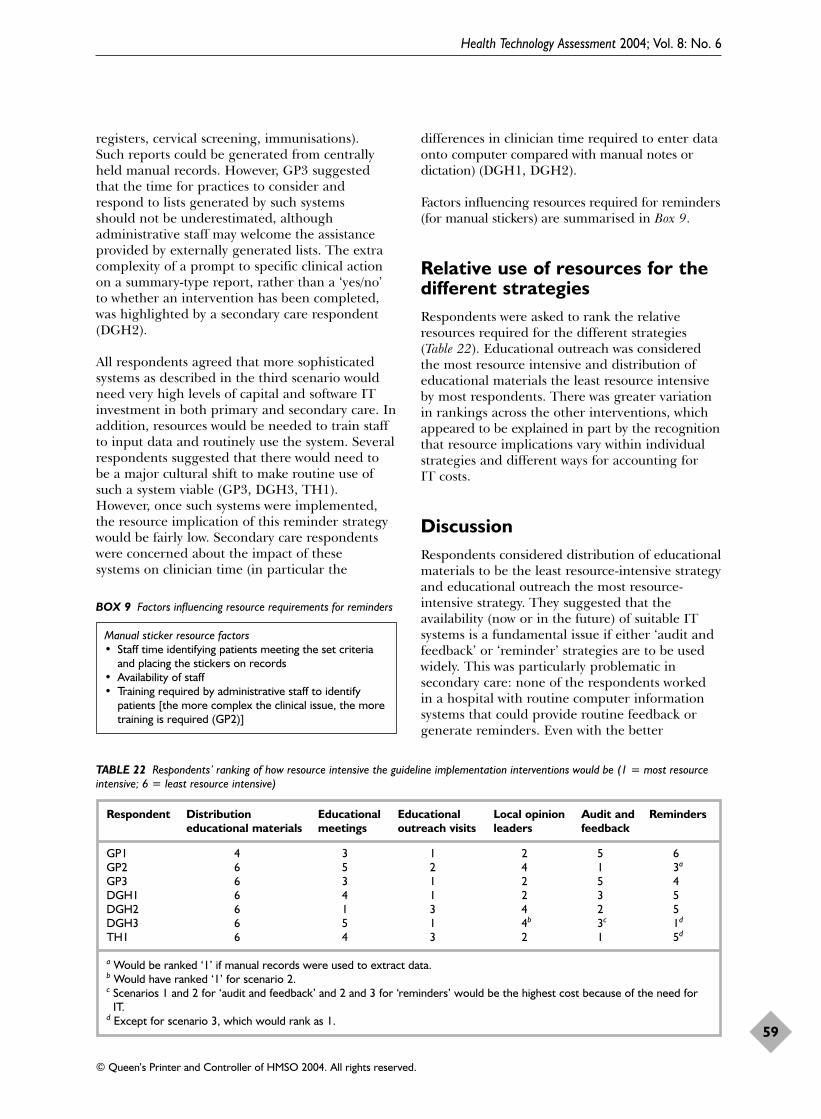
registers, cervical screening, immunisations). Such reports could be generated from centrallyheld manual records. However, GP3 suggestedthat the time for practices to consider andrespond to lists generated by such systems should not be underestimated, althoughadministrative staff may welcome the assistanceprovided by externally generated lists. The extracomplexity of a prompt to specific clinical actionon a summary-type report, rather than a ‘yes/no’to whether an intervention has been completed,was highlighted by a secondary care respondent(DGH2).
All respondents agreed that more sophisticatedsystems as described in the third scenario wouldneed very high levels of capital and software ITinvestment in both primary and secondary care. Inaddition, resources would be needed to train staffto input data and routinely use the system. Severalrespondents suggested that there would need tobe a major cultural shift to make routine use ofsuch a system viable (GP3, DGH3, TH1). However, once such systems were implemented,the resource implication of this reminder strategywould be fairly low. Secondary care respondentswere concerned about the impact of these systems on clinician time (in particular the
differences in clinician time required to enter dataonto computer compared with manual notes ordictation) (DGH1, DGH2).
Factors influencing resources required for reminders(for manual stickers) are summarised in Box 9.
Relative use of resources for thedifferent strategiesRespondents were asked to rank the relativeresources required for the different strategies(Table 22). Educational outreach was consideredthe most resource intensive and distribution ofeducational materials the least resource intensiveby most respondents. There was greater variationin rankings across the other interventions, whichappeared to be explained in part by the recognitionthat resource implications vary within individualstrategies and different ways for accounting for IT costs.
DiscussionRespondents considered distribution of educationalmaterials to be the least resource-intensive strategyand educational outreach the most resource-intensive strategy. They suggested that theavailability (now or in the future) of suitable ITsystems is a fundamental issue if either ‘audit andfeedback’ or ‘reminder’ strategies are to be usedwidely. This was particularly problematic insecondary care: none of the respondents workedin a hospital with routine computer informationsystems that could provide routine feedback orgenerate reminders. Even with the better
Health Technology Assessment 2004; Vol. 8: No. 6
59
© Queen’s Printer and Controller of HMSO 2004. All rights reserved.
BOX 9 Factors influencing resource requirements for reminders
Manual sticker resource factors• Staff time identifying patients meeting the set criteria
and placing the stickers on records• Availability of staff • Training required by administrative staff to identify
patients [the more complex the clinical issue, the moretraining is required (GP2)]
TABLE 22 Respondents’ ranking of how resource intensive the guideline implementation interventions would be (1 = most resourceintensive; 6 = least resource intensive)
Respondent Distribution Educational Educational Local opinion Audit and Reminderseducational materials meetings outreach visits leaders feedback
GP1 4 3 1 2 5 6GP2 6 5 2 4 1 3a
GP3 6 3 1 2 5 4DGH1 6 4 1 2 3 5DGH2 6 1 3 4 2 5DGH3 6 5 1 4b 3c 1d
TH1 6 4 3 2 1 5d
a Would be ranked ‘1’ if manual records were used to extract data.b Would have ranked ‘1’ for scenario 2.c Scenarios 1 and 2 for ‘audit and feedback’ and 2 and 3 for ‘reminders’ would be the highest cost because of the need for
IT.d Except for scenario 3, which would rank as 1.

developed systems in primary care, none appearedto have the capabilities to run the moresophisticated reminder strategies.
Respondents (especially in secondary care) foundit difficult to identify routinely available resourcesto fund guideline implementation strategies, butrecognised that resources are more likely to beavailable for national priority areas, for example,those covered by National Service Frameworks.There also seem to be differences for themanagement of chronic disease areas, forexample, diabetes, where the existence ofcomputerised disease registers (if available) makessome of the IT-based strategies possible when theyare infeasible for the rest of that healthcaresetting.
Practical feasibility issues may be more importantin some cases than finance; for example, theproblems of bringing GPs from a widegeographical area together for an educationalmeeting. Locum costs may be a significant expensefor GP educational meetings, but increasing use oflocums in general practice may create additionalproblems for continuity of patient care. Insecondary care, a key feasibility issue is theopportunity cost of cancelling outpatient clinics oroperating lists for group activities that cannot becontained within a lunch hour.
In general terms, there appear to be significantlyhigher resources available for all of the strategiesin primary care. In secondary care, evendistribution of educational materials may requireexternal sponsorship to make it happen. However,there appeared to be some cultural differencesbetween the secondary care settings, whichsuggested that strategies might be more or lessfeasible depending on the enthusiasm of leadclinicians, and how receptive their colleagues were.
Clearly, these findings are limited by the size ofsample, the analysis to date and the selectednature of the convenience sample. As relativeenthusiasts for the strategies under discussion,they may be thought to underestimate thedifficulties inherent in implementation. Forpragmatic reasons, other community and mentalhealthcare services were not represented in thesurvey and therefore no comment can be made onhow generalisable any of the issues raised mightbe to these settings.
There did not appear to be any new themes beingidentified from primary care respondents by theend of their interviews. In secondary care, the
variation in environment and culture identified(between specialities, teaching hospitals versusDGHs, etc.) suggested that a larger sample wouldbe needed to obtain a comprehensive picture fromthese different settings. Nevertheless, the issuesraised by the secondary care respondents still haveimportant implications for clinical governance inmany hospital settings.
The findings from this survey need to be placed inthe context of developments in the NHSinformation strategy for England, particularly thepublication of ‘Information for Health’ in 1998.26
This laid out targets for achieving lifelongelectronic health records for patients, held inprimary care, and electronic patient records withinhospital settings, before 2005. The respondents inthis survey held contradictory views on whetherthese targets are achievable and whether, even ifachieved, the resulting information systems wouldbe able to support the computerised reminderstrategies discussed here. The GPs with experienceor knowledge of MIQUEST software for extractingdata from primary care systems25 or of using thePRODIGY27 computerised reminder system werethe most optimistic about the potential. Two of thesecondary care respondents also thought that theirown Trusts’ plans for implementing the electronicpatient record would be able to deliver thecomputerised reminder strategies. Views from themore pessimistic respondents ranged from, inprimary care, the likelihood of failure whilenational strategy continues to encourage a ‘mixed economy’ of system suppliers rather thanan NHS-wide information system; and, insecondary care, serious concerns about thefeasibility of computerised medical records without widespread cultural change, training and, particularly, increases in medical staffinglevels.
One of the notable features of the interviews wasthe creativity with which the respondents hadpursued non-routine sources of funding forclinical effectiveness implementation initiatives;for example, bidding for Health Authority funds,accessing educational money and bidding forresearch and development (R&D) funding. Therespondents may not be typical in this and thefunding situation in most circumstances mayactually be worse than described here. Even so, thenon-recurrent nature of most funding earmarkedfor specific circumstances was apparent, andseveral respondents commented on the need toincrease the general capacity of the system toallow a consistent expansion of educational activityin routine practice.
Estimating the feasibility and likely resource requirements of guideline dissemination and implementation strategies
60
Principal findings of the studySystematic review of guidelinedissemination and implementationstrategiesOverall, the majority of comparisons reportingdichotomous process data (86.6%) observedimprovements in care suggesting thatdissemination and implementation of guidelinescan promote compliance with recommendedpractices. However, there was considerablevariation in the observed effects both within andacross interventions, although the majority ofinterventions observed modest to moderateimprovements in care. The reviewers looked at theconsistency of the direction and effect size of theresults across the different study designs andacross studies where statistical significance couldbe determined and studies where it could not. Theconclusions are therefore tentative and need to beexplored in future well-designed, robustevaluations.
Reminders are the single intervention that havebeen evaluated the most frequently. These resultssuggest that reminders are a potentially effectiveintervention and are likely to result in moderateimprovements in process of care. The majority of comparisons evaluated reminders across a wide range of settings and targeted behaviours.
Educational outreach was the next most commonlyevaluated intervention. It was often a componentof a multifaceted intervention and might beconsidered to be inherently multifaceted. Therewere modest effects across the majority of studies.Combinations of educational materials andeducational outreach appeared to be relativelyineffective. The results suggest that educationaloutreach may result in modest improvements inprocess of care, but this needs to be offset againstboth the resources required to achieve this changeand practical considerations.
The evidence about the effectiveness of educationalmaterials, audit and feedback and patient-directedinterventions was less robust as there were fewerevaluations of these interventions. Educationalmaterials and audit and feedback appeared to
result in modest effects, whereas patient-directedinterventions appeared to result in moderateeffects. Nevertheless, if the median effect observedfor educational materials as a single interventioncould be achieved in routine practice, it would beimportant (especially given the feasibility andrelatively low cost of disseminating educationalmaterials; see below). However, the addition ofeducational materials to other interventions didnot seem to increase effectiveness.
Although the majority of comparisons evaluatedmultifaceted interventions, there were fewreplications of specific multifaceted interventionseither against a no-intervention control or againsta specific control group. This raised considerableproblems for the interpretation and analysis of thecomparisons. The original plan was to undertake ameta-regression, but this was not possible.Although it would have been possible to undertakean analysis assuming that the effects of the variousinterventions were additive, this was judged to beunrealistic (see Appendix 1 for further details).Instead, all the results of the comparisons weredescribed and the results summarised formultifaceted interventions including educationaloutreach and other multifaceted interventions withat least four comparisons. It was difficult to drawgeneralisable conclusions from comparisons ofmultifaceted interventions owing to the largenumber of different combinations evaluated.However, across all combinations, multifacetedinterventions did not appear to be more effectivethan single interventions and the effects ofmultifaceted interventions did not appear toincrease with the number of componentinterventions.
The majority of studies were conducted in theUSA and the applicability of the results to othersettings is uncertain. In general, there is poorunderstanding of the factors that may influencethe applicability of implementation researchfindings.
The review highlights many of the methodologicaland reporting weaknesses of existing studies andhighlights the importance of using well-appliedrobust designs when evaluating guidelinedissemination and implementation strategies.
Health Technology Assessment 2004; Vol. 8: No. 6
61
© Queen’s Printer and Controller of HMSO 2004. All rights reserved.
Chapter 7
Discussion

Reported details of the study interventions andcontextual factors were poor and it was oftendifficult to assess the rationale for the choice ofintervention. There was little description of thepotential barriers and facilitators to practice.Many studies suffered from methodologicalweaknesses (e.g. unit of analysis errors) thatcreated considerable uncertainties in synthesisingand interpreting the results of the review.
Systematic review of economicevaluations and cost analyses inevaluations of guideline disseminationand implementation strategiesPolicy makers need to have information about thelikely benefits and costs of different guidelinedissemination and implementation strategies ifthey are to make informed decisions aboutwhether it is worthwhile to introduce guidelines.Despite this, only 29% (63) of studies reported anyeconomic data. Eleven reported cost-effectivenessanalyses, 38 reported cost–consequence analyses(where differences in cost were set againstdifferences in several measures of effectiveness)and 14 reported cost analyses (where some aspectof cost was reported but not related to benefits).The majority of studies only reported costs oftreatment; only 25 studies reported data on thecosts of guideline development or guidelinedissemination and implementation. The majorityof studies used process measures for their primaryend-point, despite the fact that only threeguidelines were explicitly evidence based (and maynot have been efficient).
Overall, the methods of the economic evaluationsand cost analyses were poor. The viewpointadopted in economic evaluations was stated inonly ten studies. The methods to estimate costswere comprehensive in about half of the studies,and few studies reported details of resource use.Owing to the poor quality of reporting the studies,data on resource use and cost of guidelinedevelopment, dissemination and implementationwere not available for most of them. Only fourstudies provided sufficiently robust data forconsideration. These studies demonstrated thatthe costs of local guideline development are notinsubstantial if explicitly costed, although theyrecognised that the time needed for manyactivities is frequently not made explicit and suchactivities are often undertaken outside work time.Further estimates of the resources and costs ofdifferent methods of dissemination andimplementation are needed before thegeneralisability of the reported costs can bedetermined. This is a relatively new area of work,
with few publications discussing the methods ofeconomic evaluation alongside implementationresearch trials.18,19,28 Nevertheless, future studiesneed to undertake such analyses if they are tomaximise their benefits to policy makers.
Key informant surveyThe key informant survey, although limited inscope, raised many issues about the practicabilityand feasibility of using dissemination andimplementation strategies in NHS settings.Respondents rarely identified existing budgets tosupport guideline dissemination andimplementation strategies and made frequentcomments about using ‘soft’ money or resourcesfor specific initiatives to support such activities.Some respondents observed that there were non-monetary resources in the system that could beused. In general, the respondents thought thatdissemination of educational materials and short(lunchtime) educational meetings were generallyfeasible within current resources (althoughprimary care respondents were aware of theopportunity costs of inviting primary care staff toeducational meetings). Respondents raisedconcerns about the feasibility of audit andfeedback and reminders relating to the resourcesrequired to deliver these interventions throughmanual systems, and the poor availability andfunctionality of current IT systems required todeliver these interventions through computerisedsystems (especially in secondary care settings).Educational outreach was seen as attractive inprimary care settings as it allowed primary carestaff to remain in their practices, but both primaryand secondary care respondents were unsure howthis could be resourced in current NHS settings.
Strengths and weaknessesThe systematic review is the most extensive,methodologically sophisticated and up-to-datereview of clinical guideline implementationstrategies. The reviewers developed highlysensitive search strategies and consider theincluded studies to be a relatively complete set ofstudies for the period from 1966 to mid-1998.The searches detected more studies than previousreviews covering similar periods. For example, theEffective Health Care bulletin on implementingclinical guidelines4 identified 91 studies from 1976to 1994, whereas over the same period the currentsearches identified 165 studies. Potentially relevantstudies that did not meet the inclusion criteria forthis specific review have now been screened for theCochrane EPOC register. The search strategy has
Discussion
62

since been used to develop the EPOC strategy andfuture reviewers should be able to reduce searchtime by searching the EPOC register for relevantstudies (available by contacting [email protected]).
Detailed data abstraction was conducted on thequality of the studies, characteristics of the studiesand interventions. As a result, the methodologicalweaknesses of the primary studies have been mademore explicit within this review. Where possible,attempts were made to reanalyse the results ofcomparisons with common methodological errors;for example, 27 ITS comparisons were reanalysed.In addition, the interventions were characterisedin greater detail than in previous reviews; thisrevealed the multifaceted nature of the majority ofevaluated interventions. Previous reviews havetended to describe interventions based on authors’main description of the intervention, which oftenignores co-interventions.
Previous reviews have tended to use vote-countingmethods of studies of statistically significantcomparisons, often ignoring unit of analysiserrors. These are potentially misleading owing tothe uncertainty of statistical significance ofcomparisons with unit of analysis errors and thelack of statistical power of many comparisons.They also provide little information about thepotential effect sizes of different interventions. Inthe present review, a more explicit framework wasused that allowed the methodological quality ofstudies (based on design and presence of unit ofanalysis errors when interpreting the results ofcomparisons) to be considered. It also allowed forthe provision of information about the potentialeffect size of interventions. In addition, themethods, assumptions and results of the reviewhave been reported in great detail to allow readersto explore these further.
The review has a number of weaknesses. It isinevitable that some studies will have been missed;the search strategy was estimated to be around93% sensitive, suggesting that around 17 studiesmay have been missed. The authors believe thatthe searches are complete up to mid-1998.Current estimates suggest that around 35–40studies per year are being published, suggestingthat the review is already out of date. There is alsosome evidence that newer studies had fewermethodological weaknesses, for example, potentialunit of analysis errors. Studies that the reviewersconsidered to meet the Institute of Medicinedefinition of clinical guidelines11 were included,irrespective of whether the term guideline wasexplicitly mentioned in the study. This was largely
done for pragmatic reasons. Over time the use ofthe term guideline has changed, and many studiesundertaken in the 1970s and 1980s targetedrecommendations that would probably have beencalled guidelines if published today. Thesejudgements inevitably included a degree ofsubjectivity. Attempts were made to minimise thisby having two reviewers independently assessstudies against the inclusion criteria and byresolving any disagreements in discussion with athird reviewer. The Cochrane EPOC taxonomy ofinterventions was used; this classification is basedupon pragmatic broad descriptions ofinterventions, was relatively easy to apply and hasbeen used in a wide range of reviews. However, itis possible that different ways of classifyinginterventions may have been more discriminatory(although the authors are unaware of anycomparably developed taxonomies). The breadthof the review also mitigated against detailedexamination of effect modifiers of individualinterventions, and it was not possible to undertakea meta-regression as planned. It was originallyplanned to contact authors for additionalinformation, but this was not possible within theresources of the review, given the unexpected sizeof the task. Finally, perhaps the most importantlimitation of the review is the quality of theprimary studies, many of which had commonmethodological weaknesses that diminish thecertainty of the conclusions.
This investigation also included the first systematicreview of economic evaluations and cost analysesin evaluations of guideline dissemination andimplementation strategies, using a standardchecklist for appraising economic evaluations. Thereview only considered the studies identified forthe review of effectiveness. It is possible that thereviewers missed economic evaluations publishedin secondary publications (even though thesearches identified many secondary publications)or economic evaluations based upon modelling.The most striking observation from this review wasthe paucity of high-quality economic evaluations,which limits the ability to draw firm conclusionsabout the resources required by and the efficiencyof different dissemination and implementationstrategies.
To supplement the findings of both reviews, asmall key informant survey was conducted toexplore the feasibility and resource requirementsto deliver interventions within the NHS. Althoughthis was a small survey it demonstrated many ofthe practical constraints that decision-makers inthe NHS face when considering different
Health Technology Assessment 2004; Vol. 8: No. 6
63
© Queen’s Printer and Controller of HMSO 2004. All rights reserved.

dissemination and implementation strategies.Further research could usefully expand this surveyto explore the generalisability of its findings.
Meaning of the study: possiblemechanisms and implications forclinicians or policy makersComparison with previous systematicreviewsAn overview of systematic reviews of professionalbehavioural change strategies published in 1999identified 44 reviews covering a wide range ofactivities and interventions.2 On the basis of thesereviews, it was concluded that “Passivedissemination (for example, mailing educationalmaterials to targeted clinicians) is generallyineffective and is unlikely to result in behaviourchange when used alone; however this approachmay be useful for raising awareness of the desiredbehaviour change. Active approaches are morelikely to be effective but also likely to be morecostly. Interventions of variable effectivenessinclude audit and feedback, and use of localopinion leaders. Generally effective strategiesinclude educational outreach (for prescribingbehaviour) and reminders. Multifacetedinterventions based on assessment of potentialbarriers to change are more likely to be effectivethan single interventions.”
This review has arrived at conclusions that mayappear at odds with the overview and previoussystematic reviews. For example, Freemantle andcolleagues29 reviewed 11 studies evaluating theeffects of the dissemination of educationalmaterials. They used vote-counting methods andexcluded studies with unit of analysis errors. Noneof the comparisons using appropriate statisticaltechniques found statistically significantimprovements in practice. In the current review, amore explicit analytical framework was used toexplore the median and range of effect sizes instudies with and without unit of analysis errors.Four C-RCT comparisons reporting dichotomousprocess measures were identified. All of theseobserved improvements in care; the median effectwas +8.1% (range +3.6 to +17%) absoluteimprovement in performance. Two comparisonshad potential unit of analysis errors and thesignificance of one comparison could not bedetermined. The remaining comparison without apotential unit of analysis error observed an effectof +6% (NS). If the same analytical approach hadbeen used here, the reviewers would have reachedsimilar conclusions to Freemantle and colleagues.
However, such an approach would have failed todetect that printed educational materials led toimprovements in care across the majority ofstudies (albeit that the statistical significance of themajority of comparisons is uncertain). Based uponthis review the authors would not conclude thatprinted educational materials are effective, giventhe methodological weaknesses of the primarystudies. Instead, it was concluded that printededucational materials may lead to improvementsin care and that policy makers should not dismissprinted educational materials given their possibleeffect, relative low cost and feasibility within NHSsettings.
Thomson O’Brien and colleagues30 undertook asystematic review of educational outreach usingvote-counting methods, and concluded that therewas support for “educational outreach visitscombined with additional interventions to reduceinappropriate prescribing by physicians”, but thatthe cost-effectiveness of this approach remainedunclear. In the present review, the majority ofstudies evaluating multifaceted interventionsincluding educational outreach detected positivedirections of effect. Again, if the same methods ofreview had been used here, the reviewers wouldhave come to similar conclusions to ThomsonO’Brien and colleagues. However, the analyticalapproach adopted in the current reviewhighlighted the modest effect sizes observed in theprimary studies (median effect size of +6%, range–4 to 17.4% across 11 C-RCTs). Based upon thisfinding, the potential high cost of the interventionand concerns about the feasibility of thisintervention in routine NHS settings, the authorsare more cautious in their conclusions about theefficiency of this intervention. Since this reviewwas carried out, two well-conducted, UK-basedstudies of educational outreach have beenpublished. Hall and colleagues31 observed noeffect of educational outreach on prescribing.Freemantle and colleagues observed an effect of+3% improvement across four areas ofprescribing.32 Interestingly, despite the small effectsize, an economic analysis24 suggested thateducational outreach was cost-effective in smallgeneral practices for certain drugs.
Previous reviews have also suggested thatmultifaceted interventions are more effective thansingle interventions, on the basis that they addressmultiple barriers to implementation. Davis andcolleagues’ review of continuing medical educationstrategies13 concluded that multifacetedinterventions were more likely to be effective.Wensing and colleagues8 undertook a review of
Discussion
64

the effectiveness of introducing guidelines inprimary care settings; they concluded thatmultifaceted interventions combining more thanone intervention tended to be more effective butmight be more expensive. The specific detailsabout how interventions were coded and theanalytical method of these two reviews are unclear.In this review, all intervention components werecoded and explicit methods were used todetermine a single effect size for each study. Theanalysis suggested that the effectiveness ofmultifaceted interventions did not increaseincrementally with the number of components.Few studies provided any explicit rationale ortheoretical base for the choice of intervention. Asa result, it was unclear whether researchers had ana priori rationale for the choice of components inmultifaceted interventions based upon possiblecausal mechanisms, or whether the choice wasbased on a ‘kitchen sink’ approach. It is plausiblethat multifaceted interventions built upon acareful assessment of barriers and coherenttheoretical base may be more effective than singleinterventions.
It is important not to overinterpret these results,as there were few head-to-head comparisons of thedifferent interventions. In particular, it would beinappropriate to conclude that one intervention islikely to be more effective than another basedupon indirect comparisons. There is probably anatural confounder, in that researchers choseinterventions that they thought were likely to beeffective within their study context; thus, theremay be important differences in the context,barriers or targeted behaviour between studiesthat assessed, for example, printed educationalmaterials and educational outreach.
Implications for policy makersGuidelines are increasingly common in healthcaresettings. Within the UK, local decision-makers inclinical governance structures need to considerhow to respond to the increasing number ofguidelines developed by national agencies such asNICE and SIGN. Ideally, the decision of whetherand how to develop, disseminate and implement aclinical guideline should be based upon carefulestimates of the costs and benefits of thedissemination and implementation strategy, andthe costs and benefits of the resulting changes inpatient care. Mason and colleagues24 coined theterm policy cost-effectiveness to describe thiscombination of treatment cost-effectiveness withthe cost and magnitude of change achieved by animplementation method. They elegantlydemonstrated that educational outreach visits were
cost-effective to promote the uptake ofangiotensin-converting enzyme inhibitors in heartfailure, but were not cost-effective to promote thesubstitution of tricyclic antidepressants forselective serotonin reuptake inhibitors in UKprimary care.
This review has demonstrated that there is not arobust, generalisable evidence base to provideestimates of the likely costs and benefits ofdifferent strategies. Further, for many areas ofclinical care, robust evidence on the cost-effectiveness of clinical interventions is notavailable and few guidelines have incorporatedeconomic considerations when derivingrecommendations.33 As a result, it is unlikely thatdecision-makers will be able to replicate thesophisticated modelling approach demonstratedby Mason and colleagues.24 Nevertheless, decision-makers can use a similar framework to guide theirdecisions about how best to use the limitedresources they have for clinical governance andrelated activities to maximise population benefits.
The following conclusions were drawn for policymakers.
� Given the limited resources available, it seemslikely that decision-makers will need toprioritise which guidelines to disseminate andimplement actively based upon considerationsof local burden of disease, availability ofeffective and efficient healthcare interventions,and local evidence of current suboptimalperformance. This will clearly be influenced bynational priorities and initiatives such asNational Service Frameworks (several keyinformant respondents noted that it is ofteneasier to secure additional funds aroundnational priorities).
� Decision-makers should also consider theavailability (or otherwise) of high-quality, cost-conscious guidelines. If such a guideline isunavailable, the resources required to develop arobust guideline de novo are substantial.
� Decision-makers need to identify what resourcesare available to them to support disseminationand implementation strategies. While there mayonly be limited direct resources available withinclinical governance budgets, there may besubstantial additional resources that can bemobilised through partnership andcoordination with other stakeholders (e.g.coordinated educational approaches withcontinuing medical education providers) orwithin the environment of the organisation (e.g.
Health Technology Assessment 2004; Vol. 8: No. 6
65
© Queen’s Printer and Controller of HMSO 2004. All rights reserved.

information systems that can support thegeneration of reminders).
� The choice of guideline dissemination andimplementation strategies should be basedupon considerations of the barriers to andfacilitators of change, and the likely costs andbenefits of different strategies. Several authorshave proposed rationales for choosing differentinterventions in the presence of different typesof barriers and faciliatators (e.g. Grol,34
Mittman and colleagues,35 Grimshaw andEccles36 and Moulding and colleagues37).However, the empirical basis for these rationalesis not strong. Further, the lack of explicitrationale for interventions and poor reportingof potential barriers and facilitators in currentstudies limits our understanding of theapplicability of study results to other settingsand problems.
� Decision-makers need to use considerablejudgement about which interventions are mostlikely to be effective in any given circumstanceand choose intervention(s) based uponconsideration of the feasibility, costs andbenefits that potentially effective interventionsare likely to yield. – Wherever possible, interventions should
include paper-based or computerisedreminders.
– It may be more efficient to use a cheaper,more feasible, but less effective intervention(e.g. passive dissemination of guidelines) thana more expensive but potentially moreeffective intervention.
– Decision-makers also need to consider theresource implications associated withconsequent changes in clinical practice and toassess their likely impact on differentbudgets.
� Decision-makers should assess the effects of anyinterventions, preferably using rigorousevaluative designs.
Unanswered questions and futureresearchThis review highlights the fact that despite 30 yearsof research in this area, we still lack a robust,generalisable evidence base to inform decisionsabout strategies to promote the introduction ofguidelines or other evidence-based messages intopractice.
The UK Medical Research Council (MRC) recentlyproposed a framework for evaluating complexinterventions (such as guideline dissemination and
implementation strategies).38 This suggests thatthe evaluation of complex interventions shouldfollow a sequential approach, involving:
1. development of the theoretical basis for anintervention
2. definition of components of the intervention(using modelling or simulated techniques andqualitative methods)
3. exploratory studies to develop further theintervention and plan a definitive evaluativestudy (using a variety of methods)
4. a definitive evaluative study (using quantitativeevaluative methods, predominantly randomiseddesigns).
This recognises the benefits of establishing thetheoretical basis of interventions and conductingexploratory studies to choose and refineinterventions to minimise the number of costly‘definitive’ RCTs. Most of the studies includedwithin this systematic review could be considereddefinitive evaluations. Relatively little research hasbeen conducted to develop the theoretical basis ofhealthcare professional and organisationalbehaviour and behavioural change. Few studiesappear to have undertaken preparatory studies todefine the intervention or demonstrate thefeasibility of the planned definitive study.
The lack of a coherent theoretical basis forunderstanding professional and organisationalbehavioural change limits our ability to formulatehypotheses about which interventions are likely tobe effective under different circumstances andhampers our understanding of the likelygeneralisability of the results of definitive trials.An important focus for future research should beto develop a better theoretical understanding ofprofessional and organisational behaviouralchange. Ferlie and Shortell39 suggested four levelsat which interventions to improve the quality ofhealthcare might operate: the individual healthprofessional, healthcare groups or teams,organisations providing healthcare (e.g. NHStrusts) and the larger healthcare system orenvironment in which individual organisations areembedded. A full scientific rationale for guidelinedissemination and implementation interventionsrequires exploration of theories relevant to each ofthese four levels. A large number of educational,behavioural, social and organisational theories hasproved to be useful to understand behaviour in awide range of contexts. However, the applicabilityof these theories to healthcare professional andorganisational behaviour has rarely been tested.Thus, an initial step in the development of the
Discussion
66

theoretical basis of professional and organisationalbehaviour could involve testing the applicability ofsuch theories in healthcare settings. Differenttypes of theory will be relevant to interventions atdifferent levels; for example, psychologicaltheories will be more relevant to interventionsdirected at individuals and teams, and theories oforganisational change will be more relevant tointerventions directed at hospitals or trusts. Inaddition, further research is required into methodsto optimise interventions before conductingdefinitive trials (equivalent to the modelling andexploratory trial phases of the MRC framework).
As in other areas of medical and social research,rigorous evaluations (mainly RCTs) will providethe most robust evidence about the effectiveness ofguideline dissemination and implementationstrategies because effects are likely to be modest,there is substantial risk of bias and we have poorunderstanding of the likely effect modifiers andconfounders.40,41 However, despite theconsiderable number of evaluations that have beenundertaken in this area, we still lack a coherentevidence base to support decisions about whichdissemination and implementation strategies touse. This is partly due to the poor methodologicalquality of the existing studies; for example, thestatistical significance of many comparisons couldnot be determined from the published studiesowing to common methodological weaknesses.Further rigorous evaluations of differentdissemination and implementation strategies needto take place. These evaluations need to bemethodologically robust (addressing the commonmethodological errors identified in the systematicreview), incorporate economic evaluations and,wherever possible, explicitly test behaviouraltheories to develop further our theoreticalunderstanding of factors influencing theeffectiveness of guideline dissemination andimplementation strategies.
The MRC framework represents an idealisedsequential framework for developing andevaluating interventions. However, it is modelledon the stages of development of pharmaceuticals,which typically takes 15–20 years to work througheach stage, requiring substantial investment ofresources. It is unlikely that implementationresearchers will have the time and resourcesrequired to work through each phase sequentiallywhen evaluating guideline dissemination andimplementation strategies. Given this, futureresearch needs to adopt a variety of approaches todeveloping and testing theory and evaluatinginterventions.
Specific recommendations for furtherresearch Further research is required in the theoretical,substantive and methodological domains.
Theoretical� Further research is required to develop and
validate a coherent theoretical framework ofhealth professional and organisationalbehaviour and behavioural change to informbetter the choice of interventions in researchand service settings. Initially, research shouldevaluate the applicability of existing predictivetheories relevant to a range of levels (e.g.individual, team, organisation, system) ratherthan attempt to develop theory de novo.
Substantive� Further rigorous evaluations of different
dissemination and implementation strategiesare required that: – are methodologically robust (addressing the
common methodological errors identified inthe systematic review)
– incorporate economic evaluations – wherever possible, explicitly test behavioural
theories to develop further our theoreticalunderstanding of factors influencing theeffectiveness of guideline dissemination andimplementation strategies. If this is notpossible, then trials should include integratedprocess evaluations better to describe andilluminate their findings
– evaluate a range of (theoretically based)interventions in head-to-head comparisons.
� Further rigorous evaluations are required ofrelatively cheap interventions such as printededucational materials that have the potential tobe efficient.
Methodological� Further research is required to develop methods
to optimise interventions before definitive trials. � Further research is required to improve the
methods of conducting C-RCTs of complexinterventions such as guideline disseminationand implementation strategies. The MRC haspublished a monograph42 on the conduct of C-RCTs; however, there needs to be a widerunderstanding of these issues and theirapplication within the research community.
� Although not strictly a recommendation forfurther research, there is a clear need forimproved reporting of studies evaluatingcomplex interventions such as guidelinedissemination and implementation strategies.This would include areas such as how best to
Health Technology Assessment 2004; Vol. 8: No. 6
67
© Queen’s Printer and Controller of HMSO 2004. All rights reserved.

provide detail on the choice and construction ofinterventions and the evaluation of effectmodifiers.
� The results of this systematic review differ fromprevious reviews as a result of the methodsused. Further research is required to establishoptimal review methods for complexinterventions such as guideline disseminationand implementation strategies. This shouldinclude issues such as:– how best to aggregate results across studies
that have unit of analysis errors – how best to deal with categorising
interventions.
Other issuesThe research agenda is substantial and will requirean interdisciplinary perspective using a variety ofmethodological approaches. This remains arelatively new area of health services research, with
a distinct perspective and specific methodologicalchallenges. It is important to develop expertise inthis area through interdisciplinary programmaticactivities. Further progress in this area will requireongoing support by a range of funding agencies.For example, the theoretical developments needed(equivalent to establishing ‘the basic science ofimplementation’) may best be supported byfundamental, as opposed to applied, healthresearch funders. Further, these research issues cutacross national and cultural differences in thepractice and financing of healthcare, and theirscope is such that no individual country’s healthservices research programme or individualresearch group alone can systematically examinethem in a comprehensive way. There aresubstantial opportunities for internationalcollaboration to enhance our understanding inthis area.
Discussion
68

We are extremely grateful to Liz Grant for herexcellent work and support in the preparation
of this report.
We also wish to thank the key informants whoresponded to our semistructured telephone surveyin Chapter 6 (Drs Phil Ayres, John Parr, Helen
Rodgers, Peter Sanderson, Professors ColinBradshaw, Gene Feder and John Wright).
The Health Services Research Unit is funded bythe Chief Scientist Office of the Scottish ExecutiveHealth Department. The views expressed arethose of the authors.
Health Technology Assessment 2004; Vol. 8: No. 6
69
© Queen’s Printer and Controller of HMSO 2004. All rights reserved.
Acknowledgements


1. Woolf SH, Grol R, Hutchison A, Eccles M,Grimshaw J. Clinical practice guidelines. Thepotential benefits, limitations, and harms of clinicalguidelines. BMJ 1999;318:527–30.
2. NHS Centre for Reviews and Dissemination.Getting evidence into practice. Effective Health Care1999;5:1–16.
3. Lomas J. Words without action? The production,dissemination, and impact of consensusrecommendations. Annu Rev Public Health 1991;12:41–65.
4. NHS Centre for Reviews and Dissemination andNuffield Institute for Health. Implementing clinicalguidelines. Can guidelines be used to improveclinical practice? Effective Health Care 1994;1:1–12.
5. Oxman A, Thomson MA, Davis DA, Haynes RB. No magic bullets: a systematic review of 102 trialsof interventions to improve professional practice.CMAJ 1995;153:1423–31.
6. Davis DA, Taylor-Vaisey A. Translating guidelinesinto practice. A systematic review of theoreticconcepts, practical experience and researchevidence in the adoption of clinical practiceguidelines. CMAJ 1997;157:408–16.
7. Worrall G, Chaulk P, Freake D. The effects of clinicalpractice guidelines on patient outcomes in primarycare: a systematic review. CMAJ 1997;156:1705–12.
8. Wensing M, Van der Weijden T, Grol R.Implementing guidelines and innovations ingeneral practice: which interventions are effective? J Gen Pract 1998;48:991–7.
9. Thomas L, Cullum N, McColl E, Rousseau N,Soutter J, Steen N. Clinical guidelines in nursing,midwifery and other professions allied to medicine(Cochrane Review). The Cochrane Library (Issue 1).Oxford: Update Software; 1999.
10. Bero L, Grilli R, Grimshaw JM, Mowatt G, Oxman A,Zwarenstein M. Cochrane Effective Practice andOrganisation of Care Review Group (Cochrane GroupModule). In Bero L, Grilli R, Grimshaw JM, MowattG, Oxman A, Zwarenstein M, editors. The CochraneLibrary (Issue 3). Oxford: Update Software; 2001.
11. Institute of Medicine Committee on ClinicalPractice Guidelines. Guidelines for clinical practice:from development to use. Washington, DC:National Academy Press; 1992.
12. Cook TD, Campbell DT. Quasi-experimentation:design and analysis issues for field settings.Chicago, IL: Rand McNally; 1979.
13. Davis DA, Thomson MA, Oxman AD, Haynes RB.Changing physician performance. A systematicreview of the effect of continuing medical educationstrategies. JAMA 1995;274:700–5.
14. Whiting-O’Keefe QE, Henke C, Simborg DW.Choosing the correct unit of analysis in medicalcare experiments. Med Care 1984;22:1101–14.
15. Ukoumunne OC, Gulliford MC, Chinn S, SterneJAC, Burney PGJ. Methods for evaluating area-wideand organisation based interventions in health andhealth care: a systematic review. Health Technol Assess1999;3(5).
16. Bushman BJ. Vote counting methods in meta-analysis. In Cooper H, Hedges L, editors. Thehandbook of research synthesis. New York: RussellSage Foundation; 1994; pp. 193–213.
17. Drummond M, O’Brien B, Stoddart G, TorranceGW. Methods of economic evaluation of health careprogrammes. Oxford: Oxford University Press; 1997.
18. McIntosh E. Economic evaluation of guidelineimplementation studies. In Makela M, Thorsen T,editors. Changing professional practice. Theory andpractice of clinical guidelines implementation.Copenhagen: Danish Institute for Health ServicesResearch and Development; 1999, pp. 77–98.
19. Mason J, Wood J, Freemantle N. Designingevaluations of interventions to change professionalpractice. J Health Serv Res Policy 1999;4:106–11.
20. Drummond MF, Jefferson TO, for the BMJWorking Party on guidelines for authors and peer-reviewers of economic submissions to the BritishMedical Journal. Guidelines for authors and peer-reviewers of economic submissions to the BritishMedical Journal. BMJ 1996;313:275–83.
21. Jefferson TO, Demicheli V, Vale L. Methodologicalreviews of economic evaluations in health care.JAMA 2002;287:2809–12.
22. Fergusson D, van Walraven C, Coyle D, Laupacis A.Economic evaluations of technologies to minimizeperioperative transfusion: a systematic review ofpublished studies. International Study ofPerioperative Transfusion (ISPOT) investigators.Transfus Med Rev 1999;13:106–17.
23. Campbell MK, Mollison J, Grimshaw JM. Clustertrials in implementation research: estimation ofintracluster correlation coefficients and sample size.Stat Med 2001;20:391–9.
24. Mason J, Freemantle N, Nazereth I, Eccles M,Haines A, Drummond M. When is it cost effective
Health Technology Assessment 2004; Vol. 8: No. 6
71
© Queen’s Printer and Controller of HMSO 2004. All rights reserved.
References

to change the behaviour of health professionals?JAMA 2001;286:2988–92.
25. Neal RD, Heywood PL, Morley S. Real world data –retrieval and validation of consultation data fromfour general practices. Fam Pract 1996;13:455–61.
26. Department of Health. An information strategy forthe modern NHS 1998–2005. A national strategyfor local implementation. London: Department ofHealth; 1998.
27. Purves IN. PRODIGY: implementing clinicalguidelines using computers. Br J Gen Pract 1998;48:1552–3.
28. Sculpher M. Evaluating the cost-effectiveness ofinterventions designed to increase the utilisation ofevidence-based guidelines. Fam Pract 2000;17:S26–31.
29. Freemantle N, Harvey EL, Wolf F, Grimshaw JM,Grilli R, Bero L. Printed educational materials:effects on professional practice and health careoutcomes (Cochrane Review). Cochrane Database ofSystematic Reviews 2003;1.
30. Thomson O’Brien MA, Oxman AD, Davis DA,Haynes RB, Freemantle N, Harvey EL. Educationaloutreach visits: effects on professional practice andhealth care outcomes (Cochrane Review). CochraneDatabase of Systematic Reviews 2003;1.
31. Hall L, Eccles MP, Barton R, Steen N, Campbell M.Is untargeted outreach visiting in primary careeffective? A pragmatic randomized controlled trial.J Public Health Med 2001;23:109–13.
32. Freemantle N, Nazereth I, Eccles M, Wood J,Haines A. Evidence-based OutReach trialists. Arandomised controlled trial of the effect ofeducational outreach by community pharmacists onprescribing in UK general practice. Br J Gen Pract2002;52:290–5.
33. Eccles M, Mason J. How to develop cost-consciousguidelines. Health Technol Assess 2001;5(16).
34. Grol R. Beliefs and evidence in changing clinicalpractice. BMJ 1997;315:418–21.
35. Mittman BS, Tonesk X, Jacobsen PD. Implementingclinical practice guidelines: social influencestrategies and practitioner behavior change. QualityReview Bulletin 1992;18:413–22.
36. Grimshaw JM, Eccles MP. Clinical practiceguidelines. In Haines A, Silagy C, editors. Evidence-based practice in primary care. London: BMJPublishing; 2001, pp. 120–34.
37. Moulding NT, Silagy CA, Weller DP. A frameworkfor effective management of change in clinicalpractice: dissemination and implementation ofclinical practice guidelines. Quality in Health Care1999;8:177–83.
38. Medical Research Council. A framework fordevelopment and evaluation of RCTs for complexinterventions to improve health. MRC HealthServices and Public Health Board discussiondocument. London: MRC; 2000.
39. Ferlie EB, Shortell SM. Improving the quality ofhealth care in the United Kingdom and the UnitedStates: a framework for change. Milbank Q2001;79:281–315.
40. Cochrane AL. Effectiveness and efficiency: randomreflections on health services. London: NuffieldProvincial Hospitals Trust; 1979.
41. Campbell DT. Methodology and epistemology forsocial science: selected papers. In Overman ES,editor. The experimenting society. Chicago, IL:University of Chicago Press; 1988, pp. 290–314.
42. Medical Research Council. Cluster randomisedtrials: methodological and ethical considerations.MRC Clinical Trials Series. London: MRC; 2002.
43. Grimshaw J, Campbell M, Eccles M, Steen I.Experimental and quasi-experimental designs forevaluating guideline implementation strategies. FamPract 2000;17:S11–18.
44. Donner A, Birkett N, Buck C. Randomization bycluster. Sample size requirements and analysis. Am JEpidemiol 1981;114:906–14.
45. Mollison J, Simpson J, Campbell MK, GrimshawJM. Comparison of analytical methods for clusterrandomised trials: an example from a primary caresetting. J Epidemiol Biostat 2000;5:339–46.
46. Draper N, Smith H. Applied regression analysis.New York: Wiley; 1981.
47. Dickersin K, Scherer R, Lefebvre C. Identifyingrelevant studies for systematic reviews. BMJ1994;309:1286–91.
References
72

This version of HTA monograph volume 8, number 6 does not include the 269 pages of appendices. This is to save download time from the HTA website. The printed version of this monograph also excludes the appendices. View/download the appendices (936 kbytes).


Health Technology Assessment 2004; Vol. 8: No. 6
349
Health Technology AssessmentProgramme
Prioritisation Strategy GroupMembers
Chair,Professor Tom Walley, Director,NHS HTA Programme &Professor of ClinicalPharmacology, University of Liverpool
Professor Bruce Campbell,Consultant Vascular & GeneralSurgeon, Royal Devon & ExeterHospital
Professor Shah Ebrahim,Professor in Epidemiology of Ageing, University of Bristol
Dr John Reynolds, ClinicalDirector, Acute GeneralMedicine SDU, RadcliffeHospital, Oxford
Dr Ron Zimmern, Director,Public Health Genetics Unit,Strangeways ResearchLaboratories, Cambridge
HTA Commissioning BoardMembers
Programme Director, Professor Tom Walley, Director,NHS HTA Programme &Professor of ClinicalPharmacology, University of Liverpool
Chair,Professor Shah Ebrahim,Professor in Epidemiology ofAgeing, Department of SocialMedicine, University of Bristol,Canynge Hall, WhiteladiesRoad, Bristol
Deputy Chair, Professor Jenny Hewison,Professor of Health CarePsychology, Academic Unit ofPsychiatry and BehaviouralSciences, University of LeedsSchool of Medicine, Leeds
Professor Douglas Altman,Professor of Statistics inMedicine, Centre for Statisticsin Medicine, Oxford University,Institute of Health Sciences,Cancer Research UK MedicalStatistics Group, Headington,Oxford
Professor John Bond, Professorof Health Services Research,Centre for Health ServicesResearch, University ofNewcastle, School of HealthSciences, Newcastle upon Tyne
Professor John Brazier, Directorof Health Economics, SheffieldHealth Economics Group,School of Health & RelatedResearch, University ofSheffield, ScHARR RegentCourt, Sheffield
Dr Andrew Briggs, PublicHealth Career Scientist, HealthEconomics Research Centre,University of Oxford, Instituteof Health Sciences, Oxford
Dr Christine Clark, MedicalWriter & Consultant Pharmacist,Cloudside, Rossendale, LancsandPrincipal Research Fellow,Clinical Therapeutics in theSchool of Pharmacy, BradfordUniversity, Bradford
Professor Nicky Cullum,Director of Centre for EvidenceBased Nursing, Department ofHealth Sciences, University ofYork, Research Section,Seebohm Rowntree Building,Heslington, York
Dr Andrew Farmer, SeniorLecturer in General Practice,Department of Primary HealthCare, University of Oxford,Institute of Health Sciences,Headington, Oxford
Professor Fiona J Gilbert,Professor of Radiology,Department of Radiology,University of Aberdeen, LilianSutton Building, Foresterhill,Aberdeen
Professor Adrian Grant,Director, Health ServicesResearch Unit, University ofAberdeen, Drew Kay Wing,Polwarth Building, Foresterhill,Aberdeen
Professor Alastair Gray, Director,Health Economics ResearchCentre, University of Oxford,Institute of Health Sciences,Headington, Oxford
Professor Mark Haggard,Director, MRC ESS Team, CBUElsworth House, Addenbrooke’sHospital, Cambridge
Professor F D Richard Hobbs,Professor of Primary Care &General Practice, Department ofPrimary Care & GeneralPractice, University ofBirmingham, Primary Care andClinical Sciences Building,Edgbaston, Birmingham
Professor Peter Jones, Head ofDepartment, UniversityDepartment of Psychiatry,University of Cambridge,Addenbrooke's Hospital,Cambridge
Professor Sallie Lamb, ResearchProfessor in Physiotherapy/Co-Director, InterdisciplinaryResearch Centre in Health,Coventry University, Coventry
Dr Donna Lamping, SeniorLecturer, Health ServicesResearch Unit, Public Healthand Policy, London School ofHygiene and Tropical Medicine,London
Professor David Neal, Professorof Surgical Oncology, OncologyCentre, Addenbrooke's Hospital,Cambridge
Professor Tim Peters, Professorof Primary Care Health ServicesResearch, Division of PrimaryHealth Care, University ofBristol, Cotham House, CothamHill, Bristol
Professor Ian Roberts, Professorof Epidemiology & PublicHealth, Intervention ResearchUnit, London School ofHygiene and Tropical Medicine,London
Professor Peter Sandercock,Professor of Medical Neurology,Department of ClinicalNeurosciences, University ofEdinburgh, Western GeneralHospital NHS Trust, BramwellDott Building, Edinburgh
Professor Martin Severs,Professor in Elderly HealthCare, Portsmouth Institute ofMedicine, Health & Social Care,St George’s Building,Portsmouth
Dr Jonathan Shapiro, SeniorFellow, Health ServicesManagement Centre, ParkHouse, Birmingham
Current and past membership details of all HTA ‘committees’ are available from the HTA website (www.ncchta.org)
© Queen’s Printer and Controller of HMSO 2004. All rights reserved.

Health Technology Assessment Programme
350
Diagnostic Technologies & Screening PanelMembers
Chair,Dr Ron Zimmern, Director ofthe Public Health Genetics Unit,Strangeways ResearchLaboratories, Cambridge
Dr Paul Cockcroft, ConsultantMedical Microbiologist/Laboratory Director, PublicHealth Laboratory, St Mary’s Hospital, Portsmouth
Professor Adrian K Dixon,Professor of Radiology,Addenbrooke’s Hospital,Cambridge
Dr David Elliman, Consultant inCommunity Child Health,London
Dr Andrew Farmer, SeniorLecturer in General Practice,Institute of Health Sciences,University of Oxford
Dr Karen N Foster, ClinicalLecturer, Dept of GeneralPractice & Primary Care,University of Aberdeen
Professor Jane Franklyn,Professor of Medicine,University of Birmingham
Professor Antony J Franks,Deputy Medical Director, TheLeeds Teaching Hospitals NHSTrust
Mr Tam Fry, HonoraryChairman, Child GrowthFoundation, London
Dr Susanne M Ludgate, MedicalDirector, Medical DevicesAgency, London
Dr William Rosenberg, SeniorLecturer and Consultant inMedicine, University ofSouthampton
Dr Susan Schonfield, CPHMSpecialised ServicesCommissioning, CroydonPrimary Care Trust
Dr Margaret Somerville,Director of Public Health,Teignbridge Primary Care Trust,Devon
Mr Tony Tester, Chief Officer,South Bedfordshire CommunityHealth Council, Luton
Dr Andrew Walker, SeniorLecturer in Health Economics,University of Glasgow
Professor Martin J Whittle,Head of Division ofReproductive & Child Health,University of Birmingham
Dr Dennis Wright, ConsultantBiochemist & Clinical Director,Pathology & The KennedyGalton Centre, Northwick Park& St Mark’s Hospitals, Harrow
Pharmaceuticals PanelMembers
Chair,Dr John Reynolds, ClinicalDirector, Acute GeneralMedicine SDU, OxfordRadcliffe Hospital
Professor Tony Avery, Professorof Primary Health Care,University of Nottingham
Professor Iain T Cameron,Professor of Obstetrics &Gynaecology, University ofSouthampton
Mr Peter Cardy, ChiefExecutive, Macmillan CancerRelief, London
Dr Christopher Cates, GP andCochrane Editor, Bushey HealthCentre, Bushey, Herts.
Mr Charles Dobson, SpecialProjects Adviser, Department ofHealth
Dr Robin Ferner, ConsultantPhysician and Director, WestMidlands Centre for AdverseDrug Reactions, City HospitalNHS Trust, Birmingham
Dr Karen A Fitzgerald,Pharmaceutical Adviser, Bro TafHealth Authority, Cardiff
Professor Alastair Gray,Professor of Health Economics,Institute of Health Sciences,University of Oxford
Mrs Sharon Hart, ManagingEditor, Drug & TherapeuticsBulletin, London
Dr Christine Hine, Consultant inPublic Health Medicine, Bristol South & West PrimaryCare Trust
Professor Robert Peveler,Professor of Liaison Psychiatry,Royal South Hants Hospital,Southampton
Dr Frances Rotblat, CPMPDelegate, Medicines ControlAgency, London
Mrs Katrina Simister, NewProducts Manager, NationalPrescribing Centre, Liverpool
Dr Ken Stein, Senior Lecturer inPublic Health, University ofExeter
Professor Terence Stephenson,Professor of Child Health,University of Nottingham
Dr Richard Tiner, MedicalDirector, Association of theBritish Pharmaceutical Industry,London
Professor Dame Jenifer Wilson-Barnett, Head of FlorenceNightingale School of Nursing& Midwifery, King’s College,London
Current and past membership details of all HTA ‘committees’ are available from the HTA website (www.ncchta.org)

Health Technology Assessment 2004; Vol. 8: No. 6
351
Therapeutic Procedures PanelMembers
Chair, Professor Bruce Campbell,Consultant Vascular andGeneral Surgeon, Royal Devon& Exeter Hospital
Dr Mahmood Adil, Head ofClinical Support & HealthProtection, Directorate ofHealth and Social Care (North),Department of Health,Manchester
Professor John Bond, Head ofCentre for Health ServicesResearch, University ofNewcastle upon Tyne
Mr Michael Clancy, Consultantin A & E Medicine,Southampton General Hospital
Dr Carl E Counsell, SeniorLecturer in Neurology,University of Aberdeen
Dr Keith Dodd, ConsultantPaediatrician, DerbyshireChildren’s Hospital, Derby
Professor Gene Feder, Professorof Primary Care R&D, Barts &the London, Queen Mary’sSchool of Medicine andDentistry, University of London
Ms Bec Hanley, FreelanceConsumer Advocate,Hurstpierpoint, West Sussex
Professor Alan Horwich,Director of Clinical R&D, TheInstitute of Cancer Research,London
Dr Phillip Leech, PrincipalMedical Officer for PrimaryCare, Department of Health,London
Mr George Levvy, ChiefExecutive, Motor NeuroneDisease Association,Northampton
Professor James Lindesay,Professor of Psychiatry for theElderly, University of Leicester
Dr Mike McGovern, SeniorMedical Officer, Heart Team,Department of Health, London
Dr John C Pounsford,Consultant Physician, NorthBristol NHS Trust
Professor Mark Sculpher,Professor of Health Economics,Institute for Research in theSocial Services, University ofYork
Dr L David Smith, ConsultantCardiologist, Royal Devon &Exeter Hospital
Professor Norman Waugh,Professor of Public Health,University of Aberdeen
Current and past membership details of all HTA ‘committees’ are available from the HTA website (www.ncchta.org)

Health Technology Assessment Programme
352Current and past membership details of all HTA ‘committees’ are available from the HTA website (www.ncchta.org)
Expert Advisory NetworkMembers
Mr Gordon Aylward, Chief Executive, Association of British Health-Care Industries, London
Ms Judith Brodie, Head of Cancer SupportService, Cancer BACUP, London
Mr Shaun Brogan, Chief Executive, RidgewayPrimary Care Group, Aylesbury,Bucks
Ms Tracy Bury, Project Manager, WorldConfederation for PhysicalTherapy, London
Mr John A Cairns, Professor of Health Economics,Health Economics ResearchUnit, University of Aberdeen
Professor Howard Stephen Cuckle, Professor of ReproductiveEpidemiology, Department ofPaediatrics, Obstetrics &Gynaecology, University ofLeeds
Professor Nicky Cullum, Director of Centre for EvidenceBased Nursing, University of York
Dr Katherine Darton, Information Unit, MIND – TheMental Health Charity, London
Professor Carol Dezateux, Professor of PaediatricEpidemiology, London
Professor Martin Eccles, Professor of ClinicalEffectiveness, Centre for HealthServices Research, University ofNewcastle upon Tyne
Professor Pam Enderby,Professor of CommunityRehabilitation, Institute ofGeneral Practice and PrimaryCare, University of Sheffield
Mr Leonard R Fenwick, Chief Executive, Newcastleupon Tyne Hospitals NHS Trust
Professor David Field, Professor of Neonatal Medicine,Child Health, The LeicesterRoyal Infirmary NHS Trust
Mrs Gillian Fletcher, Antenatal Teacher & Tutor andPresident, National ChildbirthTrust, Henfield, West Sussex
Ms Grace Gibbs, Deputy Chief Executive,Director for Nursing, Midwifery& Clinical Support Servs., WestMiddlesex University Hospital,Isleworth, Middlesex
Dr Neville Goodman, Consultant Anaesthetist,Southmead Hospital, Bristol
Professor Robert E Hawkins, CRC Professor and Director ofMedical Oncology, Christie CRCResearch Centre, ChristieHospital NHS Trust, Manchester
Professor F D Richard Hobbs, Professor of Primary Care &General Practice, Department ofPrimary Care & GeneralPractice, University ofBirmingham
Professor Allen Hutchinson, Director of Public Health &Deputy Dean of ScHARR,Department of Public Health,University of Sheffield
Professor Rajan Madhok, Medical Director & Director ofPublic Health, Directorate ofClinical Strategy & PublicHealth, North & East Yorkshire& Northern Lincolnshire HealthAuthority, York
Professor David Mant, Professor of General Practice,Department of Primary Care,University of Oxford
Professor Alexander Markham, Director, Molecular MedicineUnit, St James’s UniversityHospital, Leeds
Dr Chris McCall, General Practitioner, TheHadleigh Practice, CastleMullen, Dorset
Professor Alistair McGuire, Professor of Health Economics,London School of Economics
Dr Peter Moore, Freelance Science Writer,Ashtead, Surrey
Dr Andrew Mortimore, Consultant in Public HealthMedicine, Southampton CityPrimary Care Trust
Dr Sue Moss, Associate Director, CancerScreening Evaluation Unit,Institute of Cancer Research,Sutton, Surrey
Professor Jon Nicholl, Director of Medical CareResearch Unit, School of Healthand Related Research,University of Sheffield
Mrs Julietta Patnick, National Co-ordinator, NHSCancer Screening Programmes,Sheffield
Professor Chris Price, Visiting Chair – Oxford, ClinicalResearch, Bayer DiagnosticsEurope, Cirencester
Ms Marianne Rigge, Director, College of Health,London
Professor Sarah Stewart-Brown, Director HSRU/HonoraryConsultant in PH Medicine,Department of Public Health,University of Oxford
Professor Ala Szczepura, Professor of Health ServiceResearch, Centre for HealthServices Studies, University ofWarwick
Dr Ross Taylor, Senior Lecturer, Department ofGeneral Practice and PrimaryCare, University of Aberdeen
Mrs Joan Webster, Consumer member, HTA –Expert Advisory Network


The National Coordinating Centre for Health Technology Assessment,Mailpoint 728, Boldrewood,University of Southampton,Southampton, SO16 7PX, UK.Fax: +44 (0) 23 8059 5639 Email: [email protected]://www.ncchta.org ISSN 1366-5278
FeedbackThe HTA Programme and the authors would like to know
your views about this report.
The Correspondence Page on the HTA website(http://www.ncchta.org) is a convenient way to publish
your comments. If you prefer, you can send your comments to the address below, telling us whether you would like
us to transfer them to the website.
We look forward to hearing from you.