nifty intra-day movement banknifty intra-day movement · products across various categories to fend...
TRANSCRIPT
June 21, 2016
Indian Markets CMP % chg 1d % chg 3m % chg 6m % chg ytd Nifty 8,239 0.8 6.9 5.2 3.7 Sensex 26,867 0.9 6.3 4.4 2.9 BSE Small Cap 11,478 0.4 9.9 (1.3) (3.0) Midcap 11,404 0.4 9.2 3.8 2.3 INR/USD 67 (0.3) 1.2 1.5 (1.7) Developed/Emerging markets Dow Jones 17,805 0.7 1.0 3.2 2.2 S&P 500 2,083 0.6 1.5 3.1 1.9 Nasdaq 4,400 0.6 (0.6) (3.5) (4.2) Nikkei 16,042 0.5 (4.1) (15.2) (15.7) Hang Seng 20,638 0.6 (0.2) (5.3) (5.8) Bovespa 51,309 1.6 (2.8) 9.0 10.5 DAX 9,962 3.4 0.1 (5.1) (7.3) FTSE 6,204 3.0 0.3 2.8 (0.6) SGX Nifty 8,249 0.1 7.0 5.2 3.8
Trading turnover
Cash (Rs cr)
Index Fut*
Stock Fut* Index Calls* Index Puts*
FII (537) (23,756) 5,242 (2,041) (15,253) DII 724 4,961 2,342 0 800 Prop 9,614 364 14,452 (17,083) HNI Clients 9,181 (7,948) (12,411) 31,536
* Number of contracts
Top gainers Top losers Underlying Security CMP % chg Underlying security CMP % chg Indian Bank 142 14.3 Welspun 107 (2.9) Jet Airways 586 6.6 Torrent Power 177 (2.5) Vedanta 129 4.9 Bajaj Finserv 2,008 (2.3) Godrej Ind. 369 4.8 Ipca Labs 478 (2.2) BEML 868 3.8 Muthoot Fin. 260 (2.2)
Recent eco. data Actual Cons. Upcoming eco. data Cons. Previous BOJ interest rate (%) (0.1) (0.1) Zew Survey 15.3 16.8 EUR CPI yoy (%) 0.3 (0.1) Brexit Reff. Remain ‐ US Initial jobless cl. 277k 270k Japan industry activity (%) 1.2 0.1 US Housing Starts 1164K 1150k India Eight core ind. ‐ 8.5
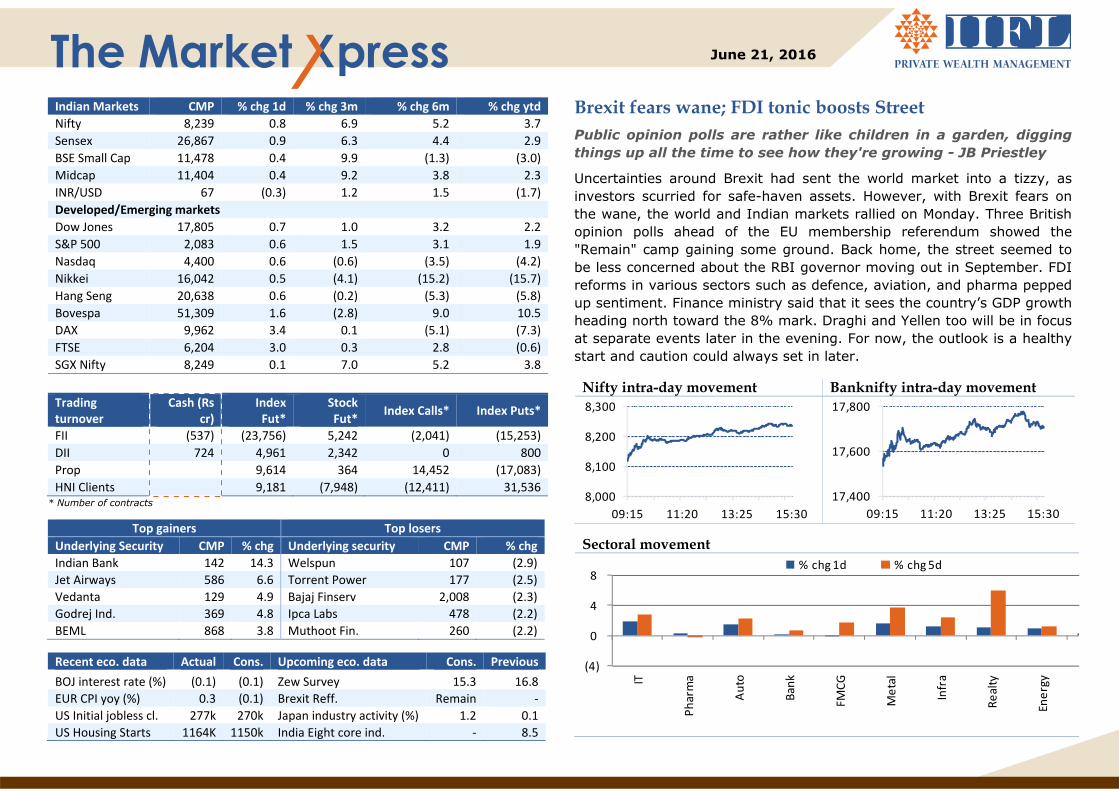
Brexit fears wane; FDI tonic boosts Street Public opinion polls are rather like children in a garden, digging things up all the time to see how they're growing - JB Priestley
Uncertainties around Brexit had sent the world market into a tizzy, as investors scurried for safe-haven assets. However, with Brexit fears on the wane, the world and Indian markets rallied on Monday. Three British opinion polls ahead of the EU membership referendum showed the "Remain" camp gaining some ground. Back home, the street seemed to be less concerned about the RBI governor moving out in September. FDI reforms in various sectors such as defence, aviation, and pharma pepped up sentiment. Finance ministry said that it sees the country’s GDP growth heading north toward the 8% mark. Draghi and Yellen too will be in focus at separate events later in the evening. For now, the outlook is a healthy start and caution could always set in later.
Nifty intra-day movement Banknifty intra-day movement
8,000
8,100
8,200
8,300
09:15 11:20 13:25 15:30
17,400
17,600
17,800
09:15 11:20 13:25 15:30
Sectoral movement
(4)
0
4
8
IT
Pharma
Auto
Bank
FMCG
Metal
Infra
Realty
Energy
% chg 1d % chg 5d

Corporate & Economy snippets
Corporate snippets
CLP Group has forayed into the Indian solar energy market by acquiring 49% stake in Suzlon Energy’s 100 mw project in Telangana. (ET)
Zydus Healthcare, a subsidiary of Cadila Healthcare has acquired two abbreviated new drug applications (ANDAs) from Teva Pharmaceutical in the US for an undisclosed sum. (ET)
Gayatri Projects has made inroads into the construction of airports by bagging a Rs7bn contract as part of the larger Navi Mumbai International Airport from the City and Industrial Development Corporation of Maharashtra (CIDCO). (BL)
Zee Entertainment Enterprises has announced an agreement with its Dish TV and Sling TV to further strengthen its presence in the US Territory. (BL)
Eros International Media has acquired 50% stake in Puja Entertainment & Films for an undisclosed amount. (BL)
Nestle India is embarking on a product offensive, launching up to 25 products across various categories to fend off 'disruptive competition' from new rivals like Patanjali. (ET)
Himachal Futuristic Communications (HFCL) has bagged an advance purchase order of Rs12.45bn from BSNL to build a dense wavelength division multiplexing (DWDM) based optical transmission backbone network for the armed forces within 18 months. (ET)
Essar Steel (ESIL) has introduced bullet proof steel and become the first dedicated Indian company with this specialised steel. (BS)
Mahindra First Choice Services (MFCS), a wholly-owned subsidiary of Mahindra and Mahindra, plans to take the number of its service outlets to 400 this financial year at an investment of about Rs3.50bn. (BS)
Competition Commission of India (CCI) has cleared private equity major Blackstone's multi-billion dollar deal to buy over 50% stake in Mphasis from HP Enterprise. (BS)
Economy snippets
The government announced relaxed foreign direct investment (FDI) norms in single brand retail, civil aviation, airports, pharmaceuticals, animal husbandry and food products. (BS)
The government allowed 100% Foreign Direct Investment (FDI) in trading of food products, including through e-commerce, to boost food processing sector in the country.
June 23: Referendum on Britain leaving the EU (Brexit)
June 28: US Q1 GDP
June 30: UK Q1 GDP, China June Manufacturing PMI
June 25th-30th: India Eight core data
July 1: India June Nikkei Markit Manufacturing PMI, German PMI
Upcoming events

Technicals
The strength of every market is judged on corrections. Monday's recovery after gap-down opening suggests that this market continues to be in a buy on dips phase. Despite a weak start, it managed to defend mid-point of gann channel. In fact, since last week's trade, the same has acted as a strong support for the index. Going ahead, we expect Nifty to continueMonday's momentum and attempt gann hurdle of 8281 and break above previous peak of 8295. Even though, Nifty formed a long white candle on Monday, multiple overhead hurdles placed between 8270-8300 and uncertainty of the outcome of Brexit still prevails. So, fresh longs should be created only once earlier top is surpassed. Ratio chart of NSE Pharma /Nifty index provides a fascinating insight. It has reversed after taking support of its 200-WMA. Reversal is also seen on the weekly RSI, suggesting pharma stocks could be in action in the near term. Leaders Laggards
Company CMP (Rs)
52‐wk high
Deviation % Company
CMP (Rs)
52‐wk Low
Deviation %
ACC 1,570 1,574 (0.2) Infratel 341 331 (2.8) Tata Motors 482 484 (0.4) Alembic Ph. 528 513 (3.0)
Power Grid 157 158 (0.8) Castrol 374 361 (3.6)
Petronet 287 290 (0.9) Glaxo. Cons. 5,647 5,405 (4.3) Yes Bank 1,075 1,085 (0.9) Britannia 2,622 2,505 (4.5)
* Based on deviation of 5% from 52‐week high/low
Proximity to 20-DMA Proximity to 50-DMA
Company CMP (Rs)
20‐DMA
Deviation % Company
CMP (Rs)
50‐DMA
Deviation %
BHEL 124 122 2.0 Hero Moto 3,046 2,990 1.9 Jubi Food. 1,071 1,051 1.9 HUL 879 864 1.8 JSW Steel 1,402 1,379 1.7 TTK Prest 4,570 4,493 1.7 Tech M 544 536 1.6 Relinfra 545 536 1.7 Shree Cem 13,711 13,495 1.6 M&M 1,351 1,329 1.7
* Based on deviation from moving averages
High delivery stocks Low delivery stocks
Company %
Delivery CMP (Rs) %chg Company
% Delivery
CMP (Rs) %chg
United Spirits 87.4 2,450 0.0 Adani Ent 14.9 80 1.2 Cummins 86.2 800 0.0 Rel Capital 15.0 402 1.6 P&G 86.0 6,256 (0.0) Synd. Bank 15.3 72 0.9 Persistent Sys 78.1 692 0.9 Wockhardt 15.4 896 1.3 Hcl Tech 78.0 771 2.3 Just Dial 15.7 662 (0.1)
Spurt in volumes
Company (mn) Day's Vol. 2‐week Avg. Vol 10‐DMA CMP (Rs) % chg
RCOM 26 18 48 49 3.2 Ashok Leyland 13 10 104 100 1.0 Axis Bank 11 8 532 522 (0.8) Bob 10 8 149 152 0.7 ICICI Bank 16 15 247 238 (0.1)
Index Pivot Index Last close Support Pivot Resistance Nifty 8,239 8,149 8,197 8,286 Sensex 26,867 26,581 26,733 27,019 Nifty Bank 17,719 17,503 17,641 17,856 Nifty IT 11,507 11,336 11,427 11,598
Intra-day advance decline Sectoral trend
250
350
450
550
650
750
850
950
09:15 11:20 13:25 15:30
Advance Decline
3.52.5
1.81.21.1
1.00.4
‐0.3‐0.3‐0.3‐0.4
(2.0) 0.0 2.0 4.0
RealtyMetal
ITEnergyInfraAutoFMCG
PharmaMedia
Fin ServicesBank
(%)
* Calculations based on 10‐DMA

Derivatives
Index snapshot
Futures % Chg Spot Basis Next
Month OI in shs OI % Chg PCR OI PCR Vol ATM IV's Rollovers Max call build‐up
Max put build‐up
Nifty 8,252 0.9 8,239 13.40 8,280 233,043 2.4 1.15 0.90 15.9 12.9% 8,300 8,000 Bank Nifty 17,728 0.2 17,719 9.75 17,805 59,732 18.6 1.09 0.95 28.5 6.5% 18,000 17,000 Smart comeback after initial hiccups on index, Nifty ended up near its
upper trading band of 8250-8300 hurdle zone.
Global cues remained supportive, awaiting Brexit outcome later this week.
Options front, massive build-up seen at 8100/8200 puts ~10lacs shrs added, while call writers seen shifting positions from 8300 call to 8400 calls.
FII’s data surprised as with 1% gains on index, FII’s created short index futures positions to tune of ~18k contracts, index futures long to short ratio down to 3.44x from 5.41x.
Nifty open interest distribution
0.01.02.03.04.05.06.07.08.09.0
7600
7700
7800
7900
8000
8100
8200
8300
8400
8500
8600
8700
8800
8900
(mn) Call Put
Securities in ban period: CEATLTD, IBREALEST, JPASSOCIAT
Futures open interest gainers Scrip OI (lacs) % OI Chg CMP (Rs) % Chg Action UPL 89 10.1 572 0.6 Long Build up BEML 17 7.9 873 3.9 Long Build up Torntpharm 2 7.4 1,347 (0.3) Short Build up Havells 58 7.1 363 1.3 Long Build up Godrejind 15 5.9 371 4.7 Long Build up Abirlanuvo 13 5.4 1,039 (0.1) Short Build up SUNTV 61 5.4 373 0.4 Long Build up
Futures open interest losers Scrip OI (lacs) % OI Chg CMP (Rs) % Chg Action Jetairways 51 (14.3) 587 6.3 Short Covering Amarajabat 7 (9.9) 862 (0.4) Long Unwinding Ibrealest 312 (9.0) 98 (1.3) Long Unwinding Southbank 330 (7.3) 20 0.3 Short Covering CANBK 148 (7.3) 209 3.4 Short Covering Jpassociat 1,866 (6.9) 8 (0.6) Long Unwinding ALBK 125 (6.6) 60 2.7 Short Covering
FIIs Index future positions Participant-wise mkt positions
Long78%
Short22%
Client47%
DII7%
FII29%
Pro17%

Fixed Income
The bond markets tried to parse out the consequences of the decision of the RBI governor to not go in for a second term and opened on a negative note. However, the situation calmed down on expectations of an able successor being chosen soon by the government. The 10-year benchmark yield almost reached the 7.55% mark in opening trade; it saw strong buying at end and closed the session at 7.49% vs.7.50%.The total traded volume of Gsec stood comparatively higher at ~Rs.471bn. The demand at the fixed Repo window was Rs.32.37bn, whereas the supply at the fixed Reverse Repo window came in at Rs.44.91bn. The OMO purchase operation received offers totalling Rs.459.22bn against the notified amount of Rs.100bn .The Government of India has announced the sale (re-issue) of four dated securities on June 24, 2016 and the auctions will be conducted using the multiple price method. Call WAR closed at 6.30% vs. 6.38%. The benchmark five-year OIS and one-year OIS inched northward, with the five-year OIS closing at 6.81% vs. previous day's close of 6.78%; the one-year OIS closed at 6.69% vs. previous day's close of 6.67%. Policy Rates (%) 20‐Jun‐16 Previous Day 1 Month Reverse Repo 6.00 6.00 6.00 Repo 6.50 6.50 6.50 CRR 4.00 4.00 4.00 SLR 21.25 21.25 21.25 Bank Rate 7.00 7.00 7.00
CBLO Yield curve
6.1
6.2
6.3
6.4
6.5
6.6
6.7
23‐M
ay25
‐May
30‐M
ay1‐Jun
3‐Jun
7‐Jun
9‐Jun
14‐Ju
n16
‐Jun
20‐Ju
n
(%)
5.5
6.0
6.5
7.0
7.5
8.0
1 Yr
2 Yr
3 Yr
5 Yr
10 Yr
12 Yr
15 Yr
30 Yr
(%) Yield curve OIS
Source: Bloomberg, IIFL Wealth Research
Liquidity Indicators (RS mn) 20‐Jun‐16 Previous Day 1 Month Govt Securities 471,583 319,611 456,473 Call Money 101,140 109,520 123,810 CBLO 901,751 843,059 846,857 Repo Fixed (Over night) 32,370 30,200 140,130
Certificate of Deposit (%) 20‐Jun‐16 Previous Day 1 Month 3‐Month 7.03 7.20 7.30 6‐Month 7.23 7.25 7.35 9‐Month 7.35 7.20 7.32 12‐Month 7.48 7.50 7.52
G‐Sec Yield (%) 20‐Jun‐16 Previous Day 1 Month 1‐Year 7.03 7.01 7.05 3‐Year 7.18 7.19 7.24 5‐Year 7.45 7.44 7.46 10‐Year 7.49 7.50 7.48
AAA Corporate Bonds 20‐Jun‐16 Previous Day 1 Month 1‐Year 7.81 7.75 7.81 3‐Year 8.01 7.93 8.01 5‐Year 8.07 8.03 8.06 10‐Year 8.27 8.28 8.21
Daily Rates (%) 20‐Jun‐16 Previous Day Change MIBOR 6.44 6.50 (0.06) CALL 6.30 6.38 (0.08) CBLO 6.23 6.51 (0.28)
Commercial Papers (%) 20‐Jun‐16 Previous Day 1 Month 3‐Month 7.84 7.83 7.99 6‐Month 8.16 8.12 8.18 9‐Month 8.22 8.20 8.24 12‐Month 8.29 8.29 8.31
Tbill Rates (%) 20‐Jun‐16 Previous Day 1 Month 91 Days 6.65 6.60 6.63 182 Days 6.85 6.88 6.90 364 Days 6.91 6.91 6.94

Commodities & Currencies
Commodities Gold prices are hovering around the vicinity of US$1,300/oz, as the complex seem to have lost the short term impetus on account of shift in the sentiment on Brexit. Although the polls indicate a neck to neck situation, there is a growing perception that Britain may opt to remain within EU. However, gold prices still remain underpinned by healthy inflows in gold ETFs, with the latest SPDR gold holdings reported at 909 tons, up by more than 260 tons since the onset of this year. US Fed Chief Janet Yellen’s two day testimony (today & tomorrow) to the Senate will also gain attention where she is expected to speak on the health of economy and its implications for the monetary policy. We infer that there is nothing much to read from it, as too much communication from the central banks these days is simply disguising investors. Fed still remains indecisive and we will not be surprised to see the central bank doing a U-turn on the process of policy normalisation in the months ahead. In Europe, Germany’s top court ruling on the legitimacy of ECB’s monetary/ asset purchases today can also have a bearing on the broader markets.
LME base metals moved higher, underpinned by reports of some strength in Chinese real estate markets. 50 of 70 Chinese cities experienced price rise during the May, collectively rising 7% on yoy basis. On fundamental front, ILZSG reported that global refined zinc market was in surplus by 24,000 tons during the first four months of 2016. Zinc mine production declined 8.1% (yoy), while refined metal production is off by 3.4%. It seems supply side situation remains tight, while demand is hit by gloomy Chinese economic landscape.
Crude oil prices are trading on a firm note, notwithstanding the fact that US rig counts have been increasing for the consecutive 3 weeks. Moreover, Canadian output is expected to be restored to normalcy soon after a forest fire hit the country’s oil producing region last month.
FX British Pound is garnering strong momentum, in light of an ever changing perception on Brexit. The currency markets now seem to be betting big on the ‘Remain vote’.
Commodities (in US$ terms)
Last Price
% chg 1d
% chg ytd Currencies
Last price
% chg 1d
% chg ytd
Gold (troy oz) 1,289 (0.1) 21.5 USD/INR 67.32 (0.3) (1.7) Silver (troy oz) 17.5 0.2 26.6 EUR/INR 76.27 (1.0) (5.4) Copper (ton) 4,633 (0.2) (1.5) GBP/INR 98.53 (2.7) (0.5) Aluminium (ton) 1,632 (0.1) 8.3 JPY/INR 0.65 (0.3) (14.8) Zinc (ton) 2,014 0.2 25.2 EUR/USD 1.13 0.2 4.4 Lead (ton) 1,722 (0.0) (4.0) GBP/USD 1.47 (0.3) (0.6) Nickel (ton) 9,295 0.1 5.4 USD/JPY 104.05 (0.1) 15.5 WTI Crude (bbl) 49.1 (0.5) 32.6 USD/CNY 6.57 0.1 (1.2) Br. Crude (bbl) 50.3 (0.6) 35.0 USD/Real 3.39 0.6 16.7 NG (mmBtu) 2.7 (0.3) 17.2 USD Index 93.53 (0.1) (5.2)
Commodity Dynamics Latest Week ago 1m ago 6m ago 1yr ago SPDR Gold ETF (tons) 909 896 869 649 702 iShares Silver ETF (mn oz) 334 340 336 322 328 LME Cu Stocks ('000 tons) 194 208 156 232 318 LME Al Stocks ('000 tons) 2,441 2,469 2,561 2,937 3,637 LME Zn Stocks ('000 tons) 397 380 387 490 469 LME Pb Stocks ('000 tons) 186 186 180 179 173 LME Ni Stocks ('000 tons) 386 394 405 439 459 US Crude stocks (mn bbl) 532 532 540 486 468 US Oil Rig Count 337 328 318 524 631
Commodity v/s Currency Speculative positions on CME
9092949698100102
150
160
170
180
190
200
Dec‐15
Jan‐16
Feb‐16
Mar‐16
Apr‐16
May‐16
CRB Index (LHS)
Dollar Index (RHS)
‐100
0
100
200
300
Dec‐15
Jan‐16
Feb‐16
Mar‐16
Apr‐16
May‐16
('000 lots)Gold SilverCopper Crude
June 21, 2016 25 years of reforms in India A Silver Jubilee of Silver linings
Macro Economics
In the 25 years since the 1991 epoch-making wave of liberalization, wonderful things have happened to India which would have been unthinkable otherwise. Under the able stewardship of Prime minster Modi, India is all set to embark on yet another wave of reforms, this time to become the most sought after destination for the world markets. Dr. Manmohan Singh’s budget speech of 1991 was no less epoch-making than Pandit Jawaharlal Nehru’s midnight speech on the eve of India’s independence for India’s tryst with economic independence got a fresh lease of life on that historic day. After breaking the shackles of a protectionist regime, which was more a product of nationalistic resolve to stand out on its own than any steadfast belief in five-year plan model, India has never looked back since. In the passage of 25 years, wonderful things happened to India which would have been unthinkable otherwise. The sheer significance of India's resurgence – as scripted by Prime minister and Finance minister Dr. Singh – can be gauged from the dismal state of the country at the time which was reeling in the effect of meager foreign exchange reserves, mortgaged gold and an intimidating BoP crisis. It took great courage and conviction to go ahead with contentious decisions like rupee devaluation and an astonishingly liberal trade policy amidst heated debate by their detractors. Thanks to the dynamic duo, license raj disappeared into thin air, monopoly turned into a cuss word and FDI become a buzz word, almost in a flash. Indian industry – particularly telecom, IT and retail looked up and consequently India’s growth rate picked up. The country became the hotbed of opportunities – both as a market and a manufacturing base. Most importantly, Indian IT scripted success stories of many a humble start-up that became conglomerates within no time. From 1991 till date, Indian economy has grown at an impressive pace, and our GDP has touched more than $2 trillion at current prices. Today, India is still in need of a fresh wave of reforms but the backdrop has changed.
Given the faltering developed economies of today, India faces a herculean task of convincing top-notch foreign players to pick up huge stakes on Indian soil. And Prime Minister Modi has done an exemplary job to this effect. Modi’s demonstrated action to increase accountability, arresting corruption, stimulating private entrepreneurship is also yielding results although we need a longer time frame to judge the potency of this progression. When the Narendra Modi government regime began in May 2014, investors were quite upbeat about India’s growth going forward. Although the economic outlook has been far from bright given a host of factors like global slowdown and a year of poor monsoon among others, the Modi government has done a credible job to register a decent growth rate besides making crucial budgetary provisions for the revival of domestic demand. Despite the stressed government finances in the wake of Finance Commission and seventh pay commission recommendations, the FM didn’t compromise on fiscal prudence and yet managed to deliver a Budget focused on economic growth. The resolve to reduce revenue deficit from 2.8% to 2.5% was also laudable. This was a reassuring gesture to build faith in India’s economic stability of India in the wake of global turmoil. There was a lot of thought behind the nine pillars of the transformative agenda focused on inclusive growth with employment generation, building of social and physical infrastructure and taking forward the reforms agenda. Some announcements like e-market for agricultural produce, modernization of land records were indeed innovative. Not all is hunky dory of course – social equity in India is still a distant dream. India is placed 130th in the global ease of doing business out of 189 countries which is still a dismal rank despite the progress of a few notches in recent times and the rather jingoistic resolve to move to higher position in record time. Agriculture, infrastructure and power still grapple with plaguing issues. Banking NPA is the new demon since 2008-09. Notwithstanding the 2016 budget provisions, health care is yet deprived

25 years of reforms in India: A Silver Jubilee of Silver linings
of high-impact spends - whether in terms of infrastructure development, better access to health care services or significant insurance coverage. ‘Make in India’, Skill Development and ‘Start up Stand up India’ have the biggest role to play in improving health care facilities & infrastructure as also stimulate action in key areas including manufacture of active pharma ingredients. The government should provide as many fiscal and tax incentives to build traction in this low-key space. Going forward, India has enough positives to help it move up the value chain from here on: it is the world’s fastest growing economy; better placed than most emerging markets. We have a favorable fiscal position and current account status and a few concrete positives like demographic dividend, mature financial markets and regulatory frameworks, productive service sector and last but not the least a largely stable central government. But it should not seek refuge in the comfort of its comparative edge over other emerging markets. Rather, it should rather go all out to ensure massive capital inflows, build world-class infrastructure and enact fair and equitable land and labour laws. It should aggressively pass key bills to boost growth prospects and fire on all cylinders to remove the perplexity with respect to its reforms – allocations being made for transport and power but not enough boost to private sector, the protracted parliamentary debate over landmark bills and the state-centre conflicts rooted in political differences. The current government definitely has the intention and wherewithal to do what it takes. In the hope, lies the scope for the next 25 years. The hope as of now can be best regarded as India’s horoscope.

Analyst: Rahul Jain, Ankit Tikmany
GPT Infraprojects Ltd. Building bridges of growth
June 21, 2016
Management Meet
We met Mr. Atul Tantia, Executive Director of GPT Infraprojects Ltd. (GPT) an Infrastructure company based out of Kolkata (India) to derive insights about the company. The company is engaged in the execution of civil and infrastructure projects and manufacturing of concrete sleeper for Railways. The manufacturing units of the company are located at Panagarh (Dist. Burdwan, West Bengal, India), Ladysmith (KZN, South Africa), and Tsumeb (Namibia). GPT clocked a meagre 1% and 6.3% revenue and PAT CAGR over FY13-16 respectively. The company is well placed to benefit from increased infrastructure and railway spending by the government. Further, upcoming DFC contracts and increase in potential of underdeveloped nations in Africa will lead to strong order flows in the future. Backed by strong global footprint in its concrete sleeper business, the company is well geared to tap new international markets. Strong business model coupled with strong manufacturing capabilities Over the years, GPT created a strong business model. It carries out activities starting from design of the track super structure to manufacturing of concrete sleepers. The company derives its revenue from two business segments: infrastructure and concrete sleeper. It figures among India’s major concrete sleeper manufacturers for railway tracks and is a renowned name in bridge construction. It has the largest single location sleeper manufacturing unit with a capacity of 480,000 units. The company supplies concrete sleepers to the Indian Railways, IRCON, RITES, SAIL, NTPC, Tata Steel, and DVC. The company has a global presence and caters to clients in Bangladesh, Sri Lanka, South Africa, Mozambique, Namibia, Myanmar, and Ghana.
Stock performance
1M 3M 1Y Absolute return (%) 9.6 16.8 149.9
20
100
180
260
Jun‐15 Oct‐15 Feb‐16 May‐16
GPT SENSEX
CMP (Rs) 247 Not rated
Stock data Sector: Construction & Engineering
Sensex: 26,866 Bloomberg code: GPT IN 52 Week h/l (Rs): 278 / 90 BSE code: 533761 Market cap (Rs mn) : 3,600 NSE code: ‐ Enterprise value (Rs mn): 5,481 FV (Rs): 10 6m Avg t/o (Rs mn): 0.01 Div yield (%): 0.8 Prices as on June 20, 2016
Company rating grid Low High 1 2 3 4 5 Earnings Growth Cash Flow B/S Strength Valuation appeal Risk
Shareholding pattern (%) Promoter 74.8 FII+DII 0.2 Others 25.0
Financial summary Y/e 31 Mar (Rs m) FY12 FY13 FY14 FY15 FY16 Revenues 4,228 4,831 4,528 3,898 5,021 yoy growth (%) ‐ 14.3 (6.3) (13.9) 28.8 OPM (%) 14 13 12.9 15.1 13.5 Reported PAT 154 96 50 41 123 yoy growth (%) ‐ (37.4) (47.7) (18.5) 199.2 EPS (Rs) 10.7 6.7 3.5 2.9 8.6 P/E (x) 23.0 36.8 70.3 86.2 28.8 Price/Book (x) 2.4 2.3 2.2 2.2 2.1 EV/EBITDA (x) 8.6 8.9 9.8 9.5 8.1 Debt/Equity (x) 1.2 1.4 1.5 1.4 1.3 RoE (%) 10.5 6.1 3.2 2.5 7.5
Source: Company, IIFL Wealth Research

GPT Infraprojects Ltd.
Order book to see significant expansion as infrastructure activity gathers momentum GPT experienced a significant increase in its order book in FY16 because of increased activity in the infrastructure space. As of March 2016, the company has an order backlog of Rs.16,500 mn, of which, infrastructure constitutes 75%. In FY16, the company received a major order worth Rs.2,465 mn from GMR Infrastructure Ltd. to supply of 1.45 mn sleepers under the Eastern Dedicated Freight Corridor Contract (World Bank funded). Table 1: Top orders
Project Description Segment Client Order Value (Rs mn)
Supply of Heavy Haul Concrete Sleepers Concrete Sleepers GMR
Infrastructure 2,465
Approach bridge for Burdwan ROB
Railways Track &bridges RVNL 1,143
ROB Flyover between Sankrail and Santragachi Stations
Railways Track &bridges
South Eastern Railway 1,133
Bridge over Katakhali, Hasnabad
Roads & Roads bridges
West Bengal PWD 813
Fabrication, Erection of Bridge in Manipur
Railways Steel Bridges
Northeast Frontier Railway 801
Construction of Intake Well for Raghunathpur Power Plant
Industrial DVC 641
Source: Company, IIFL Wealth Research GPT’s strong order booking is set to continue in both the segments, as the company is well placed to benefit from increased capital allocation towards infrastructure and railways by the government; the government has plans to invest ~Rs.65,810 mn in the construction of 917 RUBs and ROBs, which would substitute 3,438 railway crossings during the next five years. Additionally, the construction of 350 Bridges and ROBs on highways and rehabilitation of old operational steel girder bridges
provide an opportunity for GPT. Further, the Ministry of Railways has committed to build ~2,800 km Dedicated Freight Corridor (DFC) by 2022, which will lead to increased opportunities for GPT, as it is well placed to bag orders for the supply of concrete sleepers and construction of bridges, RUBs, and ROBs. On the international front, demand for transportation and infrastructure is on the rise in underdeveloped nations in Africa. In Africa, the requirement for effective and integrated logistics is on the rise. This stems from an underlying need to handle a global supply chain. Moreover, there is a need for new urban transport systems in metro cities, and increased mining is necessitating the presence of high-capacity rail infrastructures. GPT is one of the three suppliers in South Africa and a sole supplier in Namibia. Therefore, given its strong positioning in the region, we envisage robust order inflows in the future. Table 2: Railways capex plan (FY 16-20) to support GPT’s growth
Plan Rs. bn Network decongestion (including DFC, electrification, doubling) 1,993 Network expansion (including electrification) 1,930 National projects (Northeastern & Kashmir connectivity projects) 390 Safety (track renewal, bridge works, ROB, RUB and signaling & telecom) 1,270 Rolling stocks (locomotives, coaches, wagons – production & maintenance) 1,020 Station redevelopment and logistic parks 1,000 Passenger amenities, High speed rail & elevated corridor, IT and Other 957 Total 8,560
Source: Company, IIFL Wealth Research

GPT Infraprojects Ltd.
Chart 1: Share of Infrastructure business segment rising; contract sleepers to grow on the back of various opportunities
Source: Company, IIFL Wealth Research Policy to participate only in high-margin orders GPT’s revenue declined in FY14 and FY15 by 6% and 14% respectively. In this context, the management commented that GPT has a policy of bidding only for high-margin orders, i.e., orders with a margin of 14% and higher. During FY14 and FY15, the infrastructure sector had fewer orders, which created unhealthy competition among its peer group. However, GPT held its own and continued with its policy of minimum hurdle rate of 14%, below which it would not participate, thereby sacrificing on topline to ensure healthy balance sheet and margins. The management has said that it will continue with its policy of minimum hurdle rate in the future. Growth trajectory to continue GPT registered an exceptional performance in FY16, wherein revenue came in at Rs.5,021 mn, which is an increase of ~29% yoy, driven by strong order inflows. The management guided revenue to clock a similar strike rate to that achieved in FY16 over the next three to four years on the back of strong order inflows. Increase in allocation towards infrastructure and railways by the government, upcoming DFC contracts, and potential in underdeveloped nations in Africa will pave way for strong order flows. GPT reported ~82% revenue (76% a year ago) from the
infrastructure segment, whereas concrete sleepers accounted for the rest. Geographically, India accounts for ~88% of the total revenue. Chart 2: India forms major part of revenue pie followed by South Africa and Namibia (FY16)
Source: Company, IIFL Wealth Research In FY16, EBIDTA margins contracted ~160bps yoy to 13.5%. The management pinned this down to foreign currency translation loss of Rs.35 mn, as foreign countries where the company operated experienced depreciation vis-à-vis INR. The management has guided that the company will not bid or participate in low-margin orders and orders that have a high working capital cycle and thus could have a healthy balance sheet. EBITDA margin stood at 12.9% and 15.1% during FY14 and FY15 respectively. The management aims to achieve an EBITDA margin of 15% in FY17. Finance charges as a proportion of revenue fell from 10% of the revenue to 8% in FY16. The management believes that it will reduce further by another 150 bps yoy in FY17, owing to reduction in debt, interest-free mobilization advance, and expected reduction in interest rates by banks. The company had stretched its working capital cycle of 240 days in FY15, which improved to 169 days in FY16. This stemmed from higher execution and faster recoveries. In FY17, the management envisages
0
1,000
2,000
3,000
4,000
5,000
FY12 FY13 FY14 FY15 FY16
Infrastructure Concrete sleepers & Allied
88%
9% 3%
India
South Africa
Namibia
GPT Infraprojects Ltd.
further improvement to 150 days backed by faster payments and increased fund allocation to the railways. Management’s general industry observations and comments Although GOI has increased its focus on infrastructure in India, if the
government shifts its focus from infrastructure to more populist measures, it could hurt company’s revenues significantly.
Payment cycle and decision making has improved at railway’s end,
resulting in better working capital for companies such as GPT infra. Following the recent CDR and SDR cases, the thinking of banks has
undergone a sea change in regards to companies in the infrastructure space. This situation has made it difficult for growing infrastructure companies to get guarantees and working capital assistance from banks.
Banks must not paint them all with the same brush. They should
differentiate among Infra companies and should not club them together. Infrastructure has lots of segments such as power, steel, and ports. Classification of infrastructure sector is key. GPT intends to be an asset creator and not an owner and it does not see itself venturing into the BOT model either.

GPT Infraprojects Ltd.
Financials Balance sheet Y/e 31 Mar (Rs m) FY12 FY13 FY14 FY15 FY16 Equity capital 143 143 143 143 143 Reserves 1,320 1,427 1,460 1,480 1,522 Net worth 1,463 1,570 1,604 1,623 1,665 Other LT Liabilities ‐ 1 ‐ 219 209 LT provision. 11 18 22 13 18 Minority interest 33 41 46 40 42 Borrowing 1,761 2,181 2,347 2,269 2,246 Deferred tax liab (net) 63 66 64 56 76 Total liabilities 3,331 3,877 4,083 4,222 4,256
Fixed assets 1,286 1,239 1,412 1,318 1,168 Intangible assets 34 34 34 34 34 Other Non‐current Asset 152 194 205 765 730 Net working capital 1,690 2,172 2,256 1,918 2,015 Current Assets Inventories 753 966 754 700 727 Sundry debtors 1,143 1,096 886 727 827 Other current assets 1,121 1,627 1,992 2,017 2,069 ST. Loans & advances 239 486 613 341 334 Cash 171 238 177 188 308 Current Liabilities Sundry creditors (979) (1,257) (1,266) (1,115) (1,221) Other current liabilities (532) (712) (702) (733) (708) Provision (54) (34) (22) (20) (12) Total assets 3,331 3,877 4,083 4,222 4,256
Income statement Y/e 31 Mar (Rs m) FY12 FY13 FY14 FY15 FY16 Revenue 4,228 4,831 4,528 3,898 5,021 Operating profit 598 617 586 590 680 Depreciation & Amortization (146) (187) (202) (198) (191) PBIT 452 430 384 392 490 Interest expense (259) (303) (329) (355) (386) Other income 64 22 22 22 96 Profit before tax 257 148 77 59 200 Taxes (76) (45) (14) (17) (72) Minorities (27) (7) (13) (1) (5) Reported profit 154 96 50 41 123
Cash flow Y/e 31 Mar (Rs m) FY12 FY13 FY14 FY15 FY16 Cash flow from operation Profit before tax 257 148 77 59 200 Depreciation 146 187 202 198 191 Tax paid (76) (45) (14) (17) (72) Working capital ∆ (384) (482) (84) 338 (98) Operating cashflow (57) (191) 181 577 221 Cash flow from Investing Activities Capital expenditure (446) (140) (374) (104) (41) Change in other non curr assets 55 (42) (11) (559) 35 Free cash flow (448) (374) (205) (86) 214 Cash flow from Financing activities Equity raised 174 28 0 (21) (48) Debt financing/disposal 268 420 166 (78) (23) Dividends paid (25) (17) (17) ‐ (34) Other items (0) 11 (6) 196 10 Net ∆ in cash (31) 68 (62) 11 120
Ratio analysis

GPT Infraprojects Ltd.
Y/e 31 Mar (Rs m) FY12 FY13 FY14 FY15 FY16 Growth matrix (%) Revenue growth 14.3 (6.3) (13.9) 28.8 Op profit growth 3.1 (5.0) 0.7 15.3 EBIT growth (12.5) (10.0) 1.9 41.5 PBT growth (42.3) (47.8) (24.3) 241.1 EPS growth (37.4) (47.7) (18.5) 199.2
Profitability ratios (%) OPM 14.1 12.8 12.9 15.1 13.5 EBIT margin 12.2 9.3 9.0 10.6 11.7 Net profit margin 3.6 2.0 1.1 1.1 2.4 RoCE 15.5 11.6 10.2 10.0 13.8 RoNW 10.5 6.1 3.2 2.5 7.5 RoA 3.1 1.6 0.8 0.7 2.0
Per share ratios (Rs) EPS 10.7 6.7 3.5 2.9 8.6 Dividend per share 1.5 1.0 1.0 ‐ 2.0 Cash EPS 20.9 19.8 17.6 16.6 21.9 Book value per share 102.0 109.5 111.8 113.2 116.1
Payout (%) Dividend payout 16.5 17.7 33.8 ‐ 27.3 Tax payout 29.6 30.0 18.5 28.8 35.9
Liquidity ratios Debtor days 98.6 82.8 71.4 68.1 60.1 Inventory days 65.0 73.0 60.8 65.6 52.8 Creditor days 84.5 95.0 102.0 104.4 88.8
Leverage ratios (x) Interest coverage 2.0 1.5 1.2 1.2 1.5 Net debt / equity 1.1 1.2 1.4 1.3 1.2 Net debt / op. profit 2.9 3.5 3.7 3.5 2.8
Y/e 31 Mar (Rs m) FY12 FY13 FY14 FY15 FY16 Valuation ratios (x) P/E 23.0 36.8 70.3 86.2 28.8 P/BV 2.4 2.3 2.2 2.2 2.1 EV/EBITDA 8.6 8.9 9.8 9.5 8.1 Net Cash Equiv./Mcap (x) (0.4) (0.5) (0.6) (0.6) (0.5) Dividend Yield 0.6 0.4 0.4 ‐ 0.8 MCAP/Sales (x) 0.8 0.7 0.8 0.9 0.7
Component ratios (%) Raw material 15.5 15.6 20.6 14.5 37.3 Payment to sub‐contractors 22 27 22 18 14 Staff cost 5.5 6.2 6.6 7.3 6.7 Other operating exp 43.2 38.8 37.4 44.7 28.9
Du-Pont Analysis Y/e 31 Mar (Rs m) FY12 FY13 FY14 FY15 FY16 Tax burden (x) 0.6 0.6 0.7 0.7 0.6 Interest burden (x) 0.5 0.3 0.2 0.1 0.3 EBIT margin (x) 0.1 0.1 0.1 0.1 0.1 Asset turnover (x) 0.9 0.8 0.8 0.6 0.8 Financial leverage (x) 3.3 3.7 3.8 3.8 3.7 RoE (%) 10.5 6.1 3.2 2.5 7.5
Analyst: Rahul Jain, Ankit Tikmany
WPIL Ltd. Softening crude oil prices affect profitability
Management Meet
June 21, 2016
We
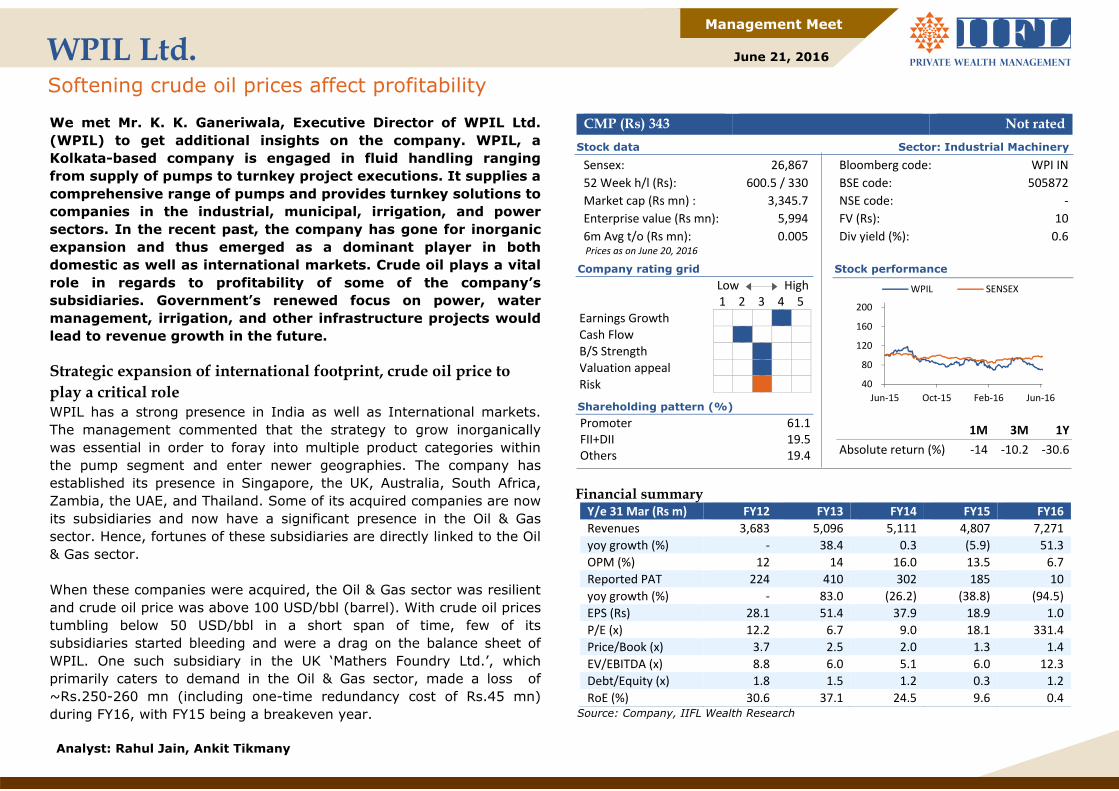
We met Mr. K. K. Ganeriwala, Executive Director of WPIL Ltd. (WPIL) to get additional insights on the company. WPIL, a Kolkata-based company is engaged in fluid handling ranging from supply of pumps to turnkey project executions. It supplies a comprehensive range of pumps and provides turnkey solutions to companies in the industrial, municipal, irrigation, and power sectors. In the recent past, the company has gone for inorganic expansion and thus emerged as a dominant player in both domestic as well as international markets. Crude oil plays a vital role in regards to profitability of some of the company’s subsidiaries. Government’s renewed focus on power, water management, irrigation, and other infrastructure projects would lead to revenue growth in the future. Strategic expansion of international footprint, crude oil price to play a critical role WPIL has a strong presence in India as well as International markets. The management commented that the strategy to grow inorganically was essential in order to foray into multiple product categories within the pump segment and enter newer geographies. The company has established its presence in Singapore, the UK, Australia, South Africa, Zambia, the UAE, and Thailand. Some of its acquired companies are now its subsidiaries and now have a significant presence in the Oil & Gas sector. Hence, fortunes of these subsidiaries are directly linked to the Oil & Gas sector. When these companies were acquired, the Oil & Gas sector was resilient and crude oil price was above 100 USD/bbl (barrel). With crude oil prices tumbling below 50 USD/bbl in a short span of time, few of its subsidiaries started bleeding and were a drag on the balance sheet of WPIL. One such subsidiary in the UK ‘Mathers Foundry Ltd.’, which primarily caters to demand in the Oil & Gas sector, made a loss of ~Rs.250-260 mn (including one-time redundancy cost of Rs.45 mn) during FY16, with FY15 being a breakeven year.
Stock performance
1M 3M 1Y Absolute return (%) ‐14 ‐10.2 ‐30.6
40
80
120
160
200
Jun‐15 Oct‐15 Feb‐16 Jun‐16
WPIL SENSEX
CMP (Rs) 343 Not rated
Stock data Sector: Industrial Machinery
Sensex: 26,867 Bloomberg code: WPI IN 52 Week h/l (Rs): 600.5 / 330 BSE code: 505872 Market cap (Rs mn) : 3,345.7 NSE code: ‐ Enterprise value (Rs mn): 5,994 FV (Rs): 10 6m Avg t/o (Rs mn): 0.005 Div yield (%): 0.6 Prices as on June 20, 2016
Company rating grid Low High 1 2 3 4 5 Earnings Growth Cash Flow B/S Strength Valuation appeal Risk
Shareholding pattern (%) Promoter 61.1 FII+DII 19.5 Others 19.4
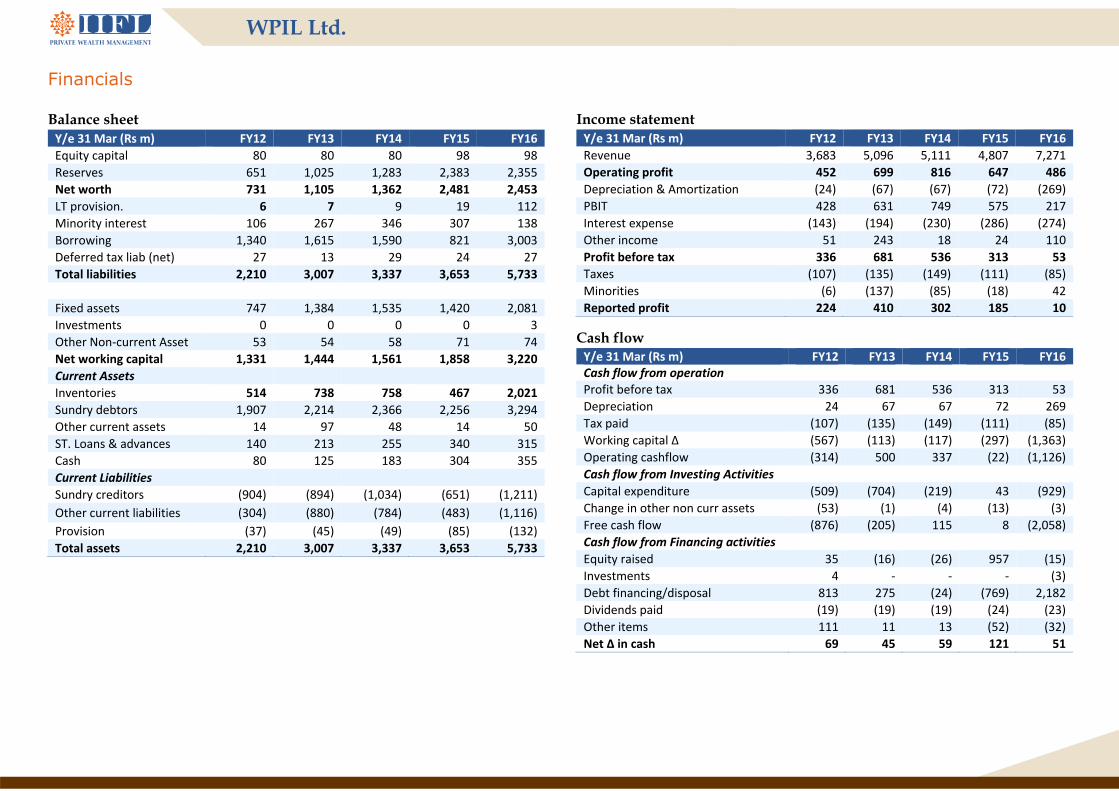
Financial summary Y/e 31 Mar (Rs m) FY12 FY13 FY14 FY15 FY16 Revenues 3,683 5,096 5,111 4,807 7,271 yoy growth (%) ‐ 38.4 0.3 (5.9) 51.3 OPM (%) 12 14 16.0 13.5 6.7 Reported PAT 224 410 302 185 10 yoy growth (%) ‐ 83.0 (26.2) (38.8) (94.5) EPS (Rs) 28.1 51.4 37.9 18.9 1.0 P/E (x) 12.2 6.7 9.0 18.1 331.4 Price/Book (x) 3.7 2.5 2.0 1.3 1.4 EV/EBITDA (x) 8.8 6.0 5.1 6.0 12.3 Debt/Equity (x) 1.8 1.5 1.2 0.3 1.2 RoE (%) 30.6 37.1 24.5 9.6 0.4
Source: Company, IIFL Wealth Research

WPIL Ltd.
The management believes that if crude oil prices were to stabilize above 50 USD/bbl, performance might start improving gradually. However, if the price settles close to 30 USD/bbl, it will be a double jolt for the company, since Oil & Gas producing companies will not go for new rigs that require pumps as a key component. Further, countries that are largely dependent on revenues from the sector may see a sudden dip in their fiscal revenues and hence, might stop major oil pipeline projects and other civil projects that require pumps as a component. Hence, the management might have to evolve a whole new strategy to counter the crisis that ensues from these developments. Government’s increased focus on key sectors to boost order book WPIL had a weak overall performance in FY16, owing to a weak economic environment. Backed by Government’s renewed focus on power, water management, irrigation, and other infrastructure projects, order flow gathered momentum during Q4 FY16 and was better compared with Q4 FY15. The management expects FY17 to end on a strong note. As of now, the management has ~Rs.7,500 mn order book in its kitty, which is divided into three divisions. Traditional or standard pumps that take six to nine months of
execution (Rs.800 mn). Engineered pumps that take 12-24 months of execution, depending
upon the size of order and the engineering design or R&D requirement to design the product (Rs.1,750 mn).
Pump-based projects are projects that take more than two years of
execution. The company only participates in projects that have at least 30-35% pump-based activity (a significant part of the project) and the success of the project depends on the pumps, which is WPIL’s forte. In large projects that are beyond WPIL’s control, i.e., where pump-based activity is less than 30%, success of the project would hinge on factors other than pumps. (Rs.4,800- Rs.4,900 mn)
Significant increase in cost led to deterioration of profits WPIL clocked a robust revenue 18.5% CAGR over FY12-16. EBIDTA margin contracted significantly from the levels of 16% in FY14 to 6.7% in FY16, owing to significant increase in staff and other operating expenses. Moreover, big jump of 272% in depreciation in FY16 led to a drop in profit levels of Rs.10 mn in FY16 compared with Rs.410 mn in FY13. WPIL has a stretched working capital cycle of about seven months in India and about two to three months in international markets. Retention money forms a major part of debt, i.e., about 50%. The company receives this retention money after the performance warranty period of 12-18 months and the actual commercial commissioning of the project; there is significant time lag between trial commissioning and commercial commissioning. Ideally, it could be 12-15% of the total contract value awarded to WPIL. Such portions constitute a major part of trade receivables. However, bad debts are negligible. The management envisages a similar revenue breakup to that in the past, with equal contribution from segments, including irrigation, municipality, power, and others. This proportion could change if there is government focus increases on one of these segments or if the segment face a liquidity crunch or perform poorly. In a given point of time, some sectors may have 5-7% diversion. However, the management ensures that no sector accounts for more than 40% of the order book to mitigate concentration risks in a particular sector.

WPIL Ltd.
Growth drivers Governments renewed focus on power, irrigation, water management
and other infra projects would enable the company to surpass its all-time high turnover of Rs.3,010 mn in FY12 in India. The management envisages a turnover of Rs.3,300-3,500 mn by the end of FY18.
In the UK, subsidiary companies that depend on the Oil & Gas sector
and companies in South Africa and Australia, which depend on commodities are expected to do well. The company believes that both crude and other commodities have bottomed out, which should boost subsidiary companies’ top-line. If crude price stays above 50 USD/bbl and if other commodity prices remain stable, the company envisages a consolidated turnover of Rs.11,000-11,500 mn with EBITDA margin of 9.5-10%.
To meet the growing demand for engineered pumps, WPIL has set up
a facility at Nagpur, centrally located in India. This leads to ease in transportation for the company. To make pumps, steel casting is essential and one of the group companies has a steel casting plant that is located adjacent to WPIL plant in Nagpur. This ensures sustained, quality, timely and reliable supply of casting pumps to WPIL.
WPIL Ltd.
Financials Balance sheet Y/e 31 Mar (Rs m) FY12 FY13 FY14 FY15 FY16 Equity capital 80 80 80 98 98 Reserves 651 1,025 1,283 2,383 2,355 Net worth 731 1,105 1,362 2,481 2,453 LT provision. 6 7 9 19 112 Minority interest 106 267 346 307 138 Borrowing 1,340 1,615 1,590 821 3,003 Deferred tax liab (net) 27 13 29 24 27 Total liabilities 2,210 3,007 3,337 3,653 5,733
Fixed assets 747 1,384 1,535 1,420 2,081 Investments 0 0 0 0 3 Other Non‐current Asset 53 54 58 71 74 Net working capital 1,331 1,444 1,561 1,858 3,220 Current Assets Inventories 514 738 758 467 2,021 Sundry debtors 1,907 2,214 2,366 2,256 3,294 Other current assets 14 97 48 14 50 ST. Loans & advances 140 213 255 340 315 Cash 80 125 183 304 355 Current Liabilities Sundry creditors (904) (894) (1,034) (651) (1,211) Other current liabilities (304) (880) (784) (483) (1,116) Provision (37) (45) (49) (85) (132) Total assets 2,210 3,007 3,337 3,653 5,733
Income statement Y/e 31 Mar (Rs m) FY12 FY13 FY14 FY15 FY16 Revenue 3,683 5,096 5,111 4,807 7,271 Operating profit 452 699 816 647 486 Depreciation & Amortization (24) (67) (67) (72) (269) PBIT 428 631 749 575 217 Interest expense (143) (194) (230) (286) (274) Other income 51 243 18 24 110 Profit before tax 336 681 536 313 53 Taxes (107) (135) (149) (111) (85) Minorities (6) (137) (85) (18) 42 Reported profit 224 410 302 185 10
Cash flow Y/e 31 Mar (Rs m) FY12 FY13 FY14 FY15 FY16 Cash flow from operation Profit before tax 336 681 536 313 53 Depreciation 24 67 67 72 269 Tax paid (107) (135) (149) (111) (85) Working capital ∆ (567) (113) (117) (297) (1,363) Operating cashflow (314) 500 337 (22) (1,126) Cash flow from Investing Activities Capital expenditure (509) (704) (219) 43 (929) Change in other non curr assets (53) (1) (4) (13) (3) Free cash flow (876) (205) 115 8 (2,058) Cash flow from Financing activities Equity raised 35 (16) (26) 957 (15) Investments 4 ‐ ‐ ‐ (3) Debt financing/disposal 813 275 (24) (769) 2,182 Dividends paid (19) (19) (19) (24) (23) Other items 111 11 13 (52) (32) Net ∆ in cash 69 45 59 121 51

WPIL Ltd.
Ratio analysis Y/e 31 Mar (Rs m) FY12 FY13 FY14 FY15 FY16 Growth matrix (%) Revenue growth 67.8 38.4 0.3 (5.9) 51.3 Op profit growth 58.3 54.6 16.8 (20.7) (24.9) EBIT growth 75.0 82.6 (12.4) (21.8) (45.4) PBT growth 45.6 102.7 (21.3) (41.5) (83.0) EPS growth 42.2 83.0 (26.2) (50.1) (94.5)
Profitability ratios (%) OPM 12.3 13.7 16.0 13.5 6.7 EBIT margin 13.0 17.2 15.0 12.5 4.5 Net profit margin 6.1 8.0 5.9 3.8 0.1 RoCE 21.7 29.1 24.2 17.1 7.0 RoNW 30.6 37.1 24.5 9.6 0.4 RoA 6.5 8.5 6.0 3.7 0.2
Per share ratios (Rs) EPS 28.1 51.4 37.9 18.9 1.0 Dividend per share 2.0 2.0 2.0 2.0 2.0 Cash EPS 31.1 59.9 46.4 26.3 28.5 Book value per share 91.7 138.7 171.0 254.0 251.2
Payout (%) Dividend payout 8.3 4.6 6.2 12.7 226.4 Tax payout 31.7 19.8 27.9 35.3 160.1
Liquidity ratios Debtor days 189.1 158.6 169.0 171.3 165.4 Inventory days 51.0 52.9 54.2 35.5 101.5 Creditor days 89.6 64.0 73.8 49.4 60.8
Leverage ratios (x) Interest coverage 3.3 4.5 3.3 2.1 1.2 Net debt / equity 1.7 1.3 1.0 0.2 1.1 Net debt / op. profit 3.0 2.3 1.7 0.8 5.5
Y/e 31 Mar (Rs m) FY12 FY13 FY14 FY15 FY16 Valuation ratios (x) P/E 12.2 6.7 9.0 18.1 331.4 P/BV 3.7 2.5 2.0 1.3 1.4 EV/EBITDA 8.8 6.0 5.1 6.0 12.3 Net Cash Equiv./Mcap (x) (0.5) (0.5) (0.5) (0.2) (0.8) Dividend Yield 0.6 0.6 0.6 0.6 0.6 MCAP/Sales (x) 0.7 0.5 0.5 0.7 0.5
Component ratios (%) Raw material 62.9 55.8 50.5 50.7 42.1 Staff cost 9.8 15.2 16.0 17.8 28.3 Other operating exp 15.0 15.3 17.5 18.5 23.4
Du-Pont Analysis Y/e 31 Mar (Rs m) FY12 FY13 FY14 FY15 FY16 Tax burden (x) 0.7 0.6 0.6 0.6 0.2 Interest burden (x) 0.7 0.8 0.7 0.5 0.2 EBIT margin (x) 0.1 0.2 0.1 0.1 0.0 Asset turnover (x) 1.1 1.1 1.0 1.0 1.1 Financial leverage (x) 4.7 4.4 4.1 2.6 2.6 RoE (%) 30.6 37.1 24.5 9.6 0.4

ABOUT IIFL Wealth Management Limited IIFL Wealth Management Limited (hereinafter referred as IIFLW), a Company incorporated under Companies Act, 1956, is registered with SEBI as Portfolio Manager and as a Stock Broker. IIFLW is also registered with AMFI as a distributor of mutual funds. IIFLW provides wealth management services to various HNI / Ultra HNI clients and inter alia distributes various securities and financial products, including mutual funds, alternative investment funds, debentures and structured products. IIFLW has made necessary application for registering itself as a Depository Participant. Contact Details ‐ Corporate Office – IIFLW Centre, Kamala City, Senapati Bapat Marg, Lower Parel, Mumbai – 400013, Regd. Office – IIFLW House, Sun Infotech Park, Road No. 16V, Plot No. B‐23, MIDC, Thane Industrial Area, Wagle Estate, Thane – 400604 Tel: (91‐22) 3958 5600. Fax: (91‐22) 4646 4706 E‐mail: [email protected] Website: www.iiflw.com Registration Details ‐ 1] CIN No.: U74140MH2008PLC177884; 2] SEBI PMS Regn. No INP000002676: 3] National Stock Exchange of India Ltd. SEBI Regn. No. : INZ000011437, Bombay Stock Exchange Ltd. SEBI Regn. No.: INZ000011437 4] AMFI Regn No. : 59563 Terms & Conditions and Other Disclosures with respect to Research Report:‐ a) This research report (“Report”) is for the personal information of the authorised recipient(s) and is not for public distribution and should not be reproduced or redistributed to any other person or in any form without
IIFLW’s prior permission. The information provided in the Report is from publicly available data, which IIFLW believes, is reliable. While reasonable endeavors have been made to present reliable data in the Report so far as it relates to current and historical information, but IIFLW does not guarantee the accuracy or completeness of the data in the Report. Accordingly, IIFLW or any of its connected persons including its directors or subsidiaries or associates or employees shall not be in any way responsible for any loss or damage that may arise to any person from any inadvertent error in the information contained, views and opinions expressed in this publication;
b) Past performance should not be taken as an indication or guarantee of future performance, and no representation or warranty, express or implied, is made regarding future performance. Information, opinions and estimates contained in this report reflect a judgment of its original date of publication by IIFLW and are subject to change without notice. The price, value of and income from any of the securities or financial instruments mentioned in this report can fall as well as rise. The value of securities and financial instruments is subject to exchange rate fluctuation that may have a positive or adverse effect on the price or income of such securities or financial instruments.
c) The Report also includes analysis and views of our research team. The Report is purely for information purposes and does not construe to be investment recommendation/advice or an offer or solicitation of an offer to buy/sell any securities. The opinions expressed in the Report are our current opinions as of the date of the Report and may be subject to change from time to time without notice. IIFLW or any persons connected with it do not accept any liability arising from the use of this document.
d) Investors should not solely rely on the information contained in this Report and must make investment decisions based on their own investment objectives, judgment, risk profile and financial position. The recipients of this Report may take professional advice before acting on this information.
e) IIFLW has other business segments / divisions with independent research teams separated by 'chinese walls' catering to different sets of customers having varying objectives, risk profiles, investment horizon, etc. and therefore, may at times have, different and contrary views on stocks, sectors and markets.
f) This report is not directed or intended for distribution to, or use by, any person or entity who is a citizen or resident of or located in any locality, state, country or other jurisdiction, where such distribution, publication, availability or use would be contrary to local law, regulation or which would subject IIFLW and its affiliates to any registration or licensing requirement within such jurisdiction. The securities described herein may or may not be eligible for sale in all jurisdictions or to certain category of investors. Persons in whose possession this Report may come are required to inform themselves of and to observe such restrictions.
g) As IIFLW along with its subsidiaries and associates, are engaged in various financial services business and so might have financial, business or other interests in other entities including the subject company/ies mentioned in this Report. However, IIFLW encourages independence in preparation of research report and strives to minimize conflict in preparation of research report. IIFLW and its associates did not receive any compensation or other benefits from the subject company/ies mentioned in the Report or from a third party in connection with preparation of the Report. Accordingly, IIFLW and its associates do not have any material conflict of interest at the time of publication of this Report.
h) As IIFLW and its associates are engaged in various financial services business, it might have:‐
(a) received any compensation (except in connection with the preparation of this Report) from the subject company in the past twelve months; (b) managed or co‐managed public offering of securities for the subject company in the past twelve months; (c) received any compensation for investment banking or merchant banking or brokerage services from the subject company in the past twelve months; (d) received any compensation for products or services other than investment banking or merchant banking or brokerage services from the subject company in the past twelve months; (e) engaged in market making activity for the subject company ; IIFLW and its associates collectively do not own (in their proprietary position) 1% or more of the equity securities of the subject company/ies mentioned in the report as of the last day of the month preceding the publication of the research report and does not have material conflict of interest at time of publication of the research report;

i) The Research Analyst/s engaged in preparation of this Report or his/her dependent relative;
(a) does not have any financial interests in the subject company/ies mentioned in this report; (b) does not own 1% or more of the equity securities of the subject company mentioned in the report as of the last day of the month preceding the publication of the research report; (c) does not have any other material conflict of interest at the time of publication of the research report.
j) The Research Analyst/s engaged in preparation of this Report:‐
(a) has not received any compensation from the subject company in the past twelve months; (b) has not managed or co‐managed public offering of securities for the subject company in the past twelve months; (c) has not received any compensation for investment banking or merchant banking or brokerage services from the subject company in the past twelve months; (d) has not received any compensation for products or services other than investment banking or merchant banking or brokerage services from the subject company in the past twelve months; (e) has not received any compensation or other benefits from the subject company or third party in connection with the research report; (f) has not served as an officer, director or employee of the subject company; (g) is not engaged in market making activity for the subject company.
We submit that no material disciplinary action has been taken on IIFLW by any regulatory authority impacting Equity Research Analysis. A graph of daily closing prices of securities is available at http://www.nseindia.com/ChartApp/install/charts/mainpage.jsp, www.bseindia.com and http://economictimes.indiatimes.com/markets/stocks/stock‐quotes. (Choose a company from the list on the browser and select the “three years” period in the price chart).
For Research related queries, write to: Amar Ambani, Head of Research at [email protected].