nigeria - states fiscal transparency, accountability and...
TRANSCRIPT

DOCUMENT OF
THE WORLD BANK
FOR OFFICIAL USE ONLY
REPORT NO: 126872-NG
INTERNATIONAL DEVELOPMENT ASSOCIATION
PROGRAM APPRAISAL DOCUMENT
ON A
PROPOSED CREDIT
IN THE AMOUNT OF SDR 521.6 MILLION
(US$750 MILLION EQUIVALENT)
TO THE
FEDERAL REPUBLIC OF NIGERIA
FOR A
STATES FISCAL TRANSPARENCY, ACCOUNTABILITY AND SUSTAINABILITY
PROGRAM FOR RESULTS
June 1, 2018
Governance Global Practice
Macroeconomics, Trade and Investment
Africa Region
This document has a restricted distribution and may be used by recipients only in the performance of their official duties. Its contents may not otherwise be disclosed without World Bank authorization.

CURRENCY EQUIVALENTS
(Exchange Rate Effective April 30, 2018)Currency Unit = Nigerian Naira
US$1 = NGN 305US$1 = SDR 0.69538128
ABBREVIATIONS AND ACRONYMS
AGF Accountant General of the FederationAPA Annual Performance AssessmentAuGF Auditor General of the FederationBSF Budget Support FacilityBVN Bank Verification NumberCAS Country Assistance StrategyCB Capacity BuildingCBN Central Bank of NigeriaCPS Country Partnership StrategyCSO Civil Service OrganizationDA Designated AccountDfID Department for International DevelopmentDLI Disbursement-linked IndicatorDLR Disbursement-linked ResultDMO Debt Management OfficeDPF Development Policy FinancingEIA Environmental Impact AssessmentERGP Economic Recovery and Growth PlanESSA Environmental and Social Management System AssessmentEU European UnionFAAC Federal Account Allocation CommitteeFCT Federal Capital TerritoryFGN Federal Government of NigeriaFIRS Federal Inland Revenue ServiceFM Financial ManagementFMoF Federal Ministry of FinanceFRA Fiscal Responsibility ActFRL Fiscal Responsibility LawsFSP Fiscal Sustainability PlanFX Foreign ExchangeFY Fiscal YearGDP Gross Domestic ProductGFS Government Finance StatisticsGRM Grievance Redress MechanismGRS Grievance Redress ServiceHFD Home Finance DepartmentIBRD International Bank for Reconstruction and DevelopmentIDA International Development AssociationIERD International Economic Relation DepartmentIFSA Integrated Fiduciary Systems Assessment
ii

IGR Internally Generated RevenuesIPSAS International Public Sector Accounting StandardsIVA Independent Verification AgentJRM Joint Review MissionJTB Joint Tax BoardKRA Key Result AreaM&E Monitoring and EvaluationMDA Ministries, Departments and AgenciesMTEF Medium-term Expenditure FrameworkNAP National Action PlanNEC National Economic CouncilNGF Nigeria Governors ForumNSC National Steering CommitteeOBI Open Budget IndexOGP Open Government PartnershipPAD Program Appraisal DocumentPAP Program Action PlanPCU Program Coordination UnitPDO Program Development ObjectivePEA Political Economy AnalysisPERL Partnership to Engage, Reform and LearnPFM Public Financial ManagementPforR Program for ResultsPOM Program Operations ManualPPSD Project Procurement Strategy for DevelopmentPSIN Public Service Institute of NigeriaSBIR State Bureaus of Internal RevenueSFTAS States Fiscal Transparency, Accountability and SustainabilitySOML Saving One Million LivesTA Technical AssistanceTF Trust FundTSA Treasury Single AccountUNCAC United Nations Convention Against CorruptionVAT Value Added TaxWBG Word Bank GroupAGF Accountant General of the Federation
Regional Vice President:Global Practice Vice President:
Makhtar DiopJan Walliser
Country Director:Practice Managers
Rachid BenmessaoudHisham Ahmed Waly, Francisco Galrao Carneiro
Task Team Leaders: Yue Man Lee, Rama Krishnan Venkateswaran
iii

Federal Republic of Nigeria
States Fiscal Transparency, Accountability and Sustainability Program for Results
Contents
I. STRATEGIC CONTEXT........................................................................................................................................ 1
A. Country Context..................................................................................................................................................1
B. Sectoral and Institutional Context.......................................................................................................................2
C. Relationship to the CAS/CPF................................................................................................................................6
D. Rationale for Use of Instrument..........................................................................................................................7
II. PROGRAM DESCRIPTION................................................................................................................................. 8
A. Government Program.........................................................................................................................................8
B. SFTAS PforR (“The Program”) Program Development Objective and Key Results..............................................10
C. Program Scope and Components......................................................................................................................14
D. Disbursement Linked Indicators and Verification Protocols..............................................................................22
E. Performance-based Financing Component: Allocation across KRAs and States..............................................27
F. Capacity Building and Institutional Strengthening.............................................................................................29
III. PROGRAM IMPLEMENTATION...................................................................................................................... 31
A. Institutional and Implementation Arrangements..............................................................................................31
B. Results Monitoring and Evaluation...................................................................................................................33
C. Disbursement Arrangements.............................................................................................................................34
IV. ASSESSMENT SUMMARY.............................................................................................................................. 35
A. Technical (including program economic evaluation).........................................................................................35
B. Fiduciary............................................................................................................................................................37
C. Environmental and Social..................................................................................................................................38
D. Risk Assessment................................................................................................................................................39
E. Program Action Plan..........................................................................................................................................40
Annex 1: Detailed Program Description............................................................................................................. 40
Annex 2: Results Framework Matrix.................................................................................................................. 40
Annex 3: Disbursement Linked Indicators, Verification Protocols and Bank Disbursement Table........................40
iv

Annex 4: Summary Technical Assessment.......................................................................................................... 40
Annex 5: Fiduciary Systems Assessment............................................................................................................ 40
Annex 6: Summary Environmental and Social Systems Assessment...................................................................40
Annex 7: Systematic Operations Risk Rating (SORT)...........................................................................................40
Annex 8: Program Action Plan........................................................................................................................... 40
Annex 9: Implementation Support Plan............................................................................................................. 40
Annex 10: Technical Assistance Component Project (IPF) for SFTAS (US$50 Million)...........................................40
v
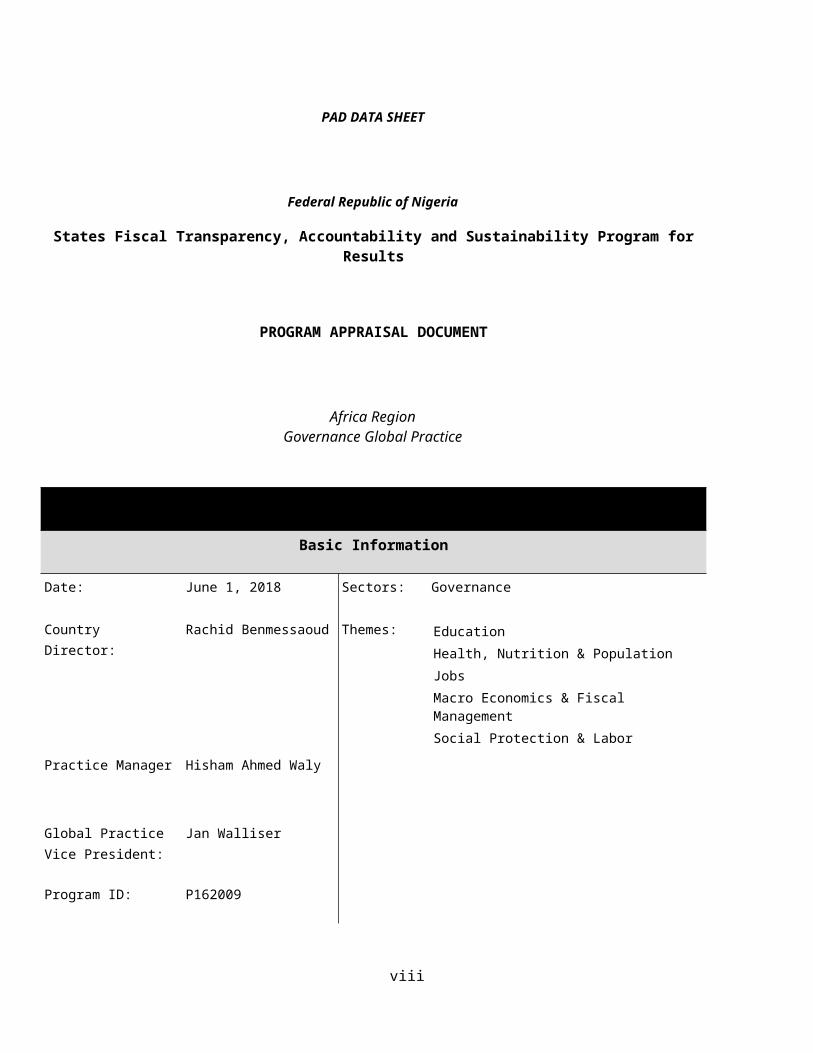
PAD DATA SHEET
.
Federal Republic of Nigeria
States Fiscal Transparency, Accountability and Sustainability Program for Results
PROGRAM APPRAISAL DOCUMENT
.
Africa RegionGovernance Global Practice
.
Basic Information
Date: June 1, 2018 Sectors: Governance
Country Director: Rachid Benmessaoud Themes: Education Health, Nutrition & Population Jobs Macro Economics & Fiscal Management Social Protection & Labor
Practice Manager
Global Practice Vice President:
Hisham Ahmed Waly
Jan Walliser
Program ID: P162009
Team Leader(s): Yue Man Lee, Rama Krishnan Venkateswaran
Program Implementation Period:
Start Date: Jun-27-2018 End Date: Dec-30-2022
vi

Expected Financing Effectiveness Date:
Expected Financing Closing Date:
Oct-1-2018
Dec-30-2022
.
Program Financing Data
[ ] Loan [ ] Grant [
] Other
[ X ] Credit
For Loans/Credits/Others (US$M):
Total Program Cost: 750.00 Total Bank Financing: 750.00
Total Financing: 0.00 Financing Gap: 0.00
.
Financing Source Amount
BORROWER/RECIPIENT 0.00
IBRD 0.00
IDA: 750.00
Others 0.00
Financing Gap 0.00
Total 750.00
.
Borrower: Federal Republic of Nigeria
Responsible Agency: Federal Ministry of Finance
vii
Contact: Mr. Aliyu Ahmed Title: Director, IERD
Telephone No.: +2348055231816 Email: [email protected]
.
Expected Disbursements (in US$ Million)
Fiscal Year FY19 FY20 FY21 FY22 FY23
Annual 140.6 191.0 220.0 194.4 4.0
Cumulative 140.6 331.6 551.6 746.0 750.0
.
Program Development Objective(s)
The Program Development Objective (PDO) is to strengthen the fiscal transparency, accountability and sustainability in the participating states.
.
Compliance
Policy
Does the program depart from the CAS in content or in other significant respects?
Yes [ ] No [X]
.
Does the program require any waivers of Bank policies applicable to Program for Results operations?
Yes [ ] No [X]
Have these been approved by Bank management? Yes [ ] No [ ]
Is approval for any policy waiver sought from the Board? Yes [ ] No [X]
Overall Risk Rating: Substantial
Legal Covenants
viii

The Recipient shall cause each Participating State to establish, not later than 2 months after the Effective Date, a State Steering Committee to be responsible for monitoring Program implementation progress, approving state annual actions plans and other functions as further detailed in the Operations Manual, and assign two focal points, one for the Program and one for the Project (Schedule 2, Section I.A.1).
The Recipient shall, through AuGF and an external audit firm to be engaged by the Recipient not later than two (2) months after the Effective Date, under terms of reference acceptable to the Association, and with the assistance of the DMO on debt-related DLI/DLRs: (i) carry out annual performance assessments to determine the compliance with the eligibility criteria as stipulated in paragraph 3 of this Section C below; and achievement or the extent of the achievement of DLI/DLRs by the Participating States after having met said eligibility criteria; and (ii) prepare and provide verifications reports in accordance with the Verification Protocol, certifying the compliance with said eligibility criteria and the achievement of the DLRs; and (iii) furnish the verification reports to the Association in such scope and in such details as the Association shall request (Schedule 2, Section I.C.2(a)).
The Recipient shall ensure that each Participating State should not be eligible for receiving financing under the Program for meeting any of the DLIs/DLRs set out in Section IV of Schedule 2 to this Agreement if said DLIs/DLRs shall have been financed by other resources of financing (Schedule 2, Section I.C.3(b)).
The Recipient shall not later than 2 (two) months before starting each FY, furnish the draft AWPB to the Association for its review, and promptly thereafter finalize the AWPB, taking into account the Association’s comments thereon (Schedule 2, Section I, D.1(b)).
The Recipient shall furnish to the Association each Program Report not later than one month after the end of each calendar semester, covering the calendar semester. Without limitation on the foregoing, the Recipient shall furnish any other reports as further detailed in the Operations Manual (Schedule 2, Section III).
Legal Conditions
Effectiveness Conditions:
The Recipient has adopted the Operations Manual in accordance with the provisions of paragraph 1(a) of Section I.B of Schedule 2 to the Financing Agreement (Article V.5.01(a)).
The Recipient through FMoF has appointed the AuGF as the independent verification agent to verify the achievements of DLIs/DLRs under the Program (Article V.5.01(b)).
The Recipient has established the Program Coordination Unit with terms of reference, resources and staffing in adequate numbers, including a Program manager, a financial management specialist and a procurement specialist (Article V.5.01(c)).
Withdrawal Conditions:
Without limitation upon the provisions of Article II of the General Conditions and in accordance with the Disbursement and Financial Information Letter, the Recipient may withdraw the proceeds of the Financing to: (a) finance Program Expenditures, on the basis of the results (“Disbursement Linked Results” or “DLRs”) achieved by the Participating States, as measured against specific indicators (“Disbursement Linked Indicators” or “DLIs”) in the amount allocated against Categories 1 through 9; and (b) with respect to the Project, finance Eligible Expenditures in the amount allocated and, if applicable, up to the percentage set forth against Category 10, all as set forth in the table in paragraph 2 of this Section IV.A (Schedule 2, Section IV.A.1).
The Recipient shall ensure that each Participating State shall not be eligible for receiving financing under the Program in a given FY unless and until the Recipient through the AuGF has furnished evidence satisfactory to the Association that the
ix

Participating State has complied with the annual eligibility criteria for that FY as set out in the table in the Annex to Schedule 2 (Schedule 2, Section I.C.3.(a)).
Notwithstanding the provisions of Part A of this Section, no withdrawal shall be made: (a) for any DLR, until and unless the Recipient through the AuGF has furnished evidence satisfactory to the Association that said DLR has been achieved; and (b) for payments under Category (10) until and unless, for the purpose of implementing Part 2(a) of the Project, the Recipient has engaged a Project management firm in accordance with the provisions of paragraph 4 of Section I.C of Schedule 2 to the Financing Agreement (Schedule 2, Section IV.B.1 (a) and (b)).
Notwithstanding the provisions of Part B.1(a) of this Section, if any of the DLRs set out in the table in Section IV of this Schedule 2 has not been achieved by the date by which the said DLR is set to be achieved, the Association may, by notice to the Recipient: (a) reallocate all or a portion of the proceeds of the Financing then allocated to said DLR to any other DLR; and/or (b) cancel all or a portion of the proceeds of the Financing then allocated to said DLR (Schedule 2, Section IV.B.2).
With respect to Category (10), no withdrawal shall be made for payments made in respect of the Project prior to the Signature Date (Schedule 2, Section IV.C).
Team Composition
Bank Staff
Name Role Specialization Unit
Yue Man Lee Team Leader (ADM Responsible) Senior Economist GMTA01
Rama Krishnan Venkateswaran Team Leader Lead Financial Management Specialist GGOAS
Ismaila B. Ceesay Team Member Practice Manager GGOAS
Bayo Awosemusi Procurement Specialist (ADM Responsible)
Lead Procurement Specialist GGOPA
Adebayo Adeniyi Procurement Specialist Senior Procurement Specialist GGOPA
Daniel Kajang Procurement Specialist Senior Procurement Specialist GGOPA
Akinrinmola Oyenuga Akinyele Financial Management Specialist Senior Financial Management Specialist
GGOAS
Aleksandar Kocevski Team Member Operations Officer GGOAS
x

Museme Munira Issa Team Member Senior Public Sector Specialist GGOAE
John Paul Ngebeh Team Member Senior Operations Officer GGOAS
Helen Ogochukwu Okeke Team Member Operations Analyst GGOAS
Amos Abu Environmental Safeguards Specialist
Senior Environmental Specialist GEN07
Taiwo Olukayode Social Safeguards Specialist Senior Social Development Specialist GSU20
Sona Varma Team Member Lead Economist GMTMN
Gloria Aitalohi Joseph-Raji Team Member Senior Economist GMTA01
Emilija Timmis Team Member Economist GMTA01
Ikechukwu John Azubike Nweje Team Member Senior Public Sector Specialist GGOAS
Stephen R. Davenport Team Member Senior Governance Specialist GGOPG
Rachel Lemay Ort Team Member Public Sector Specialist GGOAS
George Ferreira Da Silva Team Member Finance Officer WFALA
Beth Anne Hoffman Operations Analyst Legal Analyst LEGAM
Alex Woodhouse Turingan Program Assistant Legal Assistant LEGAM
Mei Wang Country Lawyer Senior Counsel LEGAM
Chinwe A. Ukpong-Bassey Program Assistant Program Assistant AFCW2
Ifeoma Clementina Ikenye Team Assistant Team Assistant AFCW2
xi

I. STRATEGIC CONTEXT
A. Country Context1. The 2015 elections marked, for the first time in Nigeria’s history, a peaceful democratic transfer of power between two political parties, but the new administration faced a fast-deteriorating macroeconomic environment. Gross Domestic Product (GDP) growth fell from 6.3 percent in 2014 to 2.7 percent in 2015, and to negative 1.6 percent in 2016, bringing Nigeria’s first full-year of recession in 25 years. In 2016, global oil prices reached a 13-year low and oil production was severely constrained by vandalism and militant attacks in the Niger Delta. While the oil sector represents only 8.3 percent of total GDP, it provides the majority of foreign exchange (FX) earnings and three-quarters of government revenues. The decline in FX earnings from oil exports, compounded by the Central Bank of Nigeria’s (CBN) introduction of several FX allocation/utilization rules that restricted access to FX at the official market rate, had significant negative spillover effects on non-oil sectors dependent on FX to import inputs and raw materials.
2. Fiscal revenues at all levels of government were severely hit by the decline in oil revenues. Total government revenues declined to 5.9 percent of GDP in 2016 - the decline would have been less if oil revenues were converted at a higher FX rate than the official rate. Although recurrent spending was rationalized and capital budgets were under-executed, the consolidated government fiscal deficit widened from 1.2 percent in 2014 to 3.9 percent of GDP in 2016. While the total public debt-to-GDP ratio remained low (17.3 percent of GDP), interest payments-to-revenue ratio1 for the Federal Government of Nigeria (FGN) increased to 61 percent in 2016.
Table 1: Selected Economic Indicators, 2014-20182014 2015 2016 2017 e 2018 f
Real GDP growth, at constant market prices (percent) 6.3 2.7 -1.6 0.8 2.1
Private consumption (percent) 0.6 1.5 -5.7 -0.8 0.6
Government consumption (percent) -7.0 -11.9 -15.1 1.9 19.5
Gross fixed capital investment (percent) 13.4 -1.3 -5.0 0.9 1.2
Exports, goods, and services (percent) 24.1 0.1 11.5 1.0 6.0
Imports, goods, and services (percent) 6.0 -25.7 -10.4 -11.6 14.8
Real GDP growth, at constant factor prices (percent) 6.2 2.8 -1.6 0.8 2.1
Agriculture (percent) 4.3 3.7 4.1 3.4 3.5
Industry (including oil) (percent) 6.8 -2.2 -8.9 2.2 3.8
Services (percent) 6.8 4.8 -0.8 -0.9 0.8
1 Differs from FGN's figures due to the World Bank excluding financing items considered revenue by FGN.
1

2014 2015 2016 2017 e 2018 f
Inflation (Consumer Price Index) (percent) 8.1 9.0 15.7 16.5 14.5
Fiscal balance (consolidated government, percent of GDP)
-1.2 -3.2 -3.9 -4.4 -4.0
Government Revenue 10.3 7.5 5.9 6.2 7.3
Government Expenditure 11.5 10.7 9.8 10.7 11.3
Debt (consolidated government, percent of GDP) 12.5 14.2 17.3 19.1 20.4
Poverty rate (US$1.9/day purchasing power parity terms)
46.8 46.8 48.4 49.2 49.3
Poverty rate (US$3.1/day purchasing power parity terms)
72.9 72.9 73.9 74.6 74.7
Source: NBS and World Bank staff projections. Notes: 2017 estimated and 2018 forecast
3. The Nigerian economy emerged from recession with GDP growth of 0.8 percent in 2017. The recovery was driven by higher oil prices and production. Agriculture and non-oil industry grew by 3.4 percent and 0.6 percent, respectively. However, services, which account for over half of GDP, continued to contract (-0.9 percent). There is substantial underemployment in addition to unemployment, quantified at 21.2 and 18.8 percent respectively in the third quarter (Q3) of 2017. Inflation remained sticky at just below 16 percent, despite monetary tightening from the CBN. The parallel exchange rate premium vis-à-vis the official exchange rate remained stable at just under 20 percent. Total government revenues performed below expectations as oil revenues remained below pre-crisis levels and non-oil revenues largely stagnated as a share of GDP, leading to a larger than planned general government fiscal deficit of 4.4 percent.
4. The recovery is expected to be slow, largely oil driven, and thus susceptible to oil production disruptions and oil price shocks. Real GDP growth is estimated to reach just over 2 percent in 2018 in the World Bank’s baseline growth scenario. Oil production is expected to remain above 2 mb/d in the medium term, but below the government’s projections. Output growth in the agricultural sector is expected to remain positive but below its potential due to ongoing conflicts between herdsmen and farmers. Non-oil industry and services are expected to grow only slowly due to subdued consumer and investment demand. Fiscal sector outcomes will be subject to considerable uncertainty and the need for fiscal adjustment at all levels of government remains.
5. The government launched the national Economic Recovery and Growth Plan (ERGP) for the period 2017-2020 in March 2017. The ERGP sets out to restore macroeconomic stability in the short-term and to undertake structural reforms, infrastructure investments and social sector programs to diversify the economy and set it on a path of sustained inclusive growth over the medium- to long-term. The ERGP has the ambitious target of 7 percent real GDP growth by 2020, initially driven by the oil sector and then increasingly by strong non-
2

oil sector growth. To increase growth above the baseline of 2 percent will require effective implementation of the structural reforms in the ERGP and a strengthened macroeconomic and fiscal framework. This in turn requires strong policy coordination between the federal and subnational governments (states and local governments).
B. Sectoral and Institutional Context6. Fiscal management occurs at all three tiers of government: federal, 36 state governments and Federal Capital Territory (FCT)2, and 774 local governments. The fiscal federalism framework in Nigeria consists of expenditure responsibilities and tax assignments, inter-governmental fiscal transfers, and a fiscal policy framework that seeks to ensure overall macroeconomic stability. Most of the fiscal revenues, including oil and gas and the key non-oil taxes (corporate income tax, excises), are collected by FGN into the federation account to be subsequently shared with different tiers of government as statutory transfers by the Federal Account Allocation Committee (FAAC) according to a formula. Value Added Tax (VAT) is collected by both FGN and the states, but pooled and distributed by FACC to the different tiers of government according to a formula. Revenues collected and maintained by the states3 - known as internally generated revenues (IGR) – represented on average 22 percent of total revenues accruing to all states (16 percent excluding Lagos4 and FCT) between 2011 and 2017. State governments account on average for 37 percent of total government expenditure, while receiving about 41 percent of total revenues, and states hold a quarter of total public debt.
7. The overall fiscal sector in Nigeria is characterized by persistently low level of domestic revenue mobilization, severely limiting the level of public expenditure. Nigeria’s revenue to GDP ratio was already one of the lowest globally and has further declined with the collapse of oil revenues to 6 percent of GDP. As a result, total government expenditure is only 10 percent of GDP, which is less than half of structural or regional peers, and does not allow the government to adequately finance core public services or key public infrastructure investments. While Nigeria’s public debt stock is low by international levels, it’s growing due to the widening of fiscal deficits since 2014 and debt servicing is becoming an issue due to the low revenues.
8. Individual states are provided with a high degree of fiscal autonomy under the country’s Constitution. The fiscal federalism framework does little to compel states to be fiscally transparent and accountable and exercise prudent fiscal management. States are not required to report budget outturns or how they utilize their fiscal resources to the federal government. Within states, budget implementation reports and annual audited financial statements are not published at all or are published with a significant time lag and not available to the public. The incentives to improve IGR collection have been weak in the past given the relative size of statutory transfers. As a result, states have weak tax administration capacity, many state bureaus of internal revenue (SBIR) are not sufficiently empowered, and the majority
2 FCT has a different formal status than a state, but similar fiscal functions and responsibilities; FCT’s fiscal numbers are included in the state tier of government.3 The 1999 Constitution sets out the powers to tax (legislate, collect and retain) for the FGN, states and local governments. The national Taxes and Levies Act 2004, amended in 2015, defines the types of taxes and levies that States and local governments can (but are not obliged to) collect and retain. Within this framework, states have the powers to legislate and set the policies and rates for state-level taxes (which are called internally generated revenues) and are not required to harmonize rates across states. In addition to taxes, states also collect non-taxes i.e. charges.4 Lagos revenue structure is markedly different from the other 35 states and FCT as it raises significantly higher IGR. IGR represented an average of 67 percent of total revenues to Lagos during 2011-2016.
3

of states do not have a published consolidated state revenue (IGR) tax code to provide certainty and transparency to taxpayers. Weak cash management and commitment controls have allowed large accumulation of domestic expenditure arrears (salaries, pensions and contractor payments). The fiscal deficit limits set in the Fiscal Responsibility Act (FRA) of 2007 only applies to the FGN5. To date only 22 out of 36 states have passed state-level fiscal responsibility laws (FRLs) and many of the FRLs do not set limits on state fiscal deficits6, hindering intergovernmental fiscal policy coordination.
9. There are several formal rules on public sector borrowing at the state level, but many guidelines and rules were not fully adhered to before the first financial assistance package from the FGN to the states. Key rules include the following: (1) no commercial bank borrowing without approval from the Federal Ministry of Finance (FMoF); and (2) liquidity and solvency debt thresholds where states should only be able to borrow externally and from the domestic capital markets if their debt stock to revenue ratio is less than 50 percent and their debt service to revenue ratio is less than 40 percent. However, adherence and enforcement of these guidelines was weak prior to the first financial assistance package from the FGN to the states in July 2015, with some states borrowing from commercial banks without prior approval.
10. The fiscal performance of states during 2011-2014 made them vulnerable to the macro-fiscal shocks of 2015-16. Total state revenues fell from 5.5 percent in 2011 to 4.0 percent of national GDP in 2014 as FAAC allocation (mostly oil revenue sharing) fell from 3.9 percent to 2.7 percent of GDP, while VAT and IGR stagnated at 0.4 and 0.8 percent of GDP. Total state expenditures also declined - from 5.7 percent in 2011 to 4.2 percent of GDP in 2014. The share of recurrent spending increased from 48 percent to 60 percent of total spending, driven by growth in personnel spending.
11. The collapse of oil revenues translated into significant revenue shortfalls at all tiers of government and led to a fiscal crisis at the state level during 2015-16. Total state revenue-to-GDP ratio fell from 4.0 in 2014 to 2.5 percent in 2016, leading to an increase in the fiscal deficit from 0.2 percent of GDP in 2014 to 1 percent in 2015 and 2016. Increased borrowing needs saw total state debt increase from 2.4 percent in 2014 to 4.2 percent of GDP by the end of 2016. This included domestic arrears on contractor payments pensions and salaries, which increased significantly from 660 billion Naira in 2014 to over 1 trillion Naira in 2016. Civil servants and pensioners in some states staged public protests and undertook strike actions, which impacted negatively on public service delivery. The total state debt-to-revenue ratio nearly doubled in one year to 113 percent in 2015 and increased further to 169 percent in 20167. The total state annual interest payment to revenue ratio increased from 5 percent to 10 percent.
Figure 1: Fiscal Aggregates - Total 36 States and FCT (Percent of GDP) 2011-2016 Actual, 2017 Estimate, 2018-2020 Simulations under a ‘Business as Usual’ Scenario
5 Limiting FGN deficits to 3% of national GDP6 The national fiscal policy framework sets a limit of 1 percent of national GDP for the aggregate fiscal deficits of states, which appears to have been adhered to (although 2015 and 2016 reached the limit), but do not set limits within that ceiling at the individual state level.7 At the end of 2016, the debt-to-revenue ratio for the median state was 169 percent. 10 states had ratios between 100 and 150 percent and only 5 states had ratios less than 100 percent. Every state breached the threshold of 50 percent in the subnational borrowing guidelines.
4

Figure 2: Debt Sustainability Indicators - Total 36 States and FCT (Percent) 2011-2016 Actual, 2017 Estimate, 2018-2020 Simulations under a ‘Business as Usual’ Scenario
12. The states’ fiscal crisis led to two financial assistance packages by the FGN and the development of the 22-point Fiscal Sustainability Plan (FSP). The first financial assistance package was approved in July 2015 with no conditions attached. It included restructuring of existing short-term commercial bank loans into longer-term state bonds, guaranteed by the FGN with 23 states participating, soft loans from CBN and Excess Crude Account-backed loans. As the states’ fiscal situation continued to worsen in 2016, a second package was put in place: the Budget Support Facility (BSF), which was accompanied by the FSP. Financed by special purpose government bonds sold to the private sector and guaranteed by the FGN, a total of N496 billion/US$1.63 billion was released to all states (equal amounts of N14.2 billion per state, excluding Lagos) in monthly disbursements over 12 months (June 2016 to May 2017). The BSF has been extended beyond its original end date and has provided further financing to 35 states for a total of N102 billion/US$335 million to the end of March 2018.
13. States continued to constrain their expenditure in 2017 as revenues remained below pre-2015 levels. 2017 saw total state revenues increase from higher statutory transfers as the oil sector started to recover and higher IGR, which now represents 30 percent of all state revenues (23 percent excluding Lagos). But total revenues remain below the levels of 2011-2014. States constrained expenditures, keeping spending flat in nominal terms and declining to 3.2 percent of national GDP, so that total state fiscal deficit improved slightly to 0.6 percent of GDP. The state Debt-to-GDP ratio remained stable at 4.2 percent and debt-to-revenue ratio also stabilized at 161 percent.
14. The need to strengthen state fiscal management and sustainability remains, as fiscal conditions are likely to continue to be challenging in the medium-term. Under base case assumptions of a steady economic recovery (with higher oil price and production) and assuming
5

no significant increase as a share of GDP in non-oil revenues collected federally or by the states, total state revenue is projected to increase slightly to 2.9 percent of GDP by 2018, but will remain much lower than 2011-2014 levels. Furthermore, if we assume in this scenario the following: 1) no further rationalization of state expenditures with spending at least remaining constant in real terms; and 2) no financing constraints, total state fiscal deficits would remain around 0.8 percent of GDP annually through the medium-term. This level of fiscal deficits would lead to steadily increase in total state debt stock to 4.7 percent of GDP by 2020, and the total state debt-to-revenue ratio will remain at the elevated levels of 2016-2017. A higher share of state revenues would eventually be used for debt servicing, and state expenditures will remain totally inadequate to provide essential public services and support economic development. States’ debt sustainability will continue to deteriorate and represent a source of fiscal risks for the FGN (who guarantees more than 50 percent of state debt). To avoid this scenario, states need to increase IGR, manage recurrent spending pressures, prevent arrears accumulation and strengthen debt management.
15. Weak governance across all tiers of government remains a significant challenge and is reflected in Nigeria’s low ranking among several international governance indices. Nigeria fares badly in most international benchmarking across a wide range of governance indicators8, including those related to fiscal governance. According to the Open Budget Index (OBI), which ranks Nigeria in the bottom quartile on fiscal transparency, no significant improvements have happened between 2008 to 2016. Public trust in government is one of the lowest among African countries with only 30 percent of Nigerian citizens trusting government9, this general lack of trust hampers fiscal management, in particular tax revenue mobilization. About 70 percent of Nigerian taxpayers claim that the reason they don’t pay taxes is because “people can’t see taxpayer money at work”10.
16. Strengthening anti-corruption and improving fiscal transparency and government accountability to citizens is high on the agenda of the Nigerian Government. The current administration introduced a package of governance reforms in 2015, including new anti-corruption institutional and legal reforms, transparency and social accountability initiatives under the Open Government agenda after Nigeria became a member of the Open Government Initiative in July 2016, further public financial management (PFM) reforms to strengthen fiscal discipline and accountability, reforms to strengthen statistical data collection, validation and use of statistical information to inform policy making, and civil service reforms.
C. Relationship to the CAS/CPF17. The proposed States Fiscal Transparency, Accountability and Sustainability (SFTAS) Program for Results (PforR) (“The Program”) is aligned with the Bank’s
8 Including the following: 1) Nigeria ranked 148 out of 180 countries by the Transparency International Corruption Perception Index in 2017; 2) Nigeria’s rating under the Worldwide Governance Indicator has not improved for the past ten years and even deteriorated on control of corruption while improving lately on voice and accountability; 3) Under the Ibrahim Index of African governance, Nigeria’s ranking has remained unchanged for the past ten years as well, below African average; and 4) The National Bureau of Statistics released a 2017 survey (Corruption in Nigeria. Bribery: Public Perception and Responses) according to which the two “most pressing challenges facing democracy in Nigeria” are perceived by Nigerian citizens as corruption (by 32% of respondents) and bad governance (22%)9 Afrobarometer, 2016, Violent extremism in Africa. Public opinion from the Sahel, Lake Chad, and the Horn.10 Good Governance Africa, 2017, Mainstreaming Good Governance into Nigerian Tax Reform.
6

Country Partnership Strategy (CPS) for FY2014-2017 (report number 82501-NG), as revised with the first Performance and Learning Review (PLR, report number 104616) in September 2016. The CPS was originally anchored on three pillars: (i) promoting diversified growth and job creation by reforming the power sector, enhancing agricultural productivity, and increasing access to finance; (ii) improving the quality and efficiency of social service delivery at the state level to promote social inclusion; and (iii) strengthening governance and public-sector management. With new development priorities of the Buhari administration, coupled with the progressively weakening economy, the PLR endorsed the inclusion of an additional cross-cutting/foundational cluster: Restoring Macroeconomic Resilience Cluster (CPS Cluster 4). This triggered additional Bank support in areas such as North-East recovery, economic diversification, enhancing climate resilience, safeguarding social expenditures, and improving the efficiency and effectiveness of public expenditures. A second PLR that extends the CPS period to FY2019, while maintaining the thrust of the CPS for the period FY2018 -FY 2019, is expected to be approved by the Board on June 27, 2018.
18. The proposed Program contributes to the twin goals of the World Bank Group: ending extreme poverty and promoting shared prosperity across the states in the Federation. The Program seeks to strengthen fiscal management at the state level so that states can eventually spend more and spend better to the benefit of their citizens in a transparent and fiscally sustainable manner. Public expenditure in Nigeria is extremely low; government does not have sufficient resources to deliver essential public services, especially in health and education that benefit the poor, or to make core public infrastructure investments to support growth and job creation. The Program could substantially increase the fiscal resources for productive public expenditures at the state level in the medium-term by supporting states to strengthen their domestic revenue mobilization, increase efficiency of existing expenditures and strengthen debt sustainability.
D. Rationale for Use of Instrument19. The Bank is well placed to support Nigeria’s efforts to strengthen state governments. The Bank has considerable experience working with the federal and state governments in Nigeria, on PFM and fiscal management. The Bank is also able to bring in global experience, especially from engagements in large federal countries such as Brazil and India, on issues relating to subnational fiscal management. In Nigeria, the Bank has been supporting PforRs which use federal transfers to incentivize states, including Nigeria - Program to Support Saving One Million Lives (SOML) (P146583) and the Better Education Service Delivery for All (BESDA) (P160430).
20. The World Bank has prepared similar PforR interventions targeting state-level reforms in various sectors in other countries. The Republic of India Swachh Bharat Mission Operation (P153251, US$1.5 billion, approved in December 2015) aims at accelerating and sustaining behavioral change in rural households and villages – stopping open defecation, using safe technologies and adopting hygienic behaviors – directly benefitting more than 60 percent of India’s rural population (more than 550 million persons). The Brazil Upper Secondary Education Reform PforR (P163868, US$250 million, approved in December 2017) aims at strengthening the capacity of the 27 state secretariats of education in the implementation of upper secondary educational reform, prioritizing vulnerable schools, and increasing the Index of Basic Education Development in targeted full-time upper secondary schools in the country. Both operations have
7

a multi-state focus on results and have been prepared through wide in-country consultations with key stakeholders and Program beneficiaries, as in the case of this proposed PforR.
21. The PforR is considered by both the Bank and the Borrower as the optimal Bank financing instrument for the proposed SFTAS Program for the following reasons11: (1) The FSP and the Open Government Partnership (OGP) are coherent government-owned fiscal governance and management reform programs strongly supported by the FGN and states with potential for high impact. The main weaknesses of these programs are the absence of a clearly defined, measurable set of results and strong incentives for states to implement the reforms and achieve results. The PforR instrument focuses the government program on implementation and on improving results (not just achieving inputs (processes and policies)); (2) The PforR instruments make use of existing government systems (financial management, social and environmental systems management, and procurement management), thereby providing the opportunity for strengthening country systems.
22. The Investment Project Financing (IPF) would not be appropriate because the focus of the SFTAS program is not on inputs and specific investments, but on outcomes and results and sector-wide reforms. An instrument focused on inputs will not be appropriate for a multi-state program, as states have different institutional contexts and reform paths. For example, states employ different strategies to increase IGR, according to their economic context, so it is preferable to incentivize the outcomes rather than provide specific inputs which may not be relevant to all states. Moreover, the IPF is much more transaction intensive, and would make the implementation across multiple states impractical.
23. The Development Policy Financing (DPF) instrument would also not be appropriate because the focus of the Program is not on new sectoral policy reforms, but on strengthening the implementation of two existing government programs and achieving outcomes-based results. The PforR instrument provides more flexibility than the DPF to deal with the diversity of states because states can participate without achieving all the disbursement-linked indicators (DLIs) so it is more appropriate for working across many Nigerian states. The DPF would either require a specific policy matrix being agreed for each state participating (which would be impractical) or require a common policy matrix for all states participating, which would mean the prior results having to be very basic so that all states participating can achieve all the prior results. The SFTAS PforR – due to its large scale (potentially covering all states) can help strengthen the fiscal framework from the ‘ground up’ (from the state tier of government).
24. A separately disbursing IPF technical assistance (TA) component allows specific and targeted support for capacity building activities to the states and to the FMoF Home Finance Department (HFD) as the Program Coordination Unit (PCU). The component allows a closer working relationship between the Bank and the implementing agencies, in ensuring that the inputs are designed to support states to achieve the results under the PforR Program and that sufficient quality assurance is provided on the activities. Rather than each state trying to implement TA activities on their own if the capacity building activities were part of the PforR, the IPF project is delivered through a few implementing entities and ensures economies of scale.
11 https://spappscsec.worldbank.org/sites/ppf3/PPFDocuments/f9e36a3b72e04edb9fdc96bf555c7208.pdf
8

II. PROGRAM DESCRIPTION
A. Government Program25. The government program supported by SFTAS focuses on strengthening the fiscal sustainability, transparency and accountability of Nigerian states. The government program is comprised of: (1) the Fiscal Sustainability Plan (FSP) actions to be implemented by state governments; and (2) the Nigerian OGP National Action Plan (NAP) actions at the state-level. While both programs had initial timeframes for states to implement the actions, most of the actions are meant to be implemented in a sustained/ongoing manner. It is well recognized by stakeholders that to fully implement the FSP and OGP program across all states will take at least 4-5 years. See Annex 1 for details on the government program.
26. The government program is a key strategy of the governance pillar of the ERGP. The ERGP is underpinned by a focus on effective governance, viewing it as crucial to the successful implementation of the other ERGP strategies. The ERGP seeks to improve governance through four priority areas: (1) Fighting corruption and enhancing transparency in the use of public resources; (2) Reinforcing public safety and security by combating terrorism and insurgency in the North East and militancy in the Niger Delta; (3) Reform the public service by reducing the cost of governance and raising productivity across all FGN agencies, and (4) Strengthening subnational coordination. The implementation of the FSP by states is one of the key strategies in the area of strengthening subnational coordination.
27. The Fiscal Sustainability Plan (FSP) consists of 22 actions grouped under five objectives: (1) Improve Accountability and Transparency (2) Increase Public Revenue (3) Rationalize Public Expenditure (4) Improve Public Financial Management and (5) Sustainable Debt Management. Out of the 22 actions, 19 are to be implemented by the state governments (some with federal support) and 3 are measures to be undertaken by the federal government. The FSP accompanied the BSF. While the BSF was originally planned to end by May 2017, the intention was for states to continue and sustain the reforms contained in the FSP. The monthly BSF disbursements to each state were supposed to be conditional on the state’s progress on implementing the FSP. In practice, BSF funds were disbursed to states even if they made less than expected progress in implementing the FSP, given the severe fiscal pressures.
28. While all states have made at least partial progress, implementation of the FSP by the states is incomplete. The FMoF and Nigeria Governors Forum (NGF) have conducted assessments of the implementation of FSP across states which show that while all states have made progress, in particular in improving regular state debt reporting to DMO12, Treasury Single Account (TSA) implementation, use of biometrics in tackling payroll fraud, and increase in IGR collection13, implementation of the FSP actions remain incomplete. Several factors contributed to the incomplete implementation of the FSP by the states: 1) weak capacity in some of the states, coupled with the lack of capacity building support accompanying the FSP; 2) absence of strong political will at the executive level in some of the states; 3) lack of strong incentives as the FGN was unable to enforce the implementation of the FSP as conditions for the disbursement of funds to the states.
12 Reported by DMO and reflected in the consolidated state debt reports. 13 Source: Joint Tax Board IGR collection figures 2016-2017 and NGF IGR dashboard data
9

29. The government seeks to further enhance the transparency and accountability in the use of public resources through the implementation of the OGP. Nigeria joined the OGP in July 2016 and has formulated a national OGP action plan. The plan consists of fourteen commitments under four areas: (1) Fiscal Transparency; (2) Anti-Corruption; (3) Access to Information; and (4) Citizen Engagement. The FGN has established a Nigerian OGP Secretariat within the Ministry of Justice to coordinate the implementation of the action plan at the federal and state level. Several states have already signed agreements to implement the seven of the fourteen OGP commitments applicable at the state level and several more are in the process of doing so. Implementation of the OGP commitments is at the initial stages at the state-level due to weak incentives for states to adhere to the OGP action points, as well as lack of capacity.
30. The FMoF requested the Bank’s support to strengthen the implementation of the government program by states and FCT. The government program at the state-level is implemented by a number of state government institutions. Specifically, the state-level FSP and the fiscal transparency actions in the OGP NAP is implemented by state government institutions responsible for financial and fiscal (including debt) management, in particular: state ministries of finance (including treasury, state debt departments), state ministries of budget and planning, state boards of internal revenues, and state office of accountant generals. The FSP and the fiscal transparency actions in the OGP NAP cover the full scope of core functions and activities of these institutions. Implementation of the government program primarily requires staff time, consultants, workshops and training. Extensive consultations carried out with key stakeholders at the federal and state levels as well as academia and civil society showed wide agreement that the FSP represents a national consensus on common standards for state fiscal management and its full and sustained implementation should be supported, alongside the state-level OGP commitments.
31. There is strong federal and state-level government buy-in and ownership of the proposed SFTAS Program. For the federal government, the main benefits of SFTAS are in reducing the fiscal risks posed by the states and in encouraging a common set of fiscal behaviors. The FMoF is now enforcing more strongly compliance with the FSP implementation for disbursements of the BSF since June 201714. The IDA supported Program can strongly further reinforce the linkage between financial assistance and implementation and achievement of results. The FMoF’s decision to ‘on grant’ the PforR financing to states significantly increases the incentives that the Program provides to the states (noting that the financial assistance packages from FGN to date are all loans to the states). States welcome not just the PforR financing but also the capacity building support that was not available when the FSP was launched. The Federal Minister of Finance presented the Program to the National Economic Council (NEC, comprised of the state governors of all 36 states and chaired by the Vice President) on 22 March 2018 and the Program was formally approved by NEC. As of 15 May 2018, 32 states have submitted formal expressions of interest to FMoF to participate in the Program, signed by the state governors and commissioners of finance.
14 Disbursements were linked to actions related to implementing an electronic tax platform designed by FIRS at the state-level. Only once states had implemented the platform did they received BSF disbursements post May 2017.
10

B. SFTAS PforR (“The Program”) Program Development Objective and Key Results32. The PDO is to strengthen the fiscal transparency, accountability and sustainability in the participating states. Strengthening fiscal transparency will help build trust in government, enhance the monitoring of fiscal risks and facilitate accountability in public resource management. Stronger accountability reduces the opportunities for corruption and misuse of public resources, thereby increasing the efficiency of public expenditures. Strengthening fiscal sustainability through increased efficiency in spending, strengthened revenue mobilization and debt sustainability, helps prevent further fiscal crises, and increase the fiscal space for productive spending to support growth and public service delivery. The following outcome indicators covering states participating in the PforR will be used to measure achievement of the PDO:
PDO Indicator 1: Open Budget Index15 score between 2018 and 2021 - average for states participating in the PforR.
PDO Indicator 2: States that increased internally generated revenue collection by more than 20 percent annually (in nominal terms).
PDO Indicator 3.1: Average citizens access to procurement information in states publishing contract award data online in OCDS format.
PDO Indicator 3.2: Average time taken for procurement processes in states that implemented e-procurement in at least 4 MDAs.
PDO Indicator 4: States with total debt stock as a share of total revenue for the preceding 12 months being less than 100 percent.
33. The baseline/current fiscal management and performance across all states, with few exceptions, can be characterized as very weak:
States lack basic fiscal transparency and accountability: Key budget documents and audited financial statements are mostly not published or published late. Citizens engagement in the budget process is limited. Budgets are not credible with budget deviation (difference between planned and actuals) extremely high - between 30 to 55 percent.
Limited IGR collection by states but high growth potential: IGR currently (in 2017) still only represents 30 percent of total state revenues, and taxpayers face uncertainty with only six states having a consolidated IGR tax code. However, many states have been able to increase IGR significantly in response to the reduction in statutory transfers (average states’ IGR annual growth was more than 20 percent in 2016-15 and 2017-16) by reducing IGR leakages through the implementation of state-level Treasury Single Accounts (TSA), and intensifying efforts in IGR collection.
States face recurrent spending pressures and inefficiencies in spending: Recurrent spending rose rapidly pre-crisis, driven by personnel spending. Many states have done biometric capture of their civil servants but not all of them have linked to this to payroll to
15 The Open budget index (OBI) developed by the International Budget Partnership (IBP) uses a standard methodology to measure the accessibility of 8 key budget documents, including the approved budget, budget implementation report, audited financial statements, which are the focus of the Eligibility Criteria and DLI 1 and 2. The OBI presents an overall measure of budget transparency and can be applied at the subnational level. The OBI survey has been conducted for FGN and for Nigerian states in 2015. Further state-level OBI surveys are planned.
11

tackle the issue of ghost workers. 26 states have a procurement legal framework but procurement systems still lack transparency and are inefficient.
States’ debt doubled during 2014-2016; debt management needs to be strengthened: 22 states have fiscal responsibility laws (FRLs), but many FRLs do not contain key provisions for debt management or rules limiting fiscal deficits. Debt sustainability analyses are not done to inform fiscal policy or the MTEF. In just two years (2014-2016), domestic arrears accumulated rapidly, total debt stock doubled and debt-to-revenue ratio tripled.
34. To achieve the PDO, the Program is expected to significantly improve outcomes in the states participating in the Program under each of the four key result areas (KRAs). The Program supports a series of key interventions (at the input and output levels) which contribute to intermediate outcomes, and which in turn contribute to outcomes. The Program’s DLIs also directly incentivize the achievement of the intermediate outcomes and outcomes under each of the four KRAs. Figure 3 shows the results chain for the Program and how the DLIs support it:
KRA#1: Increase Fiscal Transparency and Accountability. Under this results area, the PforR will support states to: (1) increase the quality (compliance with international standards), timeliness and transparency of the annual budget, budget implementation reports, and audited financial statements; (2) increase citizens’ participation in the budget process; and (3) improve budget credibility by reducing deviation in total state expenditure outturn.
KRA#2: Strengthen Domestic Revenue Mobilization. Under this results area, the PforR will support states to: (1) increase IGR collection while providing more transparency and certainty to taxpayers; and (2) reduce revenue leakages by implementing the TSA at the state-level.
KRA#3: Increase Efficiency in Public Expenditure. Under this results area, the PforR will support states to: (1) to reduce payroll fraud through the use of biometric and bank verification number (BVN); and (2) improve the transparency and value for money of public procurement through the implementation of e-procurement systems in MDAs, including those delivering education and health public services, and open contracting standards.
KRA#4: Strengthen Debt Sustainability. Under this results area, the PforR will support states to: (1) strengthen the legal framework for debt management and fiscal responsibility, improve state debt reporting and debt sustainability analyses; (2) reduce the stock of domestic expenditure arrears; and (3) strengthen debt sustainability ratios.
35. Fiscal sustainability of states can be strengthened without reducing productive expenditure through increase in revenue and improved efficiency of spending. The intended pathway to strengthen fiscal sustainability through the Program is primarily through improvements in domestic revenue mobilization (result area 2) that allows states to maintain/even increase expenditure while reducing their fiscal deficits, and secondly through increased efficiency in public expenditure (result area 1 and 3) and strengthened debt management (result area 4). The Program incentivizes increased state debt sustainability as measured by the state debt-to-revenue ratio, which can be achieved even if total state debt remains level or grows slightly, if state revenues can improve significantly. The Program is targeting a decline in domestic arrears, which states can achieve even if they are not able to run a
12

primary surplus by replacing arrears with more transparent and formal debt instruments. This BSF was supposed to help states clear arrears using the financial assistance/loans from FGN, but disbursements were not tied to clearance of arrears. The economic analysis (Annex 4) shows the intended pathway to strengthened fiscal sustainability.
36. The Program is expected to lead to changes in state behaviors to achieve the four KRAs though provision of incentives and additional capacity building resources. It is expected that many states will do more to initiate/accelerate/complete fiscal reforms in response to the PforR financial incentives and will make use of the TA resources to strengthen their capacity to undertake these fiscal reforms. Even without strong financial incentives (due to weak enforcement as conditions for the Budget Support Facility) and capacity building support, all states have made some progress in implementing the FSP. As the fiscal pressures and the need for financing remain high for all states, it is expected that states’ responsiveness to the PforR will be high, especially as the financing is provided in the form of grants to the states from the FGN.
37. States are not expected to respond uniformly to the Program; responses will depend on their political and institutional realities. Some states will respond more positively than others. Annex 2 contains the Program results framework with estimates of the number of states achieving each of the results by the end of 2021 (measured in 2022), ranging from two-thirds of states for the basic results to one-third of states for the stretch results.
38. In addition to strengthening fiscal performance in individual Nigerian states, the Program’s scale can significantly improve intergovernmental fiscal coordination by supporting a common set of good-practice fiscal behaviors and standards across many states. The high degree of fiscal autonomy enjoyed by states under the Constitution has made it challenging to instill a common set of fiscal behaviors and standards across states and between states and the FGN. Due to the large scale of the Program, there is potential to achieve wide-spread adoption of good-practice fiscal behaviors across many states (while respecting the states’ autonomy), which are consistent with those at the federal level - for example: the implementation of TSA, the use of biometrics and BVN to reduce payroll fraud.
39. The Program will also strengthen the overall fiscal responsibility framework for the Federation and reduce fiscal risks to the FGN from the states. The increased availability of reliable state fiscal and debt data will significantly improve monitoring of state debt sustainability and risks to facilitate early, coordinated response by the FGN and states. The establishment of FRLs in more states will complement the existing federal government FRA and strengthen the overall fiscal responsibility framework for the Federation.
13

Figure 3: The Program Results Chain
14

C. Program Scope and Components
The Proposed Program
40. The proposed Program is a hybrid with two components of activities that support Nigerian states to achieve the key result areas of the Program: (1) a performance-based financing component for state governments, which will be implemented as a PforR; and (2) a technical assistance (TA) component for states and selected national-level institutions, which will be implemented as an IPF.
41. The performance-based financing component is open ex-ante to all 36 states and FCT16 in Nigeria. The FSP and OGP set of reforms are relevant to all states, as fiscal management and performance are weak across the board, and all states still face considerable fiscal pressures. There is a very strong consensus across FMoF and all states17 that out of fairness, relevance and need, no states should be ex-ante excluded from the Program. However, states have to meet the annual eligibility criteria (EC) to access PforR financing. The capacity building component will support states that demonstrate a need, targeting states that currently do not receive any capacity building support in program-related areas from ongoing World Bank or development partners18.
42. The Program will support the full and sustained implementation of a strategic subset of reforms from the FSP and the OGP commitments that are implemented at the state-level. The selected reforms are considered the most critical and impactful for strengthening fiscal transparency, accountability and sustainability and contributing to the achievement of the PDO. The selected reforms form the basis of the eligibility criteria and the DLIs. The formulation of the DLIs are designed to address gaps in the programs identified in the technical assessment and strengthen the impact of the FSP and OGP programs.
43. Program Boundary: Figure 4 shows the SFTAS Program Boundary i.e. the subset of the FSP and OGP Fiscal Transparency government program supported by the SFTAS Program. 3 (three) out of the 19 state-level FSP actions form the Eligibility Criteria. A further 8 state-level FSP actions and 2 OGP state-level actions form the basis of the 9 DLIs across the four result areas of the Program.
44. The duration of the Program will be four years with the program effectiveness expected in October 2018 and end date expected in December 2022. The PforR will cover the fiscal performance of states over four fiscal19 years: 2018-2021. Capacity building activities will commence after program effectiveness until the end of 2021. During preparation, different program durations were discussed and the Bank and the Government agreed that supporting states’ performance over four years was optimal for building momentum, incentivizing the sustained implementation of reforms, accommodating weaker states, and for allowing progression in the results/DLIs.
16 Requested by the FMOF to also include FCT in the Program based on interest expressed by FCT17 Reflected in consultations that have covered all 36 states to date. States were represented by Commissioners of Finance, Finance Permanent Secretary, Commissioners of Budget and Planning, Accountant General, Chairman of State Bureau of Internal Revenue 18 Approximately 14 states have received support to strengthen PFM systems.19 Fiscal year is the same as calendar year for the Nigerian government
15

Figure 4: SFTAS Program Boundaries
# Fiscal Sustainability Plan Responsible Objective 1: To Improve Accountability & Transparency 1 Publish audited annual financial statements within 6 months of financial year end. State 2 Introduction and compliance with the International Public Sector Accounting Standards. State 3 Publish State budget online annually State 4 Publish budget implementation performance report online quarterly State 5 Develop standard IPSAS compliant software to be offered to States Federal Objective 2: Increase Public Revenue 6 Set and implement targets to improve IGR and ratio of capital to recurrent expenditure State 7 Implement a centralized Treasury Single Account (TSA) in each State. State 8a. Quarterly financial reconciliation meetings between Federal and State Governments State/ FGN 8b. Share the database of companies within each State with FIRS. State/ FGN 9 System for the immediate issue of VAT / WHT certificates on payment of invoices State/ FGN 10 Review all revenue related laws and update of obsolete rates / tariffs. State/ FGN Objective 3: Rationalization of Public Expenditure 11a Set limits on personnel expenditure as a share of total budgeted expenditure. State 11b Biometric capture of Civil Servants will be carried out to eliminate payroll fraud. State 12a Establishment of Efficiency Unit. State 12b Federal Government online price guide to be made available for use by States Federal 13 Introduce a system of Continuous Audit (internal audit). State/ FGN Objective 4: Public Financial Management 14 Create a fixed asset and liability register State/ FGN 15 Consider privatization or concession of suitable SOEs to improve efficiency... State 16 Establish a Capital Development Fund to ring-fence capital-receipts… State 17 Domestication of the Fiscal Responsibility Act (FRA) State Objective 5: Sustainable Debt Management 18 Attainment and maintenance of a credit rating by each State of the Federation State 19a Issuance of fast track Municipal bond guidelines State/ FGN
(SEC/DMO) 19b Full compliance with the FRA; Submission of updated debt profile report to the DMO 20 Publish a benchmark rate for Municipal loans to achieve greater transparency CBN 21 Ensure total liabilities (debt) do not exceed 250 percent of total revenue State
Debt service deduction is not to exceed 40 percent of the average FAAC allocation 22 States are encouraged to establish a Consolidated Debt Service Account State Nigeria Open Government Partnership National Action Plan Level Fiscal Transparency 1 Ensure more effective citizens’ participation across the entire budget cycle. FGN/State 2 Full implementation of Open Contracting and adoption of OCDS FGN/State 3 Enhance transparency in the extractive sector through a concrete set of disclosures FGN 4 Adopt common reporting standards and the Addis Tax initiative FGN 5 Improve Nigeria’s ranking on the World Bank Doing Business Index FGN Anti-Corruption 6 Establish a Public register of Beneficial Owners of Companies, FGN 7 Establish a platform for sharing information to detect, prevent and disrupt corrupt practices FGN 8 Strengthen Nigeria’s asset recovery legislation FGN 9 Co-ordinate anti-corruption activities; improve integrity and transparency and accountability FGN/State Access to Information 10/11 Improved compliance of public institutions with the Freedom of Information Act FGN/State Citizen Engagement 12 Develop a Permanent Dialogue Mechanism between citizens and government FGN/State 13 Government-civil society to jointly review legislations on transparency and accountability FGN 14 Adopt a technology-based citizens’ feedback on projects and programs FGN/State
Increase Fiscal Transparency & Accountability
Strengthen Domestic Revenue
Mobilization
Strengthen Debt Sustainability
Increase Efficiency in
Public Expenditure
Eligibility Criteria
Note: the actions under FSP and the Nigeria OGP NAP are summarized. See Annex 1 for more details
16

45. Performance-based financing to eligible state governments (PforR component, US$700 million equivalent): The Program will provide performance-based financing on an annual basis to states which have been verified through the annual performance assessments (APA) as having: 1) complied with the annual eligibility criteria; and 2) achieved the annual disbursement-linked results (DLRs). The FMoF intends to provide the financing in the form of grants to the states:
The APA will be carried out by the independent verification agent (IVA), which will be the Office of the Auditor General of the Federation (AuGF), working with a third-party external audit firm (contracted by the FMoF’s HFD as the PCU), using the detailed verification protocol established for the Program. The APA will first assess which states have met the eligibility criteria for that year.
Eligibility Criteria (EC): For each year of the Program, states will need to publish on a timely basis the annual approved state budgets and annual audited financial statements. The increased availability of timely and credible fiscal data will enable state governments to improve fiscal management, facilitate demand-driven oversight of public finances by citizens and CSOs, and provide more reliable data for monitoring fiscal performance and risks by the FGN. There is a very strong consensus across states that these are the two priority FSP actions, requiring mostly behavioral change and achievable by all states committed to the reforms, and therefore appropriate to be the minimum common performance standard for all states participating in the PforR. In years 3 and 4 of the Program, states are further required to align with international best practices through: (1) the use of the national chart of accounts/budget classification system, which is GFS compliant, to prepare the states’ annual budgets and thus foster comparability of budget classifications across the federation; and (2) states’ audited financial statements are prepared in accordance with International Public Sector Accounting Standards (IPSAS). To ensure that all states participating in the Program do so for at least 2 years, states need to achieve the EC by year 3 to participate.
Table 2: Eligibility Criteria (2018-2021)Baseline (2017) Year 1 - 2018 Year 2 - 2019 Year 3 - 2020 Year 4 - 2021
Few states publish annual state budgets and audited financial statements online in a timely manner. Budgets are not being prepared under Chart of Accounts, and financial statements are not in accordance with IPSAS
FY19 state budget approved by the State Assembly and published online by end Feb 2019
AND FY17 audited financial statement submitted to the State Assembly and published by Dec 2018
FY20 state budget approved by the State Assembly and published online by end Jan 2020
AND FY18 audited financial statement submitted to the State Assembly and published by Sept 2019
FY21 state budget, prepared under national Chart of Accounts, approved by the State Assembly and published online by end Jan 2021
AND FY19 audited financial statement, prepared in accordance with IPSAS, submitted to the State Assembly and published by Aug 2020
FY22 state budget, prepared under national Chart of Accounts, approved by the State Assembly and published online by end Jan 2022
AND FY20 audited financial statement, prepared in accordance with IPSAS, submitted to the State Assembly and published by Jul 2021
17
For states which have met the eligibility criteria, the APA will measure the performance of states against the nine disbursement-linked indicators (DLIs) under the four key result areas (KRAs) using a detailed verification protocol. Each of the DLIs has specific annual disbursement-linked results (DLRs) to be achieved for each year of the Program. The verification protocol will be established upfront and contained in the Operational Manual for the Program and communicated to all states participating in the Program. Much of the verification can be done centrally by the IVA (AuGF working with a third party external audit firm) using official documents that are available online (which are required by the DLRs) from the state websites or from a federal institution that collects and verifies the state data (e.g., the state quarterly debt reports submitted and cleared by the DMO). A few DLRs will require field visits to the states to verify results or draw from surveys conducted by a third-party consultancy. Annex 3 contains the DLI verification protocol.
States determined through the APA to have achieved the DLRs (by the end of the fiscal year/calendar year20) will receive a PforR disbursement that will be the aggregate of the monetary values of all the DLRs achieved by them in any year. This will provide resources to the states to finance recurrent expenditures that are necessary for implementing the Program and are included in their medium-term expenditure frameworks (MTEF). States will receive on average US$19 million in total from the performance-based financing component, with the specific amount depending on their performance as assessed during the APA.
46. TA/capacity building support for state governments and national institutions (IPF component, US$50 million equivalent):
This component will support key state government institutions responsible for fiscal management to strengthen their capacity to achieve the key result areas of the PforR , targeting those states that are not already the beneficiaries of similar support from other Bank or donor-financed programs. It is anticipated that the support will benefit the most lagging states (those with weaker starting fiscal management capabilities).
The support will involve a mixture of modalities: curriculum-based structured learning, central and regional technical workshops, customized just-in-time support at the individual state level, and regular peer learning forums with state commissioners of finance, budget and planning and accountant generals. The different modalities allow for training on areas that are common to all states as well as customized training to individual states addressing specific needs. The design of the component has been informed by the findings of the monitoring of FSP implementation carried out by the Nigeria Governors Forum (NGF) and FMoF, existing Bank projects at the state level, and feedback received during consultations with the FGN and state governments.
The capacity building support to states will be delivered through a set of in-country institutions: the Nigerian OGP secretariat; Public Service Institute of Nigeria (PSIN); the Debt Management Office (DMO); and the NGF. These institutions already have experience providing capacity building support across multiple states.
This component will also provide support to the FMoF’s HFD and the AuGF to enable them to perform their respective roles of Program Coordination and IVA. The AuGF already audits several of the Bank’s lending operations in Nigeria. However, given the importance of having a credible and objective verification process, a third-party external audit firm will be
20 For some DLRs, the timeline is earlier than December of that year
18

engaged to work alongside the AGF to carry out the APA, while at the same time building capacity of the AuGF.
Collaboration between the HFD and the Secretariat of the NEC and the Joint Tax Board (JTB) to use the information generated from the Program to strengthen FGN-State policy coordination will also be facilitated under this component.
47. The relative allocation between the Performance-based Financing and the TA components reflects the Bank’s and the states’ assessment that while capacity constraints in some states have hindered the implementation of the FSP, the primary factor is the weak incentives to change behavior. Moreover, based on a detailed activity costing exercise during preparation, the financing envelope of US$50 million for the TA component is deemed sufficient to support the capacity building activities that are needed to support states achieve the DLIs. The capacity building support to states does not include procurement of IT equipment and software. Not all states need additional IT investments. Also, as other World Bank-funded state-level projects are already providing funds to many states for meeting IT needs and to strengthen PFM, states are expected to use the funds from these ongoing projects.
Figure 5: Overview of the SFTAS Program Design and Implementation
48. Program expenditure framework: The estimated expenditure framework of the government program supported by SFTAS for the period 2018-2021 is US$3.27 billion. The PforR financing envelope of US$700 million represents 21 percent of the government program financing:
Table 3: Program Expenditure Framework and Financing Sources (US$ million) Source Amount Percent of Total
Government 2,566 79IDA 700 21Other Development Partners 0 0Total program financing 3,266 100
19

49. Crowding in complementary support from other development partners for the implementation of the proposed operation is foreseen, notably from the UK Department for International Development (DfID) and the European Union (EU). DfID, through its Partnership to Engage, Reform and Learn (PERL) project21, will continue to provide critical TA support to several states during the implementation of this Program. PERL seeks to promote public sector accountability and reduce corruption. The EU has been active in at least 15 states in areas of support that are aligned to strengthening PFM, including public procurement, revenue mobilization and budget management.
Linkages with other operations and future operations
50. The proposed PforR is part of a larger programmatic Bank engagement to strengthen federal and subnational fiscal governance and management. Experience in large federal countries, including Brazil and Russia, shows that macro-fiscal stability needs to be built from the ground up. Reforms at the federal level are rarely meaningful if states do not reform. The fiscal crisis has impacted all tiers of government in Nigeria and require all tiers to make the requisite fiscal adjustments. Recognizing well that strengthening fiscal governance and management in Nigeria requires coordinated and sustained reforms by the federal and the subnational governments, the PforR is part of larger Bank engagement as described in the following paragraphs.
51. If this PforR is successful in achieving its development objectives, further support to the states is envisioned that will build on this Program. For example, the future support could focus more on improving the effectiveness of expenditure at the state level, including capital spending. Future support could have a sectoral focus i.e. improving fiscal transparency and accountability and quality of spending in specific sectors.
52. The Bank has prepared in parallel an operation to strengthen fiscal accountability and management at the federal level. The Fiscal Governance and Institutions Project (FGIP) (P163540), which is expected to be approved by the Board on 22 June 2018, supports the strengthening of revenue management, and controls, transparency and accountability in the use of funds at the federal level. These are areas supported by SFTAS at the state level so the two operations will support closer alignment between the FGN and states on fiscal management and strengthen intergovernmental fiscal coordination. FGIP will also support the federal government to serve better as a positive role model for states in adopting good PFM practices.
53. SFTAS builds on previous operations focused on strengthening PFM in subsets of Nigerian states and complements the fiscal reforms contained in two current/pipeline individual state operations. While SFTAS works ‘wholesale’ across all states; others work ‘retail’ with smaller number of states and individual states. The retail allows greater attention to be paid to all aspects of the results chain within the states, from upstream functions, such as budgeting and planning, through downstream functions, such as the contracting and monitoring of service providers. On the other hand, working wholesale offers a better chance of improving federal-state coordination and generating competitive or learning dynamics across states. To prevent duplication of financing for the same results, the Bank will check across the three operations
21 Successor to DfID’s closed ‘State Partnership for Accountability, Responsiveness and Capability’ Program
20

before making PforR disbursements. The details of the process of how this will be done will be captured in the Program operations manual (POM)22.
Table 4: Summary of Bank engagements on PFM that have synergies with SFTAS
Bank Engagement Linkage to SFTAS State and Local Governance Reform Project (P133045) (IPF), approved Oct 2014
Supporting transparency, accountability, revenue management and PFM strengthening in six states. Links to SFTAS results areas 1-3
State Employment and Expenditure for Results Project (P121455) (IPF), approved Mar 2012
Supporting public procurement systems, revenue management and PFM strengthening in four states. Links to SFTAS results areas 1-3
Governance Reforms in Borno State (EU TF), effective Feb 2018
Supporting PFM reforms in a conflict/fragile context. Linkage to SFTAS results areas 1 and 2
Nigeria - Kaduna State Economic Transformation Program-for-Results (P161998) (PforR), approved Jun 2017, not yet effective
Improving budget credibility and procurement effectiveness. Links to SFTAS results areas 1 and 3
Ogun State Nigeria: Agricultural Production and Industrialization (P164031) (IPF), pipeline FY2019
Improving procurement effectiveness. Links to SFTAS result area 3
Fiscal Governance and Institutions Project (P163540) (IPF), pipeline, scheduled Board 22 June 2018
Supports federal institutions in strengthening revenue management, and controls, transparency and accountability in the use of funds. Linkage to SFTAS result areas 1-3
Lessons learned and political economy considerations
54. The design of SFTAS draws upon the lessons learned from the implementation of other Bank state-level operations. The Bank has been supporting state governments in strengthening their service delivery, institutional and financial management systems and processes through several operations. The PforR design draws upon these lessons learned, including from the design of the BESDA PforR (which covers about half of all states) the value of having a capacity building component under the hybrid PforR. From Bank-financed IPF operations in Nigeria supporting states in PFM reforms (including the Nigeria States Employment and Expenditure for Results project (SEEFOR, P121455), the Nigeria State and Local Governance Reform project (SLOGOR, P133045) and the recently closed Nigeria Public Sector Governance Reform and Development project (PSGRP, P097026) that covered 11 states). Lessons learned include: 1) strengthening transparency in the use of public resources to mitigate the risk of corruption in a context of weak institutions and systems; (ii) the importance of a development strategy that looks at both sides of the fiscal equation by strengthening states’ domestic revenue mobilization i.e. IGR; and (iii) the government integrated financial management information system needs to be adequately operationalized to support fiscal reforms.
55. The proposed Program will also be responsive to the political economy dynamics that shape state fiscal performance and accountability. The complex and still evolving relationship between the federal and state governments is characterized by incentives and interests that can hinder coordinated and cooperative action between the two tiers. Understanding
22 The Financing Agreement includes a legal covenant that activities under the PforR Component already financed by other performance-based financing operations by the Bank will not be eligible for financing from the credit proceeds.
21

the factors that drive the behavior of key actors at the federal and state level is critical for designing a Program that can provide the right incentives and enabling environment for implementing technical reforms in the areas of fiscal management and accountability. A political economy analysis (PEA) was conducted as part of the program preparation. Table 5 summarizes the findings and implications for the Program design and implementation. The Technical Assessment contains more details.
Table 5: Key PEA Findings and RecommendationsSummary Table
PEA findings Implications for the SFTAS ProgramThe federal government has limited influence over the fiscal behavior of states as the Constitution provides states with a high degree of autonomy. The federal government’s own fiscal performance has been weak which limits its influence and ability to lead by example.
The Program should facilitate alternative sources of incentives to encourage the implementation of the FSP as the FMoF may not be able to fully enforce the reforms in the FSP as conditions for financial assistance when there is a fiscal crisis. The Bank’s support to the federal government through FGIP to strengthen fiscal management and governance can help the FGN strengthen its authority with states.
Accountability pressures acting on governors are weak. Governors have strong influence over state institutions of accountability. However, governors are often influenced by the experiences of other states, especially if they have political or development ambition.
The Program can facilitate accountability and harness peer learning and competition among states. The M&E program activities will put credible and timely information on states’ performance into the public domain so that demand-side actors can better engage with the implementation of reforms and at the same time create healthy peer competition between States. The TA component will strengthen mechanisms for regular peer exchange and learning.
Opportunities from Nigeria’s fiscal crisis. The economy is slowly coming out of recession; however, all states continue to experience fiscal stress and are still relying on financial assistance (loans) from the FGN. The financial assistance packages provided by the FGN to the states have resulted in a significant increase of FGN oversight over states’ debt.
States can be expected to be incentivized by the Program even if the value of the expected disbursements per state is a small proportion of their fiscal needs given their absolute need for additional financing. SFTAS should aim to make significant progress on strengthening state debt management in the proposed DLIs.
OGP: The OGP initiative is closely linked to the current administration. Commitment and buy-in at the state-level has only just began.
SFTAS should limit its focus on OGP to issues that are also covered by the FSP (i.e. issues of fiscal transparency) while political commitment to OGP strengthens over time.
State fiscal performance heterogeneity. The nature of state political leadership and electoral incentives are important non-technical drivers of state fiscal performance. Major differences can be observed in the political economy contexts of different states. This has significant implications for prospects for fiscal reforms and large differences in performance are likely to be
The Program should be designed so that it creates incentives for a wide range of states with different starting positions and political economy contexts. For example, DLIs should be linked to relative changes against state specific baselines rather than comparison against an absolute standard.
22

observed. Motivating the civil service is critical to implementation of the FSP. Motivation depends on a broad set of incentives, including remuneration, but also non-monetary incentives such as professional pride, association with high-profile policy initiatives, opportunities for training and certification.
The TA component should support attractive training and certification programs for civil servants connected to the implementation of the FSP and OGP.
The run-up and follow-up to the February 2019 elections may have a significant impact on prospects for fiscal reform. But the impacts are uncertain (and likely to remain uncertain) and will vary from state to state.
The elections may impact the expectations of disbursement levels during the different years of the Program. New governors should be incentivized to show commitment to sustaining reforms started under predecessors.
Credible information is often lacking, often deliberately, on state government performance. States are prepared to accept differences in disbursements if they perceive that the performance of states have been fairly and objectively assessed.
To be credible, and to maintain confidence and legitimacy, the state performance results in the Program need independent verification using credible and appropriate data sources. States need to fully understand the verification process so that it is perceived as consistent and fair.
D. Disbursement Linked Indicators and Verification Protocols56. Choice of DLIs. The key criteria for selection of the Program DLIs are the following:
The Government program includes the 19 State-level reforms in the FSP and 7 State-level OGP commitments. However, only a subset - those considered most impactful and critical for achievement of the four KRAs and the PDO – form the basis of the nine Program DLIs. Moreover, only those reforms that are entirely within the states control, not relying on actions taken at the federal level, were included. See Annex 4 Table 4.1 for the detailed assessment of the FSP reforms and explanation of which ones have been selected to include in the Program.
As a large number of states at uneven starting points are expected to participate in the Program, the choice and number of DLIs has taken into cognizance the need to have a wide enough set of reforms to be relevant across all Nigerian states. This avoids the potential of a few states capturing a large proportion of the PforR financing.
The DLIs are focused on achievement of fiscal outcomes (e.g., increase in IGR, strengthen debt sustainability) but also support key interventions at the inputs/outputs part of the results chain, which are critical for achieving the outcomes (e.g., the establishment of the TSA, the domestication of the FRL). This also helps to accommodate different starting points across states, with lagging states likely to be able to implement process, input and output type of reforms even if they are not yet able to achieve progress on the outcomes.
The selection of which FSP and OGP reforms should form the basis of the DLIs and the design of the nine Program DLIs has been done in a strongly consultative manner with states (who are ultimately responsible for implementing the Program) through extensive discussions with all states during the Program preparation to ensure that the DLIs are relevant, impactful, and challenging yet realistic to achieve for a large number of the states.
23

57. Formulation of DLIs: There Program DLIs take the following forms: 1) ‘Standalone’ DLIs such as DLI#3: the implementation of the TSA; 2) ‘Composite’ DLIs, which requires two things to be both done. This is the case when the two things are strongly-related in the results chain, for example, the process/output needed to achieve the outcome. Example is DLI#8 which requires a process to verify the stock of domestic arrears to be put in place to enable the credible measurement of the outcome (the clearance of arrears); and 3) DLIs with two parts, which are separately valued. This is the case when the two parts are strongly-related in substance, are complementary, but will still have impact if only one part is achieved. Example is DLI#5 on the use of biometric to tackle ghost workers and the use of BVN to tackle other forms of payroll fraud. The use of this type of DLI in the matrix also helps to incentivize weaker states who may only be able to achieve one of the two parts.
Table 6: Summary Description and Rationale for Program DLIs
Results Area 1: Increasing Fiscal Transparency and Accountability Increasing fiscal transparency and accountability has intrinsic value. In addition, this result area will support the other three result areas by enabling better monitoring of fiscal outcomes, pressures and risks by government and the public by facilitating the engagement of citizens in the budget process. The eligibility criteria also support this result area as it requires states to publish online the approved annual budget and annual audited financial statements.DLI 1: Improved financial reporting and budget reliability
Rationale: Currently states approve budgets with over-optimistic revenue targets as there are no repercussions for not meeting them; this has also led to growing arrears as expenditure commitments are not supported by cash cover. Improving budget reliability is possible and within the states control as it primarily requires that states choose to use more realistic revenue forecasts in their budgets. Having timely reports on budget outturns will help states to take actions to improve implementation against budget targets.
Description: This DLI supports (i) the publication of quarterly budget implementation reports to foster transparency and timely monitoring for strengthened in-year budget management; and (ii) reducing expenditure outturn deviation from the approved state budget.
DLI 2: Increased openness and citizens’ engagement in the budget process
Rationale: Citizens’ engagement in the budget formulation process help ensure that the budget formulation takes account of citizen’s priorities; public scrutiny of budget execution/outturns can strengthen fiscal accountability.
Description: This DLI supports: (i) formal and systematic public consultations (which should be representative and inclusive, especially of women’s voices) in preparing the state budgets; (ii) publication of citizens’ state budgets and establishment of public feedback mechanisms; and (iii) publication of citizens’ accountability reports.
Results Area 2: Strengthening Domestic Revenue Mobilization This results area helps states to increase their total revenue by diversifying their revenue sources, and increase their total budget envelope without relying on increasing financing/borrowing. Increasing the fiscal resources of states is essential for them to be able to provide essential public services and realize state development plans. The net social benefit of higher taxes and spending will also depend on the strengthening the efficiency of public expenditure, which is the focus of results area 3.
24

DLI 3: Improved cash management and reduced revenue leakages through implementation of State TSA
Rationale: Significant savings in financing costs can accrue to states where they are able to have a real-time picture of all their accounts (receipts/expenditures) and can strengthen the predictability of resource flows to service delivery entities, while reducing potentials for expenditure arrears as commitments can be reduced if cash cover is not in place to liquidate commitments as they become due. In Nigeria, there are significant revenue leakages due to service fees and user charges collected by MDAs sitting in individual MDA accounts in different commercial banks and not being remitted to the state treasury. More than half of all states have started implementing a state-level Treasury Single Account (TSA), but many are not based on a cash management strategy.
Description: This DLI builds on the states’ TSA implementation to date, by requiring the TSA to be underpinned by a formal cash management strategy. It also requires as part of the functioning TSA one consolidated treasury account for state revenues to reduce revenue leakages. This DLI will also lower liquidity risks in states.
DLI 4: Strengthened Internally Generated Revenue (IGR) collection
Rationale: With the recovery of the oil sector, statutory transfers to states will increase from 2015-2016 levels but are likely to remain lower than 2011-2014 levels when oil prices were peaking. Therefore, it is important that states significantly increase collection of IGR so that total state revenues can fund statutory expenditures (salaries, interest payments) and important development programs. Diversifying state revenue sources will also make state budgets less vulnerable to oil shocks. IGR in 2017 still only represented 30 percent of total state revenues on average. Moreover, taxpayers face uncertainty with only 6 states having a consolidated IGR tax code. There is significant potential for IGR growth with many states able to increase IGR significantly in response to the reduction in statutory transfers (average states’ IGR annual growth was more than 20 percent 2016-15 and 2017-16) by reducing IGR leakages through the implementation of state-level TSAs, and intensifying efforts in IGR collection.
Description: This DLI incentivizes states to significantly increase their IGR23 collection without being prescriptive on the strategy so that states can decide based on their specific economic and institutional context24. The DLI will have a basic and a stretch target25 to incentivize states with different revenue potential. To ensure that the focus on increasing IGR does not lead to proliferation of arbitrary and duplicative taxes which damage the business environment, the DLI will also support the approval26 and publication of a consolidated state revenue code covering all IGR sources, providing transparency and certainty to taxpayers on
23 The verification protocol will define IGR to only include legitimate revenue sources, consistent with the state-level taxes and levies listed in the national Taxes and Levies Act of 2004, amended 2015.24 It is difficult, beyond the TSA, to identify revenue reforms that are relevant to all states. An extensive review of IGR experience across states by NGF showed that many states increased IGR significantly but the key factors differed. In some states, it was the implementation of a presumptive tax. In others, it was property tax, and in others, it was the automation of tax collection or the centralization of tax collection. The drawback of defining the intervention is that it may be relevant to some states and not to others. 25 Basic target reflects the historical annual growth in IGR of the top 40 percent of states; stretch target reflects the top 20 percent of states. These targets were discussed and considered appropriate by the states at the NGF IGR peer learning forum in November 2017.26 The legislative approval process will open the code to public discourse and scrutiny
25

the policies and rates, and empowering the state bureau of internal revenue (SBIR) to be the sole agency responsible for state revenue collection and accounting.
Results Area 3: Strengthening Efficiency in Public ExpenditureStates are likely to face limited resource envelopes through the medium-term; therefore, strengthening public expenditure efficiency is important so that states can achieve more with less. DLIs have been selected that can have a meaningful impact in increasing the efficiency of public expenditure by reducing wasteful spending. DLI 5: Biometric registration and bank verification number (BVN) used to reduce payroll fraud
Rationale: Rapidly rising personnel costs in the years preceding 2015-2016 led to states accumulating significant salary arrears when revenues declined. The FGN and some states have already successfully deployed biometric registration to identify and remove ghost workers from their payroll, leading to significant expenditure savings.
Description: This DLI seeks to reduce wasteful personnel costs by: (i) eliminating ghost workers through a linkage of the payroll to employee biometric data; and (ii) reducing payroll fraud by linking payroll to bank verification numbers (BVNs).
DLI 6: Improved procurement practices for increased transparency and value for money
Rationale: About 80 percent of public spending goes through procurement processes. While 26 states have a legal framework for procurement, 15 of them require strengthening. Procurement systems in practice are performing sub-optimally, including lack of efficiency and transparency and weak accountability.
Description: This DLI will increase transparency, accountability and efficiency of public procurement through: (i) strengthening of the public procurement legal framework; (ii) implementation of open contracting27 and the Open Contracting Data Standard (OCDS), as detailed in the OGP action plan; and (iii) implementation of e-procurement. The impact should be increased citizens’ access to procurement data and the fiscal impact should be reduction in the transaction costs of procurement and the final costs of procurable items.
Results Area 4: Strengthening Debt SustainabilityThe fiscal crisis resulted in a near doubling of total state debt from 2.4 percent in 2014 to 4.2
27 Open contracting is a process that promotes enhanced disclosure and participation throughout the states’ contracting process on public procurements – from planning through to the completion of the contract obligations.
26

percent of national GDP by the end of 2016 and accumulation of domestic expenditure arrears to over 1 trillion Naira. At the end of 2016, the debt-to-revenue ratio for the median state was 169 percent (10 states had ratios between 100 and 150 percent and only 5 states had ratios less than 100 percent). The DLIs in this results area aim to strengthen the state-level debt management and fiscal responsibility framework, reduce state domestic arrears, and improve state debt sustainability. This will reduce the fiscal risks to the FGN, who is relied on to provide financial assistance to states experiencing debt distress as was the case in 2015-6.DLI 7: Strengthened public debt management and fiscal responsibility framework
Rationale: Accurate and timely monitoring of state debt dynamics and new borrowings is critical to inform fiscal policy, debt management and fiscal risks management by states and FGN. The overall fiscal responsibility framework is weakened without all state having a FRL.
Description: This DLI seeks to support states to: (i) establish a strong legal framework for public debt management and fiscal responsibility; (ii) improve the timeliness, accuracy and comprehensiveness of state debt reporting; (iii) conduct regular debt sustainability analysis to inform the state’s fiscal policy and the medium-term expenditure framework; and (iv) supports the development of a medium-term debt strategy.
DLI 8: Improved clearance/reduction of domestic expenditure arrears
Rationale: Domestic expenditure arrears accumulated rapidly in many states during 2014-2017. In the absence of strong commitment controls, states used arrears to cope with severe revenue shortfalls and finance the budget deficit. Arrears undermine fiscal responsibility as there is no mechanism to ensure that they are accurately reported and cleared in a timely manner. States could reduce/clear their domestic arrears even if they are not able to run a primary surplus by replacing arrears with more transparent formal debt.
Description: This DLI supports the reduction in the stock of expenditure arrears, which would require clearance of past arrears as well as minimizing the flow of new arrears. This DLI will also strengthen and make more transparent the process of reporting and counter-party verification of arrears and put in place an arrears clearance framework. The DLI will have a basic and a stretch target28 to incentivize states with different fiscal capacity.
DLI 9: Improved debt sustainability
Rationale: The rapid increase in overall state debt with respect to revenues and the increase in debt servicing to revenue is of concern to not only states, but also to the federal government, who has had to provide two financial assistance packages to states.
Description: This DLI seeks to improve the sustainability of public debt at the state level by incentivizing compliance by states with FSP debt solvency (total debt stock in relation to total revenue) and liquidity (debt service deductions as a share of FAAC allocations) thresholds, and by providing additional incentives to further lower the ratios over the program duration29. The DLI will have a basic and a stretch targets30 to incentivize states with different fiscal
28 Basic target requires states to accurately report arrears and to keep level of arrears to a minimum level, allowing for a small amount of technical arrears (non-repayment because of delay in payment advice, or mismatch), or to start clearing high levels of arrears. Stretch target requires states to reduce their stock of arrears significantly - by 20 percent year-on-year - which would get states back to 2014 levels by the last year of the program/2021.29 The FSP target debt to revenue ratio was set during the 2016 fiscal crisis and reflected the increase in indebtedness of states and so is much higher than the ratio under subnational borrowing guidelines of 50 percent.
27
capacity to improve revenues and fiscally consolidate.
58. As the Program supports multiple states, a common Program DLI matrix is used to assess performance to ensure implementation and verification is not overly complex. An alternative approach of customizing the DLI matrix per state/groups of states and varying the pricing of the DLIs (based on the state’s needs, capacity, size) would be extremely complex for implementation and verification31. Moreover, it will also be perceived as unfair by the states, who prefer a common DLI matrix for simplicity and transparency and to facilitate healthy peer competition and learning. With a common Program DLI matrix, it is not expected that any individual state will achieve all the DLIs as even stronger states have areas of weaknesses. States will achieve different subsets of the DLIs based on their institutional capacities and priorities.
59. For each of the DLIs, annual disbursement-linked results (DLRs) are defined for each year and are designed to incentivize progression over the four-year Program. The annual DLRs have been defined considering the baseline (current fiscal performance, status of implementation of reforms) and the level of progress achievable by states over the period 2018-2021. The DLRs incentivize states to progress over the duration of the Program, so the DLRs in years 3 and 4 are more challenging to achieve than those in years 1 and 2. Through the capacity building component which is running in parallel, states will have strengthened their capacity to achieve more challenging results in the later years of the Program. The DLRs for each year of the Program are presented in Annex 3.
60. The DLIs are designed to account for the significant heterogeneity among states and incentivize strengthened performance from lagging and stronger states:
Some of the quantitative DLIs are formulated relative to the state’s baseline, e.g., the target for IGR improvement is a percentage increase from the state’s baseline IGR, which means that the increase in IGR in absolute terms will be higher in states with higher baseline IGR.
Some DLIs have two related components, which are valued separately, so that states which only achieve one of the two is still rewarded for one of them, while stronger states have incentives to achieve both parts and receive more funds.
The three DLIs on fiscal outcomes, which have a quantitative target (reduction in domestic arrears, growth in IGR, debt to revenue ratio), comprise of a basic result which is easier to achieve but has a lower financing amount attached to it, and a stretch result, which is harder to achieve but has a higher financing amount attached to it. States will still get rewarded for achieving the basic result while having incentives to achieve the stretch result.
61. There will be a mid-term formal review of the DLIs and DLRs by the Bank and the FMoF PCU looking at the aggregate performance of states after the second APA to provide an 30 Basic target is based on current ratios of the 40 percent of states with the lowest ratios; stretch target is based on the 25 percent of states with the lowest ratios. Base case projections estimate that states debt-to-revenue ratio would remain at similar levels (as of end 2017) in the medium-term if there were no improvements in revenues and no fiscal consolidation. Improvements in state revenues through IGR and fiscal consolidation by states would allow the ratios to fall over time.31 Given the lack of comparable state-level data: there are no systematic state GDP estimates. The FMOF has given uniform amount of financial assistance to all 35 states through the BSF. Pre-grouping states into stronger states with harder set of DLIs and weaker states with easier DLIs was avoided because it will be perceived as subjective (given limited reliable data on state finances and institutions) and result in adverse incentives in self-selection.
28

opportunity to adjust the DLI matrix for the last two years of the Program to ensure that it remains relevant, appropriate, challenging but realistic for states to achieve. Any adjustments will have to be formally approved by the central steering committee and applied consistently across all states participating in the Program.
E. Performance-based Financing Component: Allocation across KRAs and States 62. It is expected that the majority of the 36 states and FCT will participate in the Program. To ensure a minimum performance standard, only states achieving the eligibility criteria (EC) will access the PforR financing (see Table 2). We expect up to 25 states to meet the EC and enter the Program based on 2018 performance (Year 1), up to 30 states entering based on 2019 performance (Year 2), and potentially all states and FCT meeting the EC in 2020 and 2021 (Years 3 & 4).
63. The total Program PforR financing disbursed for each year will be the sum of the PforR financing for all states verified as meeting the EC and achieving DLRs that year. States will receive a disbursement commensurate with the total value of the DLRs achieved by them that year. The value/pricing attached to each of the DLRs is the same for all states32 and is based on the following principles: Results which strengthen the legal and regulatory frameworks for fiscal management are
valued at US$2 million per state and is a one-off payment, for the year in which they were first achieved – as long as they achieve them within the first three years of the program.
Upstream (processes, systems & outputs) results are valued at US$0.3 million or US$0.5 million per year, per state.
Results which are outcomes are valued higher - to incentivize achievement of results - at US$1 million for a basic result and US$1.5 or US$2 million for a stretch result, per year, per state.
64. A total of US$700 million is available over the four years for the PforR financing. The expected disbursement schedule for the PforR financing is 19 percent for year 1, 24 percent for year 2, and 28-29 percent for each of the years 3 and 4. It is expected that the revenue mobilization result area will receive the most at 38 percent, then debt sustainability (26%), then expenditure efficiency (22%) and fiscal transparency (14%). No advances are to be made to the states.
65. The performance-financing disbursement profile is indicative as it is based on the expected number of states participating in the program in each year and an estimate of the number of states achieving each of the DLRs. It is expected that on average each state meeting the EC and participating in the Program will achieve four to five out of the nine DLIs each year.
Table 7: Performance-based Financing Breakdown
Expected Disbursements US$ million Year 1/2018 Year 2/2019 Year 3/2020 Year 4/2021 Total %
Period being evaluated: Calendar Year and Fiscal Year Jan-Dec 18 Jan-Dec 19 Jan-Dec 20 Jan-Dec 21Evaluation period Jan-Mar 19 Jan-Mar 20 Jan-Mar 21 Jan-Mar 22Disbursement Apr-19 Apr-20 Apr-21 Apr-22
32 This was deemed by all states as the best way in terms of fairness and objectivity, compared to a system of having different pricing for the same DLR to reflect effort or need.
29

Number of states expected to achieve the EC and participate Up to 25 Up to 30
Up to 36 and FCT
Up to 36 and FCT
TOTAL Disbursement 131 171 205 194 700TOTAL (%) 19% 24% 29% 28% 100%RA1: Fiscal transparency 15 20 28 35 97.5 14%RA2: Revenue mobilization 52 68 75 71 265.0 38%RA3: Expenditure efficiency 27 37 51 38 152.5 22%RA4: Debt sustainability 38 47 51 50 185.0 26%Average number of DLIs achieved per state participating 4 4 4 5Average disbursement per state participating (US$ million) 5-6 5-6 5-6 5-6
66. On average, each of the States participating in the Program will receive US$19 million in total from the PforR financing component - around US$5 million per fiscal year. The annual amount is equivalent to just over N1.5 billion per state, which is the value of 2 months of financial assistance under the Budget Support Facility33. Even though the amount is smaller than the total annual financial assistance from the FGN, it is expected that states will still want to participate in the Program because the DLIs are aligned to reforms that they are already undertaking, because their needs for additional financing remains high, and because the financing will be in the form of grants from the FMoF rather than ‘on-lend’ as loans. Most states had gross borrowing needs exceeding N20 billion in 2016; it is expected that gross borrowing needs will be similar or even higher during 2017-2021.
67. While states achieving more results will receive a higher than average amount of PforR financing, lagging states should still receive a significant amount of financing. The Program is designed to allow lagging states the possibility to meaningfully participate by having the opportunity to enter the Program in years 2 or 3, by defining DLIs in relative terms (to the states’ own individual baseline), by breaking down some DLIs into sub-components and by having basic results that are easier to achieve. Stronger states participating in the Program every year and achieving higher number of DLRs and stretch results are likely to receive up to US$25-30 million in total, while lagging states which enter the program in Year 2, achieve lower number of DLRs and mostly basic results are estimated to receive US$12 million in total. The difference between the two scenarios is large enough to incentivize middle-performing states to improve their performance to achieve more DLIs and stretch results.
F. Capacity Building and Institutional Strengthening68. Capacity building and institutional strengthening are critical elements of the SFTAS Program and will be delivered through the IPF TA component (please see Section C above and Annex 10 for a detailed description). Capacity-building of participating states in the program KRAs will support them to achieve the DLIs and receive the performance-based financing. The capacity building component will be available to all states with demonstrated need, but will target those states not currently receiving TA support on PFM and fiscal management from the World Bank and other development partners. Upfront preparations are being done to ensure that the TA activities can start once the Program is effective, and careful attention will be paid on the
33 The most recent monthly disbursements as an extension of the Budget Support Facility were N900m-N1bn per State (approximately US$3 million)
30
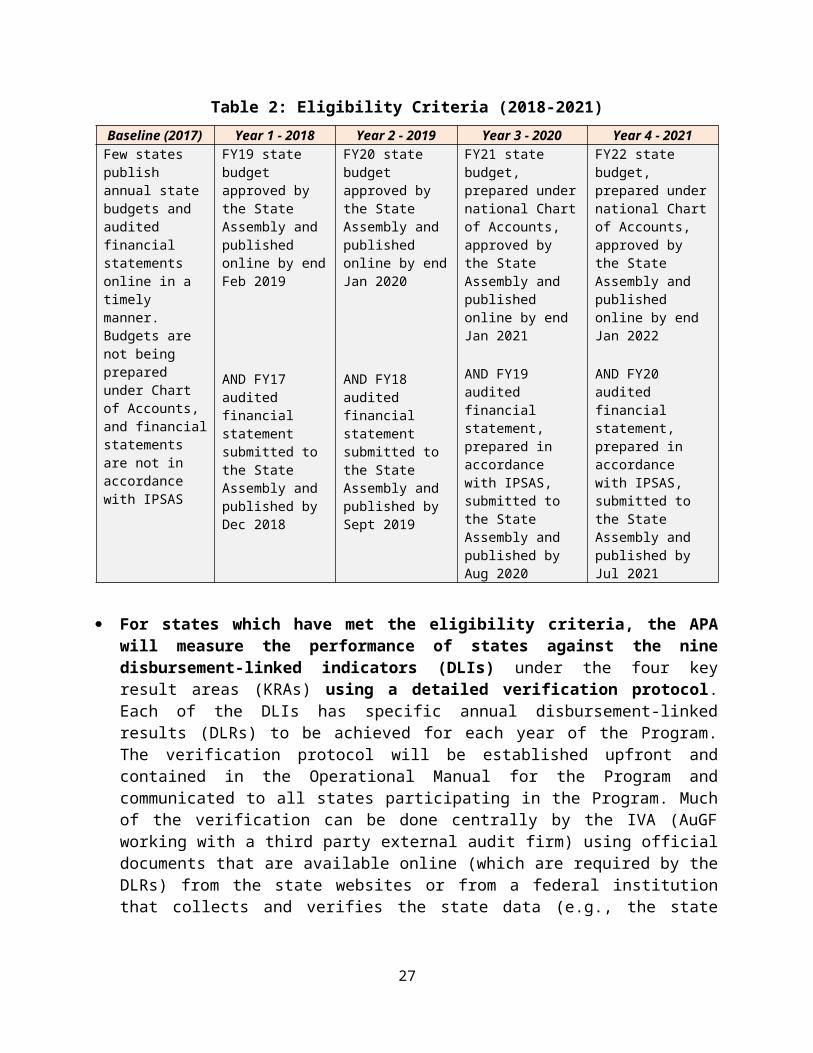
sequencing of the TA activities, accelerating those activities which are most critical to helping states achieve the DLIs in the first and second years of the program.
Table 8: Specific Areas of Capacity Building at State LevelSFTAS Program DLIs Areas of Capacity Building Focal AgenciesEligibility Criteria Preparing financial statements
according to IPSAS standards Preparing annual state budgets
according to the chart of accounts Auditing financial statements
State Accountant General’s Office
State Budget Office State Auditor
General’s Office
DLI #1: Improved financial reporting and budget reliability
Preparing budget implementation reports
State Accountant General’s Office
State Budget Office Preparing MTEF containing credible
revenue and expenditure forecasts State Budget Office State Ministry of
FinanceDLI# 2 Increased openness and citizens’ engagement in the budget process
Conducting citizens engagement and knowledge forums;
Preparing citizens budget and accountability report
State Budget Office
DLI# 3 Improved cash management and reduced revenue leakages through implementation of State TSA
Cash management strategy Implementation of state-level IFMIS
and adoption of TSA
State Accountant General’s Office
State Ministry of Finance (Treasury)
DLI # 4: Strengthened Internally Generated Revenue Collection
Developing a consolidated revenue code at the state level
Strengthening state tax administration systems and tax policy (e.g., taxpayer registration, design of presumptive tax regime and property tax34)
State (Boards of) Inland Revenue Services (SBIRS)
DLI # 5: Biometric Registration and Bank Verification Number used to reduce payroll fraud
Strengthening biometric capture and payroll/HR database alteration protocols
State Head of Office
DLI # 6: Improved procurement practices for increased transparency and value for money
Development of state-level eProcurement strategy
Implementation of the eProcurement business process and change management
Adoption of Open Contracting Data
State Procurement Board
34 In September 2017, the World Bank in collaboration with the IMF carried out a TADAT appreciation workshop for 18 State governments in Nigeria. The forum provided an opportunity for these officials to self-evaluate tax administration/revenue mobilization operations across the states. Benchmarking their operations against the twenty-eight indicators and forty-seven dimensions of the TADAT framework, the state officials could identify and prioritize the various binding constraints to effective and sustainable revenue generation at state level. Two key actions adopted by the forum were: (a) To improve taxpayer registration/databases, which by contemporary international best practice, constitutes the foundation for any effective tax administration system; and (b) To properly harvest the revenue opportunities and potentials derivable from the vast economic activities presently operating in the informal sector through measures such as the implementation of a presumptive tax regime and property taxation, amongst others
31

Standard (OCDS)DLI#7: Strengthened public debt management and fiscal responsibility framework
Domestication of Fiscal Responsibility Law (FRL)/Establishment of state public debt legislation
Usage of debt recording systems35
Preparing accurate and comprehensive quarterly debt reports
Development of medium-term debt management strategies to target an optimal debt portfolio
State Debt Management Departments
State Ministry of Finance
DLI#8 Improved clearance/reduction of stock of domestic expenditure arrears
Strengthening expenditure controls Operational risk management to
prevent frauds, errors and technical arrears
Preparation and publication of domestic arrears database
Development of domestic arrears framework
State Accountant General’s Office
State Debt Management Departments
State Ministry of Finance
DLI# 9: Improved debt sustainability
Conducting debt sustainability analysis
Development of medium-term fiscal policy and MTEF, which is consistent with debt sustainability
State Ministry of Finance (Fiscal Policy)
State Ministry of Budget and Planning
State Debt Management Departments
69. In addition, support will be provided to the FMoF’s HFD as the PCU to strengthen their capacity in program coordination, M&E, communications and outreach, financial management and procurement, and to the AuGF as the IVA.
III. PROGRAM IMPLEMENTATION
A. Institutional and Implementation Arrangements70. States will be responsible for achieving the program results and thus will be leading the implementation of the PforR component. To support the implementation of the Program in each state, a state steering committee will be established in each of the participating states. The membership of the committee shall include representation from the key MDAs responsible for achieving the DLIs: ministries of finance, budget and planning, state debt departments, state boards of internal revenue, state accountant generals, and state auditor generals. The state ministries of finance or budget and planning will be the state program coordination anchors, and the commissioners will chair the state steering committees. The commissioners will assign focal persons to coordinate the implementation of the Program across the KRAs and the coordination of the TA activities at the state level. Key responsibilities of each of the state steering 35 Several Debt Management Performance Assessments for Nigerian states (Lagos, Cross Rivers, Ondo, Edo etc.) show the weak capacity to record debt and poor systems for keeping debt data, loan records and securities around the debt database.
32

committees are to approve the annual state SFTAS action plan for achieving the Eligibility Criteria and the DLRs, which should include the annual capacity building activities for the state, to monitor progress of the annual state SFTAS action plan, to review the state’s result in the APA by the IVA, and to take remedial action if the state is unable to achieve the Eligibility Criteria and the DLRs.
71. The FMoF’s HFD, being the program manager on behalf of the FMoF, will house the PCU, with the Director of HFD as the National Program Coordinator. The HFD is the department within FMoF mandated to support financing to the states. It manages the FAAC allocation process and the BSF, disbursing the monthly amount from the BSF to states since 2016:
The PCU’s key functions are to: 1) coordinate state capacity building activities across the different implementing entities; 2) lead program communications and outreach activities from the government side; 3) lead monitoring and evaluation activities for the overall program (not the individual state performance assessments carried out by the IVA) analyzing overall program performance, gaps and identifying how the TA can help address these gaps; 4) disburse annual PforR financing to the states on the basis of the APA results from the IVA; 5) provide accounting and reporting for the Program; 6) act as the interface with the Bank’s supervision and implementation support team; and 7) act as the secretariat for the Central Steering Committee. Specialists working alongside Ministry staff to carry out these key functions will be provided for under the TA component. The PCU’s work will be guided by the Program’s operations manual.
Central Steering Committee: The Committee brings together the large number of players involved in the implementation of the FSP and OGP and strengthens their cooperation. This Committee shall be established with the following composition: FMoF HFD; FMoF International Economic Relations Department (IERD); Debt Management Office; Office of the Attorney-General of the Federation in the Federal Ministry of Justice (OGP Secretariat); PSIN; six State Commissioners of Finance (representing the six geopolitical zones); JTB; and the Statistics department at the Central Bank of Nigeria. The Committee, to be chaired by the Director of HFD, will meet at least quarterly to discuss the progress in the implementation of the Program across states, the PforR disbursements to states, the publication of the results of the APA, the delivery of the capacity building program to states. The specific roles and responsibilities of the Committee will be defined in the Program’s operations manual.
72. The capacity building support to states under the TA component will be delivered through implementing agencies. The following institutions, in addition to the PCU, have been identified as implementing agencies for delivering the capacity building support to states: (1) the PSIN; (2) Office of the Attorney-General of the Federation in the Federal Ministry of Justice (activities to be led by the OGP Secretariat housed in this Office); and (3) the Federal Debt Management Office (DMO). These agencies were selected as they have the mandate, technical expertise and experience in capacity building of state governments in the four KRAs of the Program. Where appropriate, these implementing entities will partner with local and regional training institutions to draw on their expertise and help them scale up the capacity building activities. As a result of the NGF’s unique capabilities and experience in organizing and delivery capacity building and learning activities to states, NGF will be engaged by the PCU as a project management firm to support the PCU to implement specific capacity building and learning
33

activities to states. The implementation arrangements for the TA component, including financial management and disbursement and procurement arrangements, have been designed to ensure that the TA is well coordinated across the implementing agencies, well planned while retaining flexibility, and to mitigate fiduciary risks. Significant planning and preparation will be done prior to program effectiveness so that the TA activities can start immediately to support states to achieve the results in the PforR component. The Bank, working with the PCU, will closely supervise the coordination and implementation of the capacity building activities by the implementing agencies. The agencies will develop annual capacity building work plans and budgets to be approved and to form the basis of disbursements.
73. The communication and outreach activities with states to support the Program implementation will be extensive. The Bank will work alongside the PCU to organize regular communication and outreach activities with key state-level stakeholders responsible for implementation, to keep the Program as a high priority for them and to clarify what is needed from states, starting before Program effectiveness and throughout the implementation period. It is envisaged that at least twice a year, there will be a peer forum convening stakeholders for all states to collectively review progress (based on the results of the APA), showcase and learn from success, identify and problem implementation challenges, and plan for the next year of the Program. The forums will leverage existing communities of practice of state commissioners of finance, budget and planning.
74. The Bank’s implementation support for the Program will be enhanced in recognition of the scale of the Program, the institutional capacity of the implementing agencies, the risks, and the need for close monitoring to facilitate timely response to program implementation challenges. The implementation support will include: (a) formal joint review missions (JRM); and (b) technical meetings and field visits outside the formal JRMs on a quarterly basis or more frequently if needed to provide oversight and TA on the capacity building, M&E, communications and outreach activities, and on the audit and FM reporting requirements. See Annex 9 for further details.
B. Results Monitoring and Evaluation75. A results framework for the Program (Annex 2) will guide the program monitoring and evaluation. The results framework is comprised of the PDO indicators and intermediate level result indicators drawn from the set of the DLIs. Each indicator has a baseline (2017) and end of program (2021) target (to be measured in 2022) for the total number of states achieving the results. As all the indicators in the results framework are drawn from the DLIs, the protocol for verification and assessment of progress of the indicators are those for the DLI verifications. The baseline numbers have been derived from Bank analysis of state-by-state historical (2011-2017) fiscal and debt data36 together with a baseline survey conducted by the Bank in May 2018 and completed by the individual states’ PFMUs and Commissioners of Finance on the status of the PFM and fiscal management reforms contained in the DLIs in their state as of end 2017. The target numbers have been derived from Bank projections of medium-term state-by-state fiscal performance together with a survey conducted by the Bank in May 2018 and completed by the individual states’ Commissioners of Finance on their estimates of their state’s achievement of the 36 Noting the caveats on accuracy of currently available state expenditure data in the absence of published state audited financial statements and budget implementation reports. State IGR and debt data have been verified by Joint Tax Board and DMO, respectively.
34

DLRs through the Program years. The Program is directly helping to strengthen state-level data issues through the DLIs and the APA will provide reliable data on the progress towards the end of program targets. The targets have been set by the Bank assessing the potential for improvement from the baseline from the consultations held with states, the experience from other Bank engagements with the states on PFM and fiscal reforms, and fiscal simulations.
76. The Program will not use a dedicated/stand-alone monitoring and evaluation (M&E) system. The overall coordination and responsibility for the program M&E will be assumed by the PCU in the HFD. The PCU will use the results of the APA to assess overall/aggregate program performance across all states and against the results framework. This will ensure that corrective measures can be taken early enough to support the achievement of DLIs by states individually and collectively to meet the targets for the Program. Currently, the M&E capacity of the HFD to monitor the implementation of the Program is weak. To address these weaknesses, an M&E specialist will be brought on board as part of the PCU to design and oversee the implementation of the M&E framework for the program.
77. The M&E should facilitate demand-side engagement, peer learning and healthy peer competition among states. The M&E should itself be consistent with the transparency and accountability focus of the FSP and OGP. Data on individual states performance against the DLRs collected during the APA should be published by HFD on a dedicated website for the program. Putting credible and timely information on the individual states performance in the public domain will help engage demand-side actors on the implementation of reforms. It will also facilitate peer learning and healthy peer competition between states that will help drive better results. These are some of the key recommendations from the PEA conducted.
C. Disbursement Arrangements78. The AuGF will serve as the IVA under the Program, working alongside a third-party external audit firm. The IVA and the external audit firm will verify all evidences of states achieving the DLRs in accordance with the approved verification protocol; this would entail central desk review and some physical verification at the state-level. The total disbursement per state will be determined by the number of DLRs achieved per state and the value of those DLRs achieved. The AuGF already audits several of the Bank’s lending operations in Nigeria. However, given the importance of having a credible, robust and objective verification process, a third-party external audit firm will be engaged to work with the AuGF during the four APAs, building further the capacity of the AuGF at the same time. The AuGF has agreed to be the IVA for the Program and to work with the third-party external audit firm. To ensure that the external audit firm is in place ahead of the first APA (January to March 2019), the procurement process has been initiated with the aim of having the ToRs cleared by the Bank and the publication/advert of the request for Expressions of Interest done by June 2018. In the Program Action Plan (PAP), the external audit firm will need to be appointed within 2 months of effectiveness and no later than November 2018.
79. The verification protocol and the verification/APA process details will be detailed fully in the operations manual, which is a condition of Program effectiveness. The detailed description will cover the process steps, timeline, roles and responsibilities of all parties involved (states, DMO and other federal institutions, AuGF/IVA, external audit firm, the PCU, and the Bank), information flows, dispute and resolution mechanisms. This will ensure clarity for all
35

parties involved to mitigate risks of delay in the process and ensure that the process is (and perceived to be) fair, objective and credible.
80. Annual disbursements for the performance-based financing will be triggered by the Bank’s decision to disburse after receiving evidence of the achievement of the Program DLRs through the APA process. The IDA credit proceeds will be disbursed to the federal government’s Special Fund Account which serves as a sub-account of the federal TSA held with the CBN and managed by the FMoF HFD as the PCU for the Program. The PCU will make disbursements to individual states from the Special Fund Account to the Consolidated Revenue Fund accounts of the state governments strictly based on the individual states’ APA results submitted by the IVA. No advances for the performance-based financing is expected to be made as given the complexity of doing so across multiple states. For states which have or will have their own performance-based financing operations (PforR or IPF with DLIs), the Financing Agreement includes a covenant to ensure that they will not receive SFTAS PforR financing on DLIs for which they have already received performance-based financing from other projects. During implementation, the Bank will check across the three operations before making PforR disbursements. The timing of the first-year PforR disbursements (April 2019) is after the elections (February 2019) to address the risk that the financing could be used towards campaign financing
81. To mitigate the risks of delays in the transfer of funds by the PCU to the state governments, service standards will be established to ensure that the transfers from the Special Fund Account to the states’ accounts occur in a timely fashion after the submission of the APA results and that the amount is strictly in accordance to the APA results. These service standards will be included in the POM, which is a condition of Program effectiveness.
Table 9: Program evaluation and Disbursements
Program Evaluation and Disbursements Year 1/2018 Year 2/2019 Year 3/2020 Year 4/2021
Period being evaluated: Calendar Year and Fiscal Year Jan-Dec 18 Jan-Dec 19 Jan-Dec 20 Jan-Dec 21Evaluation period Jan-Mar 19 Jan-Mar 20 Jan-Mar 21 Jan-Mar 22Disbursement Apr-19 Apr-20 Apr-21 Apr-22
82. The total PforR disbursement per year will be the aggregation of the total disbursement per state for all states participating for that year, subject to the overall financing envelope for the PforR component. Base case estimates of the number of states achieving each of the DLRs in each year of the Program has been made to guide the setting of the DLR values and estimate the disbursement profile for the Program. If states collectively under-perform relative to expectations for the year, the surplus allocated funding amount will be carried over to the subsequent year in case states collectively over-perform in the subsequent year. The carryover does not apply at the individual state level i.e. states do not receive the disbursements for the previous year if they did not achieve the DLR even if they achieve the DLR the next year.
83. Disbursement arrangements for the TA component. The Bank will directly disburse the funds for the TA component into designated accounts (DAs) opened at the CBN and managed by the respective implementing agencies. This arrangement was chosen to facilitate
36

smooth funds flows so that TA activities are not delayed by disbursement delays. A Naira draw-down account will be established by each implementing agency and from which Naira payments will be made for eligible expenditures and to service providers. Disbursements under the TA component will be made primarily as replenishments based on unaudited interim financial reports (IFRs) prepared by the respective implementing agencies and submitted to the Bank on a quarterly basis. The ceiling will be based on six-month forecast expenditures, and replenished quarterly for the same period. Details of the disbursement arrangements are provided in Annex 10.
IV. ASSESSMENT SUMMARY
A. Technical (including program economic evaluation)84. Program ownership and commitment: While the federal government initiated and coordinated the development of the FSP across states, there is a very broad consensus across heads of institutions responsible for fiscal management at the state level that the reforms in the FSP are necessary and are in the self-interest of states to implement. The public commitment from the 35 states participating in the BSF to implement the FSP has created a real sense of responsibility and accountability as exemplified by the regular reporting to NEC on FSP implementation.
85. The design of the FSP exhibits several strengths: (i) appropriate over-arching objectives; (ii) actions address key weaknesses in state fiscal management (acute lack of fiscal transparency and accountability; low IGR mobilization; inefficiencies in public spending; and poor compliance with debt management rules); (iii) actions build on various PFM reforms started by states; and (iv) the FSP encourages complementary parallel fiscal reforms.
86. However, the design of the FSP also has a number of shortcomings: (i) the 22 actions are a mixture of activities, outputs, intermediate outcomes and outcomes with varying impact potential but presented without any prioritization; (ii) there are gaps in the set of measures needed in order to fully achieve the five over-arching objectives; (iii) lack of specificity with many of the actions vaguely described; (iv) there is no accounting for differences in starting points and capacity of states to implement the measures; (v) the timeframe for the implementation is not long enough for the more complex reforms or for supporting sustained changes in fiscal behavior.
87. While all states have made at least partial progress, implementation of the FSP is far from complete. Several factors account for this: (i) the financial incentive was weakened as the FSP was not enforced by the FGN as strict conditions for accessing the BSF; (ii) some states with weak capacity struggled to implement measures and there was no program of TA to help them; (iii) some states suffered from lack of support among the civil servants and high level political will and leadership.
88. The design of the PforR seeks to address the shortcomings in the FSP design: (i) only selecting a subset of the most impactful FSP actions to include in the Program – those that are most critical in achieving the objectives; (ii) including complementary demand-side OGP commitments and other interventions that addresses the gaps identified in the FSP. These include: public budget consultations and citizens budget; improving budget credibility; use of e-
37

procurement and open contracting; clearance of domestic arrears; (iii) establishing a specific and clearly defined matrix of DLIs and DLRs, verification protocols and results framework; (iv) DLIs and DLRs are designed to account for the heterogeneity of states, offering incentives for stronger states to improve their performance further, while rewarding weaker/lagging states for strong commitment and effort; and (v) the Program measures results across four fiscal years giving time for implementing complex reforms and incentivizing sustained improvements.
89. Learning from the FSP implementation challenges, the Program will strengthen capacity of states to carry out reforms and create stronger incentives for states: (i) it will be clearly communicated to all states that disbursement for the performance-based financing component will only be made on achievement of clearly defined DLRs against detailed verification protocols, verified by the IVA. Any changes to the DLRs will undergo a formal process of review and approval and will be applied across the board for all states; (ii) capacity building support will be made available to states through the TA component to support them to achieve the DLIs; (iii) the Program will proactively create an environment for healthy peer competition and peer learning by publishing individual states performance against the DLI matrix for each result year.
90. Expenditure Framework: The overall program expenditure framework for 2018-2021 is estimated at 996 billion naira/US$3.27 billion. The state-level FSP and the fiscal transparency actions in the OGP NAP supported by the SFTAS Program is implemented by the following key finance entities: state ministries of finance (including treasury, state debt departments), state ministries of budget and planning, state boards of internal revenues, and state office of accountant generals. The state-level FSP and the fiscal transparency actions in the OGP NAP supported by the SFTAS Program covers the full scope of core functions and activities of these institutions. Implementation of the government program primarily requires staff time, consultants, workshops and training, which corresponds to recurrent spending of these institutions. The expenditure program boundary for the Program is defined as the total estimated recurrent spending by the states’ key finance entities (under the Financial and Fiscal Services Sub-Function) of all the state governments (given that we expect all states to participate in the Program) for the Program duration period of 2018-2021 (final disbursements for results achieved at the end of 2021 will be made by end-2022). The estimated spending figures are derived from the states’ latest MTEFs. The IDA contribution to the Program of US$750 million amounts to 23 percent of the program expenditure framework of US$3.27 billion over the four-year period.
91. Rationale for public provision and financing. Fiscal and public debt management is a core function of government at all tiers. State governments account for on average 37 percent of total expenditure across three tiers of government, including most of the spending in health and education. The Program seeks to improve fiscal management and sustainability to establish a foundation for states to eventually spend more and spend better in a transparent, accountable and fiscally sustainable manner to the benefit of its citizens. In addition, improving state fiscal performance will reduce one major source of fiscal risks for the federal government.
92. Value-added of the Bank’s support: (i) the Bank’s financing will increase the financial incentives and capacity building support to states to undertake FSP and OGP-related fiscal reforms; and (ii) the Bank’s global knowledge and experience with implementation of fiscal reforms will be helpful in incorporating international good practice to the reform process.
38

93. The Program could generate substantial benefits in terms of increasing the fiscal resources for productive public expenditures for participating states. The increase in fiscal resources is estimated as the difference between a base case ‘without Program’ fiscal scenario where the 36 states and FCT’ fiscal performance continues on the same trajectory with a fiscal reform ‘with Program’ scenario where the 36 states and FCT strengthen their fiscal performance in terms of increased IGR, improved expenditure efficiency, and lower fiscal deficits. The analysis estimates that the 36 states and FCT could increase their annual capital expenditure in the reform scenario compared to the base case by 192 billion naira on average during 2018-2022. In addition, the average annual fiscal deficit is lower by 710 billion naira in the reform scenario compared to the base case. States therefore have further room for additional productive spending while reducing their deficit and gross and net borrowings.
B. Fiduciary94. The Integrated Fiduciary Systems Assessment (IFSA) concludes that the Program’s integrated fiduciary systems have the capabilities to provide reasonable assurance that the financing proceeds will be used for intended purposes with the objective of supporting the achievement of the Program objectives. Nevertheless, the assessment has found that there are several weaknesses and risks in the overall fiduciary systems of the Program, warranting the design of action plans to mitigate them. For this Program, the key integrated fiduciary risks are the following: (a) weak internal control - the internal audit process is largely focused on pre-payment audits, leakages remain in the expenditure management system due to dearth of risk-based internal audit and control processes and lack of focus on systemic issues. This could create a fertile ground for fraud and corruption in budget execution, hence undermining the economy, efficiency, and effectiveness of spending; (b) weak procurement capacity to support the tenets of good procurement practices of transparency, competition, and value-for-money; and (c) weaknesses in compliance with the established legal and institutional framework for combating fraud and corruption at the Program level, which could undermine the ability of the authorities to detect and address the occurrence of fraud and corruption risk in a timely and effective manner. These risks will be mitigated progressively through the implementation of the PAP and the TA component. Hence, the overall Program integrated fiduciary risk is rated ‘substantial’.
95. There is ample legal and regulatory framework in place in Nigeria on fraud and anti-corruption. The main piece of legislation is the Corrupt Practices and other Related Offences Act, 2000. Nigeria has also ratified the United Nations Convention Against Corruption (UNCAC) in 2004. On transparency, Nigeria joined the OGP in May 2016. Recently, in July 2017, the Government of Nigeria adopted a National Anti-Corruption Strategy for the next 5 years, in the bid to institutionalize the fight against corruption in the country. Although there is little evidence that investigations into fraud and corrupt practices are systematically carried out by law enforcement agencies, the existing legal and institutional frameworks are robust enough to build on to effectively mitigate against fraud and corruption. To that effect, adequate provisions are incorporated into the PAP.
C. Environmental and Social96. An Environmental and Social Management System Assessment (ESSA) was conducted to review the existing systems for environmental and social management and assess how these systems perform in practice. The ESSA was carried out at the Program level
39
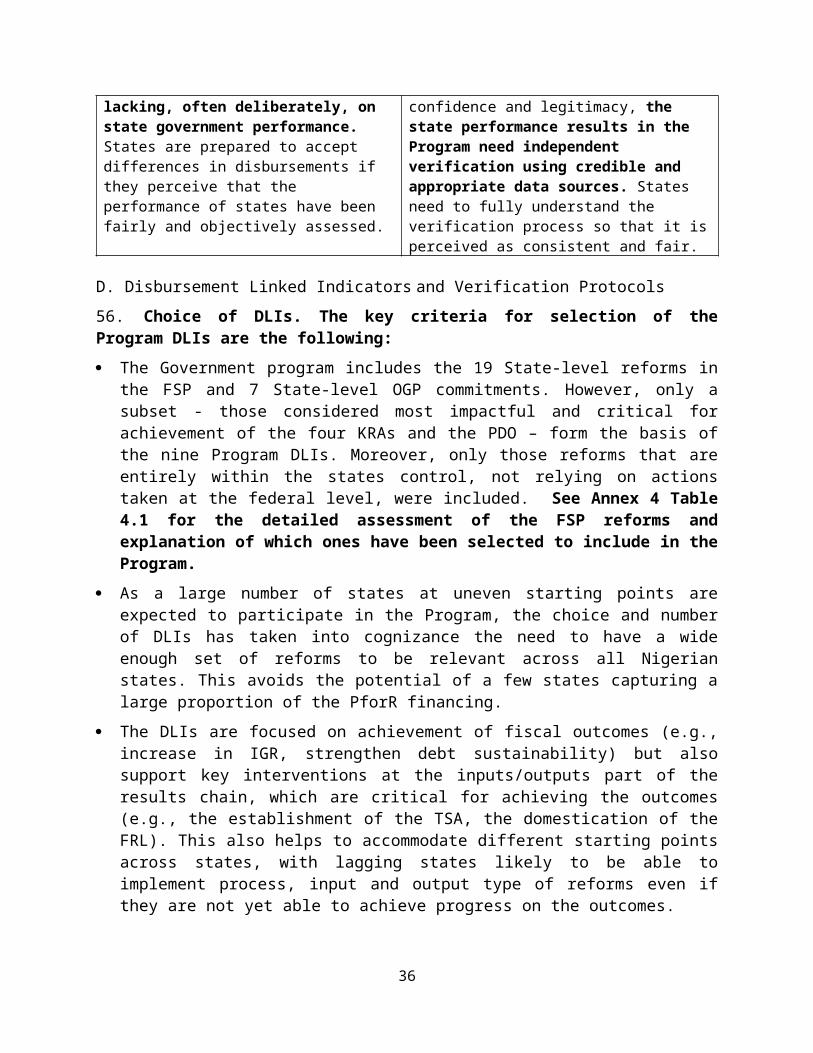
and drew on the Bank’s, development partners’, and borrower’s existing knowledge, as well as on analysis carried out during the preparation of the PforR operation. Its main conclusion is that there are, largely, adequate policy, institutional, and legal capacity and provisions to ensure that the social and environmental effects are positive. The Bank has agreed with the government on specific actions to strengthen the social management systems to ensure positive benefits, which have been incorporated into the PAP
97. Environment Assessment. In terms of environmental risks, the activities planned under the proposed Program do not include any physical interventions such as construction, rehabilitation, or renovation works. Hence, these activities are environmentally benign and will not cause any negative environmental effects, any loss or conversion of natural habitats, any changes in land or resource use, or any environmental pollution. Therefore, the project poses no risk to the environment because of planned Program activities. Instead, the ESSA identify areas where the Program could potentially bring about positive, indirect environmental benefits through improved governance i.e., greater fiscal transparency and accountability.
98. Social Assessment. The social management assessment shows that the Program operates within an adequate legal and regulatory framework, which is well suited to address potential social issues that may arise from implementation of Program activities (although none are being envisaged at the time of the assessment).
99. SFTAS supports citizen engagement and participation in the budget process. Citizen engagement increases local ownership, enables greater information sharing and transparency, and should be the basis of beneficiary engagement and trust building. Citizen engagement needs to be supported by institutional capacity and a vision. The project would require dedicated staff to oversee the social mobilization process and incorporate social concerns in all operational and M&E processes and manuals.
100. The social risk rating is ‘low’, as no major risks have been identified from the Program implementation.
101. The PforR will support the development and implementation of Grievance Redress Mechanisms (GRMs) for the main activities supported by the Program. Thus, under the PAP, tailored GRMs will be implemented. The GRMs ensures that complaints received are promptly reviewed to address pertinent concerns. Affected individuals may submit their grievance in the first instance to existing public complaints agency/citizen mediation centers in states and local authority’s level. However, it could be escalated to the World Bank’s independent Inspection Panel, which determines whether any harm occurred, or could occur, because of non-compliance with the World Bank’s policies and procedures.
102. Grievance Redress. Communities and individuals who believe that they are adversely affected because of a Bank supported PforR operation, as defined by the applicable policy and procedures, may submit complaints to the existing program grievance redress mechanism or the World Bank’s Grievance Redress Service (GRS). The GRS ensures that complaints received are promptly reviewed in order to address pertinent concerns. Affected communities and individuals may submit their complaint to the WB’s independent Inspection Panel which determines whether harm occurred, or could occur, as a result of WB non-compliance with its policies and procedures. Complaints may be submitted at any time after concerns have been brought directly
40

to the World Bank's attention, and Bank Management has been given an opportunity to respond. For information on how to submit complaints to the World Bank’s corporate GRS, please visit http://www.worldbank.org/GRS . For information on how to submit complaints to the World Bank Inspection Panel, please visit www.inspectionpanel.org .
D. Risk Assessment103. The assessment of the overall risk is rated substantial. The key risks to the success of the Program are political and governance, macroeconomic, technical design of program, institutional capacity and sustainability, and fiduciary.
104. Political and governance risk is substantial. Political will and support at the federal level is important for the success of the government programs supported by the PforR. CBN and DMO should continue to monitor the debt sustainability of states and fully enforce subnational borrowing rules, which they have been doing more effectively since 2015. FMoF should continue to advocate for the sustained implementation of the FSP; the disbursements from FMoF to states from the extension of the BSF since June 2017 have been more strongly linked to compliance with FSP actions. At the state level, the political risks are substantial as the Program works across multiple states with varying political environments and governance challenges. The national elections in February 2019 is a country-wide source of uncertainty and risk. Federal and state governments may focus more energies to political campaigning and re-elections than on implementing reforms. A change in administration may lead to lower (or higher) high-level political commitment to the reforms. These are risks that cannot be fully mitigated, but can be lowered through the following: 1) continuing the strong partnership with the NGF throughout the Program implementation as the NGF is an effective platform for policy dialogue with the state governors; 2) facilitating within the Program increase in citizens’ demand for good fiscal governance; 3) facilitating healthy peer competition (as well as peer learning) among states within the Program; and 4) securing ongoing support from NEC, which is the highest federal-state policy coordination body in Nigeria. On March 22, 2018, the Federal Minister of Finance formally presented the Program to NEC, chaired by the Vice President, and the Program was endorsed by all the state governors. Throughout the program implementation, it will be important to engage regularly with NEC to maintain support for the Program at the political level. Furthermore, the timing of the first-year PforR disbursements (April 2019) is after the elections (February 2019) to address the risk that the financing could be used towards campaign financing. Finally, in scenario where the state politics are not conducive to implementation of the Program, states can opt not to participate in the Program, and this does not directly affect the performance of other states in the program. With these actions, the residual risk is assessed as substantial.
105. Macroeconomic risk is rated high. While the economy has come out of recession in 2017, fiscal revenues are only expected to increase slightly from the low levels of 2015-6. From 2018 onwards, the recovery of fiscal revenues back to pre-2015 levels is subject to risks as it is reliant on raising oil production, oil prices, and on the Government’s ability to increase non-oil revenues. Low levels of federation revenues over the medium-term will continue the fiscal pressures on the states, making the achievement of some of the PforR results more challenging and the overall achievement of the fiscal sustainability objective of the PDO. As a mitigating factor, the FGN, in developing the ERGP, is committed to ensuring the economy recovers and has targeted increasing non-oil revenues to reduce the reliance on oil revenues, while taking measures to increase government revenue share from the oil sector. However, these non-oil
41

revenue targets are very ambitious and it will be a difficult process to get the oil industry to agree to all the oil revenue measures. While several of the reforms supported by the Program will strengthen the states’ resilience to macro-fiscal shocks, for example, increasing IGR and stronger debt management, these actions do not fully mitigate the country-wide macro-fiscal risks, so the residual risk is assessed as high.
106. Sector strategies and policies risk is rated moderate. Most states have medium-term sector strategies and policies aligned with the critical areas supported under the Program (including revenue mobilization, expenditure rationalization and payroll management, budget frameworks, and improvements in the systems of accounting and reporting) defined as part of their respective state development plans. However, implementation has often been hindered due to the absence of legal frameworks. The Program supports the establishment of key legal and regulatory frameworks to support IGR collection, procurement, debt management and fiscal responsibility.
107. Technical design of Program risk is rated substantial. As discussed in the Technical Assessment, the government programs supported by the PforR are strategically relevant and technically sound. Where there are shortcomings in the government programs, the Program’s technical design and implementation arrangements tries to address them. The Program technical design and implementation arrangements have been heavily informed by analytical work by the Bank (including the political economy analysis), the expertise of FMoF and NGF, and inputs from extensive consultations with states (state commissioners of finance, budget and planning, and accountant generals) who will be directly involved in implementing the Program. However, there is inherent complexity and uncertainty from the program working across multiple (potentially all 36 states) and diverse set of states in terms of starting point and capabilities. The preparation process (extensive consultations with all 36 states), the design of the program (a common DLI matrix designed to account for the heterogeneity across states) and the TA component help to mitigate the risks of working across multiple states. A further risk is the increased potential for fraud in the verification process of the DLIs when working across multiple states. The risk mitigation measures include: a strong verification process that has an external audit firm working with the AuGF as the IVA to assess states’ performance using clearly defined protocols; the publication of the verification process results; and strengthened state-level fraud and corruption/complaints redress mechanism.
108. Institutional capacity for implementation and sustainability risk is rated substantial. The uneven capacity across states implementing the 22-point FSP, as well as the core commitments under the OGP, pose challenges to successful implementation of the Program, as institutional building takes time to achieve sustainable outcomes. However, the Program’s TA component will help mitigate the impact of the risk by building the capacity of states to implement the government program and achieve the DLIs.
109. Fiduciary risk is rated substantial. Systemically, fiduciary risk, including PFM, procurement, and fraud and corruption, remains substantial across states and have tended to undermine expenditure management and control. To mitigate the key Program fiduciary risks of weak internal control over public expenditure, weak procurement capacity, and weakness in compliance with the established legal and institutional framework for combating corruption, the following actions in the Program Action Plan will be implemented: i) introduction of risk-based internal audit function out of the expenditure processing cycle in pilot MDAs, and ii)
42

strengthening state-level fraud and corruption/complaints redress mechanisms to incorporate the Program. The Program DLIs themselves, in particular DLI#6 on procurement, which strengthens the public procurement legal framework and increases transparency through e-procurement and adoption of OCDS, will also help mitigate the risks. The Bank’s engagement with states through other PFM-related projects to improve financial management systems, procurement compliance, and renewing the legal and regulatory framework for budget management will also help to mitigate the risks. The risk of misuse of funds for soft expenditures (especially travels, workshops, training, study tours) in the TA (IPF) component is mitigated by selecting implementing agencies based on thorough readiness, financial management and procurement assessments, and with the implementation of an enhanced accountability framework that includes requirement of Bank’s TTL prior clearance before capacity building activities are undertaken and the establishment of a demonstrated linkage between the rationale for the capacity building activities and the program objective. In addition, the governments cashless policy shall be implemented and as such no cash payments will be allowed. Annual procurement audit will be conducted on the procurement carried out. With these mitigation measures being taken, the residual risk is rated substantial for both the PforR and the TA (IPF) components.
110. Environmental and social risks are rated low. No significant safeguards risks are expected to arise from this operation. Instead, the Program will seek to enhance public accountability and transparency of the fiscal sector. The expenditure framework boundary and the supported Program boundary have no impact on capital spending, since recurrent costs of state governments will constitute the expenditures to be financed. A detailed ESSA has been prepared to serve as the enabling platform for responding and/or managing any emerging risks in this area.
111. Stakeholders risk is rated substantial. There have been regular and extensive consultations with all key stakeholders involved in the Program’s implementation at the federal and state level. At the state level, consultations have been held with all the state commissioners of finance, budget and planning and accountant generals and the Program has been formally approved by the state governors at NEC. All stakeholders have expressed strong interest in the Program as it supports two government programs that have already been committed to by the FGN and the states. As of 15 May 2018, 32 states have submitted formal expressions of interest to FMoF participate in the Program, signed by the state governor and commissioner of finance. During program implementation, there will be extensive communications and outreach activities, including to civil society. However, given the large number of stakeholders involved and the fact that the elections will bring in new key government personnel, the residual risk is substantial.
E. Program Action Plan112. A PAP has been developed containing the key actions required to support the implementation of the Program including the key actions from the Technical, Fiduciary, and Environment and Social Assessments. The PAP matrix (Annex 8) describes the key actions, due dates of delivery, responsible parties, and completion measurement.
43

Table 10: Summary of Program ActionsAction Description
1. Provision of templates/guidelines for increase citizens’ engagement in the budget process (DLI#2)2. Provision of guidelines for developing a consolidated state revenue code (DLI#4)3. Provision of guidelines for strengthening the public procurement legal framework (DLI#6)4. An independent procurement audit conducted on random sample of at least 5 percent of state
government capital procurement transactions for states achieving DLI#65. Provision of templates/guidelines to strengthen debt management, monitoring and analysis (DLI#7)6. AuGF shares letter of understanding of the role of AuGF as the IVA for the Program to FMoF7. The DLI verification protocol contained in the program operational manual is distributed and
sensitized with technical staff of key state institutions leading the implementation of the Program 8. Hiring of the third party external audit firm to work with the AuGF as the IVA9. Baseline and end of program state-level surveys to assess level of public access to procurement
data and procurement efficiency to verify DLI#6 on procurement10. Strengthen procedure used by the DMO to check the accuracy and comprehensiveness of quarterly
state debt reports to provide the IVA with data to support the verification of the debt-DLIs 11. Provision of interim reports for full year state expenditure and revenue from the State Auditor
Generals and other supplementary evidence for verification of DLIs 12. Development of the draft of the POM for clearance13. Appointment of key personnel for the Program Coordination Unit (PCU) housed in the FMoF
Home Finance Department: Program manager, FM specialist and Procurement specialist 14. Contracting of NGF as a project management firm to support the PCU to implement specific
capacity building and learning activities to states under the TA (IPF) component15. Ensure PCU is adequately staffed throughout the program duration 16. Establish central SFTAS steering committee17. Development of the 2018-2019 work plan for PCU, including support to the IVA, communication
and outreach activities 18. Development of the detailed overall plan for capacity building to states by the PCU, followed by
the annual work plan and budgets of implementing agencies19. Participating states establish the state-level SFTAS steering committee, assign the Chair and assign
the focal points for the Program implementation and coordination of capacity building activities 20. Participating states develop SFTAS annual action plans achievement of the Eligibility Criteria and
DLRs, including capacity building activities21. Formal policy and procedural guidance note accepted by participating states on fraud and
corruption /complaints redress mechanism under the Program22. Ensure existing state-level fraud and corruption/complaints redress mechanisms incorporate the
Program.23. States submit audited financial statements for the SFTAS Program Audit24. Introduction of risk-based internal audit function outside the expenditure processing cycle 25. Include environmental and social management rules in the operation (in compliance with PforR
core principles)26. Create awareness for the use of the states’ ombudsman to protect basic human rights of people
potentially affected by the SFTAS
44

Annex 1: Detailed Program DescriptionI. Program Background and Context: Sectoral and Institutional Context
A. The Role of States37 in Fiscal Management
1. Fiscal management occurs at all three tiers of government: federal, 36 state governments and FCT, and 774 local governments. The sub-national fiscal framework in Nigeria consists of expenditure responsibilities and tax assignments, inter-governmental fiscal transfers, and a fiscal policy framework that seeks to ensure overall macroeconomic stability. The expenditure responsibilities and tax assignments are established by the 1999 Constitution and other relevant legislation and policies. Inter-governmental fiscal transfers are based on revenue allocation formulae proposed by the Revenue Mobilization Allocation and Fiscal Commission and approved by the National Assembly. The FGN established a framework to control fiscal deficits and public sector borrowing through the DMO Act of 2003, Federal Fiscal Responsibility Act (2007), Investment and Securities Act (2007), and External and Domestic Borrowing Guidelines (2012, revised).
2. State governments account for on average 37 percent of total expenditure across three tiers of government, while receiving about 41 percent of total revenues. Most of the fiscal revenues, including oil and gas and the key non-oil taxes (corporate income tax, excises), are collected by the FGN into the federation account to be subsequently shared to different tiers of government as statutory transfers by the FAAC according to a formula. VAT is collected by both FGN and States, but pooled and distributed by FACC to the different tiers of government according to a formula. Revenues collected and maintained by States - known as IGRs38 – represented on average 22 percent of total revenues accruing to all States (16 percent excluding Lagos39 and FCT) between 2011 and 2017. The States’ vertical fiscal gap (defined as [state government (SG) share of spending (percent)- SG share of revenues (percent)] / [SG share of spending (percent)]) is larger than in all OECD countries in 2011.
3. The overall fiscal sector in Nigeria is characterized by persistently low level of domestic revenue mobilization, severely limiting the level of public expenditure. Nigeria’s revenue to GDP ratio was already one of the lowest globally and has further declined with the collapse of oil revenues to 6 percent of GDP. As a result, total government expenditure is only 10 percent of GDP, which is less than half of structural or regional peers, and does not allow Government to adequately finance core public services or key public infrastructure investments to support economic growth. While Nigeria’s total public debt stock is low by international levels, it’s growing due to the widening of fiscal deficits since 2014 and debt servicing is becoming an issue due to the low revenues.
4. The fiscal federalism framework does little to compel states to be fiscally transparent and accountable, adopt good public financial management practices and exercise prudent fiscal management. States are not required to report budget outturns to the FGN. There is weak transparency and accountability within the states with budget
37 For the analysis in this section all states or total states refer to the aggregation of all 36 States and FCT.38 In 2016, 57 percent of IGR came from pay-as-you-earn (PAYE), 24 percent from state agency fees, 4 percent direct assessment, 3 percent road taxes and 13 percent other taxes.39 Lagos revenue structure is markedly different from the other 35 States and FCT as it raises significantly higher IGR. IGR represented an average of 67 percent of total revenues to Lagos during 2011-2016.
45

implementation reports and annual audited financial statements mostly not published at all or published with a significant time lag and not available/accessible to the public. On the revenue side, the incentives to improve IGR collection have been weak in the past given the relative size of statutory transfers and the ability of states to borrow relatively freely from commercial banks to finance spending. As a result, states have weak tax administration capacity and lack a consolidated tax (IGR) code. In terms of expenditures, weak cash management and commitment controls have allowed large accumulation of domestic expenditure arrears (salaries, pensions and contractor payments). In terms of fiscal deficits, while FGN deficit limits are set by the FRA (2007), limiting FGN deficits to 3% of national GDP, only 22 out of 36 states to date have passed state-level fiscal responsibility laws (FRLs) and many of them do not set limits on fiscal deficits. The fiscal policy framework sets a limit of 1 percent of national GDP for the aggregate fiscal deficits of states, which appears to have been achieved (although 2015 and 2016 reached the limit), but do not set limits within that ceiling at the individual state level.
5. There are several formal rules on public sector borrowing at the state-level, but many guidelines and rules were not fully adhered to before July 2015. Key rules include: (1) no commercial bank borrowing without approval from the FMoF40; and (2) liquidity and solvency debt thresholds where states should only be able to borrow externally and from the domestic capital markets if their debt stock to revenue ratio is less than 50 percent41 and their debt service to revenue ratio is less than 40 percent42. However, adherence and enforcement of these guidelines was weak, with some states borrowing from commercial banks without prior approval before the first financial assistance package from the federal government to the states was put in place in July 2015.
B. Fiscal Governance Challenges
6. Weak governance across all tiers of government remains a significant challenge and is reflected in Nigeria’s low ranking among several international governance indices. Nigeria fares badly in most international benchmarking across a wide range of governance indicators43, including those related to fiscal governance. According to OBI, which ranks Nigeria in the bottom quartile on fiscal transparency, no significant improvements have happened from 2008 to 2016. Public trust in government is one of the lowest among African countries with only 30 percent of Nigerian citizens trusting government44, this general lack of trust hampers fiscal
40 DMO Act, 2003, Section 24; Domestic Borrowing Guidelines, 2008-2012, para 2.2.4; Revised External and Domestic Borrowing Guidelines for Federal and State Governments and their Agencies, 2012, Section G, para a. 41 ISA, 2007, Sections 222-223; Revised External and Domestic Borrowing Guidelines for Federal and State Governments and their Agencies, 2012, Section F, paragraph c. 42 Revised External and Domestic Borrowing Guidelines for Federal and State Governments and their Agencies, 2012, Section F, paragraph f; External Borrowing Guidelines, 2008-2012, paragraph 2.2 (iii); Domestic Borrowing Guidelines, 2008-2012, paragraph 2.2.4. 43 Including the following: 1) Nigeria ranked 148 out of 180 countries by the Transparency International Corruption Perception Index in 2017; 2) Nigeria’s rating under the Worldwide Governance Indicator has not improved for the past ten years and even deteriorated on control of corruption while improving lately on voice and accountability; 3) Under the Ibrahim Index of African governance, Nigeria’s ranking has remained unchanged for the past ten years as well, below African average; and 4) The National Bureau of Statistics released a 2017 survey (Corruption in Nigeria. Bribery: Public Perception and Responses) according to which the two “most pressing challenges facing democracy in Nigeria” are perceived by Nigerian citizens as corruption (by 32% of respondents) and bad governance (22%)44 Afrobarometer, 2016, Violent extremism in Africa. Public opinion from the Sahel, Lake Chad, and the Horn.
46
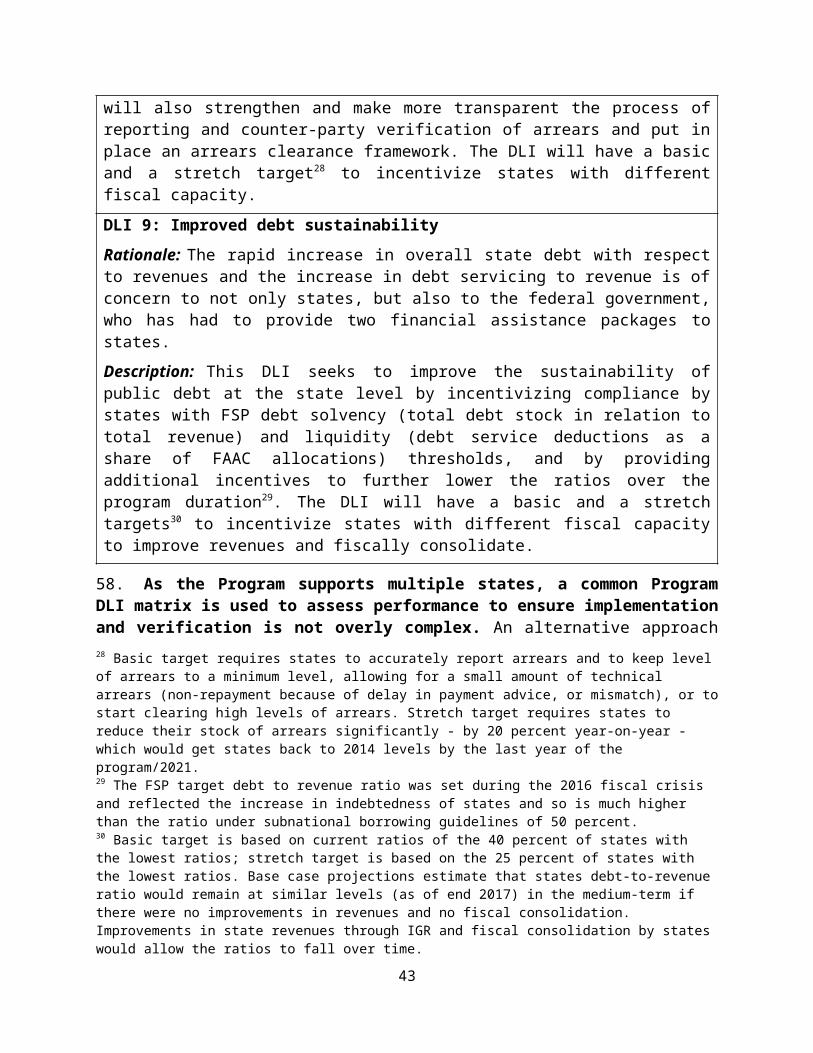
management, in particular tax revenue mobilization. 70 percent of Nigerian taxpayers claim that the reason they don’t pay taxes is because “people can’t see taxpayer money at work”45.
7. Strengthening anti-corruption and improving fiscal transparency and government accountability to citizens is high on the agenda of the Nigerian Government. The current administration introduced a package of governance reforms in 2015, including new anti-corruption institutional and legal reforms, transparency and social accountability initiatives under the Open Government agenda after Nigeria became a member of the Open Government Initiative in July 2016, further public financial management (PFM) reforms to strengthen fiscal discipline and accountability, reforms to strengthen statistical data collection, validation and use of statistical information to inform policy making, and civil service reforms.
C. Historical Fiscal Performance 2011 to 201446
8. The fiscal performance of states (Figures 1.1-1.3) during 2011-2014 made them vulnerable to the macro-fiscal shocks of 2015-16. In nominal terms, total state revenues stagnated between 2011 and 2014 and fell as a share of national GDP - from 5.5 percent to 4.0 percent as FAAC allocation (mostly oil revenue sharing) fell from 3.9 percent to 2.7 percent of GDP, while VAT and IGR stagnated at 0.4 and 0.8 percent of GDP. IGR in all states except Lagos and FCT increased only slightly from 9 percent of total revenues in 2011 to 14 percent in 2014; statutory transfers remain more than three-quarters of revenues. In only two states (Rivers with 31 percent and Lagos with 68 percent), IGR represented more than 30 percent of revenues in 2014.
9. With limited growth of the resource envelope, state expenditures stagnated and declined as a share of national GDP - from 5.7 percent in 2011 to 4.2 percent in 2014. During this period, recurrent spending increased from 48 percent to 60 percent of total spending, driven by increase in personnel spending, while capital spending fell from 52 percent to 40 percent of total spending. In nominal terms, capital spending declined from 1.9 trillion Naira in 2011 to 1.5 trillion Naira in 2014, while personnel spending increased from 0.55 trillion to 0.94 trillion.
10. The fiscal deficit for all states remained below 0.5 percent of GDP during 2011-2014 and the total debt stock for all states remained constant around 2.4-2.5 percent of national GDP. The composition of debt shifted towards commercial bank loans, which increased from 22 percent of total debt to 26 percent by 2014 as states borrowed relatively freely from commercial banks during 2011-2013. Domestic arrears stayed significant throughout the period at an average 29 percent of debt. Both commercial bank loans and domestic arrears were typically short-term, with the principal repaid or rolled over within one year.
11. While the total state debt-to-GDP ratio remained constant, the relative decline in revenue has meant that debt-to-revenue and interest payment-to-revenue ratios for all states increased. The debt-to-revenue ratio for all states increased from 45 percent in 2011 to 62 percent in 2014, higher than the debt threshold rule of 50 percent. Individually, 17 states (including FCT) had a debt-to-revenue ratio higher than 50 percent in 2014. The annual interest payment-to-revenue ratio for all states increased from 3 percent to 5 percent. Annual debt service payments including arrears-to-revenue ratio increased from 32 to 41 percent in the same period.
45 Good Governance Africa, 2017, Mainstreaming Good Governance into Nigerian Tax Reform.46 Figures in this section are WB staff calcs using state fiscal data from NBS & CBN and DMO state debt data.
47

Figure 1.1: Revenue and Grants – All States (in billion Naira, nominal)
Figure 1.2: Total Expenditure – All States (in billion Naira, nominal)
Figure 1.3: Total Debt – All States (in billion Naira, nominal)
48

D. Recent Historical Performance 2015-1747 and Financial Assistance to States
12. The collapse of oil revenues translated into significant revenue shortfalls at all tiers of government in 2016. Government revenues are dominated by oil - representing around three-quarters of total revenue prior to 2015. This dependency was not adequately addressed during the boom years so that total government revenues, which were already low at 10.3 percent of GDP in 2014, declined to 5.9 percent of GDP in 2016. Unlike the previous crisis in 2008, there were insufficient buffers accumulated in the Excess Crude Account to play a counter-cyclical role.
Box 1.1: Decline in Federation Account Revenues, Stagnation of Non-Oil Revenues and VAT
Net48 revenue accruing to the Federation Account includes all oil and gas revenues and some non-oil revenues (customs revenue, corporate taxes, and solid minerals revenue); and is the main revenue stream for all tiers of Government. The revenues are distributed to the three tiers of government as follows: 52.68 percent accrues to the FGN (of which FGN retains 48.5 percent after transfers to special funds and the Federal Capital Territory (FCT)), 26.72 percent to the 36 state governments, and 20.6 percent to the local governments. In addition to the revenues accruing to the Federation Account, value-added tax (VAT) is also federally collected and then distributed to the Federal (15 percent of which 14 is retained), state (50 percent), and local (35 percent) governments.
Net Federation Account revenue nearly halved, falling from N5,462 billion in 2014 to N2,902 billion in 2016. This sharp drop was entirely driven by the decline in oil and gas revenues because of (a) the decline in global oil prices (from US$100.8/bbl in 2014 to US$45.2/bbl in 2016); and (b) the lower oil production in 2016 (from 2.2 mb/d in 2014 to 1.8 mb/d in 2016). Collection of non-oil revenues and VAT stagnated throughout this period. The targets for non-oil revenues in 2016 had been increased ambitiously; but without any significant tax policy reforms, actual revenues did not increase, despite many efforts to strengthen tax administration. Only 56 percent of the budgeted amount of non-oil revenues was collected and only 55 percent of the budgeted VAT amount was collected.
13. The reduction in statutory transfers led to a fiscal crisis among states in 2015-16 . Total revenue-to-GDP ratio for all states fell from 4.0 in 2014 to 3.0 percent in 2015, driven by a decline in FAAC allocation (excluding VAT) from 2.7 to 1.8 percent of GDP. VAT and IGR collection did not increase sufficiently to offset this decline. As total state expenditures fell only slightly from 4.2 in 2014 to 4.0 percent of GDP in 2015, the fiscal deficit increased significantly from 0.3 percent of GDP in 2014 to 1 percent in 2015. While total expenditure in nominal terms stagnated in 2015, states reported 36 percent higher personnel spending in 2015 than compared
47 Figures in this section are WB Staff calcs using State fiscal data from NBS and CBN, and DMO State debt data.48 From gross revenue items, such as revenue collection agency fees, 13 percent derivation to oil producing States, JV cash calls, revenues in excess of specific targets and transfer to Excess Crude Account, and any subsidies are deducted to arrive at the net measure, which is then distributed per the formulae described.
49

to 2014, while there was a 17 percent drop in capital spending – for the first-time personnel spending outstripped capital spending. As total revenue further declined to 2.5 percent of GDP in 2016, states had to reduce their expenditures – from 3.8 trillion Naira (4 percent of GDP) to 3.5 trillion Naira (3.4 percent of GDP) to keep their fiscal deficit below 1 percent of GDP. The nominal spending cuts recorded mostly came from transfers; capital spending remained flat at 1.3 trillion Naira, nearly a third lower than it was in 2011.
14. Increased borrowing needs saw total state debt increase from 2.4 percent in 2014 to 4.2 percent of GDP by the end of 2016. Total state debt increased from 2.2 trillion Naira in 2014 to 4.3 trillion in 201649. Domestic arrears on contractor payments pensions and salaries increased significantly from 660 billion Naira in 2014 to over 1 trillion Naira in 2016. Civil servants and pensioners in some states staged public protests and undertook strike actions, which would have impacted negatively on public service delivery. Commercial bank loans were restructured during the first set of financial assistance to states so declined from 583 billion Naira to 300 billion Naira. At the end of 2016, debt is estimated at just over 1 trillion Naira from the first FG financial assistance package and at just under 300 billion Naira from the second package (Budget Support Facility). External loans also doubled from 549 billion Naira to 1.1 trillion Naira.
15. The debt-to-revenue ratio for all states nearly doubled in one year to 113 percent in 2015 and increased further to 169 percent in 2016, when all states (including FCT) are estimated to have breached the formal debt threshold of 50 percent. The annual interest payment to revenue ratio for all states increased from 5 percent to 10 percent. However, annual debt service payments excluding arrears-to-revenue ratio fell from 29 percent in 2014 to 20 percent in 2016 due to the restructuring of short-term commercial bank debt into longer-term instruments. Including arrears, debt service-to-revenue ratio is estimated to have increased from 41 percent to 50 percent in the same period.
16. The states’ fiscal crisis led to two financial assistance packages by the FGN . The first financial assistance package was approved in July 2015 with no conditions attached for accessing the funds to the states. It included restructuring of existing short-term commercial bank loans into longer-term state bonds guaranteed by the FG with 23 states participating for a total of N573 billion (individual state amounts varied) in 2015, soft loans from CBN, and Excess Crude Account-backed loans (state amount varied). As the states’ fiscal situation continued to worsen in 2016, affected by the overall macroeconomic situation, a second assistance package was needed. The second package, called the Budget Support Facility (BSF), was accompanied by the Fiscal Sustainability Plan (FSP). Financed by special purpose government bonds sold to the private sector and guaranteed by the FGN, an estimated total of N496 billion was released to 35 states (N14.17 billion per State, excluding Lagos and FCT) in monthly disbursements over 12 months (June 2016 to May 2017). The monthly disbursements to each state were supposed to be conditional on progress against each of the states’ FSP action plans50. While the second assistance package disbursements were to last only for 12 months, the reforms in the FSP are supposed to be sustained over the long-term. The BSF has been extended beyond its original end date of May 2017 to provide further financing to states (July, August and October 2017 and January 2018 to date) to 35 states for a total of N102 billion/US$335 million to date.
49 2016 debt stock was derived from DMO data augmented with estimates of the second financial assistance program: The Budget Support Facility assuming participation from 35 states.50 And a monthly FAAC allocation threshold falling below N500 billion.
50

17. States continued to constrain their expenditure in 2017 as revenues remain below pre-2015 levels. 2017 saw total state revenues increase from higher statutory transfers as the oil sector started to recover and higher IGR, which now represents 30 percent of all state revenues (23 percent excluding Lagos). But total revenues remain below the levels of 2011-2014. States constrained expenditures, keeping spending flat in nominal terms and declining to 3.2 percent of national GDP, so that total state fiscal deficit improved slightly to 0.6 percent of GDP. State Debt-to-GDP remained stable at 4.2 percent and debt-to-revenue ratio remained stable at 161 percent.
18. The need to strengthen fiscal performance and sustainability remain, as fiscal conditions are likely to remain challenging in the medium-term. Without further fiscal adjustment, States’ expenditures will remain constrained and debt sustainability will likely continue to deteriorate. Under assumptions of a steady economic recovery (with higher oil price and production) and assuming no significant increase as a share of GDP in non-oil revenues collected federally or by States (IGR), total state revenue is projected to increase slightly to 2.9 percent of GDP by 2018, but will remain much lower than 2011-2014 levels. Furthermore, if we assume in this scenario the following: 1) no further rationalization of state expenditures with spending at least remaining constant in real terms; and 2) no financing constraints, total state fiscal deficits would remain around 0.8 percent of GDP annually through the medium-term. This level of fiscal deficits would lead to steadily increase in total state debt stock to 4.7 percent of GDP by 2020, and the total state debt-to-revenue ratio will remain at the elevated levels of 2016-2017. This would eventually lead to a higher share of state revenues being used for interest payments and debt servicing (especially if States borrow on mostly commercial terms again), rather than development spending. In this scenario with no or very limited fiscal adjustment, States remain vulnerable and continue to represent a source of fiscal risks. Total spending as a share of GDP at the state-level will continue to remain lower than pre-crisis levels. To prevent this scenario from materializing, States need to increase their IGR, manage recurrent spending pressures, prevent arrears accumulation and strengthen debt management.
Figure 1.4: Fiscal Aggregates - All States (Percent of GDP) 2011-2016 Actual, 2017 Estimate, 2018-2020 Simulations under a ‘Business as Usual’ Scenario
51

Figure 1.5: Debt Sustainability Indicators - All States (Percent) 2011-2016 Actual, 2017Estimate, 2018-2020 Simulations under a ‘Business as Usual’ Scenario
Table 1.1 State Fiscal Outturns: 2011-2017 Estimated Actual, Naira billion
52

Table 1.2 Fiscal Indicators: 2011-2017 Estimated Actual and 2018-2020 Simulations under a ‘Business as Usual’ Scenario
II. The Government Program
19. The government program is comprised of: (1) the Fiscal Sustainability Plan (FSP) actions to be implemented by state governments; and (2) the Nigerian OGP NAP actions at the state-level. Both programs had targeted timeframes for first achieving the actions but most actions are meant to be implemented in a sustained/ongoing manner with States encouraged to implement them as soon as possible. It is well recognized that to fully implement the program cross all States will take at least 4-5 years.
20. The Government program is a key strategy of the Governance pillar of the ERGP. The ERGP, the national medium-term development strategy for 2017-2020, is underpinned by a focus on effective governance, viewing it as crucial to the successful implementation of the other ERGP strategies. This recognizes the substantial governance weaknesses in Nigeria despite governance reforms at federal and state level since 1999. Nigeria fares badly in most international benchmarking across the wide range of governance indicators51. According to the ERGP, “with effective governance, the public has the information and means to hold the 51 Including the following: 1) Nigeria ranked 148 out of 180 countries by the Transparency International Corruption Perception Index in 2017; 2) Nigeria’s rating under the Worldwide Governance Indicator has not improved for the past ten years and even deteriorated on control of corruption while improving lately on voice and accountability; 3) Under the Ibrahim Index of African governance, Nigeria’s ranking has remained unchanged for the past ten years as well, below African average; and 4) According to the Open Budget Index (OBI), which ranks Nigeria in the bottom quartile on fiscal transparency, no significant improvements have happened from 2008 to 2016; and 5) The National Bureau of Statistics released a 2017 survey (Corruption in Nigeria. Bribery: Public Perception and Responses) according to which the two “most pressing challenges facing democracy in Nigeria” are perceived by Nigerian citizens as corruption (by 32% of respondents) and bad governance (22%)
53
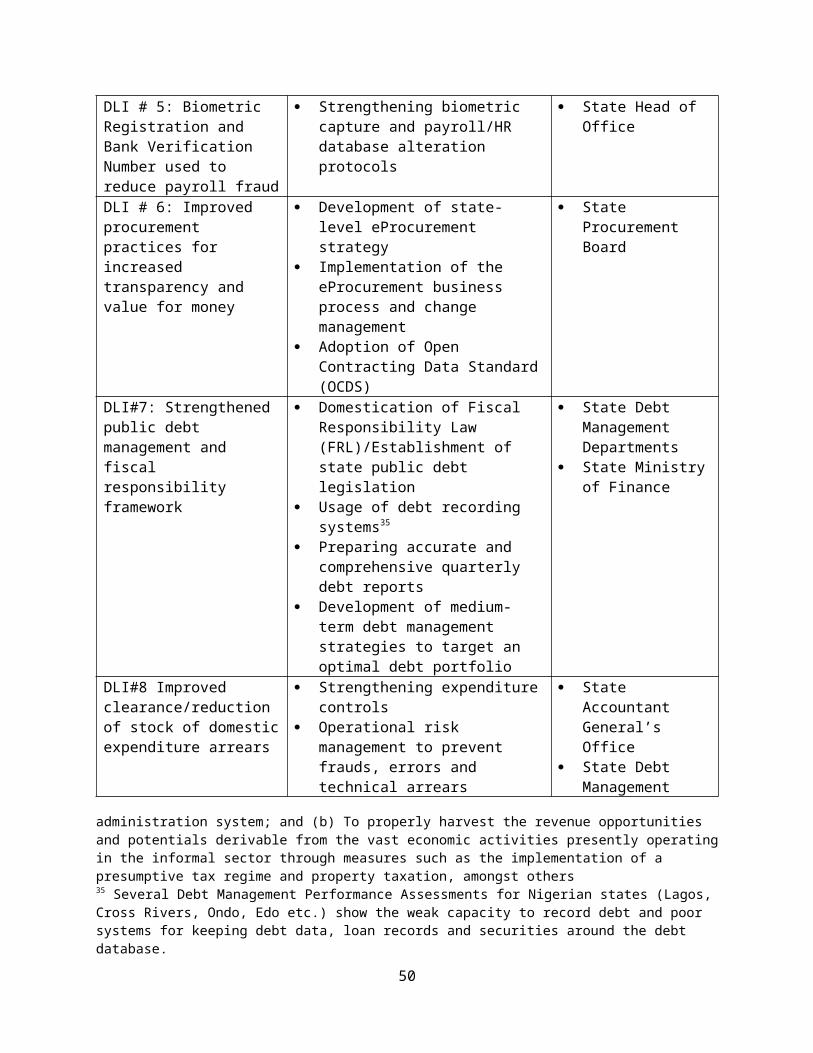
Government to account for delivering the plans in the national interest and can trust that public funds are used for their intended purpose.”
21. The ERGP seeks to improve governance through a multi-faceted approach through four priority areas: (1) Fighting Corruption and Enhancing Transparency in the use of public resources; (2) Reinforcing Public Safety and Security by combating terrorism and insurgency in the North East and militancy in the Niger Delta; (3) Reform the public service by reducing the cost of governance and raising productivity across all FGN agencies, notably the Public Procurement System; and (4) Strengthening Subnational Coordination. The implementation of the FSP by state governments and the monitoring of the FSP by the FGN is one of the key strategies in the area of Strengthening Subnational Coordination (see Box 1.2).
Box 1.2: Strengthening Sub-National Coordination in the ERGP (Excerpt from the ERGP)
State and local governments have a critical – and often leading – role to play in many of the strategies outlined in the ERGP. Sub-national coordination is therefore essential to the success of the Plan. The Federal Government will work with all 36 States and 774 Local Government Areas to implement the ERGP in line with State and local priorities. At present, however, the ability of the States to provide essential services to their citizenry is at risk and several are in a challenging financial position…At the end of 2015, State expenditures exceeded revenues by approximately N1 trillion. The inability of some States to meet their recurrent expenditure obligations, including salaries for civil servants, health workers, and teachers, has had a direct negative impact on individual well-being and general economic activity. The Federal Government is working closely with the States through the NEC to address these challenges. In June 2016, the States and the Federal Government agreed to a 22-point Fiscal Sustainability Plan to improve financial responsibility at the State level. The 22-point Fiscal Sustainability Plan has five strategic objectives and outlines critical measures to be adopted by the States that mirror public financial management reforms being undertaken at the Federal level.
StrategiesProgramme Sub-national coordinationNo. Strategy Key activities Lead58 Encourage States to
produce recovery and growth plans aligned with the ERGP
Encourage States to develop economic recovery and growth plans that outline the costed initiatives they intend to undertake in line with the thematic areas’ policy objectives laid out in the ERGP
Ministry of Budget and National PlanningState Governments
59 Monitor delivery of the Fiscal Sustainability Plan
Closely monitor progress of States’ implementation of the 22-point Fiscal Sustainability Plan
Use progress against the Fiscal Sustainability Plan as a condition for future financial relief
Improve the system of counterpart funding
State Governments
Ministry of Finance
Fiscal Sustainability Plan
22. The Fiscal Sustainability Plan: The first core set of measures/reforms in the government program is the Fiscal Sustainability Plan. In June 2016, all States agreed to the Fiscal Sustainability Plan (FSP), which consists of 22 sets of actions grouped under five objectives: (1) Improve Accountability and Transparency (2) Increase Public Revenue (3) Rationalize Public Expenditure (4) Improve Public Financial Management and (5) Sustainable Debt Management. Out of the 22 actions, 19 are to be implemented by the individual state governments (some require some Federal steps) and 3 are measures to be undertaken by the
54

federal government only to support the actions to be undertaken by the States. The FSP was put in place together with the second financial assistance package to States (the Budget Support Facility). The monthly disbursements given by FMoF to each state under the BSF were supposed to be conditional on the state’s progress on implementing the FSP to provide a financial incentive to States for the FSP implementation. While the BSF disbursements were originally to last only for 12 months, to the end of May 2017, the intention was for States to continue and sustain the reforms contained in the FSP beyond. In practice, BSF funds were disbursed to States even if they had made less than expected progress in implementing the FSP, given the severe fiscal pressures.
Table 1.3 Fiscal Sustainability Plan# Action ResponsibleObjective 1: To Improve Accountability & Transparency1 Publish audited annual financial statements within 6 months of financial year end. State2 Introduction and compliance with the International Public Sector Accounting Standards. State3 Publish State budget online annually. State4 Publish budget implementation performance report online quarterly. State5 Develop standard IPSAS compliant software to be offered to States for use by State and
Local GovernmentFederal only
Objective 2: Increase Public Revenue6 1) Set realistic and achievable targets to improve independently generated revenue (from all
revenue generating activities of the State in addition to tax collections) and ratio of capital to recurrent expenditure2) Implementation of targets
State
7 Implement a centralized Treasury Single Account (TSA) in each State. State8a. Quarterly financial reconciliation meetings between Federal and State Governments to
cover VAT, PAYE remittances, refunds on Government projects, Paris Club and other accounts
State/ Federal
8b. Share the database of companies within each State with the Federal Inland Revenue Service (FIRS). The objective is to improve VAT and PAYE collection.
State/ Federal
9 Introduce a system to allow for the immediate issue of VAT / WHT certificates on payment of invoices.
State/ Federal
10 Review all revenue related laws and update of obsolete rates / tariffs. Local/State/Federal
Objective 3: Rationalization of Public Expenditure11a Set limits on personnel expenditure as a share of total budgeted expenditure. State
11b Biometric capture of all States’ Civil Servants will be carried out to eliminate payroll fraud.
State
12a Establishment of Efficiency Unit. State12b Federal Government online price guide to be made available for use by States. Federal only13 Introduce a system of Continuous Audit (internal audit). State/
FederalObjective 4: Public Financial Management14 Create a fixed asset and liability register State/
Federal15 Consider privatization or concession of suitable State-owned enterprises to improve
efficiency and management.State
55

16 Establish a Capital Development Fund to ring-fence capital-receipts and adopt accounting policies to ensure that capital receipts are strictly applied to capital projects
State
17 Domestication of the Fiscal Responsibility Act (FRA). StateObjective 5: Sustainable Debt Management18 Attainment and maintenance of a credit rating by each State of the Federation State19a Federal Government to encourage States to access funds from the capital markets for
bankable projects through issuance of fast track Municipal bond guidelines State/Federal (SEC/DMO)19b Full compliance with the FRA and reporting obligations, including: No commercial bank
loans to be undertaken by State [without prior approval from FMoF]; Routine submission of updated debt profile report to the DMO
20 Publish a benchmark rate for Municipal loans to achieve greater transparency. Federal only (CBN)
21 Ensure total liabilities (debt) do not exceed 250 percent of total revenue for the preceding year.
State/Federal
Monthly debt service deduction is not to exceed 40 percent of the average FAAC allocation for the preceding 12 months.
22 In addition to the sinking fund, States are encouraged to establish a Consolidated Debt Service Account to be funded from the State’s Consolidated Reserve Fund Account to a minimum of 5 percent of IGR
State
23. While all States have made at least partial progress, implementation of the FSP by the States is incomplete. The NGF administered a self-assessment survey to all 36 States in April 2017 (followed by case studies in eight States) on FSP implementation. On average two-thirds of States report having completed or having work in progress on each of the FSP actions. NGF does not have the authority to verify all the results and so the results are likely to have a positive bias. The FMoF commissioned a FSP implementation verification exercise to be carried out by third-party agents at the beginning of 2017. The interim results for 23 States showed implementation was incomplete across each of the five FSP areas. Both assessments suffer from the lack of a robust monitoring and evaluation framework for the FSP with clearly defined, time-bound indicators. Nevertheless, considerable progress can be seen in several areas, including regular state debt reporting to DMO (reported by DMO)52, use of biometrics to tackle payroll fraud, implementation of the TSA, and increase in IGR collection53. Several factors contributed to the incomplete implementation of the FSP by the States: 1) weak capacity in some of the States, coupled with the lack of TA support accompanying the FSP; 2) absence of strong political will at the executive level in some of the States; 3) lack of strong incentives as the federal government has been unable to enforce the FSP as conditions for the disbursement of funds to the States from the BSF.
Open Government Partnership
24. The Government seeks to further enhance the transparency and accountability in the use of public resources through the implementation of the OGP . The FGN joined the OGP in July 2016 and committed to a number of key reforms that enhance transparency and accountability. The OGP is an international multi-stakeholder initiative focused on strengthening governance mechanisms for transparency, accountability, and citizen engagement among member States. OGP serves as a platform to bring together governments and civil society 52 Reported by DMO and reflected in the consolidated state debt reports. 53 Source: Joint Tax Board IGR collection figures 2016-2017 and NGF IGR dashboard data
56

organizations and OGP processes require the equal participation of government and non-government actors. In Nigeria, the National Steering Committee (NSC) with the Federal Ministry of Justice as the Coordinating Ministry and co-Chair, and with representation from Government MDAs and civil society, private sector and professional associations.
25. Nigeria’s OGP Action Plan aims to consolidate new and existing reforms in 14 commitments across four thematic areas: (i) fiscal transparency; (ii) access to information; (iii) anti-corruption and asset disclosure; and, (iv) citizen engagement and empowerment. The original target timeframe for the OGP action plan was January 2017 to June 2019 for the federal government implementation. It is well recognized that to rollout and implement the action plan at the state-level, across multiple States, will take a further 3-4 years.
Table 1.4 Summary of National Action Plan Commitments by Thematic Areas Fiscal Transparency1 Ensure more effective citizens’ participation across the entire budget cycle.2 Full implementation of Open Contracting and adoption of Open Contracting Data Standards in the public sector.3 Work together with all stakeholders to enhance transparency in the extractive sector through a concrete set of
disclosures related to payments by companies and receipts by governments on all transactions across the sector’s value chain.
4 Adopt common reporting standards and the Addis Tax initiative aimed at improving the fairness, transparency, efficiency and effectiveness of the tax system.
5 Improve the ease of doing business and Nigeria’s ranking on the World Bank Doing Business Index.Anti-Corruption6 Establish a Public register of Beneficial Owners of Companies,7 Establish a platform for sharing information among Law Enforcement Agencies (LEAs), Anti-Corruption
Agencies (ACAs), National Security Adviser (NSA) and financial sector regulators to detect, prevent and disrupt corrupt practices.
8 Strengthen Nigeria’s asset recovery legislation including non-conviction based confiscation powers and the introduction of unexplained wealth orders.
9 Take appropriate actions to co-ordinate anti-corruption activities; improve integrity and transparency and accountability.
Access to Information10 Improved compliance of public institutions with the Freedom of Information Act in respect of the annual
reporting obligations by public institutions and level of responses to requests.11 Improved compliance of public institutions with the Freedom of Information Act (FOIA) with respect to the
Proactive disclosure provisions and stipulating mandatory publication requirements.Citizen Engagement12 Develop a Permanent Dialogue Mechanism on transparency, accountability and good governance between
citizens and government to facilitate a culture of openness.13 Government-civil society to jointly review existing legislations on transparency and accountability issues and
make recommendations to the National Assembly.14 Adopt a technology-based citizens’ feedback on projects and programs across transparency and accountability.
26. While many of the fourteen commitments cut across both the federal and state governments, seven of the commitments are applicable to States. Chapter seven of the NAP describes the FGN’s intentions of rolling out the OGP to States as a critical ingredient of its efforts to improve the transparency and accountability of the use of public resources at the state-level. Several state governments have already signed agreements with the national OGP secretariat to implement the OGP commitments relevant to state governments and several more are in the process of doing so.
57

27. Implementation of the OGP commitments is at an early stage at the state level. Though the national OGP secretariat is taking several steps to enhance the awareness of the OGP commitments, and has signed agreements with some of the state governments, implementation is at an early stage due to weak incentives for state governments to adhere to the OGP action points as well as lack of capacity. Addressing the challenges of capacity, and strengthening the incentives will help States to implement the commitments.
28. The FMoF requested the Bank’s support to strengthen the implementation of the government program by States and FCT. The government program at the state-level is implemented by a number of state government institutions. Specifically, the state-level FSP and the fiscal transparency actions in the OGP NAP is implemented by state government institutions involved in fiscal and debt management, in particular: state ministries of finance (including treasury, state debt departments), state ministries of budget and planning, state boards of internal revenues, and state office of accountant generals. The FSP and the fiscal transparency actions in the OGP NAP cover the full scope of core functions and activities of these four institutions. Implementation of the government program primarily requires staff time, consultants, workshops and training. Extensive consultations carried out with key stakeholders at the federal and state levels (including the FMoF, state commissioners of finance and budget and planning, NGF, Nigerian OGP secretariat) as well as academia and civil society showed wide agreement that the FSP represents a national consensus on common standards for state fiscal management and its full and sustained implementation should be supported, alongside the state-level OGP commitments.
III. Program Development Objective and Key Results Areas
29. The PDO is to strengthen the fiscal transparency, accountability and sustainability in the participating states. Strengthening fiscal transparency will help build trust in government (both at the level of investors and citizens), enhance the monitoring of fiscal risks and facilitate accountability in public resource management. Stronger accountability, in turn, reduces the opportunities for corruption and misuse of public resources, thereby increasing the efficiency and effectiveness of public expenditures. Strengthening fiscal sustainability is important not only for preventing further fiscal crises, but also for supporting longer-term objectives for growth and service delivery by increasing the fiscal space for productive spending. The Program supports States to better deal with short-to-medium-term fiscal pressures as well as to sustainably improve their fiscal performance in the longer-term.
KRA#1: Increase Fiscal Transparency and Accountability. Under this results area, the PforR will support states to: (1) increase the quality (compliance with international standards), timeliness and transparency of the annual budget, budget implementation reports, and audited financial statements; (2) increase citizens’ participation in the budget process; and (3) improve budget credibility by reducing deviation in total state expenditure outturn.
KRA#2: Strengthen Domestic Revenue Mobilization. Under this results area, the PforR will support states to: (1) increase IGR collection while providing more transparency and certainty to taxpayers; and (2) reduce revenue leakages by implementing the TSA at the state-level.
KRA#3: Increase Efficiency in Public Expenditure. Under this results area, the PforR will support states to: (1) to reduce payroll fraud through the use of biometric and bank verification number (BVN); and (2) improve the transparency and value for money of public
58

procurement through the implementation of e-procurement systems in MDAs, including those delivering education and health public services, and open contracting standards.
KRA#4: Strengthen Debt Sustainability. Under this results area, the PforR will support states to: (1) strengthen the legal framework for debt management and fiscal responsibility, improve state debt reporting and debt sustainability analyses; (2) reduce the stock of domestic expenditure arrears; and (3) strengthen debt sustainability ratios.
IV. Bank Financed Program for Results
30. The proposed Program is a hybrid operation with two components that support Nigerian States to achieve the key result areas of the Program: (1) Performance-based financing component, which will be implemented as a PforR to eligible state governments; and (2) Capacity Building component, which will be implemented as an IPF for state governments and national-level institutions.
31. The Program will support the full and sustained implementation of a strategic subset of reforms from the Government programs of the FSP and the OGP that are implemented at the state-level. The selected reforms are considered the most critical and impactful for contributing to the achievement of the development objectives of the Program. The selected reforms form the basis of the eligibility criteria, the DLIs and disbursement-linked results (DLRs). The formulation of the DLIs and DLRs are designed to address gaps in the programs identified in the technical assessment and strengthen the impact of the FSP and OGP programs.
32. The Performance-based Financing component is open, ex-ante, to all 36 States in Nigeria and the FCT, but participation is based on States meeting the annual eligibility criteria (EC). The FSP and OGP set of reforms are relevant to all States, as fiscal management and performance are weak across the board, and all States still face considerable fiscal pressures. There is a very strong consensus across FMoF and all States54 that out of fairness, relevance and need, no States should be ex-ante excluded from participating in the Program. The Capacity Building component will support States that demonstrate a need, targeting States that currently do not receive any capacity building support in program-related areas from ongoing World Bank or partner supported projects and programs55.
33. Performance-based financing to eligible State Governments (PforR Component) (US$700 million): The Program will provide performance-based financing on an annual basis to state governments who are verified during the APA as having: 1) complied with the annual eligibility criteria; and 2) achieved the annual DLRs. The FMoF intends to provide the financing in the form of grants to the States:
34. A total of US$700 million is available over the four years across all States for the PforR financing. On average, each of the States participating in the Program will receive US$19 million in total from the PforR financing component - around US$5 million per fiscal year. While States achieving more results will receive a higher than average amount of PforR financing, lagging States should still receive a significant amount of financing. It is estimated
54 Reflected in consultations that have covered all 36 States to date. States were represented by Commissioners of Finance, Finance Permanent Secretary, Commissioners of Budget, Accountant General, Chairmen of State Bureau of Internal Revenue 55 Approximately 22 States will be targeted.
59

that stronger States which participate in the program every year and achieve higher number of DLRs and more stretch results will receive up to US$25-30 million in total from the PforR financing component, while lagging States that enter the program in Year 2, achieve lower number of DLRs and mostly basic results are estimated to receive US$12 million in total from the PforR financing component. Table 1.5 below illustrates from the perspective of a stronger-performing state and a lagging state which DLRs they may be aiming to achieve for. This is a simplified illustration as in reality there is a continuum of state capacity on each DLI/results area and the same state performing strongly in one area could be lagging in others.
Table 1.5: Illustrative Disbursement-Linked Results Matrix
EC and DLIs EC and DLIs for Year 1/2018 and Year 2/2019 Achieved by Lagging State
Achieved by Stronger State
Eligibility Criteria Annual state budget approved by Assembly and published online ANDAnnual audited financial statement submitted to Assembly and published
Aim to achieve for the first time in Yr. 2/2019
Aim to achieve for the first time in Yr. 1/2018
DLI 1: Improved financial reporting and budget reliability
1.1 Quarterly budget implementation reports published on average within 6 weeks of quarter-end 1.2 Deviation from total budget expenditure is < 30%/<25%
1 of the DLRs (1.1)
Both DLRs
DLI 2 Increased openness and citizens’ engagement in the budget process
2.1 Citizens’ inputs from formal public consultations are published online2.2 Citizens’ budget based on approved state budget published online
1 DLR (2.1) Both DLRs
DLI 3: Improved cash management and reduced revenue leakages through implementation of State TSA
3. TSA, based on a formally approved cash management strategy, established and functional, and covering a minimum 50/60 percent of state government finances
Aim to achieve for the first time in Yr. 2/2019
Aim to achieve for the first time in Yr. 1/2018
DLI 4: Strengthened Internally Generated Revenue (IGR) collection
4.1 Consolidated state revenue code covering all state IGR sources and stipulating that the state bureau of internal revenue is the sole agency responsible for state revenue collection and accounting approved by the state legislature and published4.2 Annual nominal IGR growth rate meets target
DLR 5.2 Basic Target
DLR 5.1 ANDDLR 5.2 Stretch Target
DLI 5: Biometric Registration and Bank Verification Number used to reduce payroll fraud
5.1 Biometric capture of at least 60/75 percent of current civil servants and pensioners completed and linked to payroll and identified ghost workers taken off the payroll5.2 Link BVN data to at least 60/75 percent of current civil servants and pensioners on the payroll and payroll fraud addressed
1 DLR (6.1) Both DLRs
DLI 6: Improved procurement practices for increased transparency and value for money
6.1 Existence of public procurement legal framework and regulatory agency6.2 Publish contract award information above a threshold on a monthly basis in OCDS format on the state website/online portal AND Implement e-procurement in at least 3 MDAs
1 DLR (6.1) Both DLRs
DLI 7: Strengthened 7.1. Approval of state-level public debt legislation 1 DLR (7.1) Both DLRs
60

EC and DLIs EC and DLIs for Year 1/2018 and Year 2/2019 Achieved by Lagging State
Achieved by Stronger State
public debt management and fiscal responsibility framework
7.2 Quarterly state debt reports accepted by the DMO on average two months or less after the end of the quarter
DLI 8: Improved clearance/reduction of stock of domestic expenditure arrears
8. Domestic arrears reported in an online publicly-accessible database, with verification process in place, and an arrears clearance framework established AND Percentage decline in the verified stock of domestic arrears at end 2019 compared to end 2018 meets target
Aim to achieve for the first time in Yr. 3/2020 and achieves basic target
Aim to achieve for the first time in Yr. 2/2019 and achieves stretch target
DLI 9: Improved debt sustainability
9. Average monthly debt service deduction is < 40% of gross FAAC allocation for FY2018 AND Total debt stock as a share of total revenue meets target
Achieves Basic target
Achieves Stretch target
VII. Institutional and Implementation arrangements
35. States will be responsible for achieving the program results and thus will be leading the implementation of the PforR component. To support the implementation of the Program in each state, a state steering committee will be established in each of the participating States. The membership of the committee shall include representation from the key MDAs responsible for achieving the DLIs: ministries of finance, budget and planning, state debt departments, state bureaus of internal revenue, state accountant generals, and state auditor generals. The state ministries of finance or budget and planning will be the state program coordination anchors, and the commissioners will chair the state steering committees. The commissioners will assign focal persons to support the implementation of the Program across the KRAs and the coordination of the TA activities at the state level. Key responsibilities of the state steering committees are to approve the annual action plans for achieving the DLRs, the annual capacity building plan for the States, and to monitor progress and take remedial action if the States are under-performing against the DLRs.
36. The FMoF’s HFD, being the program manager on behalf of the FMoF, will house the PCU, with the Director of HFD as the National Program Coordinator. The HFD is the department within FMoF mandated to support financing to the States. It manages the FAAC allocation process and the BSF, disbursing the monthly amount from the BSF to States since 2016:
The PCU’s key functions are to: 1) coordinate state capacity building activities across the different implementing entities; 2) lead program communications and outreach activities from the government side; 3) lead monitoring and evaluation activities for the overall program (not the individual state performance assessments carried out by the IVA, which is described in Section C Disbursements) analyzing overall program performance, gaps and identifying how the TA can help address these gaps; 4) disburse annual PforR financing to the States on the basis of the APA results from the IVA; 5) provide accounting and reporting for the Program and be the interface with the Bank; and 6) act as the secretariat for the Central Steering Committee. The PCU’s work will be guided by the Program’s operations manual.
61

Central Steering Committee: The Committee brings together the large number of players involved in the implementation of the FSP and OGP and strengthens their cooperation. This Committee shall be established with the following composition: FMoF HFD; FMoF IERD; DMO; Office of the Attorney-General of the Federation in the Federal Ministry of Justice (OGP Secretariat); PSIN; six State Commissioners of Finance (representing the six geopolitical zones); JTB; and the Statistics department at the Central Bank of Nigeria. The Committee will meet at least quarterly to review progress in the implementation of the Program across States, the publication of the results of the APA, the delivery of the capacity building program to States. The roles and responsibilities of the Committee will be defined in the Program’s operations manual.
37. The capacity building support to States under the TA component will be delivered through implementing agencies. The following institutions, in addition to the PCU, have been identified as implementing agencies for delivering the capacity building support to States: (1) PSIN; (2) Office of the Attorney-General of the Federation in the Federal Ministry of Justice (activities to be led by the OGP Secretariat housed in this Office); and (3) DMO. These agencies were selected as they have the mandate, technical expertise and experience in capacity building of state governments in the four KRAs of the Program. Where appropriate, these implementing entities will partner with local and regional training institutions to draw on their expertise and help them scale up the capacity building activities. As a result of NGF’s unique capabilities and experience in organizing and delivery capacity building and learning activities to States, NGF will be engaged by the PCU as a project management firm to support the PCU to implement specific capacity building and learning activities to States.
38. The Bank’s implementation support for the Program will be enhanced in recognition of the scale of the Program, the institutional capacity of the implementing agencies, the risks, and the need for close monitoring to facilitate timely response to program implementation challenges. The implementation support will include: (a) formal joint review missions (JRM); and (b) technical meetings and field visits outside the formal JRMs on a quarterly basis or more frequently if needed on the capacity building, M&E, communications and outreach activities, and on the audit and FM reporting requirements.
62
Table 1.4: Summary Program CycleProgram time line
Program Milestone
Key Program Activity Responsibility
Aug-Sept 2018
Post signing of the Financing Agreement
Appointment of IVAOperations manual Procurement of third party external audit firm and project management firmEstablishment of state and central steering committeesTechnical workshops with States on verification protocols
PCU
States and PCU
States and PCU
Oct 2018 Program Effectiveness
Capacity Building activities start
PAP activities start
TA Implementing AgenciesPCU, Implementing Agencies and States
Jan-Mar 2019-2022
APA Assessment of performance of all participating States against eligibility criteria and the DLRs relating to the last fiscal year
IVA supported by a third party external audit firm
April 2019- 2022
Disbursement of PforR financing
PforR financing based on APA disbursed to States
PCU
Jan-Dec 2019-2021
Capacity building activities
Training provided to States to improve their results and peer learning forums
TA Implementing Agencies
June 2022 Program closing activities
Program financial statements are prepared and program audit carried out
PCU/FMoF HFD
63
Annex 2: Results Framework MatrixPDO/Outcome and
Intermediate Results IndicatorsDLI # Unit of
Meas.Baseline (2017) 56
End Target (2021)57
Data Source Responsibility for Data Collection
Frequency
Results Area 1: Increased Fiscal Transparency and Accountability PDO Indicator 1: Open Budget Index58 score between 2018 and 2021 - average for States participating in the PforR
Open Budget Index score
To be measured in OBI survey
for 2018
25 percent improvement in average OBI score 2021 compared to 2018
Open Budget Survey at the State-level
Program Coordination Unit
Start and end of Program: 2018 and 2021
IR Indicator 1.1: States preparing annual state budgets using the national Chart of Accounts (GFS compliant) and publishing online by end January of that FY
EC Number 13 30 State official websiteBudget Call Circular
IVA (AuGF) Annually
IR Indicator 1.2: States preparing annual audited financial statements in accordance with IPSAS (cash or accrual) and publishing online by July of the following FY
EC Number 9 30 State official website
IVA (AuGF) Annually
IR Indicator 1.3: States publishing in-year quarterly budget implementation reports online within four weeks from quarter-end
1.1 Number 9 25 State official website
IVA (AuGF) Annually
IR Indicator 1.4: States with 1.2 Number 4 12 Report on full IVA (AuGF) Annually
56 The baseline numbers have been derived from Bank analysis of existing state-by-state historical fiscal and debt data together with a baseline survey conducted by the Bank and completed by the individual States’ PFMUs and Commissioners of Finance of the status of the PFM and fiscal management reforms contained in the DLIs in their state as of end 2017. 57 The target numbers have been derived from Bank projections of medium-term state-by-state fiscal performance together with a survey conducted by the Bank and completed by the individual States’ Commissioners of Finance on their estimates of their state’s achievement of the DLRs through the Program years.58 The Open budget index (OBI) developed by the International Budget Partnership (IBP) uses a standard methodology to measure the accessibility of 8 key budget documents, including the approved budget, budget implementation report, audited financial statements, which are the focus of the Eligibility Criteria and DLI 1 and 2. The OBI presents an overall measure of transparency across the whole budget cycle and can be applied at the subnational level. The OBI survey has been conducted for FGN and for all Nigerian States in 2015 (by CIRDDOC, funded by DFID and UNICEF. Further state-level OBI surveys have been planned by IBP to assess performance in 2018 and 2021.
64

expenditure outturn deviation (from original approved budget) less than 15 percent (PEFA threshold)
year state expenditure from State Auditor Generals
IR Indicator 1.5: States that publish online citizens’ inputs from formal public consultations, along with the proposed annual budget
2.1 Number 10 25 State official website
IVA (AuGF) Annually
IR Indicator 1.6: Female participation in the budget consultation process
2.1 Percentage Average: 20%
Average: 40% Budget consultation reports from States
Program Coordination Unit
Annually
IR Indicator 1.7: States with citizens’ budget, based on the States’ approved annual budget, published online by April of that FY and with functional online feedback mechanisms
2.2 Number 5 20 State official website
IVA (AuGF) Annually
IR Indicator 1.8: States with citizens’ accountability reports, based on the States’ audited financial statements, published online by Sept of the following FY
2.2 Number 3 18 State official website
IVA (AuGF) Annually
Results Area 2: Strengthened Domestic Revenue MobilizationPDO Indicator 2: States that increased internally generated revenue collection by more than 20 percent annually (in nominal terms)
4.2 Number 2017-2016: 15
Average between 2018-
2021: 22
Interim Report on full year IGR collection from the State Auditor General
IVA (AuGF) Annually
IR Indicator 2.1: States with functional Treasury Single Account (TSA) system based on a formally approved cash management strategy, and covering a minimum of 80 percent of state government finances.
3 Number 6 25 Documentation from State Accountant General on TSA implementation
IVA (AuGF) Annually
65
IR Indicator 2.2: States with approved and published consolidated and updated revenue code covering all local and state IGR sources
4.1 Number 8 18 State official website
IVA (AuGF) Annually
Results Area 3: Strengthened Efficiency in Public ExpenditurePDO Indicator 3.1: Average citizens access to procurement information in States publishing contract award data online in OCDS format
Text To be measured
for 2019 in procuremen
t survey
More than 25 percent increase
Procurement survey at the State-level
Program Coordination Unit
Start and end of Program: 2019 and 2021
PDO Indicator 3.2: Average time taken for procurement processes in States that implemented e-procurement in at least 4 MDAs
Text To be measured
for 2019 in procuremen
t survey
Reduction of more than 20
percent
Procurement survey at the State-level
Program Coordination Unit
Start and end of Program: 2019 and 2021
IR Indicator 3.1: States that have completed biometric capture of at least 90 percent of current civil servants and pensioners and used the biometrics data to identify and remove ghost workers off the payroll
5.1 Number 10 20 A report of ghost workers and payroll fraud produced by the Office of the State Accountant General
IVA (AuGF) Annually
IR Indicator 3.2: States that have linked BVN data to at least 90 percent of current civil servants and pensioners on payroll to identify and address payroll fraud
5.2 Number 5 15 IVA (AuGF) Annually
IR Indicator 3.3: States with approved and adequate Public Procurement Law and established regulatory agency
6.1 Number 11 20 State Public Procurement Regulatory Agency Report
IVA (AuGF) Annually
IR Indicator 3.4: States that have implemented e-procurement in at least four MDAs, including health, education and public works
6.2 Number 0 15 State Public Procurement Regulatory Agency Report
IVA (AuGF) Annually
66

IR Indicator 3.5: States that publish contract award information on a monthly basis in Open Contracting Data Standard format online
6.2 Number 0 15 State official website/online portal
IVA (AuGF) Annually
Results Area 4: Strengthened Debt SustainabilityPDO Indicator 4: States with total debt stock as a share of total revenue for the preceding 12 months being less than 100 percent
9 Number End 2017: 5 16 State Q4 debt reports. Interim report on full year revenue from State Auditor Generals
IVA (AuGF) Annually
IR Indicator 4.1: States with approved state-level public debt legislation, which stipulates: 1) responsibilities for contracting state debt; 2) responsibilities for recording/reporting state debt; and 3) fiscal and debt rules/limits
7.1 Number 6 (22 States have laws
but majority does not
contain the key
provisions)
15 State official website
IVA (AuGF) Annually
IR Indicator 4.2: States with quarterly debt reports accepted by the Debt Management Office (DMO) on average two months after the end of the quarter
7.2 Number 10 25 DMO report on state quarterly debt reporting
IVA (AuGF) Annually
IR Indicator 4.3: States with annual state debt sustainability analysis results published by end of the year
7.2 Number 0 15 State official website
IVA (AuGF) Annually
IR Indicator 4.4: States with domestic arrears reported in a publicly available database with verification process in place
8 Number 0 15 State official websiteState Ministry of Finance report
IVA (AuGF) Annually
IR Indicator 4.5: States with more than 5 percent decline in the nominal stock of domestic expenditure arrears at the end of the year, compared to previous year OR maintained arrears of less than 5 billion naira, measured with
8 Number 2017-2016: 14(with unverified data)
15 (with verified
data)
State Q4 debt reports with domestic stock arrears verified by DMO
IVA (AuGF) Annually
67

verified data
68
Annex 3: Disbursement Linked Indicators, Verification Protocols and Bank Disbursement TableDisbursement-Linked Indicator Matrix
Notes: (1) DLIs that contain 2 DLRs which are separately valued i.e. States can receive the financing only achieving one of the DLRs. Are indicated by the
sub-numbering, e.g., 1.1 and 1.2; 2.1 and 2.2 etc.(2) DLRs have distinct but related components that must be all achieved in order to receive financing are indicated by the use of ‘AND’(3) DLRs have a basic target with a lower value and a stretch target with a higher value. States need to at least achieve the basic target.
Total Financing Allocated (US$m)
As % of Total
Financing (US$700m)
DLI Baseline(2016-2017)
Disbursement Linked ResultsYear 1 - 2018 Year 2 – 2019 Year 3 – 2020 Year 4 – 2021
DLI 1: Improved financial reporting and budget reliability
In-year quarterly budget reports not published online, or published > 4 weeks after quarter end in many States. Deviation for total expenditure is 30-55% across States.
1.1 FY18 quarterly budget implementation reports published on average within 6 weeks of quarter-end to enable timely budget management
1.2 FY18 deviation for total budget expenditure is < 30%
1.1 FY19 quarterly budget implementation reports published on average within 6 weeks of quarter end to enable timely budget management
1.2 FY19 deviation for total budget expenditure is < 25%
1.1 FY20 quarterly budget implementation reports published on average within 4 weeks of quarter end to enable timely budget management
1.2 FY20 deviation for total budget expenditure is < 20%
1.1 FY21 quarterly budget implementation reports published on average within 4 weeks of quarter end to enable timely budget management
1.2 FY21 deviation for total budget expenditure is < 15%
DLI 1 59.6 9% 11.6 12.5 16 19.5
DLI 1.121.6 3.6 (12 States x
$0.3m)4.5 (15 States x$0.3m) 6 (20 States x $0.3m) 7.5 (25 States x $0.3m)
DLI 1.2 38 8 (8 States x $1m) 8 (8 States x $1m) 10 (10 States x $1m) 12 (12 States x $1m)
DLI 2 Increased openness and citizens’ engagement in the budget process
While some States are consulting with citizens during the budget process, it is
2.1 Citizens’ inputs from formal public consultations are published online, along with the proposed FY19 budget
2.1 Citizens’ inputs from formal public consultations are published online, along with the proposed FY20 budget
2.1 Citizens’ inputs from formal public consultations are published online, along with the proposed FY21 budget
2.1 Citizens’ inputs from formal public consultations are published online, along with the proposed FY22 budget
69

Total Financing Allocated (US$m)
As % of Total
Financing (US$700m)
DLI Baseline(2016-2017)
Disbursement Linked ResultsYear 1 - 2018 Year 2 – 2019 Year 3 – 2020 Year 4 – 2021
not a formal; systematic process and feedback to citizens is not assured. Less than 5 State publish citizens’ budget or citizens accountability reports
2.2 Citizens’ budget based on approved FY19 state budget published online by end April 2019
AND Citizens’ budget based on approved FY20 state budget published online by end April 2020 with functional online feedback mechanisms
2.2 Citizens accountability report based on audited financial statements/reports published online for FY19 no later than Sept 2020
AND Citizens’ budget based on approved FY21 state budget published online by end April 2021 with functional online feedback mechanisms
2.2 Citizens accountability report based on audited financial statements/reports published online for FY20 no later than Sept 2021
DLI 2 37.9 5% 3 7.5 12 15.4
DLI 2.126.5 3 (10 States x $0.3m) 4.5(15 States x
$0.3m)9 (18 States x $0.5m)) 10 (20 States x $0.5m)
DLI 2.2 11.4 N/A 3 (10 States x $0.3m) 3 (10 States x $0.3m) 5.4 (18 States x $0.3m)
DLI 3: Improved cash management and reduced revenue leakages through implementation of State TSA
More than 50 percent of States report having implemented TSA but most TSA not anchored on a formal cash mgmt. strategy
TSA, based on a formally approved cash management strategy, established and functional, and covering a minimum of 50 percent of state government finances
TSA, based on a formally approved cash management strategy, established and functional, and covering a minimum of 60 percent of state government finances.
TSA, based on a formally approved cash management strategy, established and functional, and covering a minimum of 70 percent of state government finances.
TSA, based on a formally approved cash management strategy, established and functional, and covering a minimum of 80 percent of state government finances.
DLI 3 105 15% 15(10 States x $1.5m)
22.5 (15 States x $1.5m)
30 (20 States x $1.5m)
37.5 (25 States x $1.5m)
70

Total Financing Allocated (US$m)
As % of Total
Financing (US$700m)
DLI Baseline(2016-2017)
Disbursement Linked ResultsYear 1 - 2018 Year 2 – 2019 Year 3 – 2020 Year 4 – 2021
DLI 4: Strengthened Internally Generated Revenue (IGR) collection
Approx. 8 States have updated and consolidated IGR sources in a law. 2017/2016 IGR growth: 15 States achieved > 20% growth, of which 10 States achieved >40% growth.
4.1 Consolidated state revenue code covering all state IGR sources and stipulating that the state bureau of internal revenue is the sole agency responsible for state revenue collection and accounting approved by the state legislature and published (one-time payment for year in which DLR is first achieved, up to 2020/Year 3)
4.1 N/A
4.2 2018-2017 annual nominal IGR growth rate meets target:Basic target: 20%-39%Stretch target: 40% or more
4.2 2019-2018 annual nominal IGR growth rate meets target:-Basic target: 20%-39%-Stretch target: 40% or more
4.2 2020-2019 annual nominal IGR growth rate meets target:-Basic target: 20%-39%-Stretch target: 40% or more
4.2 2021-2020 annual nominal IGR growth rate meets target:-Basic target: 20%-39%-Stretch target: 40% or more
DLI 4 160 23% 37 45 45 33DLI 4.1 36 12 (6 States x $2m) 12 (6 States x $2m) 12 (6 States x $2m) N/A
DLI 4.2 Basic 54 15 (15 States x $1m) 13 (13 States x $1m) 13 (13 States x $1m) 13 (13 States x $1m)
DLI 4.2 Stretch70 10 (5 States x $2m) 20 (10 States x $2m) 20 (10 States x $2m) 20 (10 States x US
$2m)
DLI 5: Biometric registration and bank verification number (BVN) used to reduce payroll fraud
An estimated 10-5 States have done biometric capture and linked to payroll to address payroll fraud
5.1 Biometric capture of at least 60 percent of current civil servants completed and linked to payroll, and identified ghost workers taken off the payroll
5.2 Link BVN data to at least 60 percent of current
5.1 Biometric capture of at least 75 percent of current civil servants and pensioners completed and linked to payroll, and identified ghost workers taken off the payroll
5.2 Link BVN data to at least 75 percent of current
5.1 Biometric capture of at least 90 percent of current civil servants and pensioners completed and linked to payroll, and identified ghost workers taken off the payroll
5.2 Link BVN data to at least 90 percent of current
5.1 Biometric capture of at least 90 percent of current civil servants and pensioners completed and linked to payroll, and identified ghost workers taken off the payroll
5.2 Link BVN data to at least 90 percent of current civil servants and pensioners on the
71

Total Financing Allocated (US$m)
As % of Total
Financing (US$700m)
DLI Baseline(2016-2017)
Disbursement Linked ResultsYear 1 - 2018 Year 2 – 2019 Year 3 – 2020 Year 4 – 2021
civil servants on the payroll and payroll fraud addressed
civil servants and pensioners on the payroll and payroll fraud addressed
civil servants and pensioners on the payroll and payroll fraud addressed
payroll and payroll fraud addressed
DLI 5 73 10% 8 12.5 26.3 26.3DLI 5.1 42.5 5 (10 States x $0.5m) 7.5 (15 States
x$0.5m)15 (20 Statesx$0.75m)
15 (20 States x $0.75m)
DLI 5.2 30.5 3 (6 States x $0.5m) 5 (10 States x $0.5m) 11 (15 Statesx$0.75m)
11 (15 States x $0.75m)
DLI 6: Improved procurement practices for increased transparency and value for money
26 States have legal framework but 15 frameworks require strengthening. Procurement systems are performing sub-optimally, lacking efficiency and transparency
6.1 Existence of public procurement legal framework and procurement regulatory agency. Said legal framework should conform with the UNCITRAL Model Law and provide for: 1) eProcurement; 2) establishment of an independent procurement board and 3) cover all MDAs receiving funds from the state budget. (one-time payment for year in which DLR is first achieved, up to 2020/Year 3)
6.1 N/A
6.2 Publish contract award information above a threshold set out in the Operations Manual for 2018 on a monthly basis in OCDS format on the state website
6.2 Publish contract award information above a threshold set out in the Operations Manual for 2019 on a monthly basis in OCDS format on the online portal AND Implement e-procurement in at least 3 MDAs (inc. Education, Health and Public Works) for goods and works program expenditure
6.2 Publish contract award information above a threshold set out in the Operations Manual for 2020 on a monthly basis in OCDS format on the online portalAND Implement e-procurement in at least 4 MDAs (inc. Education, Health and Public Works) for goods and works program expenditure
6.2 More than 25% increase in citizens’ access to procurement information
AND
Time savings by more than 20% for each procurement process conducted in the MDAs implementing e- procurement
DLI 6 79.5 11% 18.5 24 25 12
72

Total Financing Allocated (US$m)
As % of Total
Financing (US$700m)
DLI Baseline(2016-2017)
Disbursement Linked ResultsYear 1 - 2018 Year 2 – 2019 Year 3 – 2020 Year 4 – 2021
DLI 6.1 40 16 (8 States x $2m) 14 (7 States x $2m) 10 (5 States x $2m) N/A
DLI 6.2 39.5 2.5 (5 States x $0.5m) 10 (10 States x $1m) 15 (15 States x $1m) 12 (12 States x $1m)
DLI 7: Strengthened public debt management and fiscal responsibility framework
22 States have FRL or a PDML, but some laws do not contain key provisions. All States submitting quarterly debt reports but many submit late. No state conducts DSA or develop MTDS
7.1 Approval of state-level legislation, which stipulates: 1) responsibilities for contracting state debt; 2) responsibilities for recording/reporting state debt; and 3) fiscal and debt rules/limits (one-time payment for year in which DLR is first achieved, up to 2020/Year 3)
7.1 N/A
7.2 Quarterly state debt reports accepted by the DMO on average two months or less after the end of the quarter in 2018
7.2 Quarterly state debt reports accepted by the DMO on average two months or less after the end of the quarter in 2019
7.2 Quarterly state debt reports accepted by the DMO on average two months or less after the end of the quarter in 2020AND Annual state debt sustainability analysis published by end Dec 2020
7.2 Quarterly state debt reports accepted by the DMO on average two months or less after the end of the quarter in 2021AND Debt sustainability analysis and MTDS published by end Dec 2021
DLI 7 67.5 10% 19.5 20 18 10DLI 7.1 30 12 (6 States x $2m) 10 (5 States x $2m) 8 (4 States x $2m) N/A
DLI 7.2 38 7.5 (15 States x $0.5m)
10 (20 States x $0.5m)
10 (20 States x $0.5m)
10 (20 States x $0.5m)
DLI 8: Improved clearance/reduction of stock of domestic expenditure arrears
In 2017, 14 States reduced their stock of arrears or maintained arrears of less than 5 billion naira. No state reports domestic arrears in a publicly-
Domestic arrears as of end 2018 reported in an online publicly-accessible database, with a verification process in place and an arrears clearance framework established.
Domestic arrears as of end 2018 and end 2019 reported in an online publicly-accessible database, with verification process in place.
AND Percentage decline in the verified stock of domestic arrears at
Domestic arrears as of end 2019 and end 2020 reported in an online publicly-accessible database, with verification process in place.
AND Percentage decline in the verified stock of domestic arrears at
Domestic arrears as of end 2020 and end 2021 reported in an online publicly-accessible database, with verification process in place.
AND Percentage decline in the verified stock of domestic arrears at end 2021 compared
73

Total Financing Allocated (US$m)
As % of Total
Financing (US$700m)
DLI Baseline(2016-2017)
Disbursement Linked ResultsYear 1 - 2018 Year 2 – 2019 Year 3 – 2020 Year 4 – 2021
accessible database.
end 2019 compared to end 2018 meets target and is consistent with the state’s arrears clearance framework. -Basic target: At least a 5 percent decline or maintain stock below 5 billion naira-Stretch target: More than 20 percent decline
end 2020 compared to end 2019 meets target and is consistent with the state’s arrears clearance framework. -Basic target: At least a 5 percent decline or maintain stock below 5 billion naira-Stretch target: More than 20 percent decline
to end 2020 meets target and is consistent with the state’s arrears clearance framework. -Basic target: At least a 5 percent decline or maintain stock below 5 billion naira-Stretch target: More than 20 percent decline
DLI 8 50 7% 3 12 15 20DLI 8 Basic 26 3 (3 States x $1m) 6 (6 States x $1m) 7 (7 States x $1m) 10 (10 States x $1m)
DLI 8 Stretch 24 6 (3 States x $2m) 8 (4 States x $2m) 10 (5 States x $2m)
DLI 9: Improved debt sustainability
All but 3-4 States are complying with the monthly debt service threshold per FSP. Total debt-to-revenue ratio for the median state was 172% end 2017. 15 States < 150%, 11 States < 125% and 5 States < 100%
Average monthly debt service deduction is < 40% of gross FAAC allocation for FY2018
AND Total debt stock at end Dec 2018 as a share of total revenue for FY2018 meets target: -Basic target: < 150%-Stretch target: < 125%
Average monthly debt service deduction is < 40% of gross FAAC allocation for FY2019
AND Total debt stock at end Dec 2019 as a share of total revenue for FY2019 meets target: -Basic target: < 140%-Stretch target: < 115%
Average monthly debt service deduction is < 40% of gross FAAC allocation for FY2020
AND Total debt stock at end Dec 2020 as a share of total revenue for FY2020 meets target: -Basic target: < 130%-Stretch target: < 105%
Average monthly debt service deduction is < 40% of gross FAAC allocation for FY2021
AND Total debt stock at end Dec 2021 as a share of total revenue for FY 2021 meets target: -Basic target: < 120%-Stretch target: < 95%
74

Total Financing Allocated (US$m)
As % of Total
Financing (US$700m)
DLI Baseline(2016-2017)
Disbursement Linked ResultsYear 1 - 2018 Year 2 – 2019 Year 3 – 2020 Year 4 – 2021
DLI 9 67.5 10% 15 15 17.5 20DLI 9 Basic 27 6 (6 States x $1m) 6 (6 States x $1m) 7 (7 States x $1m) 8 (8 States x $1m)
DLI 9 Stretch 40.5 9 (6 States x $1.5m) 9 (6 States x $1.5m) 10.5 (7 States x$1.5m)
12 (8 States x $1.5m)
DLI Verification Protocol Table# DLI Definition/
Description of achievementProtocol to evaluate achievement of the DLI and data/result
verificationState Data source
Verification Entity
Procedure
Eligibility Criteria:
Annual State budget [prepared under the National Chart of Accounts] approved by the State Assembly and published online
AND
Annual audited financial statement [prepared in accordance with IPSAS] submitted to the State Assembly and published online
The disclosures will be made on the official website of the State that can be accessed by specific timelines defined for each of the Program years:
Approved annual budget: The approved budget shall include appropriations according to the functional/organizational and detailed economic classifications of expenditures.
Audited financial statements: The annual audited financial statements should contain a complete set of financial statements including, at a minimum: the sources and uses of funds statements (or receipts and payments of funds statement); the appropriation for the year in review as well as the actual spending and balances against the appropriation; comparative actual expenditures of the preceding year; a summary statement of the state’s debt stock and debt servicing; accounting policies applied; and notes to the accounts.
IPSAS-compliant annual audited financial statements: At the minimum, IPSAS Cash Basis of reporting is used, excepting compliance with (a) third party transactions; and (b) consolidation, and completeness of required disclosures under IPSAS.
Annual state budget prepared under national Chart of Accounts (GFS compliant): The national Chart of Accounts (CoA) is the approved FAAC CoA/budget classification system,
State official website(s)
Budget Call Circular to confirm that the State has prescribed and used the new budget and account classification system.
IVA (AuGF) IVA checks the state website and reviews the documents published on the website. The IVA reviews the Budget Call Circular sent to the IVA
75

domesticated to the State requirement in terms of elements without varying the structure and segments.
RA 1: Increasing Fiscal Transparency and Accountability 1 Improved financial reporting and budget reliability:
1.1 In-year quarterly budget implementation reports published on average within [x] weeks of quarter-end to enable timely budget management
Quarterly budget implementation report has the same meaning as quarterly budget execution reports. The report would be posted to the state website within the specific timelines defined for each of the Program years, and would include, at a minimum, the approved budget appropriation for the year against each organizational units (MDAs) for each of the core economic classification of expenditures (Personnel, Overheads, Capital, and others), the actual expenditures for the quarter attributed to each as well as the cumulative expenditures for year to date, and balances against each of the revenue and expenditure appropriations. This would be provided also on a consolidated basis across the 4 economic classifications for the entire state. Note that ‘others’ will include debt servicing, and transfers, or other expenditures not attributable to any of the other 3 economic classifications. The specific timelines are defined in the DLRs for each of the Program years
State official website(s)
IVA (AuGF) IVA checks the state website and reviews the documents published on the website.
1.2. FY[x] deviation from total budget expenditure
Expenditure outturn deviation is computed as the difference between the original approved total budget expenditure and the actual total budget expenditure, divided by the original approved total budget expenditure, and expressed in positive percentage terms. The deviation should be less than the percentage defined for each year of the Program.
Interim report on full year state expenditure from State Auditor General
IVA (AuGF) IVA reviews the interim report and verifies the correct computation of the outturn deviation
2 Increased openness and citizens’ engagement in the budget process:2.1 Citizens’ inputs from formal public consultations are published online, along with the proposed budget
Formal public consultations on the budget preparation is interpreted as the executive holding at least one ‘town-hall’ consultation before the proposed budget is drafted. Consultations should include the participation of local government authorities and state-based CSOs. Citizen’s inputs are represented by the minutes of the public consultations, and these should be posted on the official state website, alongside the proposed annual budget.
State official website(s)
IVA (AuGF) IVA checks the state website and reviews the documents published on the website.
2.1/2.2 Citizens’ budget based on approved annual State budget published online by
Citizens’ budget based on the State’s approved budget published online means that the budget of the State government shall, after the budget is approved, be presented in a summarized but comprehensible manner for citizens and posted on the State website no later than April i.e. 4 months after the start of the fiscal
State official website(s)
IVA (AuGF) IVA checks the state website and reviews the documents published on the website.
76

end April [with functional online feedback mechanisms]
year. The form and general content of the citizens’ budget shall be provided to each State for ease of reference. Functional feedback and response mechanisms online are interpreted as a space in the State website for verified users [email, Facebook, and other accounts] to download, post comments on and share the citizens’ budget for government response.
2.2 Citizens accountability report based on audited financial statements/reports published online for FY[x], no later than September
Citizen’s Accountability reports are summarized and comprehensible versions of the audited financial statements/reports that are made available on the state website by September of the proceeding FY. The form and general content of the accountability report to citizens shall be provided to each state for ease of reference.
State official website(s)
IVA (AuGF) IVA checks the state website and reviews the documents published on the website.
RA 2: Strengthening Domestic Revenue Mobilization 3 Improved cash
management and reduced revenue leakages through implementation of State TSA
An established and functional state-level TSA requires all the following criteria to be met by the end of the calendar year:
(i)There is a formally approved cash management strategy in place.
(ii) The TSA has a system of cash management that allows for a central view of cash balances in bank accounts on a single electronic dashboard. The minimum percentage of state government finances that is managed by the state ministry of finance or the state accountant general’s office on the single electronic dashboard is defined for each of the Program years. State government finances include all budgetary and non-budgetary funds managed by the state Government. It excludes local government and parastatals. (iii) The TSA has one consolidated revenue treasury account for state revenues. Revenues collected by MDAs such as service fees no longer sit in individual MDA accounts at different commercial banks but are brought into the consolidated revenue account as part of the TSA.
Office of the State Accountant General
The States accountant general will produce a state cash survey report based on an inventory of state’s cash balances in all bank accounts to confirm the gross state government finances and how much of it is part of the TSA.
IVA (AuGF) Verification by the IVA of the existence of a functioning TSA platform meeting the criteria through online or physical verification.
IVA verifies that the cash management strategy exists and forms the basis of the TSA
IVA reviews the state cash survey report to verify the percentage of state government finances covered by the TSA
4 Strengthened Internally Generated Revenue (IGR) collection
77

4.1 Consolidated state revenue code covering all state IGR sources and stipulating that the state bureau of internal revenue is the sole agency responsible for state revenue collection and accounting approved by the state legislature and published
The up-to-date consolidated revenue code covers all the state’s IGR sources and all the local governments (falling under that state) IGR sources. IGR sources include presumptive tax, indirect taxes and levies (roads, hotels), fines, fees and charges. Personal income tax, including PAYE, which is collected by the State will be covered by the federal tax code. The consolidated revenue code must also stipulate that the state bureau of internal revenues (SBIR) is the sole agency responsible for state revenue (tax and non-tax) collection and accounting in the state.
The code must be approved by the state legislature to have a legal basis, either as a law or a resolution. It cannot be an executive order with no legal basis.
Publication must include being published online, so it is automatically available to the public/all taxpayers.
State official website(s)
IVA (AuGF) IVA checks the state website and reviews the Code
4.2 Annual nominal IGR growth rate meets target
Annual nominal growth rate of total state IGR is computed as the difference between the total IGR collected in Jan-Dec in the current year and the total IGR collected in Jan-Dec in the previous year, divided by the total IGR collected in Jan-Dec in the previous year, and expressed as a percentage, which could be negative (if IGR has declined) or positive (if IGR has increased). The ratio must meet the basic or stretch targets.
The IGR receipts included must come from regular IGR sources and not from financing or savings items. Specifically, IGR is defined as all sources of State revenue from taxes, levies, fines, fees, and charges provided that these are as defined in any or all of the following codes passed by the relevant legislative bodies, as required: Taxes, levies, fees and fines for States and Local
Governments as listed in Part 2 and 3 of the Taxes and Levies (Approved list for collection) Act 2004 as amended in 2015.
Taxes, levies, fees and fines for States and Local Governments as codified and listed in the consolidated state revenue code (if it exists) Charges by States MDAs as codified and listed in the consolidated state revenue code (if it exists)
Interim Report on full year IGR collection from the State Auditor General
IVA (AuGF) IVA reviews the interim report and check that only regular and legitimate IGR sources have been included, and then verifies that the computation of the annual nominal growth rates of IGR is correct
RA 3: Strengthening Efficiency in Public Expenditure 5 Biometric 5.1 Use of biometrics to reduce payroll fraud is defined as a state Copies or IVA (AuGF) The IVA reviews the
78

registration and bank verification number (BVN) used to reduce payroll fraud
having: i) completed a biometric exercise for a percentage (as defined for each of the Program years) of the current (defined as in the same calendar year) civil servants and pensioners on the state payroll; ii) linked the biometrics data to the state payroll to identify ghost workers; iii) taken actions to remove and/or regularize identified ghost workers from the payroll within 3 months of identification.
5.2 is defined as a state having: i) linked bank verification number data to a percentage (as defined for each of the Program years) of its current (defined as in the same calendar year) civil servants and pensioners on the state payroll; ii) taken steps to identify payroll fraud; iii) taken actions to address the identified payroll fraud within 3 months of identification
evidence of the payroll scripts, biometric database and BVN database
Office of the State Accountant General will prepare and provide a report of ghost workers and payroll fraud identified and the financial savings accruing from removing them from the payroll and made available for IVA inspection and confirmation
payroll scripts, biometric database and BVN database, and the report on ghost workers and payroll fraud submitted by the States
The IVA can conduct on-site visits to do physical verification of payroll scripts, the biometric database, and the BVN database and ask for them to be generated in their presence.
6 Improved procurement practices for increased transparency and value for money:
6.1 Existence of a public procurement legal framework and a procurement regulatory agency. Said legal framework should conform with the UNCITRAL Model Law and provide for: 1) eProcurement; 2)
The public procurement legal framework must be approved by the state legislature to have a legal basis, either as a law or a resolution. It cannot be an executive order with no legal basis.
The law should conform with the UNCIRTAL Model Law and provide for: 1) eProcurement; 2) establishment of an independent Procurement Board and 3) cover all MDAs receiving funds from the state budget including the LGAs.
The regulatory agency is the agency responsible for prescribing regulations and procedures for public procurements in accordance with legal framework with a view to improve governance,
State Public Procurement Regulatory Agency
IVA (AuGF) (i) The IVA confirm the existence of State procurement law(s) (ii) Physical inspection by the IVA to confirm the existence and functionality of the agencies in accordance with the legal framework.
79

establishment of an independent procurement board and 3) cover all MDAs receiving funds from the state budget
management, transparency, accountability and quality of public procurement of goods, works and services.
Year 1-36.2 Publish contract award information above a threshold set out in the Operations Manual on a monthly basis in OCDS format AND Implement e-procurement in MDAs (inc. education, health and public works) for goods and works Program expenditure
To achieve the open contracting component of the DLI, States must publish online contract award information for all contracts awarded during the fiscal year that are above the threshold (as defined in the state procurement law), in line with the Open Contracting Data Standards (OCDS). For 2018, States can publish the information on the state website or online portal if already established. For 2019 onwards, States will have to have an online portal established to record and publish data on all the various processes in the procurement cycle, in line with the Open Contracting Data Standards (OCDS).
To achieve the e-procurement component of the DLI, States will have to implement e-procurement in at least 3 (in 2019) and then 4 (in 2020) MDAs (including Education, Health and Public Works) for at least two categories of program expenditures. E-procurement is defined as an ICT-based procurement management tool that reduces human interface and hence the potential for corruption in procurement activities.
State official website(s)
Open contracting online portal
IVA (AuGF) (i)IVA checks the state website in the first year and from the open contracting portal in subsequent years and verifies that contract award information has been published in line with OCDS
(ii) Physical inspection by the IVA of the implementation of e-procurement across MDAs
Year 46.2 More than 25% increase in citizens’ access to procurement informationAND Time savings by more than 20% for each procurement process conducted in the MDAs implementing e- procurement
A baseline survey will be conducted in 2019 in every state participating in the SFTAS program to assess: (1) Citizen’s access to procurement information for contracts awarded in 2018. Each state will be given a percentage score to represent the percentage of procurement information accessible by citizens which will be measured by analyzing the amount of procurement data available to the public; and (2) The average time taken to carry out procurement processes in Education, Health and Public Works. Each state will be given a quantitative figure for the average time in that state.
A second survey will be conducted in Q4 of 2021 using the same methodology will be conducted in every state that have been verified by the IVA as having implemented open contracting and e-procurement reforms in 2018-2020. The second survey will
Baseline (2019) and follow up (2021) state procurement surveys conducted by an external consulting firm (with AuGF as part of the team) procured under the TA component by the FMoF
IVA (AuGF) The consulting firm will provide the results of the state procurement surveys and the underlying data to the IVA
80
assess: (1) Citizen’s access to procurement information for contracts awarded in 2020 and the first half of 2021; and (2) The average time to carry out procurement processes in 2020 and the first half of 2021.
The increase in citizens’ access to procurement information is calculated as the difference between the scores as a percentage of the score in the baseline survey. States will meet this DLR if the percentage increase is 25 percent or more.
The time savings for procurement process is calculated as the difference between the average time as a percentage of the average time in the baseline survey. States will meet this DLR if the average time for carrying out the procurement process has been reduced by 20 percent or more.
RA 4: Strengthening Debt Sustainability7 Strengthened
public debt management and fiscal responsibility framework
7.1 Approval of state-level public debt legislation, which stipulates: 1) responsibilities for contracting state debt; 2) responsibilities for recording/reporting state debt; and 3) fiscal and debt rules/limits
7.2 Quarterly state debt reports accepted by the DMO on average
Strengthened public debt monitoring and management is to be achieved by adopting the following four actions: (i) Passage of a State Fiscal Responsibility Law OR passage of the State Public Debt Management Law OR the inclusion of the provisions of the FRA in the organic PFM Law. For any state approving new legislation or amending an existing legislation, the DMO will prepare an assessment on the adequacy of the provisions indicated in DLI 7.1, i.e., provisions establishing responsibilities for contracting state debt, responsibilities for recording/reporting state debt, fiscal and debt rules/limits.
(ii) States having quarterly debt reports using the template DMO provides to States, approved by the DMO on average two months after the end of the quarter. [Note: The DMO already has a state debt reporting template and procedure to approve the quarterly debt reports submitted by States, which includes a technical assessment of data consistency and accuracy. The state debt template and procedure will be further strengthened prior to program effectiveness]
(iii) States publishing annual state debt sustainability analysis results by end of the calendar year, including medium-term budget forecasts and a detailed description of the debt portfolio and
(i)State Ministry of Finance and FGN DMO assessment of the state law
(ii)FGN DMO schedule of approved quarterly debt reports
(iii) and (iv) State official website(s) and FGN assessment of the DSA and MTDS
DMO assesses and IVA (AuGF) validates DMO’s findings
(i) DMO transmits the State law(s) to IVA, including the assessment by DMO on the adequacy of the laws.(ii)DMO transmits to IVA the schedule of the State debt reports approved in each year, including the average time between the end-of-quarter and the date of DMO’s approvals. The schedule will contain notes on why State’s debt report was not approved or approved.
(iii) DMO transmits the state debt sustainability analysis reports to IVA, including the
81

two months or less after the end of the quarter in [x]
AND
Annual state debt sustainability analysis and MTDS published by end of December [x]
borrowing options. The state debt sustainability analysis report must contain analysis of the previous CY’s debt and fiscal figures, and must be published in a state official website. For any state publishing an annual state debt sustainability analysis report, the DMO will review and verify whether it meets the DMO standards that are issued with the DSA tool.
(iv) States publishing a medium-term state debt management strategy, including a detailed description of the borrowing options and the expected performance of cost-risk indicators. The state medium-term debt management strategy report must be published in a state official website. For any state publishing the state medium-term debt management strategy report, the DMO will review and verify whether it meets the DMO standards reflected in the Federal Government Medium-Term Debt Management Strategy (MTDS) Report.
assessment by DMO of whether the DSA meets the quality standards set out by the DMO for the DSA. IVA confirm the existence of the State debt sustainability analysis on the state website.
(iv) DMO transmits the state medium-term debt management strategy report to IVA, including the assessment by DMO of whether the report meets the quality standards set out by the DMO. IVA confirm the existence of the State medium-term debt management strategy on the state website
8 Improved clearance/reduction of stock of domestic expenditure arrears
(i) Domestic arrears reported in an online publicly-accessible database, with information of contractor arrears by creditor to permit verification: The online database will contain information on: 1) the
aggregate and individual contractor arrears whose amount exceed a certain threshold (to be defined in the operations manual) to reduce administrative costs associated to reporting and/or verifying small claims); 2) the aggregate pension and salary arrears.
The published data on contractor arrears must include information that can permit creditors to verify that their claims are being accurately reported in the database. At a minimum, the internal database must include the name of the contractor, the amount due at end-of-year, the nature of the goods and services procured that generated the claim, and billing data (as applicable). The published database should include the name of the contractor, the nature of the goods
State arrears clearance framework from State Ministry of Finance
State official website(s) containing the arrears database and claims link
FGN DMO:-State debt report for Q4 approved by DMO and with
DMO assesses and IVA (AuGF) validates DMO’s findings
DMO transmits the state arrears clearance framework to IVA, including the assessment by DMO. IVA confirm the existence of the State arrears clearance framework on the website
DMO transmits to IVA: (i) the list of States that DMO has assessed as having verified domestic arrears stock at end-of-year; (ii) the
82

and services procured and billing date, but does not need to contain the contractor amount. The amount can be made known to the contractor on request.
A link in the official website will permit any contractor creditor whose claims are not included in the database to communicate this exclusion to the State Ministry of Finance and the DMO, by filling an online form and attaching supportive evidence of her claim. If the State Ministry of Finance confirms the validity of the claim, it will be added to the database.
Note: State quarterly debt reports submitted to DMO already include information on arrears at end-of-quarter. To verify the accuracy of the arrears reported by a state at the end-of-year, the DMO will review the state online database and state ministry of finance report of the verification process. States whose reported end-of-year total arrears cannot be verified by the DMO will be considered unable to meet the DLI 8.
(ii) The domestic arrears clearance framework will include at the minimum the planned actions to settle arrears and an explicit prioritization of expenditure arrears to be settled. The arrears clearance framework will be published in the State official website. (iii) Clearance/reduction of domestic expenditure arrears (contractors, salaries, pension arrears) is defined as the decline in the nominal stock of domestic expenditure arrears at the end of year, compared to the previous year, expressed in percentage terms. The percentage decline must be within the basic or stretch targets, and it must be consistent with the arrears clearance framework of the State. Domestic arrears data used to calculate the annual percentage decline must be obtained from State debt reports for the fourth quarter of two consecutive years, approved by the DMO, and with the reported total domestic arrears verified by the DMO.
(iv) For the basic target, States either have to show a 5 percent year-on-year decline or maintain the stock of arrears below 5 billion naira. The 5 billion naira represents a small amount of technical arrears (non-repayment because of delay in payment advice, contested claims, delays in payment by treasury which
the domestic arrears stock verified
approved Q4 debt reports for those States that allow calculation of the percentage change in the nominal stock of total domestic expenditure arrears at the end of the year, compared to the previous years; (iii) IVA confirm the existence of the arrears database on the state website.
83

lead to short-term timing mismatches).9 Improved debt
sustainabilityStrengthened debt sustainability results from achieving levels of debt indicators that are below the debt thresholds established in DLI 9. Two debt indicators are to be observed: (i) the ratio of total debt stock at end-of-year (the end of December) to the total revenue collected during the year (Jan-Dec of the same calendar year); and (ii) the ratio of average monthly debt service (principal and interest) deductions during the year to the gross FAAC allocation for the same year. DLI 9 is met when the two indicators are below the basic or stretch targets.
Total state debt stock includes domestic debt (which includes commercial bank borrowing, domestic bonds, debt associated with the two financial assistance packages from FGN, domestic arrears) and external debt (multilateral loans). State debt data used to calculate the debt indicators must be obtained from the state debt report for the fourth quarter approved by the DMO.
Total state revenue includes statutory transfers, IGR and grants. Deductions for debt service payments refer to the deductions from the gross FAAC allocation to States, made to cover debt service obligations on external borrowing and other State borrowing that is guaranteed by the FGN.
FGN DMO:-State debt report for Q4 approved by DMO for the debt stock data
-State debt service deductions data
Interim report on full year state revenue and gross FAAC allocation to the state from State Auditor General
DMO assesses and
IVA (AuGF) validates DMO’s findings
DMO transmits to IVA for those States with approved Q4 debt reports data on the state debt stock and state debt service deductions.
IVA uses the DMO reports and the interim report from the State Auditor General to calculate the two ratios and verify if they meet the thresholds indicated in DLI 9.
Bank Disbursement Table
# DLI Bank financing allocated to the DLI (Indicative) - All States
Deadline for DLI Achievement1
- All States
Minimum DLI value to be achieved to trigger disbursements of Bank Financing2
-per State
Maximum DLI value(s) expected to be achieved for Bank disbursements purposes 3
-per State
Determination of Financing Amount to be disbursed against achieved and verified DLI value(s) 4
-per State
84

1Improved financial reporting and budget reliability
US$59.6 million
December 31, 2021
1.1 FY18 quarterly budget implementation reports published on average within 6 weeks of quarter-end to enable timely budget management
1.2 FY18 deviation for total budget expenditure is < 30
1.1 FY21 quarterly budget implementation reports published on average within 4 weeks of quarter end to enable timely budget management
1.2 FY21 deviation for total budget expenditure is < 15%
1.1-1.2: Pass/fail
2Increased openness and citizens’ engagement in the budget process
US$37.9 million
December 31, 2021
2.1 Citizens’ inputs from formal public consultations are published online, along with the proposed FY19 budget
2.1 Citizens’ inputs from formal public consultations are published online, along with the proposed FY22 budget AND Citizens’ budget based on approved FY21 State budget published online by end April 21 with functional online feedback mechanisms
2.2 Citizens accountability report based on audited financial statements/reports published online for FY20
2.1-2.2: Pass/fail
3Improved cash management and reduced revenue leakages through implementation of State TSA
US$105 million
December 31, 2021
TSA, based on a formally approved cash management strategy, established and functional, and covering a minimum of 50 percent of state government finances
TSA, based on a formally approved cash management strategy, established and functional, and covering a minimum of 80 percent of state government finances.
Pass/fail
4Strengthened Internally Generated Revenue (IGR) collection
US$160 million
December 31, 2021
4.1 Consolidated state revenue code covering all state IGR sources and stipulating that the state bureau of internal revenue is the sole agency responsible for state revenue collection and accounting approved by the state legislature and published
4.2 Annual nominal IGR growth rate is 20 percent (basic result)
4.1 N/A
4.2 Annual nominal IGR growth rate is 40 percent or more (stretch result)
4.1: Pass/fail
4.2 Pass/fail for basic result; and additional US$1 million per year
85

per state for stretch result
5Biometric registration and bank verification number (BVN) used to reduce payroll fraud
US$73 million
December 31, 2021
5.1 Biometric capture of at least 60 percent of current civil servants completed and linked to payroll, and identified ghost workers taken off the payroll in FY18
5.2 Link BVN data to at least 60 percent of current civil servants on payroll and identified payroll fraud addressed in FY18
5.1 Biometric capture of at least 90 percent of current civil servants and pensioners completed and linked to payroll, and identified ghost workers taken off the payroll in FY21
5.2 Link BVN data to at least 90 percent of current civil servants and pensioners on payroll and identified payroll fraud addressed in FY21
5.1-5.2: Pass/fail
6Improved procurement practices for increased transparency and value for money
US$79.5 million
December 31, 2021
6.1 Existence of public procurement legal framework and procurement regulatory agency
In 2018-20206.2 Publish contract award information above a threshold for 2018 on a monthly basis in OCDS format on the state website
In 20216.2 More than 25% increase in citizens’ access to procurement information AND Time savings by more than 20% for each procurement process conducted in the 4 MDAs
6.1 N/A
In 2018-20206.2 Publish contract award information above a threshold for 2020 on a monthly basis in OCDS format on the state website AND Implement e-procurement in at least 4 MDAs (inc. Education, Health and Public Works) for goods and works program expenditure in FY2020In 20216.2 N/A
6.1-6.2: Pass/fail
7Strengthened public debt
US$67.5 million
December 31, 2021
7.1 Approval of state-level public debt legislation, which
7.1 N/A 7.1-7.2: Pass/fail
86

management and fiscal responsibility framework
stipulates: 1) Responsibilities for contracting state debt; 2) Responsibilities for recording/reporting state debt; and 3) Fiscal and debt rules/limits
7.2 Quarterly state debt reports accepted by the DMO on average two months or less after the end of the quarter in 2018
7.2 Quarterly state debt reports accepted by the DMO on average two months or less after the end of the quarter in 2021 AND Annual state debt sustainability analysis and MTDS published by end Dec 2021
8Improved clearance/reduction of stock of domestic expenditure arrears
US$50 million
December 31, 2021
Domestic arrears reported in an online publicly-accessible database, with verification process in place AND At least a 5 percent decline in the verified stock of domestic arrears or maintain stock below 5 billion naira (basic result)
Domestic arrears reported in an online publicly-accessible database, with verification process in place AND Percentage decline in the verified stock of domestic arrears is 20 percent or more (stretch result)
Pass/fail for basic result; and additional US$1 million per year per state for stretch result
9Improved debt sustainability
US$67.5 million
December 31, 2021
Average monthly debt service deduction is < 40% of gross FAAC allocation for FY2018ANDTotal debt stock at end of Dec 2018 as a share of total revenue for FY2018 meets basic target of less than 150 percent
Average monthly debt service deduction is < 40% of gross FAAC allocation for FY2021ANDTotal debt stock at end of Dec 2021 as a share of total revenue for FY2021 meets stretch target of less than 95 percent
Pass/fail for basic result; and additional US$0.5 million per year per state for stretch result
1If the DLI is to be achieved by a certain date before the Bank Financing closing date, please insert such date. Otherwise, please insert the Bank Financing closing date.2 If the DLI has to remain at or above a minimum level to trigger Bank disbursements (e.g. DLI baseline), please indicate such level. 3 Please insert the DLI value(s) above which no additional Bank financing will be disbursed.4Specify the formula determining the level of Bank financing to be disbursed based on level of progress in achieving the DLI, once the level of DLI achievement has been verified by the Bank. Such formula may be of various types, including pass/fail, linear, or other types as may be agreed between the Bank and the borrower.
87

Annex 4: Summary Technical AssessmentA. Program Strategic Relevance
1. The need to strengthen state fiscal management and increase sustainability remain, as fiscal conditions will continue to be challenging in the medium-term. At present, States remain under considerable fiscal pressure, with States having to constrain spending and requesting continuation of the Budget Support Facility beyond the original end date of May 2017. Under assumptions of a fragile economic recovery (with higher oil price and production) and assuming no increase in non-oil revenues or in States’ IGR (as a share of GDP), total state revenues are projected to increase slightly to 2.9 percent of GDP by 2018, but will remain much lower than 2011-2014 levels. Furthermore, if we assume that total state fiscal deficits will remain around 0.8 percent of GDP annually through the medium-term to finance expenditures, total state debt stock will continue to increase to 4.7 percent of GDP by 2020, and the total state debt-to-revenue ratio will remain at the elevated levels of 2016-2017. As a result, a higher share of state revenues would be used for interest payments and debt servicing, rather than development spending. In this scenario with no or very limited fiscal adjustment, States remain vulnerable and continue to represent a source of fiscal risks. for the FGN (who guarantees more than 50 percent of state debt) and state expenditures will remain totally inadequate to provide essential public services and support economic development.
2. Therefore, the Government’s Fiscal Sustainability Plan and the fiscal transparency commitments of the OGP will remain highly relevant through the medium-term. The full and sustained implementation of the key PFM reforms and fiscal adjustments contained in the FSP as well as the fiscal transparency commitments of the OGP can help strengthen States fiscal sustainability and increase fiscal resources for essential expenditures by increasing their internally generated revenues (IGR), managing recurrent spending pressures, strengthening debt management and significantly improving fiscal transparency and accountability.
B1. Technical Soundness of the Program (FSP)
3. The technical soundness of the Program has been assessed looking at the level of ownership and commitment to the FSP, the strengths and weaknesses in the FSP design and implementation arrangements, and the extent in which the PforR operation and the TA component can address the gaps and challenges highlighted. The assessment has been informed by a large body of analytical work by the World Bank, other development partners and by the NGF on state-level fiscal management and performance. It has also drawn from the learnings of past and current state-level Bank operations involving governance and PFM reforms. The ongoing assessments by the FMoF and NGF of the FSP implementation status have been used to review progress by States in implementing the FSP. A focused political economy analysis study on the FSP and on broader state-level fiscal reforms has been carried out by the Bank and the findings and implications for the operation form part of the assessment. Finally, extensive consultations with state commissioners of finance, and budget and planning, accountant generals, chairpersons of state bureau of internal revenue from all 36 States in a series of focus groups have been carried out to understand their views on the FSP, the challenges they face in implementing reforms and what can be done to accelerate progress.
88

4. Program ownership and commitment: While the federal government initiated and coordinated the development of the FSP across States, there is a very broad consensus across heads of institutions responsible for fiscal management at the state-level that the reforms in the FSP are necessary and are in the self-interest of States to implement. The public commitment from the 35 States participating in the BSF to implement the FSP has created a real sense of responsibility and accountability as exemplified by the reporting to NEC on FSP implementation.
5. The design of the FSP exhibits several strengths: (i) appropriate over-arching objectives; (ii) many actions address key weaknesses in state fiscal management (acute lack of fiscal transparency and accountability; low IGR mobilization; inefficiencies in public spending; and poor compliance with debt management rules); (iii) actions build on various PFM reforms started by States; and (iv) the FSP encourages complementary parallel fiscal reforms.
6. However, the design of the FSP also has a number of shortcomings: (i) the 22 actions are a mixture of activities, outputs, intermediate outcomes and outcomes with varying impact potential but presented without any prioritization; (ii) there are gaps in the set of measures needed in order to fully achieve the five over-arching objectives; (iii) lack of specificity with many of the actions vaguely described; (iv) there is no accounting for differences in starting points and capacity of States to implement the measures; (v) the timeframe for the implementation is not long enough for complex reforms or for supporting sustained changes in fiscal behavior.
7. While all States have made at least partial progress, implementation of the FSP is far from complete. Several factors have contributed to incomplete implementation of the FSP to date: (i) the financial incentive was weakened as the FSP was not enforced by the federal government as strict conditions for accessing the monthly disbursements from the BSF; (ii) some States with weak capacity struggled to implement measures and there was no program of TA to help them train staff and introduce new processes and systems; (iii) within the States, in some cases there was a lack of support among the civil servants and a lack of political will and leadership from the state executive.
8. Despite these challenges, every state has made some progress and there are several success stories that can be used as examples. Success stories include the increase in IGR that many States were able to achieve in 2016, despite the economic slowdown and recession, by reducing leakages from remittance of service fees collected by MDAs through the implementation of the TSA. Kaduna reported that their TSA had helped them double their IGR. Many States also noted that they had tackled payroll fraud by using biometric capture, which enabled them to remove ghost workers and bring down their personnel expenditure costs.
9. The design of the PforR seeks to address the shortcomings in the FSP design highlighted above through the following:
Only selecting a subset of the most impactful FSP actions to include in the Program – those that are most critical in achieving the objectives. Other areas of the FSP are to be taken up through complementary or future interventions. The success of the Program will not be affected by the implementation of the areas of the FSP not included in the Program;
89

Including complementary demand-side OGP commitments and other interventions that addresses the gaps identified in the FSP. These include: public budget consultations and citizens budget; improving budget credibility; use of e-procurement and open contracting; clearance of domestic arrears. See Table 4.1 below for further details;
Putting in place a specific and clear matrix of DLIs and DLRs, DLI verification protocols and results framework to eliminate ambiguity on what is needed to be done by States to achieve a result;
DLIs and DLRs are designed to account for the heterogeneity of States, offering incentives for stronger States to improve their performance further, while rewarding weaker/lagging States for strong commitment and effort through scalability and the series of stretch and basic results; and
The multi-year program measures results across four fiscal years giving time for implementing complex reforms and incentivizing sustained performance.
10. Furthermore, learning from the implementation challenges, the Program proactively seeks to strengthen capacity of States to carry out reforms and create stronger incentives for sustained and full implementation of the DLIs:
Disbursements for the performance-based financing component will only be made on achievement of clearly defined DLRs against detailed verification protocols, verified by an IVA. Any changes to the DLRs will undergo a formal process of review and approval and will be applied across the board for all States. This will strengthen the incentives for States, knowing that the PforR disbursements are strictly conditional on achieving results. The impact of enforcing the conditions can be demonstrated by the process of BSF disbursements in August 2017. The FMoF only disbursed the 1 billion naira to States that had implemented the tax eservices platform at the state-level (one of the FSP actions). As a result, there was an upsurge in demand from States for FIRS consultants to come and implement the platform in their state;
Capacity building support will be made available to States through the TA component to support them to achieve the DLIs;
The Program will proactively create an environment for healthy peer competition and peer learning among States by publishing individual States performance against the DLI matrix for each result year so that lagging States will want to improve so that it is no longer at the bottom and can also learn from States that are performing better.
90

Table 4.1: Summary assessment of the FSP actions
Assessment# Action Responsi
ble Strengths, weaknesses and enhancementsInclusion as DLI in PforR?
Objective 1: To Improve Accountability & Transparency1 Publish audited annual financial
statements within 6 months of financial year end.
State This is the foundation for improving accountability and transparency and strong consensus among States that this is essential
Important for providing source of credible fiscal and financial data for States for verification of other results
Eligibility Criteria
2 Introduction and compliance with the International Public Sector Accounting Standards
State Audited financial statements should be prepared in accordance with IPSAS (minimum cash)
Eligibility Criteria (Years 3 & 4)
3 Publish state budget online annually.
State This is the foundation for improving accountability and transparency and strong consensus among States that this is essential.
But this action should be enhanced and complemented to have a significant impact on improving accountability and transparency: Budget is prepared according to standard Chart of Accounts to allow for
analysis and comparability across States Budget will only be a credible expression of government’s fiscal plans if the
budget is reliable. Include in Program the PEFA indicator on budget reliability and target reducing deviation between budget and expenditure outturns
Complement with OGP commitments to engage citizens on the budget formulation process: public consultations and citizen’s budget
Eligibility Criteria
Eligibility CriteriaDLI #1.2
DLI #2
4 Publish budget implementation performance report online quarterly.
State Essential for improving accountability and transparency. But should target publishing reports on average within or less than 4 weeks of quarter end
DLI 1.1
5 Develop standard IPSAS compliant software to be offered to states
Federal Less impactful as States do not have to use FGN software to implement IPSAS
No
Objective 2: Increase Public Revenue6 1) Set realistic and achievable
targets to improve independently generated revenue (from all revenue generating activities of the state in addition to tax collections) and ratio of capital to recurrent expenditure2) Implementation of targets
State IGR growth targets should consider the States’ different starting points; there is a risk of setting soft targets if States are left to decide what is realistic and achievable. The IGR target could be set as a percentage increase relative to the States IGR collection for the previous year. A basic and stretch result can account for different IGR growth potential.
A risk that in focusing on IGR growth, States may impose arbitrary taxes creates an uncertain business environment. The private sector is already
DLI #4.2
DLI #4.1
91

concerned with the unpredictability of state-level taxes. To mitigate against the risk, States should also be encouraged to regularize taxes, put all state IGR sources in one tax code to ensure not overlap and make the tax code accessible to all taxpayers.
Expenditure ratio: While the growth in recurrent spending has made it challenging for States to consolidate fiscally, increasing the ratio may have little benefit if capital spending is inefficient and public investment management is weak.
No
7 Implement a centralized Treasury Single Account (TSA) in each State.
State Potential for fiscal impact is high – to improve cash management and save on financing costs, to improve revenue collection by reducing revenue leakages from MDA remittances of service fees and to reduce liquidity risks. The FGN and some States already have benefit from implementing the TSA
To be effective to reduce unnecessary financing costs, TSAs need to be based on a formal cash management strategy
To reduce revenue leakages and contribute to increasing revenues, MDAs should bring receipts sitting in different accounts at commercial banks into the TSA
DLI #3
8a. Quarterly financial reconciliation meetings between Federal and State Governments to cover VAT, PAYE remittances, refunds on Government projects, Paris Club and other accounts
State/ Federal
The responsibility for these meetings lie also with the Federal (FIRS). The reconciliation meetings will in the future no longer be necessary when
the FIR eservices platform is rolled out to States
No – as may not be relevant in the future
8b. Share the database of companies within each State with the Federal Inland Revenue Service (FIRS). The objective is to improve VAT and PAYE collection.
State/ Federal
The responsibility for these sharing of databases is also with the Federal (FIRS) as well as with the States
No – as not fully within States’ control
9 Introduce a system to allow for the immediate issue of VAT / WHT certificates on payment of invoices.
State/ Federal
The e-Services system developed by FIRS is in the process of being rolled to States as this was made as a condition for disbursement of funds (extension of BSF) to States in August and September 2017
No – as rolled out in most States by end 2017
10 Review all revenue related laws and update of obsolete rates / tariffs.
Local/State/Federal
Reviewing and updating revenue laws without an aim is not going to be impactful. Also updating individual revenue laws won’t address the issue of overlapping taxes.
Yes, modify with DLI #4.1
Objective 3: Rationalization of Public Expenditure11a Set limits on personnel expenditure
as a share of total budgeted State While personnel spending has grown rapidly and requires management,
efficiencies also exist on overhead spending (goods and services). This No
92

expenditure. indicator also does not address the issue of falling capital spending as a share of total spending
11b Biometric capture of all States’ Civil Servants will be carried out to eliminate payroll fraud.
State Many States have done biometric capture but it is not linked to payroll. Those States that have done so have been able to reduce their personnel spending (for example, by removing ghost workers)
In addition to biometric data, Bank Verification Number (BVN) data can be linked to payroll to reduce fraud
DLI #5
12a Establishment of Efficiency Unit. State Many States have set up an Efficiency Unit, but it is not clear what these functions these units perform and what strategies they will use in order improve efficiency/value for money in public spending.
A more specific and more effective action is to encourage implementation of specific public procurement reforms which aims to improve transparency as well as efficiency: e-procurement and open contracting, which are one of the OGP commitments.
No
DLI #6
12b Federal Government online price guide to be made available for use by States.
State/ Federal
This is not a high impact action by itself; requires States to actively use cost benchmarking data
No – as not a State action
13 Introduce a system of Continuous Audit (internal audit).
State/Federal
This would be a more impactful measure if the audit system is risk-based and ex-post.
No
Objective 4: Public Financial Management14 Create a fixed asset and liability
register State/Federal
This is important to support an accrual accounting system but most States are still struggling to implement IFSAS on a cash basis so this is not urgent/priority action
No
15 Consider privatization or concession of suitable State-owned enterprises to improve efficiency and management.
State Privatization or concession of SOEs is not an option for many States and privatization by itself does not improve efficiency, it requires a strong regulatory and performance framework to be in place.
No
16 Establish a Capital Development Fund to ring-fence capital-receipts and adopt accounting policies to ensure that capital receipts are strictly applied to capital projects
State Unclear the magnitude of capital-receipts versus general budget allocation to capital spending.
No
17 Domestication of the Fiscal Responsibility Act (FRA).
State Although adopting the laws are not sufficient to guarantee compliance, it provides an important framework for debt management and fiscal responsibility, strengthening the state debt management departments that have been set up. To be effective, needs to have details on the key provisions that need to be included in the state FRA or state public debt legislation
DLI #7.1
Objective 5: Sustainable Debt Management
93

18 Attainment and maintenance of a credit rating by each State of the Federation
State It will be difficult to motivate States to do this at a time when most States would get a poor credit rating and would find it difficult to issue bonds on the capital markets. This would be only relevant to a small number of States already in a relatively strong fiscal situation.
No
19a Federal Government to encourage States to access funds from the capital markets for bankable projects through issuance of fast track Municipal bond guidelines
State/Federal (SEC/DMO)
Municipal bond guidelines would only be relevant to a very small number of States already in a relatively strong fiscal situation and looking to issue bonds.
No – this is a FGN action
19b Full compliance with the FRA and reporting obligations, including: No commercial bank loans to be undertaken by State [without prior approval from FMoF]; Routine submission of updated debt profile report to the DMO
This is an important measure to sustain. If the expansion of borrowing by States from commercial banks pre-crisis had been more controlled and there was stronger monitoring of the state debt dynamics, the crisis could have been smaller in magnitude and measures taken earlier to prevent it from worsening. But the enforcement can be done through the CBN supervision of Banks, not relying on the States to get approval.
The debt profiling reporting needs timelines and quality element to make it impactful as now all States are submitting reports but late and often incomplete
No
DLI #7.2
20 Publish a benchmark rate for Municipal loans to achieve greater transparency.
CBN Only relevant to a very small number of States already in a relatively strong fiscal situation and looking to issue bonds.
No – this is a CBN action
21 Ensure total liabilities (debt) do not exceed 250 percent of total revenue for the preceding year.
State/Federal
Ongoing compliance with solvency and liquidity thresholds are important for ensuring that state debt does not expand in an unsustainable manner. However, to be effective the following modifications need to be made:
The ratios should become challenging over time as the state’s fiscal situation improves. The ratio of total debt-to-revenue in the FSP was set higher than the ratio of 50 percent in the FRA, to accommodate the increased borrowing by States in 2015-16. But as States fiscal situation improves, for example increase in IGR, the FSP ratio is likely to be too easy so the target ratio should fall over time towards the FRA ratio.
For some States the target is likely to be very easy but for other States already a stretch, so this target should have a basic target and a stretch target
Difficult to target a decline in the deductions from FAAC as States will need to pay debt service from the two financial assistance packages from FGN
DLI #9
Monthly debt service deduction is not to exceed 40 percent of the average FAAC allocation for the preceding 12 months.
94

22 In addition to the sinking fund, States are encouraged to establish a Consolidated Debt Service Account to be funded from the State’s Consolidated Reserve Fund Account to a minimum of 5 percent of IGR
State More important is to prevent ex-ante excessive debt accumulation in the first place, in particular domestic arrears which increased significantly during 2015-2016 and which does not have formal mechanisms to ensure that they are cleared in a timely manner (unlike FGN-backed loans or commercial bank borrowing). Even while total domestic arrears increased in 2016, 40 percent of States managed to stop accumulating arrears showing that it is possible even at present
NoReplace with DLI # 8
95

B2. Technical Soundness of the Program (Nigeria’s OGP NAP)
11. The technical soundness of the OGP NAP has been assessed looking at the level of stakeholder ownership and commitment in the drafting and implementation of the Action Plan, the strengths and weaknesses in the Action Plan design and implementation arrangements, and the extent to which the PforR operation and the TA component can help accelerate progress and address implementation gaps. The assessment focuses on the OGP NAP that has been in implementation since January 2017. The Action Plan is important for creating an environment of openness and for setting priorities that are jointly shared by government and non-state actors. The assessment draws on the self-assessment progress report prepared by the FGN in September 2017, as well as the Bank’s previous and current engagements supporting open government, at global and country levels. International subject matter experts were also consulted on ways to support the implementation of the commitments in the OGP NAP.
12. Action Plan ownership and commitment: Domestic OGP processes require the equal involvement of government and non-government actors in the action planning process for the resulting Plan to be considered a “co-owned” product. In 2016, a National Steering Committee (NSC) was constituted for this express purpose. The Action Plan was developed in a consultative way that was consistent with OGP Guidelines on country consultations59. There is indication of high-level commitment from the government as evidenced by the appointment of the Federal Ministry of Justice as the Coordinating Ministry and co-Chair of the NSC. At the subnational level, Kaduna State has formalized its membership to OGP while other States, including Kano and Anambra States, have started the process to formally join the OGP process and implement its principles within their States. The Action Plan involves MDAs and non-state actors in the implementation and monitoring of the OGP NAP Commitments. OGP in Nigeria, like in many countries, is seen as a strong driver of political agenda on a range of issues; for implementing partners, it will be key to support commitments that are both technically and politically sound. A strong, coordinated voice from the non-government sector will also be important in sustaining government’s focus and commitment to OGP considering the upcoming 2019 elections.
13. The design and implementation of the Action Plan has the following strengths : (i) alignment with FSP and other state-level reforms through its four thematic areas of fiscal transparency, access to information, anti-corruption and asset disclosure, and citizen engagement and empowerment. Seven out of the 14 OGP commitments apply to state-level reforms in Nigeria; (ii) contains appropriate yet achievable actions that draw on international good practices for fiscal transparency; (iii) establishes the importance of a well-implemented FOI Act in support of more specific mechanisms for fiscal transparency; (iv) promotes cooperation between government and citizens as the norm in governance in Nigeria.
14. The following are the key gaps in the design and implementation of the Action Plan : (i) slow or limited60 progress on 10 out of 13 Commitments (no information available on mid-term progress of Commitment #7) including Commitment #2 on open contracting; and (ii) strong reliance on technology solutions to engage citizens, which may be risky or ineffective without a review of access and incentives; (iii) lack of strong incentives for effective implementation at the state-level. 59 https://www.opengovpartnership.org/sites/default/files/attachments/OGP_consultation%20FINAL.pdf60 https://www.opengovpartnership.org/sites/default/files/Nigeria_Mid-Term_Self-Assessment_2016-2018.pdf
96

15. Several factors could accelerate progress on the implementation of the commitments in the Action Plan: (i) focusing on building CSO capacities on the technical areas of the planned reforms and commitments; (ii) providing TA to States to implement commitments; (iii) creating a stronger coordination and buy-in for open government among States; (iv) strengthening the connection between Federal and state level OGP processes.
16. The design of the PforR accounts for the gaps and leverages the key factors to support the implementation of the OGP Action Plan:
Focusing on sub-national engagement in OGP. Fiscal transparency and accountability mechanisms at the subnational level are weak. Seven out of the 14 OGP commitments apply to state level reforms in Nigeria, as concluded at the National OGP retreat in Kaduna in October 2016. Application of key OGP principles at the state level will enhance service delivery efficiency and effectiveness, reduce corruption, and empower citizens. State governments can be part of the OGP in two ways: first, States implement related commitments in the current FGN Action Plan; and second, States can formally sign on to OGP. Currently, Kaduna State has formalized its membership to OGP while Kano and Anambra States have sent in letters of intent to join the OGP process and implement its principles.
Focusing on state-level implementation of OGP Commitments on budget and procurement transparency as the foundations of subnational fiscal transparency. Commitments #1 and #2 (citizen participation in budget and open contracting) are supported by DLIs #2 and #6, respectively. The DLIs provide specificity to the Commitments and are attainable by the States regardless of their baseline capacity.
Increasing coordination across government. Through the TA component, the OGP Secretariat focuses on systematically building capacities for MDAs and subnational governments on OGP. The OGP Secretariat also engages with the NGF to increase uptake of open government principles among States, and to strengthen the coordination between Federal and State governments. The TA component also provides resources to develop a robust monitoring website that tracks state and MDA performance across the different OGP commitments and relevant DLIs.
Participation of actors from non-government sectors. Not all States may have civil society groups that are actively working on fiscal transparency issues. Through the TA component, partnerships between international expert groups and domestic actors is a way to build local CSO capacity. For both budget and procurement transparency, existing international organizations can provide support to local actors, though this support needs to be responsive to the level of engagement and existing capacity in each State.
Supporting a mix of online and offline mechanisms for engagement. The DLIs are calibrated taking into consideration the varying level of baseline capacities among States, by integrating technology and non-technology mechanisms for disclosing information and engaging citizens.
97

C. Program Expenditure Framework
17. The expenditure program boundary for the Program is defined as the total estimated recurrent spending by the States’ key finance entities that will be directly responsible for the Program activities for 2018-2021. The state-level FSP and the fiscal transparency actions in the OGP NAP supported by the SFTAS Program is implemented by the States’ key finance entities: state ministries of finance61, state ministries of budget and planning, state boards of internal revenues (SBIRs), and state office of accountant generals. The key finance entities constitute the state governments’ ‘financial and fiscal affairs’ sub-function under the ‘General Public Services Function’ (Government Finance Statistics based). The state-level FSP and the fiscal transparency actions in the OGP NAP supported by the SFTAS Program covers the full scope of core functions and activities of these institutions.
18. Implementation of the government program supported by the SFTAS Program (i.e. the achievement of the DLIs) primarily requires staff time, consultants, workshops and training, which corresponds to the recurrent spending of these key finance entities. The expenditure program boundary for the Program is, therefore, defined as the total/aggregated estimated recurrent spending by the States’ key finance entities across the 36 state governments (given that we expect all States to participate in the Program) for the Program duration period of 2018-2021 (final disbursements for results achieved at the end of 2021 will be made by end-2022) as per the States’ latest MTEFs 2018 to 2019 and extrapolated for 2020 to 202162. The expenditure program boundary excludes any capital spending as it is not anticipated that States will need to make material capital investments to implement the Program.
19. The overall program expenditure framework for 2018-2021 is estimated at 996 billion naira/US$3.27 billion – the total/aggregated estimated recurrent spending by the States’ key finance entities across the 36 state governments for the Program duration period of 2018-2021 (with last disbursements taking place by end-2022). Table 4.2 highlights that the IDA contribution of US$700 million is 21 percent against an overall expenditure framework boundary of US$3.27 billion over the four years. During the program implementation, the expenditure framework of the participating States will be monitored through the submission of the States’ annual audited financial statements, which contains details of the realized budgeted recurrent spending of the state, broken down by individual ministries, departments and agencies, which will allow the computation of the program expenditure framework.
Table 4.2. Program Expenditure Framework and Financing Sources (in US$ million)
20. Activities excluded from the Program: As defined above, the Program expressly excludes activities that do not meet World Bank policy on eligibility for PforR financing. State
61 Which includes typically state treasury, state debt department, fiscal policy department62 MTEFs for all the States were collected and provided by the Federal Ministry of Budget and National Planning
98

governments through the federal government (the Borrower) shall ensure that the Program does not include any activities which, in the opinion of the World Bank, are likely to have significant adverse impacts that are sensitive, diverse, or unprecedented on the environment and/or have affected people, as defined in the World Bank policy on PforR financing, and/or Works, Goods, and Consultancy contracts above the Operations Procurement Review Committee thresholds. The World Bank will support Program execution to ensure compliance with PforR policy requirements during implementation.
D. Results Framework and M&E
21. One of the major weaknesses of the 22-point FSP is the absence of a results framework, compounding the lack of specificity of the actions descriptions in the plan itself. The absence of a results framework and a results chain/explanation of the plan’s theory of change means that it is not clear how the different actions, which are a mixture of outputs, intermediate outcomes and outcomes, work together to contribute to the achievement of the 5 over-arching objectives of the FSP. Without indicators and baseline and (realistic) end targets in terms of the number of States achieving each of the indicators, it is also not possible to measure the overall impact of the implementation of the FSP across States.
22. The detailed DLI matrix, verification protocols, results chain and results framework that has been defined for the Program will strengthen the monitoring and evaluation of the FSP and OGP fiscal commitments. In addition, HFD/PCU will receive support to strengthen its monitoring and evaluation capacity. The M&E activities will facilitate demand-side engagement, peer learning and healthy peer competition among States. Data on individual States performance against the DLRs verified by the IVA during the APA will be published by HFD/PCU. Putting credible and timely information on the individual States’ performances in the public domain will help engage demand-side actors on the implementation of reforms. It will also facilitate peer learning and healthy peer competition between States that will help drive better results. This is one of the key recommendations from the PEA conducted.
E. Economic Rationale63
23. Rationale for public provision and financing. Fiscal and public debt management is a core function of government at all tiers. State governments account for on average 37 percent of total expenditure across three tiers of government, including the majority of spending in health and education. The Program seeks to improve fiscal management and sustainability at the state-level to establish a foundation for States to eventually spend more and spend better in a transparent, accountable and fiscally sustainable manner to the benefit of its citizens. In addition, improving States’ fiscal performance will reduce one major source of fiscal risks for the Federal Government.
24. Value-added of the Bank’s support: (i) Bank financing will increase the financial incentives and capacity building support to States to undertake FSP and OGP-related fiscal
63 This section discusses the rationale for public financing of the Program, the valued added from the Bank support, and presents the analysis of the Program’s potential fiscal impact. This analysis is consistent with the Bank guidelines. Operational Policy and Bank Procedure, Program for Results.
99

reforms; and (ii) the Bank’s global knowledge and experience with implementation of fiscal reforms will be helpful in incorporating international good practice to the reform process.
25. The fiscal impact analysis shows that the Program could substantially increase the fiscal resources for productive public expenditures at the state-level. The increase in fiscal resources are estimated as the difference between a base case ‘without Program’ fiscal scenario where States’ fiscal performance during 2018-2022 continue on the same trajectory with a fiscal reform ‘with Program’ scenario where States’ fiscal performance during 2018-2022 improves in terms of the Program’s key result areas: collecting more revenues, improved expenditure efficiency and allocation, and strengthened debt sustainability. As a result, more resources are available for productive spending due to increased revenues (expanding the overall resource envelope), improved expenditure efficiency in terms of lower recurrent spending growth, and lower fiscal deficits which reduces borrowing requirements and future interest payments. The key assumptions underlying the fiscal simulations for both scenarios are shown in the below table. They are consistent with the results framework for this Program. The simulation is based on changes in the average performance of the 36 States and FCT in total/aggregated as all States are expected to participate in the Program. Additional fiscal gains are expected from the improvements in fiscal transparency and accountability but these have not been quantified in the simulation. The timeframe used in the simulation is limited to 2018-2022 to illustrate the impact of fiscal reforms during 2018-2021. The changes in States’ fiscal behavior as a result of the Program is expected to continue beyond 2021, so there would be additional impact beyond 2022.
Table 4.3: Key Fiscal Assumptions for Base Case and Fiscal Reform Scenarios
Key Fiscal Drivers for 36 States and FCT
Base Case ‘without Program’ Scenario2018-2022
Fiscal Reform ‘with Program’ Scenario 2018-2022
Impact of Program
Average IGR annual growth (nominal)
15 percent – in line with GDP growth
25 percent Higher IGR growth
Average annual recurrent personnel & overhead growth (nominal)
13.5 percent - in line with CPI
7.5 percent Lower growth due to efficiency gains
Average annual capex growth (nominal)
15 percent – in line with GDP growth
20 percent Higher growth due to increased fiscal space
Average fiscal balance (as a share of national GDP)
-0.9 percent -0.6 percent Lower deficit due to higher IGR & lower total spend
26. The potential increase in the average annual fiscal resources available for productive public expenditures for all States because of the Program is substantial. States increase their annual capital expenditure in the reform scenario compared to the base case by 192 billion naira on average per year. In addition, the average annual fiscal deficit is lower by 710 billion naira in the reform scenario compared to the base case (even with higher capital spending due to increased revenues, lower personnel and overheads expenditure and interest payments).
100

Table 4.4: Fiscal Outcomes for Total 36 States and FCT, 2018-2022
Nominal Naira (Billions) Base Case ‘without Program’ ScenarioAverage 2018-2022
Fiscal Reform ‘with Program’ ScenarioAverage 2018-2022
Impact of Program
Total annual revenue 5,532 5,942 HigherStatutory Transfers 3,921 3,921 Same
IGR collected 1,537 1,947 HigherTotal annual expenditure 7,277 6,977 Lower
Interest 810 712 LowerPersonnel and Overheads 3,387 2,994 Lower
Capital 2,575 2,766 Higher by 192Interest/Revenue ratio 13.6 percent 11.3 percent LowerTotal annual fiscal balance -1,745 -1,035 Lower by 710Fiscal balance/national GDP -0.9 percent -0.6 percent LowerTotal annual gross borrowing 3,713 2,843 LowerTotal State debt at end of 2022 13,768 10,220 LowerTotal State debt to total state revenue at end 2022
189 percent 126 percent Lower
Total State debt to national GDP at end 2022
5.3 percent 4.2 percent Lower
101

Annex 5: Fiduciary Systems AssessmentA. Introduction
1. An IFSA was carried out as part of the Program preparation, consistent with the World Bank Policy for PforR and in accordance with the World Bank Guidance on PforR (formerly OP/BP 9.0). The objective of the assessment was to examine whether Program systems provide reasonable assurance that the financing proceeds will be used for their intended purposes, with due attention to the principles of economy, efficiency, effectiveness, transparency, and accountability. The financial management systems were assessed to gauge the extent to which the planning, budgeting, accounting, controls, funds flow, financial reporting, and auditing systems and practices provide a reasonable assurance on the appropriate use of Program funds and safeguarding of its assets. Equally, the Program procurement systems have also been assessed to establish the extent to which the planning, bidding, evaluation, contract award, and contract administration arrangements and practices provide a reasonable assurance in support of achievement of the Program results. In addition, the assessment considered how Program governance systems manage the risks of fraud and corruption and how such risks will be mitigated. This part of the IFSA is focused on the Program results component, while Annex 10 defines the financial management, disbursement and procurement arrangements for the TA component of the hybrid operation.
2. The IFSA was conducted through a methodical review of systems and practices at the federal and state levels, involving the review of a number of analytical work - Public Expenditure and Financial Accountability (PEFA) Assessment and Public Expenditure Management and Financial Accountability Review (PEMFAR) carried out in 28 out of the 36 States, Fiscal Sustainability of States (2017) and the Programmatic Integrated Fiduciary Assessment of Nigerian States (PIFANS) (2015) carried out in six States. The team also reviewed the lessons learned in implementation of Bank Programs including at the state-level. The Bank has been supporting state governments in strengthening their service delivery, institutional and financial management systems and processes through several operations - SEEFOR, PSRGDP and SLOGOR.
3. The conclusion of the IFSA is that the Program systems meet the requirements of OP/BP 9.00 and are adequate for achievement of the Program objectives. The IFSA has identified certain risks and measures to mitigate such risks. The risks mitigation measures will be managed through methodical implementation of the PAP. The overall program integrated fiduciary risk (financial management, procurement, and governance) is rated ‘Substantial’ as a result of critical weaknesses in financial reporting, auditing, procurement, and governance systems and practices. The key mitigation measures arising from the identified risks, that are largely contained in the DLIs/PAP.
A1. Program Design and Expenditure Framework
4. The overall expenditure program of the government, represented by the MTEF of States, will be leveraged and supported through the truncated boundary under the PforR. The recurrent expenditures for 2018-2021 relating to the key entities constituting the state governments’ ‘financial and fiscal affairs’ sub-function under the ‘General Public Services’ function as well as targeted expenditures from the funds provided by the World Bank for performance-based financing to performing States, constitute the Program expenditure framework. The key entities
102

constituting the State Governments’ ‘financial and fiscal affairs’ sub-function are: i) state ministry of finance, (ii) state ministry of budget and planning, (iii) state bureau of internal revenues services; and (iv) state office of the accountant general.
5. The recurrent expenditures under the ‘financial and fiscal affairs’ sub-function will be the basis of analysis for ensuring that the overall program expenditures (actual) at program closure are more than or equal to the Program withdrawals from IDA. The strengthening of expenditure management and accounting, through implementation of the FSP, will enhance the availability of financial information to monitor the Program expenditure framework. During the program implementation, States will submit their annual audited financial statements, which contains details of the realized recurrent spending of the state, broken down by individual ministries, departments and agencies, allowing for identification of the recurrent spending by the State Ministry of Finance, the Office of the Accountant General (if separate), State Ministry of Budget and Planning; and State Bureau of Internal Revenue Services, and the computation of the program expenditure framework.
Table 5.1: Summary of the Program Expenditure Framework
B. Program Financial Management Systems
6. The financial management arrangements under the Program will be carried out using the States governments’ budget management systems which are, generally in reasonably good operating order. The existing systems of budgetary planning, budget preparation, budget execution, accounting, internal controls, funds flow, financial reporting, external audit, and legislative oversight will continue to be adopted for Program implementation.
7. Program Procurement Systems: The Program expenditures are essentially recurrent in nature and will not involve procurable items.
B1. Institutional and Legal Framework - Financial Management Arrangements
8. The key institution for PFM in the States is the States’ ministries of finance and their respective agencies. Other players include the State Ministry of Budget and Planning, the State National Assembly and the Office of the Auditor General.
9. In Nigeria, broadly, the enabling institutional and legal framework for financial management is contained in (a) the Constitution (Sections 80-89) – accounts, audit, and investigations; (b) the Finance (Control & Management) Act 1958 – the organic public finance management law; (c) the FRA 2007, aiming to instil discipline into fiscal planning and management; (d) the federal Public Procurement Act 2007, and Public Procurement Acts at the state-level that mirror the federal Public Procurement Act - regulating public procurement for Federal and States’ governments; (e) Audit Act 1957; and (f) Freedom of Information (FoI) Act
103
2011 - aiming to improve transparency and public accountability by providing for public access to non-sensitive official data. Along with the subsidiary legislations, regulations, and operational and financial directives which dictate the day-to-day basis for the management and oversight of public finances (notwithstanding the long overdue organic public finance legislation and the audit law), it is concluded that the legal framework is in place and acceptable to the World Bank.
10. In general, the States’ accountant-generals as well as the budget directorates play a significant part in the overall management and control of public finances – releasing the budget and accounting for and reporting on the use of budgetary resources.
B1.1 Institutional and Legal Framework - Procurement Arrangements
11. Nigeria’s procurement environment is largely premised on the progress achieved in implementing a procurement reform program based on the recommendations of the 2000 Country Procurement Assessment Review (CPAR). With the enactment of a Public Procurement Act in June 2007, the enabling legal framework aimed at establishing transparent, fair, and cost-effective use of public funds has been in place. The provisions in the Act are consistent with the principles of the UNCITRAL model law, and are applicable to all procurement categories (suppliers, contractors, consultants).
12. Following the enactment of the procurement act, a regulatory agency - the Bureau of Public Procurement (BPP) - was established. The Government has also prepared relevant implementation tools, including Regulations, Standard Bidding Documents (SBD) and Manuals. In addition, a procurement professional cadre has been created at the federal level and in some States. A complaints and appeals mechanism has been established in accordance with the provisions of the Act to enhance transparency and accountability. The gains of the procurement reform at the federal level have extended to the 36 States of the Federation of Nigeria. Presently, 24 States have passed their respective procurement laws while other States have draft procurement bills under consideration.
13. Notwithstanding the above successes, there are still inherent weaknesses in the public procurement system in Nigeria. In 2012/2013, the Bank conducted a Procurement Value Chain Analysis (VCA) which identified the following weaknesses at the federal level: delay in budget approval; late release of budgeted funds; lack of budget-linked procurement planning; failure of full compliance with the use of standard bidding documents; poor bid evaluation reports; delays in contract award approvals; weak procurement and performance monitoring; poor record keeping, fraud and corruption and lack of effective enforcement of sanctions as provided for the law.
14. At the state-level, procurement law has been enacted in 24 States while the remaining States have draft bills at various stages of consideration; procurement regulatory agencies have been established in 18 States. The Programmatic Integrated Fiduciary Assessments of Nigerian States (PIFANS) for Lagos, Ondo, Edo, Delta, Rivers and Bayelsa also identified the procurement weaknesses in the States. In addition, PIFANS highlighted the: (a) need for the States to develop and deploy necessary tools, including regulations, manuals and standard bidding documents; (b) the need to professionalize the procurement function; (c) need for publication of contract award to enhance transparency and demand for accountability; and (d) need for the establishment of complaints and appeals mechanism.
104

B2. Planning and Budgeting
15. In compliance with the directive of FAAC to harmonize classification methodologies across the federation, 14 States have fully transitioned to a new budget and account classification system that is Government Finance Statistics 2001 compliant. Ten other States are currently gearing themselves to also migrate from their legacy system of classification to the new standard, and these are being supported under the World Bank as well as European Union (EU) trust-funded operations. Improvements in the linkage of budgets to sector strategies are being recorded across a few States – essentially 6 out of the 21 States being supported by Bank and EU trust-funded operations out of the 36 States – although there remains the reliability of these linkages in the absence of realistic costing of the strategies that feed into the budget.
16. Existing budgetary planning and budget preparation system entails the determination of the budget years’ service delivery framework through sector plans and preparation of financial estimates, based on the budget ceilings provided by the federal ministries of budget and planning. In general, the States’ annual budgets are passed by the States’ houses of assembly before the commencement of the fiscal year. However, the budgetary system at state level is broadly characterized by deteriorating budget credibility because of expenditure budget ‘padding’ in the absence of realistic estimation of revenues. The exercise of discretions by state governors on fiscal matters in the absence of well-functioning fiscal policy management strategies has limited the usefulness of budgets as instruments of policy intent. Budget deviation is high, in the range of 30 – 50%. Improved budget reliability through reducing expenditure outturn deviation from the approved state budget is supported under the Program Result Area 1: Increasing Fiscal Transparency and Accountability – Improved financial reporting and budget reliability, DLI 1.
17. International best practice encourages openness and transparency in budget processes. For compliance States are expected to publish their budgets and budget implementation outturns on accessible platforms such as their websites to facilitate public access. Currently, only 15 States publish their annual budget online through their State official websites whilst 3 States publish their budget implementation performance reports – in year and year end, online.
18. Across the States, personnel cost constitutes a significant percentage of aggregate expenditures. However, the accounting systems and controls for personnel management are inadequate. The inadequacy of the systems, have allowed for the incidence of ghost workers with resultant inflated wage bills. To mitigate the incidence of ghost workers, some States have commenced the biometric capture of their civil servants. Progress of the exercise amongst the States has been uneven and evidence of the outcome of the exercise is lacking. The biometric capture is being employed to support the enrolment of staff under the Integrated Payroll and Personnel Information System (IPPIS). Biometric capture and staff enrollment under IPPIS are supported under the Program Result Area 3 – Strengthening Efficiency in Public Expenditure Management, DLI 5.
B3. Payments and Flow of Funds
19. The federal government transacts its budgetary spending through a system of a TSA held with the CBN. At present, all budgetary resources are processed through the government integrated financial management information system (IFMIS). This is a significant improvement
105

from the erstwhile status quo when cash was being indiscriminately moved from the CRF held with the CBN to nominated commercial bank accounts of agencies, thus undermining the good principles of an effective and efficient cash management system. Payments are made from individual MDAs’ TSA with the CBN through a uniform electronic payment platform (REMITA) to finance budgetary expenditures.
20. At the level of the States, the control in funds flow is exercised through the ministry of finance and, by extension, the offices of the States’ accountants-generals, after the budget release to MDAs is made through the budget office. Generally, most States do not maintain a TSA system. However, they do maintain a cash management system based on a strictly cash budgeting arrangement. Their CRFs are held across several selected commercial banks within their respective States and the daily status of cash balances in individual accounts is monitored. Expenditures undergo a process of validation at the MDA level as well as at the accountant-generals’ offices, and pre-payment audits are undertaken on every expenditure transaction before payment is authorized. Apart from a few States that operate a mixture of electronic cash transfers and check system (under a cashless economy policy), most of the States execute their payments by check or even cash. The latter constitutes areas of risk of fraud and corruption.
21. All the 36 state governments have subscribed to the 22 Point Fiscal Sustainability Strategy and Plan that seeks to support States in reversing their current fiscal management weaknesses, including transitioning to TSA arrangements.
22. To mitigate the risk of delay in the transfer of Program funds from IDA to the States, it is envisioned that service standards will be established (to be included in the OIM) to ensure, among other things, that funds are transferred to the eligible States’ accounts within 14 days of receipt of withdrawn Program results component funds into the Special Fund Account held with the CBN. The OIM will also include elaboration on the acceptable processes to be observed by the PCU in effecting the transfers.
B4. Accounting, Recording and Financial Reporting
23. The federation has adopted the International Public-Sector Accounting Standards (IPSAS) cash basis of accounting and financial reporting as of fiscal year 2014. All States have adopted the IPSAS basis of accounting but its implementation is uneven across the States. In addition, the federation has adopted the new chart of accounts and budget classification system that is GFS 2001 - compliant (although implementation remains uneven across States, with the federal government and only 14 other States having commenced implementation). In effect, Nigeria is moving progressively towards complying with international standards on accounting and financial reporting as well as on use of a classification methodology (for budgeting, budget execution, accounting, and reporting) that conforms to international best practice.
24. In the majority of States, accounting for and reporting on financial transactions is done using ICT based systems. The system of accounting and financial reporting is generally performed at acceptable levels. The States’ treasury offices are endowed with adequately qualified and experienced staff in financial management.
25. The Program financial statements shall be in two parts: (i) for the Performance Based Financing, the States audited financial statements shall constitute the Program financial statements. The availability of States audited financial statements is enhanced, as States audited financial statements are part of the eligibility criteria for the Program, and so, States will have to
106

produce them to access the Performance Based Financing, and (ii) for the TA, IPF component, the audited financial statements of the implementing agencies shall be the other part of the Program financial statements.
26. The financial statements prepared by the State Accountant Generals include reporting on the recurrent expenditure budget lines in the Program Expenditure Framework. As part of the Program Implementation arrangement, the State audited financial statements will be submitted by the States to the HFD/PCU within twelve months of the end of the government fiscal year. From the audited financial statements submitted by the States, the Financial Management Specialist at the HFD/PCU will undertake a compilation of the data on recurrent expenditures included in the Program Expenditure Framework for: i) state ministry of finance (including the Office of the Accountant General, State Debt Department), (ii) ministry of budget and planning, (iii) state bureau of internal revenues services. The AuGF at the time of the annual audit of HFD/PCU, will certify the compiled information. These aspects will be detailed in the Program Operations Manual currently under preparation.
B4.1 Procurement Procedures and Processes
27. Institutional Arrangements. FMoF has a Procurement Unit that is headed by a Director who reports directly to the Permanent Secretary of ministry. The Unit carries out mainly two types of procurements: (a) consultancy; and (b) procurement of office equipment and furniture.
28. Staffing. The procurement staffing capacity is inadequate to undertake all the required procurement work, and the procurement unit suffers from regular depletion of its experienced staff arising from staff rotation amongst MDAs in the Public Service. For the current staff to perform optimally, more training, will be required and provided through the TA component of the Program.
29. Record Keeping. For each contract, there is a specific file for procurement and contract management that ensures an audit trail and lends to easy auditing. Each file individually describes the entire history of the procurement process - from invitation for bids up to contract award. The Procurement Unit implements a manual filing system and all procurement files are kept in metallic locked cabinets in the offices of the procurement staff. The procurement information can be located and this is protected from unauthorized access. More sensitive documents such as the financial proposals and original bids that are being evaluated, etc. are kept in a secured safe, accessible only to the procurement staff. This practice fulfills the legal requirements of the Public Procurement Act.
B5. Internal Controls and Internal Audit
30. The internal controls over public expenditures is a key area of risk. Weak internal control measures over public expenditure have tended to undermine expenditure management and control.
31. The internal audit process is largely focused on pre-payment audits, while lacking in oversight as a support function to internal management. Leakages remain in the expenditure management system due to dearth of risk-based internal audit and control processes, and lack of focus on systemic issues. A key challenge will be how to divorce the internal audit function from involvement in the expenditure processing cycle and accord independence to the role the internal auditors play. This is an institutional issue cutting across the Federation. There are on-
107

going Bank interventions at the modernization of the internal audit function, these include the Nigeria Public Sector Governance Reform and Development Project (P097026) (closed 2017), State and Local Governance Reform Project (P133045) and through country wide PforR operations in the Health and Education sectors. The Program will under the TA component seek to address the shortcoming by supporting the introduction of risk-based internal audit function outside the expenditure processing cycle but focusing on systemic fiduciary issues and risk-prone areas.
B5.1 Anti-Corruption and Governance (ACG)
32. The program appears exposed to three main risks of fraud and corruption: a) fraudulent or corrupt procurement transactions; (b) diversion of funds; and (c) potential administrative and bureaucratic delays in transferring funds to the States. These risks are directly related to the PDO: ‘to strengthen fiscal transparency, accountability and sustainability in the participating states’. The program which targets reforms in the fiscal realm, will serve as a platform to ease the fiscal crunch arising from the impact of low oil revenues. Hence, more stringent measures would be needed to ensure that transparent procurement processes are undertaken, money is used for the intended purposes and program implementation is not curtailed by administrative and bureaucratic delays.
33. Existing anti-fraud and corruption measures in Nigeria rest largely on the criminal justice system, more specifically the Corrupt Practices and other related offenses Act, 2000; the Economic and Financial Crimes Commission (Establishment) Act, 2004, as well as on the UNCAC, ratified in 2004. Additional pieces of legislation address conflict of interest, promote transparency (asset disclosure and freedom of information), and strengthen the governance of extractive industries (Nigeria Extractive Industries Transparency Initiative Act). To institutionalize the fight against corruption in the country, the Government adopted a National Anti-Corruption Strategy (NACS) for the next five years64, in July 2017. The NACS focuses on prevention of corruption, public engagement, campaign for ethical reorientation, enforcement and sanctions and recovery of proceeds of corruption. Asset disclosure requirements apply to all public officers, including at State and LG levels. Additional reforms introduced included the prosecution of financial crimes, the management of recovered stolen assets and government overall transparency (under the Open Government Initiative). The OGP NAP prioritizes fiscal transparency; anti-corruption; access to information and citizen engagement among others. The Nigerian anticorruption institutional framework comprises multiple agencies at the Federal level, loosely coordinated by the President’s Office (within the inter-agency task team on anticorruption)65. The jurisdiction of these various anti-corruption agencies extends to the State level. The weakest level in the anti-corruption architecture is at the departmental level, with the line ministries’ Anti-corruption and Transparency Units (ACTUs). Although, the existing legal and institutional frameworks are robust enough to build on, to effectively mitigate against fraud
64 National Anti-Corruption Strategy65 The Inter-Agency Task Team of Anti-Corruption Agencies (IATT) comprises representatives of the Office of the Attorney General of the Federation and Ministry of Justice, the Ministry of Foreign Affairs, the FMoF, the EFCC, the Nigerian Financial Intelligence Unit, the ICPC, the Code of Conduct Bureau, the Public Complaints Commission, the Nigerian Extractive Industry Transparency Initiative, the TUGAR, the Nigerian Police Force, the Federal Inland Revenue Service, the Office of the Auditor General, the Corporate Affairs Commission,the CBN, the National Drug Law Enforcement Agency, the Bureau of Public Service Reforms, and the Budget Office of the Federation.
108

and corruption, there is little evidence that investigations into fraud and corruption are systematically carried out by the law enforcement agencies.
34. Given this background, the PforR program will address weaknesses and potential risks to the program through several mitigation measures, including the fiduciary measure of implementing an enhanced accountability framework over soft expenditures and other measures embedded in the DLIs as well as in the PAP. Through the DLIs and planned inputs, the program focuses on strengthening several mechanisms that will contribute to the reduction of some of the cited fiduciary risks, and consequently the fraud and corruption risks. The program will specifically address some of these risks through DLI (2) on increased openness and citizen engagement in the budgeting process; DLI 3 on improved cash management and reduced revenue leakages and DLI 6 on improved procurement practices for increased transparency and value for money. The use of the third-party audit firm in the program verification as well as the fraud and corruption/complaints redress mechanism further help in mitigating risks.
35. The Program shall also coordinate with existing national mechanisms for launching corruption related complaints, such as the one under Independent Corrupt Practices Commission (ICPC)66. Here, complaints are sent by email/ phone or conveyed indirectly through websites, such as BribeNigeria or Egunje to ICPC. These websites publish statistics on the geographical and sectoral distribution of gathered corruption allegations (run by NGOs). This will help in providing useful information for fast-tracking measures in cases that arise.
36. Additional measures to further mitigate the risk of fraud and corruption under the program will include:(a) Grievance redress mechanisms will be implemented across key agencies involved in program implementation at both the federal and States level. In addition, the PAP includes the appointment of anticorruption desk officers in the Program lead agencies. Formal policy and procedural guidance note will be prepared and approved on Fraud and Corruption/complaints redress mechanism under the program.(b) To raise public awareness about existing mechanisms to handle allegations of fraud and corruption, the state government will agree with the ICPC on adequate measures to be introduced by the States government, including the insertion of a link with ICPC portal on the state government’s websites.(c) The World Bank Anti-Corruption Guidelines67 will apply to the Program-for- Results.(d) Digital platform for citizens’ engagement will be established and maintained.
B6. Oversight – Program Audit
66 The Commission which has both a repressive and preventive role, was established in 2000 by the Corrupt Practices Act67 “Guidelines on Preventing and Combating Fraud and Corruption in Program for Results Financing”, July 2015,World Bank.
109
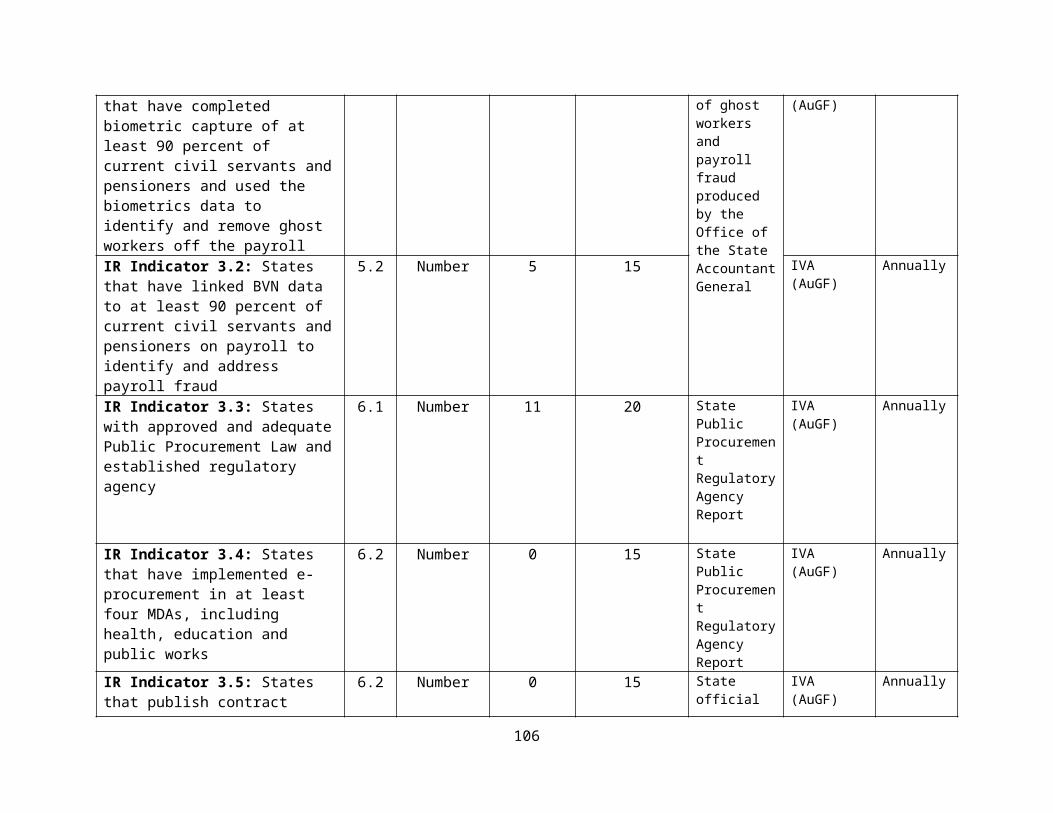
37. In general, the AuGF as well as the States’ auditor-generals conduct the independent audits of public finances in their respective jurisdictions.
38. With respect to the federal government, external audit (according to PEFA 2013) covers at least 50 per cent of total expenditures of the federal government. The submission of the audit report (as well as the financial statements upon receipt of the draft accounts from the Accountant General of the Federation) to the legislature has been achieved within four months of the end of the period covered. The audit reports for 2016 are yet to be submitted to the legislature, due to delay in the Accountant General of the Federation’s closing the books on time, there are clear prospects that the audit report submission to the legislature will resume timeliness. The quality of audit has begun to be improved, especially with the implementation of key reforms supported under the World Bank-financed ERGP, and there is a progressive transition to International Organization of Supreme Audit Institutions standards of auditing. Notwithstanding, audit follow-up at the level of the legislature has continued to remain weak.
39. Noting the Program boundary of the operation, the annual audited financial statements of the participating States, and the annual audited financial statements of transactions in the Special Fund Account (Program results component) and the TA component account of the implementing entities will be considered as constituting the basis for the annual financial assurance required by the World Bank. Annually, two audit reports will be submitted by the HFD/PCU to the Bank: i) the compiled data on recurrent expenditure for the 36 States and FCT, certified by the AuGF and express opinion thereon, and ii) consolidated audit report for OGP, PSIN, DMO and HFD, prepared by the AuGF.
40. The States auditor-generals conduct the audits of the financial statements of their respective States and render them to the States’ assemblies. PEFA reports of States indicate that, in general, the audited financial statements and their related reports are submitted to the legislature within 12 and 15 months of end of each fiscal year. In the 2017, research into the fiscal environment of States within the context of the Fiscal Sustainability Plan, 18 States self-reported that they publish their audited financial statements within 6 months of the fiscal year end. The quality of these audits remained, though, uneven across States, and some may not be IPSAS compliant. The Program will support the strengthening of the capacity of state’s auditor generals under the TA component to improve upon the quality of audited financial statements. This shall entail the hiring of an external audit firm at the Federal level that will apply a risk based approach in the selection of state auditor generals for capacity building over the period of program implementation. The annual States audited financial statements shall be submitted to HFD/PCU within twelve months of the end of the government fiscal year.
B7. Disbursements from the World Bank
41. The IDA credit proceeds of the Program results component, in the equivalent sum of US$700 million, will be disbursed to the Federal Government’s Special Fund Account, which serves as a sub-account of the TSA held with the CBN - triggered by the achievement of the DLRs for the Program. The Program verification process and information flows is provided in schematic form in Figure 5.1. Upon receiving the decision to disburse from the World Bank, a WA will be submitted to the World Bank, using the World Bank’s standard disbursement forms through the e-disbursement functionality in the World Bank’s Client Connection system. Disbursements of Performance-based Financing to performing States will be made directly from
110

the Special Fund Account, to the Consolidated Revenue Fund Accounts of the respective States. To mitigate the risk of delay in the transfer of funds from the FMoF to the States, it is envisioned that service-standards will be established to ensure that States’ share of funds received in the TSA at the federal level (by virtue of their meeting the DLIs) are transferred to the States’ accounts in a timely fashion. The funds flow for the Program results component is provided in schematic form in Figure 5.2.
42. As the Program results component, will not allow for advances for potential meeting of DLRs, the underlying principle for disbursements will be based on States achieving the DLRs for each referenced year as affirmed by the IVA.
Figure 5.1: PforR Verification Process/APA and Information Flow Arrangements
Figure 5.2: PforR Disbursements/Funds Flow Arrangements
111

B8. Program Financial Management Risk
43. Despite the improvements that have been realized in the PFM arena across the States, challenges remain in the internal controls over public expenditure. This remains a cardinal risk to the Program.
44. Given the weak internal controls as highlighted above, the reinforcement of internal controls through the introduction of a methodical internal audit function within the MDAs shall be implemented. Currently, the role of internal audits at both the federal and States levels is limited to conducting ‘pre-payment audits’. This functioning mandate comes from the local laws and does imply that internal auditors who should be independent, consistent with the International Institute of Internal Auditors’ standards, are directly involved in the expenditure processing cycle – a factor that undermines the independence and integrity of internal auditors.
45. In addition to meeting the DLIs, one of the criteria to be established is for ensuring that the overall program expenditures (actual) at program closure is more than or equal to the Program withdrawals (disbursements) from IDA. Any over-withdrawals will need to be recovered from/refunded by the Federal Government. This will ensure that the results achieved have a relationship with financial resources deployed.
46. Finally, the external audit of the Program expenditures will be critical to providing the requisite assurance that the Program resources were appropriately used with the requisite economy, efficiency and effectiveness towards achieving the Program goals. To this end, and with a view to managing the risks to program outcomes on time, the audit report of the state’s auditors general, will be submitted to the PCU\HFD within twelve months of the end of each fiscal year.
47. Overall, notwithstanding the established deficiencies in financial management in the States, there is reasonable assurance that the established systems will be adequate, especially when the mitigating factors as highlighted in the DLIs/PAP are adopted and implemented.
112

B8.1 Program Fraud and Corruption Risk
48. Although, the existing legal and institutional frameworks are robust enough to build on, to effectively mitigate against fraud and corruption, there is little evidence that investigations into fraud and corruption are systematically carried out by the law enforcement agencies.
49. Additional provisions are called for to mitigate further the risk of fraud and corruption under the program, based on this assessment:(a) GRM will be implemented across key agencies involved in program implementation at both the federal and States level. In addition, the PAP includes the appointment of anticorruption desk officers in the Program lead agencies. Formal policy and procedural guidance note will be prepared and approved on Fraud and Corruption/complaints redress mechanism under the program.(b) To raise public awareness about existing mechanisms to handle allegations of fraud and corruption, the state government will agree with the ICPC on adequate measures to be introduced by the States government, including the insertion of a link with ICPC portal on the state government’s websites.(c) The World Bank Anti-Corruption Guidelines68 will apply to the Program-for- Results.(d) Digital platform for citizens’ engagement will be established and maintained.
E. Program Integrated Fiduciary Risk Assessment
50. The integrated assessment concludes that the SFTAS Program Integrated Fiduciary Systems have the capabilities to provide reasonable assurance that the financing proceeds under the Program will be used, generally, for intended purposes. The assessment noted the existence of significant gaps and weaknesses in these systems which will need to be addressed in the PAP as part of Program implementation. There are opportunities to be harnessed, based on prevailing legal framework on anticorruption that the Program can take advantage of. With the existing gaps, the overall risks of the Program for an integrated fiduciary perspective is ‘Substantial’, thus affecting the expected results against the program objectives. However, based on the findings of the assessment, a PAP has been developed, and whose implementation will support the mitigation of the identified risks during the life of the Program. Monitoring the implementation of the PAP and refining the operational modalities as and when required will be critical to managing the risks during program life.
F. Program Action Plan
51. The PAP (see Annex 8) covers the entire spectrum of the integrated fiduciary areas requiring management, monitoring, and control under the Program. At quarterly intervals, a monitoring report on the status of implementation of the actions will need to be provided by the HFD for discussion, and strategic and technical directions and guidance provided.
68 “Guidelines on Preventing and Combating Fraud and Corruption in Program for Results Financing”, July 2015,World Bank.
113

G. Implementation Support
60. The Nigeria country office has a team of integrated fiduciary staff—Procurement, Financial Management, and Governance—that will, as part of the program task team, monitor the implementation of the Program’s integrated fiduciary aspects, and the status of implementation of the ‘action plan’. This will be carried out not only half-yearly during implementation support missions, but also between missions, at least for the first year of Program implementation. The team will provide hands-on support to the HFD teams dealing with procurement, financial management, and to the ACTU as well as to other organs (like Servicom) supporting the mitigation of fraud and corruption. In carrying out its implementation support, the World Bank team will also review the Program’s financial reports and their conformance with applicable standards.
114

Annex 6: Summary Environmental and Social Systems AssessmentA. Introduction
1. The SFTAS PforR and the delineated Program boundary are not envisaged to lend themselves to significantly adverse environmental and social risks and impacts, as defined under OP/BP 9.0 and related guidance notes. Thus, the overall environmental and social impacts and risks of this program are assessed as low.
2. The assessment exercise mapped Program components in accordance with the Interim Guidance Note on ESSA and selected two principles for further assessment of social risk. These included core principles related to (a) equitable access to program benefits giving special attention to rights and interests of IPs and to the needs or concerns of vulnerable groups and (b) avoiding the exacerbation of social conflict, especially in fragile States, post-conflict areas, or areas subject to territorial disputes. A social risk mapping was undertaken to assess the applicability of these principles.
3. The overall environmental impacts of the SFTAS PforR are likely positive as the program could free-up money that could be used for better environmental monitoring and enforcement of extant laws. The Program is not expected to finance any civil works and, thus, may not cause any significant adverse impacts that are sensitive, diverse or unprecedented on the environment and/or affected people. The principle will allow the Program to operate within an adequate legal and regulatory framework. Overall, the environmental and social systems for handling such impacts and risks are relatively strong and the federal and the States have good track record for complying with Nigeria’s Environmental Impact Assessment (EIA) laws and World Bank safeguards policies in development operations. Potential adverse environmental impacts and risks associated with the program could emanate from the required strengthening of ICT system and rehabilitation of existing offices might result in debris generation and e-wastes from old/obsolete IT equipment. These impacts are site specific and manageable if adequate measures are taken during the design, implementation, and operation phases. Implementation will be closely monitored through routine program reporting and occasional verification mission by the World Bank. The ESSA provides additional clarity on the impacts and mitigation measures required.
4. The assessment was prepared through a combination of relevant literature review, interviews with the government staff, and consultations with beneficiaries of SFTAS program. The ESSA undertook qualitative assessment of inclusion of marginalized groups through purposive selection of sites in each state based on the presence of mobilized groups, marginalized groups. Issues related to latent tension and friction were also assessed.
5. The ESSA for this Program was prepared through a review of the available data, extensive consultations with stakeholders, and detailed analysis of the environmental and social effects of the Program and the institutional context. Primary areas for action have been identified to ensure that the Program interventions are aligned with the core principles of the World Bank Policy for Program for Results Financing. The consultations with different stakeholders were undertaken for the preparation of the ESSA included federal and state, and civil society organizations (CSOs). A stakeholders’ engagement was held on 25 th January 2018 where the draft ESSA was presented. Stakeholders present offered inputs on the findings and recommended actions in an interactive format. Some of the issues raised during the consultation
115
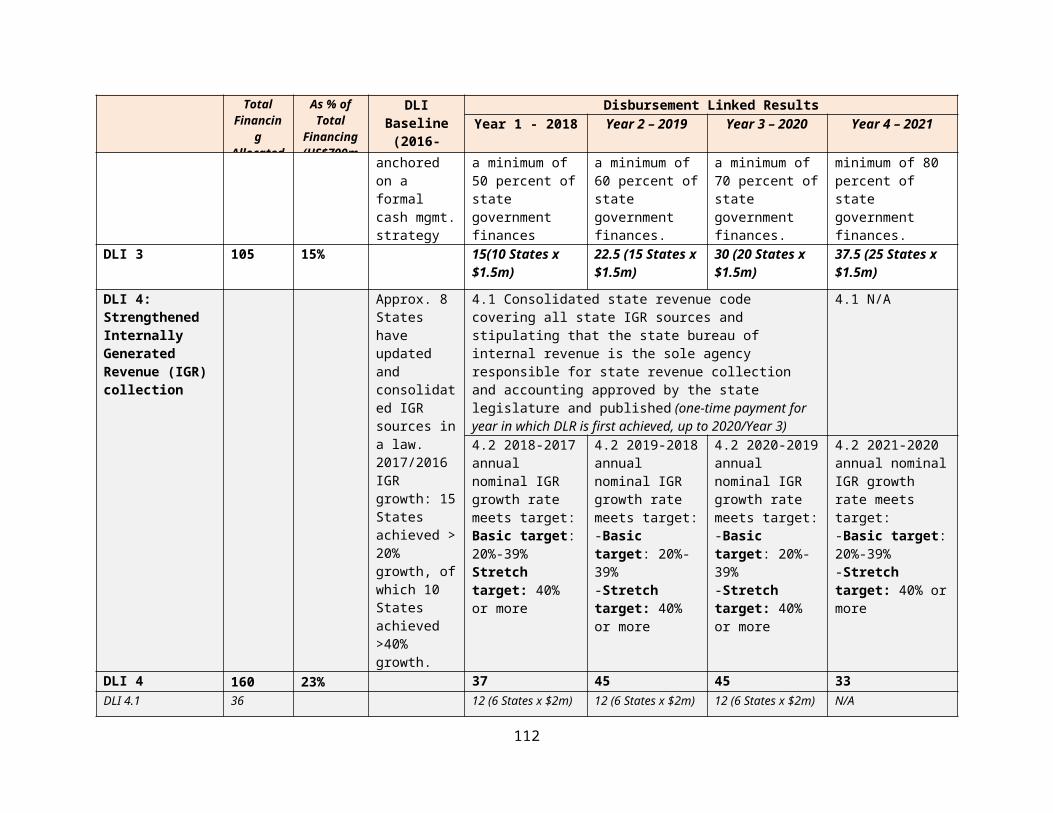
was why the role of the ministry of environment was not indicated in a project of this magnitude given the concern for environmental compliance such as greenhouse emission and its related impacts, noting that the ministry of have a huge role to play on the project. The response was that the project would not be financing infrastructural activities as such and that disbursement which is directly to the budget of each participating state is result based, linked to the achievement of agreed indicators. The task team also undertook some field visits, including to States. Additional consultations were undertaken during appraisal and will subsequently be carried out during Program implementation, with a large group of stakeholders, covering both federal and States. The final ESSA has been shared with the FMoF and will be published on their website and publicly disclosed on the World Bank’s external website before Board approval, and at the same time shared with other stakeholders involved with environmental and social management issues in Nigeria.
6. The Program is expected to have major positive impacts: 1) Its objectives concerning fiscal transparency, accountability, and sustainability are in sync with the twin goals of the World Bank Group in Nigeria; and 2) Supporting the overall objective of promoting national prosperity and an efficient, dynamic and self-reliant economy.
B. Key Risks
7. SFTAS is expected to emphasize citizen engagement as an overarching strategy for its core and complementary programs. Openness of budget process entails citizens’ inputs from public consultations are reflected in the pre-budget statements. Citizen engagement increases local ownership, enables greater information sharing and transparency, and should be the basis of beneficiary engagement and trust building. However, citizen engagement needs to be supported by institutional capacity and a vision.
8. The PforR will support the development and implementation of Grievance Redressal Mechanisms for the main activities supported by the Program . Thus, under the PAP, tailored GRM will be implemented to ensure that stakeholders concerns are documented and resolved in a timely manner.
9. Grievance Redress. Communities and individuals who believe that they are adversely affected because of a Bank supported PforR operation, as defined by the applicable policy and procedures, may submit complaints to the existing program grievance redress mechanism or the World Bank’s Grievance Redress Service (GRS). The GRS ensures that complaints received are promptly reviewed in order to address pertinent concerns. Affected communities and individuals may submit their complaint to the WB’s independent Inspection Panel which determines whether harm occurred, or could occur, as a result of WB non-compliance with its policies and procedures. Complaints may be submitted at any time after concerns have been brought directly to the World Bank's attention, and Bank Management has been given an opportunity to respond. For information on how to submit complaints to the World Bank’s corporate Grievance Redress Service (GRS), please visit http://www.worldbank.org/GRS. For information on how to submit complaints to the World Bank Inspection Panel, please visit www.inspectionpanel.org.
C. Assessment of Borrower Systems
Strengths
10. There exist well-defined legal/regulatory systems for safeguarding the environment and for avoiding or mitigating activities that are likely to have significant adverse impacts
116

on the environment. The national EIA system (EIA Act No. 86 of 1992) provides a comprehensive legal and regulatory framework for environmental and social impact assessment that are broadly consistent with the Core Principle 1 of the Bank Policy and Directive. FMEnv and FMOE are aware of ensuring compliance with EIA procedures. The legal/regulatory system of the country includes provisions for protecting people and environment that is applicable to regulating hazardous wastes and materials, there are also national policies and guidelines addressing public and worker safety and health, including for office infrastructure.
11. FEPA Sectoral guideline: FEPA’s Guideline covering infrastructure projects deals with both the procedural and technical aspects of EIA for construction projects. The guideline stresses the need to carry out an EIA at the earliest stage possible. Draft building code (2006) exists to provide comprehensive standards and guidelines for construction/rehabilitation management.
12. The States and FMOE have experience of integrating rules and procedures for environmental and social management in individual projects, generally. EIA capacity training for FMOE has been conducted under Bank and other donor’s existing programs.
13. Weaknesses: While there seem to be adequate legal and institutional frameworks for managing
environmental issues, the ability of the relevant institutions to enforce the extant laws is rather weak and would require further strengthening.
The implementation of the existing legal/regulatory provisions faces challenges, such as multiple regulations; overstretched regulatory authorities, weak monitoring; inadequate and mismanaged funding; and a low degree of public awareness of environmental issues.
Poor compliance with local environmental regulations on waste management. The national EIA system does not cover all aspects of public and worker safety, there is
general lack of awareness, including among relevant authorities’ staff, on occupational health and safety issues, particularly in relation to exposure to hazardous materials and workplace safety.
14. EIA Act No 86 of 1992: Under the Act, the public and interested third party stakeholders make an input in the assessment process only during public review, which takes place after preparation of the draft report (which is often not well publicized). Early public participation during scoping and preparation of the Terms of Reference (TOR) will contribute greatly to the success of the project. Also, infrastructure project EIAs have been conducted rather loosely, and are often taken as a supplementary requirement to overall economic and engineering issues. There is need for mainstreaming the approach to sustainability planning, with community involvement throughout the program life cycle.
15. Actions and Opportunities: Key state and local government institutions shall maintain strong monitoring of environmental and social safeguard issues to support the implementation of the program: Use of the Ombudsman to redress violation of citizens human rights should be promoted; Individuals who believe that they are adversely affected because of the operation, may submit complaints to the State Public Complaints bureau/Citizen Mediation Centres as available in their locality or the WB’s Grievance Redress Service (GRS). The GRS ensures that complaints received are promptly reviewed to address pertinent concerns.
16. Risks: Poor implementation of the environmental and social management rules and procedures is a possible risk. Inability to enforce the current environmental regulations in a
117

timely fashion is another risk that could lead to localized environmental issues affecting local population and surrounding environment. These risks should be mitigated through a protocol aimed at routinely screening the activities of the Program and monitoring the implementation of actions included in the PAP.
118

Annex 7: Systematic Operations Risk Rating (SORT)
Systematic Operations Risk-Rating Tool (SORT)
Risk Category Rating
1. Political and Governance Substantial
2. Macroeconomic High
3. Sector Strategies and Policies Moderate
4. Technical Design of Project or Program Substantial
5. Institutional Capacity for Implementation and Sustainability Substantial
6. Fiduciary Substantial
7. Environment and Social Low
8. Stakeholders Substantial
OVERALL Substantial
119

Annex 8: Program Action Plan Action Description Due Date Responsible
PartyCompletion Measurement**
Technical Aspects – related to the DLIs1. Provision of templates and guidelines to States
for DLI#2 to increase citizens’ engagement in the budget process: Citizens Budget Citizens Accountability Report
Citizens Budget – by Sept 2018
Accountability Report – by Dec 2019
Nigeria OGP Secretariat
Nigeria OGP Secretariat provides the template and instructions/user manual to States to PCU and the Bank. PCU distributes to all participating States
2. Provision of guidelines to States for developing a consolidated state revenue code under DLI#4 to strengthen IGR
By Jan 2019 JTB and NGF JTB and NGF provides the guidelines to States to PCU and the Bank. PCU distributes to all participating States
3. Provision of guidelines to States for strengthening the public procurement legal framework under DLI#6 on procurement
By Jan 2019 Bureau of Public Procurement and NGF
BPP and NGF provides the guidelines to States to PCU and the Bank. PCU distributes to all participating States
4. An independent procurement audit conducted on random sample of at least 5 percent of state government capital procurement transactions for States achieving DLI#6
By Dec 2021 FMoF HFD/PCU will hire the audit firm
Copy of the Procurement audit report is provided by the PCU to the Bank
5. Provision of templates and guidelines to States for DLI#7 to strengthen debt management, monitoring and analysis: State quarterly debt report Fiscal Responsibility Law Debt Sustainability Analysis Medium-term debt management strategy
State quarterly debt report – by Sept 2018
Fiscal Responsibility Law – by Jan 2019
DSA – by Dec 2019 MTDS – by Dec 2020
DMO DMO provides the template and instructions/user manual to States to PCU and the Bank. PCU distributes to all participating States
Technical aspects – related to the verification process6. AuGF shares letter of understanding of the
role of AuGF as the IVA for the Program to FMoF
By end July 2018 FMoF HFD AuGF provides letter of understanding to FMoF, copy to PCU and to the Bank
120

Action Description Due Date Responsible Party
Completion Measurement**
7. The DLI verification protocol contained in the program operational manual is distributed and sensitized with technical staff of key state institutions leading the implementation of the Program in participating States by the PCU and IVA in a series of technical workshops
Aug to Sept 2018 FMoF HFD/PCU supported by DMO and IVA
State COFs
PCU provides details of the workshops conducted and staff from each participating state attending to the Bank
8. Hiring of the third party external audit firm to work with the AuGF as the IVA
2 months after program effectiveness, no later than end Nov 2018
FMoF HFD/PCU The PCU provides copy of the signed contract with the external audit firm to the Bank
9. Baseline and end of program state-level surveys to assess level of public access to procurement data and procurement efficiency to verify DLI#6 on procurement
By Dec 2019 (Baseline)By Dec 2021 (End of Program)
FMoF HFD/PCU to procure survey firm
Copy of the survey report is provided to the Bank
10. The procedure used by the DMO to check the accuracy and comprehensiveness of quarterly state debt reports and to provide the IVA with data to support the verification of the debt-DLIs will be reviewed and updated if necessary
By Oct 2018 DMO, IVA The DMO provides a description of the procedure used to check and approve the state quarterly debt reports and provide the IVA with data to IVA, PCU and the Bank
11. Provision of interim reports for full year state expenditure and revenue from the State Auditor Generals and other supplementary evidence for verification of DLIs
By end Feb 2019, Feb 2020, Feb 2021 and Feb 2022 as part of the APA
State COF or State COBP (Chair of the state-level SFTAS steering committee)
Submission by States to IVA of interim reports to assess DLIs requiring estimates of full year expenditure and revenue and other supplementary evidence for verification of DLIs
Technical aspects – related to program coordination at the central level12. Development of the draft of the POM for
clearanceBy end Sept 2018 FMoF HFD FMoF’s HFD submits POM to
the Bank for clearance13. Appointment of key personnel for the Program
Coordination Unit (PCU) housed in the FMoF’s HFD: Program manager, FM specialist and Procurement specialist
By end Sept 2018 FMoF HFD and IERD
FMoF’s HFD provides copy of the signed contracts to the Bank
121

Action Description Due Date Responsible Party
Completion Measurement**
14. Contracting of NGF as a project management firm to support the PCU to implement specific capacity building and learning activities to States under the TA (IPF) component
By end Oct 2018 FMoF and NGF FMoF provides the Bank with copy of the signed contract
15. Ensure PCU is adequately staffed throughout the program duration with a program manager, FM specialist, Procurement specialist, Capacity Building specialist, Communications and Outreach specialist, and M&E specialist
By end Dec 2018 and continuous
PCU PCU provides the Bank with annual reports of its activities and staffing
16. Establish central SFTAS steering committee By end Sept 2018 FMoF HFD/PCU FMoF’s HFD provides to the Bank the composition, terms of reference and meeting schedule
17. Development of 2018-2019 work plan for PCU, including its support to the IVA, including support to the IVA, Communication activities
By end Sept 2018 PCU PCU provides to the Bank the work plan covering 2018-2019 the activities of the PCU and estimated budget
18. Development of the detailed overall plan for capacity building to States, the Communications and Outreach Plan and Monitoring and Evaluation Plans
Capacity Building Plan by end Aug 2018
Communications and Outreach and Monitoring and Evaluation Plans by end Feb 2019
FMoF HFD /PCU FMoF’s HFD /PCU provides to the Bank copies of the plans and presents to the central SFTAS steering committee for review
Technical aspects – related to program coordination at the state level19. Each state shall establish the state-level
SFTAS steering committee, assign the Chair and assign the focal points for the Program implementation and coordination of capacity building activities to the States
By Sept 2018, prior to program effectiveness
State Ministry of Finance
Confirmation from the PCU that information on the composition of the state-level steering committee and focal points have been received from the state within the specified time period.
122

Action Description Due Date Responsible Party
Completion Measurement**
20. Develop state SFTAS annual action plans achievement of the Eligibility Criteria and DLRs, including capacity building activities
By Sept 2018, prior to program effectiveness for 2018
By Dec 2018 for 2019
State COF or State COBP (Chair of the state-level SFTAS steering committee)
Confirmation from the PCU that the action plans have been received within the specified time period.
Fiduciary Aspects21. Formal policy and procedural guidance note
accepted by participating States on fraud and corruption /complaints redress mechanism under the Program
Within 12 months of effectiveness
FMoF HFD/PCU (supported by ICPC/EFCC) and States’ Ministries of Finance
Confirmation from the PCU that the formal policy & procedural guidance note for participating States have been accepted by the participating States within the specified time period.
22. Ensure existing state-level fraud and corruption/complaints redress mechanism incorporate the Program.
Within 18 months of effectiveness
States’ Ministries of Finance (supported by ICPC/EFCC)
States confirm to PCU that the state-level fraud and corruption/ complaints redress mechanism have incorporated the SFTAS program within the specified time period.
23. States submit audited financial statements with the necessary information required for the SFTAS Program Audit
FY2018 by Dec 2019, FY 19 by Dec 2020, FY 20 by Dec 2021, FY 21 by Dec 2022
States Accountant General
States submit the audited financial statements to the PCU
24. Introduction of risk-based internal audit function outside the expenditure processing cycle
Within 18 months of effectiveness in Pilot MDAs
States Accountant General
States submit internal audit reports to the PCU. PCU confirms reports have been received within the specified timeframe
Environmental and Social Aspects
123

Action Description Due Date Responsible Party
Completion Measurement**
25. Include environmental and social management rules in the operation (in compliance with PforR core principles)
Within six months of project effectiveness
Federal Ministry of Environment (FMEnv) with States’ ministries of environment – under an agreement with the Ministry of Justice (federal and state level).
Confirmation from the FMEnv that the formal policy & procedural guidance note, with assigned responsibilities and oversight, have been received within the specified time.
26. Create awareness for the use of the States’ ombudsman to protect basic human rights of people potentially affected by the SFTAS
This should be in place within six months of project effectiveness
Program implementation focal person at State level
Confirmation from the Program implementation focal person at State level that citizens have been informed of the possibility to use the States’ ombudsman for protection of basic human rights potentially affected by the SFTAS
124

Annex 9: Implementation Support Plan
1. The strategy for implementation support is based on the assessed risks of the Program (as delineated in the SORT), as well as the assessed capacity of the client agencies responsible for delivering results under the operation. The strategy embraces the principle of on-demand and flexible implementation support to address challenges as they arise. In addition, frequent supervision and consistent collaboration with government, and beneficiaries will be strengthened by regular communication with all actors directly involved in the Program, constant information exchange, and adequate flexibility to accommodate the specificities of the Program.
2. The implementation support for the Program will be enhanced in recognition of the scale of the Program, the institutional capacity of the implementing agencies, the risks, and the need for close monitoring to facilitate early response to program implementation challenges. The implementation support will include: (a) Joint Review Missions (JRM) (more frequent in first two years); (b) quarterly technical meetings and field visits between the formal JRMs; (c) on-demand external technical expertise; and (d) audit and FM reporting.
Implementation Support Plan
3. The World Bank will provide timely support to the program results areas and TA component as well as guidance to the relevant agencies regarding technical, fiduciary, social, and environmental issues. Implementation support and field visits will be carried out as required, and will focus on:
(a) Technical inputs. The World Bank will make available relevant specialists/consultants for all formal JRMs as well as on-demand technical requests throughout the life of the Program. The support in the first year or two will be intensive to rollout the program. In addition, the World Bank will sponsor quarterly video conference technical reviews to address implementation issues related to the four results areas.
(b) Fiduciary requirements and inputs. The assessments conducted have highlighted the need for significant training for the implementing agencies in procurement. Supervision of financial management and procurement arrangements will be carried out as required as part of the Program supervision plan and support will be provided on a timely basis to respond to program needs.
(c) Safeguards. The World Bank will monitor compliance with the ESSA during JRMs and technical guidance will be provided accordingly, including training on environmental and social management.
(d) Monitoring dashboard. A monitoring dashboard will be put in place for monitoring SFTAS PforR performance, with regards to: (i) progress against DLIs; (ii) disbursements (overall and per state), including issues causing delays; and (iii) implementation status and progress against agreed activities (completed, ongoing, delayed), including issues and challenges in the program implementation. The dashboard will be produced on a monthly basis, but its format and frequency may be adjusted during program implementation and as deemed necessary.
125

4. The focus of implementation support is summarized below:
Time Focus Skills Needed
First twelve months
Technical support for:
results areas; governance, management, and accountability
mechanisms; procurement training and supervision; FM training and supervision; environmental and social monitoring and
reporting; institutional arrangement and Program
supervision; communication and outreach
Technical; audit; M&E; procurement; financial management; institutional; environmental and social; communication
12-48 months Technical support for
results areas; procurement management; FM and disbursement; environmental and social monitoring and
reporting; Program supervision, monitoring, and reporting communication and outreach
Technical; M&E; procurement; financial management; institutional; environmental and social; communication
Task Team Skills Mix Requirements for Implementation Support (over Program Duration)
Skills Needed Number of Staff Weeks
Number of Trips
Comments
Task Team Leader 40 weeks As required Country office based
Co-Task Team Leaders 40 weeks As required HQ and Country based
FM Specialist 40 weeks As required Country based
Procurement Specialist 28 weeks As required Country based
Fiscal and Debt Economist(s)
20 weeks As required HQ and Country based
Public Sector Specialist(s)
20 weeks As required HQ and Country based
Operations Specialist 20 weeks As required HQ and Country based
Communications Specialist
20 weeks As required Country based
Social Specialist 4 weeks As required Country based
126
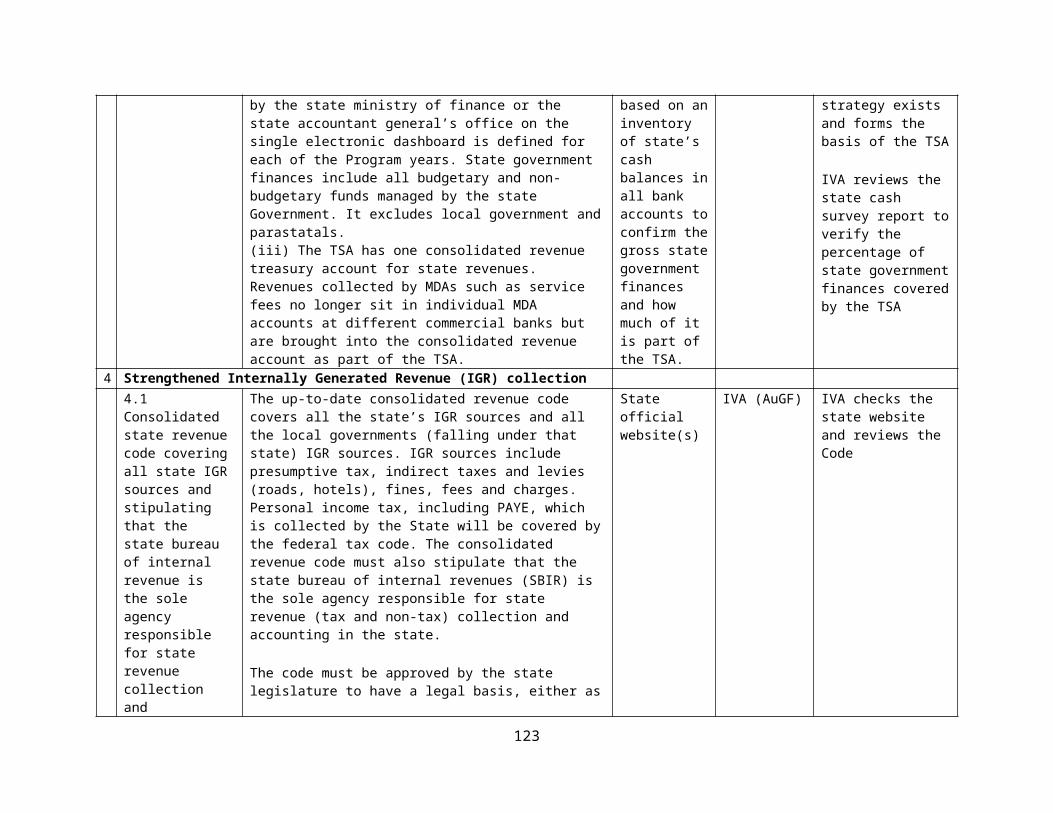
Environment Specialist 4 weeks As required Country based
Annex 10: Technical Assistance Component Project (IPF) for SFTAS (US$50 Million)
1. The TA Project for SFTAS is comprised of three components: (1) Strengthening State Government Systems and Capacities; (2) Strengthening Program Coordination and Verification of Results; and (3) Strengthening Policy Coordination between Federal and State Governments. The first component will be the largest, focusing on providing capacity support to all participating state governments to strengthen their systems and capacities to enable them to achieve the Program results (the DLRs). The design of the capacity support program to States is based on the findings of the assessment of the implementation of the FSP carried out by the FMoF and NGF, previous assessments of state fiscal and debt management capacity69, as well as on the feedback received during the consultation with the state governments. Implementation under the TA component will be managed in accordance with Bank Policy and Bank Directive (IPF).
2. The capacity building strategy for SFTAS draws upon the lessons learned from the Bank’s experience of implementing capacity building programs in Africa. A recent review of the World Bank’s capacity building experience in Africa recommends that capacity building efforts should aim at developing capable organizations and enabling institutions beyond the life cycle of individual projects,” leaving something behind”70. Accordingly, instead of crafting project specific arrangements or parallel structures, the SFTAS Program takes a strategic approach to building state capacity by relying on national and regional institutions with the explicit mandate for public sector capacity building. The Program intends to build coalitions among line ministries (who have the technical knowledge) and public-sector training institutions (who have the capability and reach to deliver capacity building programs across the nation) with the objective of tapping the technical skills and experience within the Nigerian public sector to create sustainable capacity building programs.
3. The TA Component (i.e. “Project”) will focus on strengthening in-country institutions: selected national-level institutions who are critical for supporting state governments to achieve Program results as well as to strengthen state government capacities in a sustainable manner. Accordingly, the following national-level institutions will act as the implementing agencies for the Project: (i) the PCU housed in the FMoF HFD will provide support to the AuGF as the IVA, and support the JTB and the NEC to play their mandated roles in federal-state policy coordination. The PCU will engage the NGF as a project management firm to support the PCU to implement specific capacity building and learning activities, including technical workshops on the KRAs, customized just-in-time hands on support at the individual state level through mobile teams and the NGF’s helpdesks, and peer learning forums to facilitate learning across States on the KRAs of the Program; (ii) the PSIN, the training institution for the federal civil service, will design and deliver curriculum-based structured learning programs in the KRAs of the Program, in collaboration with other training organizations as well as Government
69 For example, the six Debt Management Performance Assessments conducted for Nigerian States through the World Bank’s Debt Management Facility70 World Bank’s Regional Approach to promote Sustainable Capacity Building Outcomes in Africa: Good Practice Note. March 2018
127

technical departments; (iii) the Office of the Attorney-General of the Federation in the Federal Ministry of Justice (activities to be led by the OGP Secretariat housed in this Office) will provide targeted capacity support to state governments on OGP implementation; and (iv) the DMO will provide a range of structured learning programs, technical workshops and just-in-time support on the debt-related result area and DLIs of the Program;
4. The implementation arrangements for the Project, including financial management and disbursement and procurement arrangements, have been designed to ensure that the Project is well coordinated across the implementing agencies, well planned while retaining flexibility, and to mitigate fiduciary risks. Significant planning and preparation will be done prior to project effectiveness so that the Project activities can start immediately to support States to achieve the results in the PforR component.
Component One: Strengthening State Government Systems and Capacities ($38 million):
5. The component will provide direct support to participating state governments to enable them to achieve the DLIs. While no States are excluded from accessing capacity building support, the support will build upon existing projects and TA provided by the Bank and will therefore target the 22 States that are not receiving direct support on strengthening PFM under existing Bank projects. Support will be provided to all States on result areas and DLIs that are not currently supported by existing programs (for example, on OGP and debt management activities).
6. The focus of the support will be training and learning facilitation on areas directly linked to the achievement of the DLIs of the Program. The capacity building support to States is not envisaged to include provision of IT equipment and software to States, because not all States need additional IT investments to achieve the results. Also, other World Bank-funded state-level projects are already providing funds to many States for meeting IT needs to strengthen PFM and States are expected to use these funds. While the areas of capacity building will be guided by the DLIs, broader fiscal management issues can be covered if appropriate. The capacity building activities will be sequenced and those supporting results to be achieved in the first and second year of the program will be delivered first
Table 10.1. Specific Areas of Capacity Building at State LevelSFTAS Program DLIs Areas of Capacity Building Focal AgenciesEligibility Criteria Preparing financial statements
according to IPSAS standards Preparing annual state budgets
according to the chart of accounts Auditing financial statements
State Accountant General’s Office
State Budget Office State Auditor
General’s Office
DLI #1: Improved financial reporting and budget reliability
Preparing budget implementation reports
State Accountant General’s Office
State Budget Office Preparing MTEF containing credible
revenue and expenditure forecasts State Budget Office State Ministry of
FinanceDLI# 2 Increased openness Conducting citizens engagement and State Budget Office
128

and citizens’ engagement in the budget process
knowledge forums; Preparing citizens budget and
accountability reportDLI# 3 Improved cash management and reduced revenue leakages through implementation of State TSA
Cash management strategy Implementation of state-level IFMIS
and adoption of TSA
State Accountant General’s Office
State Ministry of Finance (Treasury)
DLI # 4: Strengthened Internally Generated Revenue Collection
Developing a consolidated revenue code at the state level
Strengthening state tax administration systems and tax policy (e.g., taxpayer registration, design of presumptive tax regime and property tax71)
State (Boards of) Inland Revenue Services (SBIRS)
DLI # 5: Biometric Registration and Bank Verification Number used to reduce payroll fraud
Strengthening biometric capture and payroll/HR database alteration protocols
State Head of Office
DLI # 6: Improved procurement practices for increased transparency and value for money
Development of state-level eProcurement strategy
Implementation of the eProcurement business process and change management
Adoption of Open Contracting Data Standard (OCDS)
State Procurement Board
DLI#7: Strengthened public debt management and fiscal responsibility framework
Domestication of Fiscal Responsibility Law (FRL)/Establishment of state public debt legislation
Usage of debt recording systems72
Preparing accurate and comprehensive quarterly debt reports
Development of medium-term debt management strategies to target an optimal debt portfolio
State Debt Management Departments
State Ministry of Finance
DLI#8 Improved clearance/reduction of stock of domestic expenditure arrears
Strengthening expenditure controls Operational risk management to
prevent frauds, errors and technical arrears
State Accountant General’s Office
State Debt Management
71 In September 2017, the World Bank in collaboration with the IMF carried out a TADAT appreciation workshop for 18 State governments in Nigeria. The forum provided an opportunity for these officials to self-evaluate tax administration/revenue mobilization operations across the States. Benchmarking their operations against the twenty-eight indicators and forty-seven dimensions of the TADAT framework, the state officials could identify and prioritize the various binding constraints to effective and sustainable revenue generation at state level. Two key actions adopted by the forum were: (a) To improve taxpayer registration/databases, which by contemporary international best practice, constitutes the foundation for any effective tax administration system; and (b) To properly harvest the revenue opportunities and potentials derivable from the vast economic activities presently operating in the informal sector through measures such as the implementation of a presumptive tax regime and property taxation, amongst others72 Several Debt Management Performance Assessments for Nigerian States (Lagos, Cross Rivers, Ondo, Edo etc.) show the weak capacity to record debt and poor systems for keeping debt data, loan records and securities around the debt database.
129

Preparation and publication of domestic arrears database
Development of domestic arrears framework
Departments State Ministry of
Finance
DLI# 9: Improved debt sustainability
Conducting debt sustainability analysis
Development of medium-term fiscal policy and MTEF, which is consistent with debt sustainability
State Ministry of Finance (Fiscal Policy)
State Ministry of Budget and Planning
State Debt Management Departments
7. Curriculum-based structured learning on PFM and OGP: The PSIN, which is the training organization for federal civil servants in Nigeria will be responsible for the design and delivery of a set of curriculum-based core courses on the concepts and practices of PFM and OGP, in collaboration with technical agencies (such as the Nigerian OGP secretariat, AuGF, and the JTB). PSIN will work together with selected in-country training institutions in the six geo-political zones of the country to deliver the core course to participants from all States in an intensive face-to-face mode in the first two years of the SFTAS Program. Subsequently, PSIN will convert the core courses into an e-learning course, which will be rolled out latest by the end of FY 20. The course will be on an open access basis and the primary target group for the e-learning courses will be state government staff, though the PSIN may choose to make these courses available to the public if there is a demand. In designing and delivering the core courses, PSIN is looking to partner with well-established training institutions to draw on their expertise, including those with regional experience (for example: WAIFEM (West African Institute of Financial and Economic Management)).
8. Mobile teams for just-in-time customised on-the-ground support: The PCU will engage NGF as a project management firm to support the PCU to implement a program of providing mobile teams of experts in the KRAs of the Program to provide customized just-in-time hands on support to individual state governments. The capacity support delivered will be demand-based and tailored to the needs of individual state governments. The mobile teams will adopt a “problem-driven” approach to identify critical institutional bottlenecks and capacity constraints in the KRAs and provide just-in-time support to state governments to address the binding constraints to achieving the DLIs in the Program. The NGF will form and manage the mobile teams and provide the necessary technical guidance and oversight to the mobile teams. The mobile teams will be linked to the existing “Help Desk” facility of the NGF.
9. Strengthening debt management capacity in state governments: The Project will support the expansion of the existing training programs and capacity building provided by the Federal Debt Management Office (DMO) to the state debt management departments (DMDs) and additional training programs as needed to support States to achieve the debt-related DLIs. The DMO has a mandate to strengthen debt management at the federal and state level. At the state-level, the DMO has supported States to set up their DMDs, adopt legislation and best-practices concerning public debt management, and has provided regular training and hands on support to the state DMDs since 2008, on areas such as debt recording and reporting (as States are required to submit detailed information on their debt portfolio on a quarterly basis to the
130

DMO). Under this Program, DMO will expand their capacity building activities to participating state governments, helping them to establish strong legal foundations for public debt management, strengthen their capacities to record and report state debt, including domestic arrears, and analyze debt sustainability to inform fiscal policy and development of the MTEF. The modalities to be used by DMO include central and regional technical workshops, development of debt recording and analysis tools and templates, just-in-time advisory services in the areas of debt management and sustainability, with the purpose of enhancing States’ capacity to achieve DLIs under KRA 4 on debt management and sustainability.
10. Strengthening OGP implementation in state governments: The Project will support, through the Nigerian OGP secretariat, participating state governments to implement OGP action points. While the primary focus of the component will be to support States to achieve the DLIs relating to transparency and accountability, support will be provided the open government reforms in the OGP NAP at the state-level, specifically in the following areas: 1.) Fiscal Transparency, Open Budgets, and Citizen Budgets 2.) Citizen Engagement and Participatory Processes 3.) Open Contracting, e-Procurement Business Process Re-Engineering, 4.) State Level OGP Action Planning and 5.) Participation in the Global OGP sub-national pilot. Building upon the basic OGP training provided to all States through the PSIN, the National OGP secretariat will work with state-level counterparts and will provide advisory support through experts as well as implementation support to state government agencies involved in the OGP agenda. This support will be a combination of assistance performed by the Nigerian OGP Secretariat, State Government, and external experts73 leveraging best practice in Nigeria and the 75 OGP member countries implementing similar reforms. In addition, the Project will also support the Nigerian OGP secretariat to prepare “How to” Guides or Process Manuals on the various OGP action points.
11. Enabling Peer Learning and Knowledge Dissemination: The PCU will engage NGF as a project management firm to support the PCU to implement a program of peer learning and knowledge dissemination. The NGF already organizes state peer learning forums (main ones have been on IGR) and periodical exchanges between state commissioners of finance and budget and planning, auditor generals, etc. with a view to tap into the tacit knowledge that exists within the state governments as well as to facilitate peer learning among States. The Project will support the scaling up of these ongoing initiatives by NGF as the project management firm supporting the PCU:
i. Setting up of peer learning networks among state governments in the four KRAs of the Program. Learning from global experiences of well-established learning networks such as the PEMPAL (Public Expenditure Management Peer Assisted Learning) and the Debt Manager’s Network, the Project will support communities of practice of state commissioners of finance, budget and planning, state debt management officials, state auditor generals, etc. The communities of practice will facilitate exchange of ideas, knowledge and experience among States as well as provide a platform for discussions on common issues relating to state government financial management and accountability. In addition, the Project will also support South-South learning through exchange visits as
73 Examples: International Budget Partnership (IBP), Global Initiative for Fiscal Transparency (GIFT), OGP Support Unit, Open Contracting Partnership (OCP), Global Integrity, PPDC, BudgIT, etc.
131

well as through the Global Distance Learning Network (GDLN) in selected areas relating to the working of fiscal federalism.
ii. In addition, Knowledge Workshops and Knowledge productions in KRAs of the Program will be done. Discussions with state governments have revealed that there is a need to have ready-to-use guidance notes in areas such as revenue administration, debt management, open government practices and PFM. The Project will thus support the preparation of guidance notes on PFM, Debt Management, E-Procurement as well as to organize knowledge workshops in these areas.
Component Two: Strengthening Program Coordination and Verification of Results (US$8 million):
12. Support will be provided for the HFD as the PCU through consultants, who will work as specialists within the PCU, alongside seconded staff from the FMoF, on specific areas of Program management: Program supervision, Communications and Outreach, Procurement, Financial Management, and M&E. The establishment of the PCU with the key specialists in place will be a condition of effectiveness.
13. Coordination of Capacity Building: The PCU will have a designated Capacity Building Specialist who will support the Program Manager in the coordination of the Capacity Building component activities with the PSIN, Nigerian OGP Secretariat and DMO and in the engagement of NGF as a project management firm. The PCU will develop the overarching TA plan covering all three components of the TA project. The PCU will also chair the capacity building technical committee which will bring the implementation agencies together on a regular basis to facilitate coordination.
14. Communications and outreach: The PCU will carry out a regular extensive program of communication and outreach activities with State Governments as well as other key federal/national level stakeholders such as the NEC, the Federal Ministry of Planning and Budget, FIRS etc. on the contents and activities of the Program. The Bank will work alongside the PCU to design and organize activities with all Program stakeholders to enable regular dialogue and information sharing - starting before Program effectiveness and throughout the duration of the Program. It is envisaged that at least twice a year, there will be a peer forum convening key stakeholders across States to collectively review progress (based on the results of the APA), showcase and learn from success, identify implementation challenges and problem-solve, and plan for the next year of the Program. The forums will leverage existing communities of practice for state commissioners of finance, budget and planning, and the state accountant general. The Communications Specialist will assist the Program Manager to implement and coordinate these activities.
15. Program Monitoring and Evaluation: The PCU will put in place a robust Program M&E system to: i) select the right tools to monitor Program activities; and ii) provide a consistent series of checks, feedback and technical support during implementation of activities prior to assessment of results by the IVA in the APA. The Program’s Operations Manual will include definition and descriptions of DLIs, milestones and performance management arrangements to support an understanding of roles and responsibilities of the various stakeholders, a calendar for
132

spot-checks to track program implementation as well as a transparent and acceptable mechanism for public disclosure of information on States’ performance drawn from the APA to support demand-side engagement and healthy peer competition. The M&E Specialist at HFD will assist the Program Manager to implement and coordinate these activities.
Figure 10.1 Program Coordination Unit
16. Independent Verification of Program Results: Through the PCU, AuGF will be supported to carry out the role of the IVA for the Program. In doing so, the Project will provide the support of a third party external audit firm to work with the AuGF to build their capacity in the verification process and to provide additional quality assurance of the results of the verification process. The Project will support conducting surveys of States to collect baseline and end-of-program data for the e-procurement and open contracting DLRs that will be inputs into the verification process. The Project will also support the Federal DMO to strengthen its capacity to compile, verify and analyze the debt information submitted by States as the state debt reports constitute the primary source of data for the IVA to assess accomplishment of DLI 8 and 9. The PCU will agree with the AuGF at the start of the Program on the activities and the budget for the verification of Program results. The budgeted funds will be transferred by the PCU to the AuGF at the start of each fiscal year.
Component Three: Strengthening Policy Coordination and Cooperation between Federal and State Governments ($4 million):
17. In accordance with the Nigerian Constitution, coordination and cooperation between the federal and state governments is critical for effective governance and service delivery at the subnational level. Though there are institutions such as the NEC chaired by the Vice President and with state governors as members, the existing arrangements
133

for policy and institutional coordination between the federal and state governments are quite weak (World Bank, 2017). This has resulted in inadequate monitoring of institutional performance across the tiers of Government, lack of synergies in resource allocation and implementation of public programs, limited information-sharing among the tiers of governments as well as inadequate arrangements for the federal government to share its skills and experience with state governments in specific areas of governance and fiscal management.
18. Drawing lessons from the World Development Report (WDR) 2017, which “identifies commitment, coordination, and cooperation as the three core functions of institutions that are needed to ensure that rules and resources yield the desired development outcomes”, the Project, through the PCU, will support key federal-state coordination institutions such as the NEC and JTB. The Project will support the NEC Secretariat to use the performance data generated through the APA, as well as the feedback from the peer learning workshops organized under the Project to strengthen evidence-based policy making and support coordinated action by the federal and state governments in critical areas such as fiscal management and service delivery. The Project will provide support to the JTB to enhance their capacities for the monitoring and analysis of state IGR data and coordinating tax policy between the federal and state governments. The Project may also support the Office of Accountant General of the Federation (OAGF) who is responsible for federation and FGN accounts to use the state fiscal and budget data being published under the Program to provide a consolidated government fiscal picture, which currently does not exist. The described capacity support activities above will be part of the annual work plan and budget of the PCU and will be coordinated by the Capacity Building Specialist in the HFD.
Implementation Arrangements
19. The primary implementing agencies for capacity building activities to the States (component one) are: 1) the PCU at FMoF HFD, supported by the NGF as a project management firm; 2) PSIN; 3) the Office of the Attorney-General of the Federation in the Federal Ministry of Justice (activities to be led by the OGP Secretariat housed in this Office); and 4) DMO. For components two and three, the PCU will be responsible for the implementation of TA activities to the AuGF as the IVA and to NEC, JTB and other FGN-state policy coordination bodies. The Program Manager at the PCU will be assisted by a dedicated Capacity Building Specialist.
20. As a result of NGF’s unique capabilities and experience in organizing and delivery capacity building and learning activities to States, NGF will be engaged by the PCU as a project management firm to support the PCU to implement specific capacity building and learning activities to States, namely technical workshops, mobile teams providing just-in-time support linked to a helpdesk, peer learning forums and knowledge dissemination. NGF will be engaged as the project management firm through a single source procurement process, under terms of reference acceptable to the Bank.
21. By Program effectiveness, the PCU will have prepared a TA Plan that will cover all three components, describing the activities under each of the three components, along with their indicative budgets and timelines. The TA Plan will be reviewed by the World Bank and will be
134

submitted for the approval of the Central Steering Committee. Each of the implementing agencies will prepare an Annual Work Plan (AWP) for the activities they intend to implement and the estimated budget for each year of the Program and submit to the World Bank and HFD PCU prior to the start of the FY. The PCU and the World Bank will review these AWPs to make sure that they are in line with the TA Plan. Each implementing entity will prepare a report on the implementation of their AWP and submit to the World Bank and the PCU, who will consolidate them into a TA report for the Central Steering committee and the Bank.
Financial management and disbursement arrangements
22. General. Procurement and Financial Management assessments of the agencies that will implement the TA (IPF) component was conducted and the findings arising therefore informed the design of the implementation arrangements. The implementation arrangement includes implementing an enhanced accountability framework to mitigate the risk of misuse of funds for soft expenditures (especially travel, workshops, study tours). For the TA (IPF) component, the World Bank will disburse the funds to a U.S. Dollar designated account (DAs) opened at the CBN for each of the implementing agencies. The funds associated with the independent verification process, including the incremental costs of the AuGF, the costs of the third party external audit firm and the surveys to be commissioned to support the verification process, will be managed by the HFD PCU. To mitigate the risk of delay in payments by the implementing entities, service standards will be established (to be included in the OIM) to ensure, among other things, that payments are made within 72 hours for eligible expenditures. DAs will be managed by the implementing agencies which will, based on approved and costed AWPs, disburse funds through the Naira draw-down account (also held with the CBN) to finance eligible expenditures (see schematic diagram on funds flow arrangements under the Operation). Disbursements under the TA component will be made primarily as advances based on unaudited IFRs to be submitted on a quarterly basis. The DA ceiling will be based on six-month forecast expenditures, and replenished quarterly for the same period. The detailed assessment and related arrangements are below:
23. Planning and budgeting. On an annual basis, the designated accountant in each implementing agency for the TA component will prepare the budget for the fiscal year based on the annual workplan (AWP). The AWP and annual budget will be submitted to the World Bank and HFD at least two months before the beginning of the fiscal year for review. The Bank makes the decision to approve the AWP and the budget for disbursement.
24. Funds flow. The World Bank will disburse the funds for the TA component into U.S. Dollar DAs opened at the CBN. The DAs will be managed by HFD PCU and the other implementing agencies. Disbursements will be made primarily as advances on a quarterly basis, based on: (i) unaudited IFRs prepared by the respective implementing agencies and submitted quarterly to IDA, and (ii) forecasts for the subsequent six months. A Naira draw-down account will be established by each implementing agency, and from which Naira payments will be made for eligible expenditures and to other service providers. To mitigate the risk of delay in payments by the implementing agencies, service standards will be established (to be included in the OIM) to ensure, among other things, that payments are made within 72 hours for eligible expenditures. For NGF as the project management firm supporting the PCU, an initial advance will be paid after contract signature to mobilize activities, further payments will be made upon delivery of agreed activities, in line with the agreed provisions of the contract.
135

25. Disbursements. A flexible disbursement ceiling will be applicable. The ceiling will be derived from approved AWP and budget and will be equivalent to six-months expenditure forecast. In the circumstance of a non-compliance by an implementing agency with the Banks Policies and Directives and the FA, warranting the suspension of disbursement, only the non-compliant implementing agency will be affected, the other implementing agencies will not.
26. Disbursement categories. Table 10.2 sets out the amount allocated to a single disbursement category for financing out of the proceeds of the credit in respect of the TA component:
136

Table 10.2 Disbursement Categories
Categories Amount of the Credit Allocated (expressed
in SDR)
Percentage of Expenditures to be Financed (inclusive of
Taxes)
Goods, consulting services, non-consulting services, Training and Workshops, and Operating Costs under the Project
34,832,250 100%
Total amount 34,832,250 100%
27. Accounting and financial reporting. IDA funds will be accounted for by HFD and the other implementing agencies on an accrual basis, using its computerized accounting system. The annual financial statements for the TA component will be prepared in accordance with the relevant IPSAS. Calendar semester unaudited IFRs will be prepared by HFD and the other implementing agencies and submitted to IDA within 45 days of the end of each fiscal calendar semester. The primary responsibility for the final accounting and reporting of the use of the advances to carry out the TA component activities will remain with the HFD and other implementing agencies, and would be based on the quarterly reports received from the States.
28. Internal controls. An internal auditor will be designated for the Project. The internal auditor will prepare quarterly internal audit reports and will submit the reports to IDA within 45 days of each fiscal calendar quarter. Additional controls in the form of an enhanced accountability framework will be implemented to mitigate the risk of misuse of funds for soft expenditures (especially travel, workshops, study tours). The Bank’s Financial Procedures Manual will be adapted for the accounting and control procedures to be implemented by HFD.
29. External audit. The annual financial statements for each implementing agency will be audited by the AuGF, based on Terms of Reference acceptable to IDA. The annual audited financial statements will be considered as constituting the basis for the annual financial assurance required by the World Bank, and the audited financial statements shall be submitted to the PCU within 12 months of the end of the government fiscal year. In addition to the annual financial statements audit, annual procurement audit will be conducted on the procurement carried out by the HFD/PCU.
30. Financial Management Action Plan. Actions to be taken for the project to further strengthen its financial management system are listed in table 10.3.
31. Financial Management Implementation Support Plan. FM supervision will be consistent with a risk-based approach. The supervision intensity is based initially on the assessed FM risk rating and subsequently on the updated FM risk rating during implementation. Given the Substantial risk rating, on-site supervision will be carried out at least twice a year with all the implementing agencies. On-site review will cover all aspects of FM, including internal control systems, the overall fiduciary control environment, and tracing transactions from the bidding process to disbursements as well as IFR review. Additional supervision activities will include desk review of calendar semester IFRs, quarterly internal audit reports, audited annual financial statements, and management letters.
137

138

Table 10.3: Financial Management Action PlanAction Date due by Responsible
Agreement of format of unaudited Interim Financial Report (IFR), Annual Financial Statement and External Auditors Terms of Reference for financial audits
Before effectiveness HFD PCU and other implementing agencies
with support and guidance of IDA task team
Train FM staff of the implementing agencies in Bank FM procedures and Disbursement Guidelines
Before effectiveness IDA task team
Designate FMS/PA, PIA and support accounting technicians in each implementing agency
Before effectiveness HFD PCU and other implementing agencies
Procurement arrangements
32. Procurement under the proposed project will be carried out in accordance with the World Bank procedures, as follows: procurement for goods, non-consulting and consulting services for the project will be carried out in accordance with the procedures specified in the ‘World Bank Procurement Regulations for IPF Borrowers’ dated July 2016 (Procurement Regulations, revised as of November 2017) and the World Bank’s ‘Guidelines on Preventing and Combating Fraud and Corruption in Projects Financed by International Bank for Reconstruction and Development (IBRD) Loans and IDA Credits and Grants’ (revised as of July 1, 2016), as well as the provisions stipulated in the Financing Agreement.
33. Procurement shall be carried out by the PCU at the FMoF’s HFD: The categories of procurement consist mainly of:
Selection of individual consultants, who will work as specialists within the PCU, alongside seconded staff from the FMoF. The consultants envisaged to be hired include: Program Manager, Program Assistant, M&E specialist, Communications specialist, Capacity building specialist and Financial Management specialist who will deliver core PCU tasks. SEEFOR will provide funding prior to SFTAS program effectiveness for the establishment of the PCU, including the procurement of the consultants to be supported by a Procurement specialist. The appropriate selection method for each consulting and goods contract is established in the draft Procurement Plan.
Selection of the third party external audit firm who will work with the AuGF as the IVA to build their capacity in the verification process and to provide additional quality assurance of the results of the verification process.
Selection of the external firm who will carry out surveys of States to collect baseline and end of program data for the e-procurement and open contracting DLI and provide the data to the AuGF/IVA to do the results verification.
NGF will be engaged as the project management firm through a single source procurement process, under terms of reference acceptable to the Bank.
139

Procurement of consultancies with expertise in capacity building of States in the technical areas of the Program to support the other implementing agencies to implement their annual work plans of capacity building activities for the States.
Procurement of goods like vehicles, computers and office equipment for the PCU, the AuGF/IVA and other implementing agencies, who will not be doing their own procurement, is also envisaged.
34. The project management firm’s responsibilities include managing the related procurement (for example consulting services for just in time technical support to the States on the preparation of budget and financial statement, revenue forecasting, tax administration, IFMIS implementation, and implementation of e-procurement and open contracting) required for the firm to deliver the activities agreed in the contract. Any procurement process undertaken by NGF in executing the contract, will be carried out in accordance with the procedures specified in the ‘World Bank Procurement Regulations for IPF Borrowers’ dated July 2016 (Procurement Regulations) and the World Bank’s ‘Guidelines on Preventing and Combating Fraud and Corruption in Projects Financed by International Bank for Reconstruction and Development (IBRD) Loans and IDA Credits and Grants’ (revised as of July 1, 2016).
35. A Project Procurement Strategy for Development (PPSD) has been prepared with the Bank support, which aims to ensure that procurement activities are packaged and prepared in such a way that they expedite implementation, taking into account (i) the market analysis and the related procurement trends and (ii) the procurement risk analysis. The PPSD includes the recommended procurement approaches for the project that have been reflected in the Procurement Plan, covering the first 18 months of the project implementation.
36. A procurement plan for the first 18 months of the TA component was developed and agreed with the implementing agencies during appraisal. The Procurement Plan will be updated, as necessary and in agreement with the Bank, annually to reflect the project’s actual implementation needs and improvements in institutional capacity.
37. The Bank has assessed the above arrangements. The main procurement risks identified and mitigation measures agreed are as follows:
(1) FMoF HFD: Procurement in the department which are mainly consultants and procurement of office equipment and furniture, and consultancy services is based on the 2007 Procurement Act of Nigeria and handled by the procurement department of the ministry. HFD is usually represented in the evaluation committee for such procurement. HFD does not have any experience in the implementation of Bank funded projects. However, a PCU that will be fully dedicated for the implementation of project is being established in HFD. To address the lack of capacity for procurement implementation, a consultant with the requisite experience in procurement under World Bank funded project will be engaged to support the procurement implementation. This will be in addition to a full-time procurement officer that will be seconded from BPP. Part of the responsibility of the procurement consultant will be to train the procurement officer that will be posted to the PCU and other PCU staff on procurement under World Bank funded project. The consultant will also assist the PCU to establish a functional procurement unit that will have among other things a procurement filing and data management system and a contract administration system. The system may be manual initially but will be migrated to electronic system immediately once funding is available after program effectiveness. This is essential to avoid the problem of poor filing
140

and document management system in addition to poor contract administration in some of the projects implemented or being implemented in the Nigeria portfolio. When the project is launched, procurement-related staff in the Secretariat will be provided with a training workshop on the Bank’s Procurement Regulations and the Bank’s System Tracking of Exchanges in Procurement, STEP.
(2) NGF Secretariat: The NGF Secretariat has experience in the implementation of some donors’ funded project like Bill and Melinda Gate Foundation and DFID in which they have been involved in the procurement of individual consultants. However, it has not been involved in procurement under World Bank funded projects. To address this capacity constraint, an experience procurement consultant familiar with the World Bank Procurement Regulations for Borrowers will be engaged to support the implementation of the procurement activities that will be undertaken by the NGF as the project management firm. When the project is launched, procurement-related staff in the Secretariat will be provided with a training workshop on the Bank’s Procurement Regulations and the Bank’s System Tracking of Exchanges in Procurement (STEP).
Operating Costs:
38. Operating costs for the HFD PCU, the AuGF (as the IVA), and the implementing agencies for the capacity building will include the following: staff’s travel expenditures and other travel-related allowances with prior clearance from IDA; equipment rental and maintenance; vehicle operation, maintenance, and repair; office rental and maintenance; materials and supplies; utilities and communication expenses; and bank charges. The operating costs financed by the project will be procured using the government administrative procedures that are acceptable to the Bank. The operating expenses will be subject to statement of expenditure (SOE) review by the Bank.
Training, Capacity Building, and Workshops
39. HFD PCU and other implementing agencies will submit their annual training plans, including capacity building activities to the States and training for their own staff, to IDA for clearance. The plans will include, but not limited to, the names of the officers to be trained, the training institutions and/or facilitators, the cost contents, the justification for the training, and the estimated cost of the training.
141