nimsoft monitor saa monitor...
TRANSCRIPT

saa_monitor Guide v1.6 series
Nimsoft® Monitor™

Legal Notices Copyright © 2012, Nimsoft Corporation
Warranty
The material contained in this document is provided "as is," and is subject to being changed, without notice, in future editions. Further, to the maximum extent permitted by applicable law, Nimsoft Corporation disclaims all warranties, either express or implied, with regard to this manual and any information contained herein, including but not limited to the implied warranties of merchantability and fitness for a particular purpose. Nimsoft Corporation shall not be liable for errors or for incidental or consequential damages in connection with the furnishing, use, or performance of this document or of any information contained herein. Should Nimsoft Corporation and the user have a separate written agreement with warranty terms covering the material in this document that conflict with these terms, the warranty terms in the separate agreement shall control.
Technology Licenses
The hardware and/or software described in this document are furnished under a license and may be used or copied only in accordance with the terms of such license.
No part of this manual may be reproduced in any form or by any means (including electronic storage and retrieval or translation into a foreign language) without prior agreement and written consent from Nimsoft Corporation as governed by United States and international copyright laws.
Restricted Rights Legend
If software is for use in the performance of a U.S. Government prime contract or subcontract, Software is delivered and licensed as "Commercial computer software" as defined in DFAR 252.227-7014 (June 1995), or as a "commercial item" as defined in FAR 2.101(a) or as "Restricted computer software" as defined in FAR 52.227-19 (June 1987) or any equivalent agency regulation or contract clause. Use, duplication or disclosure of Software is subject to Nimsoft Corporation’s standard commercial license terms, and non-DOD Departments and Agencies of the U.S. Government will receive no greater than Restricted Rights as defined in FAR 52.227-19(c)(1-2) (June 1987). U.S. Government users will receive no greater than Limited Rights as defined in FAR 52.227-14 (June 1987) or DFAR 252.227-7015 (b)(2) (November 1995), as applicable in any technical data.
Trademarks
Adobe®, Acrobat®, Acrobat Reader®, and Acrobat Exchange® are registered trademarks of Adobe Systems Incorporated.
Intel® and Pentium® are U.S. registered trademarks of Intel Corporation.
Java(TM) is a U.S. trademark of Sun Microsystems, Inc.
Microsoft® and Windows® are U.S. registered trademarks of Microsoft Corporation.
Netscape(TM) is a U.S. trademark of Netscape Communications Corporation.
Oracle® is a U.S. registered trademark of Oracle Corporation, Redwood City, California.
UNIX® is a registered trademark of the Open Group.

Contact Nimsoft
For your convenience, Nimsoft provides a single site where you can access information about Nimsoft products.
At http://support.nimsoft.com/, you can access the following:
■ Online and telephone contact information for technical assistance and customer services
■ Information about user communities and forums
■ Product and documentation downloads
■ Nimsoft Support policies and guidelines
■ Other helpful resources appropriate for your product
Provide Feedback
If you have comments or questions about Nimsoft product documentation, you can send a message to [email protected].


Contents 5
Contents
Chapter 1: saa_monitor
This description applies to probe version up to 1.6x
IP SLA is embedded software within CISCO IOS devices that performs active monitoring. Active monitoring is the generation and analysis of traffic to measure performance between CISCO IOS devices or between CISCO IOS devices and network application servers. Active monitoring provides a unique set of performance measurements: network delay or latency, packet loss, network delay variation (jitter), availability, one-way latency, website download time, as well as other network statistics. IP SLA can be used to measure network health, verify service level agreements, assist with network troubleshooting, and plan network infrastructure. IP SLA is supported on almost all CISCO IOS devices. Enterprises and service providers routinely deploy IP SLA for network performance statistics and within IP networks that utilize quality of service (QoS), Voice over IP, security, Virtual Private Network (VPNs), and Multiprotocol Label Switching (MPLS). IP SLA eliminates the deployment of dedicated active monitoring devices by including the "probe" capabilities within CISCO IOS.
The Nimsoft saa_monitor retrieves existing ’probes’ from the CISCO equipment. These ’probes’ are configured using the CLI (Cisco CommandLine Interface) or other network utilities. To distinguish these ‘probes’ from the Nimsoft probes and thus avoid confusions, we use the term CISCO-probes in this description.

6 saa_monitor Guide
The Nimsoft saa_monitor probe monitors the following network services and parameters:
■ DHCP (Dynamic Host Configuration Protocol)
Measures the roundtrip time taken to discover a DHCP server and obtain a lease from it. The lease is then released after the operation.
■ DNS (Domain Name System)
Measures the time required to send a DNS request and receive a reply. If a hostname is specified, the operation queries for an IP, and vice versa.
■ Echo
Measures the time taken to send an ICMP (Internet Control Message Protocol) message to a destination and receive a reply.
■ FTP (File Transfer Protocol)
Measures the time required to transfer a file from a remote FTP server to the source.
■ HTTP (HyperText Transfer Protocol)
Measures the round trip time taken to connect and access data from a HTTP server.
■ Jitter
Measures the delay, delay variance, and packet loss in a network by generating syntetic UDP data. The operation sends a certain number of packets (specified by the "Packets" field), each of a certain size (specified by the "Packet size" field), a certain number of milliseconds apart. Requires a target which supports IP SLA agents.
■ PathEcho
Measures hop-by-hop response time between the source and target. The target can be any IP device and does not need to support IP SLA.
■ UDPEcho
Measures the UDP (User Datagram Protocol) response time between the source and target. The target must be a device which supports UDP Echo Service (UDP port 7) or another IP SLA agent.
■ TCPConnect
Measures the time taken by the source to perform a TCP (Transmission Control Protocol) connect operation to the target device (which can be any IP device and does not necessarily need to support IP SLA). Specify the target port number to test a specific TCP protocol (i.e. 21 (ftp), 22 (ssh), 23 (telnet), 80 (http), etc.).
■ RTP (Real-Time Transport Protocol-based VOIP)
■ Requires IOS ver 12.4(4)T or later and IP Voice or higher grade package).
■ Source router must have a network module with a C5510 or C549 DSP.

Chapter 1: saa_monitor 7
Provides capability to set up and schedule a test call and use Voice Gateway digital Processors (DSPs) to gather performance related statistics for the call (jitter, packet loss, MOS, R-factor).
Application example
Applications such as Voice over IP (VoIP) are susceptible to network behaviors, referred to as delay and jitter, which can degrade the voice application to the point of being unacceptable to the average user.
Delay is the time taken from point-to-point in a network. VoIP typically tolerates delays up to 150 ms before the quality of the call is unacceptable.
Jitter is the variation in delay over time from point-to-point. If the delay of transmissions varies too widely in a VoIP call, the call quality is greatly degraded. For example, if a source sends multiple packets to a destination at 15 millisecond intervals, and if the network is functioning optimally, the destination should receive the packets at 15 milliseconds intervals.
However, inconstiencies (such as travelling through different routers, processing delays, etc.) can cause the packets to arrive a little less than or greater than 15 milliseconds apart. Positive jitter means that the packets arrived at intervals greater than 15 milliseconds. If they arrived 17 milliseconds apart, then the positive jitter is equal to 2 milliseconds. The ideal jitter for delay sensitive applications is zero.
The amount of jitter tolerable on the network is affected by the depth of the jitter buffer on the network equipment in the voice path.
Packet loss is losing packets along the data path, which severely degrades the voice application.
It is important to assess the delay, jitter, and packet loss on the data network in order to determine if the voice applications work.
Measuring delay, jitter and packet loss on the network
Delay, jitter, and packet loss are measured by deploying jitter CISCO-probe routers as agents to simulate customer end stations. These probes are configured to send a number of packets of a specified size at a specified interval for a round-trip. The round-trip time is measured and the delay, jitter and number of lost packets is calculated.
Monitoring the CISCO-probes
In addition to the management of the CISCO-probes (make new, edit, delete and activate/deactivate), you may use the saa_monitor to monitor these probes.

8 saa_monitor Guide
You may create monitors retrieving measured values from the different CISCO-probes and send the measured values as QoS messages, and also check if the values exceed defined thresholds.
For troubleshooting purposes, you may for example create a CISCO-probe using a significantly higher sample rate than the existing ones and then connect an interactive monitor.
CISCO-probe management
The saa_monitor can perform management tasks, such as:
■ Create new or delete CISCO-probes
■ Edit existing monitoring properties.
Note that the CISCO-probes’ configuration data is located on the CISCO device(s) monitored.

Chapter 1: saa_monitor 9
saa_monitor Configuration
The saa_monitor is configured by double-clicking the probe in the Infrastructure Manager, which brings up the configuration tool.
Where is the configuration data stored?
The configuration is divided into two parts:
■ A CISCO-probe part, which is stored on the monitored CISCO equipment. These are parameters related to the CISCO-probe measurements, such as source and target, packet size, number of packets to be sent, frequency etc.
Note that a copy is stored on the computer hosting the Nimsoft saa_monitor probe and will automatically be copied to the monitored CISCO equipment if necessary (if the configuration parameters were lost due to a restart of the CISCO equipment, for example). This requires, however, that the Make probe configuration persistent option is checked on the properties dialog for the CISCO-probes (the Advanced tab for Monitor settings). Note that this must be done individually for each CISCO-probe.
■ A saa_monitor part, which is stored on the computer hosting the saa_monitor probe. This is monitoring parameters, such as alarm and QoS settings.

10 saa_monitor Guide
The window consists of a row of tool buttons and two panes.
The left pane
The left-pane shows the various groups and all agent hosts belonging to a group. Selecting an agent, all CISCO-probes detected (or created) for that agent are listed in the left pane.
By expanding an agent in the pane, you will find that the CISCO-probes for the selected agent are put into different groups, dependant of probe type (dns, echo, http, jitter etc.).
For some agents, you will also find the Scheduling icon.

Chapter 1: saa_monitor 11
This means the agent is enabled for Multiple Operations Scheduling (see the section Using Multiple Operations Scheduling). This means the agent is running IOS 12.3(14)T or later.
Right-clicking in the pane opens a pop-up menu, giving you the following possibilities:
■ New
Opens the profile dialog, enabling you to define a new group, or a new agent to be monitored.
■ Edit
Available only when an agent is selected.
Opens the profile dialog for the selected agent, enabling you to modify the properties for the agent.
■ Rename
Lets you rename the selected group or host.
■ Delete
Available only when a group is selected.
Lets you delete the selected group.
■ Refresh
Available only when an agent is selected.
Makes a refreshes to reflect the current list of monitored probes on the selected host.
■ Reload
Retrieves updated configuration information from the selected agent.
■ Information
Available only when an agent is selected.
Opens a dialog containing system and configuration information for the selected device.
Note the Responder Status drop-down menu, allowing you to enable or disable the responder for probes using a responder, if involved (e.g. jitter, tcp and udp).
If changing the state, the Apply button below the drop-down menu is activated. Clicking this button activates the new setting.

12 saa_monitor Guide

Chapter 1: saa_monitor 13
Note the symbols in the left pane, indicating if a monitored host responds or not:
Indicates that the host responds.
Indicates that the host does not respond.
Indicates that the host responds, but has no monitored interfaces.
The right pane
The right-pane is multifunctional and shows:
■ Hosts when a group is selected in the left-pane.
■ CISCO-probes (with data specific to the probe) when an agent is selected in the left-pane.
Note the meaning of the different probe icons in the window (see also the section Probe status for probe status information):
This indicator may be green (means OK), red (indicates an error situation), black (means the probe is not active) or yellow (the last operation performed by the probe failed).
This indicator means that we have a configuration locally stored which is deleted on the CISCO equipment.
Right-clicking in the pane gives you the following possibilities:
■ New
Opens the probe properties dialog, enabling you to define a new CISCO-probe to be monitored. This option is available only when a host is selected in the left window pane.
■ Copy
Opens the probe properties dialog for the selected CISCO-probe, enabling you to define a new one, based on the properties of the selected probe.
■ Edit
Opens the properties dialog for the selected CISCO-probe, enabling you to modify the properties.
■ Delete
Deletes the selected CISCO-probe(s) (multi-select), depending on what is displayed in the window pane.
■ Activate
Activates the selected CISCO-probe(s) (multi-select), makes it start measuring and monitoring tasks.
■ Deactivate

14 saa_monitor Guide
Deactivates the selected CISCO-probe(s) (multi-select), makes it stop its measurement and monitoring tasks.
■ Monitor
Opens the monitor window and starts monitoring the selected CISCO-probe, where you can watch the graphs being filled.

Chapter 1: saa_monitor 15
Note: Right-clicking in the right pane when a Scheduling icon is selected in the left pane opens a small menu enabling you to add, edit or delete groups of probes to be scheduled (see Using Multiple Operations Scheduling).
The tool buttons
The configuration tool also contains a row of tool buttons:
■ The General Setup button
■ The New Group Folder button
■ The Add new SA Agent button
■ The Message Pool Manager button
■ The Set Default Probe Parameters button
■ The Multiple Scheduling Operations button
General Setup

16 saa_monitor Guide
Clicking the General Setup button opens the General Setup dialog.
Field Description
General
Log-level Set the detail level for messages logged to the log-file.
Advanced
Community String Specify (add or delete) SNMP community strings to be used.
Concurrent sessions Specifies the number of concurrent parallel sessions.
SNMP request timeout Select the timeout value for the SNMP requests. Use the default value, or select another value (in seconds) from the drop-down list.
Show SNMP Error In the case of an SNMP error, a general error message appears on the screen.
If this option is checked, you will get a more detailed error message, describing the specific error that occurred.
Chapter 1: saa_monitor 17
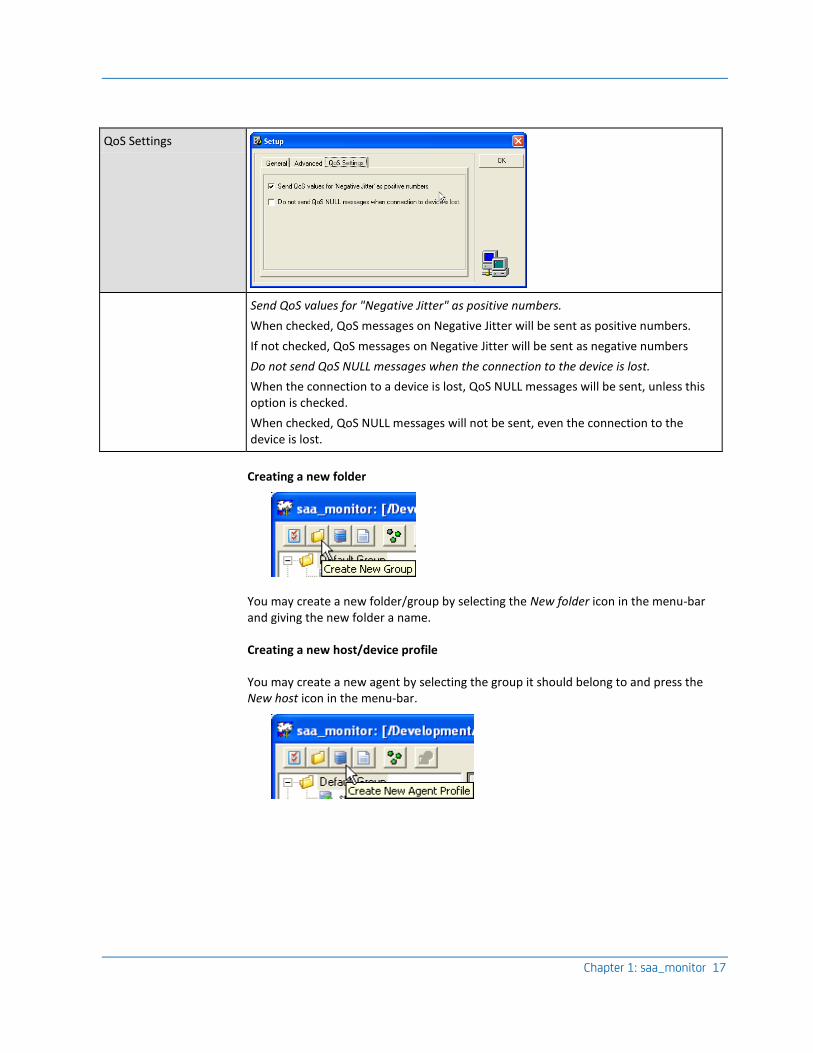
QoS Settings
Send QoS values for "Negative Jitter" as positive numbers.
When checked, QoS messages on Negative Jitter will be sent as positive numbers.
If not checked, QoS messages on Negative Jitter will be sent as negative numbers
Do not send QoS NULL messages when the connection to the device is lost.
When the connection to a device is lost, QoS NULL messages will be sent, unless this option is checked.
When checked, QoS NULL messages will not be sent, even the connection to the device is lost.
Creating a new folder
You may create a new folder/group by selecting the New folder icon in the menu-bar and giving the new folder a name.
Creating a new host/device profile
You may create a new agent by selecting the group it should belong to and press the New host icon in the menu-bar.

18 saa_monitor Guide
A dialog-box will appear and prompt you for the hostname or IP-address to the CISCO device to monitor. Enter the requested data.
Launching the Message Pool Manager
The Message Pool Manager can be opened by clicking the Message Pool button in the Tool bar.
The alarm messages for each alarm situation are stored in the Message Pool. Using the Message Pool Manager, you can customize the alarm text, and you may also create your own messages.
Note that variable expansion in the message text is supported. If typing a ‘$’ in the Alarm text field, a dialog pops up, offering a set of variables to be chosen.
Setting the default probe parameters
You may edit the default parameters automatically presented in the property dialog appearing when creating a new CISCO-probe.

Chapter 1: saa_monitor 19
See the section Defining Probe Configuration Parameters for a description of the probe properties.
Setting multiple operations scheduling
Agents running IOS 12.3(14)T or later are enabled for Multiple Operations Scheduling. This tool button is activated only when such an agent is selected, otherwise it is greyed out.
See the section Using Multiple Operations Scheduling for a description of the probe properties.
Defining a new Host
When you first start up the saa_monitor, you must first define a host before you can define any CISCO-probes. Left-clicking an agent in the left pane and selecting New allows you to define new agents:
Note that probe management requires read/write access community to allow storing of Nimsoft probe configurations.

20 saa_monitor Guide
Field Description
Active Activates monitoring of the selected agent profile.
Agent hostname or IP address
The host name or IP-address of the agent to be monitored.
Group Select the name of the group to which you want the host to belong.
Alarm Message The alarm message to be issued if the host doesn’t respond. Using the Message pool, you can edit this message or add other messages.
SNMP Version The SNMP software version number supported by the monitored device.
Authentication Type of authentication strategy (none, HMAC-MD5-96 or HMAC-SHA-96). Applies to SNMPv3 only.
Port The port to be used by the SNMP device. Default is 161.
Timeout Select the timeout value for the SNMP requests. Use the default value, or select another value from the drop-down list.
The default value is 1 second.
Retries Set the number of times to send SNMP requests without response from the device before giving up, regarding the device as not available.
The default number of retries is 5.
Community /password Select the SNMP community string to be used from the drop-down list (these community strings must have been created on the monitored device). Probe management requires read / write access community to be allowed to store CISCO-probe configurations created by the saa_monitor on the CISCO device.
Show Community /password
When checked, the entry in the password field will be shown as plain text.
Username Here you can specify a username defined on the monitored device. Applies to SNMPv3 only.
Security The security level for the user. Valid levels are NoAuthNoPriv, AuthNoPriv, and AuthPriv.
Priv. Protocol The privacy protocol to use.
Priv Passphrase
Your privacy passphrase; not needed if the security level is NoAuthNoPriv or AuthNoPriv. Must be at least eight characters long.
Test Clicking this button checks if the device is responding or not.
Description Optional description of the profile.

Chapter 1: saa_monitor 21
Defining Probe Configuration Parameters
Note that the parameters described in this section also apply when defining a new CISCO-probe and defining monitoring properties.
Note the warning at the bottom of the dialog. A warning like this will appear for probe types requiring a target device, set up as a SAA responder for its operation.
The following parameters can be modified (all other parameters must be edited after the CISCO-probe has been created):
Configuration Settings
Field Description
RTR Index An index identifying the different RTRs.

22 saa_monitor Guide
RTR Type RTR: Response Time Record. Select type of probe (type of RTR operation to be executed) from the pull-down menu:
- DHCP
- DNS
- Echo
- FTP
- HTTP
- jitter
- PathEcho
- UDPEcho
- TCPConnect
NOTE: This list depends on RTR types available on the target device.
TOS The number in this field (TOS - Type Of Service) indicates the packet precedence and type of service. This is useful for monitoring per-class traffic. Valid values are between 0 qnd 255. If you don’t know what this is, just leave the default of "0".
Precedence TOS 0 0 1 32 2 64 3 96 4 128 5 160
6 192
7 (highest) 224
This object is not applicable to dhcp and dns.
Frequency This is the probes’ check interval (how often the probe is executed).
Source IP Address A string that specifies the IP address of the source (the device sending packets). Specifying the source IP address can be useful when running the CISCO-probe on a device with multiple IP addresses. You can then force the packets to travel through a specific interface.
If you don’t know what to put here, just leave it as the default "0.0.0.0".
This object is applicable to all probes except dns and sna."
Source Port This object represents the source's port number. If this object is not specified, the application will get a port allocated by the system. This object is applicable to all probes except dns and sna.
Packet size The size of the packets to be sent (in bytes).
Packets This value represents the number of packets to be transmitted. This value is currently used for Jitter probes only.
Chapter 1: saa_monitor 23
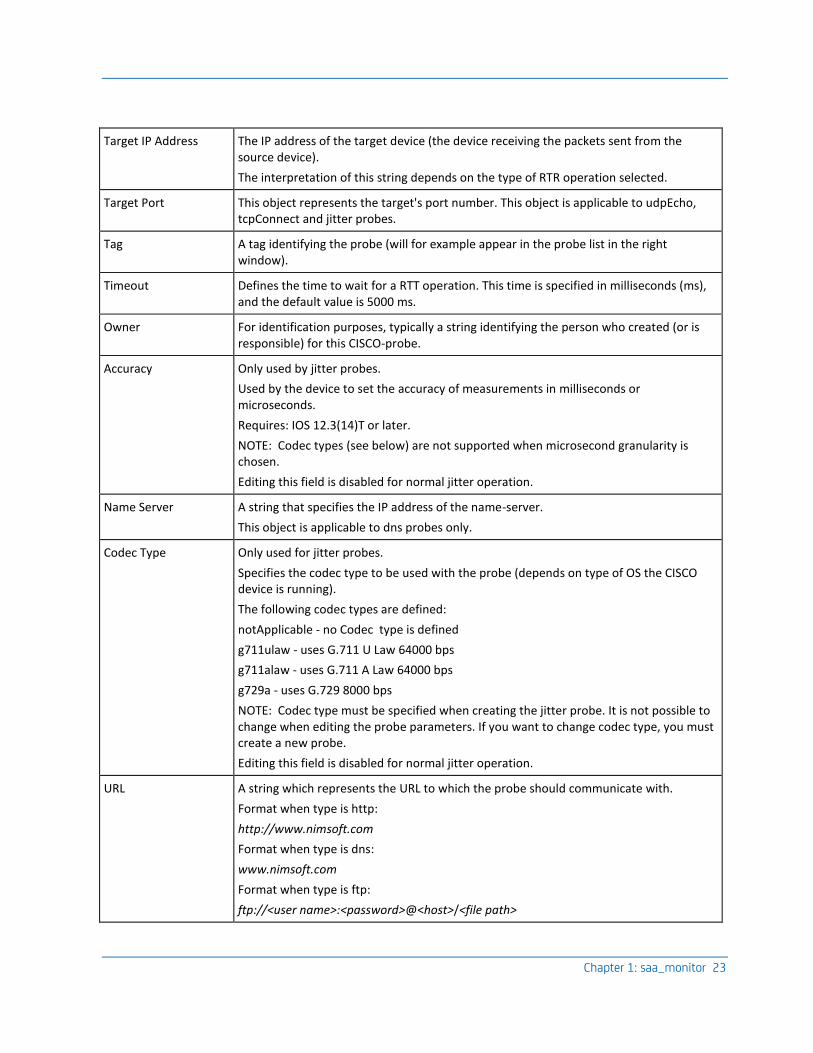
Target IP Address The IP address of the target device (the device receiving the packets sent from the source device).
The interpretation of this string depends on the type of RTR operation selected.
Target Port This object represents the target's port number. This object is applicable to udpEcho, tcpConnect and jitter probes.
Tag A tag identifying the probe (will for example appear in the probe list in the right window).
Timeout Defines the time to wait for a RTT operation. This time is specified in milliseconds (ms), and the default value is 5000 ms.
Owner For identification purposes, typically a string identifying the person who created (or is responsible) for this CISCO-probe.
Accuracy Only used by jitter probes.
Used by the device to set the accuracy of measurements in milliseconds or microseconds.
Requires: IOS 12.3(14)T or later.
NOTE: Codec types (see below) are not supported when microsecond granularity is chosen.
Editing this field is disabled for normal jitter operation.
Name Server A string that specifies the IP address of the name-server.
This object is applicable to dns probes only.
Codec Type Only used for jitter probes.
Specifies the codec type to be used with the probe (depends on type of OS the CISCO device is running).
The following codec types are defined:
notApplicable - no Codec type is defined
g711ulaw - uses G.711 U Law 64000 bps
g711alaw - uses G.711 A Law 64000 bps
g729a - uses G.729 8000 bps
NOTE: Codec type must be specified when creating the jitter probe. It is not possible to change when editing the probe parameters. If you want to change codec type, you must create a new probe.
Editing this field is disabled for normal jitter operation.
URL A string which represents the URL to which the probe should communicate with.
Format when type is http:
http://www.nimsoft.com
Format when type is dns:
www.nimsoft.com
Format when type is ftp:
ftp://<user name>:<password>@<host>/<file path>

24 saa_monitor Guide
Vrf name Available for jitter’ and ‘echo’ probes.
This field is used to specify the VPN name in which the RTT operation will be used. The agent will use this field to identify the VPN routing Table for this operation.
The field should NOT be configured for regular RTT operation.
Note: A Vrf name is case sensitive.
Source Voice Port Only used by rtp probes.
This is a string specifying the voice-port on the source gateway.
The probe requires IOS 12.4(4)T or later with a c5510 or c549 DSP on the source router.
Note: Editing is disabled for all the above fields during ICMP jitter operation.
Monitor Settings
Fields Description
Identification Name A name identifying the monitor. If nothing is specified here, the tag specified in the Configuration Settings part for the CISCO-probe automatically will be used.
Alarm tag
Time Period The average value to be compare against the threshold value is computed over the specified time period.
Round Trip Time This is the RTT (Round Trip Time) threshold. If the average value computed over the specified time period exceeds the round trip time specified, an alarm message will be issued.

Chapter 1: saa_monitor 25
Alarm Message The alarm message selected here will be issued if average value computed over the specified time period exceeds the round trip time specified.
Packet Loss This is the Packet Loss threshold. If the average percentage packet loss over the specified time period exceeds this entry, the selected alarm message will be issued.
Average Jitter This is the Average Jitter threshold. If the average jitter computed over the specified time period exceeds this entry, the selected alarm message will be issued.
Average Latency This is the Average Latency threshold. If the average latency computed over the specified time period exceeds this entry, the selected alarm message will be issued.
Alarm on one-way Latencies instead of total
If checked, alarms will be issued if either SD or DS (or both) exceed the Latency threshold specified (instead of total latency (SD + DS)).
Quality of Service Tag
Field Description
Round Trip Time If checked, Round Trip Time QoS messages will be sent.

26 saa_monitor Guide
Jitter Specific Quality of Service
Here you may select QoS messages to be sent on the following services:
PACKET LOSS:
When checked QoS messages will be sent on Packet loss (in percentage).
Packet loss is calculated in %.
Packets lost SD (%) = (Packets lost SD / Total packets Sent) * 100
Packets lost DS (%) = (Packets lost DS / Total packets Sent) * 100
Total Packets Lost is calculated as follows:
Packet loss Total (%) = ( (Packets lost SD + Packets lost DS + Packets Missing In Action + Packets Late Arrival + Packets Out of Sequence) / Total Packets sent ) * 100
------------------------------------------------------------------------
AVERAGE LATENCY
Average latency is measured in milliseconds.
Example:
If average latency SD = 1 ms and average latency DS = 2ms
Total Average Latency = avg latency SD + avg latency DS = 3 ms.
------------------------------------------------------------------------
AVERAGE JITTER:
When checked, QoS messages will be sent on the average jitter.
You have the option to select the QoS values for one of the following:
Total: This is the sum of the average value of the positive and negative jitter, round trip measurement (source – destination– source). The value is measured in ms.
Example:
Positive jitter source - destination = 4
Negative jitter source - destination = -3
Total jitter source – destination = 7
Positive jitter destination – source = 6
Negative jitter destination – source = -2
Total jitter destination – source = 8
Total round trip jitter is (7 + 8) =15 ms
SD+DS: Same as above, but the values for source – destination and destination - source are presented separately.
Using same example as above, the QoS values will be 7 ms and 8 ms.
Total and SD+DS:
In this case the QoS will contain all three values described above: Total, SD and DS.
Using same example as above, the QoS values will be 15 ms (total), 7 ms (DS) and 8 ms (SD).
------------------------------------------------------------------------
POS. AND NEG. JITTER:
The same options as for AVERAGE JITTER (see above), but in this case, the positive and negative jitter values will not be summed, but the values will be presented separately.
Total: Using the values from the example above, the QoS will contain the following values:
Total positive jitter (4+6) = 10 ms
Total negative jitter (3+2) = 5 ms
SD+DS: Using the values from the example above, the QoS will contain the following values:
Positive jitter source – destination = 4 ms

Chapter 1: saa_monitor 27
HTTP Specific Quality of Service
Here you may select QoS messages to be sent on the following services (applicable to HTTP type probes only):
- URL Response
- DNS Response
- TCP Connect
The QoS messages will be stored in the Nimsoft SLM system. Note that the TCP Connect QoS data will be placed in the Network Connectivity Response group.
RTP Specific Quality of Service
Here you may select QoS messages to be sent on the following services (applicable to RTP type probes only):
Packet loss destination to source path (%).
R-Factor at the source.
MOS – Conversational Quality at Source (MOS = Mean Opinion Score).
Inter arrival jitter at source.
The QoS messages will be stored in the Nimsoft SLM system.
Advanced
Field Description
Probe Configuration Error
Select an alarm message from the drop-down menu to be issued if probe configuration errors are detected.
Probe Run Error Select an alarm message from the drop-down menu to be issued if probe run errors are detected.
28 saa_monitor Guide
Make probe configuration persistent
The configuration parameters consist of a
saa_monitor part, which is stored on the computer hosting the saa_monitor probe and a
CISCO-probe part, which is stored on the monitored CISCO equipment.
A copy of this configuration is stored in the saa_monitor configuration file. When the ‘Persistent’ option is checked, the saa_monitor will ensure that the CISCO probe configuration will be running after a cold start of the CISCO device.
NOTE: Responders created using the CLI and stored to the CISCO ‘Startup configuration’ will be restored after a cold start, independent of the ‘Persistent’ option described above.
Responders created using the CLI will, if deleted from the saa_monitor, also be deleted from the CISCO ‘Running configuration’.
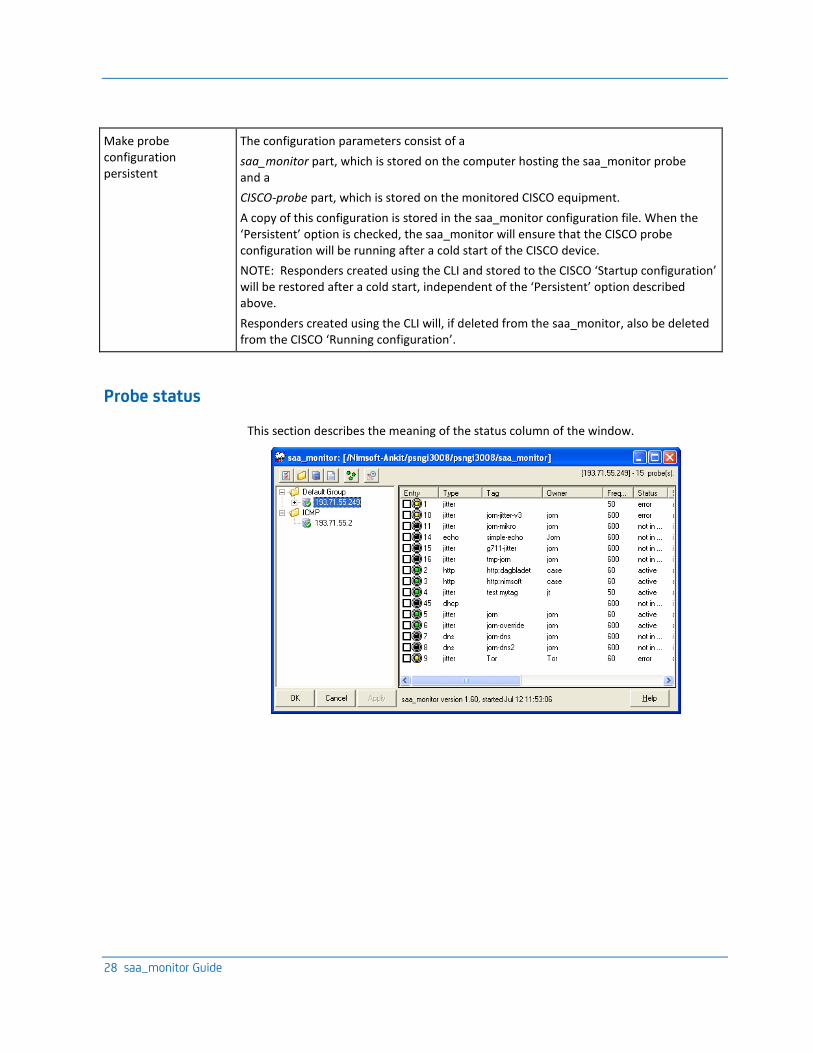
Probe status
This section describes the meaning of the status column of the window.

Chapter 1: saa_monitor 29
■ Ok
A valid completion occurred and timed successfully.
■ Active
The operation occurred successfully and connection to the target was established.
■ Disconnected
The operation did not occur because the connection to the target was lost
■ OverThreshold
A valid completion was received but the completion time exceeded a threshold value.
■ Timeout
An operation timed out; no completion time recorded.
■ Busy
The operation did not occur because a previous operation is still outstanding
■ NotConnected
The operation did not occur because no connection (session) exists with the target.
■ Dropped
The operation did not occur due to lack of internal resources.
■ SequenceError
A completed operation did not contain the correct sequence id; no completion time recorded.
■ VerifyError
A completed operation was received, but the data it contained did not match the expected data; no completion time recorded.
■ ApplicationSpecific
The application generating the operation had a specific error.
■ DnsServerTimeout
DNS Server Timeout.
■ TcpConnectTimeout
TCP Connect Timeout.
■ HttpTransactionTimeout
HTTP Transaction Timeout.
■ DnsQueryError
DNS Query error (because of unknown address, etc.).
■ HttpError

30 saa_monitor Guide
HTTP error is set when an HTTP Response StatusCode 200 (not OK) is received.
■ Not in service
The probe is not active or not deployed.
■ Error
Socket failures or other errors not relevant to the actual probe and not specified by any other status message.

Chapter 1: saa_monitor 31
Hints for your router configuration
Use the following configuration of the router(s), using the CLI - Cisco CommandLine Interface (or another network utility):
■ The name resolution settings (DNS)
Router1(config)# ip name-server x.x.x.x
Please note that some probes require a valid name-server setting, in order to resolve a host-name into an IP address.
This is necessary when using the http probe.
■ The RW community string setting
Router1(config)# snmp-server community RW <string>
Necessary when using the saa_monitor to maintain CISCO -probes.
In addition on the responder (if involved):
■ To enable jitter responder:
Router2 (config)# rtr responder
■ To enable TCP responder (on port 12345):
Router2 (config)# rtr responder type tcpConnect port 12345
■ To enable UDP responder (on port 12345):
Router2 (config)# rtr responder type udpEcho port 12345
Configuring a probe using CLI commands
This example shows how to configure an echo probe that executes an ICMP echo every 5 min. in the running configuration.
Router# conf term
Router(config)# rtr 555
Router(config-rtr)# type echo protocol ipIcmpEcho 193.71.55.151
Router(config-rtr-echo)# frequency 300
Router(config-rtr-echo)# tag echo-test
Router(config-rtr-echo)# owner myname
Router(config-rtr-echo)# exit
Router(config-rtr)# rtr schedule 555 life forever start-time now

32 saa_monitor Guide
Router# show rtr operational-state
Please note that the above configuration example only will be valid until the device is cold-started.
Save the commands into the configuration file for a more permanent solution.
From IOS 12.3, Cisco has announced:
The "rtr" keyword has been changed to "ip sla monitor". Therefore, all commands that use "rtr" are now replaced by the keywords "ip sla monitor".
Using Multiple Operations Scheduling
Agents running IOS 12.3(14)T or later are enabled for Multiple Operations Scheduling. Multiple operations scheduling allows you to schedule multiple IP SLA Operations in one operation. You can control the amount of IP SLA monitoring traffic by scheduling the operations to run at evenly distributed times.

Chapter 1: saa_monitor 33
Clicking the Multiple Operations Scheduling tool button opens the Multiple Operations Scheduling dialog (note that the tool button is activated only when such an agent is selected, otherwise it is greyed out).

34 saa_monitor Guide
1. Select probes to be scheduled
Select probes to be scheduled in the left pane. Click the Add probe to group button to move them over to the right pane.
2. Select Schedule period
The schedule period is the time frame over which the IP SLAs operations automatically are distributed (at equal intervals).
3. Select Frequency
The time range over which all the IP SLAs operations should start (frequency).
4. Click OK to save the settings and exit the dialog
The spacing (in time) between the operations is calculated by the scheduler and the operations are started. The distribution of IP SLA operations helps minimize the CPU utilization and thereby enhances the scalability of the network.
A main benefit for scheduling multiple IP SLAs operations is that the load on the network is reduced by distributing the operations equally over a scheduled period. This distribution helps you to achieve more consistent monitoring coverage. To illustrate this scenario, consider configuring 60 operations to start during the same 1-second interval over a 60-second schedule period. If a network failure occurs 30 seconds after all 60 operations have started and the network is restored before the operations are due to start again (in another 30 seconds), then this failure would never be detected by any of the 60 operations. However, if the 60 operations are distributed equally at 1-second intervals over a 60-second schedule period, then some of the operations would detect the network failure. Conversely, if a network failure occurs when all 60 operations are active, then all 60 operations would fail, indicating that the failure is possibly more severe than it really is.
Note It is recommended (but not required) to use the same type of operation in one "schedule group".
If operations have different frequencies before they are joined in a "schedule group" the "group frequency" will take over, and all operations will be scheduled with the same frequency (That’s the whole idea!).
For details, see http://www.cisco.com/univercd/cc/td/doc/product/software/ios124/124cg/hsla_c/hsmulti.pdf http://www.cisco.com/univercd/cc/td/doc/product/software/ios124/124cg/hsla_c/hsmulti.pdf.
Chapter 1: saa_monitor 5
saa_monitor Configuration .......................................................................................................................................... 9
Defining a new Host ............................................................................................................................................ 19
Defining Probe Configuration Parameters .......................................................................................................... 21

Chapter 1: saa_monitor 35
Probe status ........................................................................................................................................................ 28
Hints for your router configuration ............................................................................................................................ 31
Using Multiple Operations Scheduling ....................................................................................................................... 32