njdep - njgws - tm 12-1, results of an aquifer test in ... · 1 results of an aquifer test in...
TRANSCRIPT
NEW JERSEY GEOLOGICAL &
WATER SURVEY
Technical Memorandum 12-1
Results of an Aquifer Test in Chatham Borough,
Morris County, New Jersey, May 1992
New Jersey Department of Environmental Protection

ii
STATE OF NEW JERSEY
Chris Christie, Governor
Kim Guadagno, Lieutenant Governor
Department of Environmental Protection
Bob Martin, Commissioner
Water Resources Management Michele Siekerka, Assistant Commissioner
New Jersey Geological & Water Survey
Karl Muessig, State Geologist
NEW JERSEY DEPARTMENT OF ENVIRONMENTAL PROTECTION
The mission of the New Jersey Department of Environmental Protection is to assist the residents of New
Jersey in preserving, sustaining, protecting and enhancing the environment to ensure the integration of high
environmental quality, public health and economic vitality.
NEW JERSEY GEOLOGICAL & WATER SURVEY
The mission of the New Jersey Geological & Water Survey is to map, research, interpret and provide scien-
tific information regarding the state's geology and groundwater resources. This information supports the
regulatory and planning functions of DEP and other governmental agencies and provides the business
community and public with information necessary to address environmental concerns and make economic
decisions.
for more information contact:
New Jersey Department of Environmental Protection
New Jersey Geological & Water Survey
P.O. Box 420
Trenton, NJ 08625-0427
(609) 984-6587
http://www.njgeology.org/
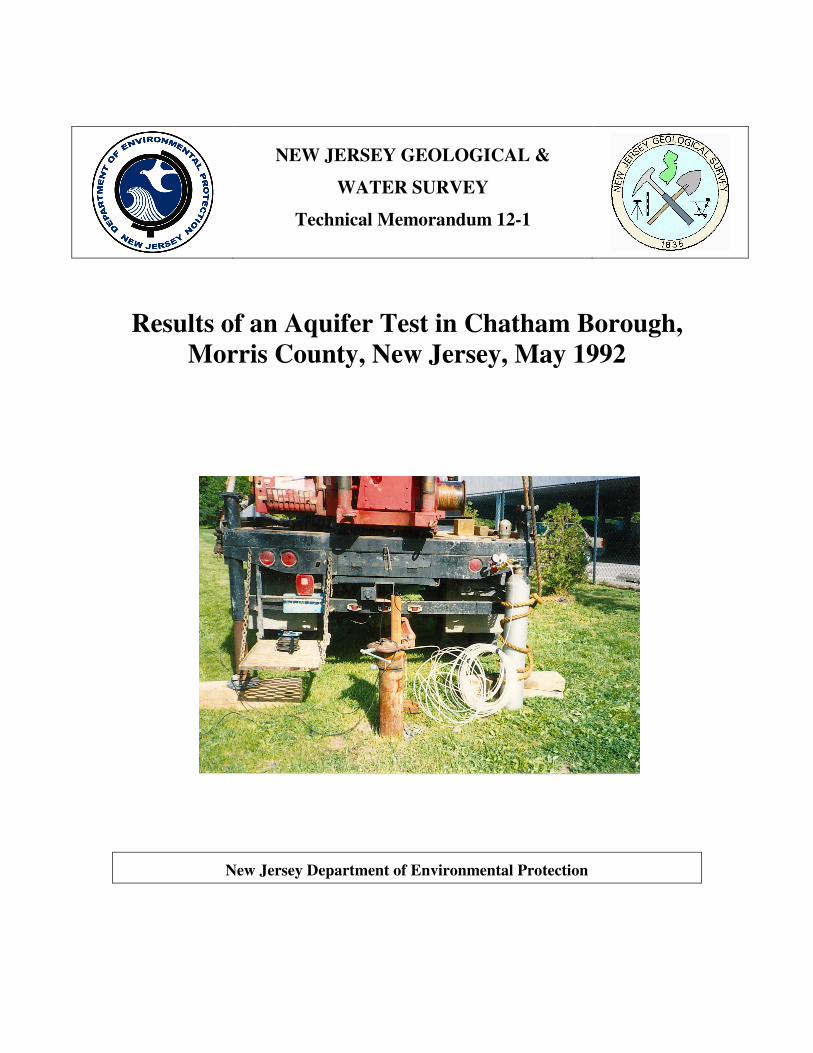
On the cover:
The Sheppard Kollock Park deep observation well in May 1992. A packer is in this
well. The cylinder to the right of the well contains nitrogen which inflates the packer.
.
iii
Results of an Aquifer Test in Chatham Borough,
Morris County, New Jersey, May 1992
by
Jeffrey L. Hoffman
2012
Table of Contents
Abstract ............................................................................................................................................1
Introduction ......................................................................................................................................2
Acknowledgements ...............................................................................................................2
Location ...........................................................................................................................................3
Geology and hydrogeology ..............................................................................................................6
Observation wells.............................................................................................................................7
Pretest water levels ........................................................................................................................12
Test procedure ................................................................................................................................13
Sheppard Kollock Park observed water levels with analysis ........................................................15
Buried-valley aquifer water levels ......................................................................................15
Bedrock aquifer water levels ..............................................................................................17
Memorial Park observed water levels with analysis .....................................................................17
Conclusions ....................................................................................................................................20
References ......................................................................................................................................22
Figures
Figure 1. Chatham Borough in northern New Jersey ....................................................................3
2. Chatham Borough with nearby wells and well fields ....................................................3
3. Physiography of the Central Passaic River Basin. .........................................................4
4. Buried valleys in the Central Passaic River Basin ..........................................................5
5-7. Maps of the Chatham Borough area
5. Buried valleys .......................................................................................................6
6. Bedrock geology ...................................................................................................6
7. Surficial geology ..................................................................................................7
8. Groundwater withdrawals in the Central Passaic River Basin .......................................7
9. Sheppard Kollock Park and nearby wells .......................................................................8
10. Memorial Park and nearby wells ..................................................................................10
11-12. Hourly water levels in Sheppard Kollock Park observation well
11. All 1991 levels with Passaic River well field withdrawals.................................12
12. February 1991 levels ..........................................................................................12

iv
Figures (continued)
13. Withdrawals from the New-Jersey American well field and Chatham
Borough well field, May 20-22, 1992 ..................................................................13
14-16. Sheppard Kollock Park observation well data and analysis
14. Water levels and reported withdrawals ...............................................................15
15. Analysis of overburden drawdown ....................................................................16
16. Water levels in bedrock zones ............................................................................17
17-18. Chatham Recreation Field observation well data and analysis
17. Water levels and reported withdrawals ................................................. 19TM12-1
18. Analysis of drawdown . .......................................................................................19
Tables
Table 1. Geologic column of the Central Passaic River Basin .......................................................9
2. Well information ..............................................................................................................11
3. Withdrawal times and volumes ........................................................................................13
4. Distances from observation wells to pumping wells .......................................................14

v
New Jersey Geological & Water Survey Reports (ISSN 0741-7357) are published by the New Jersey Geological
& Water Survey, PO Box 420, Trenton, NJ 08625-0420. This report may be reproduced in whole or part pro-
vided that suitable reference to the source of the copied material is provided.
More information on NJGWS reports is available on the Survey's website:
www.njgeology.org
Note: Any use of trade, product, or firm names in this publication is for descriptive purposes only and does
not imply endorsement by the New Jersey state government.
"Ground-water systems are dynamic and adjust continually to short-term and long-term changes in climate,
ground-water withdrawal and land use. Water-level measurements from observation wells are the principal
source of information about the hydrologic stresses acting on aquifers and how these stresses affect ground-
water recharge, storage, and discharge" --- Taylor and Alley, 2001.

1
Results of an Aquifer Test in Chatham Borough,
Morris County, New Jersey, May 1992
by
Jeffrey L. Hoffman
2012
Abstract
The New Jersey Geological & Water Survey (NJGWS) conducted a 72-hour aquifer test
in Chatham Borough, Morris County, New Jersey, in May 1992. The test yielded infor-
mation on aquifer properties and on the hydraulic connections between the unconsolidat-
ed sand-and-gravel aquifer, the upper bedrock zone, and a lower bedrock zone. In this
area the overburden sand-and-gravel aquifer is termed the buried-valley aquifer given its
location in a buried bedrock depression. The test consisted of a 24-hour background peri-
od, a 24-hour pumping period, and a 24-hour recover period.
The NJGWS measured water levels at three wells in Chatham Borough -- two wells in
Sheppard Kollock Park and one well in Memorial Park. In Sheppard Kollock Park the
shallow well (136’ deep and called SKP-shallow) is in the buried-valley aquifer. The
deeper well (241’ deep and called SKP-deep) is in the bedrock Towaco Formation. Dur-
ing the pumping period an inflatable packer in the SKP-deep allowed measurement of
water levels in upper and lower bedrock zones. The third well, in Memorial Park, is 197’
deep, called the Recreation Field well, and is completed in the buried-valley aquifer.
Two nearby well fields created the drawdowns observed during the test. Both well fields
tap the buried-valley aquifer. The New Jersey-American Water Company's Passaic River
well field consists of two wells, PR51 and PR52. During the entire 72-hour test the PR51
was pumped at 600 gpm. During the 24-hour pumping period PR52 was pumped at 600
gpm. PR52 was not pumped during the background or recovery periods. The Chatham
Borough Water Department’s well field consists of three production wells which were
pumped as needed during the aquifer test at a combined rate of 1,050 gpm.
Water levels at Sheppard Kollock Park fluctuated in response to pumpage at the nearby
Passaic River well field. Water levels in the upper bedrock zone were nearly identical to
that of water levels in the overlying buried-valley aquifer. The lower bedrock zone had
water levels 3’ to 3.5’ lower than levels in the upper bedrock zone. Water levels in both
zones of the bedrock aquifer fluctuated in response to pumpage in the buried-valley aqui-
fer. This shows that the buried-valley aquifer is in direct hydraulic contact with the bed-
rock and that there is a good hydraulic connection between the upper and lower bedrock
zones. A Theis analysis of drawdown in the shallow Sheppard Kollock Park well yields a
transmissivity of 8,088 ft2/day with a storativity of .000785.

2
A leaky-aquifer (Hantush) multi-pumping-well analysis of drawdown at the Recreation
Field observation well in Memorial Park results a transmissivity of 5,804 ft2/day, a stora-
tivity of 0.00286, and a leakance of 3,675 feet. These aquifer properties are reasonable
values for the buried-valley aquifer in southeastern Morris County.
Introduction
The New Jersey Geological & Water Survey (NJGWS), in conjunction with the New Jer-
sey-American Water Company ( NJAWC) and the Chatham Borough Water Department
(CBWD), conducted an aquifer test in Chatham Borough, Morris County, New Jersey, in
May 1992. The goals were to investigate the hydraulic connection between the overlying
buried-valley aquifer, the upper bedrock zone, and a lower bedrock zone, and to deter-
mine aquifer properties.
Aquifer properties are determined by analyzing water level changes due to pumping. This
process is called an aquifer test. Under the best scenario, water-levels changes in an ob-
servation well are caused by controlled withdrawals in a pumping well and are monitored
at frequent intervals. All outside influences on the water level are either eliminated or
controlled.
During this test the NJGWS monitored water levels in two observation wells in Sheppard
Kollock Park in eastern Chatham Borough. The shallow well (SKP-shallow) was drilled
to the bedrock surface and allowed measurement of water level in the sand-and-gravel
buried-valley aquifer. The deeper well (SKP-deep), completed in the underlying Towaco
Formation, allows water-level measurements in the bedrock aquifer. During the aquifer
test a packer was inflated in the SKP-deep to temporarily create two zones, shallow and
deep. This allowed observation of the vertical movement of water in the bedrock at the
site during the test. NJGWS also monitored water levels in the Recreation Field observa-
tion well in Chatham's Memorial Park.
Water level changes were caused by a pulsing of pumpage at New Jersey-American's
nearby Passaic River well field. The Chatham Borough Water Department’s wells were
pumped as needed.
Acknowledgements
Many groundwater professionals assisted in the conduct of this aquifer test. Dave Travis
and Mike Zack of the NJGWS drilled the Sheppard Kollock Park observation wells.
Mark French, Ken Bacorn, Mike Zack, Jeff Waldner, and Jim Boyle of NJGWS installed
and inflated the packer, installed water-level monitoring equipment, and recorded water
levels. Herb Canon, Chatham Borough Engineer, assisted with selection of an appropriate
3
location and obtaining permission to drill the Sheppard Kollock Park observation wells.
He also monitored Chatham's pumpage. Tony Tigre and Bill Osterly of New Jersey-
American Water Company supervised the controlled withdrawals at their Passaic River
well field.
Location
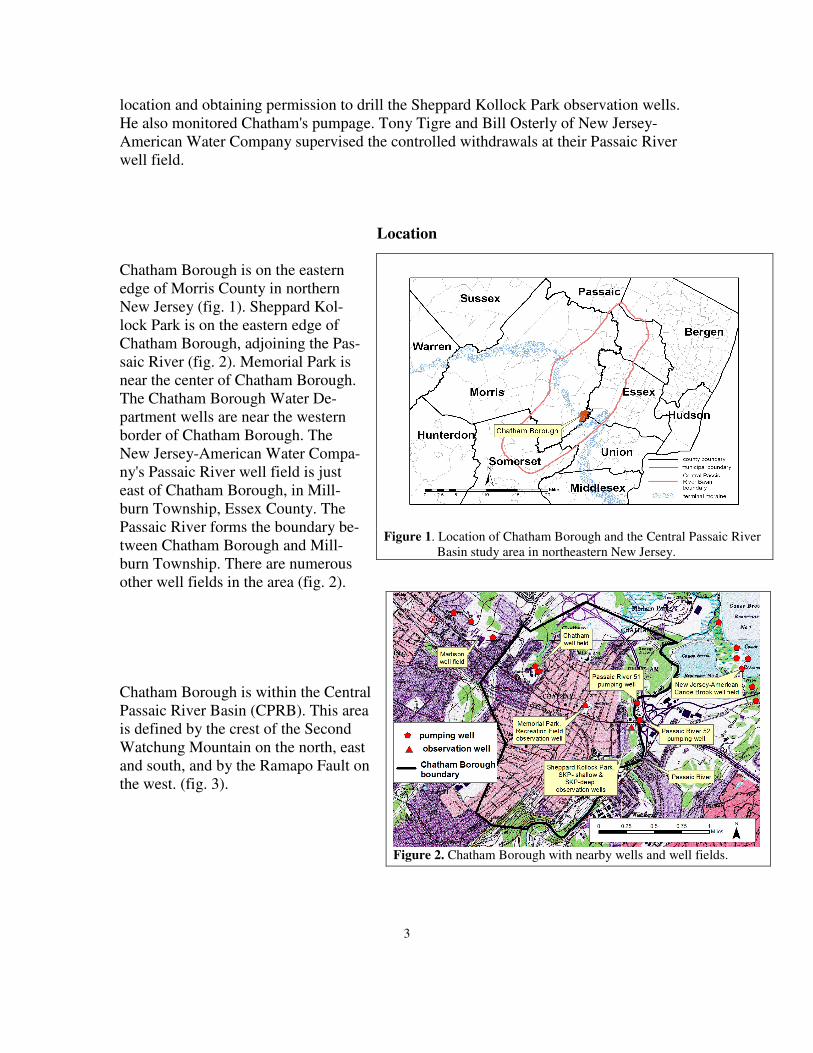
Chatham Borough is on the eastern
edge of Morris County in northern
New Jersey (fig. 1). Sheppard Kol-
lock Park is on the eastern edge of
Chatham Borough, adjoining the Pas-
saic River (fig. 2). Memorial Park is
near the center of Chatham Borough.
The Chatham Borough Water De-
partment wells are near the western
border of Chatham Borough. The
New Jersey-American Water Compa-
ny's Passaic River well field is just
east of Chatham Borough, in Mill-
burn Township, Essex County. The
Passaic River forms the boundary be-
tween Chatham Borough and Mill-
burn Township. There are numerous
other well fields in the area (fig. 2).
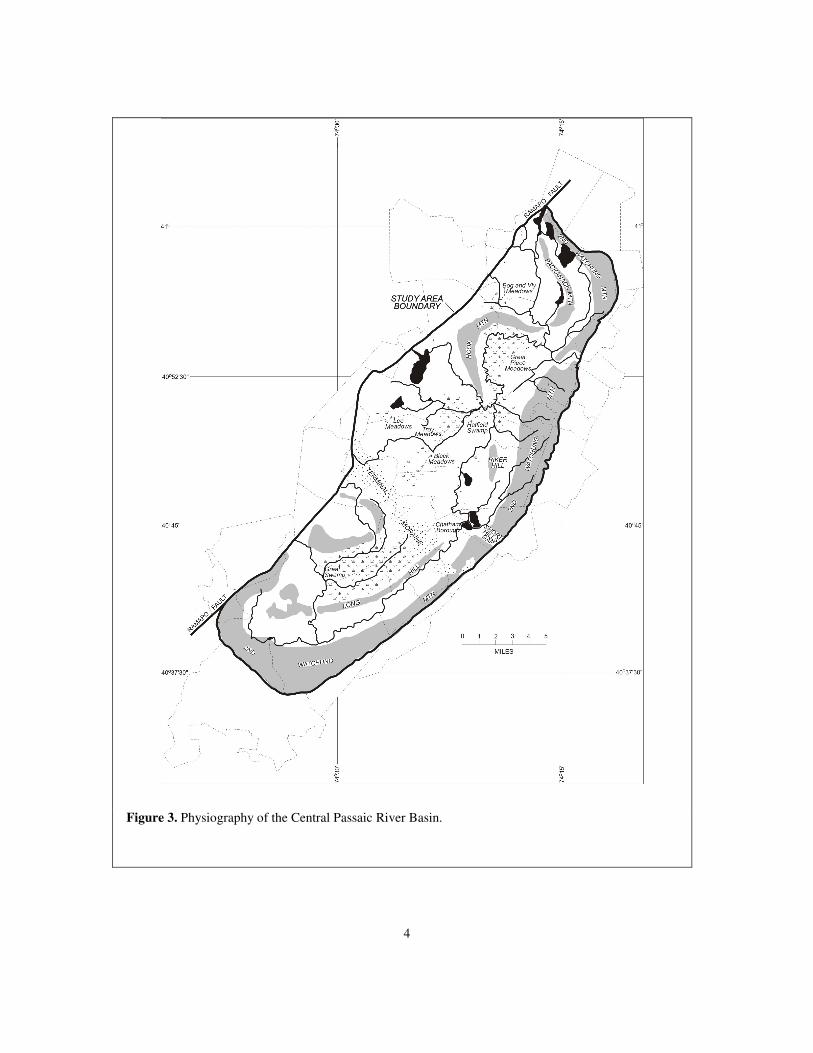
Chatham Borough is within the Central
Passaic River Basin (CPRB). This area
is defined by the crest of the Second
Watchung Mountain on the north, east
and south, and by the Ramapo Fault on
the west. (fig. 3).
Figure 1. Location of Chatham Borough and the Central Passaic River
Basin study area in northeastern New Jersey.
Figure 2. Chatham Borough with nearby wells and well fields.
4
Figure 3. Physiography of the Central Passaic River Basin.

5
Figure 4. Buried valleys in the Central Passaic River Basin

6
Geology and Hydrogeology
The following discussion of the bedrock
and surficial geology of the Central Pas-
saic River Basin (CPRB) is a summary.
More detail on the bedrock geology is in
Drake and others (1996). Surficial geol-
ogy is described by Stone and others
(2002).
The bedrock surface retains the imprint
of a pre-glacial drainage pattern that
slopes generally southeast towards the
Short Hills Gap in Millburn Borough
(fig. 3). The pre-glacial Passaic River is
presumed to have exited the CPRB
through gaps there in the Watchung Mountains at Millburn. These bedrock depressions
are termed ‘buried valleys.’ Figure 4 shows buried valleys throughout the Central
Passaic River Basin. Figure 5 shows the buried valleys in the Chatham Borough area.
Bedrock in the Central Passaic River Basin (CPRB) consists of alternating layers of sed-
imentary rocks (primarily claystone, shale, siltstone and sandstone) with igneous basalt
(table 1). These formations are part
of the Brunswick group of the New-
ark Supergroup. The sedimentary
units are much better water produc-
ers than the basalt units which are
not normally considered to be aqui-
fers.
Bedrock under the western portion
of Chatham Borough consists of the
sedimentary Boonton Formation
(fig. 6). The igneous Hook Moun-
tain Basalt underlies the center of
Chatham Borough and the sedimen-
tary Towaco Formation the eastern portion.
Figure 5. Buried valleys in the Chatham Borough area.
Figure 6. Bedrock geology in the Chatham Borough area.

7
Surficial sediments in the CPRB
are primarily glacial in origin
left during the advance and re-
treat of the Wisconsin glaciation
(fig. 7). The buried valleys in
the Chatham Borough are filled
by fluvial sand and gravel de-
posited as the Wisconsinan
glacier advanced southward.
They are covered by fine-
grained lacustrine material and
by glacial till. The higher eleva-
tions are either morainal materi-
al or till deposited on bedrock
highs. The terminal moraine, which crosses the southern portion of Chatham Borough
marks the southernmost extent of the Wisconsinan glaciation (fig. 3, fig. 7).
The fluvial sand and gravel de-
posits in the buried valleys are
commonly referred to as the bur-
ied-valley aquifer. This is an ex-
tremely productive unit. In 1995
it supplied 14.3 billion gallons,
or 73%, of the 19.6 billion gal-
lons of water withdrawn in the
CPRB (fig. 8). Unconsolidated
units outside of the buried val-
leys supplied only 0.7 billion gal-
lons (4%) (Hoffman and Quin-
lan, 1994).
Observation Wells
The NJGWS installed two observation wells at the northern end of Sheppard Kollock
Park in Chatham Borough, Morris County, NJ in December 1990 (fig. 9). The wells are
located about 20 feet apart.
Figure 7. Surficial geology in the Chatham Borough area.
Figure 8. Groundwater withdrawals in the Central Passaic
River Basin in 1995, by aquifer and relative to
buried valleys.

8
The first, called SKP-shallow,
is 136’ deep. It is screened from
124-134’ below land surface
and taps the buried-valley aqui-
fer. At this location the buried-
valley aquifer is termed the
Southern Millburn buried val-
ley and is 24' thick starting 120'
below land surface.
The second, called SKP-deep,
is 241 feet deep. The well cas-
ing extends a total of 189 feet
below land surface. The bottom
52 feet of the well consists of
open hole. Competent bedrock was encountered at a depth of 144 feet at the site. Thus the
well casing extends a total of 45 feet into the bedrock. The observed water level in this
well is an average of the water level in the aquifer along the well length.
Table 2 presents compiled data from well construction and geologic logs for these two
observation wells in addition to data for nearby production and observation wells. The
land surface elevation at the site is approximately 200 feet above mean sea level. The top
of casing for both wells was surveyed relative to a nearby fixed point. For the purposes of
this analysis, the elevation of the casing top of SKP-deep was assigned to be 200.28 feet
above mean sea level (MSL) and that of SKP-shallow to be 201.13 feet above MSL. All
observed depth-to-water measurements were subtracted from these elevations to produce
the elevation of the groundwater surface in the well for analysis purposes.
The U.S. Geological Survey (USGS) main-
tains observation wells in the CPRB. Their
Recreation Field observation well is in
Memorial Park near North Passaic Avenue
(fig. 10). It was installed in 1967 and is
197 feet deep. It is screened at a depth of
140-150 foot depth in the unconsolidated
sand and gravel of the buried-valley aqui-
fer. This well is approximately midway
between Chatham Borough's well field and
Sheppard Kollock Park. Water levels were
measured in this USGS well in order to
determine what effects, if any, Chatham's
three production wells had on observed
groundwater levels at Sheppard Kollock Park during the aquifer test.
Figure 9. Sheppard Kollock Park with nearby wells and 2007 imagery.
Figure 10. Memorial Park with nearby wells and 2007 imagery.

9
Table 1. Geologic column of the Central Passaic River Basin with stratigraphic descriptions and maximum thicknesses.
Era
System
Series
Time
(million of
years before
present)
Stratigraphic unit
(1)
Maximum
thickness
(feet)
(2)
Older usage
(3)
Lithology
(1)
Aquifer
Cenozoic
Quaternary
Holocene
0.0-0.01 alluvial and marsh deposits (al) 20
sand, gravel, silt, mud and peat
SUR-
FIC-
IAL
Pleistocene
0.01-1.0
deltaic and lacustrine fan deposits (d) 200 stratified
drift
sand and gravel
fluvial sediments (f) 30 sand and gravel
Lake-bottom sediments (l) 200 clay, silt and fine sand
Morainal material (m) 100? Terminal moraine nonstratified silt, sand, gravel and boulders
till (t) 40 till nonstratified silt, sand, gravel and boulders
~~~~~~ major unconformity ~~~~~~~~~~~~~~~~~~~~~~~~~~~~~~~~~~~~~~~~~~~~~~~~~~~~~~~~~~~~~~~~~~~~~~~~~~~~~~~~~~~~~~~~~~~~~~~~~~~~~~~~~~~~~~~~~~~~~~~
Mesozoic
Jurassic Lower Jurassic 187 - 208
Newark
Super
Group
Brunswick
Group
Boonton Formation (Jb) 1,640 Brunswick Formation sandstone, siltstone, shale, conglomerate
BED-
ROCK
Hook Mountain Basalt (Jh) 361 3rd Watchung Basalt basalt
Towaco Formation (Jt) 1,115 Brunswick Formation Sandstone, siltstone, shale, conglomerate
Preakness Basalt (Jp) 984 2nd Watchung Basalt basalt, intercalated sedimentary rock
Feltville Formation (Jf) 1,969 Brunswick Formation sandstone, siltstone, shale, conglomerate and
limestone
Orange Mountain Basalt (Jo) 656 1st Watchung Basalt basalt
Triassic
Upper Triassic
208 - 230 Passaic Formation (JTrp) 8,760 Brunswick Formation sandstone, siltstone, shale, conglomerate
~~~~~~ major unconformity ~~~~~~~~~~~~~~~~~~~~~~~~~~~~~~~~~~~~~~~~~~~~~~~~~~~~~~~~~~~~~~~~~~~~~~~~~~~~~~~~~~~~~~~~~~~~~~~~~~~~~~~~~~~~~~~~~~~
Proterozoic Middle
Proterzoic
900 - 1,600
granite (Ybh)
gneiss (Ylo) Unknown
Losee gneiss
Byram gneiss
hornblende and biotite granite
oligoclase-quartz gneiss
Based on New Jersey Geological Survey 1990.
Notes: (1) Modified from Stanford and others, 1990; Lyttle and Epstein, 1987.
(2) Estimated maximum thicknesses for Cenozoic units apply only to the study area. Measured maximum thicknesses for Mesozoic units from statewide data (Lyttle and Epstein, 1987).
(3) The older usage for the Jurassic and Triassic units (Lewis and Kummel, 1912) is still in common usage but has been officially superseded (Lyttle and Epstein, 1987).

10
Table 2 presents compiled data from well construction and geologic logs for these two
observation wells in addition to data for nearby production and observation wells. The
land surface elevation at the site is approximately 200 feet above mean sea level. The top
of casing for both wells was surveyed relative to a nearby fixed point. For the purposes of
this analysis, the elevation of the casing top of SKP-deep was assigned to be 200.28 feet
above mean sea level (MSL) and that of SKP-shallow to be 201.13 feet above MSL. All
observed depth-to-water measurements were subtracted from these elevations to produce
the elevation of the groundwater surface in the well for analysis purposes.
The U.S. Geological Survey
(USGS) maintains observation
wells in the CPRB. Their Recrea-
tion Field observation well is in
Memorial Park near North Passaic
Avenue (fig. 10). It was installed in
1967 and is 197 feet deep. It is
screened at a depth of 140-150 foot
depth in the unconsolidated sand
and gravel of the buried-valley aq-
uifer. This well is approximately
midway between Chatham Bor-
ough's well field and Sheppard Kol-
lock Park. Water levels were meas-
ured in this USGS well in order to determine what effects, if any, Chatham's three pro-
duction wells had on observed groundwater levels at Sheppard Kollock Park during the
aquifer test.
Figure 10. Memorial Park with nearby wells and 2007 imagery.

11
Table 2. Well information
Well name Permit
Number
Date
Drilled
Total
Depth
Depth of
Screened/
Open
Interval
Aqui-
fer1 Geologic Log
Sheppard
Kollock Park
(SKP)-deep
25-37620 12/06/1990 242 189-241 Towaco
0-15 fill, construction debris; 15-30 C gravel, angu-
lar, little sand; 30-40 C gravel, more F sand; 40-60
gravel decreasing w/ depth, some clay showing in
wash; 60-75 tight clay, big clay balls in wash; 75-
85 tight clay, some gravel; 85-90 interbedded clay,
gravel; 90-105 gravel fining downward, some silt;
105- 110 less gravel more sand, silt; 110-120 silt,
little gravel; 120-135 well sorted gravel, sand; 135-
144 gravel, some shale chips; 144-155 red shale,
siltstone, soft; 155-160 red siltstone; 160-165 red
siltstone w/ clay seams, weathered; 165-170 brown
siltstone, 170-241 red siltstone & shale
Sheppard
Kollock Park
(SKP) -
shallow
25-37544 12/14/1990 136 124-134 Qsd Do.
Passaic
River 51 25-04873 09/08/1955 121.5 84-124 Qsd
0-1 top soil; 1-8 brown silt, clay; 8-18 sand stone,
large rocks; 18-21 sand stone, gravel; 21-24 brown
sand, gravel; 24-46 brown clay; 46-63 brown, red
clay; 63-74 red clay; 74-79 sand stone, gravel; 79-
92 C brown sand, gravel, some stones; 92-122 C
sand, gravel; 122-124 red, gray clay, sand; 124-127
weathered rock.
Passaic
River 52 25-18486 -- -- -- Qsd No log
Chatham
Production
Well # 3
25-05687 11/05/1956 150 94-150 Qsd
0-4 fill; 4-20 sand, clay, stones, gravel; 20-25
hardpan, large stones; 25-27 sand, gravel; 27-87
clay, sand, boulders, gravel, hardpan; 87-95 FC
sand; 95-105 C sand, large & small gravel; 105-
149 C sand, gravel, small boulders; 149-150 hard-
pan, boulders.
USGS
Recreation
Field Obser-
vation Well
25-14164 01/27/1967 197 140-150 Qsd
0-38 till, silty, sandy, pebbly, boulders from 0-20
(brown); 38-42 M sand, well sorted; 42-62 clay,
silty & silt, clayey, laminated, brown; 62-73 MC
sand, well sorted; 73-76 silt, clayey, brown; 76-98
MC sand, w/ little F gravel, well sorted in part; 98-
110 clay, silty, w/ some F sand below 105, brown;
110-120 sand, vF to vC, w/ F gravel, poorly sorted;
120-161 MC sand to F gravel, poorly sorted in part,
silty. 161-191 till?, sandy, silty, pebbly, compact,
brown 191-193 sandstone, red/brown, unweathered
193-197 shale, red/brown, unweathered.
1. Qsd - overburden stratified sand-and-gravel buried-valley aquifer
Towaco - Towaco Formation bedrock aquifer

12
Pretest Water Levels
NJGWS staff installed automatic monitoring equipment in the two Sheppard Kollock
Park observation wells. This equipment measured water levels at hourly intervals from
January to September 1991.
Figure 11 shows water
levels SKP-shallow along
with daily withdrawal
volumes from the nearby
New-Jersey American's
Passaic River well field
(wells PR51 and PR52)
for the period January to
September 1991. The in-
verse correlation between
water levels and pumpage
show that SKP-shallow is
in the cone of influence
of the Passaic River well
field.
Additionally, overburden and bedrock
water levels are correlated as shown
by hourly measurements over the pe-
riod January to September 1991. Wa-
ter levels in SKP-shallow are consist-
ently 0.2 to 0.3 feet higher than in
SKP-deep but both fluctuate simulta-
neously in response to nearby with-
drawals. This relationship shows that
the bedrock and buried-valley aquifers
are in hydraulic connection, with a
slight downwards gradient. Figure 12
shows this relationship using data only from during the first week of February 1991, for
graphical clarity.
SKP-deep is open to the bedrock aquifer from 189 to 244 feet below land surface. The
reported water level in this well is an average of the water level in the bedrock aquifer
over this depth range.
Figure 11. Hourly water levels in the buried-valley aquifer at Sheppard
Kollock Park in 1991 with daily withdrawals from the
with New Jersey-American Passaic River well field
Fig 12. Observed hourly water levels in overburden and
bedrock observation wells, February 1991

13
Test Procedure
The May 1992 aquifer test was designed to determine aquifer properties and to investi-
gate the vertical hydraulic connection between the overburden buried-valley aquifer and
the bedrock aquifer at Sheppard Kollock Park. The test consisted of a 24-hour back-
ground period, a 24-hour pumping period, and a 24-hour recovery period. It ran from 9
AM on Tuesday, May 19, 1992 to 9 AM on Friday, May 22, 1992. The test was run with
the assistance of the New Jersey-American Water Company (NJAWC) and the Chatham
Borough Water Department (CBWD).
NJAWC closely
controlled
pumpage from its
two production
wells in the Pas-
saic River well
field throughout
the 72 hours. For
the entire length
of the test the
PR51 was
pumped at a rate
between 550 and
660 gallons per
minute. NJAWC
tried to keep
pumpage steady
at 560 gpm and this is the pumpage assumed by this analysis. PR52 was turned on at 9:31
AM on 21 May 1992 at an initial rate of 600 gpm (table 2, fig. 13).
The pumping rate
varied over the
next 24 hours from
550 to 620 gpm.
(Exact pumping
rates and times
were not reported,
only the extremes
of volume.) A val-
ue of 600 gpm was
assumed to repre-
sent the average
pumpage. PR52
was turned off at
Figure 13. Withdrawals from the New-Jersey American Passaic River well field and
Chatham Borough well field, May 20-22, 1992
Table 3. Withdrawal times and volumes
Owner & Well Field Well Q (gpm) Withdrawal Date & Time
1
On Off
Chatham Borough
Water Department
Combined
well field 1,050
5/20 02:00 5/20 04:00
5/20 06:30 5/20 14:00
5/20 16:00 5/20 22:30
5/21 03:00 5/21 05:00
5/21 07:00 5/21 14:00
5/21 16:30 5/22 00:00
5/22 04:00 5/22 12:00
New Jersey-American
Passaic River well field
51 560 5/19 09:00 5/23 09:00
52 600 5/21 09:31 5/22 09:00
1. All dates in May, 1992. Times given in military time format.

14
approximately 9:00 AM on 22 May 1992.
During the entire aquifer test CBWD pumped its wells to meet normal operating demands
(table 3, fig. 13). The CBWD well field consists of three wells located within 300 feet of
each other. Their joint impact on the observation wells is assumed to be accurately simu-
lated by a single well located at the centroid of the well field. This is not considered to be
a significant source of error in this study.
Other wells in the area
operated normally
during the aquifer test.
NJAWC withdrew
water from its Canoe
Brook well field,
about 6,000 feet from
Sheppard Kollock
Park. The East Orange
Water Department op-
erated normally its
well fields in the area,
Canoe Brook (~11,000
feet from Sheppard
Kollock Park), Slough Brook (~10,000'), Braidburn (~11,000') and Dickinson (~9,000')
(fig. 2). Pumpage at these well fields was not recorded due to their distance from the
Sheppard Kollock Park wells.
A series of bedrock wells about 4,000 feet southwest of Sheppard Kollock Park was op-
erated at that time by the Ciba-Geigy corporation. They reportedly pumped their wells at
a constant rate of about 500 gpm throughout the aquifer test. Further information on
pumpage times was not available.
A packer was installed in SKP-deep and pressurized on May 19. The 10-foot long packer
was located from 210 to 220 feet below land surface. Thus there was approximately 20
feet of the well bore open to the aquifer above the packer and 21 feet below the packer.
This packer created a block in the well and prevented the vertical movement of water.
Thus it created isolated zones above and below the packer. Water-level monitoring in-
strumentation, attached to automatic data recorders (ADRs) were installed both above
and below the packer. Water levels both above and below the packer could also be meas-
ured manually.
The packer deflated overnight due to a technical problem. It was reinflated on May 20 at
9:21 AM. Due to coordination issues the pumping test could not be significantly delayed.
Pumpage from PR52 began at 9:32 AM on May 20.
Table 4. Distances from Observation Wells to Pumping Wells
From To Distance (feet)
Sheppard Kollock Park
observation wells
Passaic River 52 560
Chatham Borough well field 5,300
Recreation Field
observation well 2,750
Recreation Field
observation well
Passaic River 52 2,800
Chatham Borough well field 2,630
Sheppard Kollock Park
observation wells 2,750
15
An ADR attached to water-level monitoring instrumentation was also installed in SKP-
shallow well on May 19. Water levels were observed in this observation well throughout
the 72-hour test.
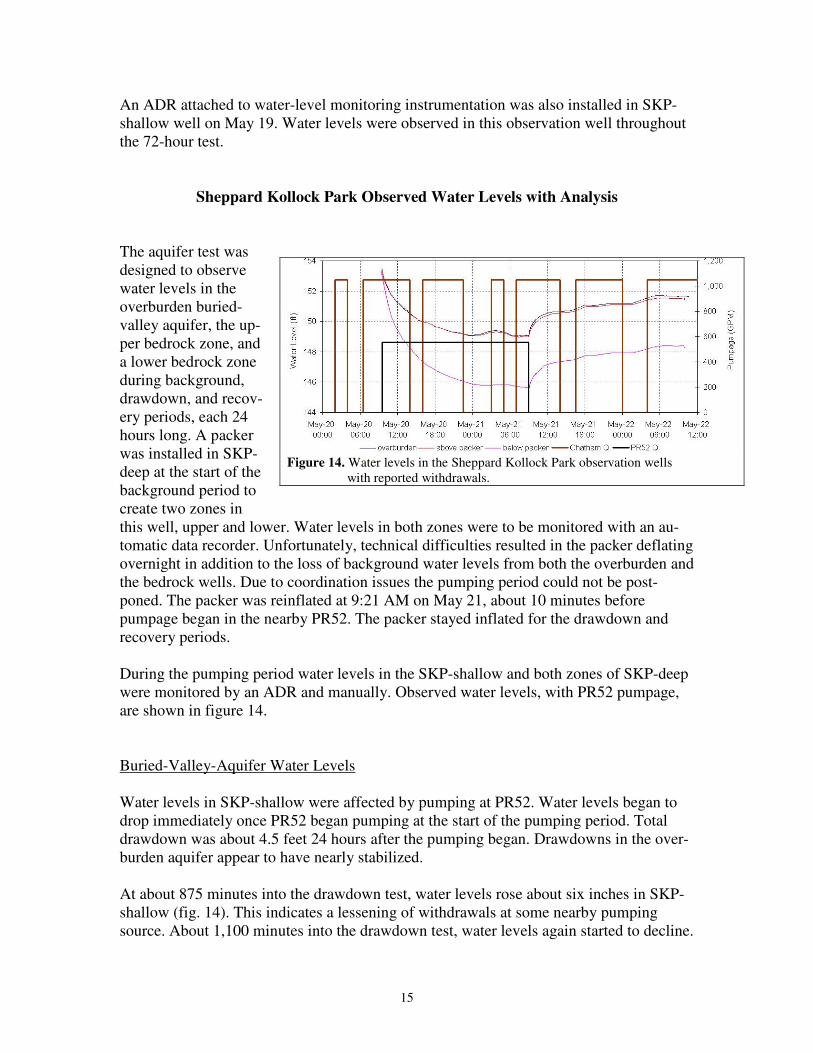
Sheppard Kollock Park Observed Water Levels with Analysis
The aquifer test was
designed to observe
water levels in the
overburden buried-
valley aquifer, the up-
per bedrock zone, and
a lower bedrock zone
during background,
drawdown, and recov-
ery periods, each 24
hours long. A packer
was installed in SKP-
deep at the start of the
background period to
create two zones in
this well, upper and lower. Water levels in both zones were to be monitored with an au-
tomatic data recorder. Unfortunately, technical difficulties resulted in the packer deflating
overnight in addition to the loss of background water levels from both the overburden and
the bedrock wells. Due to coordination issues the pumping period could not be post-
poned. The packer was reinflated at 9:21 AM on May 21, about 10 minutes before
pumpage began in the nearby PR52. The packer stayed inflated for the drawdown and
recovery periods.
During the pumping period water levels in the SKP-shallow and both zones of SKP-deep
were monitored by an ADR and manually. Observed water levels, with PR52 pumpage,
are shown in figure 14.
Buried-Valley-Aquifer Water Levels
Water levels in SKP-shallow were affected by pumping at PR52. Water levels began to
drop immediately once PR52 began pumping at the start of the pumping period. Total
drawdown was about 4.5 feet 24 hours after the pumping began. Drawdowns in the over-
burden aquifer appear to have nearly stabilized.
At about 875 minutes into the drawdown test, water levels rose about six inches in SKP-
shallow (fig. 14). This indicates a lessening of withdrawals at some nearby pumping
source. About 1,100 minutes into the drawdown test, water levels again started to decline.
Figure 14. Water levels in the Sheppard Kollock Park observation wells
with reported withdrawals.
16
During the recovery period water levels in the SKP-shallow did not recover to levels seen
at the start of the pumping period. Water levels appeared to have nearly stabilized in
SKP-shallow about one foot lower than at the start of the test (fig. 14). This indicates the
presence of a nearby pumping during the recovery period that was either not there at the
beginning of the pumping period or had increased its withdrawal rate during the test. The
available data do not allow a more definitive determination of a cause.
Figure 14 also shows withdrawals at the Chatham well field which is about 5,300 feet
away from SKP-shallow. These reported withdrawals do not appear to be correlated with
the unexplained water-level fluctuations in SKP-shallow.
The fluctuations in SHP-shallow show that either the withdrawals at PR51 and PR52
were not as steady as desired, or there is an unidentified pumping well nearby.
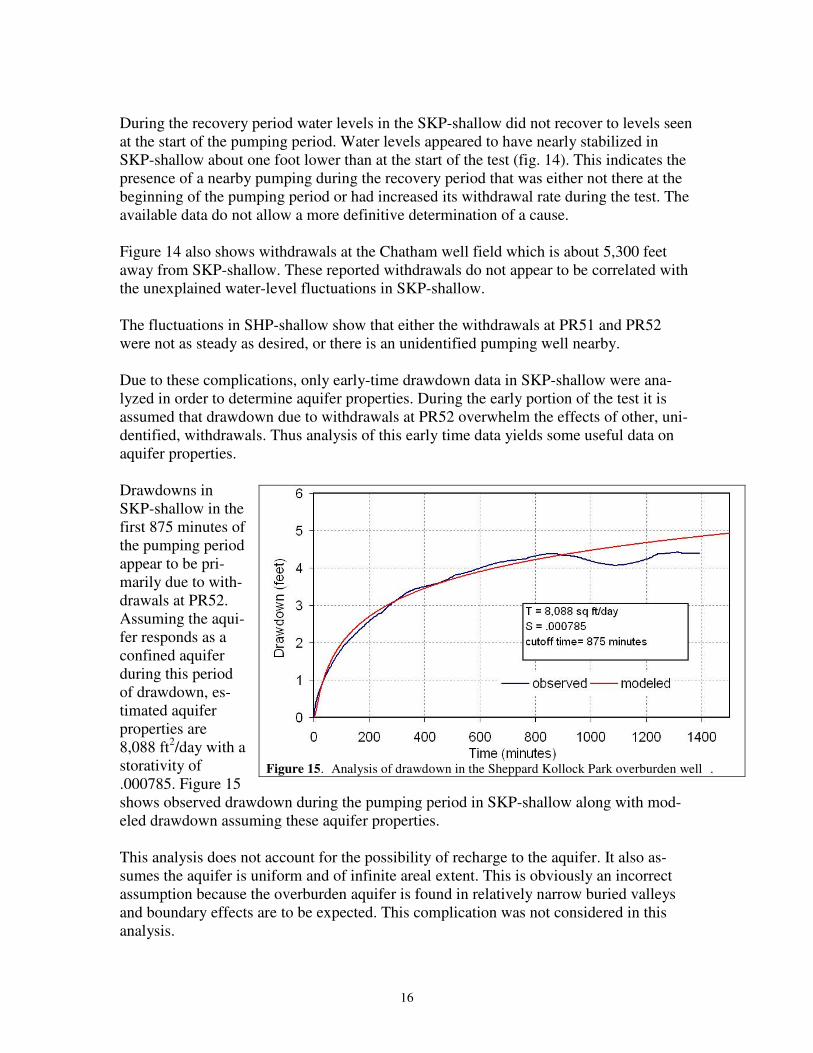
Due to these complications, only early-time drawdown data in SKP-shallow were ana-
lyzed in order to determine aquifer properties. During the early portion of the test it is
assumed that drawdown due to withdrawals at PR52 overwhelm the effects of other, uni-
dentified, withdrawals. Thus analysis of this early time data yields some useful data on
aquifer properties.
Drawdowns in
SKP-shallow in the
first 875 minutes of
the pumping period
appear to be pri-
marily due to with-
drawals at PR52.
Assuming the aqui-
fer responds as a
confined aquifer
during this period
of drawdown, es-
timated aquifer
properties are
8,088 ft2/day with a
storativity of
.000785. Figure 15
shows observed drawdown during the pumping period in SKP-shallow along with mod-
eled drawdown assuming these aquifer properties.
This analysis does not account for the possibility of recharge to the aquifer. It also as-
sumes the aquifer is uniform and of infinite areal extent. This is obviously an incorrect
assumption because the overburden aquifer is found in relatively narrow buried valleys
and boundary effects are to be expected. This complication was not considered in this
analysis.
Figure 15. Analysis of drawdown in the Sheppard Kollock Park overburden well .

17
Bedrock-Aquifer Water Levels
Long-term monitoring in 1991 (fig. 12) showed that water levels in SKP-shallow were
consistently a few inches higher than in SKP-deep. The May 1992 test was designed to
investigate the possibility that there were different zones with different water levels in the
bedrock aquifer.
The packer in the SKP-deep was inflated at the start of the background period. However,
overnight it deflated. It was reinflated, to a pressure of 500 PSI, approximately 10
minutes before the pumpage began in PR52. This short lead time proved to be a signifi-
cant limitation to the data analysis. Water levels below the packer did not come into equi-
librium with the surrounding lower bedrock unit before the beginning of the pumping pe-
riod. This means that the initial drawdown data from below the packer show the effect
both of this equilibration process and drawdown due to PR52 pumpage. This complica-
tion means early-time drawdown data from the lower bedrock zone cannot be analyzed
with accuracy using traditional approaches. Thus these data were not analyzed for aquifer
properties.
Once the packer was
reinflated, water
levels in the upper
and lower zones in
SKP-deep diverged
(fig. 14). Upper-
zone water levels
became practically
identical to those in
the SKP-shallow.
The lower bedrock
zone water levels
fluctuated in unison
with overburden wa-
ter levels, but were
consistently be-
tween 3 and 3.5 feet
lower (fig. 16). During the recovery test (after PR52 was turned off) the heads in the two
bedrock zones recovered at nearly identical rates.
The downward gradient indicates that at this location groundwater travels from the upper
portion of the aquifer down toward the lower. It also means that when no packer is pre-
sent, SKP-deep itself acts as a conduit, with water flowing out of the upper bedrock zone
in the well bore and then into the lower bedrock zone. The actual volume of water flow-
ing is unknown since there are no data available on the relative ability of the upper and
lower bedrock zones to transmit water.
Figure 16. Amount by which the upper bedrock zone water level was higher than
the lower bedrock zone water level during the aquifer test,
Sheppard Kollock Park
18
Additionally, the response of water levels in SKP-deep makes it evident that the upper
bedrock zone is in direct hydraulic connection with the semi-confined valley-fill aquifer
at this location and that the two have nearly identical water levels.
Water levels in the deeper bedrock zone are lower, showing a flow of water down into
the bedrock at Sheppard Kollock Park. These lower bedrock water levels also fluctuate in
response to nearby pumping. The cone of depression in the buried valley aquifer, created
by the NJAWC Passaic River wells, is mirrored in the bedrock aquifer. Thus at Sheppard
Kollock Park the groundwater flow direction in the valley-fill aquifer is primarily toward
the Passaic River well field but with a downward component, into the bedrock.
It is unlikely that drawdown observed in the bedrock at Sheppard Kollock Park is primar-
ily due to pumpage from the bedrock because nearby bedrock production wells do not
withdraw significant volumes of water. Withdrawals from the Ciba-Geigy wells approx-
imately 3,500 feet southwest of Sheppard Kollock Park were 120 million gallons in 1990
(Hoffman and Quinlan, 1994). The next closest major bedrock pumping is from the East
Orange Water Department's Slough Brook well field, also pumping from the Towaco unit
of the bedrock aquifer, approximately 11,000 feet away. This well field produced 373
million gallons in 1990 (Hoffman and Quinlan, 1994).
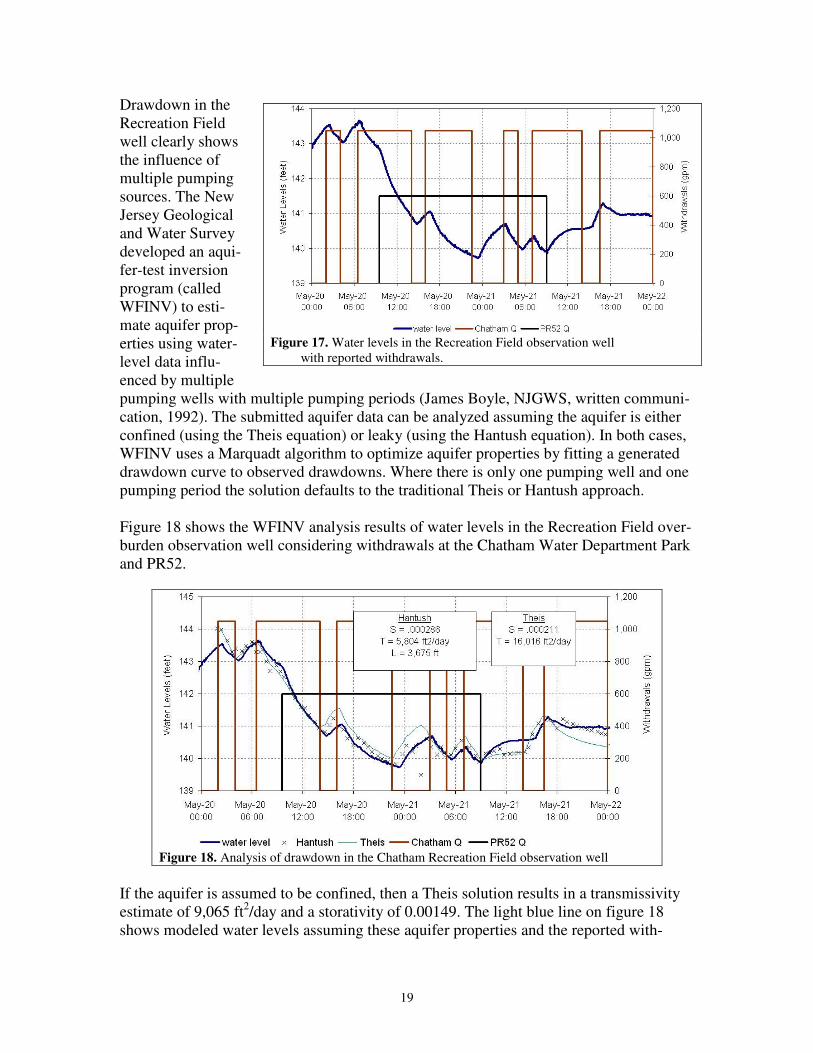
Memorial Park Observed Water Levels with Analysis
Water levels were recorded in the USGS Recreation Field observation well located in
Chatham's Memorial Park during the background, drawdown, and recovery periods of the
aquifer test. This observation well is located approximately half way between the Chat-
ham Water Department well field and the Sheppard Kollock Park observation wells (fig.
2). An automatic data recorder measured water levels at two-minute intervals from 11:40
AM on May 19, 1992 until 11:04 AM on May 22, 1992 in this well. Observed water lev-
els, and nearby withdrawals, are shown on figure 17. Distances from the production wells
to the observation wells are shown in table 4. Reported pumpages in PR51, PR52 and the
Chatham Borough well field are in table 3.
19
Drawdown in the
Recreation Field
well clearly shows
the influence of
multiple pumping
sources. The New
Jersey Geological
and Water Survey
developed an aqui-
fer-test inversion
program (called
WFINV) to esti-
mate aquifer prop-
erties using water-
level data influ-
enced by multiple
pumping wells with multiple pumping periods (James Boyle, NJGWS, written communi-
cation, 1992). The submitted aquifer data can be analyzed assuming the aquifer is either
confined (using the Theis equation) or leaky (using the Hantush equation). In both cases,
WFINV uses a Marquadt algorithm to optimize aquifer properties by fitting a generated
drawdown curve to observed drawdowns. Where there is only one pumping well and one
pumping period the solution defaults to the traditional Theis or Hantush approach.
Figure 18 shows the WFINV analysis results of water levels in the Recreation Field over-
burden observation well considering withdrawals at the Chatham Water Department Park
and PR52.
If the aquifer is assumed to be confined, then a Theis solution results in a transmissivity
estimate of 9,065 ft2/day and a storativity of 0.00149. The light blue line on figure 18
shows modeled water levels assuming these aquifer properties and the reported with-
Figure 17. Water levels in the Recreation Field observation well
with reported withdrawals.
Figure 18. Analysis of drawdown in the Chatham Recreation Field observation well

20
drawals. If the aquifer is assumed to be leaky, then a Hantush solution results in an esti-
mate of transmissivity of 5,804 ft2/day, a storativity of 0.00286, and a leakance of 3,675
feet. The ‘x’s on figure 18 shows estimated water levels assuming these aquifer proper-
ties and the reported withdrawals.
The Hantush analysis results in a generally better fit of simulated to observed water lev-
els. The aquifer properties must be considered to be spatial averages for the area between
the Chatham Water Department well field and the New Jersey-American Passaic River
well field.
Conclusions
A 72-hour aquifer test has yielded information on the aquifers of eastern Morris and
western Essex Counties, New Jersey. The test was divided into three 24-hour periods:
background, pumping, and recovery. Water levels were observed in two wells in Shep-
pard Kollock Park in Chatham Borough, Morris County. The shallower well (SKP-
shallow) is completed in a semi-confined glacial sand-and-gravel deposit that is located
in a bedrock depression. Locally this deposit, and others in a similar setting, are termed
buried-valley aquifers. The deeper well (SKP-deep) is located in the bedrock aquifer, the
Towaco Formation. Drawdowns were also observed in a shallow observation well in
Memorial Park, Chatham Borough. This well is called the Recreation Field well and also
taps the buried-valley aquifer.
Pumpage was monitored at two pumping centers, both in the buried-valley aquifer. The
New Jersey American's Passaic River well field consists of two production wells, PR51
and PR52. Withdrawals from PR51 were held roughly constant at a rate of 560 gpm dur-
ing the background, pumping and recovery periods. PR52 was not pumped during the
background and recovery periods, and was pumped at roughly 600 gpm during the pump-
ing period. PR52 is about 560' from the Sheppard Kollock Park observation wells, and
about 2,800’ from the Recreation Field well. The Chatham Water Department withdraw-
als water from three production wells located within 300 feet of each other. During the
background, pumping and recovery periods these wells were pumped to meet demand at
about 1,050 gpm. The centroid of this well field is about 5,300 feet from the Sheppard
Kollock Park observation wells, and about 2,630 feet from the Recreation field observa-
tion well
Aquifer properties are estimated based on the first 875 minutes of drawdown in SKP-
shallow. This drawdown is due to withdrawals at PR52. A Theis analysis yields estimated
transmissivity of 8,088 ft2/day and a storativity of .000785. Water levels during the back-
ground period were lost due technical difficulties. Only drawdown during the first 875
minutes of the pumping period were used due to unexplained water-level fluctuations.

21
Water levels in the Recreation Field observation well showed fluctuations that could be
correlated to both to withdrawals at PR52 well (2,800 feet away) and the Chatham Water
Department well field (2,630 feet away). An analysis program capable of handling multi-
ple pumping wells and pumping periods was used to estimate aquifer properties based on
water levels in this well. Estimated confined aquifer properties, using a Theis analysis,
are a transmissivity of 9,065 ft2/day and a storativity of 0.00149.
If the aquifer is assumed instead to be leaky then a Hantush analysis of water level
changes yields a transmissivity of 5,804 ft2/day, a storativity of 0.00286, and a leakance
of 3,675 feet. Given the location of the observation well midway between two major
pumping centers, the longer period of analysis and the greater likelihood that leakage af-
fected the water levels, these aquifer properties are judged to better represent the regional
aquifer properties.
22
References
Drake, A.A., Volkert, R.A., Monteverde, D.H., Herman, G.C., Houghton, H.F., Parker,
R.A., and Dalton, R.F., 1996, Bedrock geologic map of northern New Jersey: U.S.
Geological Survey Miscellaneous Investigations Series Map I-2540-A, scale
1:100,000, 2 plates.
Hoffman, J.L. and Quinlan, John, 1994, Ground-water-withdrawal and water-level data
for the Central Passaic River Basin, New Jersey, 1989-1990: N.J. Geological Sur-
vey Report GSR-34, 78 p., 1 plate.
Hoffman, J.L., Hall, D.W., Stanford, S.D., Ghatge, S.L. and Stone, B.D., Hydrogeology
of the Central Passaic River Basin, New Jersey: unpublished report on file with
the N.J. Geological & Water Survey.
Lewis, J.V., and Kümmel, H.B., 1912, Geological map of New Jersey: N.J. Department
of Conservation and Economic Development, Atlas Sheet No. 40 (revised by H.B.
Kümmel in 1931 and by M.E. Johnson in 1950), scale 1:250,000
Lyttle, P.T., and Epstein, J.B., 1987, Geologic Map of the Newark 1o by 2
o quadrangle,
New Jersey, Pennsylvania, and New York: U.S. Geological Survey Miscellaneous
Investigations Series Map I-1715, scale 1:250,000.
New Jersey Geological Survey, Generalized stratigraphic table for New Jersey: N.J. Geo-
logical Survey Information Circular 1, 2 pages.
Stanford, S.D., Witte, R.W., and Harper, D.P., 1990, Hydrogeologic character and thick-
ness of the glacial sediment of New Jersey: N.J. Geological Survey Open-File
Map no. 3, 2 sheets, scale 1:100,000.
Stone, B.D., Standford, S.D., and Witte, Ron W., 2002, Surficial geologic map of north-
ern New Jersey: U.S. Geological Survey Miscellaneous Investigations Series Map
I-2540-C, 3 plates, scale 1:100,000, pamphlet.
Taylor, C.J. and Alley, W.M, 2001, Ground-water-level monitoring and the importance
of long-term water-level data, U.S. Geological Survey Circular 1217, 68p.