nks-433, shieldmorc– detection distances and methods to
TRANSCRIPT

NKS-433 ISBN 978-87-7893-523-6
SHIELDMORC– Detection distances and methods to locate orphan gamma radiation sources in shielded building geometries by
mobile gamma spectrometry
Christopher L. Rääf1 (chair), Robert R. Finck1 (co-chair) Vikas C. Baranwal5, Antanas Bukartas1
Marie-Andrée Dumais5, Kjartan Guðnason4
Yvonne Hinrichsen1, Gísli Jónsson4
Mattias Jönsson1, Peder Kock7
Sune Juul Krogh2, Simon Karlsson7
Frode Ofstad5, Jan Steinar Rønning5
Petri Smolander3, Kasra Tazmini6
Mikael Westin7
1Medical Radiation Physics, ITM, Lund University, Sweden
2Danish Emergency Management Agency, Denmark 3Radiation and Nuclear Safety Authority, Finland
4Icelandic Radiation Safety Authority, Iceland 5Geological Survey of Norway, Norway
6Norwegian Radiation and Nuclear Safety Authority, Norway 7Swedish Radiation Safety Authority, Sweden
March 2020

Abstract Mobile gamma spectrometry is a key method when searching for gamma-emitting radioactive sources that have come out of regulatory control through accidents or deliberate events. Such sources can be more or less shielded, which reduces and distorts the gamma spectrometric signal. It makes detection more difficult as the signal from the primary radiation de-creases. An estimate of the shielding is needed to assess the potential hazard before approaching to handle the source. The NKS/SHIELDMORC activity is a step on the way to gain experiences in mobile gamma spec-trometry for detection of shielded sources. It is carried out in collaboration between mobile detection teams from Denmark, Finland, Iceland, Norway and Sweden. The aim is to develop and test practical methods to detect lost or hidden gamma emitting sources and estimate their locations and activities. This report describes results from preparatory theoretical calcu-lations and some experimental acquirements on situations with shielded Cs-137 and Co-60 sources, using a 4 litre NaI(Tl)-spectrometer. A method of applying a ratio of count rates in three regions of interest (ROI) repre-senting selected parts of the Compton scattered registrations together with one ROI for primary registrations seems to be useful for determination of the amount of scattered radiation from a possible shield around the source. The method may also roughly indicate the physical properties of the shield in terms of thickness and whether the material has high or low atomic number. However, further experiments are needed to verify this. The intention is to make the verification in a joint Nordic field experiment in 2020. The report describes a proposed design for such an experiment. Key words Mobile gamma spectrometry, MORC, orphan hidden gamma sources, radiation accidents, shielding, Compton scattering NKS-433 ISBN 978-87-7893-523-6 Electronic report, March 2020 NKS Secretariat P.O. Box 49 DK - 4000 Roskilde, Denmark Phone +45 4677 4041 www.nks.org e-mail [email protected]

NKS SHIELDMORC Final Report 2019 Page 1 (61)
1
SHIELDMORC– Detection distances and methods to
locate orphan gamma radiation sources in shielded
building geometries by mobile gamma spectrometry
Final Report 2019
NKS-B SHIELDMORC activity
Contract: AFT/B(19)2
Christopher L. Rääf1 (chair), Robert R. Finck1 (co-chair), Vikas C. Baranwal5, Antanas Bukartas1, Marie-Andrée Dumais5, Kjartan Guðnason4, Yvonne Hinrichsen1, Gísli Jónsson4, Mattias Jönsson1, Peder Kock7, Sune Juul Krogh2, Simon Karlsson7, Frode Ofstad5, Jan Steinar Rønning5, Petri Smolander3, Kasra Tazmini6, Mikael Westin7 1Medical Radiation Physics, ITM, Lund University, Sweden 2Danish Emergency Management Agency, Denmark 3Radiation and Nuclear Safety Authority, Finland 4Icelandic Radiation Safety Authority, Iceland 5Geological Survey of Norway, Norway 6Norwegian Radiation and Nuclear Safety Authority, Norway 7Swedish Radiation Safety Authority, Sweden

NKS SHIELDMORC Final Report 2019 Page 2 (61)
2
Abstract
Mobile gamma spectrometry is a key method when searching for gamma-emitting radioactive sources that have come out of regulatory control through accidents or deliberate events. Such sources can be more or less shielded, which reduces and distorts the gamma spectrometric signal. It makes detection more difficult as the signal from the primary radiation decreases. An estimate of the shielding is needed to assess the potential hazard before approaching to handle the source. The NKS/SHIELDMORC activity is a step on the way to gain experiences in mobile gamma spectrometry for detection of shielded sources. It is carried out in collaboration between mobile detection teams from Denmark, Finland, Iceland, Norway and Sweden. The aim is to develop and test practical methods to detect lost or hidden gamma emitting sources and estimate their locations and activities. This report describes results from preparatory theoretical calculations and some experimental acquirements on situations with shielded Cs-137 and Co-60 sources, using a 4 litre NaI(Tl)-spectrometer. A method of applying a ratio of count rates in three regions of interest (ROI) representing selected parts of the Compton scattered registrations together with one ROI for primary registrations seems to be useful for determination of the amount of scattered radiation from a possible shield around the source. The method may also roughly indicate the physical properties of the shield in terms of thickness and whether the material has high or low atomic number. However, further experiments are needed to verify this. The intention is to make the verification in a joint Nordic field experiment in 2020. The report describes a proposed design for such an experiment.

NKS SHIELDMORC Final Report 2019 Page 3 (61)
3
Table of contents
1. Introduction ............................................................................................................................ 5 1.1 The problem ..................................................................................................................... 5
1.2 The aim ............................................................................................................................. 6
2. Theory .................................................................................................................................... 7 2.1 The primary photon fluence from an unshielded point source ......................................... 7
2.1.1 The primary fluence at a stationary observation point .............................................. 7 2.1.2 The primary fluence when moving along a straight path .......................................... 8
2.2 The primary photon fluence from a shielded point source ............................................. 13 2.2.1 The primary fluence after a rectangular wall when moving along a straight path .. 13 2.2.2 The primary fluence after a cylindrical wall when moving along a straight path ... 15
2.3 The scattered photon fluence from a point source .......................................................... 16 2.3.1 Photon energies from Compton scattering .............................................................. 17 2.3.2 Energy range of Compton photons detectable with NaI(Tl)-spectrometers ............ 17 2.3.3 Non-collimated sources ........................................................................................... 18 2.3.4 Collimated sources .................................................................................................. 18
2.4 Calculations of scattered radiation from a point source using Monte Carlo technique .. 20 2.4.1 Normalized scattered fluence .................................................................................. 20 2.4.2 Measurements of pulse height distributions for scattered radiation to be incorporated in a “knowledge library” ............................................................................. 23 2.3.2 Use of the variation of scattered radiation along the road to estimate the shielding of a point source ............................................................................................................... 23
3. Equipment and measuring methods ..................................................................................... 24 3.1 Measuring equipment ..................................................................................................... 24
3.1.1 The Lund University measuring system .................................................................. 24 3.1.2 Measuring systems used by the Nordic countries ................................................... 24
3.2 Radiation sources ........................................................................................................... 25 3.2.1 Non-collimated sources ........................................................................................... 25 3.2.2 Non-collimated Co-60 source with heavy lead shielding ........................................ 27 3.2.3 Collimated source .................................................................................................... 29 3.2.4 Dimensions of the shielding material ...................................................................... 29
3.3 Data analysis ................................................................................................................... 31
4. Results and discussion .......................................................................................................... 33 4.1 Non-collimated source. Shielding experiments at source detector distance 10 - 80 m .. 33
4.1.1 Cs-137 source with air only, source-detector distance 20 - 80 m............................ 33 4.1.2 Cs-137 source with wood shield, source-detector distance 20 m ............................ 33 4.1.3 Cs-137 source with burnt clay shield, source-detector distance 10 m..................... 33 4.1.4 Cs-137 source with lead shield, source-detector distance 10 m .............................. 35

NKS SHIELDMORC Final Report 2019 Page 4 (61)
4
4.1.5 Using registrations of Compton scattered photons in the normalized pulse height distribution to estimate shielding thickness at source-detector distances 10 - 20 m ........ 36 4.1.6 Summarizing experiments with shielded Cs-137 at distances 10 - 20 m ................ 38
4.2 Non-collimated source. Shielding experiments at source detector distance 1 m ........... 38 4.2.1 Cs-137 source with wood shield, source-detector distance 1 m .............................. 38 4.2.2 Cs-137 source with burnt clay shield, source-detector distance 1 m....................... 38 4.2.3 Using registrations of Compton scattered photons in the normalized pulse height distribution to estimate shielding thickness at source-detector distance 1 m ................... 40 4.2.4 Cs-137 source with burnt clay shield combined with wood shield, source-detector distance 1 m ...................................................................................................................... 40 4.2.5 Summarizing experiments with shielded Cs-137 source at 1 m and 10 - 20 m distance ............................................................................................................................. 43
4.3 Non-collimated source, Co-60 with burnt clay shield, source-detector distance 20 m .. 43 4.3.1 Using Regions-of-interest (ROI) instead of the entire pulse height distribution ..... 43 4.3.2 Summarizing experiments with Co-60 source and burnt clay shielding ................. 43
4.4 Non-collimated source. Shielding experiment with a Co-60 source, preformed by the Nordic teams......................................................................................................................... 45
4.4.1 Unshielded source geometry ................................................................................... 45 4.4.2 Lead shielded source geometry ............................................................................... 46 4.4.3 Summarizing the shielding experiment with a Co-60 source, preformed by the Nordic teams .................................................................................................................... 48
4.5 Collimated source. Shielding experiments with Cs-137 at source-detector distance 17 m .............................................................................................................................................. 49
4.5.1 Collimated source, wood shield, 17 m distance ...................................................... 49 4.5.2 Collimated source, burnt clay shield, 17 m distance ............................................... 49 4.5.3 Collimated source, lead shield, 17 m distance ........................................................ 49 4.5.4 Summarizing shielding experiments with Cs-137 collimated source ..................... 51
5. Conclusions .......................................................................................................................... 52
Acknowledgement .................................................................................................................... 54
Disclaimer ................................................................................................................................ 54
References ................................................................................................................................ 55
Appendix A. Proposed experiments ......................................................................................... 56 A.1 The meaning of a “knowledge library”.......................................................................... 56
A.2 Determining the distance to a source ............................................................................. 56 A.2.1 The distance experiment ......................................................................................... 56
A.3 Determining the shielding properties of a source .......................................................... 57 A.3.1 The shielding experiment part 1: ............................................................................ 58 A.3.2 The shielding experiment part 2 ............................................................................. 58
A.4 Limitations of the experiment ....................................................................................... 58

NKS SHIELDMORC Final Report 2019 Page 5 (61)
5
1. Introduction
1.1 The problem
Lost (orphan) radioactive sources (Material Out of Regulatory Control, MORC) can put people in danger. Accidents with orphan sources are not very common, but events leading to dangerous situations happen almost every year worldwide. Between 1960 and 2001, at least 34 accidents involving orphan radioactive sources have occurred, resulting in 42 early deaths and injuries to hundreds of people (UNSCEAR, 2011). Mobile gamma spectrometry is an important method when searching for lost or hidden radiation sources. Authorities in the Nordic countries responsible for radiation safety and detection have together with Lund University participated in NKS funded research projects with the intention of improving methods to detect orphan gamma-ray sources by the use of mobile gamma spectrometry.
In the NKS funded projects MOMORC 2016 and AUTOMORC 2017 - 2018 methods for calculating maximum detectable distances for unshielded gamma ray sources were developed. The validity of the calculations was tested in joint Nordic experiments. A good agreement was achieved between theoretically calculated detection distances and practical measurements with the types of mobile spectrometers that are used in the Nordic countries. This has provided an understanding of how detector type and size, vehicle speed, acquisition time and variations in the natural radiation background affect the ability to detect unshielded gamma-ray sources (Finck et al, 2017; Rääf et al, 2017, 2018).
Unshielded source geometries in open environments are not always representative for actual situations. A source can be located in a building and/or placed in a shielded container, thereby reducing its radiation into the environment and its apparent activity, making it more difficult to detect. The shielding material will produce additional scattered radiation, which makes the source “signature” in the spectrometer’s pulse height distribution more complex. On the other
hand, the changed signature provides an opportunity to identify the presence of shielding material around the source.
The amount of scattered radiation in relation to the primary photon fluence increases as the radiation passes through matter. Moreover, photons of different energies are attenuated to different extent in a shield. This could be used to determine how much shielding material exists between a source and an observer. Such an investigation has been done in an NKS project RadShield (Toivonen et al, 2017). In the former study, two methods were tested: (1) Measuring full energy peak areas for two different energies from the same radionuclide, and (2) measuring and comparing the step rise in the pulse height distribution just to the left of a full energy peak with the area of the full energy peak. The first method needs two photon energies from the same radionuclide and can thus be applied on Co-60, but not for the mono-energetic gamma emitter Cs-137. The second method can work for mono-energetic gamma emitters, but requires comparing measurements for different shielding thickness, material, detector type, detector efficiency and observing the effect of albedo from the ground.
The RadShield investigated parts of the shielding problem through stationary high-resolution gamma spectrometry. The activity, SHIELDMORC 2019, described in this work, is intended to further deal with shielding characterisation in more complex, but probably more realistic, situations with shielded gamma-ray sources from the viewpoint of mobile gamma spectrometry by means of the more commonly used low resolution NaI(Tl)-spectrometers.

NKS SHIELDMORC Final Report 2019 Page 6 (61)
6
1.2 The aim
The aim of the project is to develop and test methods for detecting orphan gamma-ray sources with mobile gamma spectrometry, in order to determine distance, approximate shielding and activity for the radiation source. The first part of the project (SHIELDMORC 2019), which is presented in this work, includes results from theoretical calculations and initial preliminary measurements against shielded sources containing Cs-137 and Co-60. The results from these measurements are intended as a test of an idea of constructing a “knowledge library”, in the
form of sets of count rates in various regions of interests (ROI) in the spectrometer pulse height distribution, representing primary and Compton scattered radiation from the source. After constructing such a knowledge library from a number of calibration measurements of gamma emitting sources for different shielding geometries, the intention is to test its usefulness in a joint Nordic field experiment (SHIELDMORC 2020). This report presents proposals on how such a field experiment can be carried out.

NKS SHIELDMORC Final Report 2019 Page 7 (61)
7
2. Theory
In mobile gamma spectrometry, measurements of the primary photon fluence rate are used to identify possible presence of orphan gamma-ray sources. To determine the activity of a source, it is necessary to know the distance to the source. As the photon fluence monotonously decreases with increasing distance following a well-known physical law, the distance can be determined by performing at least two primary fluence measurements at different locations. The activity can then be calculated provided that the source is not shielded. If the source is shielded, the primary fluence will be reduced and the activity will seem apparently lower. The shielding can give rise to Compton scattered photons, whose energy distribution will depend on the shielding material and the thickness of the shield. Measurements of the scattered photon fluence can therefore provide information about the shielding. If the shielding of the source is known, its actual activity can be calculated. How the distance to a source and its shielding can be estimated by mobile gamma spectrometry in order to determine the actual activity of an identified orphan gamma-ray source is briefly described in the following.
2.1 The primary photon fluence from an unshielded point source
2.1.1 The primary fluence at a stationary observation point
The primary photon fluence rate in air at distance, r, from a photon source, which emits S photons per second can be written:
24 r
eSra
(2:1)
where a is the linear attenuation coefficient for photon absorption in air. The attenuation coefficient a is depending on the density of the air, a, and can be expressed in its density-independent form, the mass attenuation coefficient (/)a. The air density is a function of air pressure, temperature and moisture content. The linear attenuation coefficient is obtained by:
aaa / (2:2)
The term 1/4 r2 in Eqn 2:1 is generally called “the inverse square law”. It dominates the
decrease of the photon fluence for the first 30 metres from the source. At longer distance, the exponential term e-µr grows increasingly more important when the distance r from the source is increased. At long distances (kilometres) the exponential reduction of the photon fluence dominates. It can be said that at long distances the air is opaque for gamma radiation, unlike how visible light easily can penetrate thick layers of the atmosphere. The relative contributions of the “inverse square law” and the exponential attenuation law with increasing distance is illustrated in Fig 2.1.
The relatively limited range of gamma radiation in air affects the distance at which it is possible to detect a radiation source. This is especially important to take into account in mobile measurements, where the acquisition time for each single measurement generally is limited to a few seconds. Already beyond a few hundred meter distance, the primary photon fluence from radiation sources is reduced by attenuation in the air so much that the source detectability begins to be significantly affected.

NKS SHIELDMORC Final Report 2019 Page 8 (61)
8
Reduction of the primary photon fluence from a point source
1.0E-12
1.0E-11
1.0E-10
1.0E-09
1.0E-08
1.0E-07
1.0E-06
1.0E-05
1.0E-04
1.0E-03
1.0E-02
1.0E-01
1.0E+00
1 10 100 1000 10000
Distance from point source (m)
Rela
tive
prim
ary
phot
on fl
uenc
e
Inverse square Exponential Tc-99m
Exponential Cs-137Exponential Co-60Total Tc-99mTotal Cs-137
Total Co-60
Fig 2.1 The reduction of the primary photon fluence with distance from a point source as described in Eqn 1. The dotted blue line shows the reduction due to the component, 1/4r2, generally called the inverse square law, which is independent of photon energy. Hatched curves show the reduction from attenuation in air, e-r, by the exponential attenuation law. Curves are given for Tc-99m (turquoise), Cs-137 (green), Co-60 (lilac). Solid curves show the combined total reduction effect.
2.1.2 The primary fluence when moving along a straight path
When the detector is moving in a straight direction with constant speed, passing a point source located at a certain distance R perpendicular to the path, the distance between the detector and the source varies in time according to: 22 )()( tvRtr (2:3) where v is the constant speed of the detector (and vehicle) and t is the time (Fig 2.2). The time t can be chosen to 0 at the point when the detector passes the source, i.e. at the shortest distance between the detector and the source, where r(t) = r(0) = R. Inserting Eqn 2:3 into Eqn 2:1 yields:
))((4
)( 22
)( 22
tvR
eSt
tvRa
(2:4)
Eqn 2:4 gives the time variation of the primary photon fluence rate at the detector in mobile measurements. For a constant speed, the photon fluence rate can also be expressed as a function of the distance d = vt along the road, where d = 0 at t = 0.
)(4
)( 22
22
dR
eSd
dRa
(2:5)
This function is often called “the intensity curve”. An example of the shape of the intensity
curve is shown in Fig 2.3. It represents the varying signal from the source when the detector moves at a constant speed past the source.

NKS SHIELDMORC Final Report 2019 Page 9 (61)
9
Fig 2.2 Geometry for mobile measurements along a straight road, passing an unshielded point source. For a constant speed v, at time t the vehicle will be at the location d = vt along the road, assuming that t = 0 when the vehicle passes the source at the nearest point. Measurements of the photon fluence can be made in intervals with acquisition time Δt along the road, representing an average of the varying photon fluence rate in time between t and t + Δt or in space along the straight road between vt and v(t+Δt).
The “intensity curve” (the varying primary fluence rate) expressed as a function of distance along the road (Eqn 2:5) is only depending on the distance d along the road, the attenuation coefficient of air a and the distance R from the road to the source. Since the attenuation coefficient is a function of photon energy, the shape of the intensity curve for a given primary photon energy E is thus only depending on the distance R and independent of the activity of the source. If the photon fluence rate is high enough to be accurately measured with a mobile spectrometer along the road, the distance R can be determined from the shape of the curve. By knowing the photon fluence rate and the distance R the photon emission rate, S , from the unshielded source can be calculated using Eqn 2:1. The activity A of the source will be S /, where is the branching ratio (number of photons per decay) for the energy transition E in the source radionuclide.
To be able to make this calculation the measurement statistics in the spectrometer for the primary photon energy E must be sufficiently good to acquire observations in two or more places along the path. During mobile measurement, acquired data will be an average of the photon fluence rate along the part of the road represented by the acquisition time interval. A road part must not be too long in relation to the distance R, because then acquired data will form large discrete steps along the road, which make it difficult to determine the shape of the "intensity curve".
If the photon fluence rate from the source is low, near the detection limit, when the distance to the source is closest, it will be difficult to determine the curve shape accurately enough to be able to calculate the source distance and the activity of the source. A method to use Monte Carlo Markov Chain statistical analysis can somewhat improve the ability of determining
Unshielded gamma ray source
Distance, mobile detector, moving with speed v
R
r
d = v·t
t = 0
v·∆t

NKS SHIELDMORC Final Report 2019 Page 10 (61)
10
distance and activity when the measurement statistics are poor, but the method is not yet sufficiently developed to say with certainty where the potential limit goes. (Bukartas et al, 2018).
Fluence rate from point source
0
500
1000
1500
2000
2500
3000
3500
4000
4500
-300 -200 -100 0 100 200 300
Distance along road from centre line (m)
Rela
tive
units
Fig 2.3. Example of the variation of primary photon fluence rate along a 600 m straight road, where an unshielded gamma ray point source is placed at a certain distance R from the road opposite the road coordinate 0. (See Fig 2.2). The primary photon fluence rate, often called “the intensity curve” (blue line) has a maximum just
opposite the source and drops off at distance. The shape of the curve is formed by Eqn 2:4 and is solely depending on the distance R to the source and the attenuation coefficient of the air for the primary photon energy. If the photon fluence is high enough, the shape can be measured with a detector at different locations along the road (yellow points).
The width and shape of the “intensity curve” changes in function of the distance between the
road and the radiation source as can be seen in Fig. 2.4 for 662 keV photons and Fig 2.5 for 1332 keV photons. It is a clear widening of the “intensity curve” when the distance, R, to the radiation source increases. The widening of the curve can be used to determine the distance between the road and the radiation source if at least two measurements are made along the road path at sufficient distance. One of the measurements should preferably be made where the maximum count rate is obtained (the location on the road with the shortest distance to the source). Since good statistics are required in the measurement data, it may be necessary to extend the measurement times by standing still in the measuring points.
The shape of the “intensity curve” depends on the "inverse square law" and on the exponential
attenuation of the radiation in the air. For distances within a few hundred meters the energy independent “inverse square law” term 1/4πr2 dominates the reduction of the primary fluence. Therefore, there is no big relative difference in the shape and widths of the “intensity curves”
for 662 keV and 1332 keV as long as the distance is within a few hundred meters. So, the same curve shape can be approximately used for a range of photon energies as long as the exponential air attenuation is non-dominant.
Table 2.1 shows relative numerical values of the “intensity curve” at certain distances, d, along the road path for different distances, R, between the road and the radiation source.

NKS SHIELDMORC Final Report 2019 Page 11 (61)
11
Here is an example of how Table 2.1 can be used to estimate the distance between the road and a point source:
A Cs-137 photon source placed 100 meters from the road will produce 71.6% of the maximum fluence at 50 m down the road from the location of the maximum value and 33.8% 100 m down the road from this location. A source placed 150 m from the road will produce 83.4% at 50 m and 52.0% at 100 m down the road. Suppose a measurement of the primary photon fluence from a Cs-137 source gives the reduction 78% at 50 m and 43% at 100 m down the road. This corresponds to values just between the values in the table for 100 m and 150 m. So the distance to the source can be estimated to be about 125 m.
For point sources placed within a few hundred metres from the road a measurement of the photon fluence at the maximum value and at 100 m distance along the road from the maximum value will give reasonable indication of the distance to the source within about ±15 m, provided that both measurements have a statistical uncertainty of less than about 10%. This is provided that the source is unshielded in the direction towards the road.
Table 2.1. The proportion of photon fluence at distances, d, along the road path in relation to the point on the road with maximum fluence, which is the road location closest to the radiation source. Values are given for different distances R between this road location and the source.
Source distance
from road
Photon energy and distance, d, along the road path to the point opposite the source
662 keV 1332 keV
d = 50 m d = 100 m d = 200 m d = 50 m d = 100 m d = 200 m
R = 50 m 0.411 0.112 0.0135 0.434 0.132 0.0204
R = 100 m 0.716 0.338 0.0623 0.738 0.377 0.0864
R = 150 m 0.834 0.520 0.140 0.852 0.564 0.183
R = 200 m 0.888 0.640 0.229 0.903 0.682 0.285
R = 250 m 0.918 0.719 0.314 0.930 0.756 0.379

NKS SHIELDMORC Final Report 2019 Page 12 (61)
12
Relative primary photon fluence, 662 keV
0.0
0.2
0.4
0.6
0.8
1.0
1.2
-300 -200 -100 0 100 200 300
Distance along the road (m)
R = 50 mR = 100 mR = 150 mR = 200 mR = 250 m
Fig 2.4. Relative primary photon fluence at 662 keV along a road path where an unshielded source is placed at different distances R from the road. All maximum values are set to 1.
Relative primary photon fluence, 1332 keV
0.0
0.2
0.4
0.6
0.8
1.0
1.2
-300 -200 -100 0 100 200 300
Distance along the road (m)
R = 50 mR = 100 mR = 150 mR = 200 mR = 250 m
Fig 2.5. Relative primary photon fluence at 1332 keV along a road path where an unshielded source is placed at different distances R from the road. All maximum values are set to 1.

NKS SHIELDMORC Final Report 2019 Page 13 (61)
13
2.2 The primary photon fluence from a shielded point source
2.2.1 The primary fluence after a rectangular wall when moving along a straight path
Consider a situation where the radiation source is shielded with a rectangular wall perpendicu-lar to the direction between the source and the observer. Suppose the wall has thickness b, density b and mass attenuation coefficient (/)b. (Fig 2.6). Then the primary fluence rate at the road location d will be an expansion of Eqn 2:5 to include the photon path through the wall.
)(4
)( 22
2222
22
dR
eSd
R
dRb
R
dRb
dR
b
b
a
aa
a
(2:6)
An example of an “intensity curve” for a 662 keV source at 200 m from the road path shielded
by a 30 cm rectangular wall of water is shown in Fig 2.7. As a comparison the “intensity
curve” without wall (only air shielding) is given.
Fig 2.6 Geometry for mobile measurements along a straight road, passing a point source shielded by a straight wall of a certain thickness, b. The attenuation of primary photons in the wall is depending on the angle of the photons incident on the wall, The more oblique angle, the more primary photons will be attenuated in the wall. This leads to reduced primary photon fluence when the distance along the road from the centre line increases in comparison to a case without wall shielding.
The “intensity curve” with shielding by a rectangular 30 cm wall of water is narrower than without shielding. The curve resembles a situation where the source is placed at a shorter distance, without wall shielding (See Fig 2.4). So the question is: Is shielding by a rectangular wall equivalent to placing a source with lower activity at a shorter distance without wall shielding and with only air attenuation? The answer is: Not fully, as can be seen in Fig 2.7b.
Oblique penetration through the wall attenuates radiation more than straight penetration
Gamma ray source shielded behind a rectangular wall
Distance, mobile detector, moving with speed v
R
r
d = vt
b

NKS SHIELDMORC Final Report 2019 Page 14 (61)
14
In this figure a comparison is made with the “intensity curve” for an unshielded source placed at R = 140 m and its activity reduced to 2.1%. The two curves nearly overlap at distances close to the maximum, but differ when the distance along the road increases. The attenuation for larger oblique angles is larger when the radiation penetrates the wall than when there is only air attenuation.
Relative primary photon fluence, 662 keV
0
0.2
0.4
0.6
0.8
1
1.2
-300 -200 -100 0 100 200 300
Distance along the road (m)
Including air attenuationShielding by 30 cm water
Fig 2:7a Relative primary photon fluence (“intensity curve”) along a road path where a 662 keV source shielded
by a 30 cm thick rectangular wall of water is placed at distance R = 200 m from the road (yellow curve). As a comparison the “intensity curve” for an unshielded source at the same distance is shown (red curve). All
maximum values are set to 1.
Relative primary photon fluence, 662 keV
0
0.2
0.4
0.6
0.8
1
1.2
-300 -200 -100 0 100 200 300
Distance along the road (m)
Shielding by 30 cm waterCompared air attenuation
Fig 2:7b Relative primary photon fluence (“intensity curve”) along a road path where a 662 keV source shielded by a 30 cm thick rectangular wall of water is placed at distance R = 200 m from the road (yellow curve), compared to an unshielded source at 140 m with 2.1 % of the activity (turquoise curve). All maximum values are set to 1.

NKS SHIELDMORC Final Report 2019 Page 15 (61)
15
2.2.2 The primary fluence after a cylindrical wall when moving along a straight path
If the shield is a cylindrical wall instead of a rectangular wall the shielding will be the same in all direction as seen from the centre of the cylinder (Fig 2.8). There is no oblique penetration effect. Suppose the cylindrical wall thickness is c, the density c and mass attenuation coefficient (/)c. Then the primary fluence rate at the road at location d will be:
)(4
)( 22
22
dR
eSd
ccdR c
c
a
a
a
a
(2:7)
This is equal to
)(4
)( 22
22
dR
eeSd
ccdR c
c
a
a
a
a
(2:8)
The second exponential term depends only on the radius of the cylinder and the corresponding attenuation of photons travelling a distance equal to the radius. It is constant for a given cylinder. Thus, introducing a cylindrical shield will not change the shape of the “intensity curve” )(
.
d , only the amplitude. The cylindrical shield acts as if a point source with lower activity would have been placed in exactly the same position as the original source without a shield.
Fig 2.8 Geometry for mobile measurements along a straight road, passing a point source shielded by a cylindrical wall of a certain thickness, c. The attenuation of primary photons in the cylindrical wall is the same in all directions from its the centre point. This leads to equivalence with an unshielded source at the same distance R,
but with reduced activity equal to the attenuation of primary photons in the shield.
Definition of apparent activity. The similarity between cylindrical shielding and reduced source activity also brings the fact that the model for calculation of maximum detection distances for point sources is valid also for sources shielded by cylinders, if a reduced activity of the source is presumed. The reduced activity is here defined as apparent activity. The reduction from the true activity corresponds to the primary photon attenuation in the shield
Gamma ray source shielded behind a cylindrical wall of thickness c
Mobile detector, traveling direction with speed v
R
r d = vt
Primary photons are attenuated equally in all directions

NKS SHIELDMORC Final Report 2019 Page 16 (61)
16
material. One can thus simulate a radiation source with lower activity by placing a cylindrical shield around it. The calculated detection distance tables can be used, as they are, if one reduces the source activity to numerically correspond to the loss of primary photons due to attenuation in the shield.
Fig 2.9 shows an example of the equivalence between cylindrical shielding and apparent activity of a point source in mobile measurement:
At 200 m distance from an unshielded 662 keV source, the primary photon fluence rate is 3·10-7 photons per m2s per emitted photon from the source. A 10 cm cylindrical shield of water reduces the primary photon fluence to 1.27·10-7 photons per m2s, i.e. 42.3% of the fluence rate from the unshielded source. If a source with 43.2% reduced activity is placed at the same distance, it provides exactly the same primary photon fluence rate as from the higher activity shielded source.
For a rectangular shield, the attenuation is not compatible with a cylindrical shield. This leads to deviation in the “intensity curve” towards lower values of the curve along the road path at
distance from the centre line. The “intensity curve” will therefore seem narrower as if a source
with reduced activity would have been closer to the road.
Primary photon fluence rate, 662 keV
0.0E+00
5.0E-08
1.0E-07
1.5E-07
2.0E-07
2.5E-07
3.0E-07
3.5E-07
-400 -300 -200 -100 0 100 200 300 400
Distance along the road (m)
Prim
ary
fluen
ce ra
te (s
-1 m
2 )
Unshielded source
Cylindrical shielding by10 cm waterAir attenuation only withreduced source activity
Fig 2.9 Primary photon fluence rate (“intensity curve”) along a road path from an unshielded 662 keV source at
200 m from the road (red curve) and the same source shielded by a 10 cm cylindrical wall of water (yellow curve). This is compared with an unshielded source at 200 m with an apparent activity (i.e. reduced source activity) to 42.3 % of the true activity of shielded source (turquoise dotted curve). The latter two curves overlap exactly, because the attenuation in the shield is exactly matched with the reduced source activity.
2.3 The scattered photon fluence from a point source
The equivalence of primary photon fluence reduction by cylindrical shielding and apparent source activity is not valid for scattered photon fluence. The scattered fluence increases due to photons interacting in the shield. This can be used to provide a rough estimate of the thickness of the shield and thereby also obtain an estimate of the true activity of the source behind the shield. The method, however, requires careful comparative measurements using different shielding materials and thickness. To understand how scattered photons can be used to detect the thickness of a radiation shield, one needs to look at the theory of Compton scattering.

NKS SHIELDMORC Final Report 2019 Page 17 (61)
17
2.3.1 Photon energies from Compton scattering
Compton interaction follows a well-known law. The energy EC (keV) of the scattered photon can be calculated by the equation:
cos11
0
E
E
EE
p
p
C (2:9)
Ep is the primary (unscattered) photon energy, E0 is the resting energy of the electron (510.999 keV), and is the angle of the Compton scattered photon relative to the direction of the primary photon.
In Compton scattering, photon energies and angles are independent of the material. For 662 keV primary photons, Compton scattered photons will have energies from 184 keV for =
180 degrees (backscattering) up to 662 keV (forward scattering). The relationship between scattering angles and photon energies is shown in Fig 1.
Compton scattering of 662 keV photons
0
100
200
300
400
500
600
700
0 20 40 60 80 100 120 140 160 180
Angle / degrees
Phot
on e
nerg
y / k
eV
Fig 2.10. Relationship between scattering angle and energy of the scattered photon for Compton scattering of 662 keV primary photons.
2.3.2 Energy range of Compton photons detectable with NaI(Tl)-spectrometers
The ability to detect the energy of Compton scattered photons depends on the resolution capability of a gamma spectrometer. HPGe spectrometers can, through their high resolution, detect the energies of Compton scattered photons and hence scattering angles better than low-resolution NaI (Tl)-spectrometers. However, as the latter are more common for mobile gamma spectrometry, their ability and limitation for detection of Compton photons needs to be studied.
Good quality NaI(Tl)-spectrometer can have an energy resolution FWHM of about 6 - 7 percent at 662 keV, which corresponds to about 40 - 46 keV. The energy resolution for the 4-

NKS SHIELDMORC Final Report 2019 Page 18 (61)
18
liter NaI(Tl)-spectrometer used by Lund University to investigate Compton scattering in this work was about 50 keV. Thus, in order to resolve a registration of a Compton photon in the pulse height distribution, it must have an energy of at least 50 keV lower than the primary energy 662 keV, i.e. 612 keV. In order to cope with slightly worse conditions with amplification drifts, it has been assumed here that a Compton photon must have no higher energy than 600 keV in order to be distinguished from the registrations of primary photons in the pulse height distribution. This corresponds to a scattering angle of 23 degrees or more (Eqn 2:9 and Fig 2.10).
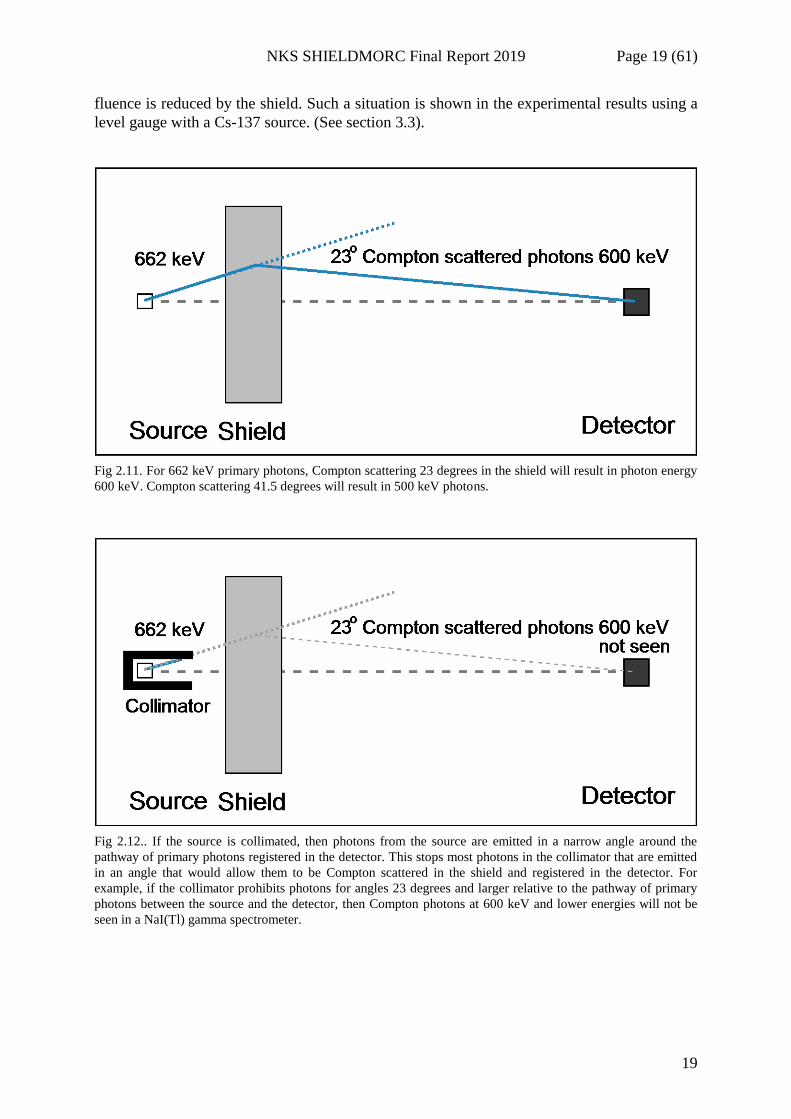
2.3.3 Non-collimated sources
Fig 2.11 is a schematic representation of Compton scattering from a point source behind a shield. While the primary photons recorded by the spectrometer have progressed straight through the shield to the detector (here denoted as the central axis), the Compton photons originate from interactions in the shield that occurred somewhere on the side of the central axis. Therefore, in order to detect Compton scattered photons by a gamma spectrometer located on the central axis (where primary photons are detected), the source must be open enough so that photons can be emitted at a sufficient angle to the central axis.
Of course, Compton interaction also occurs in materials other than in the shield between the source and the detector, such as in the air and the ground between the source and the detector, in the detector housing and in materials in the detector proximity. Many of the primary photons from the source will be scattered at larger angels in the air, the ground and the detector housing than nearly forward (23 degrees) and recorded at lower energies than 600 keV. Therefore, registrations in the region of 600 keV and slightly below mainly provide characteristics of a combination of the shielding material and its thickness and the opening angle of the radiation source.
2.3.4 Collimated sources
If the source is collimated (radiation is mainly emitted in one direction), Compton photons from the shield will be reduced (Fig 2.12). In order to obtain photons in the detector origination from Compton interactions in the shield, simultaneously with primary photons along the central axis, the source needs to have sufficient opening angle. To be able to register photons in the range 500 - 600 keV, the source needs to have up to 42 degree aperture relative to the central axis, i.e. a total of 84 degrees opening towards the detector. If the source is collimated e.g. to a 20 degree opening, i.e. 10 degrees relative to the central axis, the energies of the Compton photons will be in the interval 649 - 662 keV. This contribution cannot be distinguished from the primary energy 662 keV with a NaI(Tl)-spectrometer. However, it should work with a high-resolution HPGe spectrometer.
A collimated photon source placed behind a shield, from which it is possible to measure primary photons that have passed through the shield, does not produce measurable Compton photons at 600 keV or lower if the aperture of the collimator seen from the source point is less than 44 degrees (except for the minor contribution of Compton photons produced by primary photons that have penetrated the collimator and interacted in the detector housing). Collimated source geometries exist in various radiation apparatus, e.g. level gauges. From these, one cannot expect measurable Compton radiation produced in a shield in front of the apparatus if the primary radiation is clearly detectable (the collimator opening is directed towards the detector). This makes it difficult to estimate the thickness of a shield by looking at photons recorded in the range 500 - 600 keV. The absence of Compton scattered photons would indicate a source without shielding, but with lower activity because the primary photon
NKS SHIELDMORC Final Report 2019 Page 19 (61)
19
fluence is reduced by the shield. Such a situation is shown in the experimental results using a level gauge with a Cs-137 source. (See section 3.3).
Fig 2.11. For 662 keV primary photons, Compton scattering 23 degrees in the shield will result in photon energy 600 keV. Compton scattering 41.5 degrees will result in 500 keV photons.
Fig 2.12.. If the source is collimated, then photons from the source are emitted in a narrow angle around the pathway of primary photons registered in the detector. This stops most photons in the collimator that are emitted in an angle that would allow them to be Compton scattered in the shield and registered in the detector. For example, if the collimator prohibits photons for angles 23 degrees and larger relative to the pathway of primary photons between the source and the detector, then Compton photons at 600 keV and lower energies will not be seen in a NaI(Tl) gamma spectrometer.

NKS SHIELDMORC Final Report 2019 Page 20 (61)
20
2.4 Calculations of scattered radiation from a point source using Monte Carlo
technique
The possible presence of shielding material complicates estimates of the true activity of a source. It is necessary to have an understanding of the spectrum of scattered photon fluence due to different shielding thickness, material, photon energy and albedo from the ground and the additional detector effects when the photon spectrum is converted to a pulse height distribution by the gamma spectrometer.
2.4.1 Normalized scattered fluence
Some preliminary calculations of the photon fluence spectrum have been done in this project by using MCNP Monte Carlo calculations (Werner et al, 2018), where the photon fluence spectrum was calculated for continuous energies and the results given in predefined 10 keV intervals for varying distance from a point source in unshielded geometry (only air shielding) and with different shielding material and thickness.
In order to illustrate the scattering effect regardless of the activity of the source, the amount of scattered radiation is studied relative to the amount of primary radiation.
Definition of normalized scattered fluence: The ratio of scattered photon fluence to primary photon fluence from a source is here called normalized scattered fluence. It is calculated per energy interval. In this theoretical study the energy interval is chosen to 10 keV. For experimental gamma spectrometric measurements, the energy interval can be taken as the width of a channel, the width of an number of channels (Region of Interest, ROI) or the width of a full energy peak.
Examples: Some examples of Monte Carlo calculated normalized scattered fluence from a Cs-137 point source is given here:
Fig 2.13 shows the normalized scattered fluence one meter above ground at distances 10, 30, and 100 m from an unshielded Cs-137 point source one meter above ground. The scattered radiation increases at lower energies and with increasing distance to the source. The Compton backscatter peak is clearly seen at 10 and 30 m distance at about 170 keV and less clearly at 100 m distance because multiple Compton scattering begins to dominate at larger distances.
Fig 2.14 shows the normalized scattered fluence, for a source shielded by 10 cm wood. The increase of scattered radiation at lower energies at 10 and 30 m is about 2 - 3 times that of an unshielded source due to the increased Compton scattering in the shield. It is a little less than 2 at 100 m, where the scattering effect from the shield is more mixed in with the air scattering at longer distances.
Fig 2.15 shows how much a 3 cm wooden shield contributes to scattered photon fluence in comparison with only air scattering from an unshielded source. The extra-scattered fluence from the wood shield is quite evenly distributed over all energies with a ratio of about 1.4 - 1.5 for most energies at distances 10 m and 30 m. At 100 m the extra-scattered fluence from the shield is a little lower, about 1.2
Fig 2.16 shows how much a 10 cm wooden shield contributes to scattered photon fluence in comparison with only air scattering from an unshielded source. The extra-scattered fluence is in the order of 2 - 3 for 10 and 30 m distance from the source and a little less than 2 for 100 m distance.

NKS SHIELDMORC Final Report 2019 Page 21 (61)
21
Scattered/Primary photon fluence, unshielded source 662 keV
1.E-05
1.E-04
1.E-03
1.E-02
1.E-01
1.E+00
1.E+01
0 100 200 300 400 500 600 700
Photon energy (keV)
10 m30 m100 m
Fig 2.13. Normalized scattered radiation one meter above ground at distances 10, 30, and 100 m from an unshielded Cs-137 point source.
Scatterd/primary photon fluence, source 662 keV with 10 cm wood shield
1.00E-05
1.00E-04
1.00E-03
1.00E-02
1.00E-01
1.00E+00
1.00E+01
0 100 200 300 400 500 600 700
Photon energy (keV)
10 m30 m100 m
Fig 2.14. Normalized scattered radiation from a Cs-137 point source one meter above ground, shielded with 10 cm wood.

NKS SHIELDMORC Final Report 2019 Page 22 (61)
22
Scatterd/primary photon fluence from source shielded by 3 cm wood divided by scattered/primary photon fluence from an unshielded source, 662 keV
0
1
2
3
4
5
6
7
0 100 200 300 400 500 600 700
Photon energy (keV)
10 m30 m100 m
Fig 2.15. Ratio of normalized scattered radiation from a 3 cm wood shielded source to normalized scattered radiation from an unshielded source. Values are given for source distances of 10 m, 30 m, and 100 m. The source and observer is one meter above ground. The curves show the excess of scattered photon fluence created by the wood shield.
Scatterd/primary photon fluence from source shielded by 10 cm wood divided by scattered/primary photon fluence from an unshielded source, 662 keV
0
1
2
3
4
5
6
7
0 100 200 300 400 500 600 700
Photon energy (keV)
10 m30 m100 m
Fig 2.16. Ratio of normalized scattered fluence from a 10 cm wood shielded source to normalized scattered radiation from an unshielded point source of Cs-137. Values are given for source distances of 10 m, 30 m, and 100 m. The source and detection point are one meter above ground. The curves show the excess of scattered photon fluence created by the wood shield.

NKS SHIELDMORC Final Report 2019 Page 23 (61)
23
Monte Carlo calculations of scattered radiation indicates that at least in theory it should be possible to estimate the thickness of a shield from analysis of the normalized scattered fluence if the distance to the source is within 100 m. The material of the shield will be difficult to determine, but its thickness expressed in mean free paths of the primary photons may be possible to estimate. Together with knowledge of the distance to the source, its true activity can then be estimated.
2.4.2 Measurements of pulse height distributions for scattered radiation to be incorporated
in a “knowledge library”
When using a gamma spectrometer to measure photon fluence, measurement data will be distorted by the detector's energy-dependent absorption and scattering effects on the photons reaching the detector. This results in an energy distribution of the measured pulses (the pulse height distribution) from the photons interacting in the detector, which differs from the energy distribution of the photon fluence. Photons with lower energies are more likely to be registered in the pulse height distribution than photons with higher energy. The detector has a higher efficiency (to a certain limit) for detecting lower energy photons. The efficiency depends on the detector’s surface area in relation to the incident direction of the photons and
on the volume of the detector. Because the detector efficiency increases with lower energies, the spectrometer’s registrations will be enhanced for scattered radiation at lower energies. In addition, other effects such as Compton photon escape from the detector and scattering in the detector housing will further distort the pulse height distribution in the energy region of scattered photons. This distortion may be calculated with Monte Carlo methods, but there will still be uncertainties because of difficulties of exact modeling of the detector geometry and surrounding material. Therefore, experimental measurements of the pulse height distribution should be carried out for various shielding geometries to determine how the registered scattered component of the radiation changes with shield thickness, material and distance. Results from such experimental measurements of scattered radiation are given in Section 4. This kind of “calibration” measurements for specific source, shielding, distaste and detector
combinations will constitute part of the knowledge library, which is intended as a tool to assess radiation shielding in future real-world situations.
2.3.2 Use of the variation of scattered radiation along the road to estimate the shielding of a
point source
With mobile gamma spectrometry, several measurements of the scattered fluence contribution (i.e. the pulse height distribution) can be made along the road. For thicker shields and longer distances to the source the contribution of scattered radiation increases most in the low energy region 50 - 150 keV. This effect may be used to estimate whether a source is shielded or not and could possibly also provide a hint of the thickness of a shield.
Increased registration in a spectrometer’s low energy region without any trace of a full energy
peak, may indicate pure ”skyshine”, which could have its origin in a source with high activity,
but heavily shielded in the direction of the detector, for example a source placed in a cellar in a house along the road. The distance over which there is an increased ”skyshine” without a
primary contribution may indicate if the source is close or far away.

NKS SHIELDMORC Final Report 2019 Page 24 (61)
24
3. Equipment and measuring methods
In most of the measurements described in this report, a measurement system from Lund University was used as described below. In a joint experiment conducted in 2018 where all Nordic teams participated, the respective teams' mobile equipment was used as described under measurement systems used by the Nordic countries.
3.1 Measuring equipment
3.1.1 The Lund University measuring system
For all measurements against point sources, an Exploranium GR 460 mobile gamma spec-trometer from Lund University was used with a 4 liter NaI(Tl) crystal. The spectrometer registers the pulse height distribution at one-second intervals. Since all measurements were made stationary, measurement data were summed to acquisition times varying between 3 and 100 minutes, depending on the shield thickness and material. Longer acquisition times were used when the radiation source was heavily shielded. Acquisition times were chosen long enough to obtain reasonably good measurement statistics (less than 1% standard deviation, background subtracted) in the full energy peak for each nuclide (662 keV for Cs-137 and 1332 keV for Co-60). Background measurements were taken at each location for acquisition times between one hour and several hours
3.1.2 Measuring systems used by the Nordic countries
Denmark.The measurement car from DEMA, Denmark, is a converted VW Multivan with room for a driver, a co-driver and two operators. One driver and one operator normally operate the car. The car is equipped with an RSI RS-700 system with two detectors connected, an RSX-1 4L NaI(Tl) and a RSX-3x3 (0.39L) NaI(Tl) crystal, but only the 4 L detector was used for this experiment. The detectors are placed in a box mounted on the roof of the car, with the detectors mounted in line, with the small detector in front of the large detector. The system is connected to a computer inside the car, which is running RadAssist 6.0.4.0.
Finland. Team STUK from Finland used two four-liter NaI(Tl) detectors mounted inside a MB Sprinter van called SONNI2. SONNI2 is a new version of the radiological emergency response vehicle developed by STUK. The vehicle has identical detector packages (Environics RanidPort Mobile) mounted vertically on the floor near the opposing walls of the vehicle. The detectors are moderately collimated with 20 mm steel plates that cover the 180 degree view facing the inside of the vehicle. This type of collimation gives a distinct difference between the signals from the two detectors and the source of the radiation can be localized to either the right side or the left side of the vehicle. The results of the STUK team are the consolidated detections from these two detectors; when the source was on the right side of the vehicle, the right detector was used and vice versa.
Iceland. The Icelandic team used a SPARCS mobile survey system. It consists of two 2L NaI(Tl) detectors connected to an acquisition unit (ATU). The ATU is connected to a laptop computer with a special software called AVID. The detector was placed in the back seat of a hired station wagon near the right door. This would be a typical configuration in case of a search for a lost or stolen radiation source.
Norway. The spectrometer from NGU, Norway, was mounted inside a Toyota HiAce van. The measuring system was an RSX-5 system (Radiation Solutions, Canada), also belonging to NGU. RSX-5 is a 20 L NaI(Tl) system, consisting of five 4 L NaI(Tl) crystals. The system was positioned behind the passenger seat - front right in the rear compartment. It was oriented

NKS SHIELDMORC Final Report 2019 Page 25 (61)
25
vertically with the four "downward" crystals on the right-hand side of the vehicle. One “upward” crystal was situated on the other side of the four downward crystals in such a way
that it was mostly shielded by the four "downward" crystals for radiations coming from right side and opened for radiations coming from left side of the vehicle. In all of the analysis, which follows, we have used the summed signals from the four "downward" crystals as detector 1, giving us an active volume of 16 L; the signal from the "upward" (left) crystal is referred as detector 2 with an active volume of 4 L. The signals from all the crystals are processed in an onboard spectrometer and exported via TCP/IP to a laptop in the front cabin of the vehicle, running RadAssist software. RadAssist software controls data acquisition, monitoring, and analysis of data, and allows secondary software packages to access the same live data stream from the device. Real time data acquisition and analysis was performed using RadAssist and post-acquisition analysis was done using Geosoft software.
Sweden. The Swedish mobile measuring systems designed and owned by the Swedish Radiation Safety Authority (SSM) were based on Chevrolet Silverado pickup vans. SSM operated one system and Lund University another. Detectors and electronics were mounted in the service beds of the cars. The mobile spectrometric system consisted of four detectors; two sodium iodide detectors (NaI(Tl)) with the dimensions 430 x 102 x 102 mm (L x W x H) (4 L). Ths system operated by Lund University also had one 76.2x76.2 mm (3"x3", Ø x L) cylindrical NaI(Tl)-detector and one high purity germanium detector (HPGe) with a relative efficiency of 123%. The signal from the two 4 L NaI(Tl) detectors were added to get better statistics. Thus, the effective volume of the 4 L NaI(Tl) detectors were 8 liters (8 L). The two 4L NaI(Tl) detectors were attached to the ceiling of the service compartment 1.67 meters above the ground (to detector center). The HPGe detector was mounted in a rack and facing backwards, 1.54 m above ground. The 3"x3" NaI(Tl) detector was placed in the back 1.02 m above ground (to detector center) .The detectors had free line of sight in 90 degrees relative to the driving direction except for the plastic doors that covered the sides of the service compartment.
3.2 Radiation sources
The radiation sources used in the experiments can all be considered point-shaped in relation to the distances between the radiation source and the detector. Radiation sources that allowed the emission of photons in all directions are here called non-collimated sources. One radiation source (level guard) was provided with a built-in lead shield that allowed emission of photons mainly within a narrow angular range. This is here referred to as a collimated source.
3.2.1 Non-collimated sources
A Cs-137 point source with activity 10 MBq was placed in a trailer that could be moved to distances between about 10 to 80 m meter from the 4-liter NaI(Tl)-detector. Wooden blocks and clay bricks combined to different thickness were used as shielding material around the source. (Fig 3.1 and 3.2 showing shielding with clay bricks). Measurements with shielding material in place were made at 10 and 20 m distance. Measurements without shielding material were made in 20 m intervals from 20 to 80 m.
A few measurements were also made with a 60 MBq Co-60 source at 20 m distance from the detector using 1 - 5 clay bricks as shielding material.
In a close-distance set-up, a Cs-137 point source with activity 345 kBq, was placed 1 m from the 4-liter NaI(Tl)-detector. Wood blocks and clay bricks combined to different thickness were used as shielding material.

NKS SHIELDMORC Final Report 2019 Page 26 (61)
26
These geometries should allow for measurement of Compton scattered photons from the shield. Compton scattering 23º or more from a 662 keV source will produce photons with energies 600 keV or less (Fig 2.10). This energy difference can be resolved with a NaI(Tl)-spectrometer.
Fig 3.1 Non-collimated source geometry. Point sources of Cs-.137 and Co-60 (location indicated by the arrow), were used in this shielding geometry, with 1 - 5 clay bricks and 1 - 7 wooden blocks, in this picture with 5 clay bricks (500 mm) as a shield between the source and the detector. The detector is placed at various distances 1 - 20 m to the right of the shield, depending on the source activity.

NKS SHIELDMORC Final Report 2019 Page 27 (61)
27
Fig 3.2 Non-collimated source geometry. Point sources of Cs-.137 and Co-60 were used in this shielding geometry, with 1 - 5 clay bricks and 1 - 7 wooden blocks, in this picture with 5 clay bricks (500 mm) as a shield between the source and the detector and a thickness of one clay brick surrounding the source in all other directions. The detector is placed at various distances 1 - 20 m to the right of the shield, depending on the source activity.
3.2.2 Non-collimated Co-60 source with heavy lead shielding
In the final sub-study of AUTOMORC 2018 (Rääf et al, 2018), the four Co-60 point sources (named S-1, S-2, S-3 and S-4) were placed together in a cylindrical lead shield container. The total activity of the sources was 1127 MBq. The thickness of the cylindrical shield was about 6 cm. This reduces the primary photon fluence rate from the Co-60 photons down to about 0.19% of the original for 1,17 MeV and 0.27% of the original for 1.33 MeV photons. Fig 3.3 shows the cylindrical shield. Fig 3.4 shows the location of the four sources inside the shield with the top lid removed. For the shielding measurements described here, the top-lid was in place as in Fig 3.6.
The shield container with the Co-60 sources was mounted on a car trailer to facilitate moving the sources to different distances from the road where the measurement vehicles were (Fig 3.5). The distance to the roadside was 30 m. This produces an ambient dose equivalent rate of about 0.05 µSv/h at the roadside from the Co-60 source. During the last 10 minutes of the experiment, the source was moved to 20 m from the roadside.
Since measurements against the shielded source were made stationary by all the Nordic teams at the same time, and the source once moved from 30 to 20 m to distance from the roadside in order to increase the detection probability, the distances to the source became a bit different for the different teams. However, this is of little importance to the results, as all the analysed measurement results are given in relation to the ROI count rate for primary photons. Fig. 3.6 shows the vehicle of the Danish measurement team in the measuring position on the opposite side of the road (about 35 m from the source).

NKS SHIELDMORC Final Report 2019 Page 28 (61)
28
Fig 3.3. The shielded source container with the Co-60 sources used in the shielding experiment.
Fig 3.4. The lead container with the top lid removed to show the position the sources. The four Co-60 sources were inside the small red tubes at the bottom of the lead container The thickness of the lead shield around the sources was about 6 cm.
Fig 3.5 The shielded Co-60 source in the trailer for easy movement to different distances from the main road where the vehicles with the mobile spectrometers were parked. The source in the trailer was initially placed 30 m from the main road (2018-06-07 14:00 - 14:20) and then moved to 20 m distance in order to increase the detection probability (14:20 - 14:30).

NKS SHIELDMORC Final Report 2019 Page 29 (61)
29
Fig 3.6. The Danish (DEMA) team the measuring vehicle parked on the main road just opposite the small road where the trailer with the shielded Co-60 source was placed.
3.2.3 Collimated source
A lead-collimated level guard with a Cs-137 source of 520 MBq was used at the distance 17 m from the 4-liter NaI(Tl)-detector. Wood blocks and clay bricks combined to different thickness were used as shielding material in front of the source. (Fig 3.7, 3.8 and 3.9). The opening angle of the collimator, seen from the source towards the detector, was in the horizontal direction 12 degrees and in the vertical direction 18 degrees. With the central axis pointing towards the detector (i.e. the path of primary photons), the maximum angle that primary photons could hit the shield in front of the level guard was 6 degrees in the horizontal direction and 9 degrees in the vertical direction. This would produce Compton photons at the detector with energies between 657 and 662 keV in the horizontal direction and between 651 and 662 keV in the vertical direction. These cannot be resolved from registrations in the primary full energy peak when using a NaI(Tl)-spectrometer. (Compare with Fig 2.12).
3.2.4 Dimensions of the shielding material
The thickness of the clay bricks used, as shielding material was 50 mm and their density 2120 kg/m3. From 1 to 7 clay bricks were used as shielding. The thickness of the wooden blocks was 45 mm and their density 520 kg/m3. From 1 to 7 wooden blocks were used as shielding. The maximum number of clay bricks and wooden blocks was somewhat different for different experiments. The number used in each experiment is reported together with the results in section 4.

NKS SHIELDMORC Final Report 2019 Page 30 (61)
30
Fig 3.7 Collimated level guard with a 520 MBq Cs-137 source placed in radiation position as seen from the detector location. The distance between the source and the detector was 16.7 m. The opening angle of the collimator, seen from the source towards the detector, was in the horizontal direction 12 degrees and in the vertical direction 18 degrees.
Fig 3.8 Collimated source geometry. Clay bricks (1 - 5 bricks, 50 - 250 mm) were used as shielding material in front of the collimated Cs-137 source, in this picture with one clay brick supported by wood blocks underneath.

NKS SHIELDMORC Final Report 2019 Page 31 (61)
31
Fig 3.9 Collimated source geometry. Wooden blocks (1 - 10 blocks, 45 - 450 mm) were used as shielding material in front of the collimated Cs-137 source, in this picture with 8 blocks.
3.3 Data analysis
Ideally, spectral information in the form of the entire pulse height distribution would be used in the analysis of scattered radiation from an unshielded or shielded source. This is the case for the measurements made with the Lund University GR 460 system. However, when data from different teams with different measuring systems have to be used and compared, using spectral data is complicated because different measurement systems produce outputs in non-compatible data formats. Instead, a set of regions of interest (ROI) representing different parts of the photon energy spectrum has been used. It is easier to implement and all participants can produce ROI measurement data. If the ROIs are chosen optimally, the ratio of their net count rates will give an approximate representation of the scattered photon fluence from the source. The choice of ROIs for NaI(Tl)-detectors with explanation is given in Table 3.1 for Cs-137 and Table 3.2 for Co-60.
Table 3.1. ROIs in the pulse height distribution of a NaI(Tl)-detector that are representative for primary energies and Compton scattered photons from Cs-137. Due to the low resolution of the detector type, there is an additional distribution of count rate registrations across ROI limits. ROI Used for 51 - 216 keV Compton scattered 662 keV photons 126 - 180 degrees (Backscatter) 226 - 391 keV Compton scattered 662 keV photons 62 - 119 degrees (“Medium” angle scatter) 402 - 567 keV Compton scattered 662 keV photons 29 - 60 degrees (“Small” angle scatter) 579 - 744 keV Primary photons 662 keV Table 3.2. ROIs in the pulse height distribution of a NaI(Tl)-detector that are representative for primary energies and Compton scattered photons from Co-60. Due to the low resolution of the detector type, there is an additional distribution of count rate registrations across ROI limits. ROI Used for 200 - 350 keV Compton scattered 1173 keV photons 91 - 180 degrees and Compton scattered

NKS SHIELDMORC Final Report 2019 Page 32 (61)
32
1332 keV photons 94 - 180 degrees (Backscatter) 565 - 715 keV Compton scattered 1173 keV photons 44 - 58 degrees and Compton scattered
1332 keV photons 48 - 61 degrees (“Medium” angle scatter) 930 - 1080 keV Compton scattered 1173 keV photons 16 - 28 degrees and Compton scattered
1323 keV photons 24 - 33 degrees (“Small” angle scatter) 1090 - 1240 keV Primary photons 1173 keV and Compton scattered 1332 keV photons 14 - 24
degrees (“Small” angle scatter of 1332 keV photons) 1250 - 1400 keV Primary Photons 1332 keV In order to analyze the net contribution of scattered photons from the radiation source, the contribution from the natural background must be subtracted. If one has no previous background measurements at the current location, another representative background must be used. For the measurements made by all the teams during the AUTOMORC 2018 experiment, an average value of the natural background along Kraftverksvägen in Barsebäck has been used, although this is not fully representative for the background at the site of the Co-60 shielding measurements.
Since the analysis is based on the ratio of photon fluence rates of scattered radiation to primary radiation, the source activity does not matter. The distance between the source and detector has some influence but it varies slowly with distance, which was shown for Cs-137 in a separate experimental study (SHIELDMORC, second progress report, 2019).

NKS SHIELDMORC Final Report 2019 Page 33 (61)
33
4. Results and discussion
To investigate if Compton scattered photons measured by a gamma spectrometer can be used to obtain information about shielding material that may be present in front of a gamma emitting point source, a number of measurements of the pulse height distribution in a 4 liter NaI (Tl) spectrometer have been recorded for three different shielding materials (wood, burnt clay brick and lead) for three detector-source distances between 1 and 20 m.
4.1 Non-collimated source. Shielding experiments at source detector distance 10 -
80 m
A 10 MBq Cs-137 point source was placed in a trailer that could be moved to different source-detector distances. The gamma spectrometer was the Lund University 4-liter NaI(Tl)-detector. Wooden blocks and clay bricks combined to different thickness were used as shielding material in front of the source. In one set-up, a lead shield around the source was used. Shielding measurement data are compared to results without shielding (air only).
4.1.1 Cs-137 source with air only, source-detector distance 20 - 80 m
Fig 4.1 shows the net (background subtracted) normalized (to the full energy peak count at 662 keV) pulse height distributions from the unshielded source (only Compton scattering in the air) measured at different distances between 19.6 and 79.6 meters from the detector. There is only minor contribution of forward (23 degrees) scattered photons in the air just below 600 keV. There is a small increase in scattered radiation at energies between 186 and 350 keV from photon scattered between 70 degrees (side scatter) and 180 degrees (backscatter). Below 186 keV there is an increase in the relative pulse height distribution due to multiple scattered photons in the shield, air, detector surroundings and the detector itself. To conclude, air scattering does not notably increase the scattered photon fluence just below 600 keV for a 662 keV photon source, at least not up to 80 meter distance from the source.
4.1.2 Cs-137 source with wood shield, source-detector distance 20 m
Fig 4.2 shows the net normalized pulse height distributions from the source at 19.6 m, unshielded and with 1 - 7 wooden blocks as shielding material in front of the source. There is an increase below 600 keV in the normalized pulse height distribution from Compton photons scattered 23º or more for increasing number of wooden blocks in the shield. The normalized increase factor in the count rate at 600 keV (in relation to the full energy peak) is about 1.6 times when going from no shielding to 225 mm wood shielding (5 blocks) and about 1.9 times for 315 mm (7 blocks).
4.1.3 Cs-137 source with burnt clay shield, source-detector distance 10 m
Fig 4.3 shows the net normalized pulse height distribution from the source at 9.6 m, unshielded and with 1 - 7 burnt clay bricks as shielding material around the source. An increase in the relative pulse height distribution can be seen below 600 keV for increasing number of clay bricks. The normalized increase factor in count rate at 600 keV is about 2.5 times when going from no shielding to 150 mm clay brick shielding (3 bricks). For 250 mm (5 bricks) the increase is 3.2 times compared to an unshielded source. For 350 mm (7 bricks) the increase is 6.5 times, which is so much that the primary 662 keV peak hardly can be discerned.

NKS SHIELDMORC Final Report 2019 Page 34 (61)
34
Net normalized pulse height distribution from Cs-137 with air-only shielding at different source-detector distances
0
50
100
150
200
250
0 100 200 300 400 500 600 700 800 900 1000
Photon energy / keV
Nor
mal
ized
cou
nt ra
te /
%
Air 19.6 mAir 39.6 mAir 59.6 mAir 79.6 m
Fig 4.1. Net normalized pulse height distribution (background subtracted) from a 10 MBq Cs-137 source, recorded by a 4-liter NaI(Tl)-spectrometer at four different distances from 19.6 m to 79.6 m from the source. The maximum count rate in the full energy peak is set to 100 for each measurement. There is almost no increase in forward (23 degrees) scattered photon fluence around 600 keV with increasing distance, but a small increase can be seen for single Compton scattering for larger angles (70 - 180 degrees producing photons in the range from 360 keV down to 184 keV) and for multiple scattering (photons detected in the range 50 - 183 keV).
Net normalized pulse height distribution from Cs-137 with stepwise increasing wood block shielding
0
50
100
150
200
250
0 200 400 600 800 1000
Photon energy / keV
Nor
mal
ized
cou
nt ra
te /
%
No shield1 wood block2 wood blocks3 wood blocks4 wood blocks5 wood blocks6 wood blocks7 wood blocks7 wood blocks no side
Fig 4.2. Net normalized pulse height distribution (background subtracted) from a 10 MBq Cs-137 source with different wood shielding thickness shielding around the source, recorded by a 4 liter NaI(Tl)-spectrometer at 19.6 m from the source. The thickness of a wood block is 45 mm. The maximum count rate in the full energy peak is set to 100 for each measurement. An increase in the small angle Compton scattered photon fluence around 600 keV is seen for increased shield thickness, indicating that some forward scattering is occurring in the shield.

NKS SHIELDMORC Final Report 2019 Page 35 (61)
35
Net normalized pulse height distribution from Cs-137 with stepwise increasing clay brick shielding
0
50
100
150
200
250
0 200 400 600 800 1000
Photon energy / keV
Nor
mal
ized
cou
nt ra
te /
%
No shield1 clay brick2 clay bricks3 clay bricks4 clay bricks5 clay bricks5 clay bricks no top5 clay bricks no sides7 clay bricks no sides
Fig 4.3. Net normalized pulse height distribution (background subtracted) from a 10 MBq Cs-137 source with different clay brick shielding thickness around the source, recorded by a 4 liter NaI(Tl)-spectrometer at 9.6 m from the source. The thickness of a clay brick is 50 mm. The maximum count rate in the full energy peak is set to 100 for each measurement. A substantial increase in the small angle Compton scattered photon fluence around 600 keV is seen for increased shield thickness, indicating major forward (23º) scattering in the shield with increased thickness.
4.1.4 Cs-137 source with lead shield, source-detector distance 10 m
Fig 4.4 shows the net normalized pulse height distribution from the source at 9.6 m, unshielded and with 18, 32 and 43 mm thick cylindrical shaped lead shielding around the source. There is only a minor increase in the relative pulse height distribution at 600 keV for increasing lead shield thickness. Counted from air only shielding, between the source and the detector, the normalized increase factor is 1.5 for 18 mm lead, 1.8 for 32 mm lead and 2.1 for 43 mm lead in the shield. These values are significantly lower than for clay brick shielding for equal mass thickness of the shield (43 mm lead is about equal to 230 mm clay in mass thickness).
In addition, the mass attenuation coefficient for lead is approximately 1.5 times higher than for the clay bricks at 600 keV, due to the increased photo-electric effect in high atomic number material. This means that the scattered photons in the lead shield are more strongly attenuated than in the clay shield. This relative difference in mass attenuation coefficient becomes even more pronounced at lower energies. As shown in Fig 4.4, the amount of scattered photons does not increase at lower energies compared to no shielding (only air), except for 43 mm lead where an additional contribution from multiple scattered photons is seen at lower energies. This difference may be due to differences in shield thickness upwards and to the side of the three lead containers.

NKS SHIELDMORC Final Report 2019 Page 36 (61)
36
Net normalized pulse height distribution from Cs-137 with stewise increasing lead shielding thickness
0
50
100
150
200
250
0 100 200 300 400 500 600 700 800 900 1000
Photon energy / keV
Nor
mal
ized
cou
nt ra
te /
%
No shieldLead 18 mmLead 32 mmLead 43 mm
Fig 4.4 Net normalized pulse height distribution (background subtracted) from a 10 MBq Cs-137 source with different cylindrical lead shield thickness around the source, recorded by a 4 liter NaI(Tl)-spectrometer at 9.6 m from the source. The maximum count rate in the full energy peak is set to 100 for each measurement. A minor increase in the small angle Compton scattered photon fluence around 600 keV is seen for increased shield thickness, indicating some forward (23º) scattering in the shield with increased thickness. At lower energies, however, only little large angle scattering is seen, because lower energy photons scattered in the shield are very likely to be absorbed in the shield.
4.1.5 Using registrations of Compton scattered photons in the normalized pulse height
distribution to estimate shielding thickness at source-detector distances 10 - 20 m
The probability that a photon will undergo a Compton interaction depends on the density of the absorbing material and the energy of the photon. The probability is independent on atomic number of the material. Therefore, two different materials should produce the same amount of Compton scattered photons if their mass thickness is the same. This could be used to determine the mass thickness of a shield.
To make a simple test of the method, the amount of Compton scattered radiation produced by one burnt clay brick shield (thickness 50 mm) was compared to scattered radiation from a 203.5 mm thick shield of wood blocks. The two shields have the same mass thickness, 106 kg/m2. Since the mass thickness of one clay brick shield is equal to 4.52 wood blocks of thickness 45 mm, measurement data for wood shielding was obtained by interpolation between results for 4 and 5 wood blocks. The measurements were made at a source-detector distance of 9.6 m for the clay brick shield and 19.6 m for the wood shield. The difference in distance should be of little significance at energies between 300 and 600 keV from a Cs-137 source according to the experience from the measurement of the Compton distribution for air scattering only (see section 4.1.1).
Results showing the net normalized pulse height distribution for the 50 mm burnt clay shield and the 203.5 mm wood shield are given in Fig 4.5. The two distributions are approximately equal within the energy interval 180 - 600 keV. The average ratio clay/wood is 1.07. The average ratio clay/air for the same energy interval is 1.76.

NKS SHIELDMORC Final Report 2019 Page 37 (61)
37
Since Compton scattering should be proportional to the mass thickness, the average clay/wood ratio should be 1.0. That it was measured to 1.07 can be due to a small difference in the water content of clay bricks and wood blocks between the time of measurement in the field and the determination of the material’s densities in the laboratory (half a year). This affects the exact
thickness of wood selected in the interpolation of measurement data between 4 and 5 wood blocks.
This difference in ratios clay/air indicates that the method of using the increase in net normalized Compton distribution for increasing shield thickness should be a way to determine shield thickness expressed in mass thickness independent of shielding material, in any case as long as the Compton effect is the dominant interaction in the material, i.e. the Compton scattered photons escape the shield to a high degree. However, for materials with high atomic numbers, such as lead, the attenuation of the Compton photons in the shield is so high that the method does not work (See section 4.1.4).
In Fig 4.5 an increased count rate distribution can be seen above the full energy peak of 662 keV for the source-detector distance 9.6 m. The increase is not so pronounced for the source-detector distance 19.6 m. This is explained by pile-up of pulses in the gamma spectrometer for the higher count rate at 9.6 m. Because of this, and that there are no Compton photons above 662 keV, the count rate ratio for clay/wood and clay/air is not valid for energies above the full energy peak.
Net normalized pulse height distribution from Cs-137 for equal mass thickness of clay and wood
0.1
1.0
10.0
100.0
1000.0
0 200 400 600 800 1000
Photon energy / keV
Norm
aliz
ed c
ount
rate
50 mm clay brick203.5 mm wood blockRatio clay/woodAir onlyRatio clay/air
Fig 4.5 Net (background subtracted) normalized (to full energy peak count rate) pulse height distribution from a 10 MBq Cs-137 source with 50 mm burnt clay brick shielding measured at source-detector distance 9.6 m (dark blue curve) and with 203.5 mm wood blocks measured at source-detector distance 19.6 m (magenta curve). As comparison, a measurement for the same source without shielding at source-detector distance 19.6 is shown (turquoise curve). All measurements were recorded by a 4 liter NaI(Tl)-spectrometer. The clay shield and the wood shield have the same mass thickness (106 kg/m2). Since the probability of Compton scattering is only depending on the mass thickness of the scattering material, the normalized scattered photon fluence should be the same for the two shielding setups, just as found. The average ratio of measured pulse height distribution clay/wood (yellow curve) is 1.07 for photon energies 180 - 600 keV. The average ratio of measured pulse height distribution clay/air is 1.76 for the same energy interval (orange curve).

NKS SHIELDMORC Final Report 2019 Page 38 (61)
38
4.1.6 Summarizing experiments with shielded Cs-137 at distances 10 - 20 m
At distances 10 - 20 m, the increase in the net normalized pulse height distribution in the scattered photon energy region below 600 keV (23 degrees scattering and larger) indicates a relationship between shield mass thickness and count rate relative to the count rate in the full energy peak of 662 keV. This is because the probability of creating Compton photons in the shield is proportional to the density of the shield material and the photon energy. It is independent of atomic number of the material. This may be used to determine approximate shield thickness, by measuring the ratio of count rates in the detector for scattered to primary radiation and compare it with the corresponding value for air-only. The air between the source and the detector adds to the count rate in the Compton distribution, but very slowly with increasing source-detector distance because the density of air is in the order of 1/1000 compared to the density of a shield made of common building material. Moreover, if the distance to the source is known or measured (for example by the method described in section 2.2) the Compton scattering in air can be corrected for.
This conclusion applies to shield materials with low or medium atomic numbers where the photoelectric absorption effect is low for the Compton scattered photons. For high atomic number materials, Compton scattered photons will be attenuated at much greater extent. This makes determination of the thickness of the shield with the Compton scattering method difficult, in principle non-functioning. Shields with high atomic number will virtually act as a source without shielding but with apparent lower activity, because the shield produces only little trace of additional scattered photons.
4.2 Non-collimated source. Shielding experiments at source detector distance 1 m
In this setup, a Cs-137 point source with activity 345 kBq, was placed 1 m from the side of a 4-liter NaI(Tl)-detector. Wood blocks and clay bricks combined to different thickness were used as shielding material.
4.2.1 Cs-137 source with wood shield, source-detector distance 1 m
The net (background subtracted) normalized (to the full energy peak count at 662 keV) pulse height distributions from the source, unshielded and with 1 - 5 wooden blocks around the source are plotted in Fig. 4.6. An increase below 600 keV is seen from Compton photons scattered 23 degrees or more for increasing number of wood blocks in the shield. The increase factor in the count rate at 600 keV (in relation to the full energy peak) is about 3 times when going from no shielding to 225 mm wood shielding (5 blocks). This is a higher increase factor than measured at 19.6 m for the same shielding thickness (1.6 times for 5 blocks, see section 4.1.2). It can probably be explained by the detector volume, taking up ±20 cm from its centre line as seen from the source, covers up a larger solid angle at 1 m than at about 20 meter, thus allowing more combinations of 23 degrees scattered photons to reach the detector at 1 m.
4.2.2 Cs-137 source with burnt clay shield, source-detector distance 1 m
Fig 4.7 shows the net normalized pulse height distribution from the source, unshielded and with 1 - 3 burnt clay bricks around the source. A similar increase in the normalized pulse height distribution can be seen below 600 keV for increasing number of clay bricks. The normalized increase factor in count rate at 600 keV is about 6 times when going from no shielding to 150 mm clay brick shielding (3 bricks). This is higher than the corresponding increase (2.5 times for 3 bricks, see section 4.1.3) measured at 9.6 m distance. It can probably be explained by the increased solid angle of the detector seen from the source at 1 m compared to 9.6 m, although further experiments have to be done to verify this.

NKS SHIELDMORC Final Report 2019 Page 39 (61)
39
Net normalized pulse height distribution from Cs-137 at 1 m distance with different wood shielding
0
50
100
150
200
250
0 100 200 300 400 500 600 700 800 900 1000
Photon energy / keV
Nor
mal
ized
cou
nt ra
te No shield1 wood brick2 wood bricks3 wood bricks4 wood bricks5 wood bricks
Fig 4.6 Net normalized pulse height distribution (background subtracted) from a 345 kBq Cs-137 point source with different wood shielding thickness around the source, recorded by a 4-liter NaI(Tl)-spectrometer at 1 m from the source. The thickness of a wood block is 45 mm. The maximum count rate in the full energy peak is set to 100 for each measurement. An increase in the small angle (23 degrees) Compton scattered photon fluence around 600 keV is seen for increased shield thickness as predicted by the theory.
Net normalized pulse height distribution from Cs-137 at 1 m distance with different burnt clay shielding
0
50
100
150
200
250
0 100 200 300 400 500 600 700 800 900 1000
Photon energy / keV
Nor
mal
ized
cou
nt ra
te
No shield1 clay brick2 clay bricks3 clay bricks
Fig 4.7. Net normalized pulse height distribution (background subtracted) from a 345 kBq Cs-137 point source with different clay brick shielding thickness around the source, recorded by a 4-liter NaI(Tl)-spectrometer at 1 m from the source. The thickness of a clay brick is 50 mm. The maximum count rate in the full energy peak is set to 100 for each measurement. An increase in the small angle (23 degrees) Compton scattered photon fluence around 600 keV is seen for increased shield thickness as predicted by the theory

NKS SHIELDMORC Final Report 2019 Page 40 (61)
40
4.2.3 Using registrations of Compton scattered photons in the normalized pulse height
distribution to estimate shielding thickness at source-detector distance 1 m
In section 4.1.5 it was shown that the Compton scattered radiation is nearly equal for a shield with one burnt clay brick (thickness 50 mm) and a shield of wooden blocks with thickness 203.5 mm, the two shields having the same mass thickness, 106 kg/m2. This is because the Compton effect is independent of atomic number of the scattering material and proportional to the mass thickness of the material. It was shown using the net (background subtracted) normalized (to the full energy peak) pulse height distribution for source-detector distances 9.6 and 19.6 m. The question is whether this also applies to other distances. Corresponding calculations have been made with measurement data from the source-detector distance 1 m. The results from this calculation are shown in Fig. The ratio of net normalized count rates for 50 mm clay shield to 203.5 mm wood shield is 1.07, which is exactly the same value as obtained for the Cs-137 source with about 30 times the activity at 10 - 20 times the distance. Thus, the fact that the probability of Compton scattering depends solely on the mass thickness of the shield results in that the ratios of the net normalized pulse height distributions for different materials of the same mass thickness will be the same regardless of the distance and the activity of the photon source (within certain limits). This implies that the method of using the measured Compton distribution should work to determine the mass thickness of a shield, as long as the shield’s own absorption of the Compton photons is not very strong.
The method of using Compton photons to determine the thickness of a shield is based on detecting both primary photons and scattered photons for different scattering angles (different energies). This must be done with a detector having small dimensions in relation to the distance between the detector and the photon source. If the detector is wide relative to the source-detector distance, the angular relationships between primary photons and scattered photons will not be clear. This is the case where the distance between the detector and the source is 1 m and the detector's length perpendicular to the distance direction is 0.4 m. This gives the ratio 50 mm clay shielding to air-only of 2.44. For longer source-detector distances (10 - 20 m) the corresponding ratio becomes 1.76 (see section 4.1.5). Thus, when measuring ratios of net normalized pulse height distributions for different shield mass thicknesses aimed for the “knowledge library”, sufficiently long source-detector distances are needed in order not to obtain distorted values due to detector dimensions. Further investigations to better under-stand the problem need to be performed.
4.2.4 Cs-137 source with burnt clay shield combined with wood shield, source-detector
distance 1 m
Building material that can act as shielding material for hidden radiation sources can have different densities. To show how combinations of different materials, wood affect the net normalized pulse height distribution, some experiments were made with combinations of materials.
Figs 4.9 - 4.11 show the increase in the net normalized pulse height distribution below 600 keV for increasing number of combinations of clay bricks and wood blocks. The increase from the combined shielding material is approximately proportional to the added mass thickness giving about 8 times for the combination of 150 mm clay and 225 mm wood shielding. This is also the case at lower energies with multiple Compton scattering. At 100 keV the relative increase factor for 225 mm wood is 3.3, for 150 mm clay about 10 and for the combination of these, an increase factor of about 13 was found.

NKS SHIELDMORC Final Report 2019 Page 41 (61)
41
Net normalized pulse height distribution from Cs-137 for equal mass thickness of clay and wood shield, source-detector distance 1 m
0.1
1.0
10.0
100.0
1000.0
0 100 200 300 400 500 600 700 800 900 1000
Photon energy / keV
Norm
aliz
ed c
ount
rate
50 mm clay brick203.5 mm wood blockRatio clay/woodAir onlyRatio clay/air
Fig 4.8 Net (background subtracted) normalized (to full energy peak count rate) pulse height distribution from a 345 kBq Cs-137 source with 50 mm burnt clay brick shielding measured at source-detector distance 1 m (dark blue curve) and with 203.5 mm wood block shielding measured at the same distance (magenta curve). A measurement without shielding is shown (turquoise curve). Data were recorded by a 4 liter NaI(Tl)-spectrometer. The clay shield and the wood shield have the same mass thickness (106 kg/m2). Since the probability of Compton scattering is only depending on the mass thickness of the scattering material, the net normalized scattered photon fluence should be the same for the two shielding setups, just as found. The average ratio of measured pulse height distribution clay/wood (yellow curve) is 1.07 for photon energies 180 - 600 keV. The average ratio of measured pulse height distribution clay/air is 2.44 for the same energy interval (orange curve).
Net normalized pulse height distribution from Cs-137 at 1 m distance with combined burnt clay and wood shielding
0
50
100
150
200
250
0 100 200 300 400 500 600 700 800 900 1000
Photon energy / keV
Nor
mal
ized
cou
nt ra
te /
cps
No shield1 clay brick1 clay, 1 wood1 clay, 3 wood1 clay, 5 wood
Fig 4.9. Net normalized pulse height distribution from a 345 kBq Cs-137 point source with one clay brick shield and additional 1, 3 and 5 wood block shields around the source, recorded by a 4-liter NaI(Tl)-spectrometer at 1 m from the source. The thickness of a clay brick is 50 mm, a wood block is 45 mm. The maximum count rate in the full energy peak is set to 100 for each measurement. An added increase in the small angle (23 degrees) Compton scattered photon fluence around 600 keV is seen with the addition of wood blocks.

NKS SHIELDMORC Final Report 2019 Page 42 (61)
42
Net normalized pulse height distribution from Cs-137 at 1 m distance with combined burnt clay and wood shielding
0
50
100
150
200
250
0 100 200 300 400 500 600 700 800 900 1000
Photon energy / keV
Nor
mal
ized
cou
nt ra
te /
cps
No shield2 clay brick2 clay, 1 wood2 clay, 3 wood2 clay, 5 wood
Fig 4.10 Net normalized pulse height distribution from a 345 kBq Cs-137 point source with a 2-clay brick shield and additional 1, 3 and 5 wood block shields around the source, recorded by a 4-liter NaI(Tl)-spectrometer at 1 m from the source. The thickness of a clay brick is 50 mm, a wood block is 45 mm. The maximum count rate in the full energy peak is set to 100 for each measurement. A small added increase in the small angle (23 degrees) Compton scattered photon fluence around 600 keV is seen with the addition of wood blocks.
Net normalized pulse height distribution from Cs-137 at 1 m distance with combined burnt clay and wood shielding
0
50
100
150
200
250
0 100 200 300 400 500 600 700 800 900 1000
Photon energy / keV
Nor
mal
ized
cou
nt ra
te /
cps
No shield3 clay brick3 clay, 1 wood3 clay, 3 wood3 clay, 5 wood
Fig 4.11 Net normalized pulse height distribution from a 345 kBq Cs-137 point source with a 3-clay brick shield and additional 1, 3 and 5 wood block shields around the source, recorded by a 4-liter NaI(Tl)-spectrometer at 1 m from the source. The thickness of a clay brick is 50 mm, a wood block is 45 mm. The maximum count rate in the full energy peak is set to 100 for each measurement. A minor added increase in the small angle (23 degrees) Compton scattered photon fluence around 600 keV is seen with the addition of wood blocks.

NKS SHIELDMORC Final Report 2019 Page 43 (61)
43
4.2.5 Summarizing experiments with shielded Cs-137 source at 1 m and 10 - 20 m distance
When comparing the experiments at 1 m source-detector distance with 10 - 20 m distance, the ratio of the respective net normalized pulse height distributions for Compton scattered photons becomes equal for different shielding materials with the same mass thickness. However, the corresponding ratio for a shielding material to air-only is not equal at 1 m and 10 - 20 m. This is because when the detector's dimension is not small in relation to the distance (which it is not at 1 m distance), the angular distribution of the Compton photons from the shielding material in relation to air-only (no shielding) does not become clear. It is thus important that the measurement of the pulse height distribution for Compton scattered photons is made with sources located at a sufficient distance from the detector. Then the method of using the Compton distribution to determine the shield thickness should work for common construction materials such as brick and wood.
4.3 Non-collimated source, Co-60 with burnt clay shield, source-detector distance
20 m
A Co-60 point source with activity 60 MBq, was placed 19.6 m from the side of a 4-liter NaI(Tl)-detector. Clay bricks combined to different thickness were used as shielding material. Count rates in five ROIs as defined in Table 3.2 were calculated and normalized to the ROI for the full energy peak at 1332 keV. The net normalized pulse height distribution is shown in Fig 4.12. The increased count rates for Compton scattered photons as the shield thickness is increased is clearly visible.
4.3.1 Using Regions-of-interest (ROI) instead of the entire pulse height distribution
Instead of using the entire pulse height distribution for Compton scattered photons, repre-sentative ROIs can be chosen. This is easier to implement for different gamma spectrometry systems. Count rates in ROIs representing different Compton scattered photon angles are shown in Fig 4.13 for increased number of burnt clay bricks in the shield. This indicates that it should be possible to approximately determine shield thickness using the ROI method. Of course, this must be preceded by measurements of ROI count rates for known shield thicknesses to form a “knowledge library” of ROI count rate ratios linked to shield mass
thickness.
4.3.2 Summarizing experiments with Co-60 source and burnt clay shielding
The increase in the normalized pulse height distribution in the Compton scattered photon energy region below 600 keV (23 degrees scattering and more) indicates a relationship between shield thickness and increased number of registrations relative to the full energy peak at 662 keV. A corresponding relationship has been detected for five representative ROIs for Co-60. This may be used to determine approximate shield thickness provided that the phenomenon also occurs for radiation sources at longer distances, which was indicated to be the case based on measurements of a Cs-137 source up to 80 m source-detector distance (Section 4.1.1).

NKS SHIELDMORC Final Report 2019 Page 44 (61)
44
Net normalized pulse height distribution from Co-60 with varying clay brick shielding
0
50
100
150
200
250
0 200 400 600 800 1000 1200 1400
Photon energy / keV
Nor
mal
ized
cou
nt ra
te /
%
No shield1 clay brick3 clay bricks5 clay bricks
Fig 4.12. Net (background subtracted) normalized count rates for an unshielded Co-60 source and the same source shielded by 1, 3 and 5 clay bricks, measured by Lund University 4 liter NaI(Tl)-spectrometer. Source detector distance is 19.6 m.
Net normalized ROI count rate from an unshielded and shielded Co-60 source
0
100
200
300
400
500
600
700
800
0 200 400 600 800 1000 1200 1400
Photon energy (keV)
Norm
aliz
ed R
OI c
ount
rate
(%)
Unshielded1 clay brick3 clay bricks5 clay bricks
Fig 4.13. Net (background subtracted) normalized count rates in the five ROIs defined in Table 3.2 for an unshielded Co-60 source and the source shielded by 1, 3 and 5 clay bricks, measured by Lund University 4 liter NaI(Tl)-spectrometer. The count rates in the ROI representing the full energy peak of 1332 keV is set to 100%. Data has been linked with a smooth curve. Source detector distance is 19.6 m.

NKS SHIELDMORC Final Report 2019 Page 45 (61)
45
4.4 Non-collimated source. Shielding experiment with a Co-60 source, preformed
by the Nordic teams
As a final set-up in the AUTOMORC field experiment in Barsebäck 2018, the Nordic teams made some preliminary spectrometric measurements using a shielded Co-60 source. These measurements were analyzed to find out if spectral data represented in a set of regions of interest (ROI) could be used to draw conclusions about the shielding of a hidden point source. The shielding measurements were compared to air-only measurements using data from the calibration measurements that each team performed initially in the AUTOMORC 2018 experiment in order to determine the detector efficiencies. The source activity calibration was 34 MBq. It was placed between 6 and 8 m from the respective detector. The exact distance varied individually for each detector as the mounting in the measuring vehicle varied.
4.4.1 Unshielded source geometry
The overall results from the Nordic teams' measurements for the five ROIs representing the spectral net (background subtracted) distribution of the photon fluence from an unshielded Co-60 source are shown in Fig 4.14. For measurements on the unshielded Co-60 source, the photon contribution from the source dominates over the natural background. The potential error in the net contribution is therefore small even if the background is not fully representative of the measurement site. From Fig 4.14 it can be seen that the relative (in relation to the full energy peak area of 1.33 MeV) net (background subtracted) pulse height distribution from an unshielded Co-60 source is approximately the same independent of detector volume for 4 - 16 liter NaI(Tl)-detectors and for source-detector distances between 6 and 16 m (and probably slowly varying at lower energies for longer distances). This characteristic, referred to here as a ROI-signature, should make it possible to use the ROI method to distinguish a shielded source (giving a different pattern, see Fig 6) from an unshielded one, provided that the count rate in the full energy peak is significantly above the background.
Background subtracted relative count rate from an unshielded Co-60 source
0
20
40
60
80
100
120
140
160
180
200
0 200 400 600 800 1000 1200 1400
Photon energy (keV)
Rela
tive
ROI c
ount
rate
(%)
SSM 8 L NaI(Tl)DEMA 4 L NaI(Tl)NGU 16 L NaI(Tl)STUK 4 L NaI(Tl)LU 4 L NaI(Tl)
Fig 4.14 Background subtracted relative count rates in the five ROIs defined in Table 1 for an unshielded Co-60 source measured by the Nordic teams using NaI(Tl)-spectrometers with volumes between 4 and 16 liter. The count rates in the ROI representing the full energy peak of 1.33 MeV is set to 100%. Data has been linked with a smooth curve. Source detector distances vary between 6 and 16 m.

NKS SHIELDMORC Final Report 2019 Page 46 (61)
46
4.4.2 Lead shielded source geometry
Measurement data for the Co-60 source with 6 cm lead shielded are shown in Fig 4.15 for the respective Nordic team and detector. The results are shown in percentage terms, where the count rate for the 1.33 MeV peak is set to 100%. Since the photon fluence from the shielded source is very low at the measurement points, no subtraction of the background has been done in this case. The background is measured over a larger area (along Kraftverksvägen) and therefore not exactly representative of the location where the shielding measurements were carried out. This is evident because for some of the measurements the count rate for the background in the low energy range, here represented by ROI 200 - 350 keV, shows higher values than for the shielding measurements, which would not be possible if the background pulse height distributions were representative of the location.
Results from the Nordic teams' measurements on unshielded and shielded Co-60 radiation sources are given in Table 4.1. The team from Iceland had difficulties with the measuring equipment during the measuring step and their results are hence not reported here. The background measurements used by the teams were based on pulse height acquisition of a larger area in the vicinity of the shielding source set-up. They may therefore not be fully representative of the background at the location of the shielding measurements.
As can be seen from the measurement data in Table 4.1 and Fig 4.15, there is really no difference in measurement data between the background and the shielded radiation source, other than that which can be attributed to the uncertainty in the background measurement. In short, the shielded Co-60 source could not be detected at 30 m distance with the measurement times used by the teams. That way the experiment was not so successful. The only conclusion that can be drawn is that the amount of scattered radiation in the lead shield when measured at about 30 m distance is small. It appears that materials with lower atomic numbers in the experiment with clay brick shielding for Co-60 produces greater amount of scattered radiation than a shield of lead gives, which actually was found to be valid for Cs-137 (See section 4.1). This may be used to roughly determine what type of material is present in a radiation shield.

NKS SHIELDMORC Final Report 2019 Page 47 (61)
47
Table 4.1. Count rates in ROIs (cps) measured during the AUTOMORC 2018 experiment in Barsebäck, for background measurement, for unshielded Co-60 point source calibration measurement and for lead shielded Co-60 measured 7 June 2018 between 14:00 and 14:30. Count rates for unshielded and shielded Co-60 measurements refer to gross count rates. Also given are data for a measurement in 2019 by Lund University of an unshielded Co-60 source at the same location. Team and detector: DEMA – 4 liter NaI(Tl)
ROI (keV) Background (cps) Unshielded Co-60 (cps) Shielded Co-60 (cps) 200 - 350 299.2 1504 245.2 565 - 715 64.5 528.4 61.5
930 - 1080 33.4 347.4 34.4 1090 - 1240 27.5 1049.8 29.6 1250 -1400 18.4 890.5 23
Team and detector: STUK – 4 liter NaI(Tl)
ROI (keV) Background (cps) Unshielded Co-60 (cps) Shielded Co-60 (cps) 200 - 350 247 1792 441 565 - 715 58.7 582.7 57.6
930 - 1080 25.7 321.3 21.9 1090 - 1240 20.9 992.5 17.4 1250 -1400 13.4 855.2 11.2
Team and detector: SSM – 8 liter NaI(Tl)
ROI (keV) Background (cps) Unshielded Co-60 (cps) Shielded Co-60 (cps) 200 - 350 693 3075 568 565 - 715 171 1138 164
930 - 1080 88 685 95 1090 - 1240 64 1773 79 1250 -1400 51 1524 61
Team and detector: NGU – 16 liter NaI(Tl)
ROI (keV) Background (cps) Unshielded Co-60 (cps) Shielded Co-60 (cps) 200 - 350 923 4196 740 565 - 715 226 1685 203
930 - 1080 115 967 110 1090 - 1240 93 2728 94 1250 -1400 69 2324 70
Team and detector: LU – 4 liter NaI(Tl) (Measured 2019-08-23)
ROI (keV) Background (cps) Unshielded Co-60 (cps) Shielded Co-60 (cps) 200 - 350 352.7 2894.6 not measured 565 - 715 101.5 1131.6 not measured
930 - 1080 55.3 796.7 not measured 1090 - 1240 43.5 1858.9 not measured 1250 -1400 30.0 1548.3 not measured

NKS SHIELDMORC Final Report 2019 Page 48 (61)
48
Fig 4.15. Relative count rates in the five ROIs defined in Table 1 for natural background and an unshielded 34 MBq Co-60 source and a shielded 1127 MBq Co-60 source in a 6 cm thick cylindrical lead container, measured by the Danish Emergency Management Agency (DEMA) using a mobile 4 liter NaI(Tl)-spectrometer (upper left), the Finnish Radiation and Nuclear Safety Authority (STUK) using a mobile 4 liter NaI(Tl)-spectrometer (upper right), the Swedish Radiation Safety Authority (SSM) using a mobile 8 liter NaI(Tl)-spectrometer (lower left) and the Geological Survey of Norway (NGU) using a mobile 16 liter NaI(Tl)-spectrometer (lower right). The count rates in the ROI representing the full energy peak of 1.33 MeV are set to 100%. Data has been linked with a smooth curve. Source detector distances are about 8 m for the unshielded source and between 20 and 35 m for the shielded source (depending on team and time of measurement).
4.4.3 Summarizing the shielding experiment with a Co-60 source, preformed by the Nordic
teams
It is difficult to draw any more in-depth conclusions from the results of the joint Nordic AUTOMORC lead-shielding experiment with a Co-60 source. There was very limited time for the experiment. One difficulty was that the heavy shielding lead to insufficient counting statistics in the pulse height distributions in the short time available for the experiment. Furthermore, the natural background, which must be subtracted, had not been measured at that exact location but was an average over a lower distance. These things in combination make measurement data uncertain. To better understand the scattered radiation generated by lead shielding, more detailed experimental investigations need to be done.

NKS SHIELDMORC Final Report 2019 Page 49 (61)
49
4.5 Collimated source. Shielding experiments with Cs-137 at source-detector
distance 17 m
A lead-collimated level guard with a 520 MBq Cs-137 source was used at the source-detector distance 16.7 m from a 4-liter NaI(Tl)-spectrometer. Wood blocks and clay bricks were placed in front of the source as shielding material. (Fig 3.8 and 3.9). The collimator was so narrow (6 degrees in the horizontal direction and 9 degrees in the vertical direction, Fig 2.12) that the combined source and shielding geometry would not produce Compton photons in the shield that could be measured (resolved) with the spectrometer simultaneously with the primary photons from the source.
4.5.1 Collimated source, wood shield, 17 m distance
Fig 4.16 shows the net (background subtracted) normalized (to the full energy peak count at 662 keV) pulse height distributions from the collimated source, unshielded and with 1 - 10 wooden blocks as shielding material placed in front of the source. This corresponds to a shield thickness of up to 450 mm of wood and a mass thickness of 234 kg/m2. As expected, there is no noticeable difference in the relative photon fluence for varying shield thickness for energies from 600 keV and downward, indicating that Compton scattered photons in the shield with angles larger than 23 degrees from central axis are non-existent (23 degree scattering is what could be resolved with a NaI(Tl)-spectrometer). The source is collimated to such a small opening angle that virtually no scattered photons arise in the direction of the recorded primary radiation (i.e. along the central axis). Some multiple scattered photons are seen in the energy region 50 - 184 keV. However, with a high resolution HPGe spectrometer having about 0.3% resolution at 662 keV, there might be a chance to register Compton photons just to the left of the full energy peak, but this has not been investigated here.
4.5.2 Collimated source, burnt clay shield, 17 m distance
Fig 4.17 shows the net normalized pulse height distribution from the collimated source, unshielded and with 1 - 5 burnt clay bricks as shielding material placed in front of the source. This corresponds to a shield thickness of up to 250 mm of clay brick and a mass thickness of 530 kg/m2. As in the case with wood shielding, there is no noticeable difference in the relative photon fluence for different clay brick thickness at energies 600 keV and downwards to 450 keV, because the collimated source does not allow primary photons to reach the clay shield at angles relative to the central axis that would produce Compton photons with these energies. For lower energies and increasing shield thickness, increasing number of multiple scattered photons can be seen.
4.5.3 Collimated source, lead shield, 17 m distance
Fig 4.18 shows the net normalized pulse height distribution from the collimated source, unshielded and with a 40 mm lead shield in front of the source. This corresponds to a mass thickness of 454 kg/m2. As in the case with wood or clay shielding, there seems to be no noticeable difference in the relative photon fluence with the lead shield for energies between 450 and 600 keV, indicating that Compton scattered photons down to these energies are non-existent. Multiple scattered photons are visible in the low energy region with the shield present.

NKS SHIELDMORC Final Report 2019 Page 50 (61)
50
Net normalized pulse height distribution from Cs-137 level guard with stepwise increasing wood block shielding
0
50
100
150
200
0 100 200 300 400 500 600 700 800 900 1000
Photon energy / keV
Nor
mal
ized
cou
nt ra
te /
%
No shield1 wood block2 wood blocks3 wood blocks4 wood blocks5 wood blocks6 wood blocks7 wood blocks8 wood blocks9 wood blocks10 wood blocks
Fig 4.15 Net (background subtracted) normalized pulse height distribution from a 520 MBq Cs-137 level gauge with different wood shielding thickness, recorded by a 4 liter NaI(Tl)-spectrometer 16.7 m from the source. The thickness of a wood block is 45 mm. The maximum count rate in the full energy peak is set to 100 % for each measurement. There is no noticeable difference in the photon fluence for energies between 250 and 600 keV, indicating that Compton scattered photons in angles 23 - 105 degrees from the center axis are non-existent. Some multiple scattered photons are visible in the low energy region for high shield thickness.
Net normalized pulse height distribution from Cs-137 level guard with stepwise increasing clay brick shielding
0
50
100
150
200
0 100 200 300 400 500 600 700 800 900 1000
Photon energy / keV
Nor
mal
ized
cou
nt ra
te /
%
No shield1 clay brick2 clay bricks3 clay bricks4 clay bricks5 clay bricks
Fig 4.16 Net (background subtracted) normalized pulse height distribution from a 520 MBq Cs-137 level gauge with different clay brick shielding thickness, recorded by a 4 liter NaI(Tl)-spectrometer 16.7 m from the source. The thickness of a clay brick is 50 mm. The maximum count rate in the full energy peak is set to 100 % for each measurement. There is no noticeable difference in the photon fluence for energies between 450 and 600 keV, indicating that Compton scattered photons in angles 23 - 50 degrees from the center axis are non-existent. Registrations from multiple scattered photons are visible in the low energy region for high shield thickness.

NKS SHIELDMORC Final Report 2019 Page 51 (61)
51
Net normalized pulse height distribution from Cs-137 level guard with and without lead shielding
0
50
100
150
200
0 100 200 300 400 500 600 700 800 900 1000
Photon energy / keV
Nor
mal
ized
cou
nt ra
te /
%
No shieldLead 40 mm
Fig 4.17 Net (background subtracted) normalized pulse height distribution from a 520 MBq Cs-137 level gauge with 40 mm lead shielding in front, recorded by a 4 liter NaI(Tl)-spectrometer 16.7 m from the source. The measurement is compared to registrations without a shield (only air between the source and the detector). The maximum count rate in the full energy peak is set to 100 % for each measurement. There seems to be no noticeable difference in the photon fluence for energies between 450 and 600 keV, indicating that Compton scattered photons in angles 23 - 50 degrees from the center axis are non-existent. (The variations seen in the energy interval are not statistically significant). Multiple scattered photons are visible in the low energy region with the shield present.
4.5.4 Summarizing shielding experiments with Cs-137 collimated source
With a collimated photon source, some of the primary photons emitted sideways are prevented from forming Compton photons that can reach the detector in its position where it can register the primary radiation. If the collimator has an aperture less than 23 degrees relative to the central axis (a total of 46 degrees aperture), no single scattered Compton photons with energy below 600 keV are recorded together with the primary energy (in full energy peak) when using a NaI(Tl)-spectrometer. Therefore, because of the low resolution of NaI(Tl)-spectrometers, the method of determining shield characteristics using single scattered Compton photon contribu-tions cannot be used if the source is collimated. However, some information is found in the low-energy region where multiple scattered Compton photons are recorded. Whether this is useful for getting an idea of shielding characteristics may need to be further investigated. With a high-resolution gamma spectrometer, it may be possible to identify Compton scattered photons with only a few degrees scattering angle, resulting in a few keV energy reduction, and thus be able to obtain information about the characteristics of the shield. However, this has not been investigated here, but the report by Toivonen et al, 2017, indicates that it could be done.
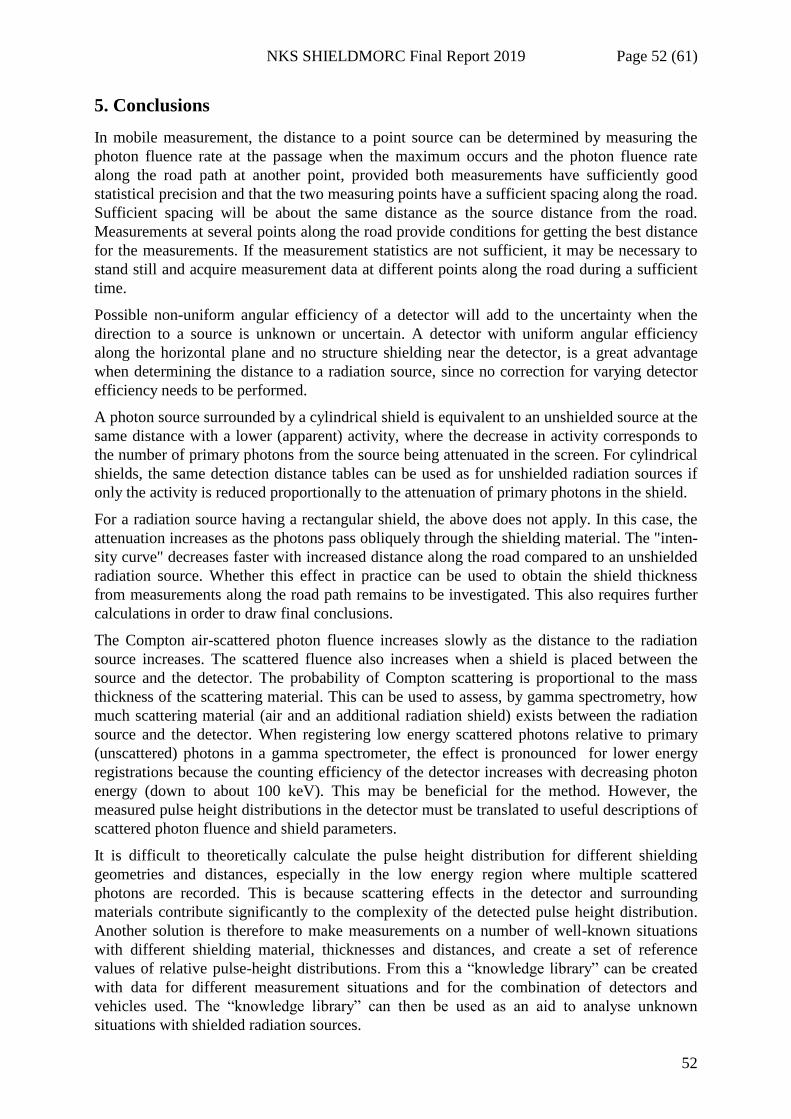
NKS SHIELDMORC Final Report 2019 Page 52 (61)
52
5. Conclusions
In mobile measurement, the distance to a point source can be determined by measuring the photon fluence rate at the passage when the maximum occurs and the photon fluence rate along the road path at another point, provided both measurements have sufficiently good statistical precision and that the two measuring points have a sufficient spacing along the road. Sufficient spacing will be about the same distance as the source distance from the road. Measurements at several points along the road provide conditions for getting the best distance for the measurements. If the measurement statistics are not sufficient, it may be necessary to stand still and acquire measurement data at different points along the road during a sufficient time.
Possible non-uniform angular efficiency of a detector will add to the uncertainty when the direction to a source is unknown or uncertain. A detector with uniform angular efficiency along the horizontal plane and no structure shielding near the detector, is a great advantage when determining the distance to a radiation source, since no correction for varying detector efficiency needs to be performed.
A photon source surrounded by a cylindrical shield is equivalent to an unshielded source at the same distance with a lower (apparent) activity, where the decrease in activity corresponds to the number of primary photons from the source being attenuated in the screen. For cylindrical shields, the same detection distance tables can be used as for unshielded radiation sources if only the activity is reduced proportionally to the attenuation of primary photons in the shield.
For a radiation source having a rectangular shield, the above does not apply. In this case, the attenuation increases as the photons pass obliquely through the shielding material. The "inten-sity curve" decreases faster with increased distance along the road compared to an unshielded radiation source. Whether this effect in practice can be used to obtain the shield thickness from measurements along the road path remains to be investigated. This also requires further calculations in order to draw final conclusions.
The Compton air-scattered photon fluence increases slowly as the distance to the radiation source increases. The scattered fluence also increases when a shield is placed between the source and the detector. The probability of Compton scattering is proportional to the mass thickness of the scattering material. This can be used to assess, by gamma spectrometry, how much scattering material (air and an additional radiation shield) exists between the radiation source and the detector. When registering low energy scattered photons relative to primary (unscattered) photons in a gamma spectrometer, the effect is pronounced for lower energy registrations because the counting efficiency of the detector increases with decreasing photon energy (down to about 100 keV). This may be beneficial for the method. However, the measured pulse height distributions in the detector must be translated to useful descriptions of scattered photon fluence and shield parameters.
It is difficult to theoretically calculate the pulse height distribution for different shielding geometries and distances, especially in the low energy region where multiple scattered photons are recorded. This is because scattering effects in the detector and surrounding materials contribute significantly to the complexity of the detected pulse height distribution. Another solution is therefore to make measurements on a number of well-known situations with different shielding material, thicknesses and distances, and create a set of reference values of relative pulse-height distributions. From this a “knowledge library” can be created
with data for different measurement situations and for the combination of detectors and vehicles used. The “knowledge library” can then be used as an aid to analyse unknown
situations with shielded radiation sources.

NKS SHIELDMORC Final Report 2019 Page 53 (61)
53
Background subtraction is necessary to obtain the net contribution from the source. Thus, background measurements representative for the environment where the source is situated must be done before an assessment of the shielding characteristics can be made. When the applied background is not fully representative for the measurement location and the primary photon fluence from the source is very low, large uncertainties occur.
It is necessary to be able to register the full energy peak in the pulse height distribution. It is in relation to this peak area that the Compton distribution for different energies provides information about the characteristics of the shield (and thus to the aforementioned knowledge library). This relation is here called the normalized pulse height distribution.
The method of using Compton scattered photons to determine the properties of a shield should be able to work for sources that are isotopically radiant. For collimated sources, from which it is not possible to register Compton scattered photons together with primary photons the suggested method does not work.
It is not necessary to do the analysis on the full information in a registered pulse height distribution. It is sufficient to use selected regions of interest (ROIs) that represent specific energy intervals (for example, the full energy peak, the area of Compton scattered photons just below the full energy peak, and a few more low-energy regions representing multiple Compton scattering). This is a way to simplify the analysis that allows different gamma spectrometry systems to be used without special programming.
In order to measure low fluence rates from shielded sources, the acquisition times need to be long enough. With mobile equipment, it will be necessary to stand still for a sufficient period of time to obtain necessary statistical accuracy. With mobile equipment, the advantage is that measurements that contribute to information about the source can easily be made in different places, for example when measuring sources with uneven shielding in different directions.
The actual activity of a radiation source found in a search mission using mobile gamma spectrometry is most likely unknown. In order to calculate the actual source activity, the source's shielding and the distance to the source must be determined. The distance can be determined by the use of “intensity curves” described above.
The conclusions given here are based on theory and results from preliminary gamma spectrometric data with a few different types of radiation-shielding materials and material thicknesses. To determine how well the proposed methods work in practice, additional field experiments need to be conducted with different types of detectors and detector sizes. One step on this path is the proposed field experiment jointly with Nordic participants in project SHIELDMORC 2020.

NKS SHIELDMORC Final Report 2019 Page 54 (61)
54
Acknowledgement
The authors thank Barsebäck Kraft AB for access to areas for carrying out parts of the experimental measurements. The experiments made by Lund University were carried out with measuring equipment originally financed by the Swedish Radiation Protection Authority and The Swedish Radiation Safety Authority. NKS conveys its gratitude to all organizations and persons who by means of financial support or contributions in kind have made the work presented in this report possible. Disclaimer The views expressed in this document remain the responsibility of the author(s) and do not necessarily reflect those of NKS. In particular, neither NKS nor any other organisation or body supporting NKS activities can be held responsible for the material presented in this report.

NKS SHIELDMORC Final Report 2019 Page 55 (61)
55
References
Antanas Bukartas, Robert Finck, Jonas Wallin, Christopher L. Rääf. 2019. A Bayesian method to localize lost gamma sources, Applied Radiation and Isotopes, 145:142-147. https://doi.org/10.1016/j.apradiso.2018.11.008 Robert R. Finck, Vikas C. Baranwal, Therése Geber Bergstrand, Jonas Jarneborn, Gísli Jónsson, Mattias Jönsson, Sune Juul Krogh, Simon Karlsson, F. Osftad, Jonas Nilsson, Marcus Persson, Per Reppenhagen Grim, Christopher L. Rääf, Morten Sickel, Petri Smolander, Robin Watson, Karl Östlund 2017. Mobile search of material out of regulatory control (MORC) – Detection limits assessed by field experiments. Final report from the NKS-B MOMORC activity Contract: AFT/B(16)1, (Yet only published within NKS). Christopher John Werner, Jeffrey S Bull, C. J. Solomon, Forrest B. Brown, Gregg Walter McKinney, Michael Evan Rising, David A. Dixon, Roger Lee Martz, Henry G. Hughes, Lawrence James Cox, Anthony J. Zukaitis, J. C. Armstrong, Robert Arthur Forster, and Laura Casswell. 2018. MCNP Version 6.2 Release Notes. United States: 2018, N. p., Web. doi: 10.2172/1419730. Christopher L. Rääf, Robert R. Finck, Antanas Bukartas, Gísli Jónsson, Sune Juul Krogh, Simon Karlsson, Morten Sickel, Petri Smolander, Jonas Wallin, Robin Watson, 2017. AUTOMORC – Improvement of automatic methods for identification of radioactive material out of regulatory control (MORC) by mobile gamma spectrometric search experiments. NKS-B AUTOMORC activity Contract: AFT/B(17)2, (Yet only published within NKS). Christopher L. Rääf, Robert R. Finck, Vikas C Baranwal, Antanas Bukartas, Marie-Andrée Dumais, Peter Friistrup, Kjartan Guðnason, Mats Hansson, Gísli Jónsson, Mattias Jönsson, Peder Kock, Sune Juul Krogh, Simon Karlsson, Frode Ofstad, Petri Smolander, Kurt Sundin, Mikael Westin, 2018. AUTOMORC-CONT – Improvement of automatic methods for identification of radioactive material out of regulatory control (MORC) by mobile gamma spectrometric search experiments. NKS-B AUTOMORC activity Contract: AFT/B(18)1, (Yet only published within NKS). H. Toivonen, M. Granström, G. Ågren, G. Jónsson, B. Møller, P. Roos, H. Ramebäck, 2017. Activity estimation of shielded or hidden radionuclides in emergency conditions, Nordic Nuclear Safety Research Report NKS-399. UNSCEAR, 2011. Sources and Effects of Ionizing Radiation, United Nations Scientific Committee on the Effects of Atomic Radiation, Report UNSCEAR 2008, Volume II, Annex C, Radiation Exposures in Accidents, pp 9-13, United Nations, New York.

NKS SHIELDMORC Final Report 2019 Page 56 (61)
56
Appendix A. Proposed experiments
This is a proposal for a joint Nordic field experiment to investigate whether the methods presented in this report for determining distances and shielding for point sources can in practice be applied to mobile gamma spectrometry with the measuring equipment available in the Nordic countries.
A.1 The meaning of a “knowledge library”
The pulse height distribution produced by scattered radiation from shielded radiation sources can be quite complex. Calculating them as a function of shielding material, density and thick-ness for a specific detector and environment is a difficult task. Instead, it is proposed to meas-ure gamma spectrometric results for known situations and create tables and diagrams of rela-tions between different parts of the scattered component and the primary component as repre-sented in regions of interest (ROIs). This is called a “knowledge library”. It may also include theoretical calculations, such as how primary radiation varies for different photon energies and distances. The idea is to try a method for analysing measurement data that can be used for a quick assessment of a situation without the need for extensive computerized analysis.
Real situations can differ greatly from those studied in the experiment. It is therefore not certain that the “knowledge library” can be used for a different real case. However, the experiments should be able to show if it is at all possible to use a “knowledge library” method to address the problem of shielded radiation sources.
A.2 Determining the distance to a source
Information about the distance to a radiation source is necessary to be able to calculate the source's activity from measurements of the primary photon fluence rate. Since the primary photon fluence in air decreases according to a combination of the square of the distance and the exponential attenuation in the air, it is possible to determine the distance to the source with two or more measurements at different distances, provided the source shielding is unchanged. The relationship between primary photon fluence and distance is solely dependent on the primary photon energy, not the source activity. For a straight path with a source on one side, the question of the distance to the source can be described as searching through a series of "intensity curves" (Fig A1), where the curve maximum occurs opposite the source and where the width of the curve only depends on the distance, R, to the source. The set of “intensity
curves” constitutes here a “knowledge library” for determining the distance to a source. By
comparing the measurement data (the count rate in the full energy peak) with the theoretically calculated curves at different places along the road, it is possible to find out which curve best fits the observations. Thus, the distance R can be determined. This is actually possible to do by hand if only the count rate in the full-energy peak from the source has sufficiently low statistical uncertainty to allow measurements at two or more different locations along the road.
A.2.1 The distance experiment
Teams will obtain sets of “intensity curves” for different source-detector distances valid for measurements on a straight road past a source. Sources of Cs-137 will be placed in different set-ups at different distances. The teams should do gamma spectrometric measurements at certain (marked) points along the road and obtain the net (background subtracted) full energy peak count rates. From the relative count rates and using the set of “intensity curves” the
distance can be determined. From the distance and the full energy peak count rate, the apparent activity of the source is calculated.

NKS SHIELDMORC Final Report 2019 Page 57 (61)
57
At the same time, also the net (background subtracted) contribution of air-scattered radiation recorded in the pulse height distribution below the full energy peak should be noted for a set (3 - 5) of regions of interest (ROI). These data form part of the “knowledge library” for air
scattered radiation at different distances from the source and will be used in the next experiment when determining shielding properties of a source.
Relative primary photon fluence, 662 keV
0.0
0.2
0.4
0.6
0.8
1.0
1.2
-300 -200 -100 0 100 200 300
Distance along the road (m)
R = 50 mR = 100 mR = 150 mR = 200 mR = 250 m
Fig A1 Normalized primary photon fluence along a road path where a photon source of primary energy 662 keV is located at different distances R from the road. All maximum values are set to 1. This set of “intensity curves” can be used to determine the distance from at set of count rate
measurement data in the full energy peak of a mobile spectrometer along the road. When the place of maximum count rate along the road is determined in a first pass and set to 1, the curve corresponding to the correct distance can be found by comparing the curves with the reduced count rate at certain distances away from the maximum. Example: Obtaining the relative count rates 1 at the maximum position, 0,7 at 50 m and 0,3 at 100 m distance from the maximum, indicates that the shortest distance from the road to the source is about 100 m (the magenta colored curve).
A.3 Determining the shielding properties of a source When shielding material is inserted between the source and detector the primary photon fluence at the detector is reduced, but the relation between scattered and primary fluence is increased because of the increased Compton scattering of photons in the shield (Fig A2 and A3). If the relation between scattered and primary fluence is known for various shield thickness and materials, the shielding properties may be assessed from the pulse height distribution registered by a gamma spectrometer. The relation is complicated to calculate theoretically, but it can be measured for different radionuclides and mass thicknesses of shield materials including the air between the source and detector. It is independent of the activity of the source. Measured observations can be stored in a “knowledge library”, which then can be
used to assess an unknown, approximately similar, situation with a shielded source. In the experiment primarily Cs-137 will be used as the source.

NKS SHIELDMORC Final Report 2019 Page 58 (61)
58
A.3.1 The shielding experiment part 1:
This constitutes a start of a “knowledge library” containing measured scattered to primary
count rate ratios in a gamma spectrometers pulse height distribution. It will be implemented by setting up a number of predefined geometries with different shielding material and shield thickness. Teams make measurements and store data in a simplified form (as ROI count rate ratios) in the “knowledge library”.
A.3.2 The shielding experiment part 2
This includes measurements on shielded point sources with unknown shielding and distance, but of a similar design as the geometries stored in the “knowledge library”. The teams should
identify approximate distance, shielding and activity. The intention is to investigate if the “knowledge library” method is a useful tool and to identify what improvements can be made.
A.4 Limitations of the experiment
The scattered radiation from a shielded photon source is a complex phenomenon that depends on many parameters. In the relatively short time available to the teams to conduct the experi-ments, only a small number of shielding geometries can be examined and stored in the “knowledge library”. The experiment will be limited to one radionuclide, Cs-137.
Net normalized pulse height distribution from Cs-137 with air-only shielding at different source-detector distances
0
50
100
150
200
250
0 100 200 300 400 500 600 700 800 900 1000
Photon energy / keV
Nor
mal
ized
cou
nt ra
te /
%
Air 19.6 mAir 39.6 mAir 59.6 mAir 79.6 m
Fig A2. Net (background subtracted) normalized pulse height distribution from a Cs-137 source recorded by a 4 liter NaI(Tl)-spectrometer at different distances from the source with only air between the source and detector. The maximum count rate in the full energy peak is set to 100 for each measurement. The suggestion is to quantify the difference in scattered radiation in relation to the primary by using one ROI for the primary photon fluence and, for example three ROI’s for the scattered fluence at lower energies (indicated as black lines). The exact energy intervals of the ROI’s will be selected before the experiment takes place.

NKS SHIELDMORC Final Report 2019 Page 59 (61)
59
Net normalized pulse height distribution from Cs-137 with stepwise increasing clay brick shielding
0
50
100
150
200
250
300
350
400
450
500
0 200 400 600 800 1000
Photon energy / keV
Nor
mal
ized
cou
nt ra
te /
%
No shield1 clay brick2 clay bricks3 clay bricks4 clay bricks5 clay bricks
Fig A3. Net normalized pulse height distribution from a Cs-137 source (background subtracted) recorded by a 4 liter NaI(Tl)-spectrometer at 9.6 m from the detector with different amount of clay brick shielding around the source. The maximum count rate in the full energy peak is set to 100 for each measurement, mimicking a source in a building with different wall thickness. The scattered fluence at 100 keV for 5 bricks is increased nearly 30 times compared to only air shielding for the same distance. At the same time the primary fluence is reduced about 4 times.

NKS SHIELDMORC Final Report 2019 Page 60 (61)
60
Bibliographic Data Sheet NKS-433
Title SHIELDMORC– Detection distances and methods to locate
orphan gamma radiation sources in shielded building geometries by mobile gamma spectrometry
Author(s) Christopher L. Rääf1 (chair), Robert R. Finck1 (co-chair), Vikas C. Baranwal5, Antanas Bukartas1, Marie-Andrée Dumais5, Kjartan Guðnason4, Yvonne Hinrichsen1, Gísli Jónsson4, Mattias Jönsson1, Peder Kock7, Sune Juul Krogh2, Simon Karlsson7, Frode Ofstad5, Jan Steinar Rønning5, Petri Smolander3, Kasra Tazmini6, Mikael Westin7
Affiliation(s) 1Medical Radiation Physics, ITM, Lund University, Sweden 2Danish Emergency Management Agency, Denmark 3Radiation and Nuclear Safety Authority, Finland 4Icelandic Radiation Safety Authority, Iceland 5Geological Survey of Norway, Norway 6Norwegian Radiation and Nuclear Safety Authority, Norway 7Swedish Radiation Safety Authority, Sweden
ISBN 978-87-7893-523-6
Date March 2020
Project NKS-B / SHIELDMORC, Contract AFT/B(19)2
No. of pages 59
No. of tables 4
No. of illustrations 47
No. of references 7
Abstract max. 2000 characters
Mobile gamma spectrometry is a key method when searching for gamma-emitting radioactive sources that have come out of regulatory control through accidents or deliberate events. Such sources can be more or less shielded, which reduces and distorts the gamma spectrometric signal. It makes detection more difficult as the signal from the primary radiation decreases. An estimate of the shielding is needed to assess the potential hazard before approaching to handle the source. The NKS/SHIELDMORC activity is a step on the way to gain experiences in mobile gamma spectrometry for detection of shielded sources. It is carried out in collaboration between mobile detection teams from Denmark, Finland, Iceland, Norway and Sweden. The aim is to develop and test practical methods to detect lost or hidden gamma emitting sources and estimate their locations and activities. This report describes

NKS SHIELDMORC Final Report 2019 Page 61 (61)
61
results from preparatory theoretical calculations and some experimental acquirements on situations with shielded Cs-137 and Co-60 sources, using a 4 litre NaI(Tl)-spectrometer. A method of applying a ratio of count rates in three regions of interest (ROI) representing selected parts of the Compton scattered registrations together with one ROI for primary registrations seems to be useful for determination of the amount of scattered radiation from a possible shield around the source. The method may also roughly indicate the physical properties of the shield in terms of thickness and whether the material has high or low atomic number. However, further experiments are needed to verify this. The intention is to make the verification in a joint Nordic field experiment in 2020. The report describes a proposed design for such an experiment.
Key words Mobile gamma spectrometry, MORC, orphan hidden gamma sources, radiation accidents, shielding, Compton scattering
Available on request from the NKS Secretariat, P.O.Box 49, DK-4000 Roskilde, Denmark. Phone (+45) 4677 4041, e-mail [email protected], www.nks.org