no. 038/2020/mkt airlines alliances: fractures in seamless
TRANSCRIPT
No. 038/2020/MKT
Airlines Alliances: Fractures in Seamless Service
Trichy V. Krishnan*
Great Lakes institute of management
Siddharth Shekhar Singh*
Indian School of Business
Dipak C. Jain
China Europe International Business School (CEIBS)
August 2020
––––––––––––––––––––––––––––––––––––––––
* Corresponding authors:
1. Trichy V. Krishnan ([email protected]). Address: Great Lakes Institute Of Management, Prince Infocity
II,Ist Floor, 283/3, Rajiv Gandhi Salai (OMR), Kandanchavadi, Chennai – 600096, India.
2. Siddharth Shekhar Singh ([email protected]). Address: Indian School of Business, Gachibowli, Hyderabad
Telangana - 500 111, India.
1
AIRLINES ALLIANCES: FRACTURES IN SEAMLESS SERVICE
ABSTRACT
Airline alliances benefit global travelers and airlines. Although they enable seamless
travel across countries and airlines, many customers complain about less-than-satisfactory
services received from ‘partner’ airlines in an alliance. This is puzzling because quality of
service impacts success and service provided by any member of an alliance impacts the
evaluation of the entire alliance.
We develop an analytical framework to analyze the problem of variation in service
quality experienced by loyal customers during their journey across allied airlines. Our game
theoretic framework shows that variation in customer service is inherent in an alliance structure.
Therefore, managing customer expectations about service quality could alleviate dissatisfaction
due to service quality variation. Both customer service and profitability of an alliance can be
improved if its governing board takes more control of the alliance members’ service efforts and
pushes them to invest in enhancing service infrastructure. Finally, alliance-wide customer service
improves when allied airlines provide higher benefits to their loyalty program members by
leveraging spare capacity—a new benefit of loyalty programs in the context of airline alliances.
Keywords: Airline, Alliance, service, customer satisfaction

2
Airlines operate in a highly competitive service industry. The intensity of competition
and high fixed cost of operations drive airlines to excel in customer service to maintain a
competitive edge. Airlines offer various services at key contact points of customer travel. These
include online ticket booking, online printing of boarding passes, fast check-in at airport
counters, seat upgrade, seat selection, airport lounges, smooth boarding, on-time departure and
arrival, in-flight comforts, baggage delivery with minimum hassle at destination airports, and
loyalty programs for frequent travelers to get upgrades, access to airline lounges and free flights
in future. To provide these ‘conventional’ services, every major airline has invested in service
infrastructure that includes physical facilities, technology and human resources.
In the 1990s, airlines started offering a novel set of benefits to international travelers
through forming global alliances. Airlines in various regions formed inter-regional and global
alliances to serve international routes. For example, Star Alliance, formed in 1997, has brought
together United Airlines from the US, Lufthansa from Europe, ANA from Japan, Singapore
Airlines and Thai Airways from SE Asia, Air China from China, Air India from India, and many
other regional airlines like Air New Zealand (see Table 1 in the Web Appendix).
An international air alliance provides a global traveler with “one-stop” benefits in ticket
purchasing, seamless travel across member airlines, end-to-end movement of baggage and better
price, as evidenced in many studies (e.g. Bamberger, Carlton and Neumann 2004;Brueckner
2001; and Brueckner and Whalen 2000). However, international travelers’ overall satisfaction
with an alliance is derived not only from the one-stop benefits provided by the alliance but also
from the conventional services offered by the different member airlines at various contact points
of their travel. While travelers are generally happy with the one-stop benefits, many seem to
3
have issues with the conventional services. They have been registering complaints on websites
such as http://www.airlinecomplaints.org to show their dissatisfaction. For example:
“… One-World airlines don't offer any real alliance wide benefits for their most loyal customers.
… no alliance wide extra baggage allowance for Ruby, emerald, sapphire members, no upgrade
rewards between alliance members. At most you get priority check in, and lounge access…”
“…Downside of the large alliance is that in some places the lounges get very crowded and at
Changi they would only let me take one child into the SQ Lounge - though I have never had a
problem anywhere else…”
Table 2 in the Web Appendix summarizes examples of such complaints. While some
individual complaints can be ignored as trivial, incorrect, or arising from a misunderstanding, a
careful analysis points to a variation in service quality experienced by travelers as they move
from one airline to another within an alliance network during a journey. Calling the airline
where a traveler has loyalty program account as the “home airline” and the other airlines in the
alliance as “partner airlines”, we summarize the complaints as follows.
a) Lack of services at partner airlines’ facilities including lounges1.
b) Unable to get choice of seating, seat upgrade and luggage allowance at partner airlines.
c) Inconsistency in terms and conditions for accrual of miles travelled with partner airlines.
d) Lack of service/support at partner airlines when unexpected problems come up such as
missed flight, lost baggage and extra-sized baggage.
1 Typically, a global traveler has a loyalty program account with one member of an alliance, say United Airlines in the case of Star Alliance, and travels across the globe using services offered by the member airlines in the alliance.
4
e) Partner airlines’ staff suggesting customers to contact their home airline (i.e. airline with
their loyalty program membership) when problems arise.
The complaints primarily pertain to perceived deficiencies in conventional services
received by a traveler at the partner airlines. There are no major complaints reported against
their home airline. Further, customers don't seem to have complaints against the one-stop
benefits. Customers seem to have taken those benefits for granted now. However, this is clearly
not the case with conventional services provided by the partner airlines. Therefore, it can be
said that many airlines seem to compromise on the level of service provided to the customers of
their partner airlines2. This results in significant variation in the services experienced by a
global traveler as she3 travels through different airlines in an alliance during a journey. In fact,
during the 6th annual Star Alliance MegaDO event, Star Alliance conducted a focus group to
understand complaints about its member airlines. One major complaint concerned variation in
customer service across partner airlines.4 As reported in www.roadwarriorvoices.com (2015),
“… there was a definite sense that some airlines in the alliance believe they’re better than
others… One attendee complained that he couldn’t choose his seat on a Lufthansa flight when
flying with United miles, despite being a Star Alliance Gold member...”
Interestingly, extant research mostly using survey research methodology has shown the
negative impact of non-uniform service on customer satisfaction. For example, Weber and
Sparks (2004) show that variation in service quality is likely to have negative impact on overall
customer satisfaction for the entire alliance. It is also well documented that increase in customer
2 Service aspects that are compromised include seat upgrading, seat choice, lost-baggage handling, extra-wide baggage handling and assistance during emergencies such as when a flight is missed or cancelled. 3 Specific gender is used for the sake of convenience only. 4 http://www.roadwarriorvoices.com/2015/06/03/4-of-the-biggest-complaints-about-star-alliance/
5
satisfaction leads to more loyalty, i.e. apart from what loyalty programs do5. In fact, Weber
(2005) shows that (conventional) services are important to customers, perhaps even more than
miles accumulation. Bolton (1988) has shown that when customer is highly satisfied with the
prior services provided by the firm the duration of the provider-customer relationship is longer.
In yet another study, Bourdeau, Cronin and Voorhees (2007) investigate service alliances in
general and find that when customers are highly satisfied with the service quality at the partner
service-provider, their evaluation of their primary (home) service-provider tends to be more
favorable, and vice versa. Hence, in light of these findings, the complaints reported on websites
such as http://www.airlinecomplaints.org about the service at the partner airlines look
surprising. Clearly, these complaints should be of concern to airline alliances.
Alliances, while offering one-stop benefits have perhaps inadvertently affected how a
member airline serves customers of its partner airlines. What explains this observation? Is the
issue particular to an airline or is it alliance-wide? Are the loyal customers of an airline
expecting more than what a partner airline is willing to or can provide to them? What should
the alliance and its member airlines do to deal with the problem and thereby improve customer
service and satisfaction?
Our primary objective in this research is to analytically investigate the variation in
service quality experienced by travelers during their journey across member airlines in a global
airline alliance network. We propose a game theoretic model to study the reasons (e.g. limited
5 Simply put, loyalty programs “buy” loyalty while customer service earns loyalty. Research into effectiveness of loyalty programs in general shows mixed results (Singh, Jain and Krishnan 2008; Dowling and Uncles 1997; Reichheld and Teal 1996).

6
capacity of airlines) for the existence of service quality variation. We also discuss ways in
which airlines can address this issue and improve their profits and travelers’ satisfaction.
The rest of the paper is organized as follows. In Section 2, we develop the analytical
model. After deriving the key theoretical results we analyze the robustness and credibility of the
results using observed data. We also analyze the impact of the main parameters of the model. We
also examine if these results hold good under a key variation of the proposed model. In Section
3, we use the insights gained from the sections 2 to suggest several possible solutions to the
problem. Section 4 summarizes the paper, giving directions for future research.
MODEL FORMULATION
We focus on the service capability of an airline, which comes under stress when the
airline becomes part of an alliance. The reasons for this focus are as follows. First, as new
members get added to an alliance to enlarge its geographical reach, each member airline
experiences a higher flow of customer traffic resulting in higher strain on its service
infrastructure and policy guidelines that were primarily designed to handle only its own customer
traffic. Second, member airlines differ in their ability to offer necessary additional services for
the members of the partner airlines. Given that the services are airline-specific, the quality of
service infrastructure may differ from one member airline to another, or the airlines’ priorities
may differ.
Third, rules and regulations regarding upgrade, miles accumulation and baggage
allowance vary widely across member airlines. The global travelers, however, may not be aware
of all these variations. Therefore, they expect similar service from various member airlines
during their travel through an alliance network. As a result, some of these customers may
7
demand certain services such as a seat upgrade from a partner airline that might not be available
to them because priority is generally given to the partner airline’s own loyal customers. In such
cases, the service staff at the airline counters would find it difficult to handle the customers’
demands, resulting in complaints of poor service.
Fourth, in times of emergencies such as missed flights and lost baggage, an airline may
not be able to proactively help a stranded passenger of a partner airline because it might not have
access to the passenger’s information such as cell phone number, which would be resting in the
data base of the customer’s home airline. This puts passengers of partner airlines at a
disadvantage during emergencies, resulting in perceived poorer service.
It would be incorrect to say that airlines overlook service capacity issues when they form
an alliance. However, to what extent these issues are given priority by the executive board of an
alliance is not clear because the level of seriousness accorded to the service capacity issue could
depend on the nature of the alliance. In general, alliances vary along a continuum based on the
level of cooperation—all the way from a “joint venture” to a loose “code-sharing” agreement. To
cover the range of alliances and for simplicity, we consider two types of alliances in this
research:
Scenario 1: The alliance as the mother organization decides what service level each
member airline should offer to customers of the partner airlines. This is akin to a “joint venture”.
Scenario 2: Each member airline of the alliance decides the service level to offer to
customers of its partner airlines.
We use a linear spatial model to analyze factors influencing service quality variation
under both the scenarios. The alliances we see among airlines can either be reduced to one of
these two scenarios or may lie somewhere in between (Figure 1 presents the two scenarios along
8
with an overview of the model we develop in this research). For Scenario 1, we use a decision
calculus approach for our analysis and for Scenario 2 we augment it with a game theoretic
analysis.
We study air journeys that have two parts or sectors. We assume two airlines in the
alliance where the first sector of the journey is operated by one airline and the second sector by
the other airline. We further assume that for a given customer, the first sector is with the home
airline, i.e. the airline with which the customer has her loyalty program membership. We refer to
this airline as A1. The second sector is with the partner airline, A2. Customers using the alliance
buy one ticket for the whole journey and expect similar conventional services on both sectors.
Description of Scenario 1
In this scenario, the Alliance6 is the decision maker and the member airlines are expected
to follow the guidelines stipulated by the Alliance. We first explain the decision variables and the
parameters that give structure to the model, then develop the profit function for the Alliance, and
finally derive the optimal price and service level.
SERVICE Level: The customer experiences conventional services offered by the home
airline (A1) in the first sector and the partner airline (A2) in the second sector. Assuming that
these services could be at different levels, let 0 indicate the poorest service level and 1 indicate
the best service level. Further, we assume that to this customer her home airline A1 offers a
service level of 1 and A2, the partner airline, offers a service level s (0 ≤ s ≤ 1), to be chosen by
the Alliance. Since an airline can easily identify its own loyal customers and those of the partner
airline, it can render different levels of service to the two groups, especially with respect to
6 Henceforth, we use Alliance (with cap A) whenever we want to indicate the alliance as a decision maker.

9
services such as seat choice, seat upgrade, assistance during missed flights or delayed flights, and
extra luggage. There are two caveats here. First, with respect to some services such as lounge
access, even the airline’s own customers may suffer when lounge is full and those times the
customers might be dissatisfied but we assume that those situations will not be frequent enough
to make the overall service rendered to them less than 1. Second, when two airlines in an alliance
have inherently different service levels, a customer whose home airline has ‘inferior’ service
might find some service aspects at the partner airline better in spite of the partner airline offering
less than its full service. This situation can be accommodated in our model. However, for
simplicity we assume that the alliance members are similar and inherently offer similar level of
service to their customers.
CUSTOMER Segments: We assume that there are two segments of customers: those who
travel in economy class (E-class) and those who travel in higher classes (e.g. business class,
denoted by H-class). One would expect H-class customers to be more sensitive to service than E-
class customers because a major reason for paying higher ticket price is to receive better service.
Let the utility obtained by a customer from service level “s” be UH(s) for H-class customers and
UE(s) for E-class customers. As s increases from 0 to 1, the utilities obtained by H and E
customers respectively are specified as:
UH(s) = s Umax (1)
UE(s) = s (Umax - ) (2)
where s is the service level experienced by customers, and 0 < < Umax. Without loss of
generality, let Umax = 1. In that case, UH(s) = s and UE(s) = s + (1 – ).
10
Role of : As gets closer to 0, UE(s) gets closer to 1 implying that E-class customers
are completely satisfied with any level of service provided to them and that a change in service
level would not influence their satisfaction. On the other hand, if = 1, then UE(s) = s implying
that E-class customers behave more like H-class customers because their utility would be
enhanced by higher service level. Since a higher value of means higher service sensitivity (i.e.
), we consider as a measure of service sensitivity of E-class customers.
Since both H- and E-class customers receive full (i.e. the expected) service from their
home airline (i.e. s = 1), both would enjoy a utility of value 1 when flying with their home
airline. However, when they fly with the partner airline, which offers a service level of s ≤ 1, the
H-class customers enjoy utility UH(s) = s while the E-class customers enjoy utility UE(s) = s +
(1 – ).
COST-to-serve: Since service plays a critical role in how customers value their travel
experience, airlines invest significantly in service infrastructure, which includes setting up
service centers and counters at airports around the world, deploying well-trained service
personnel at various contact points (i.e. check-in counters, baggage areas, gates, and in-flight),
employing technology and putting up special processes and service facilities such as lounges to
cater to their loyal customers of different grades.
When an alliance is formed, it is aware that to serve the increased customer flow,
member airlines have to either expand their service infrastructure, which needs significant
investment, or extract more from existing assets and resources, which would increase the
11
operating cost of serving a customer. Assuming the latter, we propose the following cost-to-serve
specification for an airline7:
Cost-to-serve = C(s) = Base cost-to-serve + f (additional volume of services provided) (3)
The base cost that an airline incurs using its existing infrastructure is assumed to be 1.
Extracting more out of the installed capacity of the infrastructure to serve additional customers
would result in a variable cost that increases at an increasing rate. This implies that the function
f(*) in expression (3) is convex. Given that s is the level of service offered to the customers of
partner airline, we specify the cost function as:
C(s) = 1+ s2 (4)
A customer in our model travels through two sectors during the journey, the service cost
in equation (4) refers to the total service cost incurred by the Alliance to serve a customer over
the complete trip. Consider customer G1 travelling from city C1 to C2 by airline A1, the home
airline, and from city C2 to C3 by airline A2, the partner airline. Similarly consider another
customer, G2, travelling from C3 to C2 by A2, her home airline, and from C2 to C1 by A1, the
partner airline. The airline A1 will incur service cost of “1” in serving G1 and “s2” in serving
G2. Total cost incurred by A1 is 1+s2. Similarly, airline A2 will incur a cost of “1” in serving G2
and “s2” in additionally serving G1. Total cost incurred by A2 is 1+s2. Hence, for the Alliance
that has A1 and A2 as its members, total cost to serve two customers taking opposite trips is
2*[1+s2], and hence the service cost incurred to serve one customer making one one-way trip (of
two sectors) is 1+s2.
7 We will discuss the “investment to expand service infrastructure” option later.
12
Given that s is a decision variable for the Alliance, the optimal service level will be a
function of two opposing forces, namely, the increase in cost-to-serve and the extent of influence
service has on customer satisfaction and in turn on the customers’ choice of the Alliance.
An Alternative to Alliance: Within the framework of our analysis, one alternative to the Alliance
is a customer having both the partner airlines as her home airlines by taking membership of the
loyalty programs offered by both. For the 2-sector journey, she would then buy two separate
tickets, one from airline A1 for the first sector and the other from airline A2 for the second
sector. Being a member of both of the loyalty programs, she will receive maximum service from
each airline, i.e. in each sector. We call this alternative “Independent-Airlines.”8
We assume this alternative for three reasons. First, a recent IATA report by Brueckner,
Lee and Singer (2010) uses this Independent Airlines option, which they call as ‘non-aligned
airlines’, as the base case to compare the prices of various alliances. Second, in this option, each
airline avoids competing directly with the partner airline, thus preserving an important economic
objective of the alliance formation9. This helps us focus our research on the objective of finding
out why customers experience non-uniform service across the member airlines in an alliance.
Third, once a customer gets used to flying a particular alliance, choosing another alliance to
reach the same international destination is likely to require her to travel through a different set of
cities and perhaps in a different schedule. Hence we assume that the customer would prefer
buying two independent tickets if she wants to receive the best service in both the sectors.
8 She can also have two loyalty cards but buy the alliance ticket and use in each airline the appropriate card. We assume that this segment of customers is not of significant size. 9 Economic benefits of the alliance as espoused in Brian and Doernhoefer (2011) are preserved in the Independent Airlines option.
13
Alliance Price: There are two aspects to price. First, the discount the Alliance gives with respect
to the Independent-Airlines option, called ‘spot-discount’, and second, a notional discount
arising from the loyalty program. Alliance enables a loyalty program member of one airline to
add to her account the miles flown with partner airlines, and thereby helps the customer redeem
her miles more quickly (i.e. compared to using two loyalty cards in the Independent-Airlines
option), which she could use to get a free ticket, seat upgrade or some other discount in future.
Since the customer is aware of the future price benefits, she can evaluate the present value of
those benefits and use that value to perceive a notional ‘miles-based discount.’ We explain these
two aspects of price through an example.
Let the prices at the Independent Airlines be p1 for sector 1 and p2 for sector 2. Without
loss of generality, let p1 = p2 = p. Let the spot-discount be , where 0 < < 110, and h be the
miles-based discount. So, the customer pays 2p to acquire the Alliance ticket; she further
perceives a miles-based discount of 2p h in the choice of the Alliance over the Independent-
Airlines option. For example, if p = USD 3000 (Business class), = .7 and h = .05, then the
ticket price at the Independent Airlines option is 2p i.e. USD 6000, the ticket price charged by
the Alliance will be (6000 * .7 =) USD 4200 and the miles-based discount perceived by the
customer would be (6000 * .05 =) USD 300. Although the customer flying the Alliance would
pay USD 4200, she would perceive the price to be USD 3900 because of the future rewards she
expects to get due to the miles she travels now.
10 The alliance enables member airlines to avoid overlapping routes leading to cost saving. Hence we assume that the Alliance ticket price is lower than the sum of two independent tickets’ prices. We found the same true in practice.
14
We use a spatial location model (Hotelling 1929) assuming a unit-length one-dimensional
market where the Alliance product is at one end and the Independent-Airlines product is at the
other end (see Figure 1). Since we have two classes of customers, E and H, we assume each class
to be uniformly distributed along the market of unit length. Our objective is to find and s the
Alliance would choose to optimize profits.
MARKET share of alliance: First, let us consider the H-class segment. A customer at a
distance x from the Alliance product will be indifferent between buying the Alliance product and
the Independent-Airlines product when the net cost of purchasing either product is the same. For
this customer:
Net cost of buying the H-class Alliance ticket = 2x + 2p- 2p h - (1+s) (5)
where (1+s) is the utility derived from the service –which is “1” in the first sector of the journey
travelled with her home airline, and “s” in the second sector with the partner airline, 2p is the
Alliance price for the ticket, 2ph is the perceived miles-based discount explained earlier (i.e.
more than what the Independent Airlines option provides) and 2x is the “travelling (or misfit)
cost”.
For a customer who chooses the Independent-Airlines option:
Net cost of buying Independent-Airlines tickets = 2(1-x)+2p-(1+1) = 2p-2x (6)
In this case, the customer pays regular full price for each sector individually and receives the
maximum service from partner airline as well because each airline treats the customer as its own
customer.
Equating expressions (5) and (6), we get xH, the market share of the Alliance in the H-
class segment as:
15
14
12
112
14
(7)
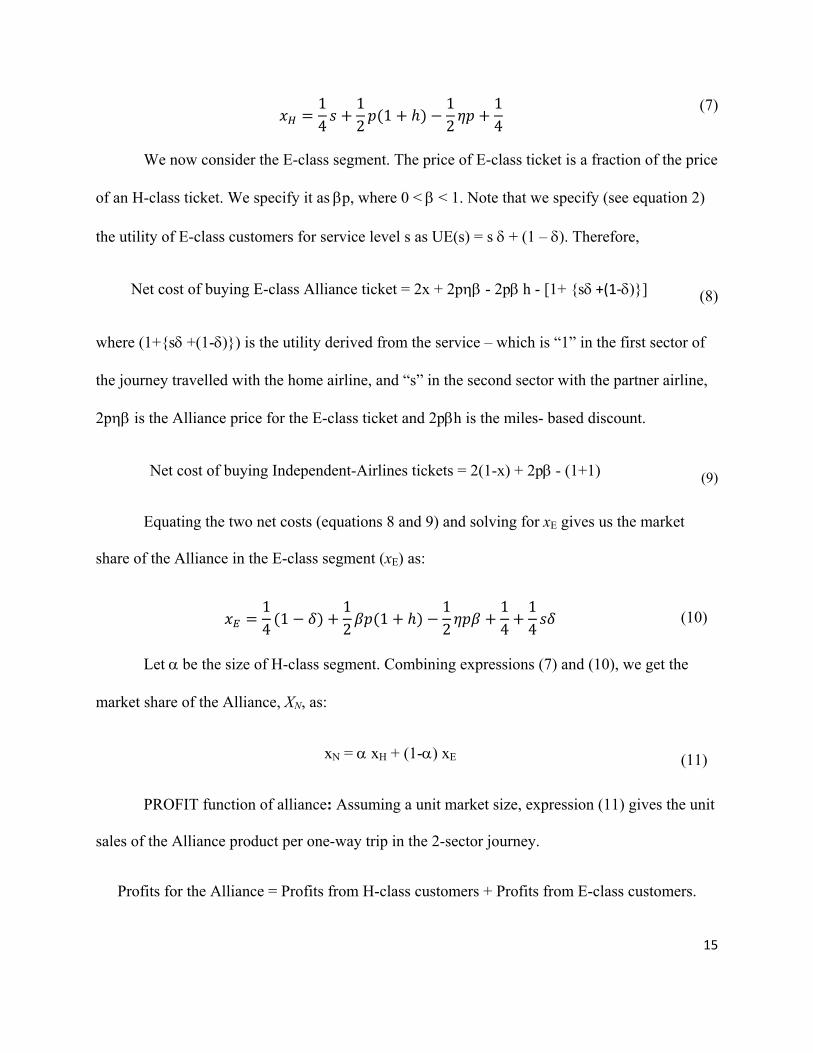
We now consider the E-class segment. The price of E-class ticket is a fraction of the price
of an H-class ticket. We specify it as p, where 0 < < 1. Note that we specify (see equation 2)
the utility of E-class customers for service level s as UE(s) = s + (1 – ). Therefore,
Net cost of buying E-class Alliance ticket = 2x + 2p- 2p h - [1+ {s +(1‐)}] (8)
where (1+{s +(1-)}) is the utility derived from the service – which is “1” in the first sector of
the journey travelled with the home airline, and “s” in the second sector with the partner airline,
2p is the Alliance price for the E-class ticket and 2ph is the miles- based discount.
Net cost of buying Independent-Airlines tickets = 2(1-x) + 2p - (1+1) (9)
Equating the two net costs (equations 8 and 9) and solving for xE gives us the market
share of the Alliance in the E-class segment (xE) as:
141
12
112
14
14
(10)
Let be the size of H-class segment. Combining expressions (7) and (10), we get the
market share of the Alliance, XN, as:
xN = xH + (1-) xE (11)
PROFIT function of alliance: Assuming a unit market size, expression (11) gives the unit
sales of the Alliance product per one-way trip in the 2-sector journey.
Profits for the Alliance = Profits from H-class customers + Profits from E-class customers.

16
Profits from H-class customers = Π αx 2ηp 1 s , (12)
where the variable cost of service is as defined and explained in expression (4).
It is important to note that the miles-based discount, h, does not influence the profit
margin, i.e. the term in the parentheses on the right hand side of expression (12), because it is
usually made available to customers from the unused flight capacity at the time of redemption.
However, the miles-discount does affect customer choice, which is captured in the market share
of the Alliance, i.e. xH (see expressions 7 and 12). Stated differently, we assume that the airlines
use their spare capacity intelligently to offer valuable rewards to customers without incurring
significant cash outflow.
Similarly for the E-class segment,
Profit from E-class customers = Π 1 α x 2ηpβ 1 s . (13)
Therefore, total profit for the Alliance is:
Π Π Π
12 2
1 2 2 2
12 2
1 2 2 1 2
(14)
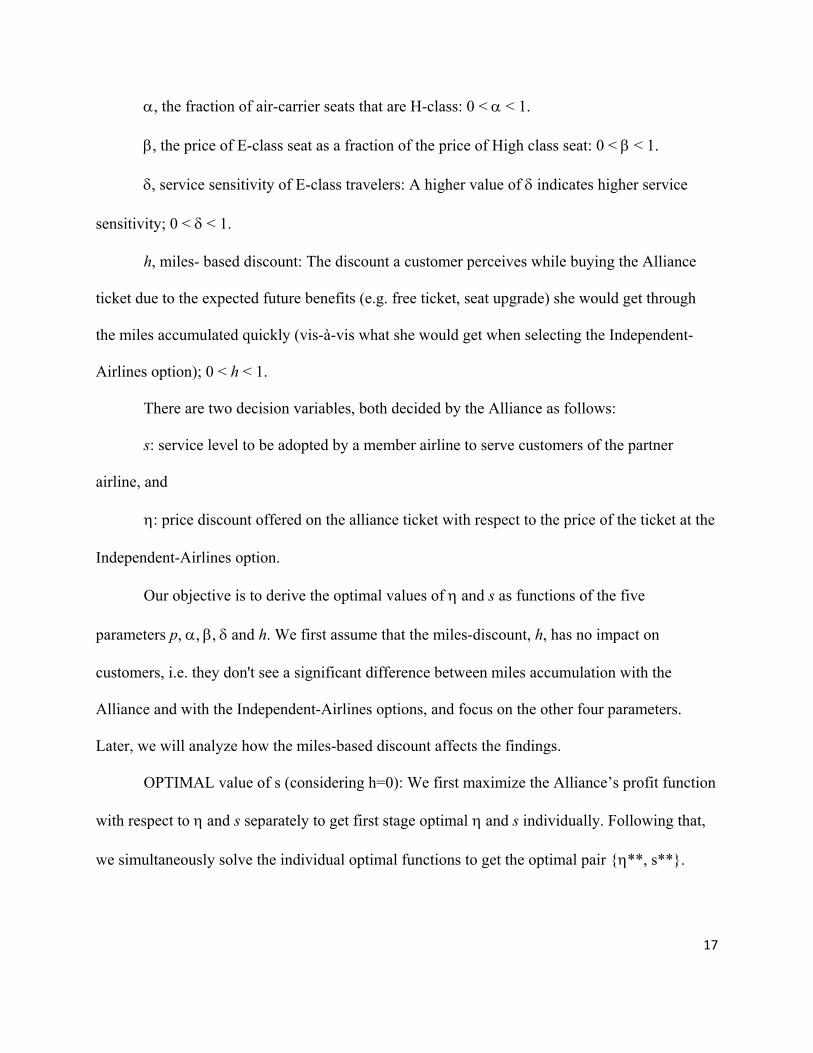
In our model formulation, the following parameters give structure to the model.
p, the price of H-class seat: Since the cost of service is assumed to be less than 1 in the
profit function (expressions 12 through 14), the parameter p has to be anchored in such a way
that we have a positive profit margin.
17
, the fraction of air-carrier seats that are H-class: 0 < < 1.
, the price of E-class seat as a fraction of the price of High class seat: 0 < < 1.
, service sensitivity of E-class travelers: A higher value of indicates higher service
sensitivity; 0 < < 1.
h, miles- based discount: The discount a customer perceives while buying the Alliance
ticket due to the expected future benefits (e.g. free ticket, seat upgrade) she would get through
the miles accumulated quickly (vis-à-vis what she would get when selecting the Independent-
Airlines option); 0 < h < 1.
There are two decision variables, both decided by the Alliance as follows:
s: service level to be adopted by a member airline to serve customers of the partner
airline, and
: price discount offered on the alliance ticket with respect to the price of the ticket at the
Independent-Airlines option.
Our objective is to derive the optimal values of and s as functions of the five
parameters p, , , and h. We first assume that the miles-discount, h, has no impact on
customers, i.e. they don't see a significant difference between miles accumulation with the
Alliance and with the Independent-Airlines options, and focus on the other four parameters.
Later, we will analyze how the miles-based discount affects the findings.
OPTIMAL value of s (considering h=0): We first maximize the Alliance’s profit function
with respect to and s separately to get first stage optimal and s individually. Following that,
we simultaneously solve the individual optimal functions to get the optimal pair {**, s**}.
18
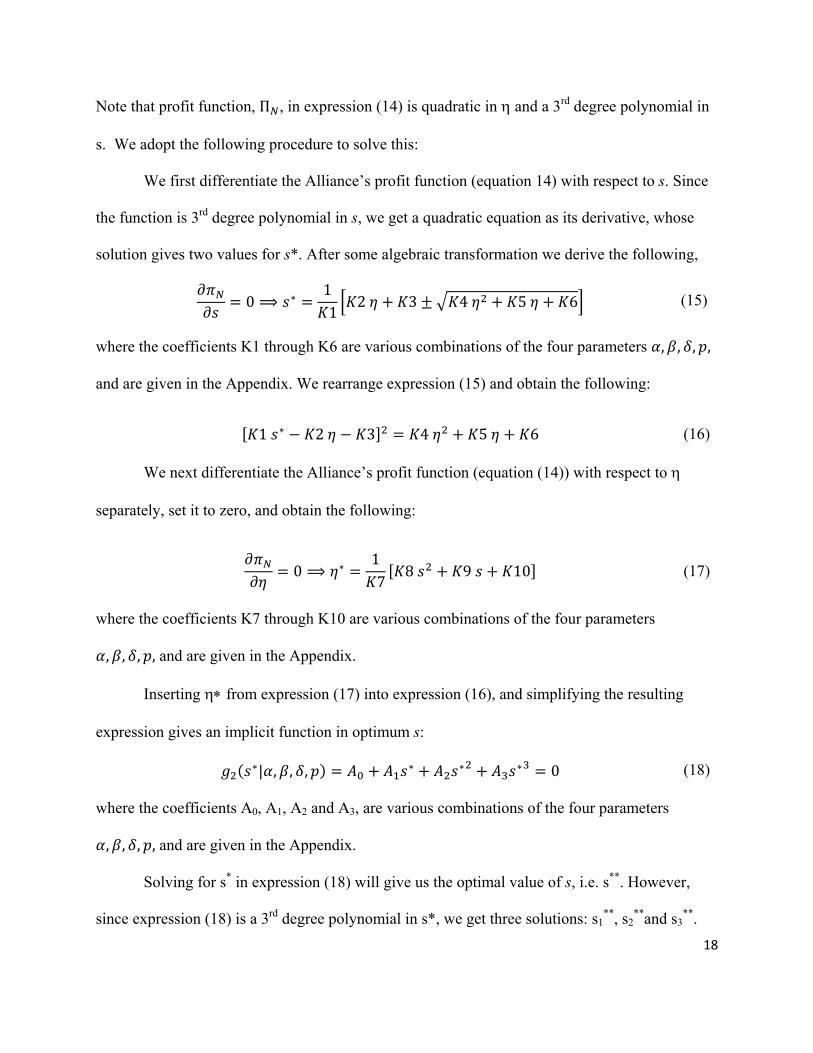
Note that profit function, Π , in expression (14) is quadratic in and a 3rd degree polynomial in
s. We adopt the following procedure to solve this:
We first differentiate the Alliance’s profit function (equation 14) with respect to s. Since
the function is 3rd degree polynomial in s, we get a quadratic equation as its derivative, whose
solution gives two values for s*. After some algebraic transformation we derive the following,
0 ⟹ ∗ 11
2 3 4 5 6 (15)
where the coefficients K1 through K6 are various combinations of the four parameters , , , ,
and are given in the Appendix. We rearrange expression (15) and obtain the following:
1 ∗ 2 3 4 5 6 (16)
We next differentiate the Alliance’s profit function (equation (14)) with respect to
separately, set it to zero, and obtain the following:
0 ⟹ ∗ 17
8 9 10 (17)
where the coefficients K7 through K10 are various combinations of the four parameters
, , , , and are given in the Appendix.
Inserting from expression (17) into expression (16), and simplifying the resulting
expression gives an implicit function in optimum s:
∗| , , , ∗ ∗ ∗ 0 (18)
where the coefficients A0, A1, A2 and A3, are various combinations of the four parameters
, , , , and are given in the Appendix.
Solving for s* in expression (18) will give us the optimal value of s, i.e. s**. However,
since expression (18) is a 3rd degree polynomial in s*, we get three solutions: s1**, s2
**and s3**.
19
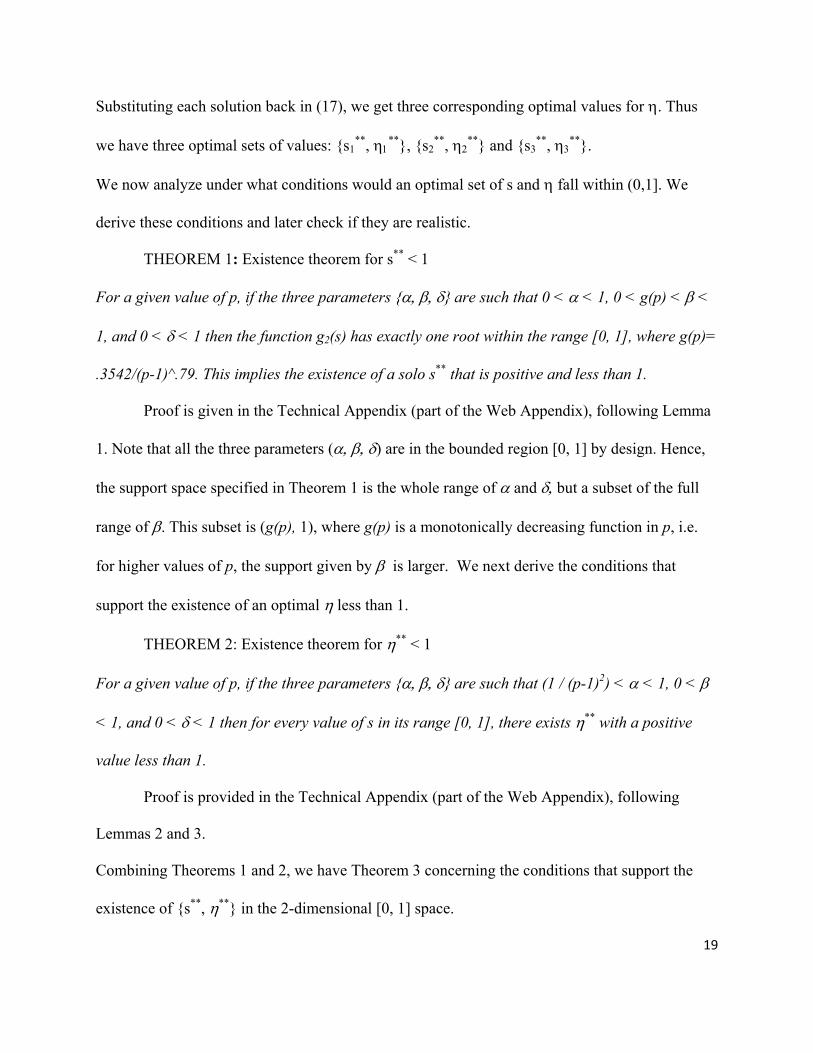
Substituting each solution back in (17), we get three corresponding optimal values for . Thus
we have three optimal sets of values: {s1**,
**}, {s2**,
**} and {s3**,
**}.
We now analyze under what conditions would an optimal set of s and fall within (0,1]. We
derive these conditions and later check if they are realistic.
THEOREM 1: Existence theorem for s** < 1
For a given value of p, if the three parameters {} are such that 0 < < 1, 0 < g(p) < <
1, and 0 < < 1 then the function g2(s) has exactly one root within the range [0, 1], where g(p)=
.3542/(p-1)^.79. This implies the existence of a solo s** that is positive and less than 1.
Proof is given in the Technical Appendix (part of the Web Appendix), following Lemma
1. Note that all the three parameters () are in the bounded region [0, 1] by design. Hence,
the support space specified in Theorem 1 is the whole range of and but a subset of the full
range of . This subset is (g(p), 1), where g(p) is a monotonically decreasing function in p, i.e.
for higher values of p, the support given by is larger. We next derive the conditions that
support the existence of an optimal less than 1.
THEOREM 2: Existence theorem for ** < 1
For a given value of p, if the three parameters {} are such that (1 / (p-1)2) < < 1, 0 <
< 1, and 0 < < 1 then for every value of s in its range [0, 1], there exists ** with a positive
value less than 1.
Proof is provided in the Technical Appendix (part of the Web Appendix), following
Lemmas 2 and 3.
Combining Theorems 1 and 2, we have Theorem 3 concerning the conditions that support the
existence of {s**, **} in the 2-dimensional [0, 1] space.
T
For a giv
< < 1,
optimal A
.3542/(p-
T
hence ne
C
present th
solution “
For exam
**< 1” s
has to
W
300 in nu
seats. Th
theoretic
many air
11 A full lis12 Parameteoperating m
THEOREM 3
ven value of p
and 0 < <
Alliance-pric
-1)^.79.
This theorem
eds no furth
CREDIBILIT
he solution s
“s**< 1 and
mple, looking
solution to ex
be between
We collected
umber) and c
herefore, w
ally derived
line tickets f
st of all the noter p should ensmargins realist
3: Existence
f p, if the thre
< 1 , there ex
ce (expresse
simply puts
er proof11.
TY and Robu
support spac
**< 1” as d
g at the case
xist, has to
0 and 1.
information
calculated th
was estimated
range (see T
for H-class a
tations used in sure positive pric if p ≥ 4 and
theorem for
ee parameter
xists a solo op
d as fraction
s together the
ustness of th
ce (i.e. the sp
defined in Th
Insert Ta
of p=4 (first
o be between
n on the class
hat approxim
d to be .20. A
Table 3, colu
and E-class f
our research isrofit margin. It<10 respective
r s** and **
rs {} a
optimal servi
n of the full-p
e conditions
he implicatio
pace of param
heorem 3 for
able 3 about
t row in Tab
n .1111 and
s and seat co
mately 20% o
As we can se
umn 2 and it
fares and fou
s provided in tht can be shownely. Therefore,
*, both to be
are such tha
ice level s** Є
price) ** Є
mentioned
ons of the the
meters (
r a sample of
here
ble 3), we see
1, has to b
onfiguration
of the total se
ee, the real w
ts two sub-co
und that E-cl
he Appendix. n that profits ar we anchor the
less than 1
at (1 / (p-1)2)
Є [0, 1] and
Є [0, 1], wher
in the Theor
eorems: In T
which su
f values of p
e that for the
be between
of various c
eats in a carr
world is w
olumns). We
lass ticket pr
re more likely te parameter p in
) < < 1, g(
d a correspon
re g(p) =
rems 1 and 2
Table 3, we
upport the
p.12
e “s**< 1 and
.2048 and 1,
carriers (arou
rier are H-cl
well within th
e also sampl
rices are arou
to be positive an [4, 10] .
20
(p)
nding
2 and
d
, and
und
lass
he
ed
und
and
21
30% of the H-class ticket prices, suggesting to be around 0.3 (see Table 4 in the Web
Appendix).
Hence, the real world also lies well within the theoretically derived range (see Table 3,
column 3 and its two sub-columns). Of course, there is no need to check for . Therefore, we
find that the solution space suggested by our model is credible with respect to the case of p=4
(first row in Table 3). Looking at the other rows of Table 3 where p > 4, one can notice that the
theoretical support ranges for and get wider implying that our findings in case of p = 4 hold
true for higher values of p as well.
We now look at optimal s and We chose a few parameter values randomly from the
three-dimensional solution support space (i.e. ) and find their corresponding solutions {s**,
**}, which are expected to be in the 2-dimensional [0, 1] space, at various values of p. Consider
p = 4, = 0.20, = 0.3 and = 0.5. In this case, the optimal service level s** was found to be
0.2736 and the optimal alliance discount ** was found to be 0.7123, both less than 1. Similarly,
for p = 10, = 0.20, = 0.3 and = 0.5, we find s** and ** to be 0.2805 and 0.5865
respectively, both less than 1. For any p between 4 and 10, using the values for () as
(0.2,0.3,0.5), we found s** and ** both less than 1. Table 5 in the Web Appendix gives the
actual -observed in a sample from the airline market. The last column of Table 5 gives the
observed value of in the market. Taking an average of these values, we get the observed
average to be .7457. The observed values of give credibility to the theoretical range of that
support the solution space. Table 3 combined with our results here demonstrates that our model
explains why airlines in an alliance provide less-than-satisfactory level of service to loyal
22
customers of their partner airlines. Next, we show how this finding is true even when we include
miles-based discount’s impact.
OPTIMAL value of s (consideringh 0): As explained previously, miles-based discount
reflects future free ticket or seat upgrade customers expect to get when enough miles are accrued.
This discount affects customer choice towards the Alliance but not the airlines’ profit margins.
Our research question concerns whether this miles-based discount affects the optimal
service level offered by an airline to the customers of its partner airline in the alliance. Since we
don't have an explicit function for optimal service level (see Theorems 1 through 3), we resorted
to numerical analysis to explore the impact of h (i.e. miles-based discount) on optimal service
level. We used the profit function of the Alliance (equation 14) to derive the optimal service
level and price simultaneously for a given set of parameter values, and then repeated the process
over many sets of parameter values. One set of results is given in Figure 2.
Insert Figure 2 about here
In Figure 2, we have h on the x-axis and optimal service level on the right vertical axis,
and profits on the left vertical axis. It is observed that for a higher value of h, the optimal service
level is higher. One plausible explanation is as follows.
With miles-based discount, the Alliance does not incur any real cash outlay because it
simply makes a promise that the miles accumulated in that travel would be rewarded later. Later
too, when the miles are redeemed, the airlines use their spare capacity to pay off the reward, and
again actual cash outlay does not happen. Hence, the Alliance is able to influence customer
choice without incurring real cash outflow for the airlines by using its spare carrier capacity
intelligently. The resulting increase in the market share of the Alliance brings in more profit for
23
the Alliance (see left vertical axis of Figure 2), which they use to improve their service level and
increase their value proposition to the customers.
As mentioned before, all the four parameters , , and h lie in the (0, 1) range and
hence the numerical analysis is reliable. Note that in Figure 2, we had assigned a value of .20 to
and a value of 0.3 to , which are close to what we observe in practice (see Tables 4 and 5 in
the Web Appendix). We tested several values for , and although we have presented only one
case in Figure 2, other results are very similar. The offering of future rewards for miles out of
spare capacity, in lieu of price discount at the ticket counter increases not only the profits of the
Alliance but also the optimal service level. This suggests that providing higher perceived benefits
to customers by leveraging spare capacity can enhance customer service as well—another
benefit of loyalty programs.
Description of Scenario 2
In Scenario 1 (i.e. Section 2.1), the Alliance chose the optimal price for the whole trip,
and also the optimal service level each member should offer to the loyal customers of the partner
airline. In Scenario 2, we let the Alliance decide on the optimal price as before. However, we let
each member airline choose an optimal service level to offer to customers of the partner airline.
Note that each member airline always offers full service to its own loyal customers. Hence, while
deciding the service level for customers of the partner airline, an airline would like to take into
account how its own loyal customers would be treated by the partner airline. We will use the
decision calculus approach as in Scenario 1 with a difference. In Scenario 2 it is not the Alliance
that decides the optimal service level, it is each airline in the alliance that makes the decision.
Further, each airline’s decision takes into account the decision by the partner airline. Hence, we
augment the decision calculus approach with game theoretic analysis.
24
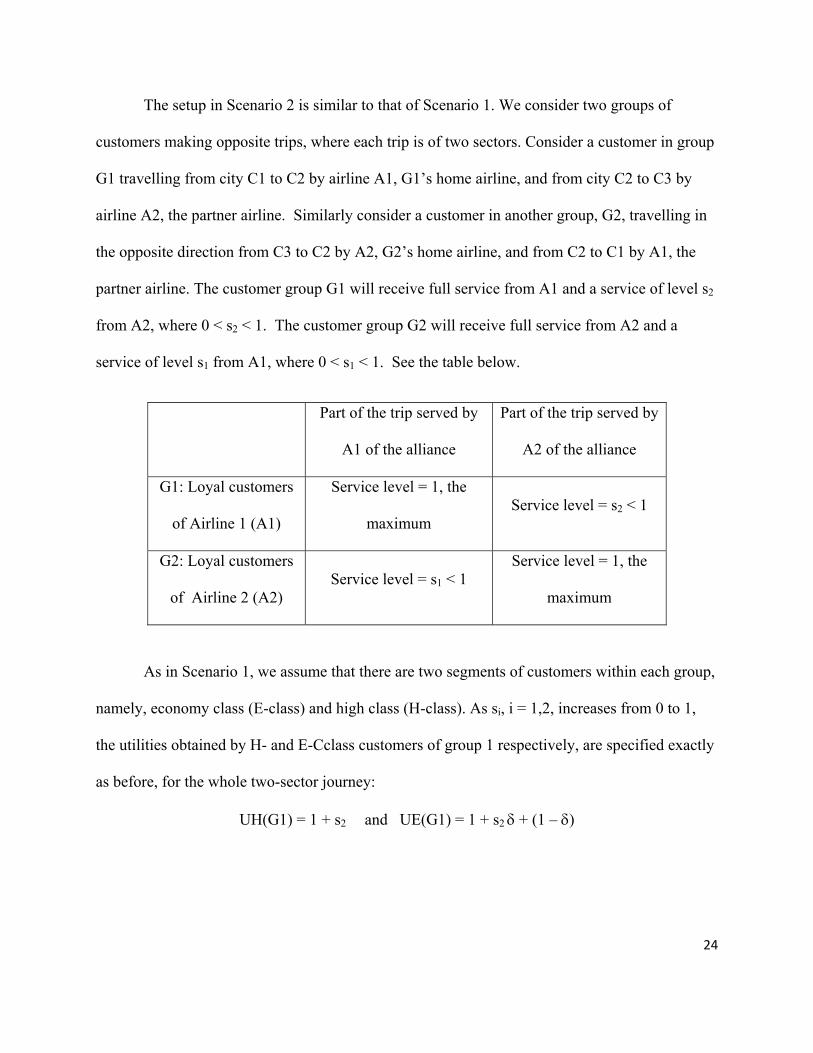
The setup in Scenario 2 is similar to that of Scenario 1. We consider two groups of
customers making opposite trips, where each trip is of two sectors. Consider a customer in group
G1 travelling from city C1 to C2 by airline A1, G1’s home airline, and from city C2 to C3 by
airline A2, the partner airline. Similarly consider a customer in another group, G2, travelling in
the opposite direction from C3 to C2 by A2, G2’s home airline, and from C2 to C1 by A1, the
partner airline. The customer group G1 will receive full service from A1 and a service of level s2
from A2, where 0 < s2 < 1. The customer group G2 will receive full service from A2 and a
service of level s1 from A1, where 0 < s1 < 1. See the table below.
Part of the trip served by
A1 of the alliance
Part of the trip served by
A2 of the alliance
G1: Loyal customers
of Airline 1 (A1)
Service level = 1, the
maximum Service level = s2 < 1
G2: Loyal customers
of Airline 2 (A2) Service level = s1 < 1
Service level = 1, the
maximum
As in Scenario 1, we assume that there are two segments of customers within each group,
namely, economy class (E-class) and high class (H-class). As si, i = 1,2, increases from 0 to 1,
the utilities obtained by H- and E-Cclass customers of group 1 respectively, are specified exactly
as before, for the whole two-sector journey:
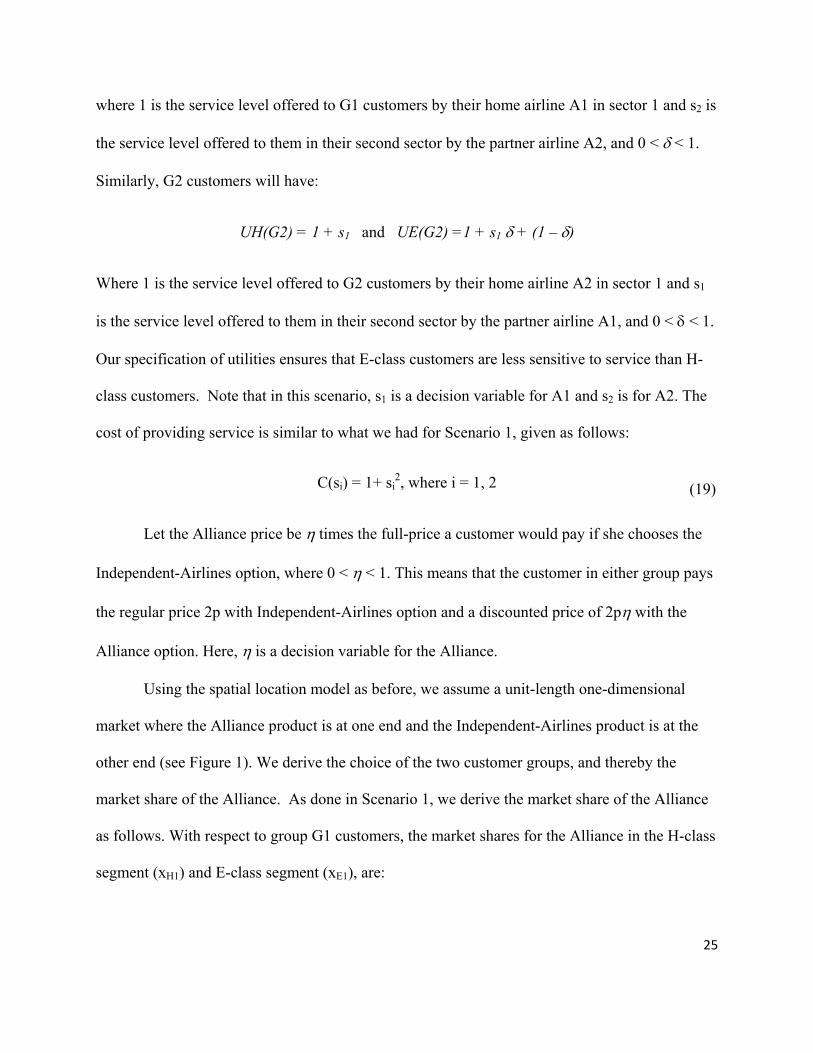
UH(G1) = 1 + s2 and UE(G1) = 1 + s2 + (1 – )
25
where 1 is the service level offered to G1 customers by their home airline A1 in sector 1 and s2 is
the service level offered to them in their second sector by the partner airline A2, and 0 < < 1.
Similarly, G2 customers will have:
UH(G2) = 1 + s1 and UE(G2) =1 + s1 + (1 – )
Where 1 is the service level offered to G2 customers by their home airline A2 in sector 1 and s1
is the service level offered to them in their second sector by the partner airline A1, and 0 < < 1.
Our specification of utilities ensures that E-class customers are less sensitive to service than H-
class customers. Note that in this scenario, s1 is a decision variable for A1 and s2 is for A2. The
cost of providing service is similar to what we had for Scenario 1, given as follows:
C(si) = 1+ si2, where i = 1, 2 (19)
Let the Alliance price be times the full-price a customer would pay if she chooses the
Independent-Airlines option, where 0 < < 1. This means that the customer in either group pays
the regular price 2p with Independent-Airlines option and a discounted price of 2p with the
Alliance option. Here, is a decision variable for the Alliance.
Using the spatial location model as before, we assume a unit-length one-dimensional
market where the Alliance product is at one end and the Independent-Airlines product is at the
other end (see Figure 1). We derive the choice of the two customer groups, and thereby the
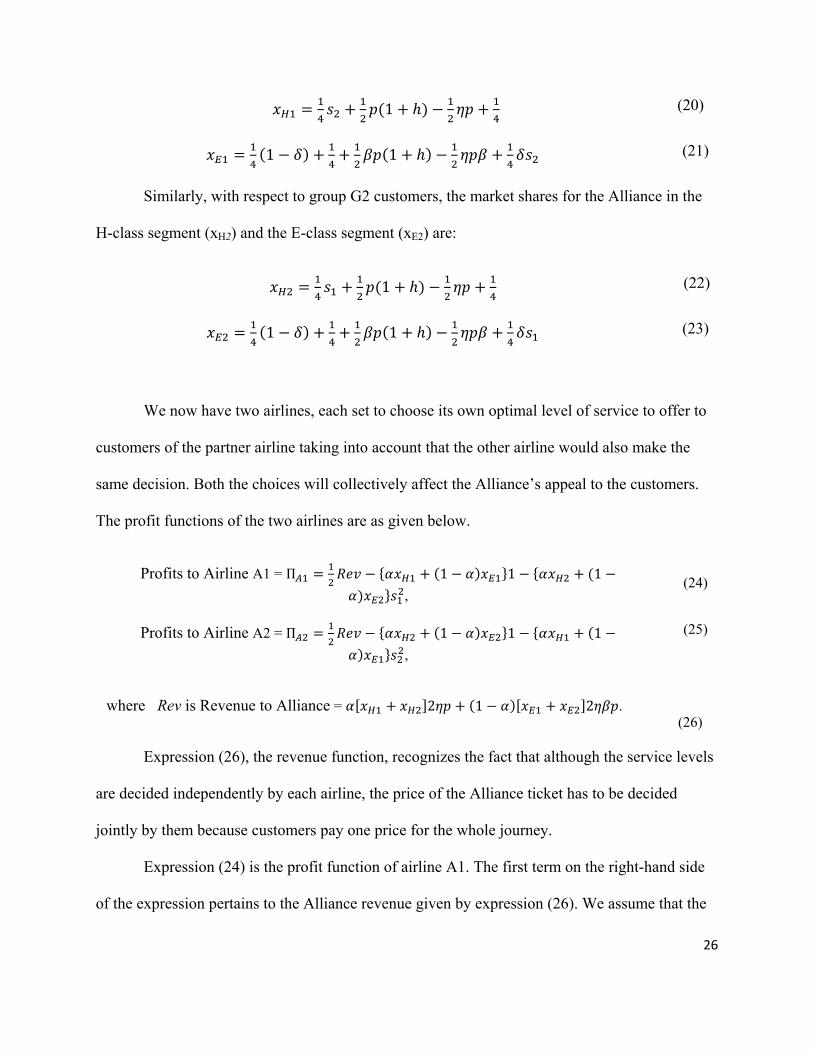
market share of the Alliance. As done in Scenario 1, we derive the market share of the Alliance
as follows. With respect to group G1 customers, the market shares for the Alliance in the H-class
segment (xH1) and E-class segment (xE1), are:
26
1 (20)
1 1 (21)
Similarly, with respect to group G2 customers, the market shares for the Alliance in the
H-class segment (xH2) and the E-class segment (xE2) are:
1 (22)
1 1 (23)
We now have two airlines, each set to choose its own optimal level of service to offer to
customers of the partner airline taking into account that the other airline would also make the
same decision. Both the choices will collectively affect the Alliance’s appeal to the customers.
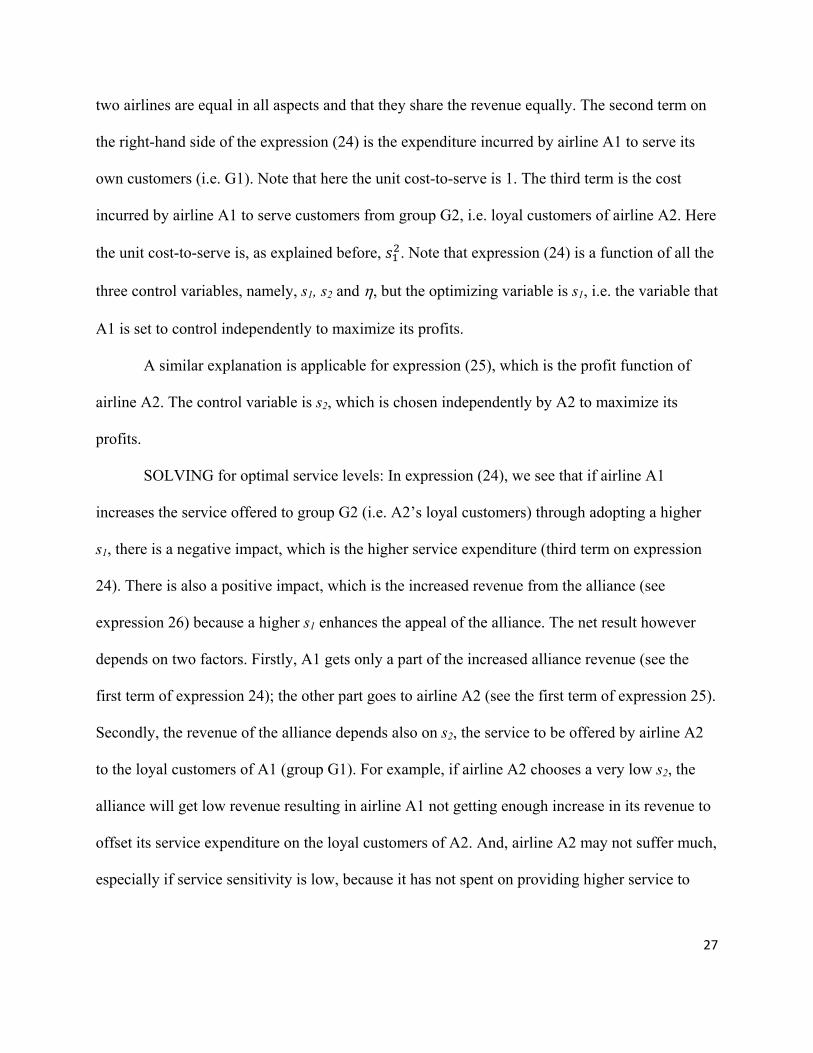
The profit functions of the two airlines are as given below.
Profits to Airline A1 = Π 1 1 1
,
(24)
Profits to Airline A2 = Π 1 1 1
,
(25)
where Rev is Revenue to Alliance = 2 1 2 .
(26)
Expression (26), the revenue function, recognizes the fact that although the service levels
are decided independently by each airline, the price of the Alliance ticket has to be decided
jointly by them because customers pay one price for the whole journey.
Expression (24) is the profit function of airline A1. The first term on the right-hand side
of the expression pertains to the Alliance revenue given by expression (26). We assume that the
27
two airlines are equal in all aspects and that they share the revenue equally. The second term on
the right-hand side of the expression (24) is the expenditure incurred by airline A1 to serve its
own customers (i.e. G1). Note that here the unit cost-to-serve is 1. The third term is the cost
incurred by airline A1 to serve customers from group G2, i.e. loyal customers of airline A2. Here
the unit cost-to-serve is, as explained before, . Note that expression (24) is a function of all the
three control variables, namely, s1, s2 and , but the optimizing variable is s1, i.e. the variable that
A1 is set to control independently to maximize its profits.
A similar explanation is applicable for expression (25), which is the profit function of
airline A2. The control variable is s2, which is chosen independently by A2 to maximize its
profits.
SOLVING for optimal service levels: In expression (24), we see that if airline A1
increases the service offered to group G2 (i.e. A2’s loyal customers) through adopting a higher
s1, there is a negative impact, which is the higher service expenditure (third term on expression
24). There is also a positive impact, which is the increased revenue from the alliance (see
expression 26) because a higher s1 enhances the appeal of the alliance. The net result however
depends on two factors. Firstly, A1 gets only a part of the increased alliance revenue (see the
first term of expression 24); the other part goes to airline A2 (see the first term of expression 25).
Secondly, the revenue of the alliance depends also on s2, the service to be offered by airline A2
to the loyal customers of A1 (group G1). For example, if airline A2 chooses a very low s2, the
alliance will get low revenue resulting in airline A1 not getting enough increase in its revenue to
offset its service expenditure on the loyal customers of A2. And, airline A2 may not suffer much,
especially if service sensitivity is low, because it has not spent on providing higher service to
28
loyal customers of A1. Hence, there is an incentive for A2 to offer a lower service level if it
knows that A1 offers a higher service level.
Thus, when choosing a particular s1, airline A1 would like to know what s2 the airline A2
will choose to serve customers of A1. For every value of s2, there will be a unique optimal s1
chosen by A1. In other words, the optimal response of A1 will be a reaction function that finds
the optimal s1 for every value of s2. Similarly it is easy to see that for every value of s1, there will
be a unique optimal s2 chosen by A2, giving us the optimal s2 as a function of s1. The intersection
point of the two reaction functions is the Nash equilibrium point that would characterize the
stable optimal pair. We arrive at the intersection point of the two reaction functions through
jointly maximizing the profit functions, expression (24) and expression (25), with respect to s1
and s2 respectively. Let us call the pair of optimal service levels obtained as {s1*, s2*}.
Note that so far we have discussed deriving optimal service levels assuming some
arbitrary value for the price parameter, . We can use the optimal pair {s1*, s2*} in expression
(26) and derive the corresponding optimal price parameter by maximizing expression (26) with
respect to . Call it *, which is a function {s1*, s2*}. Inserting this * back in expressions (24)
and (26) we can derive the next updated optimal pair for the service levels, and so on, iteratively.
We simplify this iterative procedure through jointly maximizing the three expressions (24), (25)
and (26) with respect to s1, s2 and , respectively to get the optimal set {s1**, s2**, **}.
OPTIMAL Service Levels and Optimal Price: We are interested in demonstrating the
existence of the equilibrium service levels. First, we assume that miles-based discount is zero
and choose five sample cases to evaluate jointly the optimal service levels and optimal price i.e.
{s1**, s2**, **} as explained in the previous section. The results are produced in Table 6.
Insert Table 6 about here
29
The optimal service level is less than 1 in all the five cases. Because of symmetry, both
the airlines offer the same service level. For example, in Case 1, where p = 4, = .20, = .30,
= .50, Scenario 2 would result in optimal service level, s1**= s2** = .1928, and the
corresponding optimal discount of** = .7529. We tested with several other sets of parameter
values and found optimal s to be less than 1.
Next, we relaxed the assumption of zero miles-based discount and analyzed the impact on
the optimal service level. The results are provided in Figure 3. The findings are very similar to
what we found in Scenario 1 (see Figure 2): The airlines offer higher optimal service level when
they offer a higher miles-based discount to the alliance customers.
Insert figure 3 about here
The rationale is as follows. Rewards attached to miles-based discount incur no cash
outlay for the airlines in the alliance. The airlines can intelligently use their spare capacity to pay
off the reward when the miles are redeemed. But the reward does influence customer choice. By
increasing the amount of reward, the airlines can enhance the value proposition to their
customers, thereby improving the market share of the alliance leading to higher profits for the
airlines. In turn, the airlines use the increased profits to offer a higher service level to the loyal
customers of the partner airlines. However, it is to be noted that the airlines need to coordinate
with respect to using their respective spare capacities to honor those loyalty rewards.
Discussion of Results
We showed analytically that when an airline in an alliance offers full service to its own
loyal customers, it would offer less-than-full service to the loyal customers of its partner airline.
The resulting customer dissatisfaction has been voiced on the web by many global travelers.
Table 2 (in the Web Appendix) presents a sample of the complaints.

30
We considered two scenarios in our analysis. In Scenario 1 (i.e. Section 2.1), we let the
Alliance decide an optimal service level to be provided by each member airline when serving
loyal customers of the partner airline. And in Scenario 2 (i.e. Section 2.2), we let each member
airline choose individually the service level for loyal customers of partner airlines. In both the
Scenarios, we show that a member airline would offer less-than-full service to loyal customers of
partner airline in equilibrium, implying that the observed service variation is an alliance-wide
issue that cannot be solved by the airlines individually. Therefore, alliances have to consider this
system-wide issue seriously and address it. In both the scenarios, miles-based discount increases
both the service level and the profits for the member airlines (see Figures 2 and 3).
Miles-based discount allows airlines to use their spare carrier capacity to provide rewards
to frequent travelers. This in turn enhances the attractiveness of the Alliance option for
customers resulting in higher profitability for the airlines leading to higher service level in
equilibrium. Higher service level would likely be translated into higher customer satisfaction for
the airlines as well as for the alliance. Although the advantage of loyalty reward is well known at
an individual airline level, our finding that it is useful for the alliance as well makes it all the
more important. This could be an important advantage accruing to an airline in joining an
alliance, but the issue needs further research.
Comparing the two scenarios, we find that profits for the airlines are lower in Scenario 2
because the intra-alliance competition between the two member airlines results in a lower service
level. We confirmed the findings through extensive numerical analyses. Although both the
airlines would benefit if they adopt a higher level of service (i.e. equal to that in Scenario 1),
neither would offer this higher level of service because the airline offering higher service would
be worse off if the other airline continues offering a comparatively lower level of service. Note
31
that a higher service level is meant for the customers of partner airlines and hence the airlines
would hesitate to offer that level unless they are certain that the partner airline would reciprocate
equally. Therefore, unless the Alliance steps in and specifies the required service level, the
perverse equilibrium of lower level of service would persist.
To demonstrate the higher benefit accruing in Scenario 1 compared to that in Scenario 2,
we present numerical analyses using graphical presentation. Let us use (i.e. fraction of aircraft
capacity comprising H-class seats) = .20, = .3 and p (i.e. H-class fare) = 4. We evaluate the
optimal service level, optimal discount and corresponding profit for each airline for various
values of (i.e. the service sensitivity of E-class customers) from .05 to .95 in steps of .05. We
assume .30 for . The results are given in Figure 4 in the Web Appendix. We observe that
regardless of the value of : (a) the optimal service level is always higher in Scenario 1 than in
Scenario 2, and (b) the profit to each airline is higher in Scenario 1 than in Scenario 2. One
important implication of this finding is that partner airlines can improve customer service (and
thus satisfaction) and profitability if the governing board of the alliance sets up and ensures
uniform service standard across the member airlines. For this to happen, the alliance as an
organization requires formal authority to set up and enforce service standards.
ADDRESSING CUSTOMER SERVICE VARIATION ACROSS ALLIANCE MEMBERS:
SUGGESTIONS
Our analytical model shows that when airlines use their existing fixed assets to serve
additional number of loyal customers of their partner airlines, the increased running cost of
services result in the airlines offering lower level of services to the customers of their partner
32
airlines as compared to their own loyal customers. This leads to complaints about poor services
rendered by partner airlines. The results from our analysis clearly show that the observed service
lapse is an inherent characteristic of an alliance.
What can airlines do to address the situation? Our analysis suggests the following:
Suggestion 1: More Control to Alliance
Given that Scenario 1, where the Alliance decides on the optimal service to be offered by
each airline to customers of its alliance partner, yields higher service level to customers and
higher profits to airlines as well, we suggest that the Alliance, instead of the member airlines,
should prescribe and monitor minimum service level to be maintained by the member airlines
when the airlines extend their services to loyal customers of partner airlines. They should also
clearly communicate this to the customers. Letting the member airlines decide on the optimum
service level reduces both the service level for customers and profits for the airlines. Ensuring
such a service strategy, however, requires more authority to be entrusted with the Alliance, with
an increase in incidental and monitoring costs.
An Alliance can also device an incentive scheme for the member airlines to improve their
service level, i.e. service meant for the loyal customers of the partner airlines. For this to happen,
the Alliance, as an organization, should be able to investigate the current practice of each airline
setting its service level for the customers of partner airlines, measure the various parameters we
have introduced in our model, evaluate how far the airlines can improve if the Alliance chooses a
specific service level, and then decide what type of incentives would drive the airlines to
improve their current service level.
Suggestion 2: Intelligent use of Spare Capacity and Larger Loyalty Rewards
33
Our analysis clearly shows that if airlines deploy their unused carrier capacity to honor
loyalty rewards, they could offer a higher service level to loyal customers of partner airlines,
leading to higher customer satisfaction. The Alliance should find ways to improve the loyalty
reward program and spare capacity usage. As a corollary, we suggest that alliances should
explore ways to cross-use the spare capacity in their respective member airlines, i.e. letting loyal
customers from one airline use the spare capacity in another airline within a given alliance.
However, this needs more involvement by the Alliance. Along with Suggestion 1, this implies
that the Alliance taking control of the relevant services seems to be prudent. An in-depth analysis
of this option may be a direction for future research.
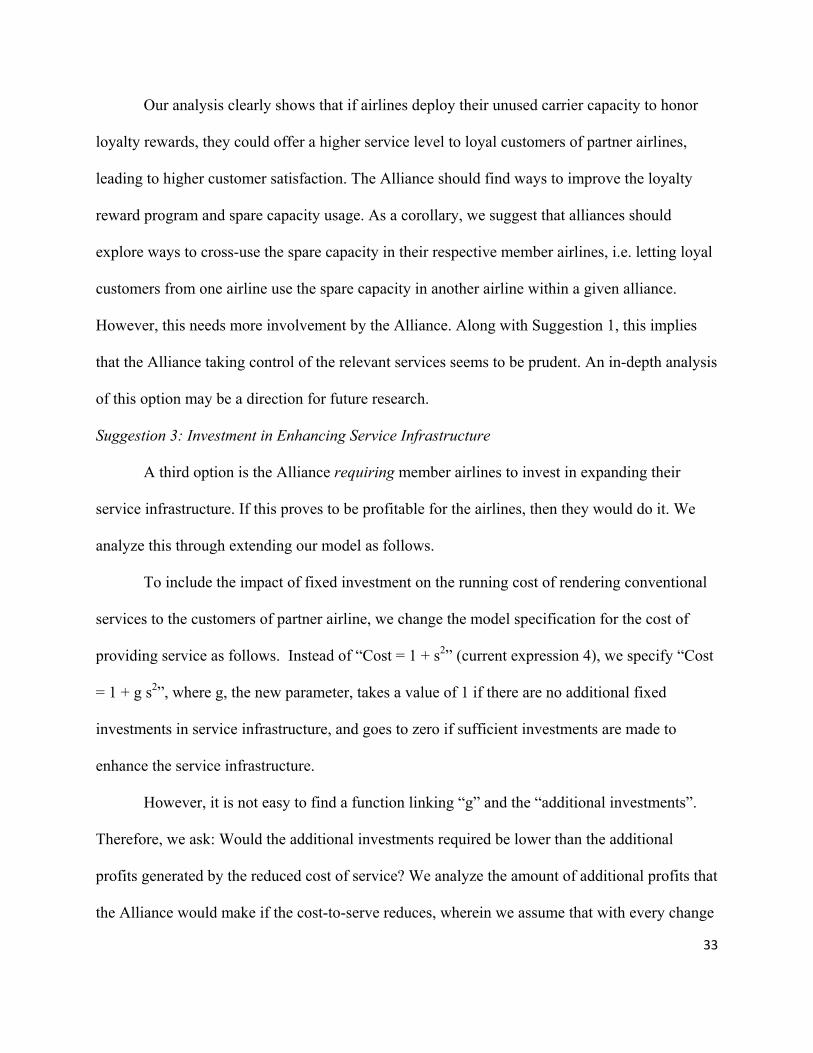
Suggestion 3: Investment in Enhancing Service Infrastructure
A third option is the Alliance requiring member airlines to invest in expanding their
service infrastructure. If this proves to be profitable for the airlines, then they would do it. We
analyze this through extending our model as follows.
To include the impact of fixed investment on the running cost of rendering conventional
services to the customers of partner airline, we change the model specification for the cost of
providing service as follows. Instead of “Cost = 1 + s2” (current expression 4), we specify “Cost
= 1 + g s2”, where g, the new parameter, takes a value of 1 if there are no additional fixed
investments in service infrastructure, and goes to zero if sufficient investments are made to
enhance the service infrastructure.
However, it is not easy to find a function linking “g” and the “additional investments”.
Therefore, we ask: Would the additional investments required be lower than the additional
profits generated by the reduced cost of service? We analyze the amount of additional profits that
the Alliance would make if the cost-to-serve reduces, wherein we assume that with every change
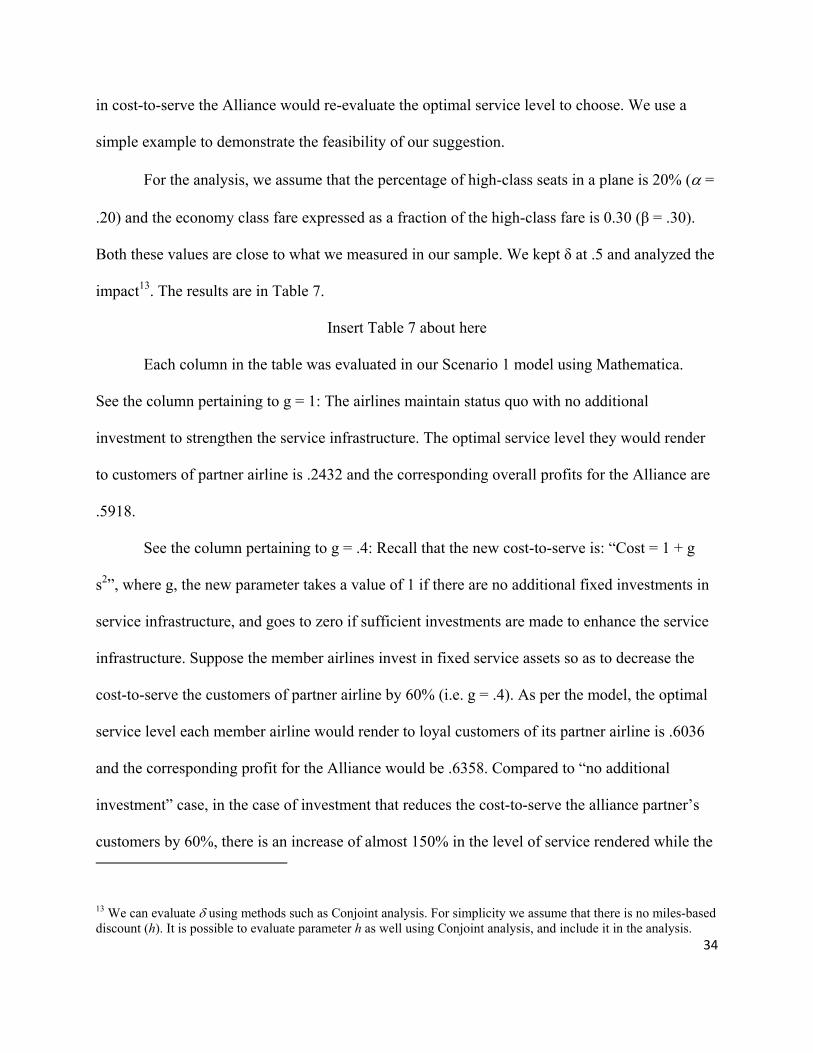
34
in cost-to-serve the Alliance would re-evaluate the optimal service level to choose. We use a
simple example to demonstrate the feasibility of our suggestion.
For the analysis, we assume that the percentage of high-class seats in a plane is 20% ( =
.20) and the economy class fare expressed as a fraction of the high-class fare is 0.30 (β = .30).
Both these values are close to what we measured in our sample. We kept δ at .5 and analyzed the
impact13. The results are in Table 7.
Insert Table 7 about here
Each column in the table was evaluated in our Scenario 1 model using Mathematica.
See the column pertaining to g = 1: The airlines maintain status quo with no additional
investment to strengthen the service infrastructure. The optimal service level they would render
to customers of partner airline is .2432 and the corresponding overall profits for the Alliance are
.5918.
See the column pertaining to g = .4: Recall that the new cost-to-serve is: “Cost = 1 + g
s2”, where g, the new parameter takes a value of 1 if there are no additional fixed investments in
service infrastructure, and goes to zero if sufficient investments are made to enhance the service
infrastructure. Suppose the member airlines invest in fixed service assets so as to decrease the
cost-to-serve the customers of partner airline by 60% (i.e. g = .4). As per the model, the optimal
service level each member airline would render to loyal customers of its partner airline is .6036
and the corresponding profit for the Alliance would be .6358. Compared to “no additional
investment” case, in the case of investment that reduces the cost-to-serve the alliance partner’s
customers by 60%, there is an increase of almost 150% in the level of service rendered while the
13 We can evaluate using methods such as Conjoint analysis. For simplicity we assume that there is no miles-based discount (h). It is possible to evaluate parameter h as well using Conjoint analysis, and include it in the analysis.
35
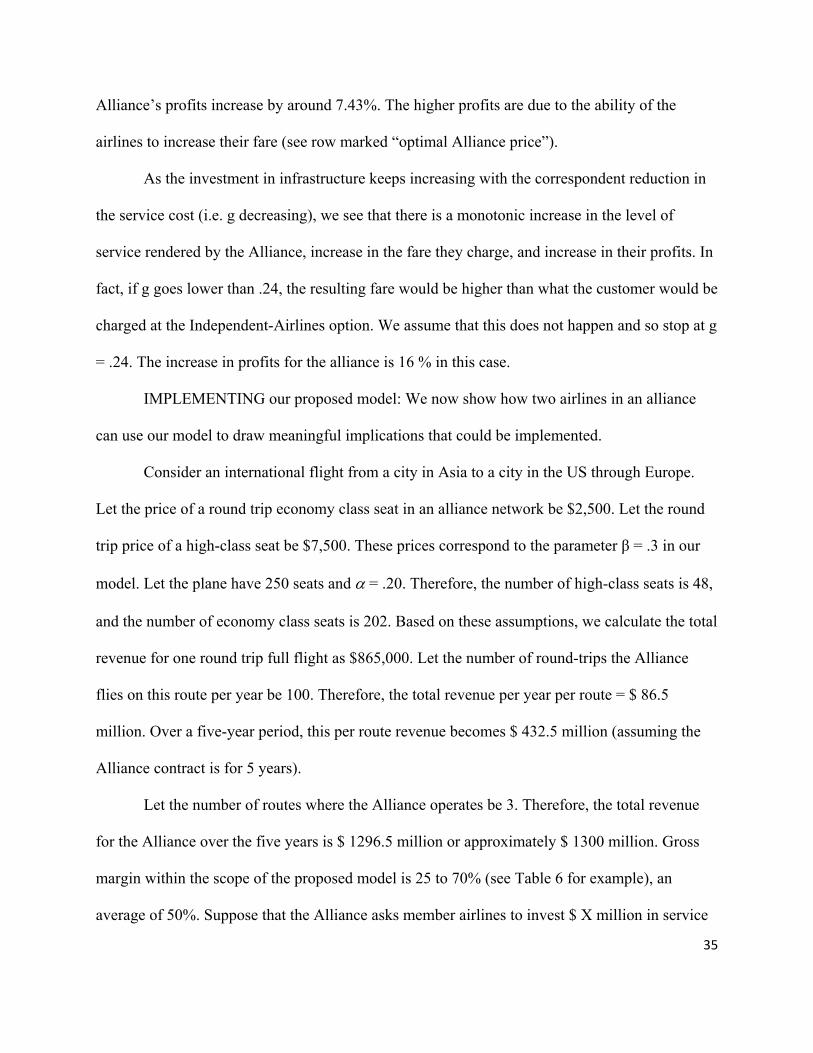
Alliance’s profits increase by around 7.43%. The higher profits are due to the ability of the
airlines to increase their fare (see row marked “optimal Alliance price”).
As the investment in infrastructure keeps increasing with the correspondent reduction in
the service cost (i.e. g decreasing), we see that there is a monotonic increase in the level of
service rendered by the Alliance, increase in the fare they charge, and increase in their profits. In
fact, if g goes lower than .24, the resulting fare would be higher than what the customer would be
charged at the Independent-Airlines option. We assume that this does not happen and so stop at g
= .24. The increase in profits for the alliance is 16 % in this case.
IMPLEMENTING our proposed model: We now show how two airlines in an alliance
can use our model to draw meaningful implications that could be implemented.
Consider an international flight from a city in Asia to a city in the US through Europe.
Let the price of a round trip economy class seat in an alliance network be $2,500. Let the round
trip price of a high-class seat be $7,500. These prices correspond to the parameter β = .3 in our
model. Let the plane have 250 seats and = .20. Therefore, the number of high-class seats is 48,
and the number of economy class seats is 202. Based on these assumptions, we calculate the total
revenue for one round trip full flight as $865,000. Let the number of round-trips the Alliance
flies on this route per year be 100. Therefore, the total revenue per year per route = $ 86.5
million. Over a five-year period, this per route revenue becomes $ 432.5 million (assuming the
Alliance contract is for 5 years).
Let the number of routes where the Alliance operates be 3. Therefore, the total revenue
for the Alliance over the five years is $ 1296.5 million or approximately $ 1300 million. Gross
margin within the scope of the proposed model is 25 to 70% (see Table 6 for example), an
average of 50%. Suppose that the Alliance asks member airlines to invest $ X million in service

36
infrastructure to cater to the increased demand on conventional services. Following Table 7 (see
the last column, last row), we see that the profits for the Alliance would increase by 16 %. Thus
the increase in cash flow for the Alliance from investment is ($1300 * .5 * .16 =) $ 104 million.
Now, it is up to the Alliance and the allied airlines to find if the investment in service
infrastructure by all of them could be contained within $ 104 million.
Suggestion 4: Customer Education about Non-Uniform Service across Partner Airlines
Our results show that service inconsistency would remain a feature of an alliance
although the level of service and the profitability can be managed through various methods (see
suggestions 3.1 to 3.3 earlier). Therefore, to reduce customer dissatisfaction from inconsistent
service encountered during their travel through the alliance network, in addition to the steps
outlined earlier, airlines can educate their customers so as to manage expectations with respect to
the service at the home and partner airlines. Once customers form right expectations, their level
of satisfaction is likely to increase with the same set of issues.
On a similar note concerning customer expectation regarding airline services, we recall a
recent incident that happened with United Airlines on April 9, 2017, when a passenger was
forcefully removed from the flight after boarding because the airline had overbooked. Initially,
the airline offered some compensation and there were no takers. Then they played a lottery and
picked a person through the lottery, but he refused to leave. Quoting their rules, the airline used
force to remove the person from his seat. That eviction resulted in bruises and visible wounds on
the person. The other passengers were simply shocked. They took a video of the event and
shared on social media. The incident went viral instantly.
Many passengers are aware that airlines handle overbooking through offering free flight
or cash in return for customers relinquishing their seats. However, they are not aware that they
37
can be forcefully evicted if they don’t take those offers. Clearly, the airlines have not
communicated this possibility appropriately to customers. The communication failure of what to
expect from the airlines resulted in a big shock that spread far and wide, and brought out the
issue of overbooking to the fore with such intensely that the US Congress stepped in and voiced
its concern over the deteriorating service quality of the airlines, including the overbooking (The
Wall Street Journal, April 15-16, 2017).
Overbooking is an outcome of the ‘revenue management’ program used by airlines to
maximize their revenues. However, the way airlines are handling an overbooked flight has
apparently been inconsistent and not properly communicated to customers. After the
Congressional hearing, United Airlines and Delta promised to increase compensation to a
passenger relinquishing his/her seat to up to $ 10,000 while the Southwest Airlines promised to
do away with overbooking totally. Thus, one can see that properly managing the expectation of
customers on various service aspects is critical to ensure continued customer support.
We now summarize this paper and present directions for future research.
SUMMARY AND DIRECTIONS FOR FUTURE RESEARCH
In this paper, we explore the customer service aspect of global airline alliances.
Satisfactory experience of travelers is important in the evaluation of an alliance. And this
satisfaction is mainly driven by the services they receive across member airlines throughout their
journey. Therefore, it is reasonable to expect airlines to provide consistent service to alliance
customers as they travel through the member airlines. However, it is observed that loyalty
program members of one airline generally do not receive the same level of services at the partner
38
airlines within the same journey. We study this issue to explore the reasons for the practice and
discuss alternatives that can benefit both the alliance and the travelers.
Although service quality and airline alliance have been studied in-depth independently in
other contexts, the service quality aspect of airline alliances has surprisingly not received much
attention despite the importance of customer service in the airline business. The extant research
has identified this issue of variation in airline service quality primarily using survey data. Giving
an analytical structure to the problem, we develop a game theoretic framework to investigate this
issue. The analytical approach has enabled us to propose a few solutions to the problem.
First, we show that the service variation is a system-wide issue that cannot be handled by
individual airlines alone. Our analysis covers two opposite scenarios: (a) the alliance acts as one
unified body that regulates and monitors member airlines to optimize alliance profit to be shared
by member airlines; (b) each member airline in an alliance optimizes its own profit. The results
show that a lower level of service for loyal customers of partner airlines cannot be avoided in
either scenario implying that the service variation is inherent and system-wide in an alliance
network.
Second, we show that letting the Alliance (i.e. the alliance as a decision making body)
choose the optimal service level results in a level higher than what is achieved when the member
airlines are allowed to choose their respective optimal service level. Therefore, airlines can
achieve higher customer satisfaction and profits if the Alliance can regulate and monitor
performance of the member airlines.
Third, our analysis shows new insights into the impact of loyalty rewards. We find that
loyalty rewards enable airlines to utilize unused capacity to attract more customers for the
alliance resulting in higher level of service and therefore customer satisfaction at partner airlines.
39
This link between loyalty program and customer satisfaction has not been explored in the extant
literature. We suggest that alliances should find ways to improve the loyalty reward programs so
that member airlines can cross-use the spare capacity of all the carriers in an alliance for the
benefit of the alliance’s customers.
Fourth, our analysis suggests that the member airlines can invest in fixed service
infrastructure to improve services for the loyal customers of their partner airlines. Both customer
satisfaction and profitability of the alliance can be increased if airlines can make suitable
investment in service infrastructure. We also present a simple framework that utilizes our model
and the findings to enable managers evaluate if any proposed investment would be profitable.
Finally, managing customer expectations is important for their satisfaction. Since non-
uniformity of service experienced by customers travelling through an alliance network is
inherent in the alliance structure, educating customers about this issue and managing their
expectations would help reduce their dissatisfaction with the service inconsistency.
Although our findings explain observed service inconsistency and suggest ways for
airlines to improve customer service and airline profitability, much more can be done to take this
inquiry forward. One is to recognize that there are different types of alliances (limited
cooperation on specific routes, code sharing, joint venture, merger-like integration) and each
type has a different level of engagement between the member airlines and the corresponding
degree of service support. It would be useful to study how each type influences the level of
uniformity in service that a traveler experiences across member airlines when she travels as an
alliance customer. A second research issue concerns how an alliance can bring about uniformity
in customer service despite the asymmetry between allied airlines in their size and scope. Third,
loyalty reward programs that use the spare capacity of all member airlines to reward a loyalty

40
program member of any member airline is a fertile area for further analysis. Fourth, research is
needed to analyze how the heterogeneity among passengers in terms of their service usage
impacts service quality at partner airlines. Fifth, in each class of travel, some customers are likely
to be travelling more often than the rest resulting in two sub-segments, namely, heavy users and
light users. What implications does this have for airlines with respect to their service and pricing
decisions needs research. Sixth, it will be interesting to analyze if a new airline joining an
alliance could use its membership combined with service commitment as a competitive
advantage. Seventh, with heterogeneity among airlines, it might be interesting to study how the
choice of home airline by strategic customers impacts the alliance service and profitability.
Finally, the issue of managing customer expectations through customer education and its
subsequent effect on satisfaction needs investigation.
41
REFERENCES
Bamberger, Gustavo E, Dennis W. Carlton, and Lynette R. Neumann (2004), “An
Empirical Investigation of the Competitive Effects of Domestic Airline Alliances,” Journal of
Law and Economics, 47, 195-222.
Bolton, Ruth N. (1998), “A Dynamic Model of the Duration of the Customer's
Relationship with a Continuous Service Provider: The Role of Satisfaction,” Marketing Science,
17, 45-65.
Bourdeau, Brian L., J. Joseph Cronin Jr. and Clay M. Vorhees (2007), “Modeling Service
Alliances: An Exploratory Investigation of Spillover Effects in Service Partnerships,” Strategic
Management Journal, 28, 609-622.
Brueckner, Jan K. (2001), “The economics of international codesharing: an analysis of
airline alliances,” International Journal of Industrial Organization, 19, 1475-1498
Brueckner, Jan K. (2003), “International Airfares in the Age of Alliances: The Effects of
Codesharing and Antitrust Immunity,” The Review of Economics and Statistics, 85, 105-118.
Brueckner, J., Darin Lee and Ethan Singer (2010), “Revisiting alliances, codesharing,
antitrust Immunity and international airfares: Findings from a new economic study,” IATA
report, www.iata.org/eocnomics
Brueckner, Jan K and Tom W. Whalen (2000), “The Price Effects of International Airline
Alliances,” Journal of Law and Economics, 43, 503-546.
Dowling, Grahame R. and Mark Uncles (1997), “Do customer loyalty programs really
work?” Sloan Management Review, 38, 71-82.
Hotelling, Harold (1929), “Stability in Competition,” Economic Journal, 39 (153): 41–57.
42
Pearce, Brian and Gary Doernhoefer (2011), IATA Economics Briefing: The Economic Benefits
Generated by Alliances and Joint Ventures, IATA, 28th November.
Reichheld, Frederick F. and Thomas Teal (1996), “The Loyalty Effect: The Hidden Force
Behind Growth, Profits, and Lasting Value,” Harvard Business School Press, Boston.
Singh, Siddharth S., Dipak C. Jain and Trichy V. Krishnan (2008), “Research Note:
Customer Loyalty Programs: Are They Profitable?” Management Science, 54, 1205-1211.
Weber, Karin (2005), “Travelers’ Perceptions of Airline Alliance Benefits and
Performance,” Journal of Travel Research, 43: 257.
Weber, Karin and Beverly Sparks (2004), “Consumer attributions and behavioral
responses to service failures in strategic airline alliance settings,” Journal of Air Transport
Management, 10, 361–367.

43
TABLE 3: SOLUTION SUPPORT SPACE DEFINED BY {, , } FOR A FEW SAMPLE VALUES OF p14
Full Price of H-class seat (p)
Number of H-class Seats as Fraction of Total Seats ()
Fare of E-class Seat as Fraction of Fare of H-Class Seat ()
Service Sensitivity of E-class Customers ()
s** **
Lower limit Upper limit Lower limit
Upper limit Lower limit
Upper limit
4 .111111111 1 .204849 1 0 1 < 1 < 1 5 .0625 1 .148704 1 0 1 < 1 < 1 6 .04 1 .118473 1 0 1 < 1 < 1 7 .027778 1 .099326 1 0 1 < 1 < 1 8 .020408163 1 .086002 1 0 1 < 1 < 1 9 .015625 1 .076141 1 0 1 < 1 < 1 10 .012345679 1 .068518 1 0 1 < 1 < 1
As we can see, the feasible support range of (2nd and 3rd columns) contains the real world value of , which is about .20. Similarly, the feasible support range of (4th and 5th columns) contains the real world value of , which is about .30.
14 For example, if p = 10 then any element in the {} three-dimensional space defined by {(.01234, 1), (.068518, 1), (0, 1}) respectively will yield an s** in (0, 1) and a corresponding ** in (0, 1) range.
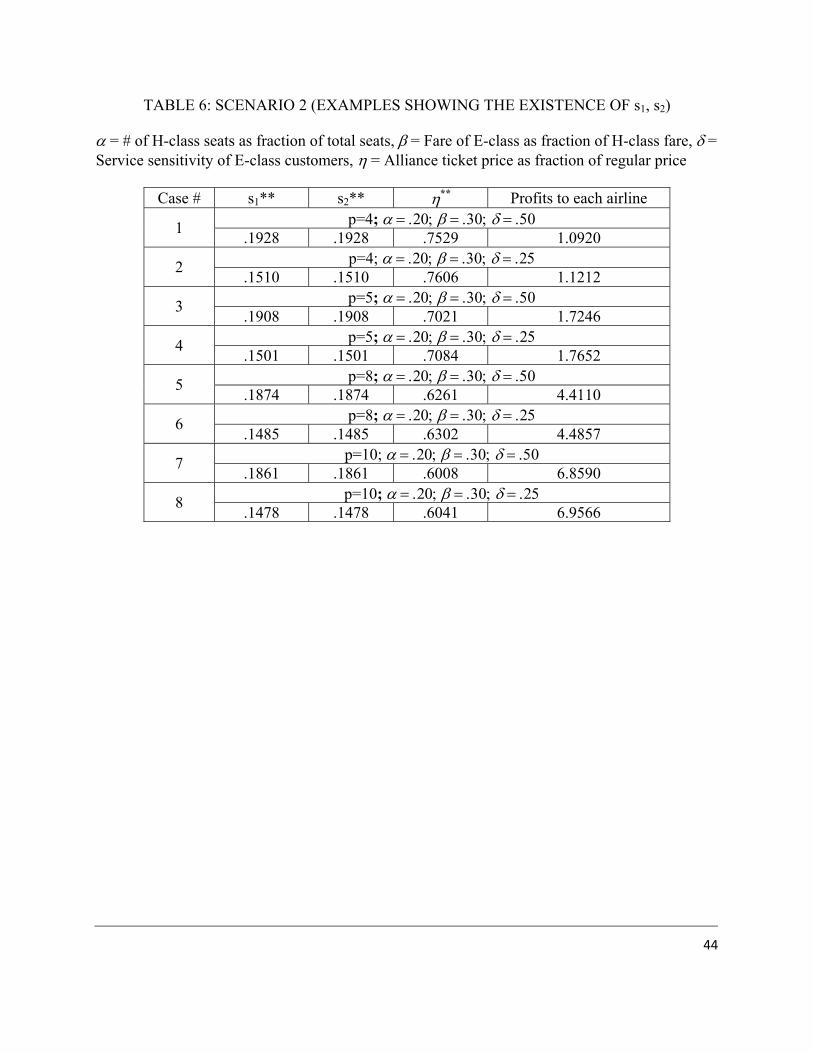
44
TABLE 6: SCENARIO 2 (EXAMPLES SHOWING THE EXISTENCE OF s1, s2)
= # of H-class seats as fraction of total seats, = Fare of E-class as fraction of H-class fare, = Service sensitivity of E-class customers, = Alliance ticket price as fraction of regular price
Case # s1** s2** ** Profits to each airline
1 p=4;
.1928 .1928 .7529 1.0920
2 p=4; .1510 .1510 .7606 1.1212
3 p=5;
.1908 .1908 .7021 1.7246
4 p=5;
.1501 .1501 .7084 1.7652
5 p=8; .1874 .1874 .6261 4.4110
6 p=8;
.1485 .1485 .6302 4.4857
7 p=10;
.1861 .1861 .6008 6.8590
8 p=10; .1478 .1478 .6041 6.9566
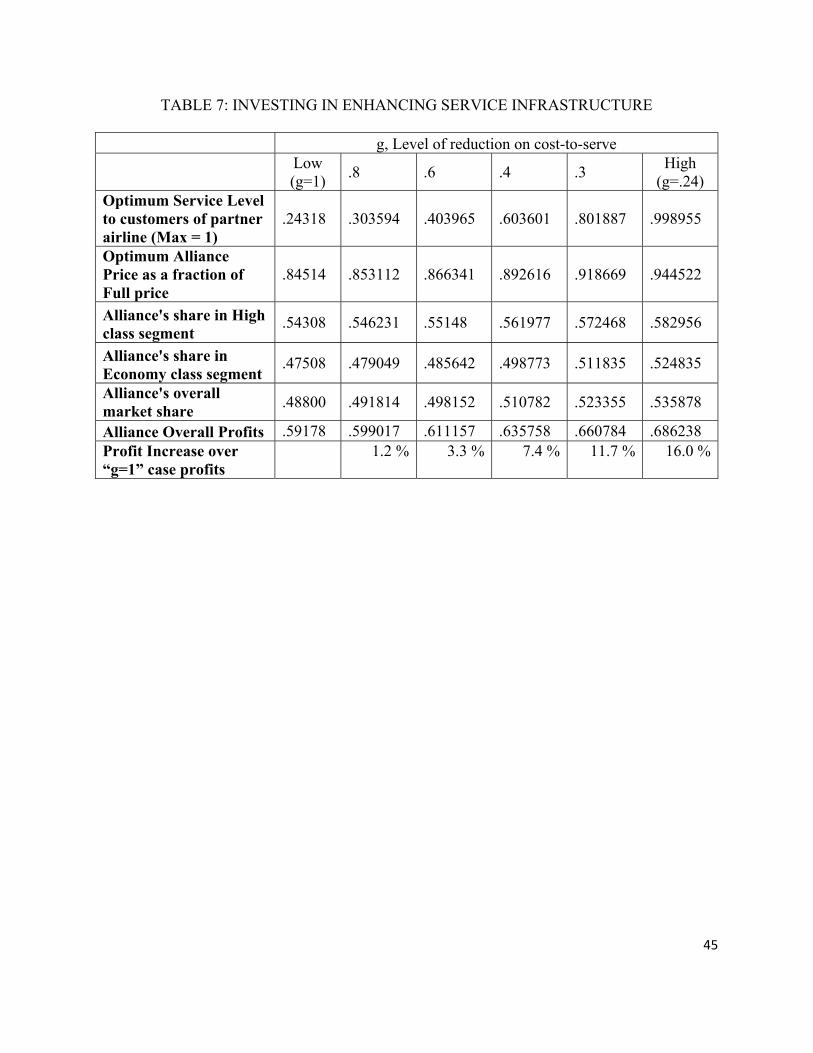
45
TABLE 7: INVESTING IN ENHANCING SERVICE INFRASTRUCTURE
g, Level of reduction on cost-to-serve
Low (g=1)
.8 .6 .4 .3 High
(g=.24) Optimum Service Level to customers of partner airline (Max = 1)
.24318 .303594 .403965 .603601 .801887 .998955
Optimum Alliance Price as a fraction of Full price
.84514 .853112 .866341 .892616 .918669 .944522
Alliance's share in High class segment
.54308 .546231 .55148 .561977 .572468 .582956
Alliance's share in Economy class segment
.47508 .479049 .485642 .498773 .511835 .524835
Alliance's overall market share
.48800 .491814 .498152 .510782 .523355 .535878
Alliance Overall Profits .59178 .599017 .611157 .635758 .660784 .686238 Profit Increase over “g=1” case profits
1.2 % 3.3 % 7.4 % 11.7 % 16.0 %

46
FIGURE 1: MODELING FRAMEWORK
Hotelling Model
Independent Airlines
Alliance
SCENARIO 1 Joint (Alliance) profit maximiza on. Common op mal price, Common op mal service level, s*
SCENARIO 2 Individual profit maximiza on by the two airlines Airline 1 decides s1* Airline 2 decides s2*
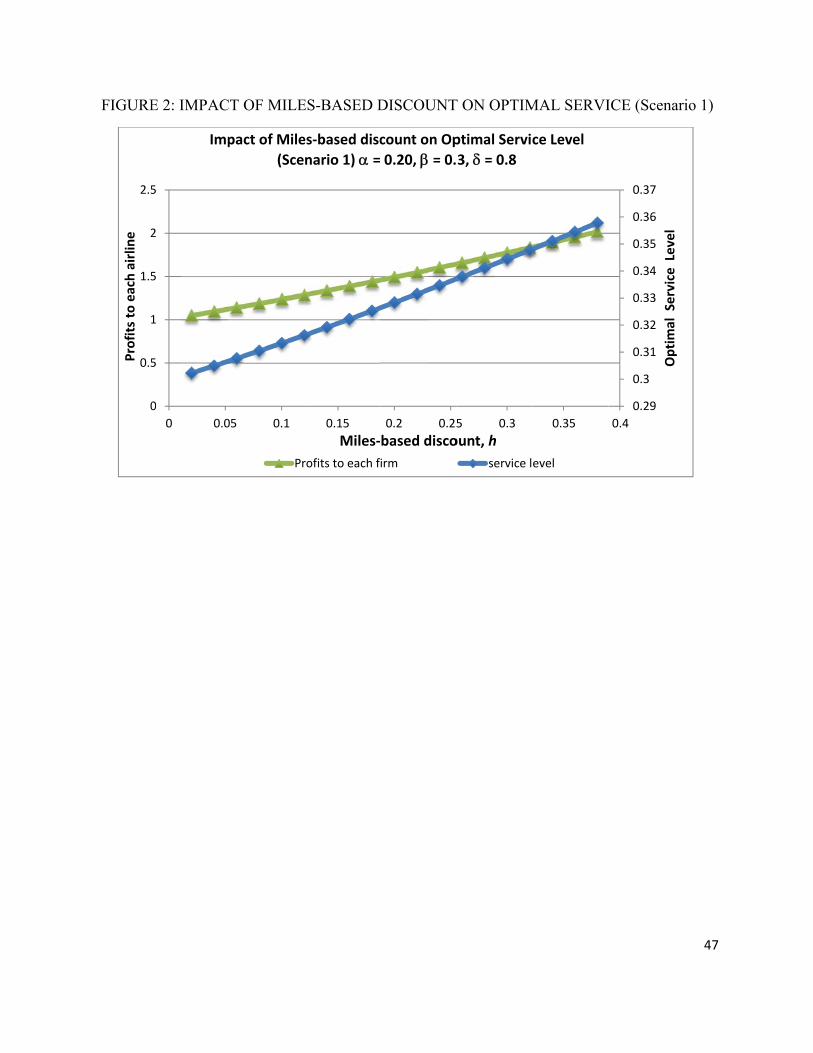
FIGURE
0
0.5
1
1.5
2
2.5
Profits to each airlin
e
E 2: IMPAC
0
5
1
5
2
5
0 0.0
Imp
CT OF MILE
05 0.1
pact of Mile
(Sce
Pr
ES-BASED D
0.15
Miles‐
es‐based disc
nario 1) =
rofits to each f
DISCOUNT
0.2 0.25
based disco
count on Op
0.20, = 0.
irm
T ON OPTIM
5 0.3
ount, h
ptimal Servic
3, = 0.8
service l
MAL SERVI
0.35
ce Level
evel
ICE (Scenari
0.29
0.3
0.31
0.32
0.33
0.34
0.35
0.36
0.37
0.4
Optimal Service Level
47
io 1)
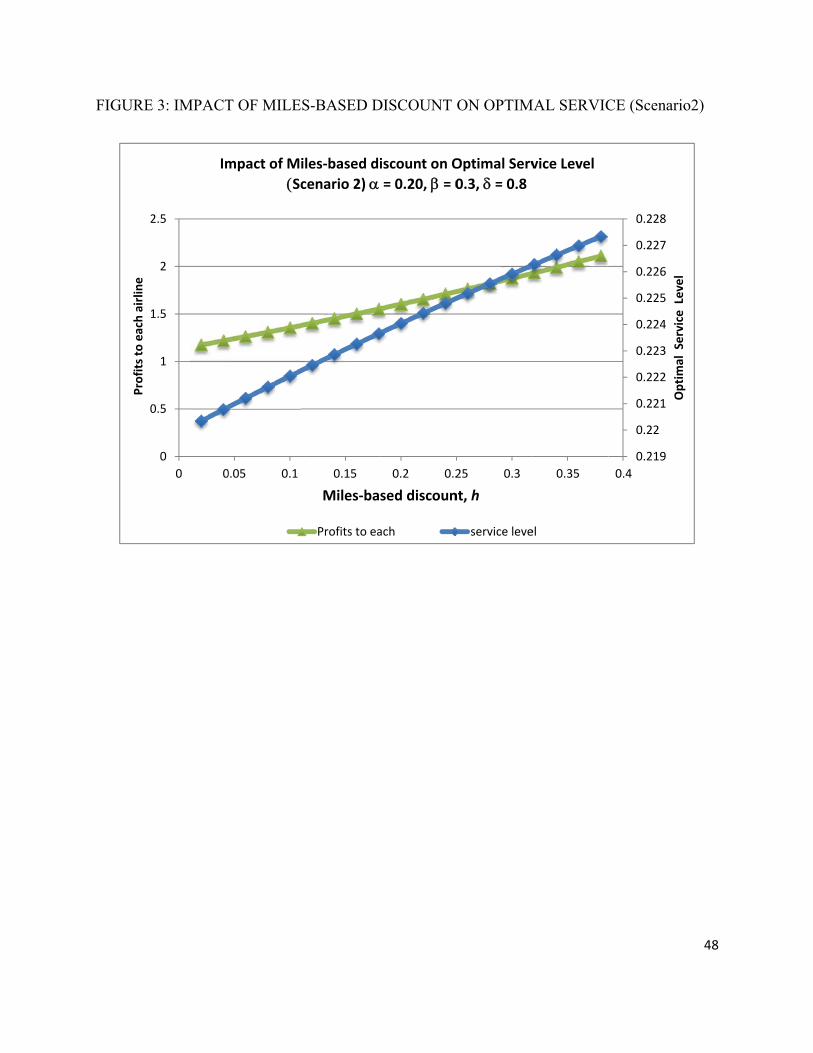
FIGURE
0
1
2
Profits to each airlin
e
E 3: IMPACT
0
0.5
1
1.5
2
2.5
0 0
Im
T OF MILES
0.05 0.1
mpact of Mi
Sc
S-BASED D
0.15
Miles‐ba
les‐based di
cenario 2)
Profits to ea
DISCOUNT
0.2 0.2
sed discoun
iscount on O
= 0.20, = 0
ach
ON OPTIM
25 0.3
nt, h
Optimal Serv
0.3, = 0.8
service leve
MAL SERVIC
0.35
vice Level
el
CE (Scenario
0.219
0.22
0.221
0.222
0.223
0.224
0.225
0.226
0.227
0.228
0.4
Optimal Service Level
48
o2)
p
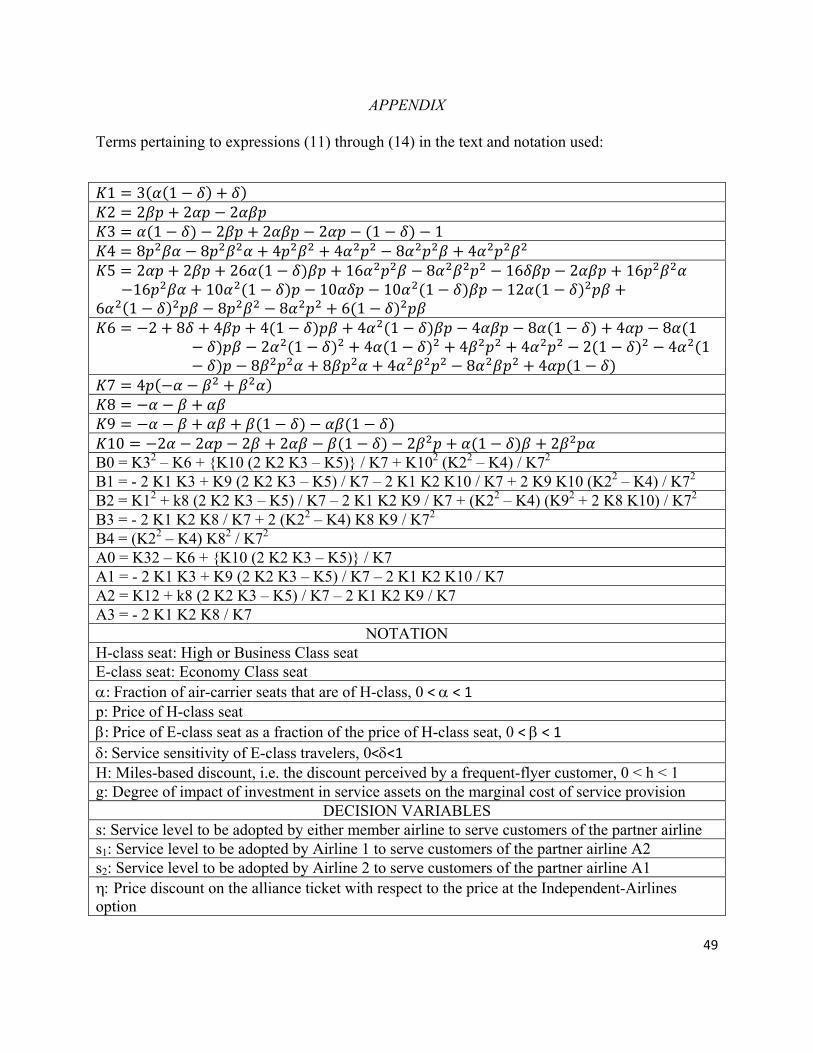
49
APPENDIX
Terms pertaining to expressions (11) through (14) in the text and notation used:
1 3 1 2 2 2 2 3 1 2 2 2 1 14 8 8 4 4 8 45 2 2 26 1 16 8 16 2 16
16 10 1 10 10 1 12 16 1 8 8 6 1 6 2 8 4 4 1 4 1 4 8 1 4 8 1
2 1 4 1 4 4 2 1 4 18 8 4 8 4 1
7 4 8 9 1 110 2 2 2 2 1 2 1 2
B0 = K32 – K6 + {K10 (2 K2 K3 – K5)} / K7 + K102 (K22 – K4) / K72 B1 = - 2 K1 K3 + K9 (2 K2 K3 – K5) / K7 – 2 K1 K2 K10 / K7 + 2 K9 K10 (K22 – K4) / K72 B2 = K12 + k8 (2 K2 K3 – K5) / K7 – 2 K1 K2 K9 / K7 + (K22 – K4) (K92 + 2 K8 K10) / K72 B3 = - 2 K1 K2 K8 / K7 + 2 (K22 – K4) K8 K9 / K72 B4 = (K22 – K4) K82 / K72 A0 = K32 – K6 + {K10 (2 K2 K3 – K5)} / K7 A1 = - 2 K1 K3 + K9 (2 K2 K3 – K5) / K7 – 2 K1 K2 K10 / K7 A2 = K12 + k8 (2 K2 K3 – K5) / K7 – 2 K1 K2 K9 / K7 A3 = - 2 K1 K2 K8 / K7
NOTATION H-class seat: High or Business Class seat E-class seat: Economy Class seat : Fraction of air-carrier seats that are of H-class, 0 < < 1 p: Price of H-class seat : Price of E-class seat as a fraction of the price of H-class seat, 0 < < 1 : Service sensitivity of E-class travelers, 0<<1 H: Miles-based discount, i.e. the discount perceived by a frequent-flyer customer, 0 < h < 1 g: Degree of impact of investment in service assets on the marginal cost of service provision
DECISION VARIABLES s: Service level to be adopted by either member airline to serve customers of the partner airline s1: Service level to be adopted by Airline 1 to serve customers of the partner airline A2 s2: Service level to be adopted by Airline 2 to serve customers of the partner airline A1 Price discount on the alliance ticket with respect to the price at the Independent-Airlines option
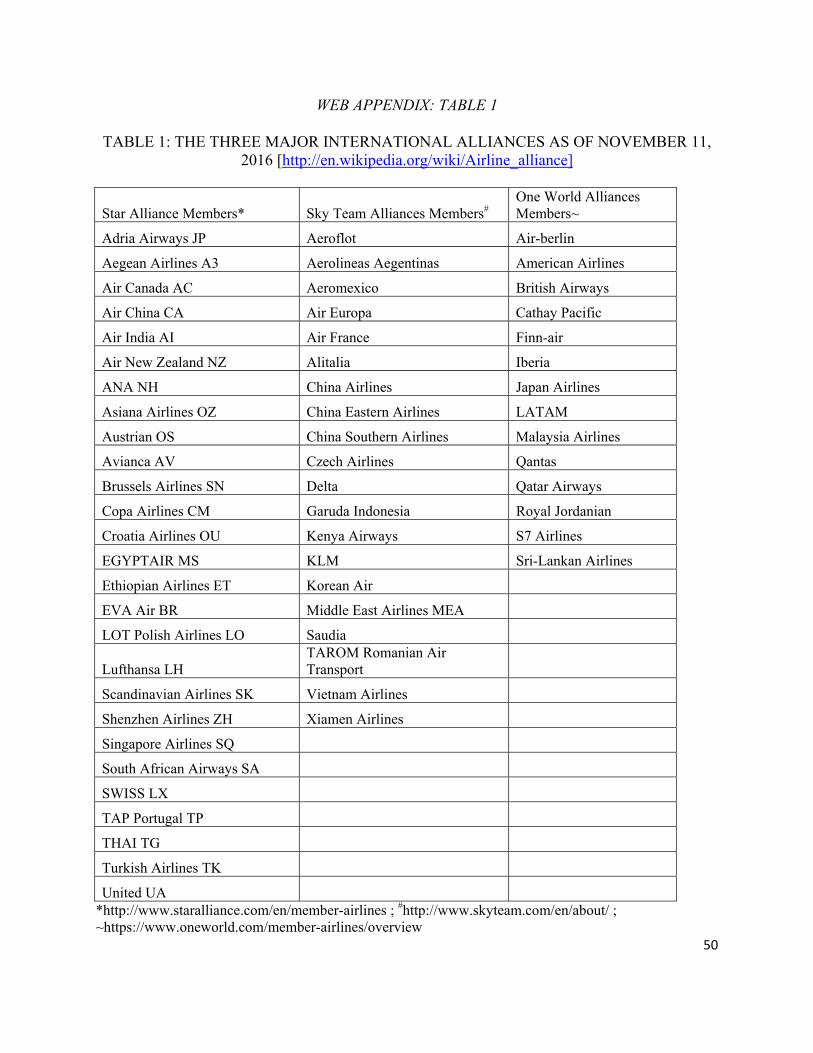
50
WEB APPENDIX: TABLE 1
TABLE 1: THE THREE MAJOR INTERNATIONAL ALLIANCES AS OF NOVEMBER 11, 2016 [http://en.wikipedia.org/wiki/Airline_alliance]
Star Alliance Members* Sky Team Alliances Members# One World Alliances Members~
Adria Airways JP Aeroflot Air-berlin
Aegean Airlines A3 Aerolineas Aegentinas American Airlines
Air Canada AC Aeromexico British Airways
Air China CA Air Europa Cathay Pacific
Air India AI Air France Finn-air
Air New Zealand NZ Alitalia Iberia
ANA NH China Airlines Japan Airlines
Asiana Airlines OZ China Eastern Airlines LATAM
Austrian OS China Southern Airlines Malaysia Airlines
Avianca AV Czech Airlines Qantas
Brussels Airlines SN Delta Qatar Airways
Copa Airlines CM Garuda Indonesia Royal Jordanian
Croatia Airlines OU Kenya Airways S7 Airlines
EGYPTAIR MS KLM Sri-Lankan Airlines
Ethiopian Airlines ET Korean Air
EVA Air BR Middle East Airlines MEA
LOT Polish Airlines LO Saudia
Lufthansa LH TAROM Romanian Air Transport
Scandinavian Airlines SK Vietnam Airlines
Shenzhen Airlines ZH Xiamen Airlines
Singapore Airlines SQ
South African Airways SA
SWISS LX
TAP Portugal TP
THAI TG
Turkish Airlines TK
United UA *http://www.staralliance.com/en/member-airlines ; #http://www.skyteam.com/en/about/ ; ~https://www.oneworld.com/member-airlines/overview
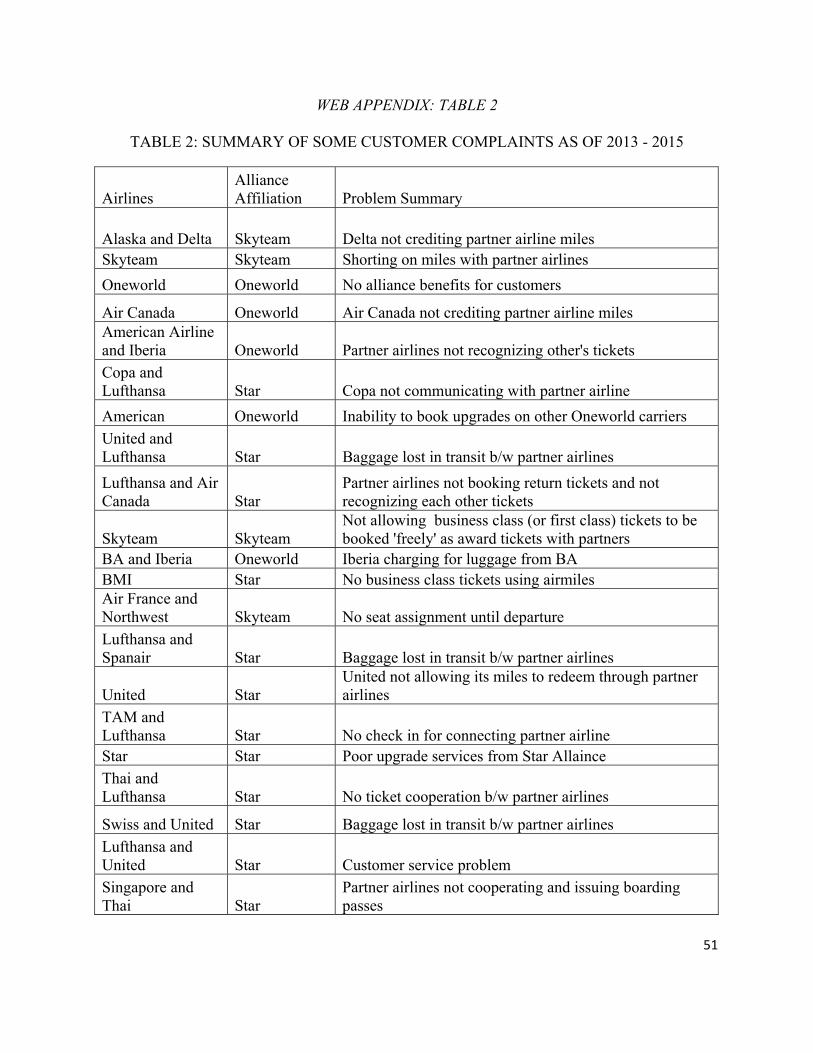
51
WEB APPENDIX: TABLE 2
TABLE 2: SUMMARY OF SOME CUSTOMER COMPLAINTS AS OF 2013 - 2015
Airlines Alliance Affiliation Problem Summary
Alaska and Delta Skyteam Delta not crediting partner airline miles Skyteam Skyteam Shorting on miles with partner airlines
Oneworld Oneworld No alliance benefits for customers
Air Canada Oneworld Air Canada not crediting partner airline miles American Airline and Iberia Oneworld Partner airlines not recognizing other's tickets
Copa and Lufthansa Star Copa not communicating with partner airline
American Oneworld Inability to book upgrades on other Oneworld carriers
United and Lufthansa Star Baggage lost in transit b/w partner airlines
Lufthansa and Air Canada Star
Partner airlines not booking return tickets and not recognizing each other tickets
Skyteam Skyteam Not allowing business class (or first class) tickets to be booked 'freely' as award tickets with partners
BA and Iberia Oneworld Iberia charging for luggage from BA BMI Star No business class tickets using airmiles Air France and Northwest Skyteam No seat assignment until departure
Lufthansa and Spanair Star Baggage lost in transit b/w partner airlines
United Star United not allowing its miles to redeem through partner airlines
TAM and Lufthansa Star No check in for connecting partner airline Star Star Poor upgrade services from Star Allaince
Thai and Lufthansa Star No ticket cooperation b/w partner airlines
Swiss and United Star Baggage lost in transit b/w partner airlines
Lufthansa and United Star Customer service problem
Singapore and Thai Star
Partner airlines not cooperating and issuing boarding passes
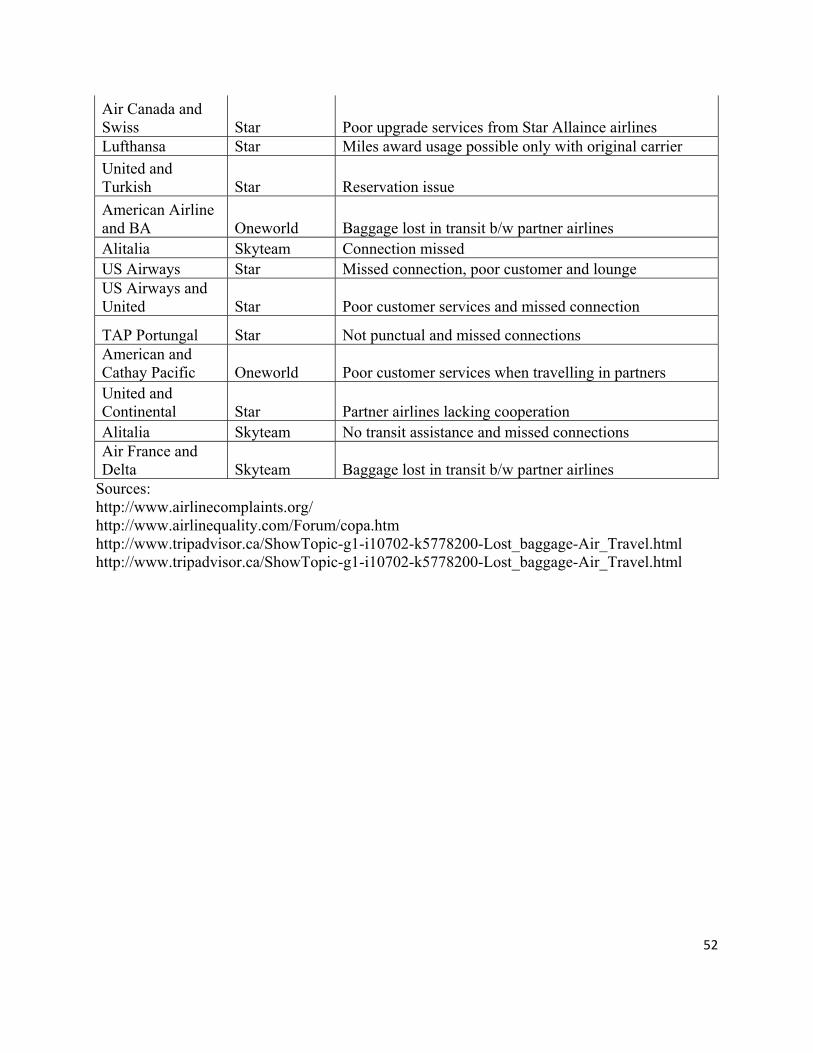
52
Air Canada and Swiss Star Poor upgrade services from Star Allaince airlines Lufthansa Star Miles award usage possible only with original carrier
United and Turkish Star Reservation issue
American Airline and BA Oneworld Baggage lost in transit b/w partner airlines Alitalia Skyteam Connection missed US Airways Star Missed connection, poor customer and lounge US Airways and United Star Poor customer services and missed connection
TAP Portungal Star Not punctual and missed connections American and Cathay Pacific Oneworld Poor customer services when travelling in partners United and Continental Star Partner airlines lacking cooperation Alitalia Skyteam No transit assistance and missed connections Air France and Delta Skyteam Baggage lost in transit b/w partner airlines
Sources: http://www.airlinecomplaints.org/ http://www.airlinequality.com/Forum/copa.htm http://www.tripadvisor.ca/ShowTopic-g1-i10702-k5778200-Lost_baggage-Air_Travel.html http://www.tripadvisor.ca/ShowTopic-g1-i10702-k5778200-Lost_baggage-Air_Travel.html
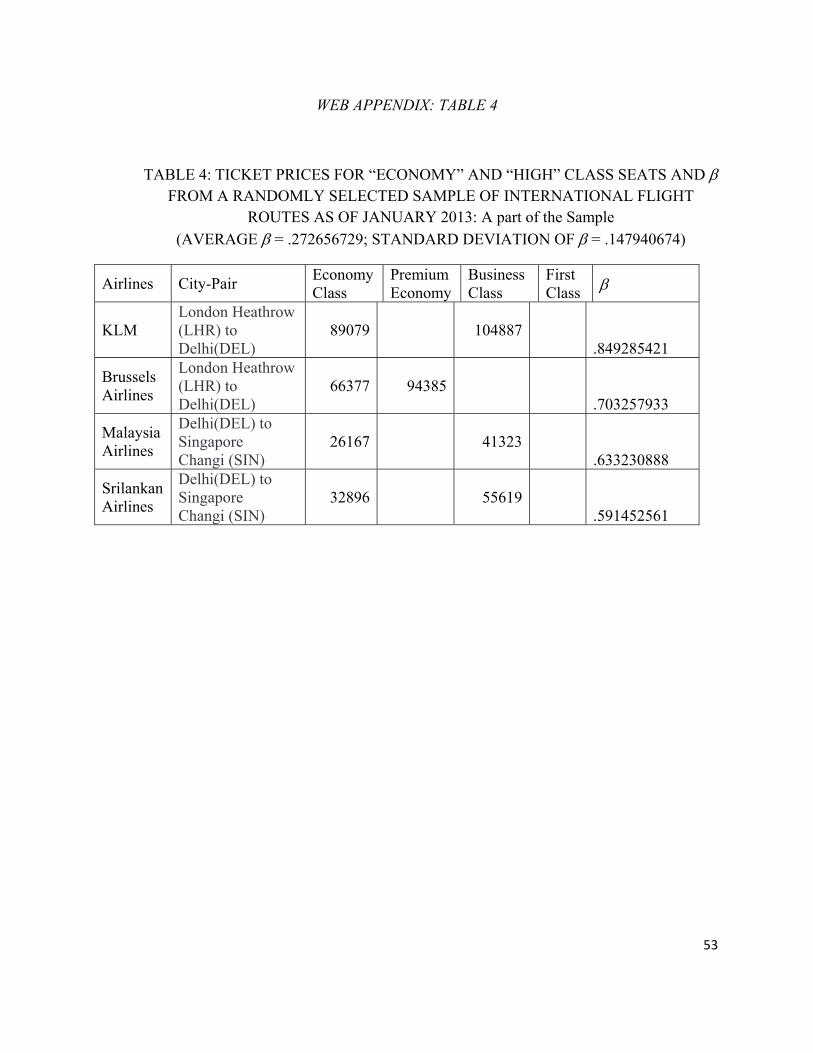
53
WEB APPENDIX: TABLE 4
TABLE 4: TICKET PRICES FOR “ECONOMY” AND “HIGH” CLASS SEATS AND FROM A RANDOMLY SELECTED SAMPLE OF INTERNATIONAL FLIGHT
ROUTES AS OF JANUARY 2013: A part of the Sample
(AVERAGE = .272656729; STANDARD DEVIATION OF = .147940674)
Airlines City-Pair Economy Class
Premium Economy
Business Class
First Class
KLM London Heathrow (LHR) to Delhi(DEL)
89079 104887 .849285421
Brussels Airlines
London Heathrow (LHR) to Delhi(DEL)
66377 94385 .703257933
Malaysia Airlines
Delhi(DEL) to Singapore Changi (SIN)
26167 41323 .633230888
Srilankan Airlines
Delhi(DEL) to Singapore Changi (SIN)
32896 55619 .591452561
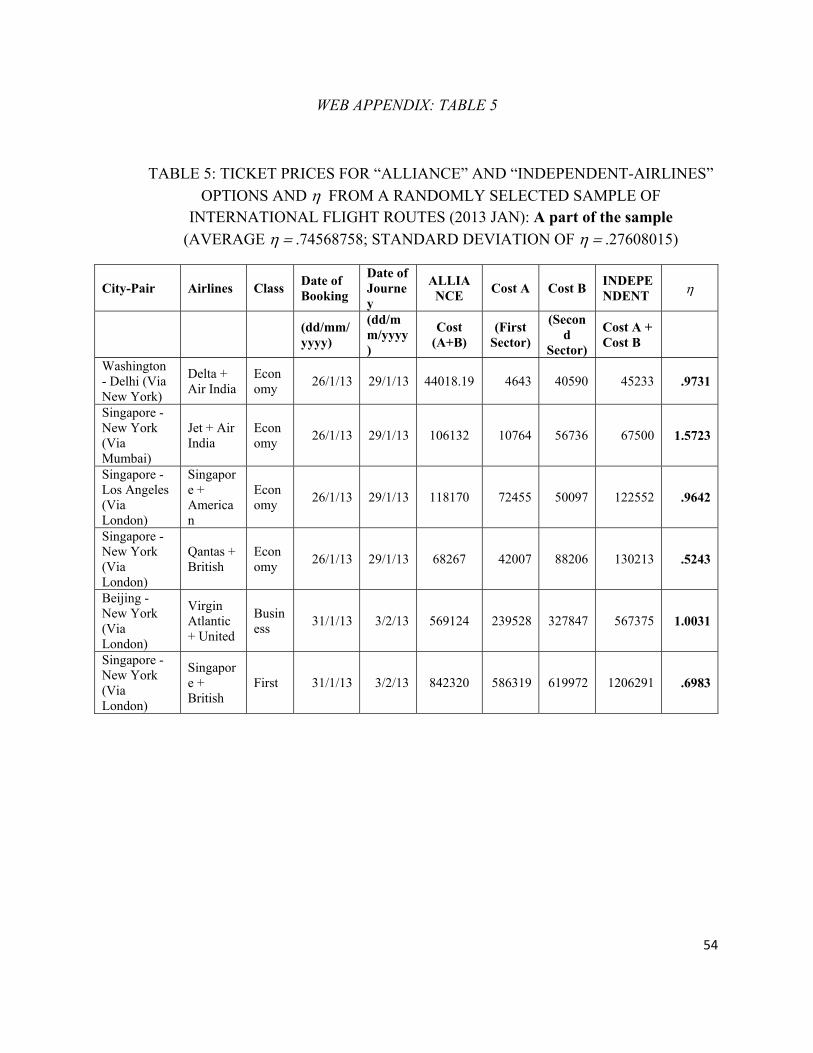
54
WEB APPENDIX: TABLE 5
TABLE 5: TICKET PRICES FOR “ALLIANCE” AND “INDEPENDENT-AIRLINES”
OPTIONS AND FROM A RANDOMLY SELECTED SAMPLE OF INTERNATIONAL FLIGHT ROUTES (2013 JAN): A part of the sample
(AVERAGE .74568758; STANDARD DEVIATION OF .27608015)
City-Pair Airlines Class Date of Booking
Date of Journey
ALLIANCE
Cost A Cost B INDEPENDENT
(dd/mm/yyyy)
(dd/mm/yyyy)
Cost (A+B)
(First Sector)
(Second
Sector)
Cost A + Cost B
Washington - Delhi (Via New York)
Delta + Air India
Economy
26/1/13 29/1/13 44018.19 4643 40590 45233 .9731
Singapore - New York (Via Mumbai)
Jet + Air India
Economy
26/1/13 29/1/13 106132 10764 56736 67500 1.5723
Singapore - Los Angeles (Via London)
Singapore + American
Economy
26/1/13 29/1/13 118170 72455 50097 122552 .9642
Singapore - New York (Via London)
Qantas + British
Economy
26/1/13 29/1/13 68267 42007 88206 130213 .5243
Beijing - New York (Via London)
Virgin Atlantic + United
Business
31/1/13 3/2/13 569124 239528 327847 567375 1.0031
Singapore - New York (Via London)
Singapore + British
First 31/1/13 3/2/13 842320 586319 619972 1206291 .6983
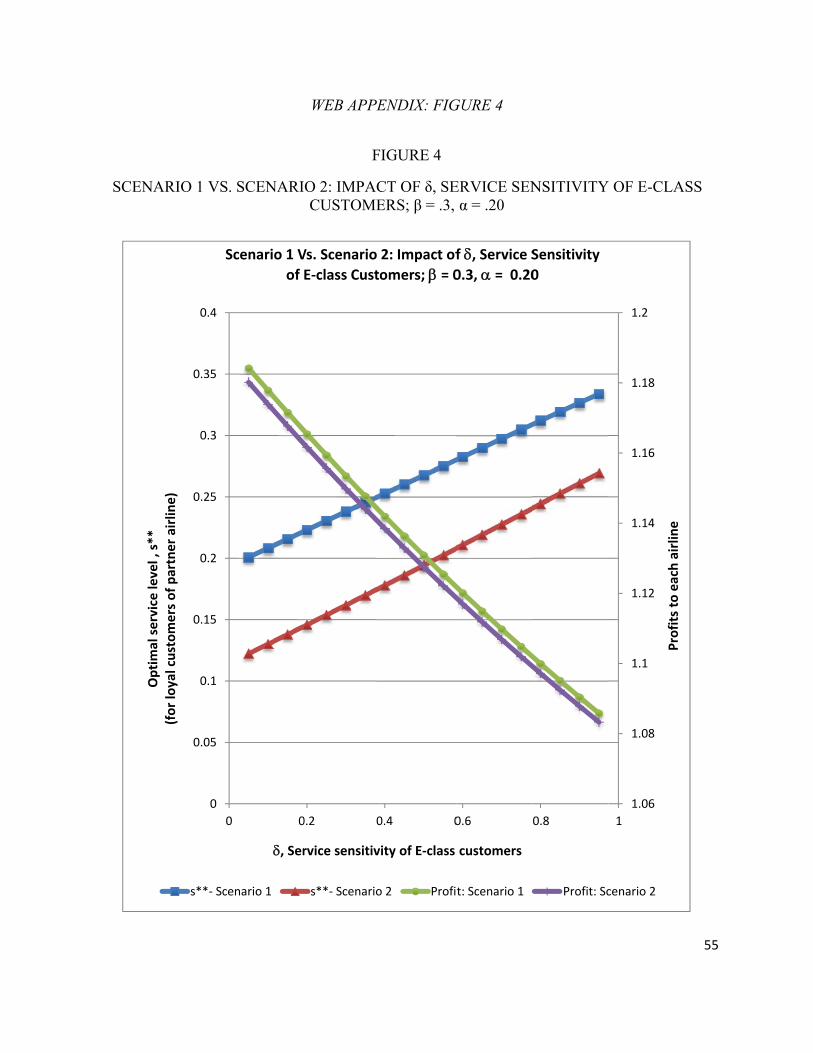
SCEN
Optimalservicelevels**
NARIO 1 VS
0
0.05
0.1
0.15
0.2
0.25
0.3
0.35
0.4
0
Optimal service level , s**
(for loyal customers of partner airline)
S
s**‐ Sce
. SCENARI
0 0
, Ser
Scenario 1 V
of
enario 1
WEB APPE
F
O 2: IMPACCUSTOME
0.2 0
rvice sensitiv
Vs. Scenario
E‐class Custo
s**‐ Scenario
ENDIX: FIG
IGURE 4
CT OF δ, SEERS; β = .3,
0.4 0
ity of E‐class
2: Impact of
omers; = 0
o 2 Profi
GURE 4
ERVICE SENα = .20
0.6
customers
f , Service S0.3, = 0.20
t: Scenario 1
NSITIVITY
0.8
Sensitivity
0
Profit: Sc
Y OF E-CLA
1.06
1.08
1.1
1.12
1.14
1.16
1.18
1.2
1
Profits to each airlin
e
cenario 2
55
SS
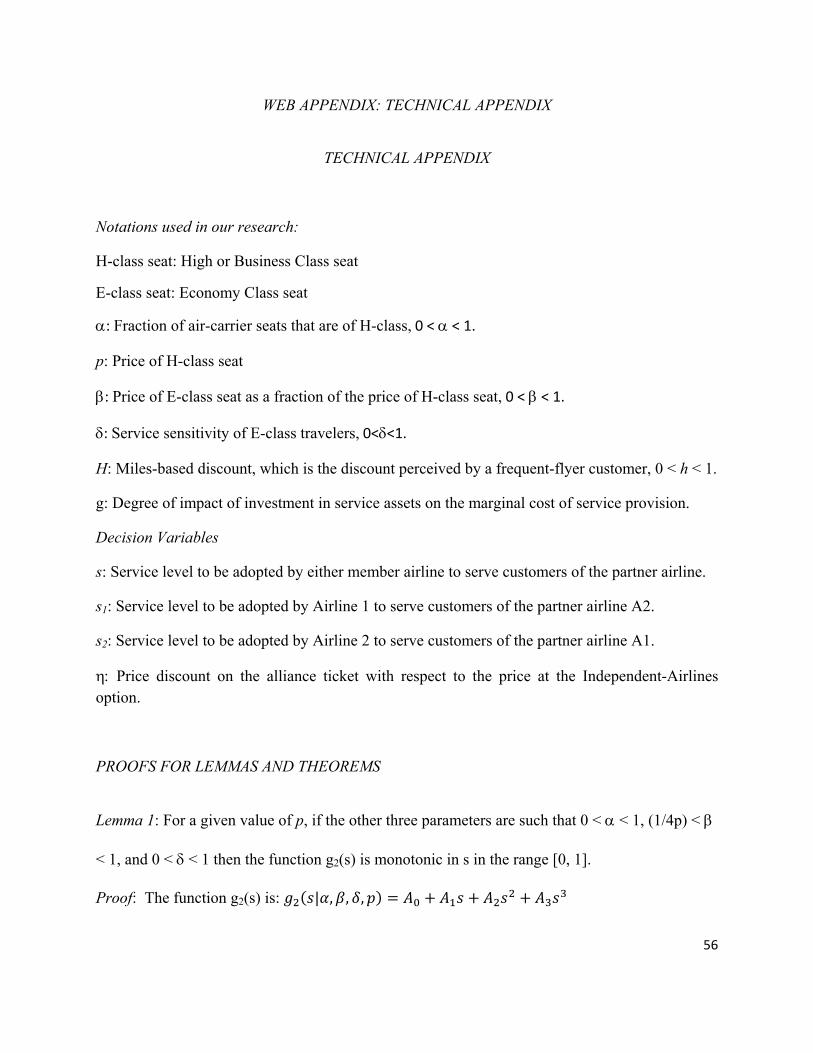
56
WEB APPENDIX: TECHNICAL APPENDIX
TECHNICAL APPENDIX
Notations used in our research:
H-class seat: High or Business Class seat
E-class seat: Economy Class seat
: Fraction of air-carrier seats that are of H-class, 0 < < 1.
p: Price of H-class seat
: Price of E-class seat as a fraction of the price of H-class seat, 0 < < 1.
: Service sensitivity of E-class travelers, 0<<1.
H: Miles-based discount, which is the discount perceived by a frequent-flyer customer, 0 < h < 1.
g: Degree of impact of investment in service assets on the marginal cost of service provision.
Decision Variables
s: Service level to be adopted by either member airline to serve customers of the partner airline.
s1: Service level to be adopted by Airline 1 to serve customers of the partner airline A2.
s2: Service level to be adopted by Airline 2 to serve customers of the partner airline A1.
Price discount on the alliance ticket with respect to the price at the Independent-Airlines option.
PROOFS FOR LEMMAS AND THEOREMS
Lemma 1: For a given value of p, if the other three parameters are such that 0 < < 1, (1/4p) <
< 1, and 0 < < 1 then the function g2(s) is monotonic in s in the range [0, 1].
Proof: The function g2(s) is: | , , ,
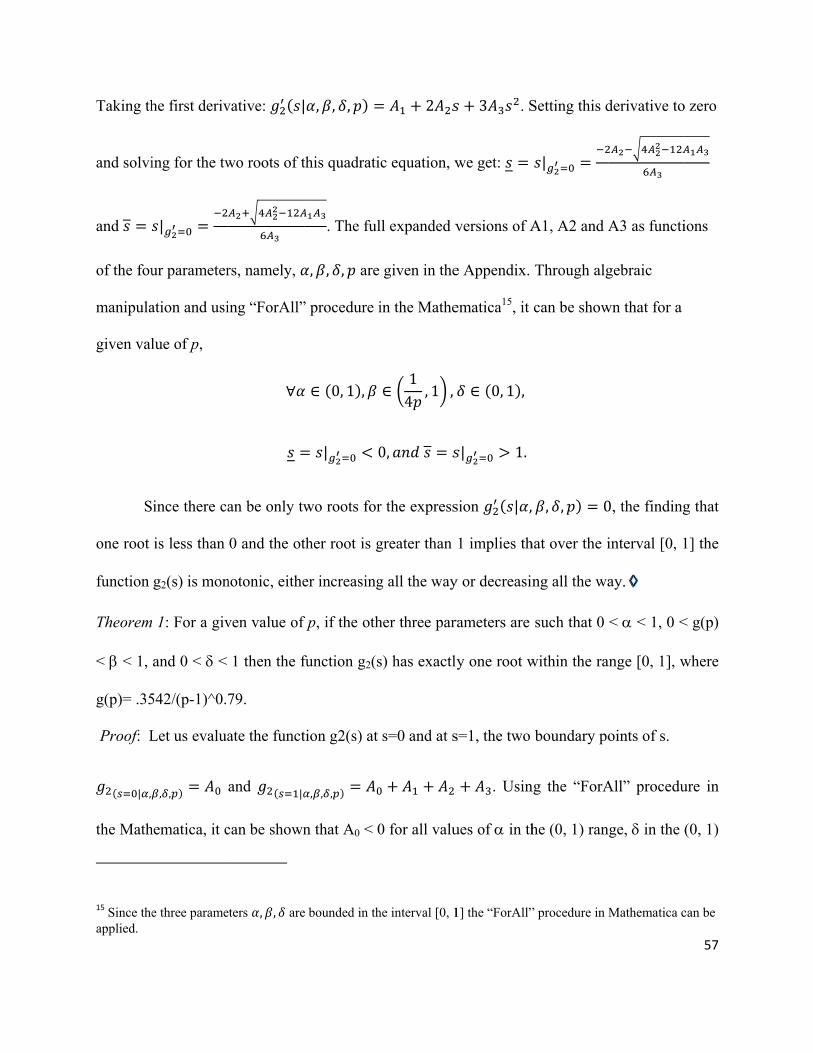
Taking th
and solvi
and
of the fou
manipula
given val
S
one root
function
Theorem
< < 1,
g(p)= .35
Proof: L
| ,
the Math
15 Since theapplied.
he first deriv
ing for the tw
|
ur parameter
ation and usi
lue of p,
ince there ca
is less than
g2(s) is mon
1: For a giv
and 0 < <
542/(p-1)^0.7
Let us evalua
, ,
hematica, it c
e three parame
vative: |
wo roots of t
rs, namely,
ing “ForAll”
∀
an be only tw
0 and the ot
notonic, eithe
ven value of
1 then the f
79.
ate the funct
and |
can be shown
eters , , are
, , ,
this quadrati
. The ful
, , , are
” procedure i
∈ 0, 1 ,
| 0
wo roots for
ther root is g
er increasing
f p, if the oth
function g2(s
tion g2(s) at
, , ,
n that A0 < 0
e bounded in th
2
c equation, w
ll expanded v
given in the
in the Mathe
∈14
, 1 ,
0,
r the express
greater than
g all the way
her three par
s) has exactly
s=0 and at s
0 for all valu
he interval [0, 1
3 . S
we get:
versions of A
e Appendix.
ematica15, it
∈ 0, 1 ,
| 1.
sion | ,
1 implies th
y or decreasin
rameters are
y one root w
s=1, the two
. Usin
ues of in th
1] the “ForAll”
Setting this d
|
A1, A2 and A
Through alg
can be show
, , 0
hat over the i
ng all the wa
such that 0
within the ra
boundary po
ng the “ForA
he (0, 1) ran
” procedure in M
derivative to
A3 as functi
gebraic
wn that for a
0, the finding
interval [0, 1
ay.
< < 1, 0 <
ange [0, 1], w
oints of s.
All” procedu
nge, in the
Mathematica c
57
o zero
ions
g that
1] the
< g(p)
where
ure in
(0, 1)
can be
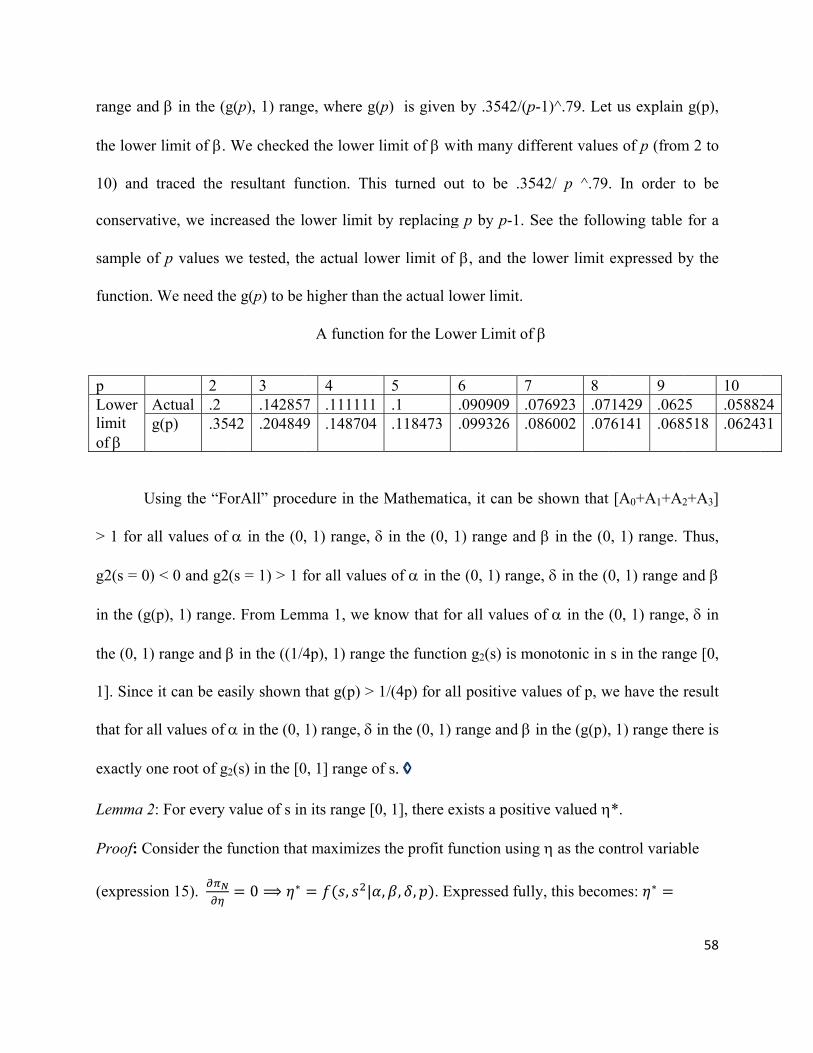
range and
the lower
10) and
conserva
sample o
function.
p Lower limit of
A
U
> 1 for a
g2(s = 0)
in the (g(
the (0, 1)
1]. Since
that for a
exactly o
Lemma 2
Proof: C
(expressi
d in the (g
r limit of .
traced the
ative, we inc
of p values w
We need th
2 Actual .2 g(p) .35
Using the “Fo
all values of
) < 0 and g2
(p), 1) range
) range and
e it can be ea
all values of
one root of g2
2: For every
onsider the f
ion 15).
g(p), 1) rang
We checked
resultant fu
creased the l
we tested, th
he g(p) to be
3 .142857
42 .204849
orAll” proce
f in the (0,
(s = 1) > 1 f
e. From Lem
in the ((1/4
asily shown
in the (0,
2(s) in the [0
value of s in
function that
0 ⟹ ∗
ge, where g(p
d the lower l
unction. Thi
lower limit b
he actual low
higher than
A function
4 7 .1111119 .148704
edure in the
, 1) range,
for all value
mma 1, we k
4p), 1) range
that g(p) >
1) range, i
0, 1] range of
n its range [0
t maximizes
, |
p) is given
limit of wi
s turned ou
by replacing
wer limit of
the actual lo
n for the Low
5 .1 .118473
Mathematic
in the (0, 1
s of in the
know that fo
e the functio
1/(4p) for al
in the (0, 1) r
f s.
0, 1], there ex
the profit fu
, , , . Ex
by .3542/(p
ith many dif
ut to be .35
g p by p-1. S
, and the l
ower limit.
wer Limit of
6 7.090909 .0.099326 .0
ca, it can be
1) range and
e (0, 1) rang
or all values
on g2(s) is m
ll positive va
range and
xists a positi
unction using
xpressed full
p-1)^.79. Let
fferent value
542/ p ^.79
See the follo
lower limit
f
8 076923 .07086002 .07
e shown that
d in the (0
ge, in the (
of in the
monotonic in
alues of p, w
in the (g(p),
ive valued
g as the co
ly, this beco
t us explain
es of p (from
. In order t
owing table
expressed b
9 71429 .06276141 .068
t [A0+A1+A2
0, 1) range. T
0, 1) range a
(0, 1) range
s in the rang
we have the r
, 1) range th
*.
ontrol variab
mes: ∗
58
g(p),
m 2 to
to be
for a
by the
10 5 .05882518 .06243
2+A3]
Thus,
and
, in
ge [0,
result
here is
ble
2431
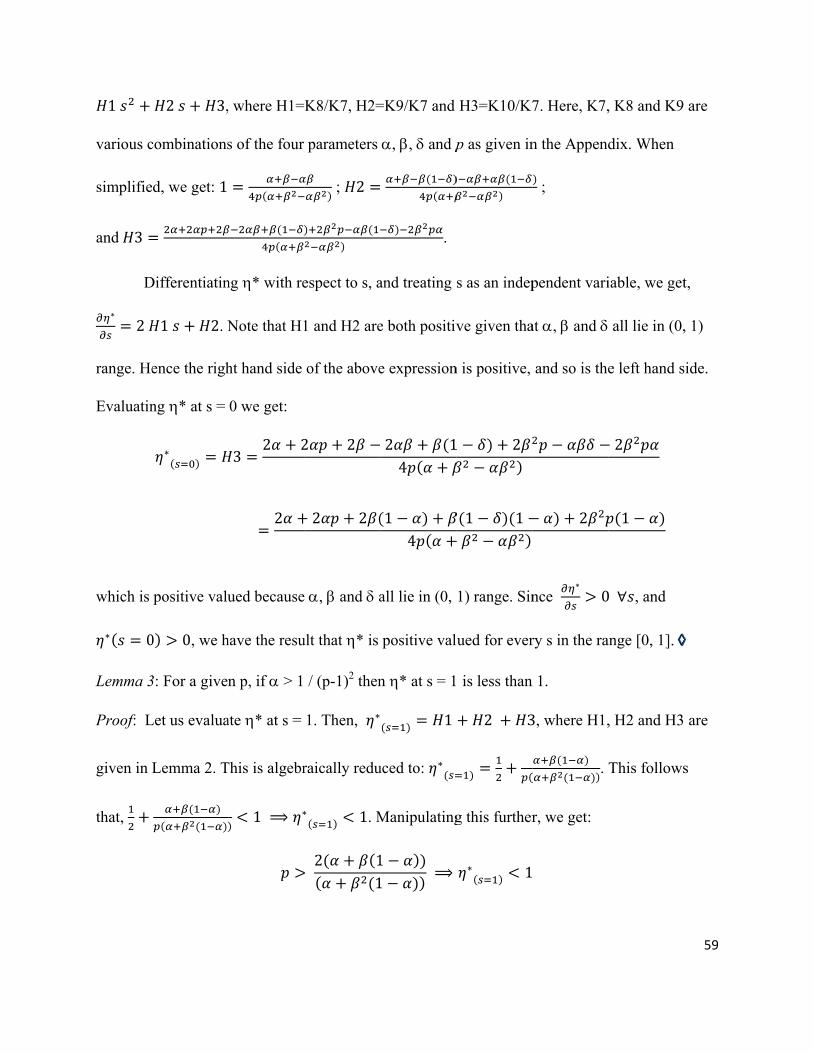
1
various c
simplifie
and 3
D
∗2
range. He
Evaluatin
which is
∗ 0
Lemma 3
Proof: L
given in
that,
2 3,
combinations
d, we get: 1
Differentiatin
1 2. N
ence the righ
ng * at s =
∗
positive valu
0 0, we h
3: For a given
Let us evalua
Lemma 2. T
, where H1=
s of the four
ng * with re
Note that H1
ht hand side
0 we get:
32 2
2
ued because
have the resu
n p, if > 1
ate * at s =
This is algebr
1 ⟹ ∗
K8/K7, H2=
parameters
; 2
espect to s, a
1 and H2 are
of the above
2 2
2 2
e , and a
ult that * is
/ (p-1)2 then
1. Then, ∗
raically redu
∗ 1. M
2 1
1
=K9/K7 and
, , and p
.
and treating
e both positiv
e expression
2 14
14
all lie in (0,
positive val
n * at s = 1
1
uced to: ∗
Manipulating
11
⟹
H3=K10/K7
p as given in
s as an indep
ve given tha
n is positive,
1 2
1 1
1) range. Sin
lued for ever
is less than
2 3
g this further
∗ 1
7. Here, K7,
n the Append
;
pendent vari
at , and
and so is the
2
nce ∗
0
ry s in the ra
n 1.
3, where H1,
.
r, we get:
, K8 and K9
dix. When
iable, we get
all lie in (0,
e left hand s
2
1
0∀ , and
ange [0, 1].
, H2 and H3
This follows
59
are
t,
, 1)
ide.
are
s
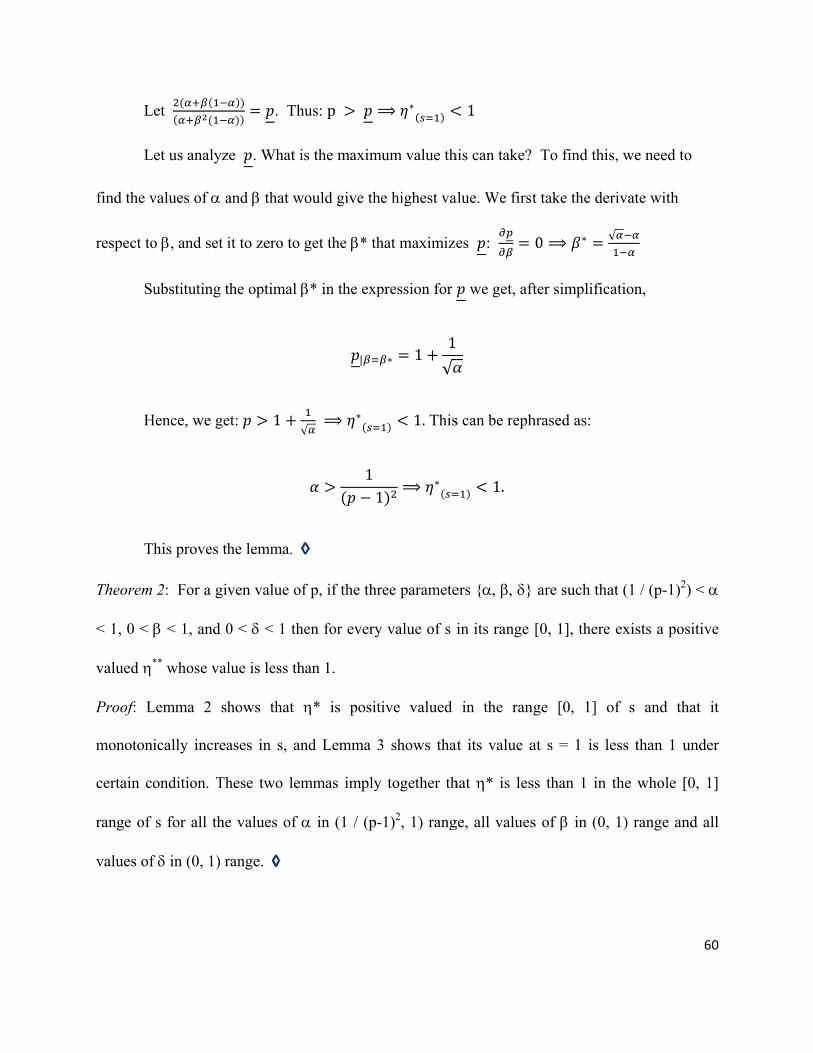
L
L
find the v
respect to
S
H
T
Theorem
< 1, 0 <
valued
Proof: L
monoton
certain c
range of
values of
Let
Let us analyz
values of a
o , and set i
ubstituting t
Hence, we ge
This proves th
2: For a giv
< 1, and 0
** whose val
Lemma 2 sh
nically increa
ondition. Th
s for all the
f in (0, 1) r
. Th
ze . What i
and that w
it to zero to
the optimal
et: 1√
he lemma.
ven value of
0 < < 1 th
lue is less th
hows that
ases in s, an
hese two lem
e values of
range.
us: p ⟹
s the maxim
ould give th
get the * th
* in the exp
|
√⟹ ∗
11
f p, if the thr
en for every
han 1.
* is posit
nd Lemma 3
mmas imply
in (1 / (p-
⟹ ∗
mum value th
e highest va
hat maximize
pression for
∗ 11
√
1. This
1⟹ ∗
ree paramete
y value of s i
tive valued
3 shows tha
y together th
-1)2, 1) rang
1
his can take?
alue. We first
es :
we get, aft
s can be reph
1.
ers {}
in its range
in the ran
at its value a
hat * is les
ge, all values
To find thi
t take the de
0 ⟹ ∗
fter simplific
hrased as:
are such tha
[0, 1], there
nge [0, 1] o
at s = 1 is l
ss than 1 in
s of in (0,
s, we need to
erivate with
√
cation,
at (1 / (p-1)2
e exists a po
of s and th
less than 1 u
the whole [
, 1) range an
60
o
2) <
sitive
hat it
under
[0, 1]
nd all