no 94 / september 2008 · 2.3.2 exchange rate pass-through to euro area import prices 28 2.3.3...
TRANSCRIPT

by Filippo di Mauro, Rasmus Rüffer and Irina Bunda
Occas iOnal PaPer ser i e snO 94 / s ePtember 2008
tHe cHanGinG rOle OF tHe eXcHanGe rate in a GlObaliseD ecOnOmY

OCCAS IONAL PAPER SER IESNO 94 / SEPTEMBER 2008
by Filippo di Mauro 2, Rasmus Rüffer
and Irina Bunda
THE CHANGING ROLE
OF THE EXCHANGE RATE
IN A GLOBALISED ECONOMY 1
This paper can be downloaded without charge from
http://www.ecb.europa.eu or from the Social Science Research Network
electronic library at http://ssrn.com/abstract_id= 1144484.
1 This Occasional Paper benefited from valuable input from several people. We would particularly like to acknowledge the contributions
by U. Baumann, K. Benkovskis, M. Bussière, F. Fornari, J. E. Gumiel, E. Hahn, C. Osbat, T. Peltonen, I. Vansteenkiste and M. Wagner.
The authors would like to thank Michele Ca’Zorzi and an anonymous referee for their very useful comments
2 Corresponding author: Head of Division of the External Developments Division, European Central Bank,
Kaiserstrasse 29, 60311 Frankfurt am Main, Germany; e-mail: [email protected].
In 2008 all ECB publications
feature a motif taken from the €10 banknote.

© European Central Bank, 2008
Address Kaiserstrasse 29
60311 Frankfurt am Main
Germany
Postal address Postfach 16 03 19
60066 Frankfurt am Main
Germany
Telephone +49 69 1344 0
Website http://www.ecb.europa.eu
Fax +49 69 1344 6000
All rights reserved. Any reproduction, publication or reprint in the form of a different publication, whether printed or produced electronically, in whole or in part, is permitted only with the explicit written authorisation of the ECB or the author(s).
The views expressed in this paper do not necessarily refl ect those of the European Central Bank.
ISSN 1607-1484 (print)
ISSN 1725-6534 (online)

3ECB
Occasional Paper No 94
September 2008
CONTENTSCONTENTS
ABSTRACT 4
NON-TECHNICAL SUMMARY 5
INTRODUCTION 7
I EURO EXCHANGE RATE AND
GLOBALISATION: STYLISED FACTS 10
1.1 Overview of developments in the
euro exchange rate 10
1.2 Globalisation and the euro area 13
1.2.1 Trade integration 14
1.2.2 Financial integration 16
1.3 The exchange rate and euro area
growth 17
1.4 Measuring effective exchange
rates in a globalised world 19
2 EXCHANGE RATES AND PRICES 25
2.1 The link between exchange rates
and prices – model-based evidence 25
2.2 Exporters’ behaviour and
pricing-to-market 26
2.3 Globalisation and
time-variability of the exchange
rate pass-through to import prices 27
2.3.1 Conceptual considerations 27
2.3.2 Exchange rate pass-through
to euro area import prices 28
2.3.3 Exchange rate pass-through
to euro area import prices –
a sectoral perspective 30
2.3.4 Explanations for
heterogeneity in sectoral
exchange rate pass-through 31
2.3.5 Pricing behaviour of
emerging market exporters 33
2.4 Has the pass-through to euro area
consumer infl ation changed over
time? 34
3 EXCHANGE RATES AND TRADE 37
3.1 Conceptual considerations 37
3.2 The empirical link between
exchange rates and euro area
trade fl ows 38
3.3 A dissagregated approach to
trade elasticities 41
4 OTHER EFFECTS OF EXCHANGE RATE
CHANGES 46
4.1 Globalisation and the impact of
exchange rate movements on
GDP growth 46
4.2 The impact of exchange rate
changes on fi rms’ profi tability 47
4.3 The importance of valuation
effects for the euro area 50
5 CONCLUDING REMARKS 54
EUROPEAN CENTRAL BANK OCCASIONAL
PAPER SERIES SINCE 2007 60

4ECB
Occasional Paper No 94
September 2008
ABSTRACT
In addition to its direct effects on the global
trading and production structure, the ongoing
process of globalisation may have important
implications for the interaction of exchange
rates and the overall economy. This paper
presents evidence regarding possible changes in
the role of exchange rates in a more globalised
economy. First, it analyses the link between
exchange rates and prices, showing that there is
at most a moderate decline in exchange rate
pass-through for the euro area. Next, it turns
to the effect of exchange rate changes on
trade fl ows. The fi ndings indicate that the
responsiveness of euro area exports to exchange
rate changes may have declined somewhat as a
result of globalisation, refl ecting mainly shifts
in the geographical and sectoral composition of
trade fl ows. The paper also provides a fi rm-level
analysis of the impact of exchange rate changes
on corporate profi ts, which suggests that overall
this relationship appears to be relatively stable
over time, although there are important cross-
country differences. In addition, it studies
the overall impact of exchange rates on GDP
and the potential role of valuation effects as
a transmission channel in the case of the euro
area.
Key words: Globalisation, exchange rate, trade,
exchange rate pass-through, valuation effects.
JEL: E3, F15, F31.

5ECB
Occasional Paper No 94
September 2008
NON-TECHNICAL
SUMMARYNON-TECHNICAL SUMMARY
Globalisation has resulted in a new confi guration
of world trade, production and fi nance, and
has had a direct impact on international
competitiveness, trade and fi nancial fl ows and
relative prices. In addition, it has brought about
changes in the dynamic interactions of economic
variables, including possibly the way changes in
the exchange rate affect the economy. Should
these changes prove to be substantial, this
could have far-reaching implications for the
international transmission of shocks and, above
all, for the mechanism through which monetary
policy is transmitted and affects infl ation.
Given the relevance of this subject for policy-
making, the objective of this Occasional Paper
is to establish whether and how the forces of
globalisation may have altered the way exchange
rate changes impact on the euro area economy.
From a conceptual point of view, the response
to the above issue is far from unambiguous. On
the one hand, stronger international competition
may have, for example, weakened the link
between exchange rate movements and trade
volumes, as more intense competition intensifi es
the pricing-to-market behaviour of exporters.
Similarly, the higher import content of exports
associated with globalisation tends to reduce the
effect of an exchange rate change, as the impact
on export prices is partly offset by the change in
the price of imported inputs. On the other hand,
increased competition may imply that importers
react more strongly to changing relative prices
between different suppliers, thus increasing the
responsiveness of trade fl ows to changes in the
exchange rate. Moreover, lower trade costs, by
making access to foreign markets easier, may
also contribute to increasing the sensitivity of
trade along the extensive margin, i.e. through
entry and exit. As a result, the overall impact of
globalisation on the way exchange rate swings
affect the economy depends on the relative
strength of these different factors, and can thus
be assessed only from an empirical standpoint.
To set the scene, the fi rst chapter presents
some general information about the historical
evolution of the euro exchange rate along with
an overview of the globalisation process and
its impact on the euro area economy. In that
context, it is important to note that the exchange
rate is only one factor affecting the euro area,
amid a broad range of transmission channels
of the external environment. Simulations using
the Area Wide Model suggest that, on average,
during the fi rst half of the 2000s, positive and
negative variations in competitors’ export prices
in foreign currency, as well as in the nominal
effective exchange rate of the euro, have been
partially cancelled out in a context of strong
global demand driving euro area growth. In the
latter part of the chapter, a statistical analysis is
undertaken aimed at investigating whether the
globalisation process has altered the information
content of the euro real effective exchange rate.
After introducing a number of adjustments to the
calculation of individual countries’ weights in
order to capture globalisation-related changes to
the trade confi guration, it is shown that, overall,
the currently used measures of cost and price
competitiveness are still broadly appropriate for
international and historical comparisons.
In the second chapter, the relationship between
nominal exchange rates and prices and possible
changes therein are analysed. Recursive estimates
provide evidence of the rather stable pricing-to-
market behaviour of euro area exporters, despite
an acceleration in the pace of real integration
and stronger competitive pressures over the
recent period. Regarding possible changes in
the relationship between nominal exchange rates
and domestic prices over time, evidence for the
euro area is less conclusive than for the United
States, where studies have unanimously pointed
to a decline in the exchange rate pass-through
over time. Looking at the time-variability of the
exchange rate pass-through to import prices,
empirical results suggest that there may have
been some decline in the pass-through for the
euro area, possibly related to a shift to sectors
with relatively low exchange rate pass-through
in the import structure. As for the impact of
globalisation on the relationship between
exchange rates and consumer price infl ation, the
results of a rolling panel VAR estimation for the

6ECB
Occasional Paper No 94
September 2008
period 1980-2007 point to a signifi cant degree of
heterogeneity within the euro area.
In order to empirically assess whether trade
fl ows may have decoupled from the exchange
rate, the third chapter analyses the relationship
between real exchange rates – as an indicator of
international price competitiveness – and trade
fl ows. The recursive estimation of a standard
econometric model of trade suggests that the
impact of exchange rate changes on extra-
euro area export volumes of goods may have
somewhat declined over time. This decline is,
however, not observed for all euro area countries,
with cross-country heterogeneity possibly
refl ecting differences in the extent to which the
use of imported inputs in the production of export
goods has increased over time.
Based on a gravity model of trade, disaggregate
estimates of exchange rate sensitivities of exports
in different industries and to various export
destinations are presented, showing signifi cant
sectoral and geographical heterogeneity. It is
shown that changes in the sectoral composition
of exports (“industry composition effects”) tend
to reduce the overall responsiveness of export
for all euro area countries examined, as exports
have shifted towards sectors with relatively
low exchange rate sensitivities. In contrast,
changes in the geographical structure of exports
(“geographical composition effects”) have been
more diverse and may thus be more relevant in
accounting for cross-country differences across
euro area member states.
The fourth chapter analyses other effects of
exchange rate changes on the economy. First,
the overall relationship between exchange rates
and GDP is investigated. The results of a rolling
panel VAR regression suggest that the impact
of an exchange rate shock on euro area GDP
has remained fairly stable over time. Second,
the chapter analyses the link between exchange
rates and economic performance, taking a fi rm-
level perspective. Drawing on an empirical
analysis conducted at the ECB for listed fi rms in
six industrial countries for the period 1973-2007,
the response of corporate earnings to exchange
rate changes appears to be relatively stable
over time for most countries. Third, the chapter
shows that valuation effects, through the impact
of an exchange rate change on the domestic
currency value of foreign assets and liabilities
holdings, may also play a role in the transmission
mechanism of economic shocks. These effects
are likely to have become stronger as a result of
fi nancial globalisation. The direction of this effect
crucially depends, however, on the currency
denomination of countries’ assets and liabilities.
Calculations for the euro area show that these
valuation effects are potentially becoming more
important in the presence of tighter links between
the euro area and its external environment.
In sum, the results suggest that the impact of the
globalisation process on the effect of exchange
rate movements on major economic aggregates
in the euro area appears to be fairly moderate.
While the evidence for the impact on prices and
trade fl ows seems to indicate some reduction in
the responsiveness to exchange rate changes,
increased international fi nancial integration
suggests that the valuation channel should have
been strengthened by globalisation. On the price
side, the evidence is rather mixed, indicating
at most a moderate decline in exchange rate
pass-through to euro area import and consumer
prices, which appears to be less pronounced
than in other industrialised countries, most
notably the United States. Regarding trade
fl ows, the analysis provides some evidence
that the responsiveness of euro area exports
to changes in the exchange rate has declined
somewhat for goods over the past decade. At
the same time, the responsiveness of euro area
services exports appears to have increased
more noticeably. In general, disaggregate
evidence on both prices and trade indicate that
composition effects appear to play an important
role in shaping the response of the economy to
exchange rate changes. Thus, the main effect of
globalisation on the role of the exchange rate
may come through the changes in the regional
and sectoral composition of trade fl ows rather
than via other structural changes, such as
increased competitiveness or the progressive
internationalisation of the production process.

7ECB
Occasional Paper No 94
September 2008
INTRODUCTION
INTRODUCTION
Globalisation, or the increased global
interdependence of economies through trade,
production and fi nancial linkages, is a complex
albeit not a new phenomenon. During the early
stages of the globalisation process, the fall in
transportation costs and the reduction in trade
barriers enabled the geographical separation
of production and consumption, contributing
to a more effi cient international allocation of
resources and overall better growth outcomes
for liberalising countries. The more recent
wave of real and fi nancial globalisation, which
started around the mid-1980s, driven by the
dismantling of trade barriers, the liberalisation
of capital controls and signifi cant technological
advances in information and communication
technologies, has brought about major changes
in both production and trade patterns. Tasks
that previously were performed in one fi rm
have become tradeable owing to the decline
in communication and transaction costs. The
increasing international fragmentation of the
manufacturing process internationally and
the slicing up of the value-added chain across
national borders are major features of this
process. In addition, the globalisation process
has been stimulated by the emergence of a
number of new players, above all China, which
has increased the effective global supply of
cheap labour. All these changes have directly
affected international competitiveness, trade
fl ows and relative prices.
The acceleration of the globalisation process over
the past decade, which has involved an
unprecedented number of countries, has resulted
in a new confi guration of world trade, production
and fi nance, while also modifying the way in
which economies react to exogenous shocks.
These structural changes have often translated
into impacts of a qualitative rather than a merely
quantitative nature, giving rise to calls for a new
paradigm to capture all dynamic international
interactions of macroeconomic variables.1 To
complicate matters, the formation of the European
Monetary Union (EMU), with the introduction of
the euro in 1999, has also affected trade and
fi nancial fl ows, in particular, among euro area
member states themselves. As a result – as will
be seen later – globalisation impacts are extremely
diffi cult to identify when intertwined with
powerful phenomena such as EMU.
In addition to directly shaping international
production and trading patterns, globalisation
may have also affected economies in more
subtle ways by altering the various international
transmission channels. In particular, it may have
changed the impact of exchange rate movements
on economic performance. From a policy
perspective, the understanding of the changing
relationship between exchange rates and
economic performance is extremely relevant for
the euro area, given its relatively high degree of
openness compared with other major economies,
at both aggregate and country level. An analysis
of possible changes in this relationship is crucial
in order to appropriately assess the likely impact
of monetary policy actions. Furthermore, apart
from being an independent source of shocks,
exchange rates may also act as an automatic
stabiliser and have a role to play in the resolution
of global imbalances.
Despite the potentially important policy
implications of globalisation-related changes
to the exchange rate-economy nexus, empirical
evidence on this issue for the euro area is rather
scarce and fragmented. The present paper aims
to fi ll this gap in the literature and proposes a
synthetic view of the evolving role of exchange
rates for the economy by drawing on empirical
work carried out at the ECB. The analysis
focuses, in particular, on potential changes in
the past ten to fi fteen years, as this is the time
frame during which the effects of globalisation
have been most noticeable. The concrete sample
periods used in the various sections may,
however, vary due to data availability.
The paper is organised as follows:
The fi rst chapter highlights some of the
main developments in the exchange rate of
See for instance Grossmann and Rossi-Hansberg (2006).1

8ECB
Occasional Paper No 94
September 2008
the euro in recent years and provides some
evidence regarding the major direct impacts
on the euro area economy of the increasingly
global dimension of economic and fi nancial
transactions. In order to put the discussion into
context, a broader perspective is subsequently
taken by analysing more generally the effects of
external infl uences on the euro area over recent
years. The analysis shows that, while exchange
rate changes can at times have a strong infl uence
on the euro area, other infl uences appear,
on average, to have been more important, in
particular, developments in foreign demand.
Lastly, the chapter provides a quantitative
assessment of the impact of globalisation-related
structural changes on the measurement of the
real effective exchange rate – the traditional
measure of a country’s international cost and
price competitiveness.
The second chapter focuses on the relationship
between nominal exchange rates and prices,
one of the most direct channels through which
changes in exchange rates affect the economy.
After reviewing some model-based evidence
on exchange rate pass-through (ERPT) and
the pricing-to-market behaviour of euro area
exporters, the chapter investigates whether
the link between exchange rates and euro area
prices has undergone signifi cant changes over
time, possibly related to the ongoing process
of globalisation. This analysis is undertaken at
different stages of the pricing chain, including
import prices and consumer prices. The chapter
also provides some insights into the possible
factors underlying the variability of exchange
rate pass-through over time, with a special
focus on potentially higher pricing-to-market
in emerging market economies and changes in
sectoral ERPT.
The third chapter turns to the link between
exchange rates and trade fl ows by assessing how
globalisation may have changed the traditional
expenditure-switching effect of changes in
exchange rates. To this end, two complementary
approaches are used: an aggregate trade equation
and a disaggregated sector-level, gravity-type
analysis of bilateral trade fl ows. This analysis
is also employed to gain some understanding of
geographical and sectoral composition effects in
driving the dynamics in the relationship between
exchange rates and trade fl ows.
The fourth chapter investigates the link between
globalisation and other impacts of exchange
rate changes on the economy. First, the chapter
analyses the relationship between exchange
rates and overall GDP, and possible changes
therein over time. Contrary to Chapters 2 and 3,
the fourth chapter takes a microeconomic view
by focusing on how exchange rate changes may
impact fi rm-level performance. To this end, it
presents some fi ndings on the link between the
exchange rate and fi rms’ earnings in selected
industrialised countries. Furthermore, the
chapter addresses other potential transmission
channels of exchange rate changes on the
euro area economy. In particular, against the
background of increased fi nancial integration
and a signifi cant increase in gross cross-border
holdings of assets and liabilities, it focuses on
the increasing role of valuation changes.
In sum, the results suggest that the impact
of the globalisation process on the effect of
exchange rate movements on major economic
aggregates in the euro area appears to be fairly
moderate. While the evidence for the impact on
prices and trade fl ows seems to indicate some
reduction in the responsiveness to exchange
rate changes, increased international fi nancial
integration suggests that the valuation channel
should have been strengthened by globalisation.
On the price side, the evidence is rather mixed,
indicating at most a moderate decline in ERPT
to euro area import and consumer prices, with
the decline appearing to be less pronounced
than in other industrialised countries, most
notably the United States. Regarding trade
fl ows, the analysis provides some evidence
that the responsiveness of euro area exports
to changes in the exchange rate has declined
somewhat for goods over the past decade. At
the same time, the responsiveness of euro area
services exports appears to have increased
more noticeably. In general, disaggregate
evidence on both prices and trade indicates that

9ECB
Occasional Paper No 94
September 2008
INTRODUCTION
composition effects appear to play an important
role in shaping the response of the economy to
exchange rate changes. Thus the main effect of
globalisation on the role of the exchange rate
may come through the changes in the regional
and sectoral composition of trade fl ows rather
than via other structural changes, such as
increased competitiveness or the progressive
internationalisation of the production process.

10ECB
Occasional Paper No 94
September 2008
I EURO EXCHANGE RATE AND
GLOBALISATION: STYLISED FACTS
In order to put the overall discussion into
perspective, this chapter provides a general
overview of the major trends in the exchange rate
of the euro in recent years. In addition, it briefl y
reviews the main impacts of the real and fi nancial
globalisation process on the euro area economy.
It also assesses the quantitative importance
of external factors in shaping the evolution of
economic activity in the euro area during the
recent past, with special emphasis on the role of the
exchange rate in that respect. Finally, the chapter
presents a quantitative analysis of the potential
impact of globalisation on the measurement of the
real effective exchange rate of the euro, which is
the most commonly used measure of international
cost and price competitiveness of the euro area.
I.1 OVERVIEW OF DEVELOPMENTS IN THE EURO
EXCHANGE RATE
The euro – and prior to 1999 its legacy currencies –
has experienced signifi cant fl uctuations vis-à-vis
the currencies of its main trading partners in
recent decades (see Chart 1). Since 1980 the
euro has undergone two major swings against the
US dollar, depreciating noticeably in the fi rst half
of the 1980s, followed by a rapid turnaround in
the second half of the decade. This episode was
followed by a period of relative stability, which
was, however, accompanied by signifi cant
shorter-term volatility. The second swing started
in 1995, resulting in a signifi cant weakening
of the euro, which lasted until late 2000.
Subsequently, the single currency recovered most
of these losses relatively quickly. More recently,
the euro has reached historical highs vis-à-vis
the US currency, trading above USD 1.50. It has
also exhibited signifi cant fl uctuations against the
Japanese yen, with a general depreciating trend
between 1980 and 2000. Subsequently, the euro
appreciated noticeably against the Japanese
currency in the context of more limited shorter-
run volatility. However, this trend has come
to an end in the context of the fi nancial market
turbulence, which started in the summer of 2007.
In real CPI-defl ated effective terms, i.e.
aggregating the bilateral exchange rates of the
euro against the currencies of its major trading
partners according to their weight in the euro
area’s overall trade fl ows, the euro has also
exhibited signifi cant swings over the past three
decades (see Chart 2). Similar to developments
Chart 1 Nominal exchange rate of the euro (on DEM basis) vis-à-vis the US dollar and the Japanese yen
1.7
1.5
1.3
1.1
0.9
0.7
0.5
280
1980 1983 1986 1989 1992 1995 1998 2001 2004 2007
USD/EUR
JPY/EUR (right-hand scale)
260
240
220
200
180
160
140
120
100
80
Source: ECB.Note: Last observation refers to May 2008.
Chart 2 Euro real effective exchange rate
(CPI-based; Q1 1999 = 100)
80
85
90
95
100
105
110
115
120
80
85
90
95
100
105
110
115
120
1980 1983 1986 1989 1992 1995 1998 2001 2004 2007
Long-term
average
real EUR EER-12 (CPI-deflated)real EUR EER-24 (CPI-deflated)
Source: ECB. Notes: Trade-weighted average using double export weights. Long-term averages refer to 1980-2007 in the case of the EER12 and 1993-2007 in the case of the EER24. Last observation refers to December 2007.

11ECB
Occasional Paper No 94
September 2008
1 EURO EXCHANGE RATE
AND GLOBALISATION:
STYLISED FACTSin the bilateral rate vis-à-vis the US dollar, the
real effective exchange rate (REER) of the euro
experienced major troughs in 1985 and 2000 and
major peaks in the mid-1990s, in 2004 and at
the end of the sample period. In December 2007
the effective exchange rate of the euro against
12 and 24 major trading partners was about 16%
and 10% above their respective longer-term
averages, for the period 1980-2007 in the case
of the REER-12 and 1993-2007 in the case of
the REER-24.
In analysing the impact of exchange rate
changes – and, in particular, the way it has
possibly changed over time – it is important to
understand the extent to which exchange rate
volatility has undergone structural changes,
especially when non-linearities are important.
For example, it is possible that economic
agents do not respond strongly to relatively
small changes in exchange rates, refl ecting,
among others, adjustment costs. By contrast,
larger exchange rate shocks may trigger a
disproportionately larger response, as agents
are willing to incur the adjustment costs. If, in
such a situation, the volatility of exchange rates,
and thus presumably the size of exchange rate
shocks, increases over time, this would result in
exchange rate changes having a stronger effect
on economic variables. Rather than refl ecting
any fundamental change in the underlying
relationship, this stronger impact would merely
refl ect the existing non-linearities. Overall,
the evidence regarding possible structural
changes in the size of exchange rate shocks is
somewhat mixed.
During the post-Bretton Woods period of fl oating
exchange rates, the degree of volatility of major
exchange rates does not appear to have undergone
signifi cant changes over time. For example, the
conditional variance of the exchange rate of the
euro vis-à-vis the US dollar and the Japanese
yen, while showing some short-run variability,
has remained broadly stable over time
(see Chart 3).2 For the USD/EUR exchange rate,
the conditional variance remained on average at
around 0.4 over the period 1980-2007, with the
short-term peaks declining somewhat in terms of
magnitude (e.g. from 2.4% in the mid-1980s to
The Fractionally Integrated GARCH (FIGARCH) model of 2
Baillie et al. (1996) was used to estimate the conditional
volatility for the period from 1980 to the end of 2007. High
frequency exchange rates have been shown to be conditionally
heteroscedastic and display long-term dependence in the
conditional second moment, as well as excess kurtosis
(Baillie (1989), Hsieh (1989), and Baillie et al. (1996)),
The FIGARCH model seems to be especially well suited to
capture this volatility clustering and long-term persistence that
characterise exchange rates.
Chart 3 Estimated conditional variance in the euro exchange rate
(a) EUR/USD (b) EUR/JPY
0.0
0.5
1.0
5.0
2.0
2.5
3.0
0.0
0.5
1.0
5.0
2.0
2.5
3.0
1984 1987 1990 1993 1996 1999 2002 200519810.0
0.5
1.0
1.5
2.0
2.5
3.0
3.5
4.0
4.5
5.0
0.0
0.5
1.0
1.5
2.0
2.5
3.0
3.5
4.0
4.5
5.0
1981 1984 1987 1990 1993 1996 1999 2002 2005
Source: Authors’ calculations. Daily data provided by Haver Analytics (last observation refers to 20 December 2007). Notes: The DEM exchange rate was used before 1999. Based on an fractionally integrated GARCH model (see Anderson and Bolleslev (1998) and Baillie et al (1996)).

12ECB
Occasional Paper No 94
September 2008
approximately 1.8% in the mid-1990s and 0.9%
in 2001) and in terms of average variability
(see Chart 3a). Overall, the conditional variance
on the JPY/EUR currency pair has also been
relatively stable over the sample. However,
unlike in the case of the USD/EUR, volatility
increased somewhat between 1998 and 2002
(see Chart 3b).
Turning to volatility expectations as captured
by options prices, there is some evidence that
implied volatility on major euro exchange
rates declined somewhat over the past decade,
but started to increase again from late 2006
(see Chart 4). Taken together, one could
argue that exchange rate volatility may have
declined somewhat over the past decade, as
the conditional variance estimates also show a
slight decline during this period. This decline
in volatility could be an indication of smaller
exchange rate shocks. In principle, this could
lead to a reduced responsiveness of the economy
to exchange rate shocks if non-linearities are
important, with larger shocks having a more
signifi cant impact. However, it seems that the
recent decline in volatility has not been strong
enough in terms of magnitude and duration to
be considered a major contributory factor to
exchange rate impacts. In any case, the decline
in volatility does not appear to have been a
permanent one, and volatility has increased
recently, together with concerns about a pick-up
in infl ation.
While exchange rate volatility has remained
broadly unchanged, the volatility in key
macroeconomic variables has declined
somewhat in recent decades, possibly indicating
a certain disconnect between developments in
the exchange rate and its impact on the overall
economy (see Chart 5).
Traditionally, the most important channel
through which the exchange rate affects
the economy is through its impact on trade
performance. Also in the case of trade fl ows,
despite signifi cant variations in the real
external value of the euro over the recent
years, export volumes have continued by
and large to expand at relatively robust
rates. While this certainly refl ects to a large
extent the buoyancy of foreign demand
directed towards the euro area, there may
also be some structural decoupling of trade
developments from exchange rate fl uctuations.
One important structural feature of euro area
trade developments is the declining trend
of the share of euro area exports in world
markets, which appears to be largely unrelated
to developments in price competitiveness
Chart 4 Implied volatility of USD/EUR and JPY/EUR
(1-month implied volatility; daily data)
0
2
4
6
8
10
12
14
16
18
20
0
2
4
6
8
10
12
14
16
18
20
1999 2000 2001 2002 2003 2004 2005 2006
USD/EUR
JPY/EUR
Source: Reuters.Note: Last observation refers to 30 May 2008.
Chart 5 HICP inflation and real GDP growth in the euro area
(annual change in percentages)
0
2
4
6
8
10
12
14
1981 1985 1989 1993 1997 2001
0
2
4
6
8
10
12
inflation (left-hand scale)
real GDP growth (right-hand scale)
-22005
Source: WEO (IMF).

13ECB
Occasional Paper No 94
September 2008
1 EURO EXCHANGE RATE
AND GLOBALISATION:
STYLISED FACTS
(see Chart 6). Instead, it seems to be related
to a large extent to the emergence of large
and fast-growing, low-cost producers, above
all China.
The link between exchange rate changes and
trade fl ows may have also been affected by
changes in the pass-through of exchange rate
changes to trade prices. Chart 7 illustrates that
the link between the nominal exchange rates
and relative export prices is not one-to-one,
but that the swings in the latter are somewhat
less pronounced. This suggests that rather
than passing on changes in the exchange rate
to customers fully, exporters choose to absorb
some of these changes in their profi t margins,
thereby stabilising sales and market shares.
Against the background of greater competition,
especially from low-cost countries, and greater
substitutability between products and suppliers,
the pressures to absorb exchange rate changes
may have increased in a more globalised
economy, thereby weakening the link between
the exchange rate and euro area trade fl ows.
I.2 GLOBALISATION AND THE EURO AREA
Globalisation or increased global trade and
fi nancial integration has been one of the major
trends shaping the world economy over recent
years. On the real side, the ongoing globalisation
process has been characterised by signifi cant
changes in global trade patterns, with new
players from low-cost countries taking a more
prominent role. In addition, the international
fragmentation of the production process has
become a more widespread phenomenon, giving
rise to a signifi cant increase in the trading of
intermediate products. On the fi nancial side, the
global integration of capital markets has led to
an unprecedented increase in cross-border
holdings of asset and liabilities, with
international capital fl ows having increased
even faster than product trade. These changes
have, of course, also affected the euro area in
important ways, as the euro area economy has
become increasingly interconnected with its
external environment. A brief review of the
major features of this process may be helpful in
explaining possible changes in the role of the
exchange rate for the euro area economy.3
A more in-depth discussion of the impact of globalisation on the 3
euro area can, for example, be found in Baumann and di Mauro
(2006) and ECB (2008).
Chart 6 Relative export prices and euro area export market shares
(quarterly data)
115
110
105
100
95
90
85
80
75
120
115
110
105
100
95
90
85
80
75
120
export market share
relative export prices
1995 1997 1999 2001 2003 2005 2007
Source: ECB staff calculations.Notes: Last observation refers to Q3 2007. Relative export prices are defi ned as the ratio of euro area prices to competitors’ prices.
Chart 7 Euro exchange rate and relative export prices
(indices; Q1 1999=100)
115
110
105
100
95
90
85
80
115
110
105
100
95
90
85
801992 1994 1996 1998 2000 2002 2004 2006
relative export prices
NEER-24
Sources: Eurostat and ECB calculations.Notes: An increase indicates a loss. Last observation refers to Q1 2007.
14ECB
Occasional Paper No 94
September 2008
I.2.1 TRADE INTEGRATION
Increased global trade integration has
contributed to a steady increase in euro area
import penetration and increased shares of
exports in overall GDP. Euro area openness,
measured by the average combined value of
imports and exports of goods and services as
a fraction of GDP, increased by 5 percentage
points from 33% in late 1990s to 38% in the
mid-2000s.
This trend has largely resulted from stronger
trading ties with emerging market economies,
which have been rapidly integrated into the
global trading system. On the one hand, this has
led to increased demand for euro area products
from these countries, while on the other, it
represents an additional source of imports and
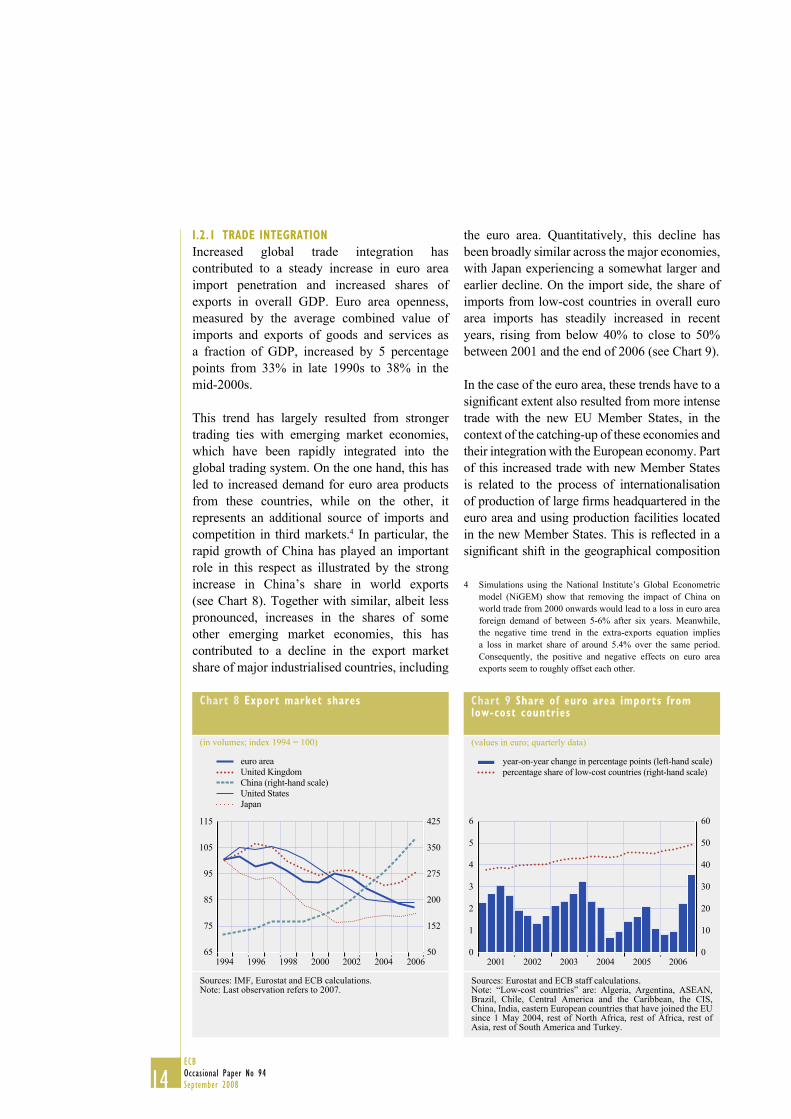
competition in third markets.4 In particular, the
rapid growth of China has played an important
role in this respect as illustrated by the strong
increase in China’s share in world exports
(see Chart 8). Together with similar, albeit less
pronounced, increases in the shares of some
other emerging market economies, this has
contributed to a decline in the export market
share of major industrialised countries, including
the euro area. Quantitatively, this decline has
been broadly similar across the major economies,
with Japan experiencing a somewhat larger and
earlier decline. On the import side, the share of
imports from low-cost countries in overall euro
area imports has steadily increased in recent
years, rising from below 40% to close to 50%
between 2001 and the end of 2006 (see Chart 9).
In the case of the euro area, these trends have to a
signifi cant extent also resulted from more intense
trade with the new EU Member States, in the
context of the catching-up of these economies and
their integration with the European economy. Part
of this increased trade with new Member States
is related to the process of internationalisation
of production of large fi rms headquartered in the
euro area and using production facilities located
in the new Member States. This is refl ected in a
signifi cant shift in the geographical composition
Simulations using the National Institute’s Global Econometric 4
model (NiGEM) show that removing the impact of China on
world trade from 2000 onwards would lead to a loss in euro area
foreign demand of between 5-6% after six years. Meanwhile,
the negative time trend in the extra-exports equation implies
a loss in market share of around 5.4% over the same period.
Consequently, the positive and negative effects on euro area
exports seem to roughly offset each other.
Chart 8 Export market shares
(in volumes; index 1994 = 100)
65
75
85
95
50
152
200
275
350
425115
105
Japan
United States
China (right-hand scale)
United Kingdom
euro area
1994 1996 1998 2000 2002 2004 2006
Sources: IMF, Eurostat and ECB calculations.Note: Last observation refers to 2007.
Chart 9 Share of euro area imports from low-cost countries
(values in euro; quarterly data)
0
1
2
3
4
5
6
0
10
20
30
40
50
60
2001 2002 2003 2004 2006
percentage share of low-cost countries (right-hand scale)
year-on-year change in percentage points (left-hand scale)
2005
Sources: Eurostat and ECB staff calculations.Note: “Low-cost countries” are: Algeria, Argentina, ASEAN, Brazil, Chile, Central America and the Caribbean, the CIS, China, India, eastern European countries that have joined the EU since 1 May 2004, rest of North Africa, rest of Africa, rest of Asia, rest of South America and Turkey.

15ECB
Occasional Paper No 94
September 2008
1 EURO EXCHANGE RATE
AND GLOBALISATION:
STYLISED FACTS
of euro area imports from traditional suppliers
in other industrialised countries to low-cost
countries, including the new Member States.
As a result, intra-euro area trade as a share of
total euro area manufacturing imports has fallen
by about 3 percentage points from 1995 to
2005, notwithstanding the trade-creating effect
induced by EMU. Charts 10 and 11 provide some
tentative evidence in support of this trade-creating
effect, showing that intra-euro area imports
and exports have generally grown faster than
trade with the United Kingdom, Denmark and
Sweden – the “old” non-euro area EU Member
States. The simultaneous trade-creating effects
of EMU and possibly trade-diverting effects of
globalisation, of course, potentially complicate
the assessment of the link between exchange rates
and globalisation.
In general, the internationalisation of production
has led to an increase in the import content
of euro area exports and thus a reduction in
the domestic value added content of exports.5
This has also been refl ected in an increase
in the correlation between euro area imports
and exports in recent years. In the presence of
declining domestic value-added per unit of
exports, the link between export growth and
overall GDP growth may be weakened. In fact,
the magnitude of euro area net trade contribution
to annual growth has declined over the past ten
years, as shown in ECB (2005).
The impact of the abovementioned changes in
trade patterns on euro area import prices, at the
aggregate level, is ambiguous. On the one hand,
the emergence of new players in global trade
stimulates global demand, putting upward
pressure on prices, in particular, on commodities
prices. On the other, increased imports of both
intermediate and fi nal goods from low-cost
countries may moderate import price pressures,
estimated at the ECB at around 2 percentage
points per year on average over the period
1996-2005.6 During the catching-up period, the
moderating effect on costs may also come from
increased international competition in product
and labour markets, which moderates wage
demand and limits the pricing power of
domestic fi rms.
At the country level, the rise in the import content of exports has 5
been particularly strong for Germany, from 31% in 1995 to 43%
in 2000. See also ECB (2005).
See European Central Bank, article entitled “Globalisation, trade 6
and the euro area macroeconomy“, in the January 2008 issue of
the ECB’s Monthly Bulletin.
Chart 10 Euro area export growth – intra-euro area exports and euro area exports to selected EU Member States
(year-on-year growth rates)
-5 -5
0 0
5
10
15
20
5
10
15
20
intra-euro area exports of goodseuro area exports of goods to DK, SE and UK
1997 1998 1999 2000 2001 2002 2003 2004 2005 2006 2007
Source: ECB.
Chart 11 Euro area import growth – intra-euro area imports and euro area imports from selected EU Member states
(year-on-year growth rates)
-5
0
5
10
15
20
25
-5
0
5
10
15
20
25
intra-euro area imports of goodseuro area imports of goods to DK, SE and UK
1997 1998 1999 2000 2001 2002 2003 2004 2005 2006 2007
Source: ECB.

16ECB
Occasional Paper No 94
September 2008
I.2.2 FINANCIAL INTEGRATION
In addition to the real integration of economies
in world trade, the wave of fi nancial integration
over recent decades, triggered by the gradual
dismantling of Bretton Woods-inherited
restrictions on international capital mobility
and a decline in information processing and
dissemination costs, has been another important
feature of the ongoing globalisation process that
has signifi cantly affected the euro area.
The euro area provides more than one-third of
the world’s stock of foreign direct investment
(FDI). At the same time, almost one-third of
world FDI is invested in euro area Member
States. At the same time, intra-euro area FDI
stocks have grown robustly, increasing from
almost 14% of euro area GDP in 1999 to around
24% by 2004, refl ecting increased intra-euro
area fi nancial integration. Extra-euro area
outward FDI stocks have also grown rapidly,
increasing from 22% to 30% of euro area GDP
between 1999 and 2004.
A commonly used measure of fi nancial
integration, the ratio of euro area foreign assets
(including intra-European cross holdings)
relative to GDP has quadrupled since the
beginning of the 1990s, outpacing the
corresponding increases in the United States
and Japan. On the liabilities side, the euro area
position has even increased fi vefold over the same
period. As Chart 12 shows, the stocks of euro
area foreign assets and liabilities as a percentage
of GDP have substantially increased for all asset
classes, with particularly large increases in the
case of foreign direct investment.
A more detailed analysis shows that, horizontal
FDI fl ows, i.e. the acquisition of new technologies
through mergers and acquisitions mainly in
the United States and the United Kingdom,
have accounted for a substantial part of total
extra-euro area FDI fl ows from the mid-
1990s onwards. At the same time, outward
vertical FDI fl ows from the euro area, which
are aimed at enhancing competitiveness by
exploiting factor-cost differences across
geographical locations, are mainly directed
to the central and eastern European countries
(CEECs). Overall, however, the share of
the new EU Member States in outward FDI
fl ows is relatively low, accounting for around
5% of overall outward FDI fl ows in 2003.
Chart 12 Euro area foreign assets and liabilities
(percentage of GDP)
1999
2006
(a) Assets (b) Liabilities
45
30
15
0
45
30
15
0FDI Equity Fixed
income
Loans/
Deposits
45
30
15
0
45
30
15
0FDI Equity Fixed
income
Loans/
Deposits
Source: ECB calculations based on Balance of Payments data.Note: Foreign assets and liabilities do not include intra-euro area holdings.

17ECB
Occasional Paper No 94
September 2008
1 EURO EXCHANGE RATE
AND GLOBALISATION:
STYLISED FACTSThis compares with shares of around 23% in the
case of euro area FDI fl ows to the United States
and United Kingdom.
Increased fi nancial integration together with
reduced information and communication costs
are generally believed to have led to a reduction
in the costs of fi nancial hedging of exchange
rate exposure by fi nancial and non-fi nancial
corporations. In addition, the increasing
internationalisation of the production base of
many multinational companies has resulted in
enhanced possibilities for real hedging through
shifts in the geographical structure of
production. Overall, a number of studies suggest
that economies of scale may be important in the
case of fi nancial and real hedging. As a
consequence, globalisation – through the
emergence of large multinational corporations –
may have been paralleled by more extensive
hedging of exchange rate exposure.7 Increased
hedging could have important implications for
the impact of exchange rate changes. Although
it might not reduce the overall impact, it may
result in a signifi cantly delayed response of
prices and trade volumes, as fi rms’ profi ts are
initially sheltered to a greater extent by
fl uctuations in exchange rates. The empirical
evidence regarding fi rms’ hedging behaviour is
rather limited, especially with respect to euro
area companies. Overall, turnover in global
foreign exchange markets, in both the traditional
and the over-the-counter derivatives segments,
has expanded rapidly over the past decade,
rising, in fact, faster than world trade, in
particular, from 2001 onwards. While some of
this increase may be related to non-commercial
trading motives, it is also likely to refl ect to
some extent increased hedging by fi rms at a
global level. Döhring (2008) provides evidence
that euro area exporters make ample use of
hedging strategies to limit the adverse impact
of exchange rate fl uctuations.
At the same time, one needs to take into account
that globalisation is also likely to have brought
about greater exchange rate exposure as a
larger share of fi rms’ sales and purchases are
international rather than domestic. In the case of
European fi rms, the introduction of the euro and
the associated elimination of various bilateral
exchange rates may have at the same time
reduced the overall exposure to exchange rate
fl uctuations. Bartram, Karolyi and Kleimeier
(2002) show that this has been the case for fi rms
with a large fraction of sales in the euro area.
More generally, Muller and Verschoor (2006)
fi nd that between 13% and 22% of a sample of
European multinational fi rms had signifi cant
exposure to the main currencies. While
short-term exposure seems to be generally
relatively well-hedged, the authors provide
evidence of considerable long-term exposure,
which is found to depend on fi rms’ size and
liquidity position. In a fi rm-level multi-country
sample from 1984 to 2003, Hutson and Stevenson
(2007) fi nd a strong positive relationship between
foreign exchange exposure and a country’s
economic openness, as measured by trade and
FDI, which holds true even after controlling
for fi rms’ size. Thus, the overall impact of
globalisation on fi rms’ responses to exchange
rate changes depends on the relative importance
of greater globalisation-related exposure and
more extensive use of hedging – real and
fi nancial. For a sample of French multinational
fi rms, Capstaff et al (2007) show that the decline
of risk exposure has been more pronounced than
the decline in the amounts hedged by French
multinational fi rms, suggesting that hedging of
existing exchange rate risk has increased.
I.3 THE EXCHANGE RATE AND EURO AREA
GROWTH 8
Increased globalisation over the recent period is
likely to have resulted in a greater dependence of
the euro area economy on developments outside
the euro area. This section provides some model-
based evidence on the quantitative importance of
different external factors for euro area growth in
the period 1999-2007. As the exchange rate is one
of these external factors, it allows an assessment
of the relative importance of exchange rate
See, for example, Bodnar, Hayt and Marston (1998) and 7
Chow, Lee, and Solt (1997).
This section has benefi ted from contributions by Jose E. Gumiel, 8
European Central Bank.

18ECB
Occasional Paper No 94
September 2008
movements. In addition, the section analyses the
correlation between the euro exchange rate and
growth in order to assess the role of the exchange
rate as an automatic stabiliser.
The ECB’s Area-Wide Model (AWM) 9 is used
to assess the impact of a number of external
variables for euro area real GDP growth in the
period 1999-2006. Concretely, the effect of
foreign demand, competitors’ export prices in
foreign currency, the nominal effective exchange
rate of the euro and the price of oil in foreign
currency are analysed. The model also takes into
account dynamic interactions between the
different exogenous variables. For example, it
considers that large swings in the exchange rate
may reverberate through other variables of the
external environment, in particular, through
competitors’ export prices and, to a lesser extent,
oil prices, to ultimately affect euro area GDP.10
Overall, the simulation suggests that the euro
effective exchange rate had a positive impact
on euro area GDP growth over the period
1999-2001, adding to the positive impact
of foreign demand, which more than offset
the negative impact of oil price increases
and changes in competitors’ export prices
(see Chart 13). Conversely, at the early stages
of the euro area recovery in 2003, the external
environment of the euro area had a negative
impact on euro area GDP, as the positive impact
of the rise in foreign demand was more than
offset by the negative impacts of the price of
oil and the euro exchange rate appreciation.11
For the period as a whole, the effect of the
euro exchange rate was broadly neutral, as the
positive initial impact was offset in the latter
part of the sample (see Table 1). Although the
exchange rate has at times had a relatively large
impact on euro area growth, other external
factors generally outweighed the effect of
exchange rate changes, with foreign demand
developments being the most important driver.
The Area Wide Model (AWM) is a structural macroeconomic 9
model of the euro area economy (see Fagan, Henry and Mestre
(2005)). The model treats the euro area as a single economy.
The main exchange rate channel is through import prices and
the energy component of the HICP. It allows for second-round
effects of exchange rate changes, i.e. the effect of import prices
via wages, unit labour costs, and competitiveness on domestic
prices, also allowing for substitution between domestic and
imported goods.
In the AWM, an adverse change in the euro effective exchange 10
rate leads to a decrease in foreign competitor prices in euro terms
and affects the economy through two channels that operate in
opposite directions. The fi rst one is the substitution effect on
imports and exports of an effective exchange appreciation,
which reduces net trade and GDP (under the assumption of no
wealth effects from the exchange rate movement). The second
effect works through lower imported infl ation, which raises real
income for consumers and puts downward pressure on the cost
of intermediate products for corporations. This effect dampens
the fi rst contractionary impact through trade. However, overall,
lower foreign prices have a negative spillover to economic
activity in the AWM model.
It has also been argued that the swings in the dollar effective
exchange rate may play an important role in explaining the
variations in the price of oil that further affect GDP growth in the
euro area. On one hand, a falling dollar, for instance, increases
demand outside the United States more than it decreases demand
in the United States, and drives up prices. Commodity exporters
may also raise prices in order to offset the loss, in domestic
currency, on their dollar-based export sales. However, the swings
in oil price have often surpassed the exchange rate movements
and also, the long-run elasticity of the price of commodities to
exchange rate is almost 1, suggesting that some other factors,
rather than the exchange rate, are responsible for the evolution
of oil prices.
For a more general discussion of the linkages between the euro 11
area and its external environment see, for example, Anderton and
di Mauro (2007).
Chart 13 Impact of the external environment on euro area GDP
(year-on-year growth rate and contributions; in percentage points)
-2
1999 2000 2001 2002 2003 2004 2005 2006
-1
0
1
2
3
4
5
foreign demand
oil price (USD)
euro effective exhange rate
competitors’ export prices; (foreign currency)
euro area GDP
-2
-1
0
1
2
3
4
5
Source: ECB staff calculations using the AWM. See also G. Fagan, J. Henry and R. Mestre (2005).

19ECB
Occasional Paper No 94
September 2008
1 EURO EXCHANGE RATE
AND GLOBALISATION:
STYLISED FACTS
A related issue is whether the exchange rate acts
as an automatic cyclical stabiliser or whether
it rather tends to amplify business cycles. The
correlation of the exchange rate with cyclical
GDP growth, i.e. the counter or pro-cyclicality
of the exchange rate, depends on the nature of
the shocks driving the exchange rate movements.
If exchange rate variations are related to trade
balance developments, then the exchange rate
may act as an amplifi er, with a pro-cyclical
impact on activity, in the case that the trade
balance is driven by domestic developments.
The deterioration in the trade balance brought
about by a pick-up in domestic activity
triggers a depreciation of the exchange rate in
order to restore external equilibrium, thereby
providing additional stimulus. Conversely,
if the deterioration in the trade balance is the
result of a slowdown in growth abroad, the
exchange rate would act as a shock absorber, as
the depreciation would tend to offset some of
the decline in foreign demand. Similarly, if the
exchange rate movements were mainly driven
by interest rate differentials, then, the exchange
rate is more likely to be counter-cyclical, as the
increase in interest rates associated with a boom
may trigger an exchange rate appreciation.12
Chart 14 illustrates the evolution of the
30-quarter rolling correlation coeffi cient
between the cyclical components of the real
effective exchange rate and real GDP, obtained
by using HP-fi ltered series. The results indicate
that the correlation between the euro exchange
rate and euro area growth is relatively large
and negative, suggesting that, in the 2000s,
the exchange rate has been pro-cyclical rather
than counter-cyclical for the euro area. This
correlation appears to have been fairly stable
over recent years. In comparison, the correlation
in the case of the United States is also negative,
but much lower in absolute terms.
I.4 MEASURING EFFECTIVE EXCHANGE RATES IN
A GLOBALISED WORLD 13
It is obvious that, given the globalisation-
driven structural changes presented so far, the
way in which exchange rate movements are
analysed and their impact on the economy may
have to be reconsidered. In particular,
globalisation may have altered the information
content of the traditionally used trade-weighted
real effective exchange rate (REER) indices or
the benchmarks against which they are
evaluated. The offi cial real effective exchange
rate index of the ECB is based on infrequently
updated weights of individual countries in euro
area manufacturing trade, taking into account
third market competition effects through double
export weights.14 With increased globalisation
and rapidly shifting trade compositions, a more
frequent updating of weights might be
See Kaminsky, Reinhart and Végh (2004).12
This section has benefi ted from contributions by Chiara Osbat.13
For a detailed description of the ECB methodology see, for 14
example, Buldorini, Makrydakis and Thimann (2002).
Chart 14 Evolution of the correlation coefficients between the cyclical components of the real effective exchange rate and real GDP
(euro area versus the United States)
-1.0
-0.9
-0.8
-0.7
-0.6
-0.5
-0.4
-0.3
-0.2
-0.1
0.0
-1.0
-0.9
-0.8
-0.7
-0.6
-0.5
-0.4
-0.3
-0.2
-0.1
0.0
euro area
United States
2002 2003 2004 2005 2006
Source: ECB staff calculations.Notes: 30-quarter rolling correlation; cyclical components extracted via the HP fi lter. An increase in the exchange rate implies an appreciation. Thus a negative correlation coeffi cients implies a pro-cyclical behaviour of exchange rates, as the exchange rate depreciates when growth is strong and vice versa.
Table 1 Contribution of the external environment to euro area GDP growth
Average2000-2006
World (extra-euro area) real GDP growth 0.8
Change in oil prices in US dollars -0.2
Change in the nominal effective
exchange rate of the euro 0.0
Change in competitors’ export prices 0.1
TOTAL 0.6

20ECB
Occasional Paper No 94
September 2008
necessary to capture signifi cant shifts in the
regional trade structure and to provide a useful
description of developments in price
competitiveness. Furthermore, the improved
tradeability of services may imply that a focus
on manufacturing trade may be too narrow, and
the increasing internationalisation of the
production process may imply that countries
with a low domestic value-added content of
exports are over-represented in the traditionally-
measured REER index. A comparison of the
traditional REER index with alternative
measures resulting from a number of
adjustments capturing these globalisation-
related structural changes provides an
assessment of the quantitative importance of
such factors.15
In order to capture globalisation-induced
changes in the geographical composition of
trade, a fi rst exercise consists of computing the
REER using quarterly time-varying weights
over the entire period for which data is available
for the 24 important euro area trade partners,
that is from the fi rst quarter of 1993 to the fourth
quarter of 2006. A comparison with the index
using the offi cial updating frequency shows that
the impact of these changes is relatively limited,
with differences emerging mainly at the end
of the sample (see Chart 15). The maximum
deviation between the two series that could
hypothetically be observed, depending on the
choice of base period is about 4% for the whole
sample period.
Chart 16 illustrates how changes in the
geographical structure of euro area trade have
affected individual country weights for the
calculation of the euro effective exchange rate.
The largest change in weights can be observed
for China, with the weight doubling from
7% on average in 1999-2001 to 15% in 2006.
At the same time, the weight of the CEECs
also increased considerably. In particular,
the shares of the Czech Republic and Poland
have risen from 2.5% to more than 4% at the
expense of the traditional main trading partners
of the euro area, such as the United States, the
United Kingdom and Japan. The use of less
frequently updated weights may therefore
The analysis is limited to CPI-based REER indices. While 15
there are several other measures of international cost and price
competitiveness available, Ca’Zorzi and Schnatz (2007) show
that these alternative measures display similar forecasting
properties for euro area exports.
Chart 15 Evolution of the euro real effective exchange rate – ECB weights versus time-varying weights
(index; Q1 1999 = 100; 24 trading partners; daily data)
120
REER-24 changing weights
REER-24 1995-1997 1999-2001 weights
115
110
105
100
95
90
85
801993 1995 1997 1999 2001 2003 2005
120
115
110
105
100
95
90
85
80
Source: ECB staff calculations.Notes: Based on internal calculations of weights, excluding domestic production. Weights may therefore differ from the offi cial EER weights published by the ECB.
Chart 16 Weights in the REER-24
(percentage)
Sweden
Canada
China
Japan
UK
US1
2
3
4
5
6 Czech Rep.
Denmark
Korea
Hongkong
Norway
Switzerland7
8
9
10
11
12 Romania
Slovakia
Australia
Hungary
Singapore
Poland13
14
15
16
17
18
1995-1997
1999-2001
2006
01 2 3 4 5 6 7 8 9 10 11 12 13 14 15 16 17 18
5
10
15
20
25
0
5
10
15
20
25
Source: ECB staff calculations.Notes: Based on internal calculations of weights, excluding domestic production. Weights may therefore differ from the offi cial EER weights published by the ECB.

21ECB
Occasional Paper No 94
September 2008
1 EURO EXCHANGE RATE
AND GLOBALISATION:
STYLISED FACTS
lead to an overestimation of the exchange rate
appreciation over the most recent period, as the
share of currencies against which the euro has
appreciated strongly, such as the US dollar and
the Japanese yen, has decreased (partly offset by
the increased share of China), whereas countries
with a stronger currency (especially some of the
new Member States) have increased their share
in overall trade.
Given increased globalisation and the
emergence of new trading partners with trading
patterns that are often very different from those
of the euro area, the assessment of third market
effects (i.e. the fact that euro area exporters in
foreign markets also face competition from
third countries’ exporters) may also have to take
into account the sectoral composition of trade.
For instance, euro area exports are concentrated
in medium high-technology industries
(accounting for roughly 40% of overall exports,
see Chart 17) and low-technology industries
(25%). In contrast, China’s main export
specialisation consists of low-tech (38%) and
high-tech (26%) industries, while CEECs’
exports are more concentrated in low-tech (35%)
and medium high-tech (35%) industries.
A two-stage weighting can capture some of
these sectoral heterogeneities, which potentially
distort the information content of the REER.
According to this method, in a fi rst step,
traditional trade weights are computed at a
sectoral level. These sector-specifi c weights are
then aggregated, based on the weights of each
sector in countries’ overall manufacturing
trade.16 A comparison of a triple-weighted
REER index constructed in this way with the
traditional double-weighted index shows that
the maximum deviation between the two
indicators is only around half a percent in the
case of the euro. Thus, this effect appears to be
quantitatively relatively small in the case of the
euro area as a whole. However, at the level of
individual euro area countries, more signifi cant
differences may emerge, as illustrated on
Chart 18. For example, while the overall euro
area trade weight of China is broadly the same
for the two measures, it is signifi cantly higher
under triple-weighting in the case of Italy,
Portugal, Greece and Finland, refl ecting the
greater similarity in the sectoral trade structure
of these countries with that of China.
See also Esteves and Reis (2006).16
Chart 17 Share of different product categories in overall exports
(percentage; average 2000-2003)
0
5
10
15
20
25
30
35
40
45
0
5
10
15
20
25
30
35
40
45
High-
technology
industries
Medium-high-
technology
industries
Medium-low-
technology
industries
Low-
technology
industries
euro area
CEECsChina
Source: ECB staff calculations based on Chelem database.Note: For sectoral defi nition of categories see ECB Occasional Paper No. 55.
Chart 18 Double and triple-weighted REER weights of China
(percentage; based on 2004 trade)
0
2
4
6
8
10
12
14
1 Finland
2 Belgium
3 Germany
4 Luxembourg
5 euro area
6 France
7 Italy
8 Austria
9 Spain
10 Portugal
11 Netherlands12 Ireland13 Greece
16
0
2
4
6
8
10
12
14
16
1 2 3 4 5 6 7 8 9 10 11 12 13
double-weighted EER
triple-weighted EER
Sources: Banco de Portugal and ECB staff calculations.Note: The calculations are based on weights for a subset of the 24 currencies usually included in the REER calculation. The currencies of Australia, Cyprus, Estonia, Latvia, Lithuania and Malta are omitted.

22ECB
Occasional Paper No 94
September 2008
Another salient feature of the ongoing process
of globalisation has been the increased
tradability of services. Consistent with this
trend, the assessment of euro area’s price
and cost competitiveness should also refl ect
developments in services trade, especially if
service-based weights are very different from
weights based exclusively on manufacturing
trade. To highlight potential differences in the
geographical structure of trade in manufacturing
goods and in services, an alternative REER is
calculated using services trade only. Chart 19
compares the traditional REER weights and the
service trade-based REER weights for the euro.17
The importance of some of the traditional main
trade partners of the euro area like the United
States, the United Kingdom and Switzerland
tends to be underestimated when taking into
account goods trade only in the computation of
individual currencies’ weights. In contrast, the
weights of China and the CEECs are lower in
the case of the service-based REER, refl ecting
the fact that these countries have a comparative
advantage in the production of manufactured
goods.
The increased cross-border segmentation of the
production process, with trade in intermediate
goods on a rapidly increasing trend, is another
relevant feature of the ongoing process of real
integration. An important implication of this
process is that the domestically produced
value-added contained in a country’s exports
may be signifi cantly below the overall value of
exports on which trade weights are traditionally
based. Since the effect of an exchange rate
change on the price competitiveness of a
country’s exports is largely restricted to the
domestic value added part, the traditional REER
measure is likely to give too high a weight to
those countries which use a higher than average
share of imported intermediate products in the
production of exports. Therefore an alternative
measure is constructed based on the domestic
value added content of exports. For this purpose,
the import content of intermediate consumption
from the OECD input-output table for the
year 2000 is used as a proxy for the share of
imported goods in overall exports.18
The resulting weights, computed by applying
the abovementioned measures of domestic value
Weights based on manufacturing trade exclude third market effect 17
in order to make them comparable to the service trade weights for
which no estimates of third market effects exist to date.
See Yamano and Ahmad (2006).18
Chart 19 Manufacturing-based versus service-based trade weights
(index; Q1 1999; 24 trading partners; quarterly data)
0.00
0.10
0.20
0.30
0.40
0.00
0.10
0.20
0.30
0.40
1 United Kingdom2 United States
3 Switzerland
4 Japan5 China6 Sweden
7 Poland8 Hungary9 Czech Republic
1 2 3 4 5 6 7 8 9
EER 24 weights w/o 3rd market effect
EER 24 Service weight
Source: ECB staff calculations.
Chart 20 Official weights versus weights based on domestic value-added content of exports
(percentage)
0
5
10
15
20
25
30
0
5
10
15
20
25
30
1 United States2 United Kingdom3 Japan4 China5 Switzerland6 Sweden
7 Poland
8 Korea
9 Czech Republic
10 Hungary
11 Denmark
12 Hong Kong
13 Canada
14 Singapore
15 Norway
16 Slovakia
17 Australia
official ECB weights
value-added weights
1 2 3 4 5 6 7 8 9 10 11 12 13 14 15 16 17
Source: ECB staff calculations.
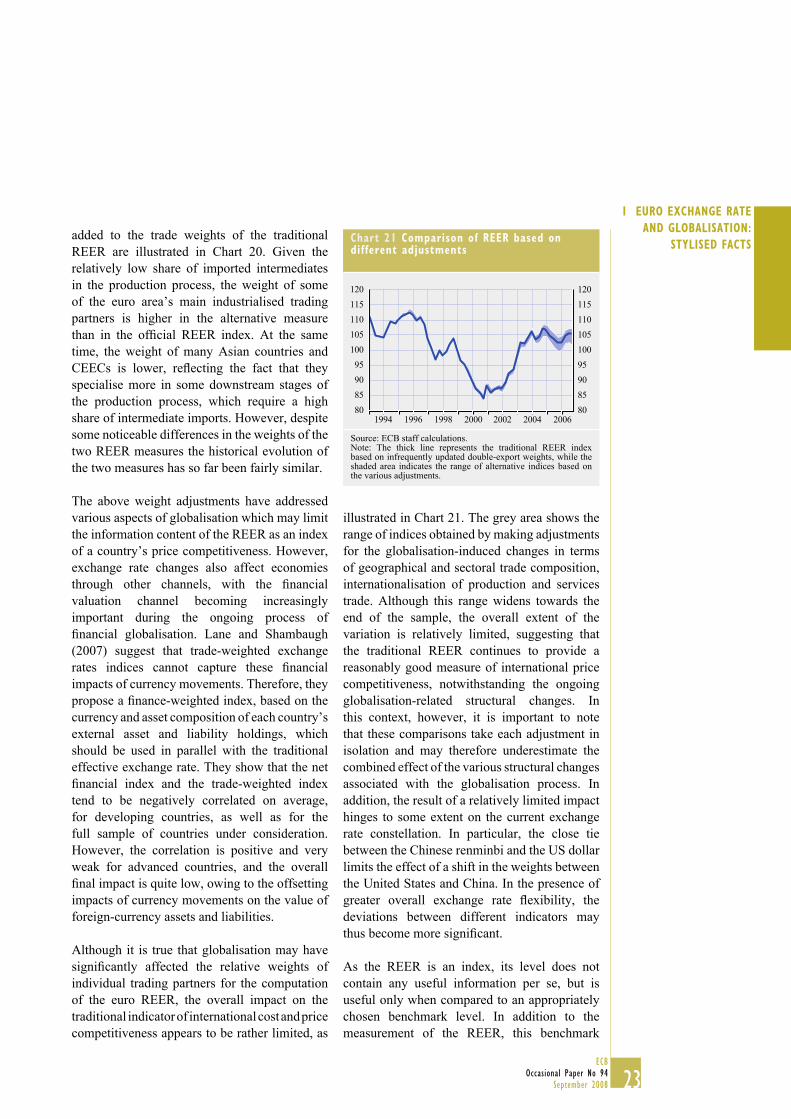
23ECB
Occasional Paper No 94
September 2008
1 EURO EXCHANGE RATE
AND GLOBALISATION:
STYLISED FACTSadded to the trade weights of the traditional
REER are illustrated in Chart 20. Given the
relatively low share of imported intermediates
in the production process, the weight of some
of the euro area’s main industrialised trading
partners is higher in the alternative measure
than in the offi cial REER index. At the same
time, the weight of many Asian countries and
CEECs is lower, refl ecting the fact that they
specialise more in some downstream stages of
the production process, which require a high
share of intermediate imports. However, despite
some noticeable differences in the weights of the
two REER measures the historical evolution of
the two measures has so far been fairly similar.
The above weight adjustments have addressed
various aspects of globalisation which may limit
the information content of the REER as an index
of a country’s price competitiveness. However,
exchange rate changes also affect economies
through other channels, with the fi nancial
valuation channel becoming increasingly
important during the ongoing process of
fi nancial globalisation. Lane and Shambaugh
(2007) suggest that trade-weighted exchange
rates indices cannot capture these fi nancial
impacts of currency movements. Therefore, they
propose a fi nance-weighted index, based on the
currency and asset composition of each country’s
external asset and liability holdings, which
should be used in parallel with the traditional
effective exchange rate. They show that the net
fi nancial index and the trade-weighted index
tend to be negatively correlated on average,
for developing countries, as well as for the
full sample of countries under consideration.
However, the correlation is positive and very
weak for advanced countries, and the overall
fi nal impact is quite low, owing to the offsetting
impacts of currency movements on the value of
foreign-currency assets and liabilities.
Although it is true that globalisation may have
signifi cantly affected the relative weights of
individual trading partners for the computation
of the euro REER, the overall impact on the
traditional indicator of international cost and price
competitiveness appears to be rather limited, as
illustrated in Chart 21. The grey area shows the
range of indices obtained by making adjustments
for the globalisation-induced changes in terms
of geographical and sectoral trade composition,
internationalisation of production and services
trade. Although this range widens towards the
end of the sample, the overall extent of the
variation is relatively limited, suggesting that
the traditional REER continues to provide a
reasonably good measure of international price
competitiveness, notwithstanding the ongoing
globalisation-related structural changes. In
this context, however, it is important to note
that these comparisons take each adjustment in
isolation and may therefore underestimate the
combined effect of the various structural changes
associated with the globalisation process. In
addition, the result of a relatively limited impact
hinges to some extent on the current exchange
rate constellation. In particular, the close tie
between the Chinese renminbi and the US dollar
limits the effect of a shift in the weights between
the United States and China. In the presence of
greater overall exchange rate fl exibility, the
deviations between different indicators may
thus become more signifi cant.
As the REER is an index, its level does not
contain any useful information per se, but is
useful only when compared to an appropriately
chosen benchmark level. In addition to the
measurement of the REER, this benchmark
Chart 21 Comparison of REER based on different adjustments
120
115
110
105
100
95
90
85
80
120
115
110
105
100
95
90
85
801994 1996 1998 2000 2002 2004 2006
Source: ECB staff calculations.Note: The thick line represents the traditional REER index based on infrequently updated double-export weights, while the shaded area indicates the range of alternative indices based on the various adjustments.

24ECB
Occasional Paper No 94
September 2008
may itself be affected by the structural changes
related to globalisation.
One of the most commonly used benchmarks
for assessing the level of price competitiveness
at any given time is the long-term average of
the REER. The underlying rationale for using
such averages is the assumed validity of relative
purchasing power parity (PPP). Relative PPP
implies that the nominal exchange rate offsets
in the medium to long-term any changes in price
competitiveness brought about by differences in
infl ation rates between two economies. Thus, in
the medium to long-run, the real exchange rate
reverts towards a constant equilibrium value.
This constant equilibrium may be approximated
by the observed average of the real exchange
rate over a suffi ciently long period assuming that
positive and negative shocks to this equilibrium
relationship more or less offset each other. As
shown above (see Chart 2), at the end of 2007,
the CPI-defl ated REER of the euro was around
16% stronger than its long-term average.
A similar assessment would be achieved if
absolute PPP is used instead of relative PPP
as a benchmark. In the fi rst quarter of 2007,
the REER of the euro was somewhat less than
10% stronger than the absolute PPP benchmark
(see Chart 22). On a bilateral basis, the
US dollar and the Japanese yen contributed most
to this deviation, with the contributions from the
Chinese renminbi and other Asian currencies
being much smaller. At the same time, the
pound sterling and the currencies of the new
EU Member States contributed negatively to the
deviation of the PPP-based REER-24 from its
1993-2007 average.
A well-known limitation of absolute and
relative PPP is that it fails to take into account
changes in the relative price of non-tradeable
goods for which international arbitrage
does not ensure that prices are equalised
internationally. One of the factors that may give
rise to such a divergence in the relative price of
non-tradeables, are differential rates of
productivity growth between countries and
sectors – the so-called Balassa-Samuelson
effect. This shortcoming might be particularly
important in the context of the ongoing
globalisation process, which is associated with
the rapid catching-up of low-income countries
through a progressive reduction in productivity
differentials. The Balassa-Samuelson effect
would imply a trend equilibrium depreciation
of the euro vis-à-vis the currencies of the
catching-up economies, a depreciation which
should not be fully interpreted as a gain in
international price competitiveness, as it is
mainly concentrated in the prices of goods which
are non-tradeable. Under those circumstances,
the use of long-term averages may thus lead to
the underestimation of a potential overvaluation
or to an overestimate of a possible undervaluation
of the REER of the euro.
Chart 22 Deviation of euro PPP-based REER-24 from 1993-2007 average
(data refer to Q1 2007; weighted contributions in percentages)
20
15
10
5
0
-51 2 3 4 5 6 7 8 9 10
20
15
10
5
0
-5
USD1
2
3
4
5
6
7
8
9
10
GBP
CHF
DK, NO, SE
NMS
JPY
CNY
Other Asian
Other
Total
Source: ECB staff calculations.

25
2 EXCHANGE RATES
AND PRICES
ECB
Occasional Paper No 94
September 2008
2 EXCHANGE RATES AND PRICES
One of the major channels through which the
exchange rate traditionally affects economic
performance is through its impact on prices. The
main direct effect occurs through the impact on
import prices, which further reverberates along
the pricing chain to consumer prices. These
price changes give rise to important indirect
and second-round effects through their impact
on real incomes, consumer spending and trade
fl ows, with feedback effects on overall price
pressures.
Before turning to the issue of whether the
relationship between exchange rates and prices
has changed as a result of globalisation, the
chapter provides some general quantitative
information about the impact of an exchange
rate shock on euro area prices, drawing on the
results from models used at the ECB. The second
section focuses on the response of the pricing
behaviour of euro area exporters to changes in
the exchange rate and investigates whether there
have been signifi cant changes in the pricing-to-
market behaviour of exporters in recent years.
The third section is devoted to the ERPT to
import prices and uses standard trade equations
and the area-wide model (AWM) of the ECB to
assess its evolution over time. In addition, the
section provides some evidence on sector-level
differences in ERPT to euro area import prices
and investigates the role of such differences in
explaining changes in aggregate ERPT. The last
section investigates the impact of globalisation
on the relationship between exchange rates and
consumer price infl ation based on the results of a
panel VAR estimation and simulation evidence
from the AWM.
Overall, the chapter shows that the impact of
increased globalisation on the relationship
between the exchange rate and prices is rather
mixed at the aggregate level for import prices.
The empirical results suggest a decline in the
ERPT to consumer price infl ation in some euro
area countries, in particular, for Germany and,
to a lesser extent, for France and Italy. Some
tentative evidence for such a decline in the
ERPT to HICP infl ation is also provided by
simulations using the AWM. These changes in
the pass-through may in part be explained by
shifts in the industry composition of euro area
imports, as the share of imports in sectors with
a relatively low pass-through has increased
over time.
2.1 THE LINK BETWEEN EXCHANGE RATES AND
PRICES – MODEL-BASED EVIDENCE
In order to provide an initial quantitative
assessment of the importance of exchange rate
shocks for euro area prices, this section presents
some model simulation results. Concretely, the
analysis draws on two models used at the ECB:
the AWM and the Global VAR (GVAR).19 With
both models, the effect of a 10% uniform
appreciation of the euro against all other
currencies is simulated.
The GVAR is a global model developed in Dées, di Mauro, 19
Pesaran and Smith (2005). It covers the period 1979-2005 and
includes 26 countries/regions. It comprises country-specifi c
models that relate the core variables of each economy to those in
the rest of the world. By providing a framework that is capable
of accounting for trade and fi nancial transmission channels,
the GVAR model is particularly suitable for analysing the
transmission of real and fi nancial shocks across countries and
regions. The transmission of shocks takes place not only through
trade, but also through interest rates, exchange rates and equity
prices. Thus, a real shock directly affecting trade fl ows is also
propagated through changes in various asset prices, in turn,
generating spillover effects on real variables. See also Dees,
Holly, Pesaran and Smith (2007).
Table 2 Impact of a 10 percent appreciation of the NEER on prices
(annual averages)
Percentage deviation from baseline (cumulated)
Year 1 Year 2 Year 3
Import pricesAWM -3.3 -5.1 -5.4
Export pricesAWM -2.1 -3.4 -3.8
HICPAWM -0.3 -0.9 -1.4
GVAR -0.2 -0.5 -1.0
HICP excl. energyAWM -0.2 -0.8 -1.3
Source: ECB staff calculations.

26ECB
Occasional Paper No 94
September 2008
Following the order in the pricing chain, the
panel on the left-hand side of Table 2 shows
the effect of the appreciation on trade prices
and the panel on the right-hand side, shows its
effect on consumer prices during the three years
following the initial shock. The results suggest
that the degree of ERPT declines along the
pricing chain, with the estimated impact being
lower for consumer prices than for trade prices.
According to the AWM, the appreciation leads to
a decline in the annual rate of change of import
prices by 3.3 percentage points in the fi rst year
and by a further 1.7 percentage points in the
second year. After three years, the cumulated
impact of a 10% appreciation is -5.4% on the
level of import prices, which implies an estimated
pass-through to euro area import prices (in the
third year) of 54%, broadly in line with the results
of other studies for the euro area.20 Based on the
same model, the impact of the euro appreciation
on export prices amounts to -2.1% in the fi rst
year and -3.8% cumulated over three years.
These fi ndings suggest that euro area exporters
lower their prices in euro in an effort to offset the
loss in price competitiveness (pricing-to-market
behaviour), although the export prices in foreign
currency nonetheless increase following the
appreciation.
As regards the impact of the exchange rate shock
on the euro area HICP, AWM and GVAR models
provide estimates of the pass-through to the
HICP after three years in the range of 10-14%.
These results are broadly consistent with the
literature, which suggests the pass-through to
consumer prices lies in the range of 8-20%.21
2.2 EXPORTERS’ BEHAVIOUR AND
PRICING-TO-MARKET 22
Higher market integration and the resulting
stiffer competition faced by exporters in
international markets are likely to affect their
pricing-to-market behaviour. On the one hand,
increased competitive pressures, for example
from low-cost countries, push producers to
adjust their mark-ups and move towards greater
local currency pricing strategies in order to limit
the negative volume effects. At the same time,
in an increasingly competitive environment,
the resulting general margin compression may
limit the ability of a reduction in profi t margins
to absorb adverse movements in the exchange
rate. The increased import content of exports
may also dampen the response of export
prices to an exchange rate change. Given these
partly offsetting factors, the overall impact of
globalisation on the link between export prices
and exchange rates remains an empirical issue.
In order to assess the evolution of exporters’
pricing behaviour empirically, a single-equation
standard model of export prices is estimated,
allowing for both short-term and long-term
effects via an error-correction mechanism. The
underlying idea is that export prices move in
line with both exporters’ costs and competitors’
prices, which can be written as follows, as an
error-correction equation (all variables are
in logarithms):
According to (1), the change in export prices
is a function of the deviation from long-run
equilibrium and short-term dynamics. The long-
run relationship is given by the expression in
brackets, with euro area export prices of goods
(xp) depending on domestic prices as captured by
producers prices (ppi) and on competitors’ export
prices in euro (cxp). In this long-run relationship,
price homogeneity is assumed, which implies
that a 10% increase in both competitors’ prices
and costs will also translate into a 10% increase
in export prices. This homogeneity is captured by
the fact that the coeffi cients for domestic costs and
for competitors’ prices add up to unity. The speed
of adjustment towards this long-run relationship
See Campa and Gonzales (2006), Anderton (2003) and 20
Ca’ Zorzi, Hahn and Sánchez (2007).
See for instance Gagnon and Ihrig (2001), Campa and Gonzales 21
(2006), Hahn (2003), Bailliu and Fujii (2004), Landolfo (2007).
This section has benefi ted from contributions from Katrin Forster, 22
European Central Bank.
∆xpt = α . (xpt-1 – β . cxpt-1
– (1– β) . ppit-1) + δ . ∆neert + λ . ∆ppit + vt (1)

27ECB
Occasional Paper No 94
September 2008
2 EXCHANGE RATES
AND PRICESis governed by the coeffi cient α. In the short run,
export prices dynamics are also determined by
changes in the nominal effective exchange rate
(NEER) and in producer prices. The long-run
pricing-to-market behaviour is captured by the
coeffi cient β which can be viewed as the long-
run elasticity of export prices to competitors’
export prices.
The econometric analysis is based on quarterly
data covering the period from the fi rst quarter of
1993 to the fi rst quarter of 2007. The competitors’
export prices are calculated using a double
weighting method, adjusting the shares of each
euro area market in total exports to account for
third-market effects. The model is estimated
recursively, for extra-euro export prices of goods
starting with an initial sample from the fi rst
quarter of 1993 to the fourth quarter of 1999,
adding at each step one further observation up to
the end of the sample period. The impact of
globalisation-related structural changes on
exporters’ pricing behaviour is refl ected in the
evolution of export price elasticities to changes in
competitors’ export prices.23
The estimation results indicate a long-run
coeffi cient on competitors’ export prices of 0.43
for the whole sample period, implying that the
loss (gain) in price competitiveness owing to a
real appreciation (depreciation) of the currency
is about one-half of the change in the exchange
rate. The other half of euro area export prices
is determined by domestic prices and costs.
Chart 23 illustrates the evolution of the pricing-
to-market coeffi cient resulting from the recursive
estimation of equation (1). Overall, the chart
suggests that the pricing behaviour of exporters
appears rather unchanged at the aggregate level.
This result may hide signifi cant differences in
the pricing-to-market behaviour of individual
euro area countries. For instance, in the case
of Germany, Stahn (2006b) fi nds evidence that
pricing-to-market behaviour among German
exporters has grown recently. This may also
have contributed to the downward trend in the
long-run price sensitivity of German exports to
euro area and to non-euro area countries since
the 1990s. The analysis of export volumes
elasticities to changes in relative export prices
across euro area countries, presented in the next
chapter, confi rms the presence of a large degree
of heterogeneity in exporters’ pricing behaviour
at the country level.
2.3 GLOBALISATION AND TIME-VARIABILITY OF
THE EXCHANGE RATE PASS-THROUGH TO
IMPORT PRICES
2.3.1 CONCEPTUAL CONSIDERATIONS
The pass-through of exchange rates to prices
at different stages of the pricing chain plays a
central role in understanding the links between
foreign prices, exchange rates and domestic
prices. It may provide an explanation for the
signifi cantly more muted price volatility,
compared with the volatility in nominal
exchange rates.
The structural changes associated with
globalisation may affect ERPT in various
ways, with the overall impact being a priori
ambiguous. On the one hand, the incentive to
defend foreign market shares through an active
pricing-to-market strategy may be reduced in an
environment of reduced trade costs and overall
The impact of structural changes could also be captured by the 23
inclusion of a trend variable.
Chart 23 Long-run coefficient on competitors’ export prices in the export price equation for goods
(Q1 1993 to Q1 2007; recursive estimation)
2000
2.0
1.5
1.0
0.5
0.0
-0.5
-1.0
-1.5
-2.0
-2.5
2.0
1.5
1.0
0.5
0.0
-0.5
-1.0
-1.5
-2.0
-2.52002 2004 2006
Source: ECB staff calculations.

28ECB
Occasional Paper No 94
September 2008
ERPT may thus be higher. More specifi cally,
lower sunk trading costs facilitate the entry
into and thus the exit from foreign markets.
Therefore in the case of an adverse exchange
rate movement, a company may choose to
temporarily exit the foreign markets rather
than reduce profi t margins in order to defend
its market presence, as it can easily re-enter the
export market if the exchange rate moves in a
more favourable direction.24 Moreover, stronger
competitive pressures from low-cost countries
cause producers’ average mark-ups to shrink.
As a consequence, the ability of exporters to
pursue pricing-to-market strategies through
variations in their mark-ups may be reduced,
at least in the case of an adverse exchange rate
movement, thereby contributing to an increase
in ERPT.
On the other hand, increased trade integration
may foster strategic complementarities in
exporters’ price-setting and eventually work
against the mechanism previously described.
In general, fi rms’ pricing decisions depend
not only on their own marginal costs, but also
on competitors’ prices. Exporters will fi nd
it optimal to lower their mark-up when the
currency appreciates, as this reduces the relative
price of competitors. The presence of strategic
complementarities implies that fi rms’ decisions
take into account the actions of competitors. In
an attempt not to deviate too much from their
competitors, their demand curve will show a
variable exchange rate elasticity depending
on the degree of competition i.e. with stronger
competitive pressures they will vary the
mark-up more and prices less in response to
an exchange rate movement. Increased trade
integration is likely to enhance this behaviour,
thereby insulating import prices to some extent
from exchange rate movements and potentially
leading to a decline in the pass-through.25 Other
structural changes induced by the globalisation
process, like shifts in the sectoral composition
of imports away from commodity-based goods
toward manufactured products, may work in the
same direction, as pricing-to-market behaviour
is more prevalent in the latter. Furthermore, an
increased export content of imports and lower
cost of hedging per unit of risk may also dampen
the impact of exchange rate changes on prices.
Another factor relevant for the euro area is the
increasing use of the euro as an invoicing
currency in the 2000s, again highlighting the
diffi culty in empirically disentangling the effects
of globalisation from the parallel processes set
in motion by the introduction of the euro.
Mechanically, if foreign exporters fi x their
prices in their own currency, the ERPT to euro
area domestic prices should be larger, while if
they tend to set their prices in euro the pass-
through should be smaller. As the euro has
gradually come to play a more prominent role in
international trade and fi nance over the 2000s, a
higher share of euro area trade is denominated
in euro, possibly contributing to a decline in the
ERPT to euro area prices. The share of exports
of goods denominated in euro increased
noticeably after the launch of the euro, and in
the fi rst years had already surpassed the amounts
previously recorded jointly by its legacy
currencies. Kamps (2006) shows that the share
of the euro as a settlement and invoicing
currency in extra-euro area exports rose, for
example, between 2000 and 2004 from 49% to
61.1% in Germany and from 44.6% to 52.6% in
France. In 2005 this share appears to have
somehow stabilised for most euro area Member
States at levels around 50-60%.26 Similarly, the
share of the euro as an invoicing currency on the
import side has also increased noticeably e.g. in
France from 32.9% in 2000 to 45.3% in 2003
and in Germany from 48% in 2002 to 55.2% in
2005 (Kamps (2006)).
2.3.2 EXCHANGE RATE PASS-THROUGH TO EURO
AREA IMPORT PRICES 27
The issue of possible changes in ERPT over
time has received considerable attention owing
to its potentially important implications for
Trade along the extensive margin has been put forward as an 24
important characteristic of trade integration (Hummels and
Klenow (2005)).
See, for example, Gust et al. (2006) for a rigorous model-based 25
treatment of this mechanism.
See ECB, Review of the International Role of the Euro (2007).26
This section has benefi ted from contributions from Chiara Osbat 27
and Martin Wagner.

29ECB
Occasional Paper No 94
September 2008
2 EXCHANGE RATES
AND PRICESmonetary policy, the resolution of global
imbalances and global infl ation. A number of
studies have shown that ERPT has gradually
declined in recent years in many countries. For
instance, Ihrig, Marazzi and Rothenberg (2006)
show in a recent study conducted at the US
Federal Reserve Board, that all G7 countries
experienced a decline in ERPT to import price
from 1990 to 2004 relative to the earlier period
from 1975 to 1989, with the decline being
statistically signifi cant in the case of the United
States, Japan and France. The ERPT estimates
for the second sub-period are very low for
France, Germany and Italy, (0.16, 0.29 and 0.46
respectively) when compared with those for
other industrial countries (in particular, 0.32 for
the USA, 0.59 for the UK and 0.61 for Japan).28
Other studies have confi rmed the fi nding of a
decline in ERPT for advanced countries. For
instance, Mumtaz, Oomen and Wang (2006)
suggest that there has recently been a signifi cant
decrease in ERPT to import price in the United
Kingdom, both economy-wide and at the
industry level.
Although individual euro area countries are
often included in these studies, the euro area as
a single economy is generally not considered.
Empirical evidence on changes in the ERPT to
euro area prices over time is extremely scarce
and the few results put forward so far are quite
mixed.
In order to ensure comparability, the following
regression equation, which is similar to the one
used by Ihrig, Marazzi and Rothemberg (2006),
is estimated:
Changes in euro area manufacturing import
prices (∆uvxt) are a function of their own lags,
changes in the nominal effective exchange rate
(∆eit) and a number of additional regressors
like the foreign producer prices, global oil and
industrial raw materials prices (other reg). The
pass-through is captured by the coeffi cient β20 in
the short run, and by the ratio β
20 + ... +β2k
1– (β11 + ... +β1k)
in the long run.
The results of dynamic regressions for the euro
area over the period 1992-2004 are summarised
in Table 3 for the long-run specifi cation of the
ERPT. Among the other explanatory variables,
only nominal exchange rates, oil and industrial
raw materials prices appear to have a signifi cant
effect, in the long run, on import prices. More
importantly, the analysis indicates an estimated
long-run ERPT coeffi cient of 0.72, higher than
those found by Ihrig, Marazzi and Rothenberg
(2006) for some individual euro area countries
included in their sample and comparable to the
ones found for the United States and the United
Kingdom. However, this result is in line with
other studies carried out on the euro area. For
instance, based on sectoral estimates for all euro
area countries, Campa and Gonzales (2006) fi nd
an average long-term pass-through coeffi cient on
extra-euro area import prices of 81%. Limiting
the analysis to manufacturing import prices,
estimates by Anderton (2003) suggest that the
pass-through in the long run is in the range of
50-70%. A more recent study based on vector
autoregressive models by Ca’ Zorzi, Hahn and
Sánchez (2007) fi nd a long-term pass-through
coeffi cient of around 70% for the euro area.
For detailed technical discussions of the different methodologies 28
and criticism of the one used in the papers mentioned in the text,
see Osbat and Wagner (2006), as well as de Bandt, Banerjee
and Kozluk (2007). See also Marazzi et al. (2005) for additional
evidence on exchange rate pass-through to US import prices.
Table 3 Euro area import price ERPT: regression results
Coeffi cient Tail probability
Constant 0.00 0.1310
NEER 0.72 0.0000
Foreign PPI 0.57 0.1790
Industrial raw material price 0.10 0.0004
Oil prices 0.10 0.0000
Source: ECB staff estimates.Notes: Long-run estimates. All variables are in growth rates. Coeffi cients signifi cant at 5% level are in bold.
∆uvxt = K
k =1
β1k∆uvxt-j +
K
k = 0
β2k ∆et-j +
n
j = 3
k
k = 0
βjk∆other regt-k +ut
(2)

30ECB
Occasional Paper No 94
September 2008
These fi ndings are also broadly in line with
the long-run ERPT embedded in the AWM.
Chart 24 depicts the evolution of the euro area
import prices response to an exchange rate
shock resulting from the AWM simulation over
a horizon of 12 quarters. Interestingly, the ERPT
appears to be somewhat lower in the most recent
version of the AWM from 2007 (at around 50%)
compared with the previous 2004 version, for
which ERPT is around 70%. Although a number
of modifi cations have been incorporated in the
new version of the AWM, this may tentatively
suggest that the extent of ERPT to import prices
may have declined somewhat in the euro area
over recent years.
2.3.3 EXCHANGE RATE PASS-THROUGH TO EURO
AREA IMPORT PRICES – A SECTORAL
PERSPECTIVE 29
While in the previous section the discussion on
ERPT in the euro area focused on aggregate
price indices, this section focuses on ERPT at
the sectoral level. As industry characteristics
differ signifi cantly, the same may be true
for sectoral ERPT, and shifts in the sectoral
composition of euro area imports may
therefore help to explain changes in ERPT at
the aggregate level. For that purpose, the same
specifi cation as that used in the previous section
is estimated at the sectoral level. However,
rather than estimating a single-equation
specifi cation, the import price equation is
estimated as part of a VAR-X model, which
includes – in addition to the main endogenous
variables – some exogenous variables, the
dynamics of which are not explained by the
model. These exogenous variables, contained
in “other reg” in equation 2, include a measure
of common external factors and demand side
effects (proxied by commodity prices and the
output gap respectively) which may condition
both prices and exchange rates. In addition,
domestic and foreign producer prices are
included to proxy for the price of substitutes
and foreign costs respectively. The model is
estimated for 16 euro area industries. Long-run
sectoral ERPT is calculated from the impulse-
response function of import prices to a shock
to the exchange rate at a 24-month horizon.
Chart 25 shows a large degree of heterogeneity
in the estimates of ERPT to import prices across
sectors. The estimated long-run ERPT varies
from 0.22 (not signifi cantly different from 0,
This section has benefi ted from contributions from Chiara Osbat 29
and Martin Wagner.
Chart 25 Sectoral ERPT and change in sectoral import shares
(percentage changes in case of import shares; 1988-2005)
negative y-axis: change in import shares ERPT
positive y-axis: ERPT
7
5
3
1
-1
-3
-51
Chemicals Petroleum productsMotor vehiclesPulp and paper productsMachinery and equipmentBasic metalsPlastic productsCommunications
Other non-metallic products
Food and beverages
Textiles
Wearing apparel
Electrical machinery
Medical instruments
Computers
Fabricated metal products1
2
3
4
5
6
7
8
9
10
11
12
13
14
15
16
2 3 4 5 6 7 8 9 10 11 12 13 14 15 16
7
5
3
1
-1
-3
-5
Source: ECB staff estimates.
Chart 24 Response of euro area import prices to exchange rate shock (over 12 quarters) based on the AWM in 2007 compared with 2003
Q1 Q2 Q3 Q4 Q5 Q6 Q7 Q8 Q9 Q10 Q11 Q12
0
-1
-2
-3
-4
-5
-6
-7
-8
0
-1
-2
-3
-4
-5
-6
-7
-8
September 2007
January 2004
Source: ECB staff calculations.

31ECB
Occasional Paper No 94
September 2008
2 EXCHANGE RATES
AND PRICESi.e. no ERPT) for chemicals and motor vehicles
to 1.57 (not signifi cantly different from 1, i.e. full
ERPT and local pricing) for fabricated metal
products and computers. Overall, long-run ERPT
is found to be not signifi cantly different from 0 in
three sectors and not signifi cantly different from
1 in eleven sectors, with a variable degree of
uncertainty across sectors. Recursive estimations
of the VAR-X model at the sectoral level, for
extra-euro area import price over the period
1988-2005 30 fi nd very little evidence of decline
in structural parameters for sectoral ERPT.
The presence of substantial heterogeneity in
sectoral ERPT for the euro area is also the
main conclusion of a recent analysis by Hahn
(2007). The exchange rate is found to have the
strongest impact on producer prices of energy,
followed by intermediate and consumer goods
producer prices, while hardly any response
is recorded for producer prices of capital
goods (see Chart 26). Data availability only
allowed changes in the ERPT to be explored
over a fi ve-year horizon, from 1995 to 2000,
and the changes found over this period are
relatively limited. According to Hahn (2007),
there has been some small decline in the ERPT
on producer prices in industry (excluding
construction), as the weight of the sub-sector
electricity, gas and water supply, which
displays a high ERPT, decreased. However,
the results appear to be highly dependent on
the price index used as endogenous variable.31
Given the large degree of sectoral heterogeneity
in ERPT, the time-variation in the aggregate
ERPT may be a result of shifts over time in the
sectoral composition of euro area imports. This
explanation based on the presence of sectoral
shifts had already been put forward by Campa
and Goldberg (2005) for the United States, who
argued that the decline in ERPT may come
from shifts in the composition of the import
bundle from high pass-through goods, such as
energy and raw materials, to lower pass-through
items, such as manufactured goods. Calculating
aggregate euro area ERPT as the import-share
weighted sum of sector-level ERPT shows that
such a shift from high to low ERPT sectors has
also occurred to some extent in the euro area.
Comparing aggregated ERPT based on import
shares in 1988 and 2005 shows that this would
mechanically result in a decline of overall ERPT
from 0.83 to 0.74.
2.3.4 EXPLANATIONS FOR HETEROGENEITY
IN SECTORAL EXCHANGE RATE
PASS-THROUGH 32
An empirical analysis of the determinants of
sectoral ERPT in the euro area can shed some
light on the factors affecting ERPT. In particular,
it is possible to assess whether globalisation-
See also for the euro area de Bandt, Banerjee, and Kozluk (2007), 30
who fi nd evidence of an increase in import price ERPT for some
euro area countries and some sectors.
For instance, when considering the producer prices in the 31
manufacturing sector, the study fi nds a small increase in the
ERPT over the same period, related to an increase in the weight
of high ERPT sector manufacture of coke, refi ned petroleum
products and nuclear fuel. This might be the result of the surge in
oil prices over the period under consideration.
This section has benefi ted from contributions from Chiara Osbat 32
and Martin Wagner.
Chart 26 Impact of a 1 percent appreciation of the euro on producer prices in the main industrial groupings of the industrial sector
-0.80
-0.70
-0.60
-0.50
-0.40
-0.30
-0.20
-0.10
0.00
0.10
-0.80
-0.70
-0.60
-0.50
-0.40
-0.30
-0.20
-0.10
0.10
0.00
intermed
capital
consumer
durables
non-durables
energy
industry (excluding construction)
1 2 3 4 5 6 7 8
Source: Hahn (2007).Notes: The impact on producer prices is not statistically signifi cantly different from zero for capital goods production. For some sectors, the impulse response shows a hump-shaped form. This is, in particular, the case for sector estimates, which are based on relatively short sample periods. This seems to suggest that this pattern is not based on economic grounds, but displays some uncertainty in the estimates. This interpretation is also in line with the estimated error bands.

32ECB
Occasional Paper No 94
September 2008
related structural changes, such as increased
market integration and import penetration, can
be expected to affect ERPT.
To this end, the sectoral ERPT coeffi cients
discussed in the previous section are
regressed against a set of proxies of sectoral
characteristics, such as import penetration,
market integration, operating surplus and
revealed comparative advantage. Specifi cally,
the import penetration, refl ecting the proportion
of foreign to domestic fi rms that are active
in a given sector, is expected to enhance the
pricing ability of foreign fi rms and therefore to
be positively related to the ERPT. Conversely,
a higher integration of a given sector in world
markets is expected to lead to a decline in the
ERPT. As far as the nature of competition is
concerned, the expectation would be for the
ERPT to decrease in a context of more intense
competition, proxied by the operating surplus.
Studies for the euro area show that, relative to
value added, the operating surplus is highest
in the petroleum sector and in other more
commodity-based sectors, such as food and
beverages, and tobacco and paper products.
Finally, the model takes into account the
revealed comparative advantage (RCA) – a
measure of the degree of specialisation of
exports introduced by Liesner (1958) and
Balassa (1965). By limiting the pricing ability
of competitors, higher competitiveness of the
euro area in a given sector (proxied by higher
operating surpluses and RCA) is expected to be
associated with a decline in ERPT.
The cross-section regression can be written as
following, with i indexing the various sectors:
IP denotes the ratio of imports to value added in
each sector as a proxy for market penetration,33
MI denotes the ratio of exports plus imports
over valued-added, based on nominal values in
euro, as a proxy for market integration, OS
denotes the ratio of net operating surplus to
value added as a measure of the degree of
competition (and hence profi tability) or
competitive pressure within the sector 34 and
RCA denotes the ratio of a sector’s share in the
euro area’s exports, divided by the same ratio
for the rest of the world, as a proxy for revealed
comparative advantage. This variable is equal to
one for a given sector if the sectoral export share
is the same as in the reference group and larger
than one if the euro area has a revealed
comparative advantage in that sector.
Table 4 reports the coeffi cient estimates for
the various determinants of sectoral ERPT.
As expected, higher import penetration leads
to increasing ERPT, whereas higher market
integration contributes to a decrease in ERPT.
This points to the presence of offsetting forces
at the sectoral level, which may provide a partial
explanation for the mixed aggregate results.
Moreover, these results imply that sectoral
competitiveness, as measured by the operating
surplus, has no signifi cant impact on the
pass-through when the degree of specialisation
at the sectoral level, measured by the revealed
comparative advantage, is taken into account.
Value added was used instead of the nominal value of total 33
production, because data for the latter have a much poorer
coverage over sectors, countries and time periods.
It is very important to note that operating surplus is a very 34
indirect measure of profi ts, as it also includes the remuneration
of capital and taxes.
ERPTi = μ + δ1IPi + δ
2 MIi + δ
3OSi +
δ4 RCAi + νi (3)
Table 4 Determinants of sectoral exchange rate pass-through: regression results
Specifi cation 1 Coeffi cient
Specifi cation 2 Coeffi cient
Intercept 2.058 (0.001)
1.695 (0.000)
Import penetration 1.682 (0.047)
1.885 (0.004)
Market integration -0.983 (0.046)
-1.089 (0.005)
Operating surplus -3.495
(0.135)-2.967
(0.001)Revealed comparative
advantage
-0.314
(0.486)-
R2 0.623 0.617
Source: ECB staff estimates. Notes: Long-run estimates. All variables are in growth rates. Coeffi cients signifi cant at 5% level are in bold.

33ECB
Occasional Paper No 94
September 2008
2 EXCHANGE RATES
AND PRICES2.3.5 PRICING BEHAVIOUR OF EMERGING MARKET
EXPORTERS 35
The analysis of export pricing behaviour of euro
area trading partners may provide an alternative
explanation for the dynamics of aggregate
ERPT. In particular, higher pricing-to-market
among several emerging markets, especially in
some Asian countries in the wake of the Asian
crisis of 1997-98, has been put forward as one
major reason for the decline in pass-through
among some advanced countries, noticeably the
United States. 36 Given the growing importance
of emerging market exporters for euro area
trade, this explanation may also be relevant in
the context of euro area ERPT.
There is some evidence that some emerging
market exporters may have indeed shifted
towards a strategy of greater pricing-to-market
in recent years. This result is based on the
recursive estimation over a window of
30 quarters in a standard trade equation.
Pass-through seems to have decreased in South
Korea and Thailand in the wake of the Asian
crisis (see Chart 27).37 In Mexico, pass-through
fell at the time of the 1995 crisis, but has been
on an upward trend since 2002. Similar
developments have been recorded in other
countries, such as Israel, Turkey and the
Philippines, as a result of specifi c developments
and structural changes affecting their economies
over the recent period. In particular, the adoption
in several emerging economies of regimes that
allow for greater exchange rate fl exibility, as
well as the ongoing move of economies towards
lower infl ation regimes, possibly indirectly
linked to globalisation, may have increased their
propensity to price to market. However, in Latin
American emerging countries, such as Peru, the
degree of pass-through seems to have been
broadly constant since the early 1990s.
This section has benefi ted from contributions from Matthieu 35
Bussière and Tuomas Peltonen, European Central Bank.
See Vigfusson, Sheets and Gagnon (2007).36
The Asian crisis episode is included in all samples which end 37
less than 30 quarters after the crisis. Thus the effect of the crisis
is generally seen around 2004/2005, when the crisis drops out of
the rolling sample.
Chart 27 Evolution of export price response for selected emerging market economies
(estimated export price elasticity (OLS); rolling sample with a window of 30 quarters)
Mexico South Korea
1.00
0.90
0.80
0.60
0.50
0.40
0.30
0.20
0.10
0.00
1.00
0.90
0.80
0.70 0.70
0.60
0.50
0.40
0.30
0.20
0.10
0.002000 2001 2002 2003 2004 2005
0.70
0.80
0.60
0.50
0.40
0.30
0.20
0.10
-0.20
-0.10
0.00
0.70
0.80
0.60
0.50
0.40
0.30
0.20
0.10
-0.20
-0.10
0.00
1998 1999 2000 2001 2002 2003 2004 2005
Peru Thailand
2.50
2.00
1.50
0.50
0.00
-0.50
-1.00
1.00
2.50
2.00
1.50
0.50
0.00
-0.50
-1.00
1.00
1998 1999 2000 2001 2002 2003 2004 2005
1.40
1.20
1.00
0.60
0.40
0.20
0.00
0.80
1.40
1.20
1.00
0.60
0.40
0.20
0.00
0.80
2000 20011998 1999 2002 2003 2004 2005
Source: ECB staff estimates.

34ECB
Occasional Paper No 94
September 2008
Thus, overall the results exhibit considerable
differences across individual emerging market
economies. The fi nding of an increase in
pricing-to-market behaviour for some important
emerging market is, however, consistent with the
observed decline in pass-through to import prices
in several developed economies and may provide
an explanation for this decline, particularly in the
United States, as argued by Vigfusson, Sheets
and Gagnon (2007). At the same time, the lower
signifi cance of the emerging market trading
partners in the export structure of euro area,
compared to the United States, for instance, may
also explain why the results for the euro area are
not as conclusive, at the aggregate level, as they
are for the United States or Japan.
2.4 HAS THE PASS-THROUGH TO EURO AREA
CONSUMER INFLATION CHANGED
OVER TIME? 38
This section presents some results regarding
ERPT to consumer prices. While import prices
are the prices most directly affected by changes
in exchange rates, fi nal prices at the consumer
level are more relevant from an overall welfare
perspective and are therefore the main focus for
most central banks.
The impact of globalisation on the traditional
relationship between exchange rate movement
and CPI infl ation for a sample of countries can
be assessed on the basis of a panel VAR
methodology. This technique treats all the
variables in the system as endogenous,
while allowing for unobserved individual
heterogeneity. Consumer price infl ation (∆pit ) is
assumed to depend on the change in the nominal
effective exchange rate (∆eit ), real GDP growth
(∆gdpit ), the domestic short-term interest rate
(γit ), the change in oil price (∆oilit ) and an error
term capturing both fi xed individual (fi ) and
temporal (et ) effects. Such a model is estimated
for the sample period from the second quarter of
1980 to the fi rst quarter of 2007 for a panel of
11 industrial countries.39 Identifi cation of the
structural shocks is achieved through the
traditional Choleski decomposition. In that
respect, it is assumed that the exchange rate, as
a fi nancial market variable, can react
contemporaneously to innovations in all other
variables and is thus ordered {∆gdpit, ∆pit, γit,
∆oilit, ∆eit}. Concretely, the following fi rst-order
VAR model is estimated:
with corresponding equations for each of the
other four variables.
The dynamic response of CPI infl ation to a
one-standard deviation exchange rate shock,
equivalent to a 3.4% appreciation of the nominal
effective exchange rate, is shown in Chart 28.
The evolution of the impulse-response function
indicates that the maximum response occurs
after 2-3 quarters. Moreover, after three years,
a 10% appreciation of the nominal effective
exchange rate results in a cumulative fall in CPI
infl ation of 1.1%.
The impact of structural changes taking place
during the period under consideration can be
This section has benefi ted from contributions from Isabel 38
Vansteenkiste, European Central Bank.
Belgium, Canada, Switzerland, Germany, Spain, France, Italy, 39
Japan, Singapore, the United Kingdom and the United States.
Chart 28 Response of CPI inflation to a one standard deviation shock to the nominal exchange rate
(sample: Q2 1980 – Q1 2007; all 11 countries)
-0.08
-0.07
-0.06
-0.05
-0.04
-0.03
-0.02
-0.01
0.00
-0.08
-0.07
-0.06
-0.05
-0.04
-0.03
-0.02
-0.01
0.00
1 3 5 7 9 11 13 15 17 19 21
Source: ECB staff estimates.Note: Confi dence intervals of the impulse-response functions calculated using Monte Carlo simulations.
∆pit = α + β1∆eit + β
2∆gdpit + β
3γit +
β4∆oilit + ƒi + et (4)

35ECB
Occasional Paper No 94
September 2008
2 EXCHANGE RATES
AND PRICES
taken into account by performing recursive
panel VAR regressions, starting with the shortest
sample that is thought to still give reasonable
estimates (concretely, the fi rst ten years of
observations were used, from the second quarter
of 1980 to the second quarter of 1990) and then
gradually adding, at each iteration, a quarter at
the end of the sample moving forward toward
the end of the sample period. Chart 29 depicts
the evolution of CPI responses at a horizon
of ten quarters, with each point on the chart
representing the estimate for a particular sample,
in chronological order from left to right. The last
point then represents the estimated ten-quarter
response based on the entire set of observations.
The results of the rolling VAR analysis point to
some tentative evidence that the impact of an
exchange rate shock on CPI has declined
through time for the entire panel of industrial
countries. Specifi cally, during the fi rst subperiod,
from the second quarter of 1980 to the second
quarter of 1990, the impact of a one-standard
deviation exchange rate shock on the CPI
infl ation is close to -0.4, whereas for the full
sample (i.e. from the second quarter of 1980 to
the fi rst quarter of 2007), the response is less
than half this amount.40 VAR estimates for some
individual euro area countries point towards
However, considering the standard error bands surrounding the 40
response, it is found that the response at the end of the sample
is still within the standard error bands of the short sample,
suggesting that the difference is not statistically signifi cant.
Charts 29 Evolution of CPI response to an exchange rate shock
(impulse response after four quarters; recursive estimation results)
Panel Germany
-0.20
-0.15
-0.10
-0.05
0.00
0.05
-0.20
-0.15
-0.10
-0.05
0.00
0.05
1991 1994 1997 2001 2003 2006
0.20.10.0
-0.1-0.2-0.3-0.4-0.5-0.6-0.7
0.20.10.0
-0.1-0.2-0.3-0.4-0.5-0.6-0.7
1995 1997 2000 2002 2003 2005
France Italy
0.20.10.0
-0.1-0.2-0.3-0.4-0.5-0.6-0.7
0.20.10.0
-0.1-0.2-0.3-0.4-0.5-0.6-0.7
1995 1997 2000 2002 2003 2005
0.20.10.0
-0.1-0.2-0.3-0.4-0.5-0.6-0.7
0.20.10.0
-0.1-0.2-0.3-0.4-0.5-0.6-0.7
1995 1997 2000 2002 2003 2005
Source: ECB staff estimates.Note: Standard errors of the impulse-response functions by using Monte Carlo simulation to generate their confi dence intervals.
Chart 30 Response of euro area HICP to exchange rate shock (over 12 quarters) based on the AWM
-2.5
-2.0
-1.5
-1.0
-0.5
0.0
-2.5
-2.0
-1.5
-1.0
-0.5
0.0
Q1 Q2 Q3 Q4 Q5 Q6 Q7 Q8 Q9 Q10 Q11 Q12
January 2004
September 2007
Source: ECB staff calculations.

36ECB
Occasional Paper No 94
September 2008
some cross-country differences in the evolution
of the ERPT over time. As Chart 29 shows, the
decline in the pass-through to consumer prices
is particularly pronounced for Germany and, to
a lesser extent, for France and Italy.
Simulation results from the ECB’s AWM
provide additional tentative evidence for a
possible decline in ERPT to euro area HICP.
As depicted on Chart 30, the response of euro
area HICP to a 10% appreciation of the euro
vis-à-vis all trading currencies declined in 2007
compared with the response obtained using the
2004 version of the AWM. The decline in ERPT
appears to be smaller for consumer prices than
for import prices.

37ECB
Occasional Paper No 94
September 2008
3 EXCHANGE RATES
AND TRADE3 EXCHANGE RATES AND TRADE
One of the key channels through which changes
in exchange rates affect an economy is through
its expenditure-switching effect on trade
fl ows. An exchange rate appreciation makes a
country’s products more expensive relative to
foreign goods and services and therefore leads
to a shift of global demand away from domestic
products towards foreign ones. This implies a
reduction in exports and an increase in imports,
resulting overall in a deterioration in the trade
balance and thus a reduction in the contribution
of net trade to GDP growth.
For a number of reasons, the ongoing process
of globalisation may have resulted in a change
in this expenditure-switching effect. This
chapter reviews some of the evidence regarding
possible structural changes in the relationship
between exchange rates and trade fl ows, and
investigates, in particular, the hypothesis of an
increasing exchange rate “disconnect”. After
some conceptual considerations are described
in Section 1, Section 2 presents an analysis of
aggregate euro area trade fl ows, focusing on the
link between real exchange rates and exports,
and possible changes thereof. Section 3 takes a
more disaggregate view by analysing the effect
of exchange rates on bilateral trade fl ows at
the sectoral level. In particular, this analysis
provides some evidence that geographical
and industry composition effects may be part
of the explanation for the observed changes
in the responsiveness of exports to exchange
rate changes.
Overall, this chapter shows that increased
globalisation might have reduced the
responsiveness of euro area export volumes to
exchange rate movements at the aggregate level.
Nevertheless, at the sectoral level, increased
trade integration has led to higher levels of
exchange rate elasticity for euro area exports
addressed to some groups of countries. Taking
a country-level approach, it is shown that the
ongoing globalisation process has weakened the
responsiveness of export volumes to exchange
rate changes in countries like Germany, whereas
it has increased their responsiveness in France
and Italy through shifts in the trade composition
across industrial sectors characterised by
different elasticities.
3.1 CONCEPTUAL CONSIDERATIONS
The issue of how globalisation is likely to affect
the link between exchange rates and trade fl ows
is closely related to the issue of ERPT. Only to
the extent that a given change in the nominal
exchange rate translates into a change in export
and import prices in the customers’ currencies
will this trigger a demand response. As discussed
in Chapter 2, the effect of globalisation forces
on the degree of ERPT is a priori ambiguous.
Empirical evidence, however, suggests that there
might have been some decline in ERPT to import
prices for a number of countries, including
the euro area, with this decline being, at least
in part, attributable to the structural changes
associated with globalisation. This should have
by itself weakened the link between changes in
the nominal exchange rate and import volumes.
At the same time, the pricing behaviour of
euro area exporters appears to have remained
relatively stable over recent years. Thus, this
channel should not have contributed to alter the
sensitivity of euro area exports to changes in the
nominal exchange rate.
In addition to such price-related effects,
the various aspects of globalisation can be
expected to also have a more direct impact on
the exchange rate-trade fl ows link. The entry
of new players in the global trading system and
lower trading costs have resulted in a larger
variety of similar products being traded. This
has increased the substitutability between
products and suppliers. Consequently, changes
in relative prices between products from
different source countries may result in a more
pronounced demand response to fl uctuations
in the exchange rate. In addition to these
demand-side effects, the reduction in trading
costs may have also resulted in a stronger
supply response to changes in exchange rates.
This applies, in particular, to “sunk” trading
costs, i.e. the costs of entering a new market

38ECB
Occasional Paper No 94
September 2008
which cannot be redeemed in case of a later
exit from the market, such as setting up of
a distribution network or initial marketing
expenses. The existence of such costs introduces
a degree of sluggishness into trade fl ows. Even
though, at a given exchange rate constellation,
it might be profi table to enter a new market,
an adverse move in the exchange rate may
subsequently render exporting unprofi table.
Without sunk costs this would not represent a
problem for the fi rm contemplating whether or
not to export, as it could just withdraw from
that market again. With sunk costs, however,
a fi rm might choose to wait a little longer in
order to ensure that the exchange rate moves
in the “right” direction, as otherwise the initial
outlays would be irredeemably lost. Similarly,
a fi rm that has already entered the market may
not immediately react to a deterioration in its
profi tability owing to an appreciation of the
currency in order to protect the value of its
initial investment. By analogy, this would of
course imply that a reduction in sunk costs,
possibly related to the process of globalisation,
would reduce this sluggishness in the supply
response by facilitating the entry or exit of
new fi rms. Thus, not only the responsiveness
of trade along the intensive margin (existing
fi rms trading more or less), but also along the
extensive margin (entry and exit of fi rms), may
increase.
One other relevant facet of globalisation
is the increasing internationalisation of the
production process, involving more extensive
sourcing of intermediate inputs from entities
located abroad. As a consequence, the import
content of exports has increased in many cases.
Similarly, imports may contain a higher share
of previously exported intermediate products
which have been processed further abroad
and then re-imported. This development
should have by itself contributed to a reduced
responsiveness of trade fl ows to exchange
rate changes. For example, an appreciation
increases the foreign currency price of exports.
However, to the extent that parts of the exports
do not constitute domestic value added, but
rather imported inputs, this effect is mitigated,
as the price of these imported inputs declines
owing to the appreciation. The same argument
applies to imports in the case where the foreign
value-added content decreases. A further
potentially relevant aspect of globalisation
is that progressive fi nancial integration and
innovation have reduced the costs of exchange
rate hedging. As a result, fi rms may choose
to hedge a larger share of their exchange
rate exposure and may therefore reduce the
supply response to an adverse change in the
exchange rate.
Last, but not least, globalisation has resulted
in signifi cant changes in the product and
geographical composition of euro area trade,
driven in part by the emergence of new and
important players in the global trading system.
The responsiveness of trade fl ows to exchange
rate changes generally differs between
industries and trading partners, refl ecting in part
differences in the competitive structure. Thus
compositional shifts may result in changes in
the exchange rate elasticity of aggregate trade
fl ows, with the direction of these changes being
a priori indeterminate and dependent on the
concrete changes induced by globalisation.
In sum, globalisation and globalisation-related
structural changes can be expected to affect the
link between exchange rates and trade fl ows
through a multitude of different channels, with
the overall net effect depending on the relative
strength of the various effects. Thus, whether
the responsiveness of euro area trade fl ows to
exchange rate changes has increased or decreased
over recent years remains an empirical question.
The remainder of the chapter will provide some
selected evidence regarding this issue.
3.2 THE EMPIRICAL LINK BETWEEN EXCHANGE
RATES AND EURO AREA TRADE FLOWS 41
Before analysing possible changes in the
relationship between exchange rate changes
and trade fl ows, it appears useful to review
This section has benefi ted from contributions by Katrin Forster, 41
European Central Bank.

39ECB
Occasional Paper No 94
September 2008
3 EXCHANGE RATES
AND TRADE
the evidence regarding this relationship more
generally. For that purpose the ECB’s Area
Wide Model (AWM) is used to simulate the
effect of a 10% appreciation of the euro in
effective terms on export and import volumes.
The ensuing loss in price competitiveness
resulted in a decline in export volumes
concentrated in the fi rst year (1.2% lower
relative to baseline) and lower impact thereafter
(see Table 5).42 On the import side, the effective
appreciation of the euro would tend to increase
import demand on impact given the decline in
import prices denominated in euro. However,
this direct price effect is more than offset by
the indirect quantity effects stemming from
the reduction in overall demand owing to the
decline in net exports and thus overall activity.
According to the AWM simulations, import
volumes decrease by 0.6% relative to baseline
in the fi rst year and by 0.7% in the third year.
In order to assess possible changes in the trade
effect of exchange rate changes, the most recent
version of the AWM from 2007 is compared with
an earlier version from 2003. The export volume
response indeed decreases to a cumulated -1.9%
after three years, compared with almost -3%
suggested by the older estimates (see Chart 31).
However, these fi ndings must be interpreted
with caution since the most recent version of
the AWM also includes some structural changes
with respect to the earlier version, in addition to
more recent data.
In order to analyse in more detail the link
between export volumes and exchange rates, a
fairly standard trade equation is used. It includes
a long-term equilibrium relationship as an error
correction term, as well shorter-term dynamics
around this long-term equilibrium. In this
setting, current changes in export volumes are
explained not only by contemporaneous changes
in a set of exogenous variables (i.e. foreign
demand 43, a trend component and the relative
export prices 44), but also by the degree to which
these variables diverge from the equilibrium
state in the previous period.
The error correction equation can be written as
follows (all variables are in logarithms):
α∆xt = • • •(xt−1− β
1fdt−1
− β2
rxpt−1• trendt−1
)− β3
+ γ1∆ fdt + γ2
∆ rxpt + υt (5)
where x denotes extra-euro area export
volumes, fd foreign demand and rxp the
relative export prices. The estimated long-run
relationship between the variables is captured
In the AWM, trade volumes are modelled in a standard fashion, 42
whereby market shares – in terms of world demand and domestic
demand respectively – are a function of a competitiveness
indicator involving trade prices, the competitors’ index being
computed as a weighted average of external and internal prices.
Thus, the downward reaction of export volumes is mitigated by
the reaction of export prices.
Foreign demand is defi ned as the weighted average of real 43
imports of the main export markets of the euro area, using
weights defi ned as the shares of each country or region in total
extra-euro area exports.
The relative export prices are defi ned as the euro area export 44
price divided by competitors’ export prices in euro, calculated
using double weights.
Table 5 Trade impact of a 10% appreciation of the euro
(deviation from baseline; annual averages)
Percentage deviation from baseline (cumulated)
Year 1 Year 2 Year 3
Export volumes -1.2 -1.9 -1.9
Import volumes -0.6 -0.8 -0.7
Source: ECB staff calculations, using the Area Wide Model.
Chart 31 AWM response of euro area export volumes to exchange rate shock over 12 quarters
-4
-3
-2
-1
1
-4
-3
-2
-1
1
Q1
September 2007
January 2004
Q2 Q3 Q4 Q5 Q6 Q7 Q8 Q9 Q10 Q11 Q12
Source: ECB staff calculations.

40ECB
Occasional Paper No 94
September 2008
by the coeffi cients β, i=1,2,3, whereas the rate
at which export volumes converge towards the
long-term equilibrium relationship is given by
the error correction coeffi cient α. The coeffi cient
of interest for our analysis is β2 which refl ects
the equilibrium effect of relative export prices
on the level of exports.
The estimation of the trade equation over the
full sample period indicates that the coeffi cient
on relative export prices has the expected
negative sign, with the long-run elasticity equal
to -0.80. Chow-breakpoint tests for the years
1999 and 2002 do not point to a break in the
relationship. To allow for the possibility of a
more gradual structural shift in the relationship,
the model is estimated recursively, with the
initial sample spanning from the fi rst quarter
of 1993 to the fi rst quarter of 2000 in the case
of goods exports and from the fi rst quarter of
1995 to the fi rst quarter of 2000 in the case
of services exports. At each step, one further
observation is added until the end of the sample
period is reached.
The results suggest that the responsiveness
of export volumes of goods to exchange rate
changes may have diminished somewhat over
time. The (negative) coeffi cient for the long-run
elasticity on relative export prices shows a slight
upward trend (see Chart 32). By contrast, the
recursive estimation for extra-euro area export
volumes of services provides some evidence
of increased responsiveness to changes in the
exchange rate (see Chart 33). This may be owing
to services becoming increasingly tradeable due
to lower costs of information processing and
communication.
To better understand the changes in the goods
export equation, the long-run relationship
is estimated alternatively with dynamic
OLS-regression.45 To test for structural changes,
the various explanatory variables are interacted
with a dummy (d00-07), taking the value 0 over
the fi rst sub-sample (until end-1999) and
1 thereafter. Expressed in this way, the
coeffi cients on the interacted terms illustrate
whether and how the infl uence of the regressors,
i.e. the elasticities, has changed in the later
period.46 More particularly, this approach
As initially shown by Saikkonen (1991), asymptotically effi cient 45
estimates can be obtained by including leads and lags of the
regressors’ fi rst-differences among the explanatory variables,
which presents the advantage of correcting for endogeneity and
serial correlation.
A similar approach was followed by Stahn (2006a) who tested 46
for changes over time in the impact of the key determinants of
German exports.
Chart 32 Long-run coefficients on relative export prices for export volumes of goods
(sample: from Q1 1993 to Q1 2007; recursive estimation)
-2.5
-2.0
-1.5
-1.0
-0.5
0.0
-2.5
-2.0
-1.5
-1.0
-0.5
0.0
1997 1998 1999 2000 2001 2002 2003 2004 2005 2006
Source: ECB staff calculations.Notes: The chart shows recursive estimation of β
2 in Equation
5 (standard specifi cation), including a deterministic trend and imposing a unit elasticity on the foreign demand trend in the long run. The endogenous variables enter with one lag only for saving the available degrees of freedom.
Chart 33 Long-run coefficients on relative export prices for export volumes of services
(sample: from Q1 1995 to Q1 2007; recursive estimation)
-0.8
-0.6
-0.4
-0.2
0.0
0.2
0.4
0.6
-0.8
-0.6
-0.4
-0.2
0.0
0.2
0.4
0.6
2000 2001 2002 2003 2004 2005 2006
Source: ECB staff calculations.Notes: The chart shows recursive estimation of β
2 in Equation
5 (standard specifi cation), including a deterministic trend and imposing a unit elasticity on the foreign demand trend in the long run. The endogenous variables enter with one lag only for saving the available degrees of freedom.

41ECB
Occasional Paper No 94
September 2008
3 EXCHANGE RATES
AND TRADEinvolves estimating the following equations for
export volumes:
βyt = • • •X + γ d00−07
d00−07 + j∆ ∆
X
Xt + j+∑k2
j=k1
(η1 j + η
2 j) + ε t
(5i)
where X denotes the set of regressors (including
the constant), k1 and k
2 the number of leads and
lags respectively and εt the error term.
As far as the long-run elasticities are concerned,
the results of dynamic regressions with time-
dummies support the previous fi ndings from the
recursive error correction model estimations
(see Table 6). The coeffi cient on relative export
prices is clearly lower (-0.27) in absolute terms
when it is interacted with the globalisation
dummy than the coeffi cient for the whole
sample (-0.63). The estimation also shows that
the negative time trend becomes signifi cant only
in the period after 2000. The responsiveness
of export volumes of goods to changes in
relative export prices appears to have declined
somewhat during the early 2000s, although the
extent of this decline is relatively limited.
To check whether these results hide important
differences at the product, or the country-level,
dynamic regressions were also performed for
broad product categories and three major euro
area countries. For manufacturing, capital and
consumer goods, the results confi rm the previous
fi nding, displaying lower coeffi cients on the
relative export prices variables over the more
recent period. For intermediate goods, in equation
(5i) both coeffi cients for the relative export price
variables and time variation are insignifi cant.
Estimating the model for the extra-euro area
export volumes of Germany, France and Italy
provides some evidence that cross-country
differences may be important. The results for
Germany are very similar to the fi ndings for the
euro area and are also in line with the results of
Stahn (2006a), who performed a similar analysis
for Germany. In particular, there is a notable and
statistically signifi cant reduction in the relative
price coeffi cient suggesting a signifi cant decline
in the responsiveness of trade fl ows to exchange
rate movements.
3.3 A DISSAGREGATED APPROACH TO TRADE
ELASTICITIES 47
Additional insights into the evolving relationship
between exchange rates and trade can be gleaned
from a study of disaggregate trade fl ows in the
context of a gravity model. The advantage of a
more disaggregate approach is that it may also
provide information on the underlying causes
for structural changes, as differences across
industries and destination countries and the
associated composition effects in aggregate
trade fl ows can be studied.
Berthou (2008) studies these issues for
bilateral trade fl ows between 17 exporting
and 56 importing countries, disaggregated for
26 industries. The study uses annual data for the
period from 1989 to 2004. Following Flam and
Nordström (2003), the value of bilateral trade
fl ows is modelled as a function of the real bilateral
exchange rate between exporting and importing
country, the real effective exchange rate vis-à-vis
third-country competitors and a range of
This section has benefi ted from contributions by Antoine Berthou.47
Table 6 Dynamic regression results
Export volumes (goods, extra-euro area)Full
sample Germany France Italy
constant 4.610** 0.260** 0.430* 0.830
d00-07 -0.870 0.540** 1.950** 1.720**
relative export
prices (rxp) -1.050** -0.440** -0.640** -0.160
d00-07*rxp 0.450** 0.320** -0.100 -0.270
Foreign demand (fd) 0.980** 0.960** 0.920** 0.820**
d00-07*fd -0.251** -0.130** -0.430** -0.380**
Adj. R2
SE0.990 0.017
0.990 0.017
0.980 0.025
0.970 0.030
Source: ECB staff estimates.Notes: Coeffi cients are signifi cant at the 5%/10% level based on standard errors adjusted for heteroskedasticty and autocorrelation (Newey-West covariance estimator). d
00-07 represents a dummy
variable, taking the value 0 before 2000 and one thereafter, rxp denote relative export prices, fd foreign demand. All variables are in logarithms.

42ECB
Occasional Paper No 94
September 2008
traditional gravity variables related to bilateral
market access. In addition, the estimation
specifi cation includes fi xed effects for exporting
and importing countries, industries and time
period. Concretely the following model of
bilateral trade is estimated
xijkt =FE+ +α1
α2
1n 1n pct (c)
++α3 Xij εijt
pit (i) ejit ejct⎯ ⎯pjt j( ) pjt j( )
(6)
where xijkt denotes the log of the value of exports
from country i to country j in industry k at
time t. FE represent the various fi xed effects
and Xij subsumes the various gravity variables,
such as bilateral distance, a common border
dummy, a common language dummy and
bilateral exchange rate volatility. The second
term represents the real bilateral exchange rate
between countries i and j, while the third term
represents the real exchange rate vis-à-vis third
market competitors, with e being the nominal
exchange rate and p a measure of producer
prices. Of particular interest in the present
context is the parameter α1 which captures the
sensitivity of trade fl ows to a change in the real
exchange rate.
The estimation results of the gravity equation
suggest that a 10% real appreciation leads
to a decline in the bilateral value of exports
of around 2.5%. The sensitivity of euro area
exports to exchange rate movements appears
to be somewhat lower, with a corresponding
fi gure of 1.5%, compared with 3.6% for other
OECD countries. In order to assess whether this
export-exchange rate link has changed over
time, the model is modifi ed by combining the
coeffi cient on the real exchange rate with time
dummies. The results indicate a moderate
increase in the sensitivity of trade fl ows to
exchange rate changes over time (see Chart 34).
This is consistent with the hypothesis that
globalisation is associated with a decline in
trading costs and thereby facilitates the entry and
exit of fi rms into foreign markets and may thus
increase the responsiveness of trade fl ows.48
Although at fi rst sight this fi nding appears to
contradict the results of a decline in the exchange
rate sensitivity for aggregate euro area exports,
it is important to note that the gravity model
does not take into account the relative
importance of different export destinations and
industries for the euro area. In addition, it does
not take into account the effect of possible
changes in the industry and geographical
composition of trade, which may, as in the case
of ERPT, be an important determinant of time
variations.49
Although it is diffi cult to obtain measures for the evolution in 48
trading costs over time directly, distance may be a useful proxy
for trading costs along the cross-sectional dimension. Therefore
the exchange rate variable is combined with a measure of
bilateral distance to analyse whether an increase in trading costs,
i.e. distance, is associated with a decline in the sensitivity of
trade fl ows to exchange rate changes. This indeed appears to be
the case, as the interaction term is statistically highly signifi cant.
Thus, if one applies this cross-section fi nding to the effect of
globalisation over time, this fi nding would suggest that the
globalisation-related decline in trading costs would result in an
increase in the sensitivity of bilateral sector-level trade fl ows to
changes in the exchange rate.
A number of other factors are also relevant in this respect: First, 49
the gravity model is not restricted to euro area exporters, but
includes other OECD exporters as well. Second, the gravity
model analyses trade values, whereas the euro area export
model focuses on volumes. Third, increased sensitivity of
bilateral, industry-level fl ows does not necessarily translate
into large aggregate sensitivity. For example, it is perceivable
that increased competition and lower fi xed cost of establishing
trading relationships could increase the substitutability of goods
from different suppliers. As a consequence, bilateral trade fl ows
react more strongly to changes in relative prices. As this does
not necessarily imply an overall reduction in trade, but merely
a switch between suppliers, the impact on aggregate trade fl ows
may be more limited.
Chart 34 Evolution of exchange rate coefficient over time
-0.30
-0.28
-0.26
-0.24
-0.22
-0.20
-0.30
-0.28
-0.26
-0.24
-0.22
-0.20
1990 1992 1994 1996 1998 2000 2002 2004
Source: Berthou (2008).

43ECB
Occasional Paper No 94
September 2008
3 EXCHANGE RATES
AND TRADE
To assess the importance of industry and
geographical composition effects in driving
the fi nding of reduced sensitivity of aggregate
euro area exports to exchange rate changes,
the gravity model is used to derive industry
and country/region-specifi c exchange rate
elasticities. The exchange rate elasticity of
trade fl ows exhibits signifi cant heterogeneity
across industries, ranging from around
-0.09 in the case of the food industry to
around 0.37 in the case of footwear and
mineral products (see Chart 35). Thus,
changes in the composition of actual trade
fl ows could have important effects on the
aggregate responsiveness of exports. The
use of weighted averages of the industry-
specifi c elasticities, with time-varying shares
of the various industries in overall exports
as weights, shows that these effects can be
signifi cant. For the euro area as a whole,
this industry composition effect would have
resulted in an overall decline in the exchange
rate elasticity of exports. On a country basis,
industry composition effects appear to have
contributed to a decline in the exchange
rate elasticity of German exports over time
(see Chart 36). By contrast, for France and
Italy, the exchange rate sensitivity of exports
appears to have increased somewhat. These
fi ndings are in line with the estimation results
for aggregate exports presented in Section 3.2
and point towards a shift in the industrial
composition of euro area and German exports
towards sectors with relatively low exchange
rate elasticity as a possible explanation for the
decline in exchange rate sensitivity.
Chart 35 Real exchange rate impacts on exports
(across industries)
27 Other non-metallic mineral products
26 Footwear, except rubber or plastic
25 Furniture, except metal
24 Wearing apparel, except footwear
23 Pottery, china, earthenware
22 Rubber products
21 Glass and products
20 Plastic products
19 Transport equipment
18 Petroleum refineries
17 Fabricated metal products
16 Textiles
15 Wood products, except furniture
14 Machinery, electric
13 Other manufactured products
12 Iron and steel
11 Paper and products
10 Beverages
-0.1
-0.2
-0.3
-0.4
0.0
-0.1
-0.2
-0.3
-0.4
0.0
1 2 3 4 5 6 7 8 9 10 11 12 13 14 15 16 17 18 19 20 21 22 23 24 25 26 27
9 Leather products
8 Machinery, except electrical
7 Printing and publishing
6 Non-ferrous metals
5 Tobacco
4 Other chemicals
3 Industrial chemicals
2 Professional and scientific
1 Food products
Source: Berthou (2008).

44ECB
Occasional Paper No 94
September 2008
In order to examine impacts of a similar
nature related to changes in the geographical
composition of exports, exchange rate elasticities
for various destination regions are estimated.
The results indicate considerable heterogeneity
across geographical destinations. In general, the
exchange rate elasticity appears to be somewhat
higher for OECD destination countries than
for non-OECD countries (see Chart 37). The
effect of exchange rate changes is particularly
large in the case of new EU Member States and
lowest – in fact, close to zero – for exports to
the Asian region. Owing to this heterogeneity,
shifts in the country composition of a country’s
exports may therefore lead to changes in the
aggregate responsiveness of exports.
Similar to the approach taken in the case of
industry effects, the quantitative importance of
composition effects is assessed by calculating
weighted averages of the regional elasticities,
with the weights given by the share of the
various destination regions in overall exports.
For the euro area as a whole, this weighted
elasticity exhibits a slightly declining trend
over the sample (in absolute terms), with
considerably short-term variability. The
same exercise for some of the large euro area
countries shows a very similar pattern of
overall decline, with cross-country differences
being much less pronounced than in the case of
the industry effects (see Chart 38). The rapid
integration of Asian countries – above all China
and India – into the global trading system may
explain some of this overall decline, given the
signifi cant increase in these countries’ share in
euro area trade.
Chart 36 Evolution of exchange rate elasticity of exports – the industry composition effect
Germany
France
Italy
-0.215
-0.220
-0.225
-0.230
-0.235
-0.240
-0.245
-0.215
-0.220
-0.225
-0.230
-0.235
-0.240
-0.245
1989 1991 1993 1995 1997 1999 2001 2003
Source: Berthou (2008).Note: The exchange rate elasticity of a country’s overall exports is calculated by weighting the sector-specifi c elasticities with the (time-varying) share of the sector in overall exports.
Chart 37 Real exchange rate impacts on exports
(across importing regions)
1 New EU Members
2 NAFTA
3 EU15
4 South America
5 RoW
6 Developing Asia
7 OECD Asia
0.00
-0.05
-0.20
-0.25
-0.30
-0.35
-0.40
-0.10
-0.15
0.00
-0.05
-0.20
-0.25
-0.30
-0.35
-0.40
-0.10
-0.15
1 2 3 4 5 6 7
Source: Berthou (2008).
Chart 38 Evolution of exchange rate elasticity of exports – the geographical composition effect
1989 1991 1993 1995 1997 1999 2001 2003
-0.314
-0.316
-0.318
-0.320
-0.322
-0.324
-0.326
-0.328
-0.314
-0.316
-0.318
-0.320
-0.322
-0.324
-0.326
-0.328
Germany
Italy
France
Source: Berthou (2008).Note: The exchange rate elasticities of a country’s overall exports is calculated by weighting the region-specifi c elasticities with the (time-varying) share of the region in overall exports.

45ECB
Occasional Paper No 94
September 2008
3 EXCHANGE RATES
AND TRADEIn sum, the results from the gravity model
complement the fi ndings from the aggregate
trade model in Section 3.2 by suggesting that
disaggregated trade fl ows may have become
somewhat more responsive to exchange rate
changes, consistent with the globalisation-
related decline in trading costs. At the same
time, the results show that industry and
geographical composition effects may explain
part of the decline in the responsiveness of
aggregate euro area exports to changes in the
exchange rate.

46ECB
Occasional Paper No 94
September 2008
4 OTHER EFFECTS OF EXCHANGE RATE
CHANGES
4.1 GLOBALISATION AND THE IMPACT OF
EXCHANGE RATE MOVEMENTS ON GDP
GROWTH 50
In order to assess the impact of exchange rate
changes on activity some model simulations are
used as a starting point. Once again, the ECB’s
area-wide model is used, as well as the GVAR
– a model of the global economy estimated for
26 countries.
On impact, a 10% appreciation of the real
effective exchange rate of the euro causes
euro area GDP to decline in both models by
0.2% in the fi rst year (see Table 7),
predominantly owing to a lower contribution
to growth from net exports. In the AWM,
the drop in domestic demand and imports
moderation initially have a roughly equal
and opposite impact on GDP, but by the third
year the negative impact on consumption and
investment becomes dominant, resulting in a
cumulated reduction in GDP of 0.9% relative
to baseline. The slightly more optimistic
results from the GVAR derive from favourable
second-round effects coming from higher
foreign demand.
Chart 39 compares the most recent simulation
results of the ECB’s AWM with an analogous
simulation in 2004. The GDP impacts are
somewhat larger (around 3% after four
quarters). Although at face value these results
may suggest that the impact of exchange rate
changes on aggregate euro area activity has
declined somewhat in recent years, the same
caveats apply as for the abovementioned
structural changes.
Owing to these limitations, a more direct
approach is chosen to assess possible changes
in the relationship between exchange rates and
euro area GDP. The panel VAR methodology
described in Section 2.4 is applied to estimate
the dynamic impact of an exchange rate shock
on GDP for the period from the second quarter
of 1980 to the fi rst quarter of 2007. Consistent
with the results from the AWM, the effects
on output materialise fairly quickly, with the
maximum impact on GDP growth occurring
from two to three quarters after the shock
(see Chart 40). According to these estimates a
10% shock to the nominal effective exchange
rate would result in a cumulative decline of
GDP growth by 0.3% after three years for the
fi ve euro area countries included in the panel
(namely Belgium, Germany, Spain, France
and Italy). With regard to possible changes
in this relationship, the model was estimated
recursively, with an initial sample for the
period from the second quarter of 1980 to the
second quarter of 1990, and a quarter being
gradually added in each separate iteration at
the end of the sample. Chart 41 depicts the
This section has benefi ted from contributions by Isabel 50
Vansteenkiste, European Central Bank.
Table 7 Impact of a 10 percent appreciation of the NEER on prices and activity in 2007
(annual averages)
Percent deviation from baseline (cumulated)
Year 1 Year 2 Year 3
Real GDPAWM -0.2 -0.6 -0.9
GVAR -0.2 -0.4 -0.6
Source : ECB staff calculations.
Chart 39 Response of euro area GDP to a 10 percent appreciation of the euro
(over 12 quarters)
-2.0
-1.5
-1.0
-0.5
0.0
0.5
-2.0
-1.5
-1.0
-0.5
0.0
0.5
Q12Q1 Q2 Q3 Q4 Q5 Q6 Q7 Q8 Q9 Q10 Q11
January 2004
September 2007
Source: ECB staff calculations.

47ECB
Occasional Paper No 94
September 2008
4 OTHER EFFECTS
OF EXCHANGE
RATE CHANGES
impulse response of GDP after ten quarters
for each recursive estimation. Although there
are some variations in this response over the
sample, these changes appear to be relatively
limited and within the “normal” range of
variation given the statistical uncertainty
surrounding the estimates, as indicated by the
95% confi dence bands. Thus, while the AWM
results tentatively indicate some decline in
the responsiveness of GDP to changes in the
exchange rate, this fi nding does not seem to
be confi rmed by the panel VAR; any change
is therefore likely to be fairly limited and
diffi cult to detect at this point.
4.2 THE IMPACT OF EXCHANGE RATE CHANGES
ON FIRMS’ PROFITABILITY 51
This section turns from the aggregate
macroeconomic view to a more disaggregated
microeconomic view by focusing on the
link between exchange rate movements and
the performance of fi rms in the presence of
increased globalisation. Changes in exchange
rates may affect the profi tability of a fi rm in a
number of ways. For example, an appreciation
will result in a loss of international price
competitiveness of an exporting fi rm. As a
consequence, export volumes and thus earnings
and profi ts are likely to decline. This decline in
profi ts may be mitigated to some extent by fi rms
absorbing part of the exchange rate change
through a reduction in export prices (in domestic
currency), thereby mitigating the decline in
volumes through a decline in margins per unit
of exports. At the same time, an appreciation
will reduce the cost of imported intermediates,
thus improving fi rms’ profi tability. Even fi rms
that are not directly engaged in international
transactions may see their profi ts affected by
exchange rate fl uctuations through competition
from foreign fi rms in the domestic market. The
overall impact of an exchange rate shock thus
largely depends on the extent to which a fi rm
is involved in international transactions, either
on the input or on the output side, and on the
competitive environment within which the
fi rm operates. In addition, fi rms may choose to
eliminate part of their exchange rate exposure –
at least in the short to medium-run – through
hedging strategies.
Increased globalisation may signifi cantly
affect these various channels. Increased trade
integration in many cases implies that a larger
share of a fi rm’s sales revenue stems from
international sales, thereby amplifying the
negative effect of an appreciation on profi ts.
At the same time, stronger penetration of the
domestic market by foreign fi rms is likely to lead
to a more competitive operating environment,
This section has benefi ted from contributions by Fabio Fornari, 51
European Central Bank.
Chart 40 Response of GDP growth to a one standard deviation nominal exchange rate shock
(sample: from Q2 1980 to Q1 2007; quarters)
-0.08
-0.07
-0.06
-0.05
-0.04
-0.03
-0.02
-0.01
0.00
0.01
-0.08
-0.07
-0.06
-0.05
-0.04
-0.03
-0.02
-0.01
0.00
0.01
1 3 5 7 9 11 13 15 17 19 21
Source: ECB staff estimates.Note: Dotted lines indicate the confi dence interval.
Chart 41 Evolution of GDP response after ten quarters
(sample: from Q2 1980 to Q1 2007; recursive estimation; quarters)
-0.12
-0.10
-0.08
-0.06
-0.04
-0.02
0.00
0.02
0.04
0.06
-0.12
-0.10
-0.08
-0.06
-0.04
-0.02
0.00
0.02
0.04
0.06
1 7 13 19 25 31 37 43 49 55 61 67
Source: ECB staff estimates.Note: Dotted lines indicate the confi dence interval.

48ECB
Occasional Paper No 94
September 2008
with increased substitutability between domestic
and imported products. This effect would also
tend to amplify the negative profi tability effect of
an appreciation. By contrast, increased sourcing
of intermediate inputs as a result of reduced
trading costs and the emergence of additional
low-cost producers may reduce the profi t-
reducing effect of an exchange rate appreciation.
However, increased competition could also
imply that a larger share of any cost reductions
brought about by an appreciation would have
to be passed on to consumers, thereby limiting
the positive effect on margins. At the same time,
increased fi nancial globalisation can be expected
to reduce the costs of hedging against exchange
rate fl uctuations, which may, in turn, increase
the share of the overall exchange rate exposure
that a fi rm insures itself against. Thus, a priori
it is diffi cult to predict the magnitude and even
the direction of the effect of globalisation on the
link between fi rms’ profi ts and exchange rate
movements.
The empirical literature on the exchange
rate exposure of fi rms provides evidence for
signifi cant cross-country variation, with the
overall level of exposure appearing to be
relatively low. Early results (Jorion (1990) and
Bodnar and Gentry (1993)) unanimously showed
that exchange rate fl uctuations infl uence fi rms’
profi ts in the United States to a very low extent.
In particular, there is a weak contemporaneous
relationship between exchange rates and stock
returns of US multinational fi rms. As shown by
Jorion (1990), for instance, only 15 out of 287
US multinationals exhibit signifi cant exchange
rate exposures which increase with the share of
foreign operations 52. For other countries, the
literature provides evidence of some stronger
exchange rate exposure. In Canada and Japan,
for instance, Bodnar and Gentry (1993) fi nd
more signifi cant exchange rate exposure using
industry returns instead of stock returns. The
result for Japanese multinationals is also
supported by He and Ng (1998). However, on
large samples of countries, both developed and
developing, Griffi n and Stulz (2001) show that
exchange rates do not matter much for the value
of industries. Overall, the empirical fi ndings
seem unanimously to favour the idea that
contemporaneous exchange rate fl uctuations
affect shareholder wealth mainly in the case
of non-US stocks. In addition, the empirical
literature suggests that the risk exposure patterns
are to a large extent industry-specifi c and tend
to vary with the time horizon.
In order to analyse possible changes in the
relationship between exchange rates and profi ts,
data have been collected on a large number of
fi rms from euro area countries using earning as
the measure of fi rms’ profi tability. The sample
consists of 12,159 listed fi rms from six industrial
countries 53, namely the United States, Japan,
Germany, France, Italy and the United Kingdom.
The sample period is from March 1973 to June
2007. As the impact of exchange rate movements
is likely to differ depending on the degree of
international involvement of a fi rm, fi rms are
classifi ed in three categories according to the
share of international sales in total net sales as
of end 2005: large and small multinationals, i.e.
fi rms with an above-median or below-median
share of international sales in total net sales
respectively and domestic fi rms, i.e. fi rms with
no international sales.
Based on the cross-section of fi rms, the following
equation is estimated for each country:
∆It+1/t = αi + δi
∆NEERt / t-4
+ εit(7)
where ΔIt+1/t is the quarterly rate of change
(between (t+1) and (t)), of an earnings index
calculated from the price to earnings ratio and
the price index of stocks, ΔNEERt/t-4 is the
annual rate of change of the trade weighted
nominal exchange rate index over the previous
four quarters, δi is the coeffi cient of interest,
refl ecting the elasticity of earnings growth
These fi ndings are consistent with Amihud (1994), who reports 52
no signifi cant contemporaneous exposure for the 32 largest US
exporting fi rms and Bartov and Bodnar (1994), who fi nd no
signifi cant link between exchange rate changes and stock returns
for a sample of 208 fi rms with international activity.
Germany (247 fi rms), France (9243 fi rms), Italy (142 fi rms), 53
Japan (995 fi rms), the United Kingdom (543 fi rms) and the
United States (989 fi rms).

49ECB
Occasional Paper No 94
September 2008
4 OTHER EFFECTS
OF EXCHANGE
RATE CHANGESto past developments in exchange rates and
εit is the white noise error term. For most
fi rms, δi can be expected to be negative, as an
appreciation leads to a reduction in earnings
growth. Only in the case of a fi rm with largely
domestic sales, limited foreign competition
in the domestic market and signifi cant
international sourcing of imports could one
expect a positive sign. In order to measure how
the link between profi ts and exchange rates has
changed over time as the operating environment
has become increasingly globalised, the
equation is estimated recursively, starting
with the initial sample from March 1973 to
January 1991.
The evolution of FX exposure from the recursive
estimation of equation (7) is reported in
Chart 42 for the United States, Japan, Germany
and France. Each point on the charts represents
the estimate of the fi rms’ earnings sensitivity
to exchange rate movements resulting from the
cross-section regression of the quarterly rate of
change in earnings against the annual change in
the effective exchange rate.
Most of the time, the effect of a change in the
exchange rate on the earnings of non-exporters
is positive, but relatively small in magnitude.
This suggests that the sourcing effect outweighs
possible competition effects in the case of
these fi rms. For fi rms with international sales,
however, the competition effect dominates,
implying that an appreciation reduces fi rms’
earnings. The relative sensitivity of the earnings
of small and large multinationals to a change
in the exchange rate varies between countries,
suggesting that fi rms with an above-average
share of international sales are not necessarily
more exposed to exchange rate changes. This
Chart 42 Impact of a 10% appreciation on earnings growth after one year
(sample: from March 1973 to June 2007; recursive estimation)
non-exportersexporters – below median
exporters – adove median
a) United States b) Japan
0.5
0.0
-0.5
-1.0
-1.5
-2.0
-2.5
0.5
0.0
-0.5
-1.0
-1.5
-2.0
-2.51991 1993 1995 1997 1999 2001 20052003 2007
0.5
0.0
-0.5
-1.0
-1.5
-2.0
-2.5
0.5
0.0
-0.5
-1.0
-1.5
-2.0
-2.51980 1983 1986 1989 1992 1995 20011998 2004 2007
c) Germany d) France
0.5
0.0
-0.5
-1.0
-1.5
-2.0
-2.5
0.5
0.0
-0.5
-1.0
-1.5
-2.0
-2.5
1991 1993 1995 1997 1999 20032001 2005 2007
0.5
1.0
0.0
-0.5
-1.0
-1.5
-2.0
-2.5
-3.0
0.5
1.0
0.0
-0.5
-1.0
-1.5
-2.0
-2.5
-3.01980 1985 1990 1995 2000 2005
Source: ECB staff estimates.Note: The categories “Exporters – above median” and “Exporters – below median” refer to exporters whose export earnings as a share of overall earnings area above and below the median share in the overall sample respectively.

50ECB
Occasional Paper No 94
September 2008
could, for example, refl ect the fact that large
multinationals may in some cases also source a
large part of their inputs internationally and/or
that large multinationals more actively manage
their sales in relation to exchange rate exposure.
Regarding the evolution of the exchange rate
sensitivity of earnings over time, for most fi rm
categories and most countries, no clear trend
can be identifi ed, with French fi rms being the
only exception.
Turning in more detail to the country results, US
non-exporters appear to benefi t moderately from
an appreciation, with this effect disappearing in
the latter part of the sample (Chart 42a). The
impact on the earnings of small multinationals
is relatively limited and close to zero in the
middle of the sample. The earnings of large
multinationals appear to be most affected, in
line with the larger exposure on the sales side.
According to these estimates, a 10% effective
appreciation can be expected to reduce the
earnings of large multinationals by around
0.7-0.8. Overall, the estimated coeffi cients for
US fi rms are relatively stable over time. For
Japanese fi rms, the estimated elasticities are
generally small and close to zero in the case
of non-exporters and small multinationals
(Chart 42b). As in the case of US fi rms, the
earnings of large multinationals in Japan are
also most affected by exchange rate changes,
with the overall impact being more limited,
however, with an estimated elasticity of
around 0.3.
In the case of Germany, the effect of a change
in exchange rates on the earnings of non-
exporters is virtually zero over the entire
sample (Chart 42c). The effect on the earnings
of multinationals is signifi cant, with a 10%
appreciation reducing earnings by around 1%.
The effects for small and large multinationals
were initially very similar in magnitude,
with more notable differences starting to
emerge in the late 1990s, as earnings of small
multinationals were affected more strongly than
those of those of large multinationals. Although
the effects fl uctuate somewhat over the sample,
no clear trend over time is apparent. The
estimates for France indicate that the earnings
of French fi rms may be particularly exposed to
exchange rate fl uctuations (Chart 42d). As in
the case of German fi rms and in contrast to US
and Japanese fi rms, the earnings of small French
multinationals are more affected than those of
large multinationals. This exposure increases
more or less continuously up to 2003, with the
elasticity estimate reaching around 2 in the case
of both categories of multinationals.
Overall, the analysis provides evidence for
signifi cant heterogeneity in the extent of
exposure across industrial countries, as well as
large variation in the direction and magnitude of
exposure. Exchange rate movements do matter
for an important fraction of fi rms, although
which fi rms are affected and the direction of
exposure varies over time. However, the results
suggest that despite the rapid internationalisation
of fi rms’ operating environments, this has not
necessarily translated into an increased exposure
of fi rms’ earnings to shocks originating from the
external side.
4.3 THE IMPORTANCE OF VALUATION EFFECTS
FOR THE EURO AREA
The recent wave of fi nancial globalisation has
brought about a sharp increase in cross-border
holdings of foreign assets and liabilities.
Fluctuations in assets prices and exchange rates
may thus affect country portfolios and trigger
potentially large wealth transfers across
countries, which are, in turn, likely to affect
spending behaviour 54. The currency
denomination of assets and liabilities is of
crucial importance for these wealth effects. In
principle, if both assets and liabilities are
denominated in the same currency the net
external wealth position of a country with a net
international investment position (NIIP) of zero
would not be affected by a change in exchange
rates. In the case of a net debtor with both assets
and liabilities denominated in the same foreign
currency, an appreciation of the domestic
See, for example, Tille (2005) for a model-based assessment 54
of the importance of wealth effects for the transmission of US
monetary policy shocks.

51ECB
Occasional Paper No 94
September 2008
4 OTHER EFFECTS
OF EXCHANGE
RATE CHANGEScurrency would, however, imply an improvement
in the NIIP position as the exchange rate effect
on the quantitatively larger gross liabilities
holdings would outweigh the effect on the
asset side.
These effects may be exacerbated or mitigated
if the currency denomination on the asset and
liabilities sides of the balance sheet differs. For
example, in the case of industrialised countries,
assets are generally denominated in foreign
currency, while liabilities are denominated
in domestic currency.55 Thus an exchange
rate effect mainly affects the asset side and
an appreciation actually worsens the NIIP
(measured in domestic currency).
The importance of such exchange rate-induced
valuation effects can be illustrated by the
evolution of the euro area and the US net
international investment position. In cumulated
terms, from 2001 onwards, the euro area current
account has been close to balance, shifting
from a defi cit in 2000 to a surplus in 2002-2005
and back to close to balance in 2006 and 2007
(Chart 43). By contrast, the net liability position
of the euro area declined by around 10% of
GDP over the same period, standing close
to -15% in 2007, refl ecting valuation related
losses. In contrast, the US net liability position
declined over the same period despite a large
and increasing current account defi cit, which
exceeded 5% of GDP from 2004 onwards.
In order to assess the relative impact of the
exchange rate movements on the euro area, the
change in the euro area net international
investment position can be broken down into its
components, which are mainly changes in net
transaction volumes, asset prices and exchange
rates,56 over the period from 2000 to 2006.
The results illustrated in Chart 45 and in Table 8
show that the euro area net international
investment position has deteriorated over the
period from 2000 to 2006 by almost 6% in
cumulated terms. The exchange rate changes
play a major role, accounting for around 5% of
the negative variation, whereas actual
transactions contributed by 1.8%. The impact of
asset price movements in the euro area NIIP
were relatively small and partly offset each other
over time, mainly refl ecting the relatively
synchronised movements in price indices of
foreign assets and liabilities, especially over the
longer term. It is worth noting that the
contribution of exchange rate movements to
changes in the international investment position
of the euro area has always been larger than the
Lane and Milesi-Ferretti (2006).55
For methodological details see ECB (2007).56
Chart 43 Current account balances
(percentage of GDP)
-7
-6
-5
-4
-3
-2
-1
0
1
2
-7
-6
-5
-4
-3
-2
-1
0
1
2
Euro Area
US
1999 2000 2001 2002 2003 2004 2005 20072006
Sources: ECB and Haver Analytics.
Chart 44 Net international investment positions
(percentage of GDP; at end-period)
Euro Area
US
0
-5
-10
-15
-20
-25
0
-5
-10
-15
-20
-25
1999 2000 2001 2002 2003 2004 2005 2006 2007
Sources: ECB and Haver Analytics.

52ECB
Occasional Paper No 94
September 2008
contribution of actual transactions in the annual
change in the euro area NIIP. The FX valuation
effect can thus be seen as the main driver of
changes in the euro area net investment position
in recent years.57
As in most industrialised countries, euro
area external assets tend to be more exposed
to exchange rate movements than external
liabilities. As a consequence, an appreciation
of the euro lowers the domestic-currency
value of external assets more than external
liabilities, leading to a decline in the euro
area’s NIIP. This was, for example, the case
during the period from 2002 to 2003. The
appreciation of the euro in effective terms
and the corresponding negative exchange rate
valuation effects were the main determinants
of the decline in the euro area NIIP in 2002
and the slight further decline in 2003. As
Chart 45 shows, in 2002 and 2003, around
3 percentage points can be attributed to the
exchange rate effect in the decline in the euro
area NIIP.
The euro exchange rate vis-à-vis the US dollar
plays a particularly important role in determining
the returns earned on euro area foreign assets.
Although the bulk of the euro area’s external
holdings are in other European countries, the
currencies of which are in general relatively
stable vis-à-vis the euro, the US dollar is the
dominant foreign currency exposure faced by
the euro area. Moreover, the euro area and the
United States are major partners in cross-border
fi nancing, with the euro area holding around
one quarter of its foreign fi nancial assets in the
United States, whereas both economies have the
The growing importance of valuation effects worldwide has been 57
reported by Lane and Milesi-Ferretti (2008), who show that the
correlation coeffi cient between the cumulative current account
balances and NIIP changes in industrial countries has been
reduced by half, from 0.6 during the period 1982-1992 to 0.3
during the period 1993-2004.
Chart 45 Changes in euro area NIIP
(percentage of GDP)
-6
-5
-4
-3
-2
-1
0
1
2
3
-6
-5
-4
-3
-2
-1
0
1
2
3
2006
valuation adjustments related to asset price changes
valuation adjustments related to exchange rate changes
financial transactions
other adjustments
denominator effect
total change in the net international investment position
2000 2001 2002 2003 2004 2005
Source: ECB calculations based on Eurostat data.
Table 8 Change in euro area NIIP
(1999-2006; percentage of GDP)
Overall -6.0
Transactions -1.8
Asset prices -1.3
Exchange rates -5.1
Growth effect 2.3
Other -0.1
Chart 46 Gross external asset and liability positions of the euro area and the United States
(percentage of GDP)
60
70
80
90
100
110
120
130
140
150
160
60
70
80
90
100
110
120
130
140
150
160
2006
EA assets
EA liabilities
US assets
US liabilities
1999 2000 2001 2002 2003 2004 2005
Source: ECB staff calculations.

53ECB
Occasional Paper No 94
September 2008
4 OTHER EFFECTS
OF EXCHANGE
RATE CHANGESmajority of their foreign liabilities denominated
in their own currencies. Any changes in their
relative asset prices and/or movements in the
euro-dollar exchange rate, therefore, tend to be
transformed into a revaluation adjustment with
an opposite sign in the two economies, therefore
generating transfers of net fi nancial wealth.
At the same time, it is important to note that the
size of the euro area gross external positions
(147% and 159% of GDP at the end of 2005 for
assets and liabilities respectively) exceeds the
size of the corresponding stocks in the United
States, thus rendering the euro area NIIP more
exposed to valuation effects relative to the
United States (Chart 46).

54ECB
Occasional Paper No 94
September 2008
5 CONCLUDING REMARKS
Globalisation is not a new phenomenon, but
recent years have witnessed an acceleration
in its pace and signifi cant modifi cations in its
nature. Global trade patterns have changed, with
emerging market economies, such as China and
India, taking a larger share. The tremendous
increase in world trade in goods and services, as
well as the signifi cant increase in capital fl ows
has triggered a series of structural changes in
product and factor markets.
Against this background, this paper has provided
an analysis of the impact of globalisation forces
on the relationship between exchange rates
and the euro area economy. Although this
relationship is clearly bidirectional, for reasons
of space, this paper has mainly concentrated
on the effect of changes in exchange rates on
a number of economic variables. The issue of
whether globalisation has altered the role of the
exchange rate as a shock absorber of – or as a
transmission channel for – external shocks has
been left for future consideration.
Starting from the historical evolution in the
euro exchange rate and in major globalisation-
induced changes, the paper fi rst shows that
the exchange rate has been a critical, but not a
unique element amid a broad range of external
factors affecting the euro area. Simulation
results from the ECB’s AWM suggest,
however, that, on average, during the fi rst half
of the 2000s, exchange rate changes have been
broadly neutral on euro area activity, as positive
and negative effects have almost cancelled
each other out. Instead, foreign demand has
been a key positive factor supporting euro area
growth since 2000.
The paper addresses the question whether
globalisation-related factors have affected
the information content of the real effective
exchange rates, seen as the traditional measure
of international price competitiveness. By
computing several measures of the real effective
exchange rate using alternative weights, the
paper fi nds that the range of results obtained is
rather narrow. This suggests that, in this respect,
globalisation effects appear to be relatively
limited quantitatively.
Instead, the relationship between exchange
rates and prices appears to have been rather
more clearly infl uenced by globalisation forces.
The estimation of a standard equation of trade
shows active, but rather stable pricing-to-market
behaviour by euro area exporters over the recent
period, notwithstanding increased competitive
pressures from low-cost countries. However,
a comparison of simulation results using two
different vintage versions of the AWM provides
some evidence of possible structural changes.
Concretely, the overall price reaction to a change
in the euro exchange rate may have become
somewhat more muted over time.
A sector-level analysis of the time-variability
of ERPT to import prices shows at most some
moderate decline in the magnitude of aggregate
ERPT. Moreover, estimation of ERPT to import
prices at the sectoral level does not provide
evidence of any signifi cant instability in the
relationship over time. Instead, the analysis
reveals signifi cant differences in the degree of
ERPT across various sectors of the economy.
This, in turn, may have caused a decrease in the
overall ERPT, given that trade appears to have
shifted over time to less exchange rate sensitive
sectors.
Regarding the impact of globalisation on
the relationship between exchange rates and
consumer price infl ation, a rolling panel VAR
estimation over the period 1980-2007 suggests
that, overall, for the 11 industrial countries
included in the panel, the impact of an exchange
rate shock on consumer price infl ation appears
to have declined somewhat over time.
Third, the paper provides an assessment of
whether the hypothesis of an exchange rate
“disconnect” from trade fl ows and GDP growth
is relevant to the euro area economy. Based on
the recursive estimation of a standard model of
trade, it is shown that the impact of exchange
rate changes on extra-euro area export volumes

55ECB
Occasional Paper No 94
September 2008
5 CONCLUDING
REMARKSof goods may have declined somewhat over time.
As there is no evidence of increased pricing-
to-market by euro area exporters, the decline
in the responsiveness of trade fl ows over time
may refl ect possible structural changes in the
exchange rate-trade fl ows nexus. This decline is,
however, not found for all euro area countries,
with cross-country differences possibly stemming
from differences in the extent to which the use
of imported inputs in the production of export
goods has increased over time.
A gravity model of trade incorporating
information at the sectoral level allows the
conclusion to be drawn that changes in the
exchange rate responsiveness of overall exports
may well have been triggered by shifts in the
industry and destination composition of euro
area exports. While industry effects would tend
to reduce this responsiveness for all countries
examined, geographical composition effects are
found to be particularly important in explaining
cross-country differences. In contrast to goods
exports, export volumes of services appear to
be increasingly affected by changes in exchange
rates, refl ecting the increasing tradeability of
services and, overall, stronger competitive
pressures over the last decade.
Regarding the overall impact of exchange rate
changes on real GDP, the paper investigates
whether the responsiveness of overall GDP
has also changed over time, refl ecting, for
example, the variability of trade volume
responses over time. The results of the rolling
panel VAR regression suggest that the impact of
an exchange rate shock on euro area GDP has
remained fairly stable over time.
Fourth, the link between exchange rates and
economic performance taking a fi rm-level
perspective is analysed. An empirical analysis
of the link between exchange rates and earnings/
returns for listed fi rms in several industrial
countries over the period 1973-2007 shows no
clear change in the responsiveness of earnings
to changes in exchange rates for most countries.
Finally, other potential transmission channels
of exchange rate fl uctuations to the economy
are investigated. Valuations effects through
the impact of an exchange rate change on the
domestic currency value of foreign assets
and liabilities holdings become all the more
important in the presence of tighter links
between the euro area economy and its external
environment. It is shown that, over the recent
period, exchange rate movements have been
the most important factor explaining changes in
the euro area international investment position,
even more so than actual transactions.
Admittedly, this paper has not fully taken into
consideration that the mostly endogenous nature
of the exchange rate calls for its role as a shock
absorber to also be studied. This, however, was
done expressly to limit the length of the paper and
is an aspect that could be studied in the future.

56ECB
Occasional Paper No 94
September 2008
REFERENCES
Amihud, Y. (1994), “Exchange rates and the valuation of equity shares”, in Amihud, Y. and
R. Levich (eds), Exchange Rates and Corporate Performance, New York: Irwin, pp. 49-59.
Andersen, T.G. and T. Bollerslev (1998), ”Answering the sceptics: Yes, standard volatility models
do provide accurate forecasts”, International Economic Review, Vol. 39, No.4, pp. 885-905.
Anderton, R. (2003), “Extra-euro area manufacturing import prices and exchange rate pass-through”,
ECB Working Paper Series No. 219, March.
Anderton, R. and F. di Mauro (2007), The External Dimension of the Euro Area. Assessing the
Linkages, Cambridge: Cambridge University Press.
Baillie, R.T., T. Bollerslev and H.O. Mikkelsen (1996), “Fractionally integrated generalized
autoregressive conditional heteroskedasticity”, Journal of Econometrics, Vol. 74, pp. 3-30.
Bailliu, J. and E. Fujii (2004), “Exchange Rate Pass-Through and the Infl ation Environment in
Industrialized Countries: An Empirical Investigation”, Bank of Canada Working Papers
No. 04-21.
Balassa, B. (1965), “Trade liberalization and revealed comparative advantage”, Manchester School
of Economic and Social Studies, No. 33, May.
Baldwin, R. (2006), “In or Out: Does it matter? An evidence-based analysis of the euro’s trade
effects”, Centre for Economic Policy Research Working Paper, London, June.
Bartov, E. and G.M. Bodnar (1994), “Firm valuation, earnings expectations, and the exchange-rate
exposure effect”, Journal of Finance, Vol. 49, No. 5, pp. 1755-1785.
Bartram, S. M., A.G. Karolyi and S. Kleimeier (2002), “The impact of the euro on foreign exchange
rate risk exposures”, Ohio State University Working Paper.
Baumann, U. and F. di Mauro, (2006), “Globalisation and euro area trade: interactions and
challenges”, ECB Occasional Paper Series No. 55, March.
Berthou, A. (2008), “An investigation on the effect of real exchange rate movements on OECD
bilateral exports”, ECB Working Paper Series, No. 920.
Bodnar, G.M. and W.M. Gentry (1993), “Exchange rate exposure and industry characteristics:
Evidence from Canada, Japan, and the USA”, Journal of International Money and Finance,
Vol. 12, No. 1, pp. 29-45.
Bodnar, G.M., G.S. Hayt and R.C. Marston (1998), “1998 Wharton Survey of Financial Risk
Management by U.S. Non-Financial Firms”, Financial Management, Vol. 27, No. 4, pp. 70-91.
Buldorini, L., S. Makrydakis. and C. Thimann (2002), “The effective exchange rates of the euro”,
ECB Occasional Paper Series No. 2, February.

57ECB
Occasional Paper No 94
September 2008
REFERENCES
Campa, J.M. and J.M. González-Minguez (2006), “Differences in exchange rate pass-through in
the euro area”, European Economic Review, Vol. 50, No. 1, pp. 121-145.
Campa J. and L. Goldberg (2005), “Exchange rate pass-through into import prices”, Review of
Economics and Statistics, Vol. 87, No. 4, pp. 679-690.
Capstaff, J., A.P. Marshall and J. Hutton (2007), “The introduction of the euro and derivative use
in French fi rms”, Journal of International Financial Management & Accounting, Vol. 18, No. 1,
pp. 1-17.
Ca’Zorzi, M., E. Hahn and M. Sanchez (2007), “Exchange Rate Pass-Through in Emerging
Markets”, ECB Working Paper Series No. 739, March.
Ca’Zorzi, M. and B. Schnatz (2007), “Explaining and forecasting euro area exports: Which
competitiveness indicator performs best?”, ECB Working Paper Series No. 833, November.
De Bandt, O., A. Banerjee, and T. Kozluk (2007), “Measuring long-run exchange rate pass-through”,
Banque de France Working Paper No. 173, July.
Dées, S., F. di Mauro, M.H. Pesaran and V. Smith (2005), “Exploring the international linkages of
the Euro Area: A Global VAR analysis”, ECB Working Paper Series No. 568 and Journal of
Applied Econometrics, 2007, Vol. 22, No. 1, pp. 1-38.
Dées, S., S. Holly, M.H. Pesaran and V. Smith (2007), “Long Run Macroeconomic Relations in the
Global Economy,” Economics – The Open-Access, Open-Assessment E-Journal, Kiel Institute
for the World Economy, Vol. 1(3).
Döhring, B. (2008), “Hedging and invoicing strategies to reduce exchange rate exposure:
a euro-area perspective”, European Economy Economic Papers No. 299, January.
Esteves, P.S. and C. Reis (2006), “Measuring export competitiveness: Revisiting the effective
exchange rate weights for the euro area countries”, Banco de Portugal Working Papers No. 11,
May.
European Central Bank (2005), “Competitiveness and export performance of the euro area”,
Monetary Policy Committee Task Force of the European System of Central Banks, Occasional
Paper Series No. 30, June.
European Central Bank (2007), “Explaining changes in the net international investment position”,
Monthly Bulletin, Box No. 5, January.
European Central Bank (2007), “Review of the international role of the euro”.
European Central Bank (2008) “Globalisation, trade and the euro area macroeconomy”, Monthly
Bulletin, January.
Fagan G., J. Henry and R. Mestre (2005), “An Area-Wide Model (AWM) for the euro area”,
ECB Working Paper Series No. 42 and Economic Modelling, Vol. 22, No.1, pp. 39-59.

58ECB
Occasional Paper No 94
September 2008
Flam, H. and H. Nordstrom (2003), “Trade volume effects of the euro: Aggregate and sector
estimates”, Institute for International Economic Studies, Seminar Paper No. 746, Stockholm
University.
Gagnon, J.E. and J. Ihrig (2004), “Monetary Policy and Exchange Rate Pass-Through”, International
Journal of Finance and Economics, Vol. 9, pp. 315-338.
Griffi n, J.M. and R.M. Stulz (2001) “International Competition and Exchange Rate Shocks:
A cross-country industry analysis of stock returns”, Review of Financial Studies, Vol. 14,
No. 1, pp. 215-41.
Grossman, G. and E. Rossi-Hansberg (2006), “Trading tasks: A simple theory of offshoring”,
NBER Working Paper, No. 12721, December.
Gust, C., S. Leduc and R.J. Vigfusson (2006) “Trade integration, competition, and the decline in
exchange-rate pass-through”, Board of Governors of the Federal Reserve System International
Finance Discussion Papers No. 864.
Hahn, E. (2003), “Pass-through of external shocks to euro area infl ation”, ECB Working Paper
Series, No. 243, July.
Hahn, E. (2007), “The Impact of Exchange Rate Shocks on Sectoral Activity and Prices in the Euro
Area”, ECB Working Paper Series, No. 796, August.
He, J. and L.N. Ng (1998), “The Foreign Exchange Exposure of Japanese Multinational
Corporations”, Journal of Finance, Vol. 53, No. 2, pp. 733-753.
Hsieh, D. A. (1989), “Testing for non-linear dependence in daily foreign exchange rates”, Journal
of Business, Vol. 62, pp. 339-368.
Hummels, D. and P.J. Klenow (2005), “The variety and quality of a nation’s exports”, American
Economic Review Vol. 95, No. 3, pp. 704-723, June.
Hutson, E. and S. Stevenson (2007), “Openness and foreign exchange exposure: A fi rm-level
multi-country study”, mimeo.
Ihrig, J., M. Marazzi and A. Rothenberg (2006), “Exchange-rate pass-through in the G-7 countries”,
Board of Governors of the Federal Reserve System International Finance Discussion Papers
No. 851.
Jorion, P. (1990), “The exchange rate exposure of U.S. multinationals”, Journal of Business,
Vol. 63, No. 3, pp. 331-345.
Kaminsky, G.L., C. Reinhart and C.A. Végh (2004), “When it rains it pours: Procyclical capital
fl ows and policies”, in Gertler, M. and K. S. Rogoff (eds) NBER Macroeconomic Annual 2004,
Cambridge, Massachusetts: MIT Press, pp. 11-53.
Kamps, A. (2006), “The euro as invoicing currency in international trade”, ECB Working Paper
Series, No. 665.

59ECB
Occasional Paper No 94
September 2008
REFERENCES
Landolfo, L. (2007), “Modelling the impact of external factors on the euro area’s HICP and
real economy: a focus on pass-through and the trade balance”, ECB Working Paper Series,
No. 789.
Lane, P.R. and G.M. Milesi-Ferretti (2006), “A Global Perspective on External Positions,” in
R.H. Clarida, (ed.) G-7 Current Account Imbalances: Sustainability and Adjustment, Chicago
IL: University of Chicago Press, pp. 67-102.
Lane, P.R. and G.M. Milesi-Ferretti (2008) “International Investment Patterns,” CEPR Discussion
Papers No. 4499, 2004.
Lane, P.R. and J.C. Shambaugh (2007), “Financial exchange rates and international currency
exposures”, CEPR Discussion Paper No. 6473, September .
Liesner , H.H. (1958), “The European Common Market and British Industry”, Economic Journal,
Vol. 68, pp. 302-316.
Marazzi, M., N. Sheets, N. Vigfusson, J. Faust, J. Gagnon, J. Marquez, R. Martin, T. Reeve and
J. Rogers (2005) “Exchange rate pass-through to U.S. import prices: some new evidence”,
Board of Governors of the Federal Reserve System International Finance Discussion Paper,
No. 832, April.
Muller, A. and W.F.C. Verschoor (2006), “European Foreign Exchange Risk Exposure”, European
Financial Management, Vol. 12, No. 2, pp. 195-220.
Mumtaz, H., O. Oomen and J. Wang (2006), “Exchange rate pass-through into UK import prices”,
Bank of England Working Paper No. 312, November.
Saikkonen, P. (1991), “Asymptotically effi cient estimation in cointegrated regressions”,
Econometric Theory, Vol. 7, pp. 1-21.
Stahn, K. (2006a) “Has the impact of key determinants of German exports changed?”, Deutsche
Bundesbank Discussion Paper No. 07/2006.
Stahn, K. (2006b) “Has the export pricing behaviour of German enterprises changed? Empirical
evidence from German sectoral export prices”, Deutsche Bundesbank Discussion Paper
No. 37/2006.
Tille, C. (2005), “Financial Integration and wealth effects of exchange rate fl uctuations”, Federal
Reserve Bank of New York Staff Report No. 226, October .
Vigfusson, R., N. Sheets and J.E. Gagnon (2007), “Exchange rate pass-through to export prices:
Assessing some cross-country evidence”, Board of Governors of the Federal Reserrve System
International Finance Discussion Papers No. 902.
Yamano, N. and N. Ahmad (2006), “The OECD input-output database” OECD Science, Technology
and Industry Working Papers No. 2006/8.

60ECB
Occasional Paper No 94
September 2008
EUROPEAN CENTRAL BANK
OCCASIONAL PAPER SERIES SINCE 2007
55 “Globalisation and euro area trade: Interactions and challenges” by U. Baumann and F. di Mauro,
February 2007.
56 “Assessing fi scal soundness: Theory and practice” by N. Giammarioli, C. Nickel, P. Rother,
J.-P. Vidal, March 2007.
57 “Understanding price developments and consumer price indices in south-eastern Europe” by
S. Herrmann and E. K. Polgar, March 2007.
58 “Long-Term Growth Prospects for the Russian Economy” by R. Beck, A. Kamps and
E. Mileva, March 2007.
59 “The ECB Survey of Professional Forecasters (SPF) a review after eight years’ experience”, by
C. Bowles, R. Friz, V. Genre, G. Kenny, A. Meyler and T. Rautanen, April 2007.
60 “Commodity price fl uctuations and their impact on monetary and fi scal policies in Western and
Central Africa” by U. Böwer, A. Geis and A. Winkler, April 2007.
61 “Determinants of growth in the central and eastern European EU Member States – A production
function approach” by O. Arratibel, F. Heinz, R. Martin, M. Przybyla, L. Rawdanowicz,
R. Serafi ni and T. Zumer, April 2007.
62 “Infl ation-linked bonds from a Central Bank perspective” by J. A. Garcia and A. van Rixtel,
June 2007.
63 “Corporate fi nance in the euro area – including background material”, Task Force of the
Monetary Policy Committee of the European System of Central Banks, June 2007.
64 “The use of portfolio credit risk models in central banks”, Task Force of the Market Operations
Committee of the European System of Central Banks, July 2007.
65 “The performance of credit rating systems in the assessment of collateral used in Eurosystem
monetary policy operations” by F. Coppens, F. González and G. Winkler, July 2007.
66 “Structural reforms in EMU and the role of monetary policy – a survey of the literature” by
N. Leiner-Killinger, V. López Pérez, R. Stiegert and G. Vitale, July 2007.
67 “Towards harmonised balance of payments and international investment position statistics – the
experience of the European compilers” by J.-M. Israël and C. Sánchez Muñoz, July 2007.
68 “The securities custody industry” by D. Chan, F. Fontan, S. Rosati and D. Russo, August 2007.
69 “Fiscal policy in Mediterranean countries – Developments, structures and implications for
monetary policy” by M. Sturm and F. Gurtner, August 2007.

61ECB
Occasional Paper No 94
September 2008
EUROPEAN
CENTRAL BANK
OCCAS IONAL
PAPER SERIES
70 “The search for Columbus’ egg: Finding a new formula to determine quotas at the IMF”
by M. Skala, C. Thimann and R. Wölfi nger, August 2007.
71 “The economic impact of the Single Euro Payments Area” by H. Schmiedel, August 2007.
72 “The role of fi nancial markets and innovation in productivity and growth in Europe”
by P. Hartmann, F. Heider, E. Papaioannou and M. Lo Duca, September 2007.
73 “Reserve accumulation: objective or by-product?” by J. O. de Beaufort Wijnholds and
L. Søndergaard, September 2007.
74 “Analysis of revisions to general economic statistics” by H. C. Dieden and A. Kanutin,
October 2007.
75 “The role of other fi nancial intermediaries in monetary and credit developments in the euro area”
edited by P. Moutot and coordinated by D. Gerdesmeier, A. Lojschová and J. von Landesberger,
October 2007.
76 “Prudential and oversight requirements for securities settlement a comparison of cpss-iosco”
by D. Russo, G. Caviglia, C. Papathanassiou and S. Rosati, November 2007.
77 “Oil market structure, network effects and the choice of currency for oil invoicing”
by E. Mileva and N. Siegfried, November 2007.
78 “A framework for assessing global imbalances” by T. Bracke, M. Bussière, M. Fidora and
R. Straub, January 2008.
79 “The working of the eurosystem: monetary policy preparations and decision-making – selected
issues” by P. Moutot, A. Jung and F. P. Mongelli, January 2008.
80 “China’s and India’s roles in global trade and fi nance: twin titans for the new millennium?”
by M. Bussière and A. Mehl, January 2008.
81 “Measuring Financial Integration in New EU Member States” by M. Baltzer, L. Cappiello,
R.A. De Santis, and S. Manganelli, January 2008.
82 “The Sustainability of China’s Exchange Rate Policy and Capital Account Liberalisation”
by L. Cappiello and G. Ferrucci, February 2008.
83 “The predictability of monetary policy” by T. Blattner, M. Catenaro, M. Ehrmann, R. Strauch
and J. Turunen, March 2008.
84 “Short-term forecasting of GDP using large monthly datasets: a pseudo real-time forecast
evaluation exercise” by G. Rünstler, K. Barhoumi, R. Cristadoro, A. Den Reijer, A. Jakaitiene,
P. Jelonek, A. Rua, K. Ruth, S. Benk and C. Van Nieuwenhuyze, May 2008.
85 “Benchmarking the Lisbon Strategy” by D. Ioannou, M. Ferdinandusse, M. Lo Duca, and
W. Coussens, June 2008.

62ECB
Occasional Paper No 94
September 2008
86 “Real convergence and the determinants of growth in EU candidate and potential candidate
countries: a panel data approach” by M. M. Borys, É. K. Polgár and A. Zlate, June 2008.
87 “Labour supply and employment in the euro area countries: developments and challenges”,
by a Task Force of the Monetary Policy Committee of the European System Of Central Banks,
June 2008.
88 “Real convergence, fi nancial markets, and the current account – Emerging Europe versus
emerging Asia” by S. Herrmann and A. Winkler, June 2008.
89 “An analysis of youth unemployment in the euro area” by R. Gomez-Salvador and N. Leiner-Killinger,
June 2008.
90 “Wage growth dispersion across the euro area countries: some stylised facts” by M. Anderson,
A. Gieseck, B. Pierluigi and N. Vidalis, July 2008.
91 “The impact of sovereign wealth funds on global fi nancial markets” by R. Beck and
M. Fidora, July 2008.
92 “The Gulf Cooperation Council countries – economic structures, recent developments and role
in the global economy” by M. Sturm, J. Strasky, P. Adolf and D. Peschel, July 2008
93 “Russia, EU enlargement and the euro” by Z. Polański and A. Winkler, August 2008.
94 “The changing role of the exchange rate in a globalised economy” by F. di Mauro, R. Rüffer
and I. Bunda, September 2008.

by Filippo di Mauro, Rasmus Rüffer and Irina Bunda
Occas iOnal PaPer ser i e snO 94 / august 2008
tHe cHanging rOle OF tHe eXcHange rate in a glOBaliseD ecOnOMY