no dutch treat: oil and gas wealth benefits all of canada
TRANSCRIPT

1 Commentary – No Dutch Treat: Oil and Gas Wealth Benefits All of Canada – May 2012
The authors of this document has worked independently and is solely responsible for the views presented here. The opinions are not necessarily those of the Macdonald-Laurier Institute, its Directors or Supporters.
Number 1 in the High Dollar Series of Commentaries
No Dutch Treat: Oil and Gas Wealth Benefits All of Canada Robert P. Murphy and Brian Lee Crowley
Introduction Recently a number of high-profile Canadians, including the Premier of Ontario, Dalton McGuinty, and the Leader of the Official Opposition (NDP), Thomas Mulcair, have disparaged the effects of high commodity prices and Canadian exports of such products because of their impact on the value of the Canadian dollar.1 Many have linked Canada’s current experience with that of the Netherlands in the 1970s, which was dubbed the “Dutch Disease,” referring to a situation where high commodity prices and exports lead to an appreciation of the currency, which in turn subsequently hurts other exports, particularly manufacturing. The Macdonald-Laurier Institute has commissioned a series of essays to explore the accuracy of this argument, the real effects of a high dollar, and the state of manufacturing and resource extraction in Canada.
This first essay in this series examines the benefits of the Canadian petroleum industry to provinces other than the oil- and gas-rich western provinces of British Columbia (BC), Alberta, and Saskatchewan. It turns out that citizens, businesses, and governments in other parts of the country enjoy substantial benefits from resource extraction in western Canada, which at the very least complicates the simplistic picture painted by those decrying the impacts on the dollar and Canadian manufacturing.
The “Dutch Disease” International trade theorists have developed formal models2 illustrating the possibility of a global resource boom (in the oil sector, for example) indirectly hurting the manufacturing sector in oil-rich countries. Intuitively, the mechanism is that the increased global demand for the commodity causes an appreciation of the resource-rich country’s currency, which (other things equal) makes it harder for other manufacturers in that same country to export their own wares because of the change in the currency. In other words, the appreciation
May 2012

2 Commentary – No Dutch Treat: Oil and Gas Wealth Benefits All of Canada – May 2012
of the currency from the commodity boom makes other goods like manufactured products less price competitive. This situation is referred to as the “Dutch Disease” because of the experience of the Netherlands in the 1970s, and it is what many critics allege has been happening in Canada.
Although such effects can occur in simplified models of the economy, it is not obvious what larger conclusions one should draw from them, especially concerning government policies towards natural resource development. For example, would the critics who decry the “Dutch Disease” go so far as to say Canadians would be better off if their oil and gas deposits were magically transported to other countries, so that their citizens, instead of Canadians, would earn a flow of goods and financial assets from the rest of the world?
International trade with multiple currencies is a difficult topic that confuses even professional economists. The layperson might benefit from first thinking about these issues in the context of an economy with a few individuals who all use the same currency. In this setting, suppose one individual suddenly discovered abundant supplies of oil on his land, and then began selling them to his neighbours. At first, one might think that this behavior would “hurt the export market” of everybody else in the small community, because now people would spend some of their money on the newly discovered oil, rather than spending it on goods and services sold by other individuals.
Yet it obviously would be shortsighted to stop the analysis there. After all, the person who discovered the oil deposit would himself be able to spend more on the wares of his neighbours, because of his higher monetary income (from the sale of the oil). Trade patterns would be rearranged, of course, but the mere discovery of oil deposits per se wouldn’t hurt (on average) the standard of living of the others in the community; on the contrary they would be enriched by the greater abundance of resources.
There is a similar effect when it comes to natural resource extraction in Canada. Yes, it may be true that high worldwide commodity prices cause foreigners to concentrate more of their purchases on Canadian petroleum exports, rather than Canadian manufactured goods. But at the same time, these increased earnings in the Canadian petroleum sector allow for greater purchases of manufactured goods within Canada. In principle these effects could be quite large, showing that Canadians in general and even the manufacturing sector in particular are enriched by the presence of bountiful resource deposits.
Provincial Distribution of Employment and Output Impacts Generated by Canadian Resource Development As explained in the previous section, a major weakness in the “Dutch Disease” perspective is that it overlooks the sense in which western Canadian resource development provides “export markets” for the other provinces. Thus, even if it is true that other things equal high worldwide commodity prices lead to large Canadian resource exports and hence make it harder for Canadian manufacturers to export their own goods, in practice other things aren’t equal, because the profitable Canadian resource sectors are able to demand more goods from manufacturers in neighbouring provinces.
To get a sense of just how large this effect might be, we will summarize three recent papers that model the economic impact of (segments of) the energy sector on the various provinces. The studies focus on different activities, and involve two independent methodologies, yet all reach the same conclusion: Western resource extraction showers large economic benefits on all provinces.

3 Commentary – No Dutch Treat: Oil and Gas Wealth Benefits All of Canada – May 2012
Study #1: Alberta Oil Sands (CERI 2011)
The first model we will review comes from the Canadian Energy Research Institute (CERI).3 The purpose of the CERI study was to model the economic impacts (including Canadian and US GDP growth, job creation, etc.) stemming from oil sands projects in Alberta over a 25-year horizon, under four scenarios (“cases”) making different assumptions about the development of pipeline capacity, including the Keystone XL, Enbridge Northern Gateway, and other pipeline projects that may or may not come to fruition.
The CERI study finds that the oil sands development impacts other provinces, because the projects in Alberta require materials from other provinces. (The study also takes into account the further spending that this initial burst sets in motion.) Even in the most conservative of scenarios, Case 1 (where only existing pipeline capacity is considered), the CERI study estimates the following provincial distribution of economic benefits attributable to the development of Alberta oil sands (see table 1).
TABLE 1 CERI model’s estimates of regional impact due to Alberta oil sands development, “Case 1,” from 2010-2035.
Investments and Operations GDP ($CAD Million) Employment (Thousand Person-Years) Alberta 2,165,038 10,372 British Columbia 28,776 426 Manitoba 4,323 67 New Brunswick 838 12 Newfoundland & Labrador 369 4 Northwest Territories 151 2 Nova Scotia 857 12 Nunavut 30 0 Ontario 64,888 882 Prince Edward Island 65 1 Quebec 14,066 211 Saskatchewan 4,525 55 Yukon Territory 40 1 Total Canada 2,283,966 12,046
SOURCE: Adapted from Honarvar et al. (2011), Table 1.3, page 12.
As table 1 indicates, the CERI model finds – unsurprisingly – that the lion’s share of both GDP and employment impacts due to Albertan oil sands projects, accrue to Alberta itself. Even so, these projects shower a substantial benefit (in absolute terms) on other provinces. For example, Ontario alone is projected to enjoy $64.9 billion in higher economic output, and 882,000 person-years of additional employment, over the 25-year period. To repeat, this incremental economic activity in Ontario is due solely to sales made to Albertan oil sands projects, under the very conservative assumption that no additional pipeline capacity is added.
4 Commentary – No Dutch Treat: Oil and Gas Wealth Benefits All of Canada – May 2012
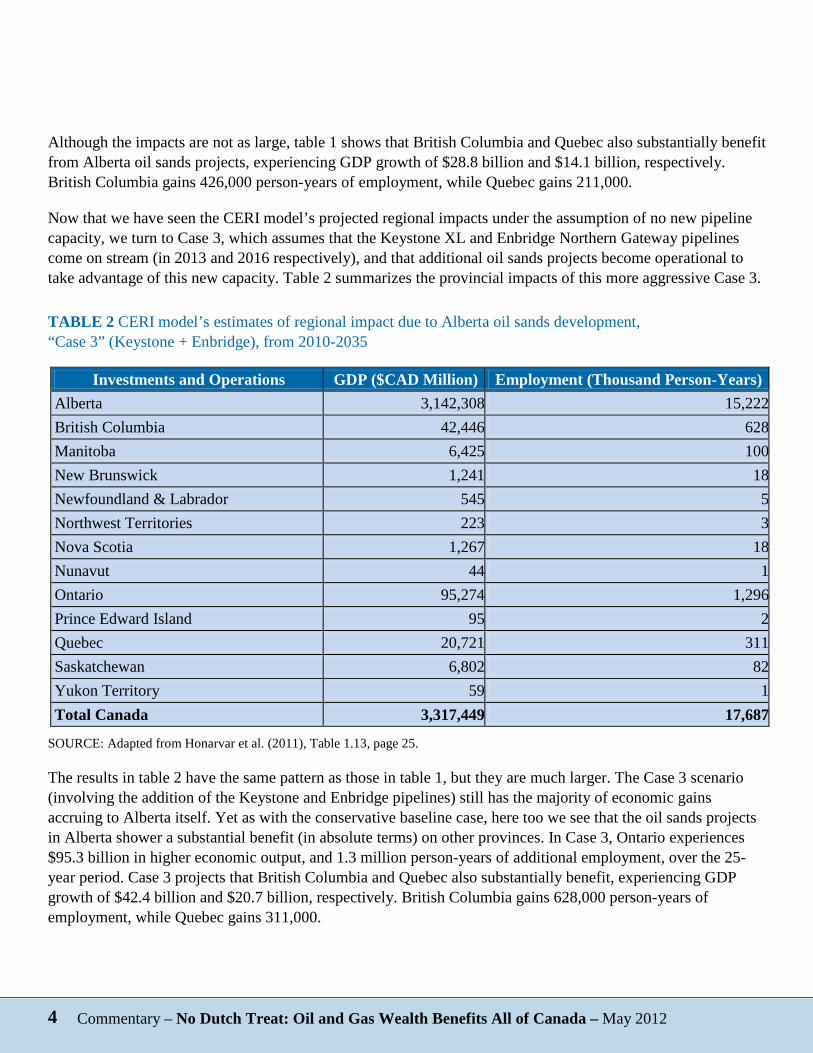
Although the impacts are not as large, table 1 shows that British Columbia and Quebec also substantially benefit from Alberta oil sands projects, experiencing GDP growth of $28.8 billion and $14.1 billion, respectively. British Columbia gains 426,000 person-years of employment, while Quebec gains 211,000.
Now that we have seen the CERI model’s projected regional impacts under the assumption of no new pipeline capacity, we turn to Case 3, which assumes that the Keystone XL and Enbridge Northern Gateway pipelines come on stream (in 2013 and 2016 respectively), and that additional oil sands projects become operational to take advantage of this new capacity. Table 2 summarizes the provincial impacts of this more aggressive Case 3.
TABLE 2 CERI model’s estimates of regional impact due to Alberta oil sands development, “Case 3” (Keystone + Enbridge), from 2010-2035
Investments and Operations GDP ($CAD Million) Employment (Thousand Person-Years) Alberta 3,142,308 15,222 British Columbia 42,446 628 Manitoba 6,425 100 New Brunswick 1,241 18 Newfoundland & Labrador 545 5 Northwest Territories 223 3 Nova Scotia 1,267 18 Nunavut 44 1 Ontario 95,274 1,296 Prince Edward Island 95 2 Quebec 20,721 311 Saskatchewan 6,802 82 Yukon Territory 59 1 Total Canada 3,317,449 17,687
SOURCE: Adapted from Honarvar et al. (2011), Table 1.13, page 25.
The results in table 2 have the same pattern as those in table 1, but they are much larger. The Case 3 scenario (involving the addition of the Keystone and Enbridge pipelines) still has the majority of economic gains accruing to Alberta itself. Yet as with the conservative baseline case, here too we see that the oil sands projects in Alberta shower a substantial benefit (in absolute terms) on other provinces. In Case 3, Ontario experiences $95.3 billion in higher economic output, and 1.3 million person-years of additional employment, over the 25-year period. Case 3 projects that British Columbia and Quebec also substantially benefit, experiencing GDP growth of $42.4 billion and $20.7 billion, respectively. British Columbia gains 628,000 person-years of employment, while Quebec gains 311,000.
5 Commentary – No Dutch Treat: Oil and Gas Wealth Benefits All of Canada – May 2012
Study #2: Entire Canadian Oil and Gas Sector (CERI 2009)
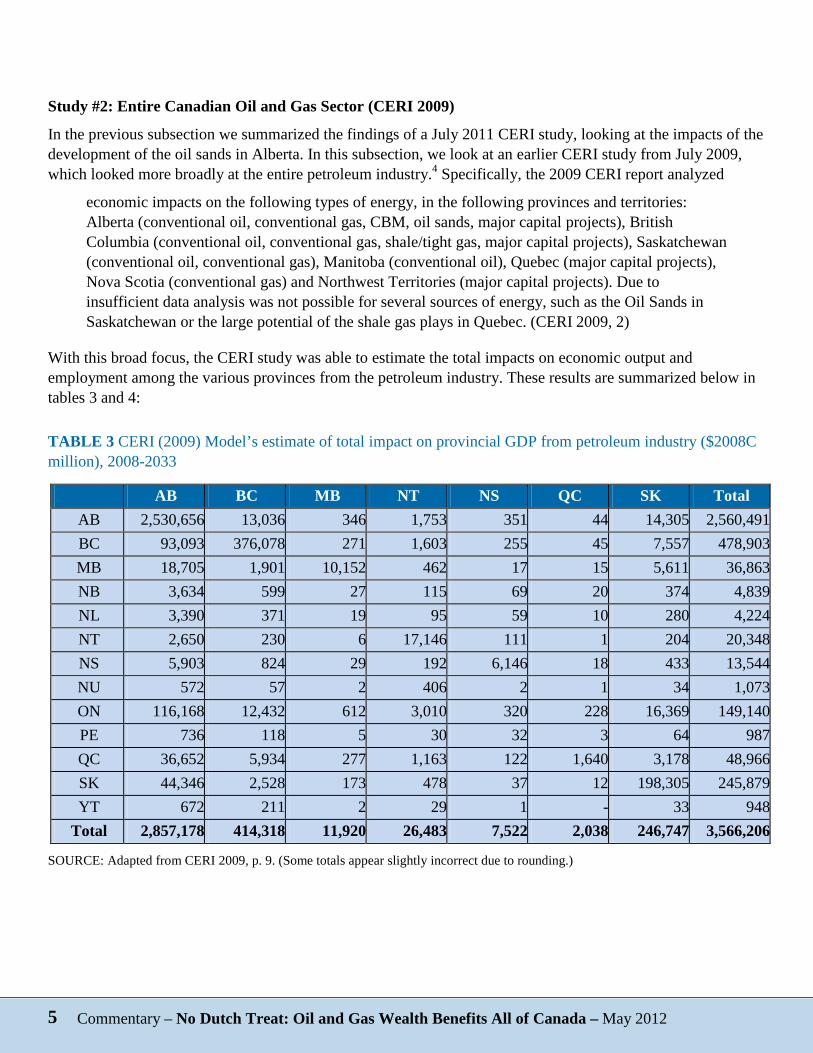
In the previous subsection we summarized the findings of a July 2011 CERI study, looking at the impacts of the development of the oil sands in Alberta. In this subsection, we look at an earlier CERI study from July 2009, which looked more broadly at the entire petroleum industry.4 Specifically, the 2009 CERI report analyzed
economic impacts on the following types of energy, in the following provinces and territories: Alberta (conventional oil, conventional gas, CBM, oil sands, major capital projects), British Columbia (conventional oil, conventional gas, shale/tight gas, major capital projects), Saskatchewan (conventional oil, conventional gas), Manitoba (conventional oil), Quebec (major capital projects), Nova Scotia (conventional gas) and Northwest Territories (major capital projects). Due to insufficient data analysis was not possible for several sources of energy, such as the Oil Sands in Saskatchewan or the large potential of the shale gas plays in Quebec. (CERI 2009, 2)
With this broad focus, the CERI study was able to estimate the total impacts on economic output and employment among the various provinces from the petroleum industry. These results are summarized below in tables 3 and 4:
TABLE 3 CERI (2009) Model’s estimate of total impact on provincial GDP from petroleum industry ($2008C million), 2008-2033
AB BC MB NT NS QC SK Total AB 2,530,656 13,036 346 1,753 351 44 14,305 2,560,491 BC 93,093 376,078 271 1,603 255 45 7,557 478,903 MB 18,705 1,901 10,152 462 17 15 5,611 36,863 NB 3,634 599 27 115 69 20 374 4,839 NL 3,390 371 19 95 59 10 280 4,224 NT 2,650 230 6 17,146 111 1 204 20,348 NS 5,903 824 29 192 6,146 18 433 13,544 NU 572 57 2 406 2 1 34 1,073 ON 116,168 12,432 612 3,010 320 228 16,369 149,140 PE 736 118 5 30 32 3 64 987 QC 36,652 5,934 277 1,163 122 1,640 3,178 48,966 SK 44,346 2,528 173 478 37 12 198,305 245,879 YT 672 211 2 29 1 - 33 948
Total 2,857,178 414,318 11,920 26,483 7,522 2,038 246,747 3,566,206
SOURCE: Adapted from CERI 2009, p. 9. (Some totals appear slightly incorrect due to rounding.)

6 Commentary – No Dutch Treat: Oil and Gas Wealth Benefits All of Canada – May 2012
Table 4 CERI (2009) Model’s estimate of total impact on provincial employment from petroleum industry (thousand person-years), 2008-2033
AB BC MB NT NS QC SK Total AB 13,750 166 4 25 2 1 117 14,065 BC 1,265 2,778 4 27 2 1 90 4,166 MB 342 35 106 9 - - 81 574 NB 71 12 1 3 2 - 8 95 NL 69 7 - 2 1 - 5 85 NT 26 3 - 215 - - 1 245 NS 106 16 1 4 45 - 8 180 NU 10 1 - 7 - - 1 19 ON 1,689 196 10 54 5 4 236 2,193 PE 15 2 - 1 1 - 1 21 QC 600 99 4 23 2 30 54 812 SK 579 41 3 8 - - 1,421 2,052 YT 9 3 - - - - - 13
Total 18,530 3,359 132 379 60 36 2,024 24,522
SOURCE: Adapted from CERI 2009, p. 12. (Some totals appear slightly incorrect due to rounding.)
In tables 3 and 4 above, each column represents the economic impact generated across all provinces by petroleum industry activities within that particular column’s province. For example, looking at just the second column “BC” in table 3 and moving down, we see that over the period specified, petroleum activities in British Columbia will generate an estimated $13.0 billion in additional output in Alberta, $376.1 billion in British Columbia itself, $1.9 billion in Manitoba, and so on. (Note that these figures are simple summations, not discounted present values.) In the same column, we see that Alberta petroleum operations also generate $36.7 billion in additional output in Quebec.
On the other hand, if we want to see the total impact on output that the petroleum industry has for the province of Ontario, we would look at the “ON” row (ninth from the top) in table 3. The petroleum sector’s operations in Alberta alone generate $116.2 billion in output in Ontario, British Columbia generates $12.4 billion, and so on, for a total impact of $149.1 billion in Ontario.
In similar fashion, the final column in table 4 shows that the petroleum sector generates an estimated 2.2 million person-years of additional employment in Ontario alone, during the period 2008-2033, which works out to an average of 88,000 full-time jobs during the entire period. We also see that the petroleum sector in all provinces generates 4.2 million person-years of employment in British Columbia, or the equivalent of 168,000 full-time jobs during the entire period. Finally, Quebec enjoys 812,000 person-years of additional employment, or 32,480 full-time jobs over the entire 25-year period.
7 Commentary – No Dutch Treat: Oil and Gas Wealth Benefits All of Canada – May 2012
This more comprehensive CERI study shows the enormous contribution that the petroleum sector provides to the economies not just of the oil-rich provinces, but all of Canada. The specific mechanism, to repeat, is that the high level of construction and extraction activity in Alberta and other energy-rich areas, ultimately stimulates demand for goods produced in Quebec and elsewhere. This important mechanism shows the danger in a naïve application of the “Dutch Disease” critique of Canadian commodity exports.
Study #3: Enbridge Northern Gateway Pipeline (Wright Mansell Research Ltd.)
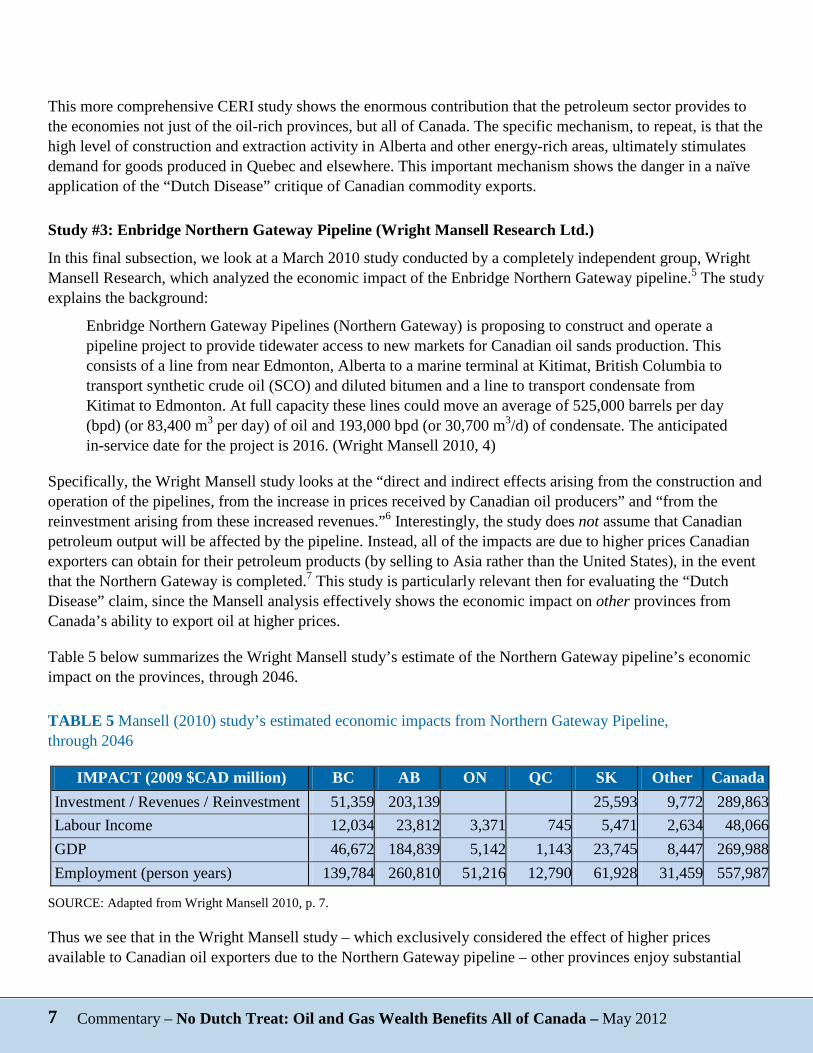
In this final subsection, we look at a March 2010 study conducted by a completely independent group, Wright Mansell Research, which analyzed the economic impact of the Enbridge Northern Gateway pipeline.5 The study explains the background:
Enbridge Northern Gateway Pipelines (Northern Gateway) is proposing to construct and operate a pipeline project to provide tidewater access to new markets for Canadian oil sands production. This consists of a line from near Edmonton, Alberta to a marine terminal at Kitimat, British Columbia to transport synthetic crude oil (SCO) and diluted bitumen and a line to transport condensate from Kitimat to Edmonton. At full capacity these lines could move an average of 525,000 barrels per day (bpd) (or 83,400 m3 per day) of oil and 193,000 bpd (or 30,700 m3/d) of condensate. The anticipated in-service date for the project is 2016. (Wright Mansell 2010, 4)
Specifically, the Wright Mansell study looks at the “direct and indirect effects arising from the construction and operation of the pipelines, from the increase in prices received by Canadian oil producers” and “from the reinvestment arising from these increased revenues.”6 Interestingly, the study does not assume that Canadian petroleum output will be affected by the pipeline. Instead, all of the impacts are due to higher prices Canadian exporters can obtain for their petroleum products (by selling to Asia rather than the United States), in the event that the Northern Gateway is completed.7 This study is particularly relevant then for evaluating the “Dutch Disease” claim, since the Mansell analysis effectively shows the economic impact on other provinces from Canada’s ability to export oil at higher prices.
Table 5 below summarizes the Wright Mansell study’s estimate of the Northern Gateway pipeline’s economic impact on the provinces, through 2046.
TABLE 5 Mansell (2010) study’s estimated economic impacts from Northern Gateway Pipeline, through 2046
IMPACT (2009 $CAD million) BC AB ON QC SK Other Canada Investment / Revenues / Reinvestment 51,359 203,139 25,593 9,772 289,863 Labour Income 12,034 23,812 3,371 745 5,471 2,634 48,066 GDP 46,672 184,839 5,142 1,143 23,745 8,447 269,988 Employment (person years) 139,784 260,810 51,216 12,790 61,928 31,459 557,987
SOURCE: Adapted from Wright Mansell 2010, p. 7.
Thus we see that in the Wright Mansell study – which exclusively considered the effect of higher prices available to Canadian oil exporters due to the Northern Gateway pipeline – other provinces enjoy substantial

8 Commentary – No Dutch Treat: Oil and Gas Wealth Benefits All of Canada – May 2012
benefits. Ontario, for example, gains $3.4 billion in labor income, $5.1 billion in GDP, and 51,216 person-years of employment. This works out to an average of almost 1500 full-time jobs in Ontario alone through 2046, and these jobs are due entirely to the higher prices Canadian exporters can obtain for their crude exports using the Northern Gateway pipeline.
Summary of Three Studies
As we have documented, independent studies – employing different assumptions and two different modeling approaches – may differ on the exact magnitudes, but they agree qualitatively that the Canadian petroleum industry contributes to the economies of all provinces, even those lacking natural resource endowments. Of particular interest is the Mansell (2010) study of the Enbridge Northern Gateway pipeline, which assumed a constant level of oil production, and merely modeled the impact of the higher prices achieved by Canadian crude exporters. The study found that this change by itself would ultimately lead to some 1500 full-time jobs created just in Ontario. Clearly, the relationship between Canadian commodity exports and manufacturing is more nuanced than some critics allege.
Provincial and Federal Revenues Generated by Canadian Resource Development In the previous section we discussed three separate models of the petroleum industry’s economic impact across the various provinces. Each of the studies also used its economic model to estimate the flow of government revenues, at both the provincial and federal level, due to the petroleum industry. To the extent that the federal government earns tax revenue from the natural resource extraction based in oil-rich provinces, other Canadians indirectly benefit from enjoying lower tax burdens and/or a higher level of federal services than would otherwise be possible.
Study #1: Alberta Oil Sands (CERI 2011)
Recall that our first model is the 2011 CERI study, which confined its attention to the oil sands projects in Alberta over a 25-year horizon.8 Based on the economic impacts discussed in the previous section, the CERI study projects the following flow of tax and royalty revenues coming entirely from residents and corporations based in Alberta, as illustrated in table 6.
TABLE 6 Government revenues from Alberta due to oil sands projects, “Case 1,” 2010-2035
Type of Revenue Provincial-Municipal
($CAD Million)
Federal ($CAD Million) Federal Share of Total
Indirect 21,480 112,769 84% Personal Income 59,342 147,342 71% Corporate 33,900 68,124 67% Royalties 450,000 - 0% Total 564,722 328,234 37%
SOURCE: Adapted from Honarvar et al. (2011), page 13, as well as private communication with CERI for disaggregated revenue data.

9 Commentary – No Dutch Treat: Oil and Gas Wealth Benefits All of Canada – May 2012
As table 6 indicates, although the royalties paid to the Alberta government from oil sands projects constitute the single largest revenue source, even so these activities will generate large streams of revenue in other tax categories, at both the regional and federal levels. (See figure 1 below for a graphical presentation of the same information.) Over the 2010-2035 period, in this conservative scenario that (recall) assumes only existing pipeline capacity, the CERI model projects that individual and corporate taxpayers in Alberta will pay some $328 billion to the federal government, all because of economic activity attributable to the oil sands. Even including the large royalty category, the federal government still ends up collecting 37 percent of the total revenues generated by these projects.
FIGURE 1 Provincial-municipal versus federal revenues from Alberta due to oil sands projects, “Case 1,” 2010-2035
SOURCE: Adapted from Honarvar et al. (2011), page 13, as well as private communication with CERI for disaggregated revenue data.
This result is quite significant in discussions of distributional impacts from the Canadian petroleum industry. Because of the precision offered by the CERI 2011 study, we are here focusing on the specific item of oil sands in Alberta, but the result holds generally: Strong economic activity associated with the development of natural energy resources automatically “redistributes” wealth from the resource-rich to the resource-poor provinces, through federal fiscal policy. So long as the federal government spends its funds on activities that generate benefits for all citizens, the large share of resource development going to federal taxation ensures that all Canadians indirectly benefit from this activity. Citizens in resource-poor provinces benefit from the abundance of their neighbours, because (other things equal) higher federal tax payments stemming from their activities allow for more federal services and/or lower federal tax rates.
Study #2: Entire Canadian Oil and Gas Sector (CERI 2009)
Turning now to the 2009 CERI study, which recall modeled the entire Canadian oil and gas sector, we find the following distribution of government revenues, as summarized in tables 7 and 8.9
Indirect P-M 2%
Corporate P-M 4%
Personal IncomeP-M 7%
Personal IncomeFederal 16%
Royalties P-M50%
CorporateFederal 8%
IndirectFederal 13%
Type of RevenueRoyalties P-M 450,000Indirect P-M 21,480Corporate P-M 33,900Personal Income P-M 59,342Indirect Federal 112,769Corporate Federal 68,124Personal Income Federal 147,342

10 Commentary – No Dutch Treat: Oil and Gas Wealth Benefits All of Canada – May 2012
TABLE 7 Total federal tax revenues due to petroleum industry, ($2008C million), 2008-2033
AB BC MB NT NS QC SK Total AB 266,886 1,375 37 185 37 5 1,509 270,033 BC 13,101 52,924 38 226 36 6 1,063 67,394 MB 2,848 290 1,546 70 3 2 854 5,613 NB 625 103 5 20 12 3 64 832 NL 450 49 2 13 8 1 37 561 NT 449 39 1 2,906 19 - 35 3,449 NS 977 136 5 32 1,018 3 72 2,243 NU 222 22 1 158 1 - 13 417 ON 14,768 1,580 78 383 41 29 2,081 18,960 PE 143 23 1 6 6 1 12 192 QC 4,900 793 37 155 16 219 425 6,546 SK 5,785 330 23 62 5 2 25,870 32,076 YT 208 65 1 9 - - 10 293
Total 311,364 57,730 1,773 4,224 1,201 272 32,046 408,609
SOURCE: Adapted from CERI 2009, p. 10. (Some totals appear slightly incorrect due to rounding.)
TABLE 8 Total provincial tax revenues due to petroleum industry, ($2008C million), 2008-2033
AB BC MB NT NS QC SK Total AB 152,257 784 21 105 21 3 861 154,052 BC 12,358 49,924 36 213 34 6 1,003 63,574 MB 3,119 317 1,693 77 3 2 936 6,147 NB 633 104 5 20 12 3 65 843 NL 598 65 3 17 10 2 49 745 NT 222 19 - 1,437 9 - 17 1,705 NS 1,109 155 5 36 1,154 3 81 2,544 NU 68 7 - 48 - - 4 127 ON 15,317 1,639 81 397 42 30 2,158 19,665 PE 155 25 1 6 7 1 13 208 QC 6,459 1,046 49 205 22 289 560 8,629 SK 5,986 341 23 64 5 2 26,767 33,188 YT 94 30 - 4 - - 5 133
Total 198,375 54,457 1,918 2,630 1,320 341 32,519 291,560
SOURCE: Adapted from CERI 2009, p. 11. (Some totals appear slightly incorrect due to rounding. Note: Cells in red changed significantly to remove an inconsistency in the totals in the original document, due to an apparent typographical error.)

11 Commentary – No Dutch Treat: Oil and Gas Wealth Benefits All of Canada – May 2012
Recall that in tables 7 and 8 above, each column represents the tax revenues generated across all provinces by petroleum industry activities within that particular column’s province. For example, looking at just the second column “BC” in table 7 and moving down, we see that petroleum activities in British Columbia will generate an estimated $1.375 billion in federal tax receipts in Alberta, $52.924 billion in British Columbia itself, $290 million in Manitoba, and so on. The total federal tax receipts in all provinces, attributable to petroleum activities within British Columbia, amount to an estimated $57.73 billion over the 25-year period. (Note that these figures are simple summations, not discounted present values.) On the other hand, if we look at (say) the fourth row in table 8, we see that of the total $843 million in New Brunswick’s provincial tax receipts due to the petroleum industry, $633 million is due to the petroleum industry in Alberta, $104 million comes from the petroleum industry’s activities in British Columbia, and so on.
Looking just at tax receipts (excluding royalty payments), the CERI 2009 study estimates that over a 25-year period, the Canadian petroleum industry will generate $408.6 billion in federal tax revenues, and $291.6 in provincial tax revenues, meaning that the federal government reaps 58 percent of the total tax receipts (modeled in the study). However, the study also estimates that Alberta, British Columbia, Saskatchewan, and Manitoba will collectively earn provincial royalties of $428.9 billion during the same period from petroleum activities. If we include these revenues, then the federal government still reaps 36 percent of all tax and royalty payments (modeled in the study), which the reader may recall is virtually identical to the value (37 percent) calculated in the previous subsection, which focused just on the oil sands in Alberta.
Study #3: Enbridge Northern Gateway Pipeline (Wright Mansell Research Ltd.)
Finally we report the government revenue estimates provided in the 2010 Wright Mansell Research study, which (recall) focused exclusively on the higher crude prices made available to Canadian exporters from the Enbridge Northern Gateway pipeline.10 The results are shown in table 9.
TABLE 9 Mansell (2010) provincial versus federal revenues due to northern gateway pipeline ($2009C million), through 2046
Revenue (2009 $CAD million) BC AB ON QC SK Other Canada Provincial Revenue 6,709 32,014 565 198 3,914 1,574 44,974 Federal Revenue 5,133 26,054 912 145 2,911 1,099 36,253 Federal % of Total 43% 45% 62% 42% 43% 41% 45%
SOURCE: Adapted from Wright Mansell 2010, p. 7.
Thus we see that in the Wright Mansell study, the federal government reaps $36.3 billion (45 percent of the total increase in revenues) from the construction of the Northern Gateway pipeline and the higher prices it will bring to Canadian crude exporters.
Conclusion Despite the claims by certain prominent critics, there is ample evidence that the petroleum industry showers benefits across the provinces, and provides outlets for manufactured goods.

12 Commentary – No Dutch Treat: Oil and Gas Wealth Benefits All of Canada – May 2012
In this paper we have discussed three recent studies, which employed different assumptions and methodologies, which found the petroleum industry generated large contributions to economic output and employment even in provinces lacking resource deposits. Furthermore, the studies estimated large contributions to federal tax receipts from petroleum operations. While the so-called “Dutch Disease” mechanism may operate, in practice it is partially (perhaps more than fully) offset by the gains to the overall Canadian economy documented by these studies.
About the Authors Robert P. Murphy has a Ph.D. in economics from New York University. After teaching for three years at Hillsdale College, Murphy entered the financial sector to work as an analyst and portfolio manager for Laffer & Associates. He currently runs Consulting By RPM and is the Senior Economist for the Institute for Energy Research, a D.C.-based think tank. Murphy has published several books for the layperson on economics, including The Politically Incorrect Guide to Capitalism (Regnery, 2007) and Lessons for the Young Economist (Mises Institute, 2011). He is also the author of numerous studies and peer-reviewed articles, including “Taxifornia: California’s tax system, comparisons with other states, and the path to reform for the Golden State” (with Jason Clemens, Pacific Research Institute, 2010).
Brian Lee Crowley has headed up the Macdonald-Laurier Institute (MLI) in Ottawa since its inception in March of 2010, coming to the role after a long and distinguished record in the think tank world. He was the founder of the Atlantic Institute for Market Studies (AIMS) in Halifax, one of the country’s leading regional think tanks. He is a former Salvatori Fellow at the Heritage Foundation in Washington DC and is a Senior Fellow at the Galen Institute in Washington. In addition, he advises several think tanks in Canada, France and Nigeria.
Crowley has published numerous books, including two bestsellers: Fearful Symmetry: the fall and rise of Canada’s founding values (2009) and MLI’s first book, The Canadian Century; Moving Out of America’s Shadow, which he co-authored with Jason Clemens and Niels Veldhuis.
Crowley twice won the Sir Antony Fisher Award for excellence in think tank publications for his heath care work and in 2011 accepted the award for a third time for MLI’s book, The Canadian Century.
From 2006-08 Crowley was the Clifford Clark Visiting Economist with the federal Department of Finance. He has also headed the Atlantic Provinces Economic Council (APEC), and has taught politics, economics and philosophy at various universities in Canada and Europe.
Crowley is a frequent commentator on political and economic issues across all media. He holds degrees from McGill and the London School of Economics, including a doctorate in political economy from the latter.

13 Commentary – No Dutch Treat: Oil and Gas Wealth Benefits All of Canada – May 2012
Endnotes 1 See for example, May 15, 2012, “Mulcair dismisses Western premiers as Harper’s ‘messengers’ in oils sands debate,” National Post, available at: http://www.nationalpost.com/m/wp/news/blog.html?b=news.nationalpost.com/2012/05/15/thomas-mulcair-oil-sands. See also Peter O’Neill, September 27, 2011, “NDP Oilsands Policy: Moratorium? Freeze? How about a ‘deep breath’?”, Vancouver Sun, available at: http://blogs.vancouversun.com/2011/09/27/ndp-oilsands-policy-moratorium-freeze-how-about-a-“deep-breath”/. 2 An early paper in this literature is W.M. Corden and J.P. Neary. 1982. “Booming Sector and De-industrialization in a Small Open Economy.” The Economic Journal 92 (December), 825-848. 3 See Afshin Honarvar, Dinara Millington, Jon Rozhon, Thorn Walden, and Carlos A. Murillo. 2011. “Economic Impacts of Staged Development of Oil Sands Projects in Alberta (2010-2035).” Canadian Energy Research Institute, Study No. 125, June. Available at: http://ceri.ca/images/stories/2011-08-24_CERI_Study_125_Section_1.pdf. 4 See Peter Howard, Afshin Khademvatani, Paul Kralovic, David McColl, Melissa Mei, Abbas Naini, Rami Shabaneh, Asghar Shahmoradi, Martin Slagorsky, and Thorn Walden. 2009. “Economic Impacts of the Petroleum Industry in Canada.” Canadian Energy Research Institute, Study No. 120, Summary Report, June. Available at: http://www.ceri.ca/docs/CERIIOSummaryReport.pdf. 5 Wright Mansell Research Ltd. 2010. “Public Interest Benefits of the Enbridge Northern Gateway Pipeline Project.” March. 6 Wright Mansell 2010, p. 6. The study also considers benefits from diversifying the Canadian export market, but these are not quantified. 7 The study “assumes that total Canadian oil sands production remains the same as in a benchmark forecast (the CAPP ‘Expected’ forecast). However, in the Northern Gateway Case some Canadian oil exports that would otherwise go into US markets are sent to Asian markets. While total Canadian oil sands production volumes are unchanged, there is an increase in the value of this production that would benefit Canadian oil producers. The incremental net revenues from this would in part be reinvested and generate further gains to output, employment, incomes, and government revenues in Canada.” (Wright Mansell 2010, 7) 8 See Afshin Honarvar, Dinara Millington, Jon Rozhon, Thorn Walden, and Carlos A. Murillo. 2011. “Economic Impacts of Staged Development of Oil Sands Projects in Alberta (2010-2035).” Canadian Energy Research Institute, Study No. 125, June. Available at: http://www.ceri.ca/images/stories/CERI_IO_Conventional_Report_June_2011.pdf. 9 See Peter Howard, Afshin Khademvatani, Paul Kralovic, David McColl, Melissa Mei, Abbas Naini, Rami Shabaneh, Asghar Shahmoradi, Martin Slagorsky, and Thorn Walden. 2009. “Economic Impacts of the Petroleum Industry in Canada.” Canadian Energy Research Institute, Study No. 120, Summary Report, June. Available at: http://www.ceri.ca/docs/CERIIOSummaryReport.pdf. 10 Wright Mansell Research Ltd. 2010. “Public Interest Benefits of the Enbridge Northern Gateway Pipeline Project.” March.


