noaa technical report nos co-ops 049 ocean · pdf fileocean systems test and evaluation...
TRANSCRIPT

NOAA Technical Report NOS CO-OPS 049 Ocean Systems Test and Evaluation Program
noaa National Oceanic and Atmospheric Administration
U.S. DEPARTMENT OF COMMERCE National Ocean Service Center for Operational Oceanographic Products and Services
Initial Operational Deployment Report
Miros Air Gap Sensor and Laser Sensor at the Verrazano-Narrows Bridge
Silver Spring, Maryland September 2009

Center for Operational Oceanographic Products and Services National Ocean Service
National Oceanic and Atmospheric Administration U.S. Department of Commerce
The National Ocean Service (NOS) Center for Operational Oceanographic Products and Services (CO-OPS) provides the National infrastructure, science, and technical expertise to collect and distribute observations and predictions of water levels and currents to ensure safe, efficient and environmentally sound maritime commerce. The Center provides the set of water level and tidal current products required to support NOS’ Strategic Plan mission requirements, and to assist in providing operational oceanographic data/products required by NOAA’s other Strategic Plan themes. For example, CO-OPS provides data and products required by the National Weather Service to meet its flood and tsunami warning responsibilities. The Center manages the National Water Level Observation Network (NWLON), a national network of Physical Oceanographic Real-Time Systems (PORTS) in major U. S. harbors, and the National Current Observation Program consisting of current surveys in near shore and coastal areas utilizing bottom mounted platforms, subsurface buoys, horizontal sensors and quick response real time buoys. The Center: establishes standards for the collection and processing of water level and current data; collects and documents user requirements which serve as the foundation for all resulting program activities; designs new and/or improved oceanographic observing systems; designs software to improve CO-OPS’ data processing capabilities; maintains and operates oceanographic observing systems; performs operational data analysis/quality control; and produces/disseminates oceanographic products.
Ocean Systems Test & Evaluation Program
The CO-OPS Ocean Systems Test and Evaluation Program (OSTEP) facilitates the transition of new technology to an operational status, selecting newly-developed sensors or systems from the research and development community and bringing them to a monitoring setting. OSTEP provides quantifiable and defensible justifications for the use of existing sensors and methods for selecting new systems. The program establishes and maintains field reference facilities where, in cooperation with other agencies facing similar challenges, devices are examined in a non-operational field setting. OSTEP evaluates sensors, develops quality control procedures, and generates maintenance routines. Rigorous, traceable calibrations and redundant sensors assure the quality of the reference systems used in the field.
The program receives guidance from the Ocean Systems Test & Evaluation Advisory Board.
OSTEP Advisory Board
Mark Bushnell, NOAA/NOS/CO-OPS Karen Earwaker, NOAA/NOS/CO-OPS
Warren Krug, NOAA/NOS/CO-OPS Philip Libraro, REMSA Consultant W. Douglas Wilson, NOAA/CBO
Bill Burnett, NOAA/NDBC Kent Hathaway, USACE/WES

NOAA Technical Report NOS CO-OPS 049 Ocean Systems Test and Evaluation Program
U.S. DEPARTMENT OF COMMERCE Gary Locke, Secretary
National Oceanic and Atmospheric Administration Dr. Jane Lubchenco, Undersecretary of Commerce for Oceans and Atmosphere and NOAA Administrator
National Ocean Service John H. Dunnigan, Assistant Administrator
Center for Operational Oceanographic Products and Services Michael Szabados, Director
Mark Bushnell Max Ivanov Warren Krug Tom Mero Brad Wynn
September 2009
Initial Operational Deployment Report
Miros Air Gap Sensor and Laser Sensor at the Verrazano-Narrows Bridge

NOTICE
Mention of a commercial company or product does not constitute an endorsement by NOAA. Use for publicity or advertising purposes of information from this publication concerning proprietary products or the results of the tests of such products is not authorized.

i
TABLE OF CONTENTS
LIST OF FIGURES .................................................................................................................. ii
LIST OF TABLES .................................................................................................................... ii
ACKNOWLEDGEMENTS ...................................................................................................... iii
EXECUTIVE SUMMARY ...................................................................................................... v
1.0 BACKGROUND ............................................................................................................... 1 System Configuration ........................................................................................................ 2
2.0 PRE-DEPLOYMENT PREPARATIONS ......................................................................... 3 2.1 Functional Test ........................................................................................................... 3 2.2 Burn-In Test ............................................................................................................... 3 2.3 Reference Range Test ................................................................................................ 4 2.4 Crane Hoist Acceptance Test ..................................................................................... 4 2.5 Final Pre-Deployment Road Test ............................................................................... 5 2.6 Pre-Deployment Logistics .......................................................................................... 7
3.0 DEPLOYMENT ................................................................................................................ 9 3.1 Measurement of Low Steel to Miros Sensor .............................................................. 11 3.2 Measurement of Miros Sensor to Laser Sensor ......................................................... 11 3.3 In-Situ Calibration ...................................................................................................... 12 3.4 Sensor Settings ........................................................................................................... 12 3.5 Data Flow ................................................................................................................... 22
4.0 SUMMARY OF RESULTS .............................................................................................. 27
REFERENCES ......................................................................................................................... 28
LIST OF APPENDICES ........................................................................................................... 29 Appendix A Sutron Air Gap SLL Users Manual .............................................................. A-1 Appendix B Air Gap Acceptance Test Report .................................................................. B-1 Appendix C Proposed Installation Drawings for the Verrazano-Narrows Bridge ............ C-1
ACRONYMS AND ABBREVIATIONS .................................................................................

ii
LIST OF FIGURES
Figure 1. Road test in Field Operations parking lot to compare Miros to ULS. ...................... 5
Figure 2. Satellite view of the Verrazano-Narrows Bridge. .................................................... 9
Figure 3. A view of the equipment and sensor mounting. ....................................................... 10
Figure 4. Measurement taken from the bottom of rail up to bottom beam of bridge. ............ 11
Figure 5. This plot shows agreement over an extended period of many tidal cycles. ............. 24
Figure 6. Sample shows a air gap anomaly detected by both sensors . ................................... 25
LIST OF TABLES
Table 1. Comparison of LTI to Miros to target and to each other ........................................... 6
Table 2. Sensor Settings ........................................................................................................... 13
Table 3. Example of a PORTS® tag file from the Verrazano-Narrows Bridge. ...................... 22
Table 4. Line-by-line explanation of the PORTS® tag file. ..................................................... 23

iii
ACKNOWLEDGEMENTS
The authors would like to thank Katie Derner for her efforts in organizing the Miros microwave sensor air gap metadata.
Thanks also to Seth Baldelli and Kathy Egan for their careful review of and constructive input for this report.
We thank Mike Evans for his assistance with the development of the data flow discussion.
We also thank our technical writer/editor, Helen Worthington, for her assistance in preparing this report.

iv

v
Operational Deployment of a Miros Air Gap Sensor and Laser Sensor at the Verrazano-Narrows Bridge
EXECUTIVE SUMMARY The maritime industry depends on accurate bridge clearance or air gap measurements. Knowing the distance between the lowest point of a bridge (low steel) and the water surface helps to avoid the risk of a vessel’s overhead allision with bridges, which increases as vessel size increases. The potential economic gains to be realized by both increased commerce and the avoidance of allisions are considerable, and as a result, the maritime industry has a clear requirement for air gap information.
The potential users of air gap sensor data require continuous, real-time observations of the clearance beneath a bridge with an accuracy of ±15 centimeters (6 inches). CO-OPS further reduces this accuracy requirement to ±75 millimeters (3 inches) to maintain an initial level of quality assurance and considers the value to represent two standard deviations of the difference between the final system output and a reference observation.
The system must provide useful observations of air gap every six minutes in real time, corrected for any sensor mounting offset on the bridge from low steel. It must operate in all weather conditions and survive in the hostile bridge environment, where vibration can be a significant issue.
CO-OPS has determined that the microwave sensors meet user requirements and has successfully deployed both microwave and laser air gap sensors since 2003. CO-OPS maintains nine operational microwave air gap sensors in support of the Physical Oceanographic Real-Time System (PORTS®), which provides real-time marine environmental information to help ensure safe and efficient maritime commerce and informed coastal resource management.
On bridges with known motion or sites without an adjacent water level gauge, independent air gap observations must confirm the microwave observations. For example, this capability is required on the Verrazano-Narrows Bridge in New York City. The bridge encounters so much excessive motion (12-foot vertical excursions) due to thermal expansion and traffic loading that, even if there were an adjacent water level station, it would not be a suitable reference. Independent air gap observations must validate the microwave observations and are also useful for investigation of long term sensor drift, abrupt sensor offset, and range-related errors (rare). Ideally, a laser sensor could also provide air gap data if the microwave sensor fails (also rare). If the laser sensor provides valid data (+/- 75 millimeters or 3 inches, 1 standard deviation, with respect to an accepted standard) in the absence of atmospheric interference, it would easily meet quality control requirements and be sufficient as a redundant sensor, especially given the robustness of the microwave sensors.
In partnership with the Triborough Bridge and Tunnel Authority of New York, CO-OPS deployed a Miros SM094 microwave sensor and a Laser Technology Incorporated (LTI) universal laser sensor (ULS) on the Verrazano-Narrows Bridge in New York City on 2 May 2008. This was the first CO-OPS deployment of the newest Miros sensor using digital signal processing at an extended range (72 meters or 236.22 feet). The laser sensor is deployed as a redundant sensor and may replace trigonometric leveling.

vi
Both the pre-deployment calibration and post-deployment in-situ calibration correction (−14.7 centimeters or 5.79 inches) represented an improvement over the manufacturers’ calibration. We believe the laser observations bring a highly valued quality control capability to our air gap operations, greatly exceeding the existing quality control derived from annual trigonometric leveling, increasing system robustness, and reducing the overall deployment cost.
Finally, we believe there is sufficient quantitative evidence to demonstrate that CO-OPS air gap observations are: 1) well within the user requirement of +/-15 centimeters (6 inches); 2) at or near the desired +/-75-millimeter (3-inch) CO-OPS requirement; 3) very reliable; and 4) readily defensible.

Ocean Systems Test and Evaluation Program
1
1.0 BACKGROUND
The economic vitality of the U.S. depends upon safe and efficient maritime commerce. As the size of vessels increases, so does the risk of overhead allisions with bridges. Thus, the maritime community has voiced the need for accurate bridge clearance (air gap) information.
CO-OPS plays an important role in providing the most reliable and up-to-date decision-support tools that help vessels safely navigate within U.S. waters. One of these tools is the air gap sensor, which measures the distance from the lowest point or low steel of a bridge to the water surface to determine how much clearance a vessel has to pass under the bridge. The sensor emits a microwave FM (frequency-modulated) chirp signal and receives an echo from the water surface. The signal propagation delay given by the distance from the antenna to the water surface causes a beat signal in the receiver. The beat frequency is converted to an accurate distance via advanced signal processing.
Measuring air gap is not always straightforward because of varying water levels and bridge motion. For example, tides are a major source of variation in bridge clearance. Additional sources include river stage (water depth), wind and wave setup, bridge altitude variations caused by varying traffic loads, and structural thermal expansion and contraction. Sources of noise that could interfere with the accurate measurement of air gap include bridge vibration, waves, and water level setup or setdown caused by water current interaction with bridge supports. Sampling techniques must consider these noise sources to avoid bias and to extract the maximum accuracy possible from the sensor. No two bridges will offer the same conditions or results with various technologies (Bushnell et al., 2005).
Microwave air gap sensors were first deployed in 2003 and became operational in 2004 on the Chesapeake City Bridge (Maryland) and the Reedy Point Bridge (Delaware) over the Chesapeake and Delaware Canal. CO-OPS now maintains nine operational microwave air gap sensors in support of the Physical Oceanographic Real-Time System (PORTS®), which provides real-time marine environmental information to help ensure safe and efficient maritime commerce and informed coastal resource management. PORTS® contains a suite of instruments that measures and disseminates observations and predictions of water levels and currents, as well as observations of salinity, water temperature, and meteorological parameters (wind, air temperature, and barometric pressure) (Bosley et al., May 2005). After data are collected, they are quality-controlled and become available to users every six minutes via the Internet or cellular phone.
All nine operational sensors underwent extensive pre-deployment validation. Upon installation, their output was confirmed through trigonometric leveling referenced to adjacent water level stations or confirmed using a laser air gap sensor. Where trigonometric leveling provides the reference, annual maintenance leveling is recommended to confirm continued nominal operation, even though these leveling operations yield only a single validation point. Our intention is to replace the requirement for trigonometric leveling with laser sensors at all operational air gap sites.
Continuous quality control (QC) is performed by applying an offset to inverted bridge-mounted microwave sensor output for direct comparison with an adjacent water level gauge; however, this

Ocean Systems Test and Evaluation Program
2
does not consider bridge motion. In many cases this is acceptable; however, some bridges are known to experience considerable vertical excursions. To provide quality controlled air gap observations from moving bridges or at sites without adjacent water level gauges, an alternative air gap observation is required to validate air gap observations.
The Verrazano-Narrows Bridge in New York City is a high-traffic suspension bridge that experiences extensive vertical excursions due to thermal expansion and contraction of the steel cables. Since there is no adjacent water level gauge available, the Verrazano-Narrows Bridge is an appropriate location for a laser air gap sensor to provide an additional observation to the microwave air gap sensor.
Infrared air gap laser sensors are capable of ranging to the water interface, but they require a clear optical path to the surface and may not function as well in the presence of precipitation, haze, or fog. It is precisely for these reasons that they are not used as primary air gap sensors. However, it appears that laser sensors can provide reliable ranges in the absence of interference, yielding redundant air gap observations most of the time. This is a great improvement over the nominal single annual validation point obtained through trigonometric leveling. Since these lasers are inexpensive devices, their deployment is comparable to a single annual leveling effort, making them cost effective.
The CO-OPS deployment of a Miros SM094 microwave sensor and a Laser Technology Incorporated (LTI) universal laser sensor (ULS) on the Verrazano-Narrows Bridge in New York City on 2 May 2008 was conducted in cooperation with the Triborough Bridge and Tunnel Authority of New York (NOS Weekly News, May 2008). This report documents the findings of the pre-deployment phase and the results of the initial operational deployment of these air gap sensors on the Verrazano-Narrows Bridge.
System Configuration Both the Miros microwave air gap sensor and the ULS are connected to the data collection platform (DCP) that is manufactured by Sutron Corporation and part of the Xpert family of DCPs. The model 9210B runs the Microsoft Windows CE operating system version 3.0.0.27 and is based on the Intel 486 microprocessor. The unit has integrated analog and digital input-output (I/O) modules, three RS232 serial ports, an SDI-12 port, and an I2C port for additional I/O modules. The unit is packaged in an 11-inch (in) by 6-in by 3-in aluminum case.
Data are obtained through two redundant paths: 1) via Internet Protocol (IP) modem address, and 2) transmitted through the Geostationary Operational Environmental Satellite (GOES) system. The GOES ID is 33408170.
The DCP performs a number of self-tests on its internal systems while powering up; any errors are displayed on the front panel Liquid Crystal Display (LCD) and recorded in the system logs. After the self-tests, the system reads the setup file implementing the AquaPro SLL (Sutron Dynamic Linked Library) software (Appendix A)

Ocean Systems Test and Evaluation Program
3
2.0 PRE-DEPLOYMENT PREPARATIONS
CO-OPS personnel performed several tests prior to deployment of the Miros SM094/2/85N (serial number 060277) microwave sensor and the LTI ULS LR 200 laser range finder (serial number US000151), including functional benchtesting, burn-in testing, a 50-meter (m) range calibration in the Field Operations Division (FOD) parking lot, a crane hoist test conducted at Metro Machine Corporation in Norfolk, Virginia, and a “road test” in the Chesapeake facility FOD parking lot at varying distances from 0-72 m. The purpose of these tests was to confirm satisfactory sensor performance.
2.1 Functional Test Personnel conducted the initial tests during the week of 11 December 2006 to verify that the sensor functioned properly. Functional testing of the Miros includes wiring the SM094 to a male DB9 connector, connecting the sensor to a PC, and running ProComm, a commercial terminal emulation program that permits flexible communications and file transfers between a PC and a digital device. In this test, ProComm was configured to 9600 baud, N/8/1. Personnel then toggled the Capture File On and connected 24 Vdc power to the SM094. Personnel gave commands that captured the following information:
SM094 settings Hidden settings Start-up data
Once the sensor passed the functional test, complete burn-in testing was conducted.
2.2 Burn-In Test The burn-in test is an initial sustained period of operation that confirms successful sensor performance throughout all cycles associated with start up and continuous operation. The test was conducted in the Chesapeake facility warehouse during the week of 11 December 2006. The following steps were performed to complete the burn-in test:
1. Place the Miros SM094 sensor in an area that will be undisturbed so that it has a target of adequate distance at which to shoot (the ceiling is acceptable).
2. Plug the sensor into the PC and connect to the battery (check whether the system is 12V or 24V).
3. Open ProComm. 4. Change the Baud rate to 9600. 5. Start a capture file to capture the initial metadata (may need to re-plug the unit). 6. Type: ser 1. 7. Allow the unit to operate overnight.
The system operated for ~19 hours, after which personnel confirmed that the system performed satisfactorily. Personnel then toggled Capture File Off and archived the captured file on the CO-OPS drive at H:MIROS\MIROS_UNIT_RECORDS\INSTRUMENT LAB\85_Meter_Units and the test report can be found in Appendix B-2.

Ocean Systems Test and Evaluation Program
4
2.3 Reference Range Test The reference range test provides additional information to help confirm the sensor’s nominal operation. For the Miros microwave air gap sensor, a 50-m (164.04-ft) test was conducted in the FOD parking lot on 18 December 2006.
The following steps were performed for this reference range test: 1. Place Miros SM094 instrument stand at the north end of range. 2. Align instrument stand base with three reference marks. 3. Place target on south end of range, aligning base with three marks. 4. Use a level to verify vertical position of instrument stand and target. 5. Target and SM094 planes are parallel, vertical, and exactly 50.00 m apart. 6. Use laser to verify that SM094 and target are 50.00 m apart. 7. Power up laptop. 8. Check/set date/time. 9. Connect SM094 DB9 to laptop. 10. Run ProComm, configure to 9600 baud, N/8/1. 11. Toggle Capture File On. 12. Connect power (24 Vdc) to SM094. 13. Watch start-up sequence until values stabilize at ~50.00 m. 14. Continue capturing data for 5 minutes. 15. Toggle Capture File Off. 16. Archive captured file on the CO-OPS H: drive (at
H:MIROS\MIROS_UNIT_RECORDS\INSTRUMENT LAB\85_Meter_Units.
2.4 Crane Hoist Acceptance Test The crane hoist acceptance test was conducted on 22 January 2007 (Appendix B-4). Tower crane #5 located at the Metro Machine Corporation, a shipyard in Norfolk, Virginia, was used to test the accuracy of the Miros SM094 microwave and LTI ULS air gap sensors. These tests used the newly developed Crane Hoist Test Platform, which housed one Miros reference sensor (serial number P020146), two air gap test Miros SM094 sensors (serial numbers 060278 and 060277) and an LTI LR 200 laser range finder (serial number US000151). A laptop computer located on the crane hoist test platform provided data collection and real-time reporting via a 900-MHz spread spectrum radio for test control. A receiver on the ground fed into a second computer that displayed the results in real-time. Satisfactory performance was observed throughout the hoist.
Ocean Systems Test and Evaluation Program
5
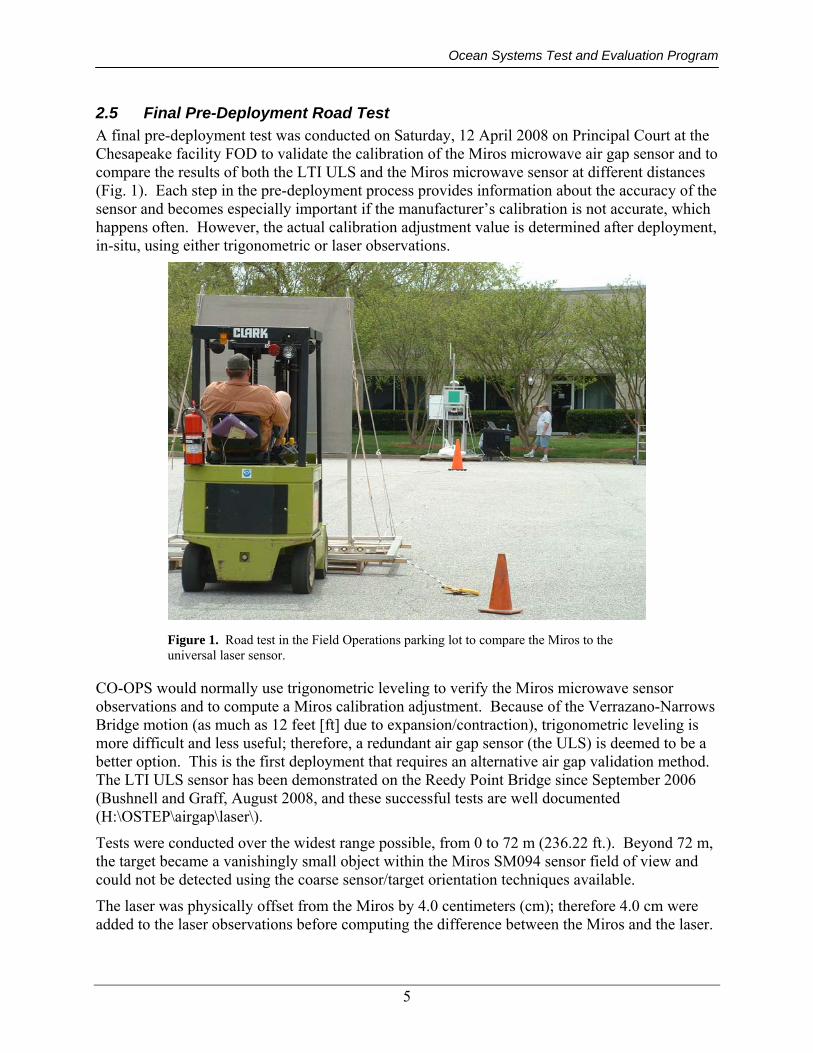
2.5 Final Pre-Deployment Road Test A final pre-deployment test was conducted on Saturday, 12 April 2008 on Principal Court at the Chesapeake facility FOD to validate the calibration of the Miros microwave air gap sensor and to compare the results of both the LTI ULS and the Miros microwave sensor at different distances (Fig. 1). Each step in the pre-deployment process provides information about the accuracy of the sensor and becomes especially important if the manufacturer’s calibration is not accurate, which happens often. However, the actual calibration adjustment value is determined after deployment, in-situ, using either trigonometric or laser observations.
Figure 1. Road test in the Field Operations parking lot to compare the Miros to the universal laser sensor.
CO-OPS would normally use trigonometric leveling to verify the Miros microwave sensor observations and to compute a Miros calibration adjustment. Because of the Verrazano-Narrows Bridge motion (as much as 12 feet [ft] due to expansion/contraction), trigonometric leveling is more difficult and less useful; therefore, a redundant air gap sensor (the ULS) is deemed to be a better option. This is the first deployment that requires an alternative air gap validation method. The LTI ULS sensor has been demonstrated on the Reedy Point Bridge since September 2006 (Bushnell and Graff, August 2008, and these successful tests are well documented (H:\OSTEP\airgap\laser\).
Tests were conducted over the widest range possible, from 0 to 72 m (236.22 ft.). Beyond 72 m, the target became a vanishingly small object within the Miros SM094 sensor field of view and could not be detected using the coarse sensor/target orientation techniques available.
The laser was physically offset from the Miros by 4.0 centimeters (cm); therefore 4.0 cm were added to the laser observations before computing the difference between the Miros and the laser.

Ocean Systems Test and Evaluation Program
6
Each range data point consisted of at least one full 181-second observation processed using the DCP and software destined for the Verrazano-Narrows Bridge.
Table 1 shows a comparison of the LTI ULS and Miros microwave sensors to the target and to each other. The first column shows the distance from the ULS to the target. The second column shows the distance of the Miros microwave sensor to the target, and the third column shows the difference between the ULS and microwave distances. The outlying fourth reading was discarded and 4.0 cm added to the ULS. The Miros-LTI comparison is then computed and stored. The mean of the Miros-LTI is 0.9 cm with a standard deviation of 3.2 cm. The Miros microwave sensor and the LTI ULS compared very well; therefore it is reasonable to assume both are generally correct.
Table 1. Comparison of LTI to Miros to target and to each other
LTI Miros Miros +4.0cm -laser 4.9220 4.9410 0.0190 4.9230 4.9410 0.0180 9.3790 9.3800 0.0010 13.4720 14.0230 0.5510 14.0910 14.0390 -0.0520 19.2530 19.2710 0.0180 23.6540 23.6610 0.0070 29.6760 29.6850 0.0090 35.3620 35.3300 -0.0320 40.3030 40.2620 -0.0410 45.5400 45.5230 -0.0170 50.2990 50.3330 0.0340 50.2920 50.3170 0.0250 55.8900 55.9290 0.0390 60.9450 60.9640 0.0190 67.1910 67.2700 0.0790 72.5780 72.5970 0.0190
However, there were several deficiencies noted during the test. The wind caused sensor and target motion, the road surface was not level, and the visible laser pointer on the ULS was too dim to be useful at large ranges. Although the primary infrared laser is not visible to the naked eye, the laser sensor contains a visible red laser beam for orientation. The red laser beam or pointer may have been partially obstructed by the laser housing, making it difficult to determine whether or not the infrared laser beam was hitting the target. Beyond 55 m it was increasingly difficult to align sensors on the target. In order to compensate for the increasing distance, personnel toggled between data collection mode and streaming data mode, adjusting the sensors and the target until receiving valid data. Personnel shut down the test because of thunderstorms; however, successfully hitting the target beyond 72 m with the Miros microwave sensor is unlikely.

Ocean Systems Test and Evaluation Program
7
The 85-m sensors have a beam width (total spread at half power point) of 5°. From the technical specifications: “SM-094/85 is an extended range version of SM-094/50. By modification of the transceiver IF response the maximum range is extended to 85 m. The 5° beamwidth antenna gives a footprint of 7.4 m at 85-m range.” Therefore, the footprint width D at various ranges H is:
D=H tan(5)
At 72 m D = 6.3 m or 20.6 ft. The foot print area is 427 square feet while the 5 ft by 5ft target is only 25 square feet, or 6% of the footprint.
Overall, the pre-deployment tests showed general agreement between Miros microwave sensor and the LTI ULS sensor.
2.6 Pre-Deployment Logistics The Metropolitan Transportation Authority (MTA) of the State of New York required drawings of the proposed installation signed by a professional engineer. These drawings were submitted in advance of the deployment (Appendix C).
One week prior to deployment, CO-OPS personnel contacted the MTA to obtain authorization to install the air gap sensors on 1-2 May 2008. Personnel checked in at the MTA offices, located at the base of the bridge, prior to commencing work. MTA issued passes for CO-OPS personnel and for the rental vehicle. After obtaining the passes, personnel contacted the Security Office, located in a separate building. CO-OPS personnel informed the Security Office both before and after working on the bridge.
CO-OPS personnel also informed CORMS (Continuous Operational Real-Time Monitoring System) personnel both before work began and after the sensors went online.

Ocean Systems Test and Evaluation Program
8

Ocean Systems Test and Evaluation Program
9
3.0. DEPLOYMENT
The installation of the air gap measurement system on the Verrazano-Narrows Bridge was completed on 2 May 2008 by Brad Wynn of FOD and Max Ivanov of the Engineering Division (ED), both from the Chesapeake facility. The system became fully operational on 30 May 2008.
During the installation, personnel observed all MTA, NOAA, and OSHA (Occupational Safety and Health Administration) safety requirements. Personnel wore harnesses with fall-arresting lanyards affixed to the bridge at two different points, allowing horizontal movement along the bridge. They also wore brightly colored and reflective safety vests over their regular clothing, as well as solid toe boots.
One lane was closed to traffic because of previously scheduled bridge maintenance, which helped to ensure a safer environment for CO-OPS personnel.
The deployed system includes a Miros SM094 microwave sensor (serial number 060277) operating beside an LTI ULS sensor (serial number US000151). Both sensors are mounted on a standard Miros bracket that is attached to the handrail of the bridge's navigation light cat-walk on the south side of the bridge. The GOES transmitter global positioning system (GPS) provides a highly accurate location of the sensor:
Lat: 40° 36' 23.07" North
Long: 074° 2' 40.37"West
Figure 2 shows the satellite map of the bridge location. Figure 3 shows the area where the sensors are mounted.
Figure 2. Satellite view of the Verrazano-Narrows Bridge.

Ocean Systems Test and Evaluation Program
10
Figure 3. A view of the equipment and sensor mounting.
The following information describes the calculation used to determine both the Miros microwave and LTI ULS air gap sensors’ vertical reference to the low steel of the bridge. A visual inspection revealed that the low steel of the bridge is the bottom of the bridge’s maintenance carriage rail running below the lower deck of the bridge. There was no lower steel visually apparent from the viewing perspective on the bridge. An accurate taped measurement was obtained from the bottom of this rail at a point perpendicular to the navigation light and sensor location. Determining if this point is at the absolute apex of the rail’s arch requires more sophisticated techniques and equipment, without which we can only provide air gap at the location of the sensor. Regardless, the sensor’s vertical reference to the low steel of the bridge is the spot perpendicular and most adjacent to the single point measurement on the bridge.
IP Modem
Laser Sensor (behind this
panel)
GOES Antenna
GPS Antenna
Navigation Light
Equipment Box
Miros Sensor

Ocean Systems Test and Evaluation Program
11
3.1 Measurement of Low Steel to Miros Sensor
Obtaining this taped measurement required personnel to access a 30.48-cm (12-in.) wide cross brace below the navigation light cat-walk. Accessing this point should only be attempted under the best conditions (good weather, adequate support personnel). Field measurements were made using a steel tape graduated in inches.
The taped measurement, taken from the bottom of the rail up to the bottom beam of the bridge proper (Fig. 4), was 0.60 m (+23.75 in.). The latter point corresponds structurally with the bottom of the outward box beam running along the south side of the bridge. This measurement was then transferred to the box beam at a point below the cat-walk. A taped measurement was then obtained to the deck of the cat-walk (1.47 m or +58.0 in.) directly above this point. A taped measurement (0.55 m or +21.5 in.) was taken from the deck of the cat-walk to the face of the Miros microwave sensor. Therefore, the sum of these three measurements equals the total vertical distance from the bottom of the carriage rail to the face of the Miros sensor: 2.62 m (+103.25 in.).
Figure 4. Measurement taken from the bottom of the rail up to the bottom beam of the bridge.
3.2 Measurement of Miros Sensor to Laser Sensor The laser sensor is mounted within a video camera-type protective housing and bolted directly to the outward side of the Miros’ mounting bracket. A direct measurement of 0.635 cm (+0.25 in.) was made from the face of the Miros sensor to the bottom of the laser’s protective housing glass window. The laser’s lens is mounted within the protective housing 0.635 cm above this point.
Therefore, the total vertical distance from the face of the Miros sensor to the laser's lens is 1.27 cm (+0.5 in.).

Ocean Systems Test and Evaluation Program
12
3.3 In-Situ Calibration
CO-OPS previously conducted five operational air gap installations, and in-situ calibrations for those deployments were obtained through trigonometric leveling. This correction to the manufacturers’ calibration was applied in each deployment. A value between 10 cm (3.94 in.) and 20 cm (7.87 in.) was subtracted from the Miros sensor output to force the readings to agree with the trigonometric leveling. This is CO-OPS’ first deployment of the newest Miros microwave sensors using digital signal processing at an extended range of 72 m (236.22 ft). The range at the Reedy Point deployment is just 45 m (147.64 ft) (full report at H:\OSTEP\AirGap\Laser\ReedyPt\Validate\DemonstrationReport/LaserAGDeploy0308.doc).
From 6-18 May 2008, a total of 2 652 six-min data points were collected at the Verrazano-Narrows Bridge over this 13-day period. These data were obtained during the operational configuration period, during which several sensor settings were changed aboard the Miros sensor to enhance performance. Within this data set 2 310 difference values (microwave minus ULS) were identified in the 0-1 ft range, i.e. valid observations from both sensors with a difference values falling within +/- 6 in., representing 87% of all observations.
The mean difference was calculated using this valid data 2 310-point subset collected during the 13-day period. This value, which is the mean Miros microwave minus LTI ULS difference, is 14.7 cm (5.51 in.). The standard deviation of the difference time series is 2.6 cm (1.02 in.).
The in-situ calibration value of 14.7 cm, to be subtracted from the Miros microwave sensor observation, agrees with all previous deployments. This presumes that the LTI ULS is a valid reference. While we do not know that it is, we at once adopt the most conservative stance and find agreement with our other operational deployments by using the sensor with the lowest air gap reading. The Miros and LTI sensors now match by subtracting the 14.7 cm in-situ offset. Since this value was derived from raw sensor readings that had no adjustments/offsets/corrections, it includes the 0.5-in. physical offset (ULS higher). The laser zero point now becomes the system zero point; therefore the total low steel offset is 2.64 m or 103.75 in. (103.25 in. plus 0.5 in.).
The pre-deployment calibration check and post-deployment in-situ calibration correction efforts are better than the manufacturer calibration effort (virtually identical to the Aquatrak air acoustic sensor). Miros uses a constant slope for all sensors and determines the offset using a short reference range. Oistein Gronlie at Miros says, “We presently use a similar fixed measuring range, 6.5 m distance using a flat aluminum plate target, approx 1 m by 1 m, just to set the sensor offset. Then we check a few distances against a calibrated laser sensor and a mobile flat plate target. It is our experience that laser and SM094 measurements match well, normally within 1 mm - 2 mm. We do not have a range allowing for more than 17 m in-house.”
3.4 Sensor Settings The Miros SM094 microwave sensor has several user-selected parameters. During the operational configuration period, these settings were changed to enhance performance. Table 2 shows an example of CO-OPS’ remote communications with the sensor using the IP modem and the passthru feature of the Xpert. Commands or input are bold, underlined, and italicized for clarity. The table details sensor access, initial sensor settings, test commands, and a change to the ntc setting. The response to the last ALL command lists the final sensor settings, which now have become the operational configuration.

Ocean Systems Test and Evaluation Program
13
Table 2. Sensor Settings
Login user: super Password: *** \Flash Disk>recording off Stopping. Recording is OFF \Flash Disk>shutdown The Xpert application has been shutdown. \Flash Disk>passthru com3:9600,n,8,1 Passthru operation has begun (press ESC ESC ESC to abort) GV 72.361 72.331 ALL Miros Range Finder Ver. 7.1.3 built on Jul 21 2005 20:14:03 EPLD version 1.3 Maximum range 85 Ant. beam width 5 ch 60.00 - 80.00 m win 3.00 m min 100.00 det 100.00 % tout 10.00 sec atc 29.51 sec (664) htc 0.49 sec (11) ntc 29.51 sec (664) wtc 0.49 sec (11) ser 0 top 1 freq 2.00 Hz (0.500 sec) sep tab (ASCII value 9) gps 0 ALTCONFIG meas 375.00 mm/ch, -875.00 mm fft 512 range 85 m index t.hold 50 % ant 5 deg speed 9600 baud sampling-freq. 46083 Hz sweep-time 22.22 msec cycle-time 44.44 msec

Ocean Systems Test and Evaluation Program
14
tst c Testtype set to 0xC Real frequency domain, downsweep : 0 0 0 0 0 0 0 0 0 0 0 0 0 0 0 0 0 0 0 0 0 0 0 0 0 0 0 0 0 0 0 0 0 0 0 0 0 0 0 0 0 0 0 0 0 0 0 0 0 0 0 0 0 0 0 0 0 0 0 0 0 0 0 0 0 0 0 0 0 0 0 0 0 0 0 0 0 0 0 0 0 0 0 0 0 0 0 0 0 0 0 0 0 0 0 0 0 0 0 0 0 0 0 0 0 0 0 0 0 0 0 0 0 0 0 0 0 0 0 0 0 0 0 0 0 0 0 0 0 0 0 0 0 0 0 0 0 0 0 0 0 0 0 0 0 0 0 0 0 0 0 0 0 0 0 0 0 0 0 0 0 0 0 0 0 0 6 3 3 9 12 10 9 1 0 0 3 4 6 3 3 0 2 2 1 4 0 0 2 2 0 0 0 2 11 66 33 0 0 0 0 3 3 1 0 0 0 2 0 0 2 0 0 1 2 0 2 0 0 0 0 0 0 0 0 0 0 0 0 0 0 0 Range tracking parameters: Upsweep RFFT: peak level = 7 [ 0] (qa-factor = 1.7) Dwnsweep RFFT: peak level = 67 [ 0] (qa-factor = 5.1) Upsweep CFFT: peak level = 31 [ -1] Dwnsweep CFFT: peak level = 32 [ -1] min = 100.00 det = 100.00 % wtc = 0.49 s tout = 10.00 s meter = 0.00 m window = 72.37 m +/- 1.5m min_ch = 160 max_ch = 218 (size = 512)

Ocean Systems Test and Evaluation Program
15
tst d Testtype set to 0xD Real frequency domain, upsweep : 0 0 0 0 0 0 0 0 0 0 0 0 0 0 0 0 0 0 0 0 0 0 0 0 0 0 0 0 0 0 0 0 0 0 0 0 0 0 0 0 0 0 0 0 0 0 0 0 0 0 0 0 0 0 0 0 0 0 0 0 0 0 0 0 0 0 0 0 0 0 0 0 0 0 0 0 0 0 0 0 0 0 0 0 0 0 0 0 0 0 0 0 0 0 0 0 0 0 0 0 0 0 0 0 0 0 0 0 0 0 0 0 0 0 0 0 0 0 0 0 0 0 0 0 0 0 0 0 0 0 0 0 0 0 0 0 0 0 0 0 0 0 0 0 0 0 0 0 0 0 0 0 0 0 0 0 0 0 0 0 0 0 0 0 4 0 0 0 0 8 11 1 0 0 0 0 0 1 0 1 7 4 0 0 3 0 2 0 0 3 0 4 1 0 16 41 14 2 0 0 0 0 7 0 0 0 0 0 0 0 0 2 4 1 0 0 1 0 0 0 0 0 0 0 0 0 0 0 0 0 0 0 Range tracking parameters: Upsweep RFFT: peak level = 44 [ 0] (qa-factor = 7.3) Dwnsweep RFFT: peak level = 44 [ 0] (qa-factor = 2.3) Upsweep CFFT: peak level = 26 [ -1] Dwnsweep CFFT: peak level = 77 [ -1] min = 100.00 det = 100.00 % wtc = 0.49 s tout = 10.00 s meter = 72.42 m window = 72.39 m +/- 1.5m min_ch = 160 max_ch = 218 (size = 512)

Ocean Systems Test and Evaluation Program
16
ALL Miros Range Finder Ver. 7.1.3 built on Jul 21 2005 20:14:03 EPLD version 1.3 Maximum range 85 Ant. beam width 5 ch 60.00 - 80.00 m win 3.00 m min 100.00 det 100.00 % tout 10.00 sec atc 29.51 sec (664) htc 0.49 sec (11) ntc 29.51 sec (664) wtc 0.49 sec (11) ser 0 top 1 freq 2.00 Hz (0.500 sec) sep tab (ASCII value 9) gps 0 ntc 0 Hold noise spectrum (use resn-command to reset noise spectrum) FLASH update OK

Ocean Systems Test and Evaluation Program
17
ALL Miros Range Finder Ver. 7.1.3 built on Jul 21 2005 20:14:03 EPLD version 1.3 Maximum range 85 Ant. beam width 5 ch 60.00 - 80.00 m win 3.00 m min 100.00 det 100.00 % tout 10.00 sec atc 29.51 sec (664) htc 0.49 sec (11) ntc 0.00 sec (0) wtc 0.49 sec (11) ser 0 top 1 freq 2.00 Hz (0.500 sec) sep tab (ASCII value 9) gps 0 resn Noise spectrum is cleared reset Board will be reset! MIROS C54x bootloader ver 1.6.0 built on Sep 30 2004 [17:45:26] Flash initialization OK. [Intel 28F640J3A] External SRAM test on page 3.....OK Watchdog is enabled. Space to enter command-mode [#####] No interruption on primary port. Trying secondary. No activity detected on primary or secondary port. Boot application id : 0 Application CRC check : OK [75E9h:75E9h] Application name : Rangefinder v7.1.3.out Application description : No description. Info : Data memory words copied: 00002FE8h Info : Program memory words copied: 00009F80h Info : Branching to address [0001:8079]

Ocean Systems Test and Evaluation Program
18
C Miros Range Finder Ver. 7.1.3 built on Jul 21 2005 20:14:03 EPLD version 1.3 Flash initialization OK Flash: Intel 28F640J3A Config OK. Parameters read from FLASH Noise spectrum is cleared Processing starting ser 1 Serial configuration set to 1 FLASH update OK 72.378 72.375 72.376 72.375 72.376 72.375 72.376 72.375 72.372 72.375 72.372 72.375 72.372 72.375 72.367 72.375 72.367 72.375 72.367 72.375 72.367 72.375 72.369 72.375 72.369 72.375 ser 0 Serial configuration set to 0 FLASH update OK

Ocean Systems Test and Evaluation Program
19
tst c Testtype set to 0xC Real frequency domain, downsweep : 0 0 0 0 0 0 0 0 0 0 0 0 0 0 0 0 0 0 0 0 0 0 0 0 0 0 0 0 0 0 0 0 0 0 0 0 0 0 0 0 0 0 0 0 0 0 0 0 0 0 0 0 0 0 0 0 0 0 0 0 0 0 0 0 0 0 0 0 0 0 0 0 0 0 0 0 0 0 0 0 0 0 0 0 0 0 0 0 0 0 0 0 0 0 0 0 0 0 0 0 0 0 0 0 0 0 0 0 0 0 0 0 0 0 0 0 0 0 0 0 0 0 0 0 0 0 0 0 0 0 0 0 0 0 0 0 0 0 0 0 0 0 0 0 0 0 0 0 0 0 0 0 0 0 0 0 0 0 0 0 7 6 7 3 5 3 4 1 3 10 12 3 9 2 4 4 2 2 3 2 11 8 4 3 3 2 4 2 0 2 1 10 9 6 11 74 132 48 36 7 3 9 4 6 0 3 2 2 4 2 1 4 2 2 3 2 1 1 0 0 0 0 0 0 0 0 0 0 0 0 0 0 Range tracking parameters: Upsweep RFFT: peak level = 111 [ 196] (qa-factor = 9.2) Dwnsweep RFFT: peak level = 132 [ 196] (qa-factor = 2.2) Upsweep CFFT: peak level = 127 [ 196] Dwnsweep CFFT: peak level = 123 [ 196] min = 100.00 det = 100.00 % wtc = 0.49 s tout = 10.00 s meter = 72.46 m window = 72.46 m +/- 1.5m min_ch = 160 max_ch = 218 (size = 512)

Ocean Systems Test and Evaluation Program
20
tst d Testtype set to 0xD Real frequency domain, upsweep : 0 0 0 0 0 0 0 0 0 0 0 0 0 0 0 0 0 0 0 0 0 0 0 0 0 0 0 0 0 0 0 0 0 0 0 0 0 0 0 0 0 0 0 0 0 0 0 0 0 0 0 0 0 0 0 0 0 0 0 0 0 0 0 0 0 0 0 0 0 0 0 0 0 0 0 0 0 0 0 0 0 0 0 0 0 0 0 0 0 0 0 0 0 0 0 0 0 0 0 0 0 0 0 0 0 0 0 0 0 0 0 0 0 0 0 0 0 0 0 0 0 0 0 0 0 0 0 0 0 0 0 0 0 0 0 0 0 0 0 0 0 0 0 0 0 0 0 0 0 0 0 0 0 0 0 0 0 0 0 0 5 8 7 5 9 3 2 3 2 6 14 2 2 3 2 4 4 4 4 7 9 12 1 0 2 0 3 0 5 5 2 6 11 7 18 106 113 22 19 5 6 2 6 3 1 1 2 1 2 2 3 6 7 5 2 1 2 2 0 0 0 0 0 0 0 0 0 0 0 0 0 0 Range tracking parameters: Upsweep RFFT: peak level = 113 [ 196] (qa-factor = 6.6) Dwnsweep RFFT: peak level = 151 [ 195] (qa-factor = 5.7) Upsweep CFFT: peak level = 134 [ 196] Dwnsweep CFFT: peak level = 158 [ 195] min = 100.00 det = 100.00 % wtc = 0.49 s tout = 10.00 s meter = 72.45 m window = 72.45 m +/- 1.5m min_ch = 160 max_ch = 218 (size = 512)

Ocean Systems Test and Evaluation Program
21
\Flash Disk>startup Xpert has been started. \Flash Disk>recording on Running. \Windows\Coms.sll ver 3.0.0.27 -- LOADING Reloading Basic Programs Recording is ON Login user: p Password: NOS 85179861 05/15/2008 01:48:00 Q1 ( 72.561 0.028 0.000 19.126 20.033 Q2 ( 72.404 0.108 1.000 19.126 20.033 L1 < 13.572 DAT 0.000 SNS 0.000 REPORT COMPLETE

Ocean Systems Test and Evaluation Program
22
Legend
Q1 Miros Q2 Laser L1 Battery voltage
3.5 Data Flow
Air gap sensor data are collected using two distinct methods: (1) using a PORTS® Data Acquisition System (DAS), (2) using 6-minute GOES. This installation uses the PORTS DAS.
A centralized or local DAS collects data from the air gap sensor by polling the DCP. The DAS has no direct connection or interaction with the air gap sensor, but uses the DCP as a data server to acquire the data quality assurance processing (DQAP) data. The DQAP is an algorithm that smooths or filters the data using a 3-min average of 181 levels taken once per second. The average and the standard deviation are computed and the samples are compared to the average ±3 standard deviations. All outliers are discarded; the average and standard deviation are recomputed and reported along with the number of outliers discarded (Bushnell, Graff, August 2008).
The DAS acquires the data from the DCP by using one of several communication methods, in this case an IP modem. Once a connection is made to the DCP, the DAS enters a special login which triggers the DCP to output the last data sample collected from the air gap sensor. The DCP outputs the data in a pre-determined format called a PORTS® TAG. Table 3 shows the PORTS® tag format and Table 4 provides a line-by-line explanation.
Table 3. Example of a PORTS® tag file from the Verrazano-Narrows Bridge.
Login user: p Password: NOS 85179861 06/17/2008 21:24:00 Q1 ( 71.494 0.036 0.000 24.312 23.113 Q2 ( 71.372 0.067 0.000 24.312 23.113 L1 < 13.615 DAT 0.000 SNS 0.000 REPORT COMPLETE --------------------------------------------------------

Ocean Systems Test and Evaluation Program
23
Table 4. Line-by-line explanation of the PORTS® tag file.
Line 1
NOS National Ocean Service 85179861 Station Number: Verrazano-Narrows Bridge 06/17/2008 Date 21:24:00 Data collection time, UTC. PORTS® data is reported every 6 minutes starting
at 6 minutes after the hour. This is NOT the station time or date.
Line 2
Q1( Denotes Microwave Air Gap Data. Q = Microwave Air Gap Data 1 = 1st Air Gap sensor at this station ( = GOES flag, used when the data is transmitted via GOES 71.494 Air Gap data in meters. The water is 71.494 m from the Miros sensor on the bridge. This
represents the raw range from the sensor, uncorrected for low steel. 0.036 Standard deviation 0.00 Outlier count 24.312 The temperature value from temp 1 23.113 The temperature value from temp 2
Line 3
Q2( Denotes Laser Air Gap Data Q = Laser data 2 = 1st backup data at this station ( = GOES flag, used when the data is transmitted via GOES 71.372 Air Gap data in m. The surface of the water is 71.372 m from the laser sensor on the
bridge. This represents the raw range from the sensor, uncorrected for low steel. 0.67 Standard deviation 0.00 Outlier count 24.312 The temperature value from temp 1 23.113 The temperature value from temp 2
Line 4
L1< Denotes Battery data L = Battery voltage 1 = 1st Battery voltage at this station < = GOES flag, used when the data is transmitted via GOES 13.615 Battery voltage, should be between 11.8 and 14.2 volts DC
Line 5
DAT Station datum value, always 0.0 for Air Gap 0.000
Line 6
SNS Station datum offset, always 0.0 for Air Gap 0.000 Login user:

Ocean Systems Test and Evaluation Program
24
After the DAS has acquired the air gap data, it begins a series of steps to process and QC the data. As a result of the processing, the DAS produces a PUFFF (PORTS Uniform Flat File Format) file, a PORTS® standard data format. A detailed description of the PUFFF documentation is available at http://co-ops.nos.noaa.gov/publications/pufff4.pdf.
The DAS then sends data to Silver Spring for ingestion into the CO-OPS databases. The data are transferred from the DAS to TESTPORT, a server in Silver Spring, which adds no value to the data but acts as a “traffic cop” by transferring data to the appropriate servers (all of which are protected behind the CO-OPS firewall) throughout CO-OPS.
The air gap data are distributed, along with all the other data types collected as PUFFF files, to a number of CO-OPS servers that are involved in the ingestion process. The data ingestion server (DIS) acquires and processes the data and generates QC flags, which are inserted along with the data into the DMS (CO-OPS databases). The CORMS server provides an interface for CORMS operators to see the flags that are generated at the DAS. It allows the operators to stop and start dissemination of sensor data. The users then access the data using various interfaces that CO-OPS has developed (Bushnell et al., May 2005).
The air gap sensors produced data during the operational configuration period, 6-18 May 2008. Figure 5 shows the general agreement between the two sensors over many tidal cycles. Figure 6 focuses on an air gap anomaly detected by both sensors over 36 min - 48 min of 6-min intervals.
Figure 5. This plot shows agreement over an extended period of many tidal cycles.
Verrazano-Narrows Bridge Air Gap Sensors

Ocean Systems Test and Evaluation Program
25
Figure 6. This sample shows a small air gap anomaly detected by both sensors over 6-8 observations.
Verrazano Narrows Bridge, Miros (red) & laser (blue)

Ocean Systems Test and Evaluation Program
26

Ocean Systems Test and Evaluation Program
27
4.0 SUMMARY OF RESULTS
Data return has dramatically improved since the initial Verrazano-Narrows Bridge deployment and configuration period. A subsequent analysis conducted using a cleaner data set (98% valid data returned from both sensors combined, including all communications errors) obtained on 21-27 May 2008 yielded a calibration correction of −14.4 cm. Subtracting 14.4 cm from the Miros microwave sensor forces it to match the LTI ULS readings, this time with a standard deviation of only 1.4 cm. This agrees with the earlier −14.7 cm offset and 2.6 cm standard deviation in-situ calibration.
We are confident that the sensor reading difference is ~14.5 cm with a standard deviation of a few centimeters. The cause of this difference is not known. Comprehensive pre-deployment tests showed a mean microwave minus ULS value of less than 1 cm, calculated from differences obtained at ranges from 5 m to 72 m. One or both sensors performed slightly differently after deployment. Two possible causes under investigation are 1) horizontal tests close to the ground modify the microwave propagation rate, perhaps through coupling with the ground or multipath effects, and/or 2) the relatively small, flat, and perpendicular aluminum target is not perfectly representative of the expansive undulating sea surface. Recent tests have shown a small non-linear response to a variety of regular waves created during tests at the Naval Surface Warfare Center Maneuvering and Seakeeping Basin facility from every sensor tested.
There is also evidence that one or both sensors exhibit a small but detectible temperature dependency. Preliminary investigations indicate that the microwave minus laser sensor difference may be related to local air temperature. Environmental chamber tests are planned to further investigate the issue.
The evaluation of system performance is a moving target. As sensor technology evolves, each installation provides unique challenges, although CO-OPS’ air gap situational awareness sharpens with each deployment. CO-OPS believes the ULS observations bring a highly valued QC capability to the air gap operations, greatly exceeding the existing QC derived from annual trigonometric leveling and comparison to nearby water level observations. The system robustness is increased and overall deployment cost is reduced due to the avoidance of the approximately nine staff field days it takes to conduct the trigonometric leveling.
Finally, CO-OPS believes that it has provided sufficient quantitative evidence to demonstrate that our air gap observations are: 1) well within the user required +/-15.24 cm (6 in.); 2) at or near the desired +/-7.62 cm (3 in.) CO-OPS requirement; 3) very reliable; and 4) readily defensible.
Ocean Systems Test and Evaluation Program
28
REFERENCES
Bushnell, Mark, Tom Mero, and Kathryn Bosley, May 2005. Microwave Air Gap: Bridge Clearance Sensor Test, Evaluation, and Implementation Report, NOAA Technical Report NOS CO-OPS 042.
Bosley, Kathryn Thompson, Chris McGrath, Jennifer P. Dussault, Mark Bushnell, Michael J. Evans, Geoffrey W. French, Karen Earwaker, May 2005. Test, Evaluation, and Implementation of Current Measurement Systems on Aids-To-Navigation, NOAA Technical Report NOS CO-OPS 043.
NOS Weekly News, May 2008.
Bushnell, Mark and Tammy Graff, August 2008. Deployment and Demonstration of a Laser Sensor.

Ocean Systems Test and Evaluation Program
29
LIST OF APPENDICES
Appendix A Sutron Air Gap SLL Users Manual
Appendix B Air Gap Acceptance Test Report
Appendix C Proposed Installation Drawings for the Verrazano-Narrows Bridge

Ocean Systems Test and Evaluation Program
30

Ocean Systems Test and Evaluation Program
A-1
Appendix A Sutron Air Gap SLL Users Manual Sutron XPert/XLite SLL
SUTRON
Miros Air Gap Water Level Sensor Serial Interface Driver
AirGapWL For: National Ocean Survey Chesapeake, Virginia October 21, 2002 Sutron Corporation 21300 Ridgetop Circle Sterling, Virginia, USA 20166

Ocean Systems Test and Evaluation Program
A-2
1.0 Introduction 1.1 Purpose of SLL The purpose of this SLL is to allow users to connect a MIROS Air Gap water level sensor to one of the COM ports on a Sutron XPert or XLite (Model 9210) data logger. The purpose of the sensor is to provide the distance from the sensor’s location (normally the deck of a bridge) to a water surface. This SLL adds an Input (sensor) block to the XPert/XLite. The block handles serial communications with an Air Gap sensor connected to one of the serial ports. The sensor can be sampled by a standard Measure block at tested rates up to once per second. Note that the Air Gap block has two (2) outputs labeled WL1 and WL2. These correspond to the two water levels returned by the sensor when data are requested. Refer to the Miros documentation for an explanation of the difference between the two outputs. 1.2 Scope of Document This document contains:
Instructions for installing the SLL on an XPert Instructions for connecting an Air Gap sensor to an XPert Operating Instructions Error Messages and Troubleshooting
2.0 Software Installation 2.1 Installing an SLL It is important to ensure that the SLL is compatible with the version of XPert software you are running. Log on to the XPert with SETUP privileges. Go to the STATUS tab and press the ABOUT button. Verify that the software is version 1.2.05 or higher. SLLs are installed by copying the .SLL file to the \Flash Disk folder on the XPert. The easiest way to accomplish this is to use Sutron’s XTerm utility. Connect a PC or laptop computer to COM 1 on the XPert. The steps to load the SLL are as follows:
1. Run XTerm 2. If the XPert application is running, go to the STATUS tab and press the Exit App button
to shut it down. (The new SLL will not take effect until the application is stopped and restarted.)
3. Press the File Transfer button. The File Transfer window is illustrated in Figure 1.

Ocean Systems Test and Evaluation Program
A-3
Figure 1. – XTerm File Transfer Window
4. Set the left hand panel (PC Files) to display the folder on the PC containing the SLL to be loaded
5. Make sure the right hand panel (XPert Files) is pointed to \Flash Disk 6. Highlight the SLL file and press the right-pointing arrow at the bottom of the screen to
copy the SLL to the flash disk 7. You will be asked to confirm the operation. Press OK. 8. After the SLL load is completed you may restart the XPert application. You may do this
by scrolling to the bottom of the \Flash Disk panel (XPert Files), selecting XPert.exe, and pressing the RUN button at the bottom of the window. Powering off and on will also work if an Autoexec.bat file is defined on the XPert.
Verify that the SLL has loaded correctly. Log on to the XPert application (either through the front panel or using XTerm) with SETUP access privileges. Go to the SETUP tab and press the ADD button. The Select Category window (Figure 2) will appear.

Ocean Systems Test and Evaluation Program
A-4
Figure 2. – Category Window for Selecting Block Type Select Input as the block type.
Figure 3. – Input Module Window You will see the Air Gap sensor block with the following icon as an available input (Figure 3).
AirGapWL If the block is not available, or you received an error message when the XPert application started, then try powering down the XPert and restarting it. If you still can’t find the block or you still

Ocean Systems Test and Evaluation Program
A-5
receive an error message, it is likely that the SLL is not compatible with the version of XPert software that you are running. Contact Sutron to obtain the latest updates. If the block is available, the installation is successful. Press Cancel twice (once in the Input Module window and once in the Select Category window) to return to the Setup window. Using the Air Gap block in a setup is covered later in this manual.

Ocean Systems Test and Evaluation Program
A-6
3.0 Hardware Requirements and Wiring 3.1 COM port connections
3.1.1 Output Connection No XPert output connection is required. 3.1.2 Input Connection The Air Gap sensor block requires a connection to one of the available COM ports on the XPert. The default port is COM 2, but COM 2 through COM 4 (COM 8 with optional I/O expansion on XPert) may be selected as part of the setup. The connection from the XPert to the Air Gap sensor is a standard, straight-wired (not null modem) male-female DB-9 cable. 3.2 Analog Connections None required. 3.3 digital connections None required.
4.0 Operating instructions 4.1 Setup The Air Gap sensor block is a passive input. That is, it must be measured in order to obtain values. This is normally done by wiring the Air Gap block to a Measure block. The Air Gap block has been tested at sample rates up to once per second. Note that the Air Gap block has two (2) outputs labeled WL1 and WL2. These correspond to the two water levels returned by the sensor when the GV command is issued. Refer to the Miros documentation for an explanation of the difference between the two outputs. Note that no RS-232 serial settings are required. The Air Gap block sets the selected input port to 9600 bps, no parity, 8 data bits, and one stop bit. 4.1.1 Test Setup Figure 4. illustrates a simple test setup that may be used to determine if the Air Gap block is operating properly.

Ocean Systems Test and Evaluation Program
A-7
Figure 4. – Test Setup for Air Gap Sensor The test setup uses one Air Gap block, one Measure block, and one Log block. The test setup is named AirGapTest.ssf. It can be copied to the \Flash Disk on the XPert and loaded through the SETUP tab File Open menu option. Test an Air Gap sensor by connecting it to an available COM port. After the wiring is complete, go to the SETUP tab and click on the Air Gap icon. Select the Edit Properties option. The following dialog window will open:
Figure 5. – Serial Display Properties Window Select the COM port to which the display is connected (default is COM 2). Set the Slope and Offset parameters (Output equals input times slope plus offset) if you want to scale the outputs. Click on OK.

Ocean Systems Test and Evaluation Program
A-8
Set the properties of the Measure block so that the Air Gap sensor is sampled frequently – for example every 5 seconds. Click on OK. Go to the MAIN tab and turn recording on. (If recording was on when you entered SETUP then you will have the opportunity to turn it back on when you exit SETUP mode.) Examine the Status tab to ensure that there are no communications errors. View the log to see the sensor readings. 4.1.2 Normal Setup There is no fundamental difference between a normal setup and the test setup except for processing. Typically the Air Gap block will be wired to a Measure block. The Measure block can be wired directly to the Log or to a DQAP block that filters and/or averages the output values. DQAP provides several outputs including average, standard deviation, and outlier count. Refer to the standard XPert documentation for information on DQAP.

Ocean Systems Test and Evaluation Program
A-9
4.2 Operations When recording is turned on the Air Gap block sets the selected COM port properties to N-8-1 at 9600 bps. It then issues the Air Gap SER0 command to put the sensor into sampled mode. (The default Air Gap sensor mode is “streaming” with output of water levels at rates greater than once per second.) The software then looks for the returned message from the sensor indicating that the mode has been reset. When the Air Gap sensor block is measured it issues the Air Gap GV command. The GV command requests data values. The sensor returns two water levels filtered in different ways. Both are available as outputs from the Air Gap block. If the user has changed the Slope and Offset parameters in the Air Gap block properties then the values are first multiplied by the slope and then the offset is added. The Slope and Offset apply to both water levels. That is, there is no separate slope and offset for each one.

Ocean Systems Test and Evaluation Program
A-10
5.0 Error Messages and Troubleshooting 5.1 Error Messages The Air Gap block can produce two status messages and one error message. The messages and their meanings are presented in the following table. Message Explanation CAirGapWL::Execute No data returned
When the Air Gap block issued the GV command to the sensor there was no data returned. That is, the input buffer was blank.
CAirGapWL::Execute Com out of synch
Line noise will occasionally cause corrupted characters in the data values. When this happens the software may not be able to correctly parse the data. The software will loose synchronization with the sensor for one or more sample intervals until all of the air gap error messages are cleared from the input buffer.
CAirGapWL::Execute OpenComm n failed
The Air Gap block was not able to establish communications with the selected COM port (number n).
Error messages will appear on the XPert Status tab as illustrated in Figure 6
Figure 6. - XPert Status Tab with error messages

Ocean Systems Test and Evaluation Program
A-11
5.2 Troubleshooting The following table presents common problems and their solution. Problem Solution Unable to open the selected COM port
Likely wiring problem. Make sure that the DB-9 to air bap sensor connection is wired properly. Make sure that pins 2 and 3 (TXD/RXD) are not reversed in your cable. Test that the air gap sensor is generating output by connecting a PC or laptop to in and establishing a Hyperterm session with the sensor. Try issuing the SER0 and SER1 commands and the GV command to test the sensor.
XPert displays an hourglass cursor when recording is turned on.
The air gap sensor is connected to the wrong COM port. Go to the SETUP tab and edit the properties of the display block to match the port or move the DB-9 cable to the correct port. NOTE: If the hourglass is displayed it will eventually (about 4 minutes) time out and recording will start.
Error messages appear in the STATUS panel.
Error messages indicate severe errors. The most likely cause is a wiring error in the DB-9 cable or a hardware failure on the XPert.
It is possible to determine if the Air Gap block is operating by connecting a laptop computer to the COM port selected for the sensor. Establish a Hyperterm or other terminal emulator session with the port at 9600-N-8-1. When recording is turned on you should be able to see the XPert issue the SER0 command as well as the GV commands. Note that the commands only contain a carriage return and DO NOT contain a line feed character. This effects the appearance of the output in a terminal session. (It may be necessary to use a null modem cable for the connection.)

Ocean Systems Test and Evaluation Program
A-12

Ocean Systems Test and Evaluation Program
B-1
Appendix B Air Gap Acceptance Test Report
Serial #:Range: 85m Voltage:
Miros Range Finder Ver. 7.1.3 built on Jul 21 2005 20:14:03EPLD version 1.3Maximum range 85Ant. beam width 5allch 3.00 - 85.00 mwin 6.00 mmin 100.00det 100.00 %tout 10.00 secatc 60.00 sec (1350)htc 0.00 sec (1)ntc 0.00 sec (0)wtc 5.02 sec (113)ser 0top 1freq 2.00 Hz (0.500 sec)sep tab (ASCII value 9)gps 0altconfigmeas 375.00 mm/ch, -875.00 mmfft 512range 85 mindex t.hold 50 %ant 5 degspeed 9600 baudsampling-freq. 46083 Hzsweep-time 22.22 mseccycle-time 44.44 msec
Command Command Issued? (yes/no) Acceptable Reply? (yes/no - description)
"altconfig" yes
yes
altconfig: set interrupt command to interrupt = 1
Note any changes to standard configuration and reason for changes:
12 VDC
Capture File Location: H:\MIROS\MIROS_UNIT_RECORDS\MIROS-060277\060277.cap
Copy of Setup Commands:
Firmware Version Installed: 7.1.3
Comments:
SYSTEM COMMAND CHECK:
"all"
SYSTEM SETUP COMMANDS
Air Gap Acceptance Test Report CO-OPS Standardized Operational Test Acceptance Report
I. System Configuration
GENERAL SENSOR INFORMATION
Sensor Model: 060277MIROS SM094/2/85N RANGE FINDER
Communication Protocol: RS232

Ocean Systems Test and Evaluation Program
B-2
Serial #:Range: 85m Voltage:
Rewiring:
Dates:
Date: Time: 2pm
Date: Time: 9am
WIRING: Describe in detail any changes to wiring - IF CHANGED
Manual Reference:
II. Bench Testing
GENERAL SENSOR INFORMATION
Sensor Model: 060277MIROS SM094/2/85N RANGE FINDER
12 VDCCommunication Protocol: RS232
Firmware Version Installed:
wk of 12/11-12/16
Comments:
BURN-IN TESTING
Signal NameWire #/ Color Internal Terminal
BURN-IN TESTING -- RUN TIME
Comments:
Tammy GraffTesting Completed by:Test Location: Chesapeake Facility Warehouse
Data Files:
Commenced:Terminated:
Total Duration of Testing:
~19 hr.
Comments:
Files Associated with Bench
Testing:

Ocean Systems Test and Evaluation Program
B-3
Serial #:Range: 85m Voltage:
Dates:50m
Serial #:
Files Associated with Reference Range Testing:
Standard Deviation (microwave from laser mean):
Comments:
MICROWAVE & LASER TEST RESULT COMPARISONS
[Microwave Mean] - [Laser Mean] =
Comments:
Sample Mean: Sample Standard Deviation:Low Value: High Value: Sample Range:
Sample Standard Deviation:Comments:
# of Samples: Sample Period (min):
High Value:
Sensor Model:
Sample Range:Low Value:
LASER TEST RESULTS
Sample Mean:
Tammy Graff, Katie Derner, Anthony Nugnes
# of Samples: Sample Period (min):
MICROWAVE RANGE TEST RESULTS
Manufacturer Tolerance Standards:
Test Location:Comments:
Reference Range:Chesapeake Reference Test Range - back parking lot
Comments:
TESTING
Testing Completed by:
III. Reference Range Testing
GENERAL SENSOR INFORMATION
Sensor Model: MIROS SM094/2/85N RANGE FINDER 060277
Mon 12/18/06
Communication Protocol: RS232 12 VDC
Firmware Version Installed:

Ocean Systems Test and Evaluation Program
B-4
Serial #:Range: 85m Voltage:
Dates:
Offset Between the Microwave Sensor & Laser Range Sensor:Comments:
Continual Up Rate: Low Continual Down Rate:Sensor Polling Time: 1Hz - 1s
Low
Measured Average Speed:Crane Operator Speed Setting: Low
IV. Crane Hoist Testing
GENERAL SENSOR INFORMATION
Sensor Model: MIROS SM094/2/85N RANGE FINDER 060277
Communication Protocol: RS232 12 VDC
Firmware Version Installed:Comments:
TESTING
Testing Completed by: Tammy Graff, Katie Derner, Anthony Nugnes 1/22/2007
Test Location: Metro Machines - Norfolk, VA
Crane Utilized: Crane #5 Crane Operator: Terry
MICROWAVE TEST RESULTS
# of Samples: Sample Period (min):
Mean (Microwave - Laser) =
Low Value:
MICROWAVE & LASER TEST COMPARISONS
Comments:
Comments: High Value: Sample Range:
Standard Deviation (microwave from laser mean):
Standard Deviation (microwave from reference mean):
TEST MICROWAVE & OSTEP AIR GAP REFERENCE SENSOR COMPARISON
Mean (Test Microwave - Reference Microwave) =
Comments:
Air Gap Test #1: 060278 3
Port
060277 2
Lift Number (for day):Mounted Sensor Serial Numbers:
OSTEP Reference Air Gap: MIROS RANGE FINDER SM-094/85 SN: P020146 1
Air Gap Test #2:
ULS: SN: US000151
Files Associated with Crane
Testing:

Ocean Systems Test and Evaluation Program
B-5
Serial #:Range: 85m Voltage:
Date:
Files Associated with XPERT
Testing:
Testing Completed By:Comments:
V. XPERT Testing
IN-HOUSE MICROWAVE UNIT CHECK WITH XPERT
Unit Check with XPERT : YES NO
Firmware Version Installed:Comments:
Comments:
SENSOR LOCATION
Dates CommentsSensor Location / Owner
12 VDC
SENSOR ALLOCATION
Comments:
Manufacturer:Contact Number:
VI. Location Report
GENERAL SENSOR INFORMATION
Sensor Model: 060277MIROS SM094/2/85N RANGE FINDER
Communication Protocol: RS232
PLANNED SENSOR DESTINATION:
Contact Name (s):
Receive Date:Purchase Date:

Ocean Systems Test and Evaluation Program
B-6
Serial #:Range: 85m Voltage:
VII. Additional Notes
GENERAL SENSOR INFORMATION
Sensor Model: MIROS SM094/2/85N RANGE FINDER 060277
Comments:
NOTES
Communication Protocol: RS232 12 VDC
Firmware Version Installed:

Ocean Systems Test and Evaluation Program
C-1
Appendix C Proposed Installation Drawings for the Verrazano-Narrows Bridge

Ocean Systems Test and Evaluation Program
C-2

Ocean Systems Test and Evaluation Program
ACRONYMS AND ABBREVIATIONS cm centimeter CO-OPS Center for Operational Oceanographic Products and Services CORMS Continuous Operational Real-Time Monitoring DAS data acquisition system DCP data collection platform DIS data ingestion server DQAP data quality assurance process ED Engineering Division FM frequency modulated FOD Field Operations Division ft feet GOES geostationary operational environmental satellite GPS global positioning system IF intermediate frequency in inches m meter MHz mega-Hertz min minute mm millimeter MTA Metropolitan Transportation Authority NOAA National Oceanic and Atmospheric Administration NOS National Ocean Service OSHA Occupational Safety and Health Administration OSTEP Ocean Systems Test and Evaluation Program PORTS® Physical Oceanographic Real-Time System QC quality control ULS universal laser sensor V Volt Vdc Volt direct current