historical golden gate tidal series · 2013-07-08 · noaa technical report nos co-ops 035...
TRANSCRIPT
NOAA Technical Report NOS CO-OPS 035
HISTORICAL GOLDEN GATE TIDAL SERIES
Silver Spring, MarylandOctober, 2002
noaa National Oceanic and Atmospheric Administration
U.S. DEPARTMENT OF COMMERCENational Ocean ServiceCenter for Operational Oceanographic Products and ServicesProducts and Services Division

Center for Operational Oceanographic Products and ServicesNational Ocean Service
National Oceanic and Atmospheric AdministrationU.S. Department of Commerce
The National Ocean Service (NOS) Center for Operational Oceanographic Productsand Services (CO-OPS) collects and distributes observations and predictions of waterlevels and currents to ensure safe, efficient and environmentally sound maritimecommerce. The Center provides the set of water level and coastal current productsrequired to support NOS' Strategic Plan mission requirements, and to assist inproviding operational oceanographic data/products required by NOAA's otherStrategic Plan themes. For example, CO-OPS provides data and products requiredby the National Weather Service to meet its flood and tsunami warningresponsibilities. The Center manages the National Water Level ObservationNetwork (NWLON), and a national network of Physical Oceanographic Real-TimeSystems (PORTS®) in major U.S. harbors. The Center: establishes standards for thecollection and processing of water level and current data; collects and documentsuser requirements which serve as the foundation for all resulting program activities;designs new and/or improved oceanographic observing systems; designs software toimprove CO-OPS' data processing capabilities; maintains and operatesoceanographic observing systems; performs operational data analysis/quality control;and produces/disseminates oceanographic products.

NOAA Technical Report NOS CO-OPS 035
HISTORICAL GOLDEN GATE TIDAL SERIES
Raymond A. SmithOctober 2002
noaa National Oceanic and Atmospheric Administration
U.S. DEPARTMENT OF COMMERCE National Oceanic and Atmospheric AdministrationDon Evans, Secretary Conrad C. Lautenbacher, Jr. Under Secretary for Oceans
and Atmosphere and NOAA Administrator
National Ocean ServiceMargaret A. Davidson, Acting Assistant Administrator
for Ocean Services and Coastal Zone Management
Center for Operational Oceanographic Products and ServicesMichael Szabados, Director

ii
iii
TABLE OF CONTENTS
Page
I. INTRODUCTION . . . . . . . . . . . . . . . . . . . . . . . . . . . . . . . . . . . . . . . . . . . . . . . . . . . . 1
II. HISTORY OF TIDE STATIONS AT THE GOLDEN GATE . . . . . . . . . . . . . . . . . . . 1
A. Fort Point . . . . . . . . . . . . . . . . . . . . . . . . . . . . . . . . . . . . . . . . . . . . . . . . . . . . . . . . 1 B. Sausalito . . . . . . . . . . . . . . . . . . . . . . . . . . . . . . . . . . . . . . . . . . . . . . . . . . . . . . . . . 1 C. Presidio . . . . . . . . . . . . . . . . . . . . . . . . . . . . . . . . . . . . . . . . . . . . . . . . . . . . . . . . . . 1
III. BENCH MARK AND LEVELING HISTORY AT THE GOLDEN GATE . . . . . . . . 3
A. Fort Point . . . . . . . . . . . . . . . . . . . . . . . . . . . . . . . . . . . . . . . . . . . . . . . . . . . . . . . . 3B. Sausalito . . . . . . . . . . . . . . . . . . . . . . . . . . . . . . . . . . . . . . . . . . . . . . . . . . . . . . . . . 3C. Presidio . . . . . . . . . . . . . . . . . . . . . . . . . . . . . . . . . . . . . . . . . . . . . . . . . . . . . . . . . . 4D. Relating the Tide Staff Zeros for the Three Locations to a Common Zero . . . . . . 4
IV. TIDAL DATUMS FOR THE GOLDEN GATE . . . . . . . . . . . . . . . . . . . . . . . . . . . . . 7
A. Fort Point/Presidio . . . . . . . . . . . . . . . . . . . . . . . . . . . . . . . . . . . . . . . . . . . . . . . . . 7B. Sausalito . . . . . . . . . . . . . . . . . . . . . . . . . . . . . . . . . . . . . . . . . . . . . . . . . . . . . . . . . 8
V. ADJUSTMENTS TO SAUSALITO 1877-1897 TIDAL HEIGHTS . . . . . . . . . . . . . . 9 VI. DATUM RECOVERY AT SAUSALITO . . . . . . . . . . . . . . . . . . . . . . . . . . . . . . . . . . 11
VII. GEODETIC RELATIONSHIPS TO TIDAL DATUMS AT THE GOLDEN GATE . 13
A. National Geodetic Vertical Datum . . . . . . . . . . . . . . . . . . . . . . . . . . . . . . . . . . . . . 13
B. North American Vertical Datum . . . . . . . . . . . . . . . . . . . . . . . . . . . . . . . . . . . . . . . 13
VIII. SPECIAL DATUMS. . . . . . . . . . . . . . . . . . . . . . . . . . . . . . . . . . . . . . . . . . . . . . . . . . . .. . . 15
IX. VARIATIONS IN MEAN SEA LEVEL AT THE GOLDEN GATE . . . . . . . . . . . . . 17
A. Seasonal Variations in Sea Level . . . . . . . . . . . . . . . . . . . . . . . . . . . . . . . . . . . . . . 17 B. Interannual-to-Decadal Variations . . . . . . . . . . . . . . . . . . . . . . . . . . . . . . . . . . . . . 18
C. Long-TermVariations in Annual Mean Sea Level . . . . . . . . . . . . . . . . . . . . . . . . . 19 D. Sea Level Trends . . . . . . . . . . . . . . . . . . . . . . . . . . . . . . . . . . . . . . . . . . . . . . . . . . 20 X. EXTREME HIGH AND LOW WATER LEVELS AT THE GOLDEN GATE . . . . . 23
A. Observed Highest Water Levels . . . . . . . . . . . . . . . . . . . . . . . . . . . . . . . . . . . . . . . 23 B. Observed Lowest Water Levels . . . . . . . . . . . . . . . . . . . . . . . . . . . . . . . . . . . . . . . 25 C. One Hundred Year Level . . . . . . . . . . . . . . . . . . . . . . . . . . . . . . . . . . . . . . . . . . . . 27

iv
D. The Great January 1862 Floods . . . . . . . . . . . . . . . . . . . . . . . . . . . . . . . . . . . . . . . 27 E. Return Period . . . . . . . . . . . . . . . . . . . . . . . . . . . . . . . . . . . . . . . . . . . . . . . . . . . . . 28
XI. FREQUENCY AND DURATION OF INUNDATION . . . . . . . . . . . . . . . . . . . . . . . . 31 XII. COMPARISON OF OBSERVED AND PREDICTED HIGH AND LOW WATER
LEVELS . . . . . . . . . . . . . . . . . . . . . . . . . . . . . . . . . . . . . . . . . . . . . . . . . . . . . . . . . . . 35 XIII. CONCLUDING REMARKS . . . . . . . . . . . . . . . . . . . . . . . . . . . . . . . . . . . . . . . . . . . . 37
ACKNOWLEDGMENTS . . . . . . . . . . . . . . . . . . . . . . . . . . . . . . . . . . . . . . . . . . . . . . 37
REFERENCES . . . . . . . . . . . . . . . . . . . . . . . . . . . . . . . . . . . . . . . . . . . . . . . . . . . . . . 39
APPENDIX A. History of Tide Gauges . . . . . . . . . . . . . . . . . . . . . . . . . . . . . . . . . . . . . . . A-1APPENDIX B. Leveling Techniques . . . . . . . . . . . . . . . . . . . . . . . . . . . . . . . . . . . . . . . . . B-1APPENDIX C. Comparative Readings and Adjustments to Tidal Heights at Fort Point
Between 1855 and 1859 . . . . . . . . . . . . . . . . . . . . . . . . . . . . . . . . . . . . . . C-1APPENDIX D. Water Level Crossings of the Golden Gate . . . . . . . . . . . . . . . . . . . . . . . . D-1

v
LIST OF FIGURES Page1. Location of Golden Gate Tide Stations . . . . . . . . . . . . . . . . . . . . . . . . . . . . . . . . . . 22. Summary of the relationships between tide staffs at the Presidio and Sausalito . . . 53. Tidal Datum Elevations at the Golden Gate for 7 Different Tidal Epochs
Between 1855 and 1998 . . . . . . . . . . . . . . . . . . . . . . . . . . . . . . . . . . . . . . . . . . . . . . 114. Seasonal Variations in Sea Level for Select Years in the Golden Gate Tidal Series 175A. Seasonal Variations in Sea Level During Several El Nino Events
Between 1939 and 1983 . . . . . . . . . . . . . . . . . . . . . . . . . . . . . . . . . . . . . . . . . . . . . . 185B. Seasonal Variations in Sea Level During Several El Nino Events
Between 1990 and 1998 . . . . . . . . . . . . . . . . . . . . . . . . . . . . . . . . . . . . . . . . . . . . . . 196. Annual Mean Sea Level, 19-Year Moving Average of Sea Level and Sea Level
Trend for the Golden Gate . . . . . . . . . . . . . . . . . . . . . . . . . . . . . . . . . . . . . . . . . . . . 207. Observed Annual Highest Water Levels at the Golden Gate Between 1855 and 1999 . . . . . . . . . . . . . . . . . . . . . . . . . . . . . . . . . . . . . . . . . . . . . . 238A. Observed Highest Water Level, Predicted and Storm Surge for
January 27, 1983 at the Presidio . . . . . . . . . . . . . . . . . . . . . . . . . . . . . . . . . . . . . . . . 248B. Observed Highest Water Level, Predicted and Storm Surge for
December 3, 1983 at the Presidio . . . . . . . . . . . . . . . . . . . . . . . . . . . . . . . . . . . . . . . 249. Observed Annual Lowest Water Levels at the Golden Gate . . . . . . . . . . . . . . . . . . 2510A. Observed Lowest Water Level, Predicted, and Storm Surge for
December 26, 1932 at the Presidio . . . . . . . . . . . . . . . . . . . . . . . . . . . . . . . . . . . . . . 2610B. Observed Lowest Water Level, Predicted, and Storm Surge for
December 17, 1933 at the Presidio . . . . . . . . . . . . . . . . . . . . . . . . . . . . . . . . . . . . . . 2611. Observed, Predicted and Storm Surge for January 22 - 24, 1862 at Fort Point . . . . 2812A. Frequency of Inundation for High Waters at the Presidio Between 1922 and 1984 3112B. Duration of Inundation for High Waters at the Presidio Between 1922 and 1984 . . 3212C. Frequency of Inundation for Low Waters at the Presidio Between 1922 - 1984 . . . 3212D. Duration of Inundation for Low Waters at the Presidio Between 1922 and 1984 . . 3313A. Frequency Distribution of Differences for High Water Heights at the Presidio . . . 3513B. Frequency Distribution of Differences for Low Water Heights at the Presidio . . . . 36A-1. Self-Registering Tide Gauge Installed at Fort Point in 1854 . . . . . . . . . . . . . . . . . . A-4A-2. ADR and Bubbler Tide Gauge Systems in Operation at the Presidio in the 1970s . A-5A-3. NGWLMS Installed at the Presidio in the Late 1980s . . . . . . . . . . . . . . . . . . . . . . . A-7C-1. Monthly Means of MLLW Elevations at Fort Point Corrected for Wharf Sinking
Between 1855 and 1859 . . . . . . . . . . . . . . . . . . . . . . . . . . . . . . . . . . . . . . . . . . . . . . C-4

vi
LIST OF TABLES Page1. Bench Mark and Leveling History at Fort Point . . . . . . . . . . . . . . . . . . . . . . . . . . . . . . 32. Bench Mark and Leveling History at Sausalito . . . . . . . . . . . . . . . . . . . . . . . . . . . . . . 43. Primary Bench Marks at the Presidio . . . . . . . . . . . . . . . . . . . . . . . . . . . . . . . . . . . . . . 44. Tidal Datums and Associated Tidal Parameters . . . . . . . . . . . . . . . . . . . . . . . . . . . . . . 75. Tidal Datums for Fort Point and the Presidio . . . . . . . . . . . . . . . . . . . . . . . . . . . . . . . . 86. Tidal Datums for Sausalito . . . . . . . . . . . . . . . . . . . . . . . . . . . . . . . . . . . . . . . . . . . . . . 87. Tidal Datum Elevations at Sausalito Adjusted to Reflect Tidal Datum Elevations at
the Presidio . . . . . . . . . . . . . . . . . . . . . . . . . . . . . . . . . . . . . . . . . . . . . . . . . . . . . . . . . . 108 . Tidal Datum Recovery at Sausalito . . . . . . . . . . . . . . . . . . . . . . . . . . . . . . . . . . . . . . . 129. Geodetic Relationships to Tidal Datums at the Golden Gate . . . . . . . . . . . . . . . . . . . . 1310. Relationships Between Tidal Datums (1960-1978 Tidal Epoch), NGVD and
NAVD at the Presidio . . . . . . . . . . . . . . . . . . . . . . . . . . . . . . . . . . . . . . . . . . . . . . . . . . 1411. Tidal Datums (1960 - 1978 Tidal Epoch) Related to Special Datums at the Presidio
. . . . . . . . . . . . . . . . . . . . . . . . . . . . . . . . . . . . . . . . . . . . . . . . . . . . . . . . . . . . . . . . . . 1612 Sea Level TrendsComputed for the Golden Gate . . . . . . . . . . . . . . . . . . . . . . . . . . . . . 2013. Highest Observed Water Levels in 100-Year Periods for the Golden Gate,
Adjusted for Sea Level Change . . . . . . . . . . . . . . . . . . . . . . . . . . . . . . . . . . . . . . . . . . 2714. Return Periods for San Francisco (1920 - 1970) . . . . . . . . . . . . . . . . . . . . . . . . . . . . . 29

vii
Executive Summary This report is a comprehensive summary of the tide data and tidal datums for theGolden Gate tidal series covering the period from 1854 to 2000. The Golden Gatetidal series is the longest uninterrupted tidal series in the United States and one of thelongest tidal series in the world. The Golden Gate is the entrance to the SanFrancisco Bay Estuary, one of the largest and most important commercial andindustrial estuarine areas in the United States. The Golden Gate tidal series servesan important reference for tidal studies conducted within the San Francisco BayEstuary.
The primary objective of this report is to document the establishment of the commondatum relationship between the three long data sets at Fort Point, Sausalito andPresidio locations. Tidal measurements have been recorded in the Golden Gate areasince the mid-1800s at Fort Point (1854-1877), Sausalito (1877-1897) and thePresidio (1897- Present). Once the datum relationships were established, the datasets were referenced to one common datum in order to establish the 146 year longdata series for the National Ocean Service tidal program. Tidal analyses wereperformed and tidal datums were computed on the basis of long-term data setsleading to increased reliability of chart datums, and marine boundary determinationwith San Francisco as the reference station. Comprehensive studies of sea levelchanges and trends relative to land were possible. Long-term extreme high waterlevels are an important factor in studies of the influence of storms on the waterlevels. Return periods were determined with a higher degree of accuracy. Frequencyand duration of inundation procedures were developed in which the data set at SanFrancisco provided ample long-term data. The scientific, engineering and academiccommunities have found this information useful to support resolution of manydevelopmental and environmental issues related to the Golden Gate region.
* The National Ocean Service was previously named the Survey of the Coast (1807 - 1837), then the Coast Survey (1837- 1878), followed by the Coast and Geodetic Survey (1878 - 1970). It was called the National Ocean Survey from 1970until 1982 when it was renamed the National Ocean Service.

viii
1
I. INTRODUCTION
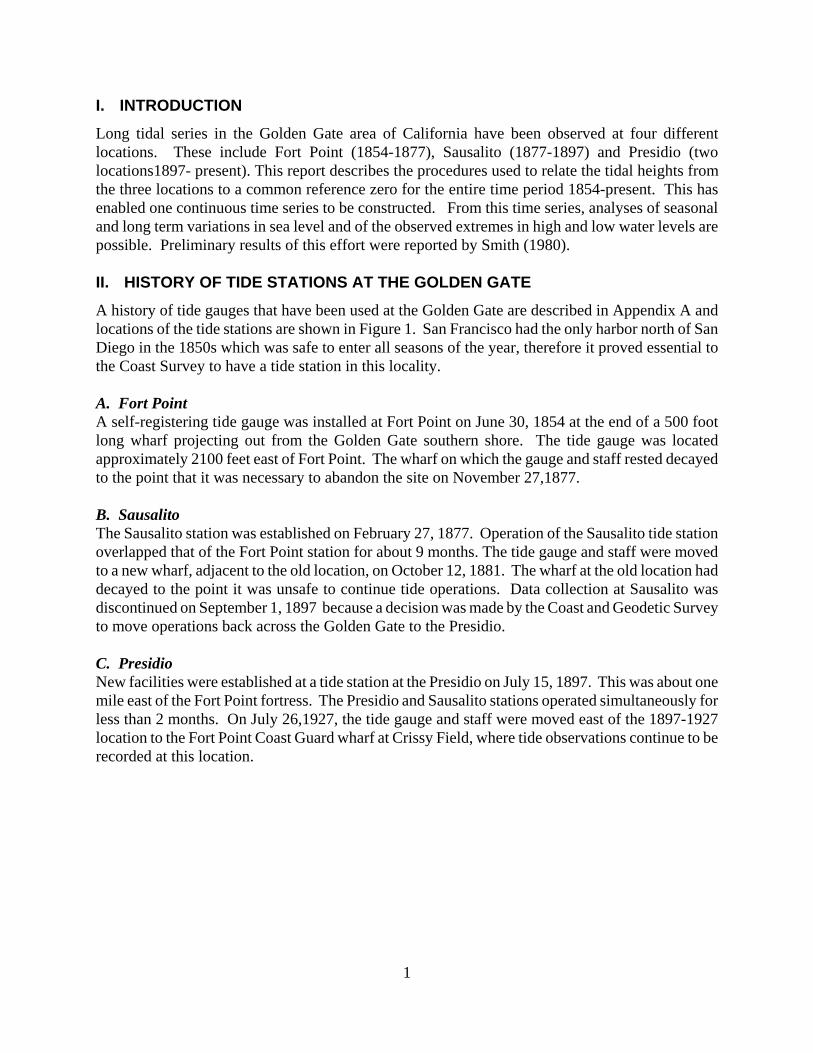
Long tidal series in the Golden Gate area of California have been observed at four differentlocations. These include Fort Point (1854-1877), Sausalito (1877-1897) and Presidio (twolocations1897- present). This report describes the procedures used to relate the tidal heights fromthe three locations to a common reference zero for the entire time period 1854-present. This hasenabled one continuous time series to be constructed. From this time series, analyses of seasonaland long term variations in sea level and of the observed extremes in high and low water levels arepossible. Preliminary results of this effort were reported by Smith (1980).
II. HISTORY OF TIDE STATIONS AT THE GOLDEN GATE
A history of tide gauges that have been used at the Golden Gate are described in Appendix A andlocations of the tide stations are shown in Figure 1. San Francisco had the only harbor north of SanDiego in the 1850s which was safe to enter all seasons of the year, therefore it proved essential tothe Coast Survey to have a tide station in this locality.
A. Fort PointA self-registering tide gauge was installed at Fort Point on June 30, 1854 at the end of a 500 footlong wharf projecting out from the Golden Gate southern shore. The tide gauge was locatedapproximately 2100 feet east of Fort Point. The wharf on which the gauge and staff rested decayedto the point that it was necessary to abandon the site on November 27,1877.
B. SausalitoThe Sausalito station was established on February 27, 1877. Operation of the Sausalito tide stationoverlapped that of the Fort Point station for about 9 months. The tide gauge and staff were movedto a new wharf, adjacent to the old location, on October 12, 1881. The wharf at the old location haddecayed to the point it was unsafe to continue tide operations. Data collection at Sausalito wasdiscontinued on September 1, 1897 because a decision was made by the Coast and Geodetic Surveyto move operations back across the Golden Gate to the Presidio.
C. PresidioNew facilities were established at a tide station at the Presidio on July 15, 1897. This was about onemile east of the Fort Point fortress. The Presidio and Sausalito stations operated simultaneously forless than 2 months. On July 26,1927, the tide gauge and staff were moved east of the 1897-1927location to the Fort Point Coast Guard wharf at Crissy Field, where tide observations continue to berecorded at this location.

2
Figure 1. Location of Golden Gate Tide Stations
3
III. BENCH MARK AND LEVELING HISTORY AT THE GOLDEN GATE
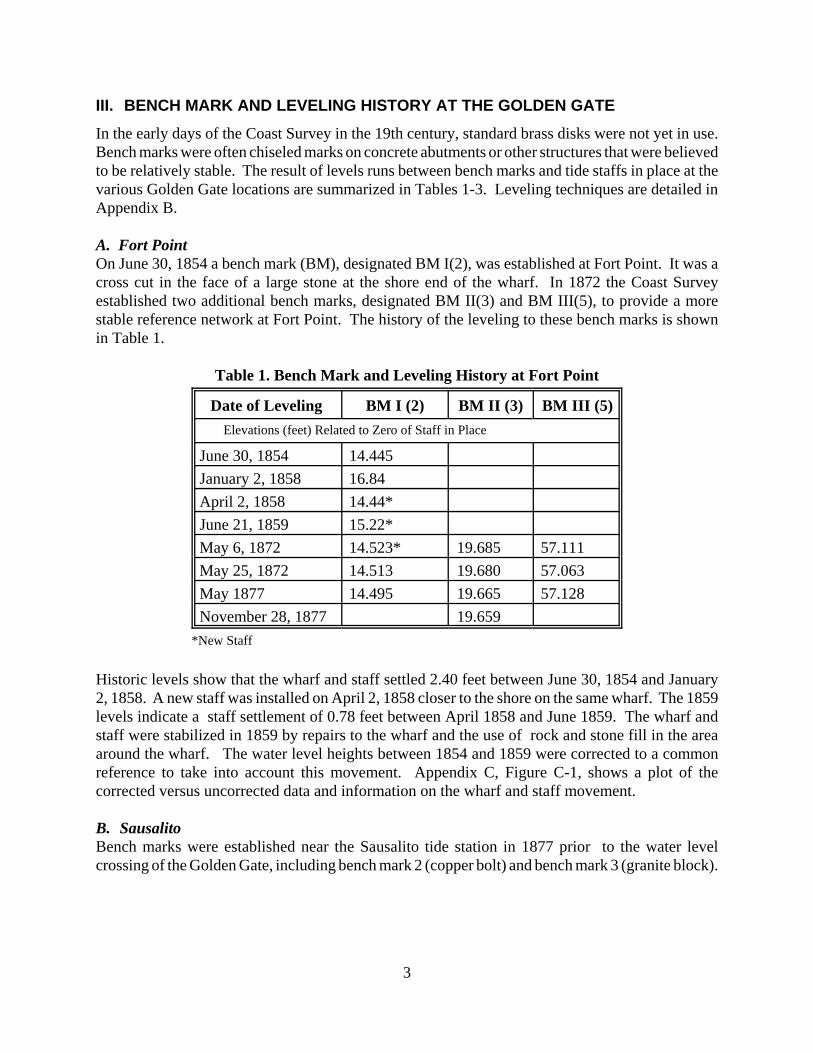
In the early days of the Coast Survey in the 19th century, standard brass disks were not yet in use.Bench marks were often chiseled marks on concrete abutments or other structures that were believedto be relatively stable. The result of levels runs between bench marks and tide staffs in place at thevarious Golden Gate locations are summarized in Tables 1-3. Leveling techniques are detailed inAppendix B.
A. Fort PointOn June 30, 1854 a bench mark (BM), designated BM I(2), was established at Fort Point. It was across cut in the face of a large stone at the shore end of the wharf. In 1872 the Coast Surveyestablished two additional bench marks, designated BM II(3) and BM III(5), to provide a morestable reference network at Fort Point. The history of the leveling to these bench marks is shownin Table 1.
Table 1. Bench Mark and Leveling History at Fort Point
Date of Leveling BM I (2) BM II (3) BM III (5)Elevations (feet) Related to Zero of Staff in Place
June 30, 1854 14.445January 2, 1858 16.84April 2, 1858 14.44*June 21, 1859 15.22*May 6, 1872 14.523* 19.685 57.111May 25, 1872 14.513 19.680 57.063May 1877 14.495 19.665 57.128November 28, 1877 19.659
*New Staff
Historic levels show that the wharf and staff settled 2.40 feet between June 30, 1854 and January2, 1858. A new staff was installed on April 2, 1858 closer to the shore on the same wharf. The 1859levels indicate a staff settlement of 0.78 feet between April 1858 and June 1859. The wharf andstaff were stabilized in 1859 by repairs to the wharf and the use of rock and stone fill in the areaaround the wharf. The water level heights between 1854 and 1859 were corrected to a commonreference to take into account this movement. Appendix C, Figure C-1, shows a plot of thecorrected versus uncorrected data and information on the wharf and staff movement. B. SausalitoBench marks were established near the Sausalito tide station in 1877 prior to the water levelcrossing of the Golden Gate, including bench mark 2 (copper bolt) and bench mark 3 (granite block).

4
Bench mark 2 is recoverable today and has been virtually undisturbed for over 100 years. Benchmark elevations and the mean elevation difference from the level results are presented in Table 2.
Table 2. Bench Mark and Leveling History at Sausalito
Event BM 2(Copper Bolt)
BM 3(Granite)
May 25, 1877 (1877 Staff) 12.614 ft. 46.093 ft.
October 12, 1881 (1881 Staff)(1886-1896 Levels, Mean of24 level runs)
12.829 ft. 46.282 ft.
Difference 0.215 ft. 0.189 ft.
Mean Difference 0.202 ft.
C. PresidioThe zero of the fixed staff to which the automatic tide gauge record at the Presidio wharf wasreferred was designated as Bench Mark 11. Tidal heights were referred to this tide staff zero fromJuly 1897 to July 1905. Bench Mark 11 was 14.494 feet (mean of level results between 1897 and1905) below BM 15 (Granite BM) which was designed as the primary bench mark (PBM) at thePresidio. The PBM is the principal mark of a group of tidal bench marks to which the tide staff andtidal datums are referred. New PBM’s are established over time to replace PBM’s that have becomeunstable or are destroyed. The other bench marks to replace BM 15 in time as the PBM are shownin Table 3.
Table 3. Primary Bench Marks at the Presidio
PBM Above 1897 Tide StaffZero (Elevation in Feet)
Years as PBM
15 (1897) 14.49 1897-1912166 (1912) 17.05 1912-1927173 (1927) 15.80 1927-1936180 (1936) 19.01 1936-1995
D. Relating the Tide Staff Zeros for the Three Locations to a Common ZeroThe level crossing of the Golden Gate between Fort Point and Sausalito in 1877 and the watercrossing of the Golden Gate in 1906-07, after the "Great San Francisco Earthquake of 1906", wereinstrumental in relating the water level heights for the three locations to a common datum. Theprocedures used in the level crossings are described in Appendix B and the level runs are shown inAppendix D. The relationships between the zeros of the respective staffs at the three locations are
5
0.20 foot
0.25 foot
0.01 foot
1877 Tide Staff 0
1881 Tide Staff 0
1897 Tide Staff 0
1877 Tide Staff 0
Sausalito
Sausalito
Presidio
Fort Point
0.46 foot
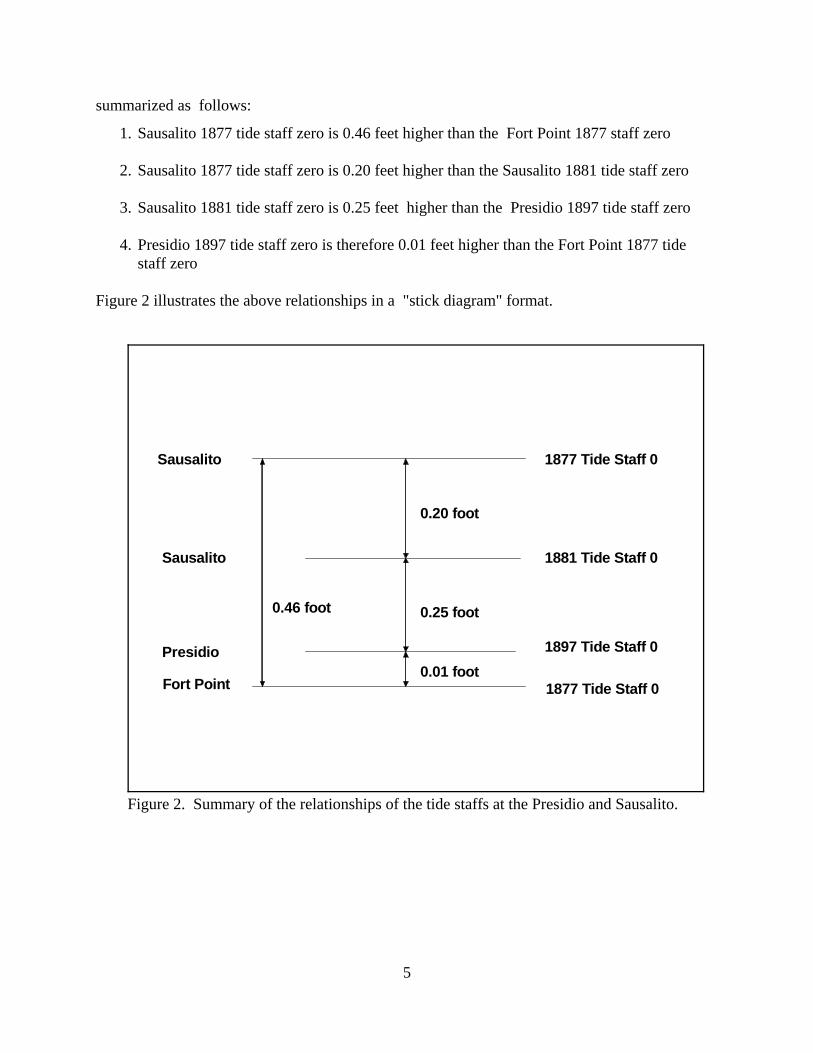
Figure 2. Summary of the relationships of the tide staffs at the Presidio and Sausalito.
summarized as follows: 1. Sausalito 1877 tide staff zero is 0.46 feet higher than the Fort Point 1877 staff zero
2. Sausalito 1877 tide staff zero is 0.20 feet higher than the Sausalito 1881 tide staff zero
3. Sausalito 1881 tide staff zero is 0.25 feet higher than the Presidio 1897 tide staff zero
4. Presidio 1897 tide staff zero is therefore 0.01 feet higher than the Fort Point 1877 tidestaff zero
Figure 2 illustrates the above relationships in a "stick diagram" format.

6
7
IV. TIDAL DATUMS COMPUTED FOR THE GOLDEN GATE
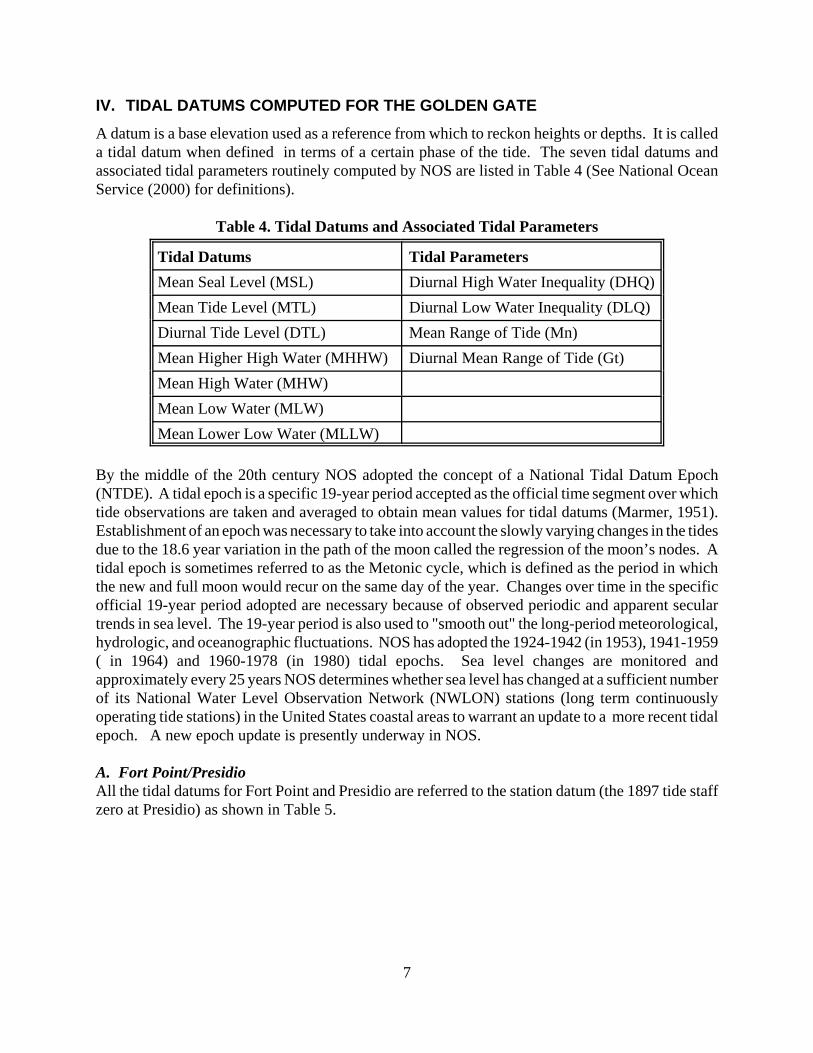
A datum is a base elevation used as a reference from which to reckon heights or depths. It is calleda tidal datum when defined in terms of a certain phase of the tide. The seven tidal datums andassociated tidal parameters routinely computed by NOS are listed in Table 4 (See National OceanService (2000) for definitions).
Table 4. Tidal Datums and Associated Tidal Parameters
Tidal Datums Tidal ParametersMean Seal Level (MSL) Diurnal High Water Inequality (DHQ)Mean Tide Level (MTL) Diurnal Low Water Inequality (DLQ)Diurnal Tide Level (DTL) Mean Range of Tide (Mn)Mean Higher High Water (MHHW) Diurnal Mean Range of Tide (Gt)Mean High Water (MHW)Mean Low Water (MLW)Mean Lower Low Water (MLLW)
By the middle of the 20th century NOS adopted the concept of a National Tidal Datum Epoch(NTDE). A tidal epoch is a specific 19-year period accepted as the official time segment over whichtide observations are taken and averaged to obtain mean values for tidal datums (Marmer, 1951).Establishment of an epoch was necessary to take into account the slowly varying changes in the tidesdue to the 18.6 year variation in the path of the moon called the regression of the moon’s nodes. Atidal epoch is sometimes referred to as the Metonic cycle, which is defined as the period in whichthe new and full moon would recur on the same day of the year. Changes over time in the specificofficial 19-year period adopted are necessary because of observed periodic and apparent seculartrends in sea level. The 19-year period is also used to "smooth out" the long-period meteorological,hydrologic, and oceanographic fluctuations. NOS has adopted the 1924-1942 (in 1953), 1941-1959( in 1964) and 1960-1978 (in 1980) tidal epochs. Sea level changes are monitored andapproximately every 25 years NOS determines whether sea level has changed at a sufficient numberof its National Water Level Observation Network (NWLON) stations (long term continuouslyoperating tide stations) in the United States coastal areas to warrant an update to a more recent tidalepoch. A new epoch update is presently underway in NOS.
A. Fort Point/PresidioAll the tidal datums for Fort Point and Presidio are referred to the station datum (the 1897 tide staffzero at Presidio) as shown in Table 5.

8
Table 5. Tidal Datums and Tidal Parameters for Fort Point and Presidio
Tidal DatumsElevation (Feet) above 1897Tide Staff Zero at Presidio
Fort Point
PresidioTidal Epoch
Datum 1855-1873
1898-1916
1924-1942
1941-1959
1960-1978
1980-1998
MHHW 10.97 11.15 11.31 11.46 11.60 11.12MHW 10.40 10.57 10.72 10.86 11.00 11.22MTL 8.50 8.60 8.73 8.86 8.95 9.17MSL 8.44 8.54 8.67 8.80 8.90 9.11MLW 6.62 6.64 6.74 6.87 6.90 7.13MLLW 5.43 5.49 5.61 5.75 5.77 6.00
Tidal ParametersMn 3.78 3.93 3.98 3.99 4.10 4.09DHQ 0.57 0.58 0.59 0.60 0.60 0.61DLQ 1.19 1.15 1.13 1.12 1.13 1.13Gt 5.54 5.66 5.70 5.75 5.83 5.83
B. SausalitoTidal datums (1878 - 1896), referred to the station datum (the 1881 tide staff zero) at Sausalito, aresummarized in Table 6.
Table 6. Tidal Datums and Tidal Parameters for Sausalito
Tidal Datum (1878-1896)
Elevation (Feet)
Tidal Parameters
Elevation(feet)
MHHW 10.79MHW 10.22 Mn 3.57MTL 8.43 DHQ 0.57MSL 8.39 DLQ 1.13MLW 6.65 Gt 5.27MLLW 5.52

9
Range of tide (1878-96) for Sausalito 3.57Range (Mn) Ratio 0.94
V. ADJUSTMENTS TO SAUSALITO 1877 - 1897 TIDE HEIGHTS
The difference in the mean level of the sea surface across the Golden Gate between San Franciscoand Sausalito was thought to be small enough that adjustments were not made to the MSL elevationsat Sausalito when the datum elevations were transferred to the Presidio. The concept of a minimalsea surface slope across the Golden Gate between Fort Point and Sausalito was supported by thecomputed difference of MSL (1960 - 1978) - NGVD of 0.02 feet between the two locations.
The mean range of tide at Sausalito had an average range ratio (mean range of tide at Sausalitodivided by the mean range of tide at Fort Point) of 0.94, therefore adjustments to the mean range oftide at Sausalito were needed. The range ratio was computed from an average of the ranges fromthe results of simultaneous comparisons between Fort Point and Sausalito. The mean high water andmean low water datum elevations also needed adjustments. The diurnal high water (DHQ = MHHW- MHW) and diurnal low water (DLQ = MLW - MLLW) inequalities were not required to beadjusted in the transfer. The following procedures were used to make adjustments to the tidaldatum elevations for Sausalito to obtain values for these parameters for Fort Point/Presidio:
1. = = 3.80 Ft
2. MTL and MSL are computed by transferring values to the 1897 tide staff at the Presidio. Station datum at Sausalito is defined as the 1881 tide staff zero which 0.25 foot above the
Presidio station datum (1897 tide staff zero).
MTL + 0.25 = 8.43 + 0.25 = 8.68 Ft MSL + 0.25 = 8.39 + 0.25 = 8.64 Ft
3. MLW = MTL - 1/2 Mn = 8.68 - 1/2(3.80) = 6.78 Ft
4. MHW = MLW + Mn = 6.78 + 3.80 = 10.58 Ft
5. MHHW = MHW + DHQ = 10.58 + 0.57 = 11.15 Ft
6. MLLW = MLW - DLQ = 6.78 - 1.13 = 5.65 Ft
All these adjusted values have been combined to reflect the tidal datum elevations reduced to meanvalues (1878 -1896) at Presidio, referred to the 1897 tide staff zero (Table 7).
10
Figure 3. Tidal Datum Elevations at the Golden Gate For 7 Different Tidal Epochs Between 1855 and 1896
4
5
6
7
8
9
10
11
12
13
MHHW
Elev
atio
n in
Fee
t Abo
ve S
tatio
n D
atum
MHW
MTLMSL
MLW
MLLW
1855 - 1873 1878 - 1896 1898 -1916 1924 - 1942 1941 - 1959 1960 - 1978 1980 - 1998
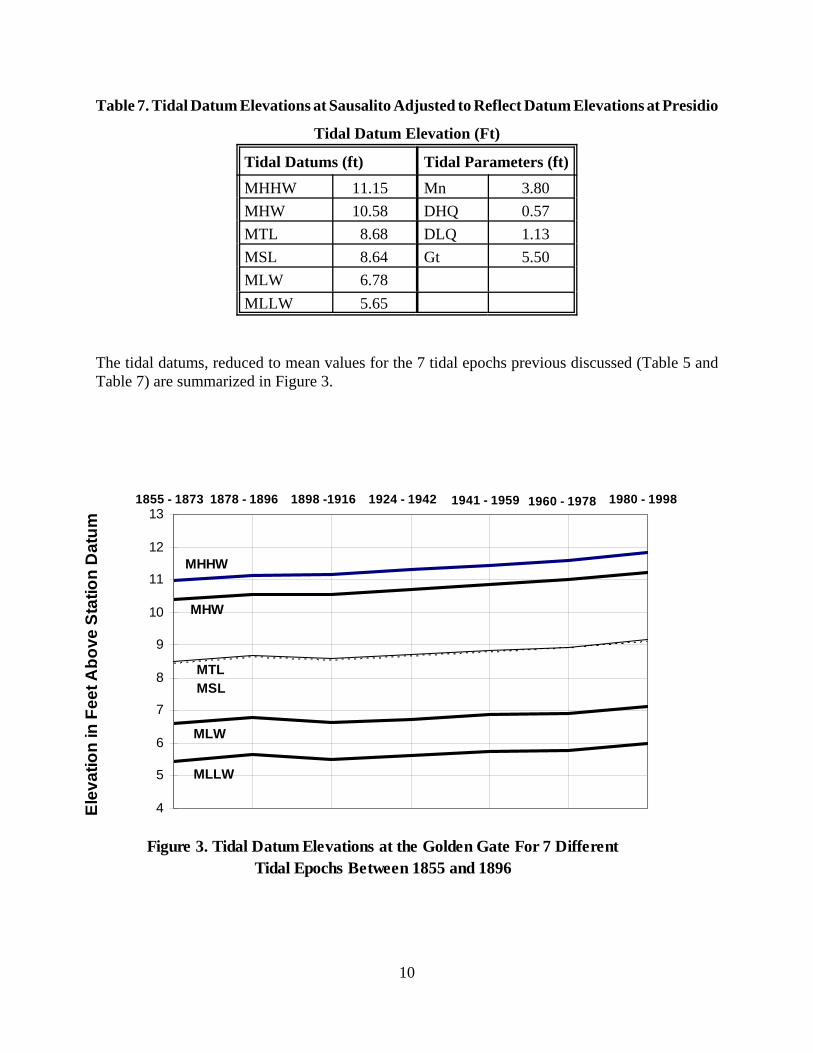
Table 7. Tidal Datum Elevations at Sausalito Adjusted to Reflect Datum Elevations at Presidio
Tidal Datum Elevation (Ft)
Tidal Datums (ft) Tidal Parameters (ft)MHHW 11.15 Mn 3.80MHW 10.58 DHQ 0.57MTL 8.68 DLQ 1.13MSL 8.64 Gt 5.50MLW 6.78MLLW 5.65
The tidal datums, reduced to mean values for the 7 tidal epochs previous discussed (Table 5 andTable 7) are summarized in Figure 3.

11
VI. DATUM RECOVERY AT SAUSALITO
A datum recovery is made at a tide station to determine how accurate the datum computed from onedata set compares with the datum computed from a different period of time. It also assesses howaccurate the datum at a location can be transferred from one period in time to another. Thedifference may also give an indication of how much the datum has changed over time due to man-made/or natural causes. If the recovery of the datum over time between different hydrographicsurveys in the area are possible, then a history of the changes in sounding datum betweenhydrographic surveys can be determined which may provide information on bathymetric or otherchanges in the area.
Tidal datum recovery at Sausalito has been computed over a 100 year period with the use of the tidalseries 1878 - 1896 and 1977 - 1979. Bench mark 2 1877 is a common bench mark to both tidal seriesin the analysis. The preliminary steps in the datum recovery are shown in Table 8.
Table 8. Tidal Datum Recovery at Sausalito
MTL(on staff 0)
BM 2Elevation
MTL ( on 1881Staff 0)
Series
8.43 ft. 12.83 ft. 8.43 ft. First reduction 1878-1896
5.99 ft. 10.11 ft. 8.71 ft. 24 months 1977-1979 datumsreduced to mean value to 1960-1978tidal epoch
The information in Table 8 is used to determine the datum recovery at Sausalito using the followingsteps:
a. The difference in the elevation of the common bench mark on the respective staffs for thetwo series is computed. From Table 8, the difference is 12.83 - 10.11 = 2.72 feet.
b. To refer the MTL elevation on the 1977 tide staff to the 1881 tide staff zero , 2.72 feet isadded to 5.99 so that the corrected MTL (1878 - 1896) = 8.71 feet.
c. The datum recovery must take into account the change in relative mean sea level over time.This is estimated from Table5. The difference in mean sea level at the Presidio between the1898-1916 and 1960-78 tidal epochs is 8.90-8.54 = 0.36 feet or a rate 0.0058 ft./yr(0.36ft./62 years).
d. The MTL of 8.43 feet in Table 8 needs to be adjusted as follows to reflect the sea levelchange between epochs 1878-1896 and 1960-78 (82 years). This difference is 0.48 ft.(0.0058 x 82 years).
MTL (1878-1896) of 8.43 + 0.48 = 8.91 feet. (Corrected to MTL (1960-78)
e. The computed datum recovery for MTL is therefore 8.91 - 8.71 = 0.20 feet.
12
This datum recovery 0.20 foot is quite good given that the two tidal series are separated by such along period of time. This indicates is that there has probably been little movement of BM 2 atSausalito and the comparison of the results of 19 year datums at Sausalito from 1878 - 1896 comparewell with those based on 1977 - 1979 Sausalito data, reduced to mean values (1960 - 1978) througha simultaneous comparison with the Presidio.
There are difficulties in obtaining a precise datum recovery (0.10 foot or better) at tide stations whena station is re-occupied again years later. The factors that affect the datum recovery include:common bench mark(s) available for both series, the bench marks may have been destroyed, settledor disturbed; and the quality of the tide data for one of the tidal series at the location may bequestionable. The tidal datums for both series should be reduced to mean values (same tidal epoch)through simultaneous comparison with the same reference station in computing the tidal datums.
13
VII. GEODETIC RELATIONSHIPS TO TIDAL DATUMS AT THE GOLDEN GATE
The tidal datum of MSL has frequently been incorrectly referred to as a geodetic datum. MSL is atidal datum determined over a 19-year National Tidal Datum Epoch. It pertains to local mean sealevel and should not be confused with the fixed datums of North American Vertical Datum of 1988(NAVD 88) or National Geodetic Vertical Datum of 1929 (NGVD 29). NGVD 29 and NAVD 88are fixed geodetic datums whose elevation relationships to local MSL and other tidal datums are notexpected to be consistent from one location to another.
A. National Geodetic Vertical DatumNGVD 29 is a fixed datum that was adopted as a national standard geodetic reference for heightsbut is now considered superseded. NGVD 29 is sometimes referred to as Sea Level Datum of 1929or as Mean Sea Level on some early issues of Geological Survey Topographic Quads. NGVD 29was originally derived from a general adjustment of the first-order leveling networks of the U.S. andCanada after holding mean sea level observed at 26 long term tide stations as fixed. Numerous localand wide-spread adjustments have been made since establishment in1929. Bench mark elevationsrelative to NGVD 29 are available from the National Geodetic Survey (NGS) data base via theWorld Wide Web at http://www.ngs.noaa.gov/.
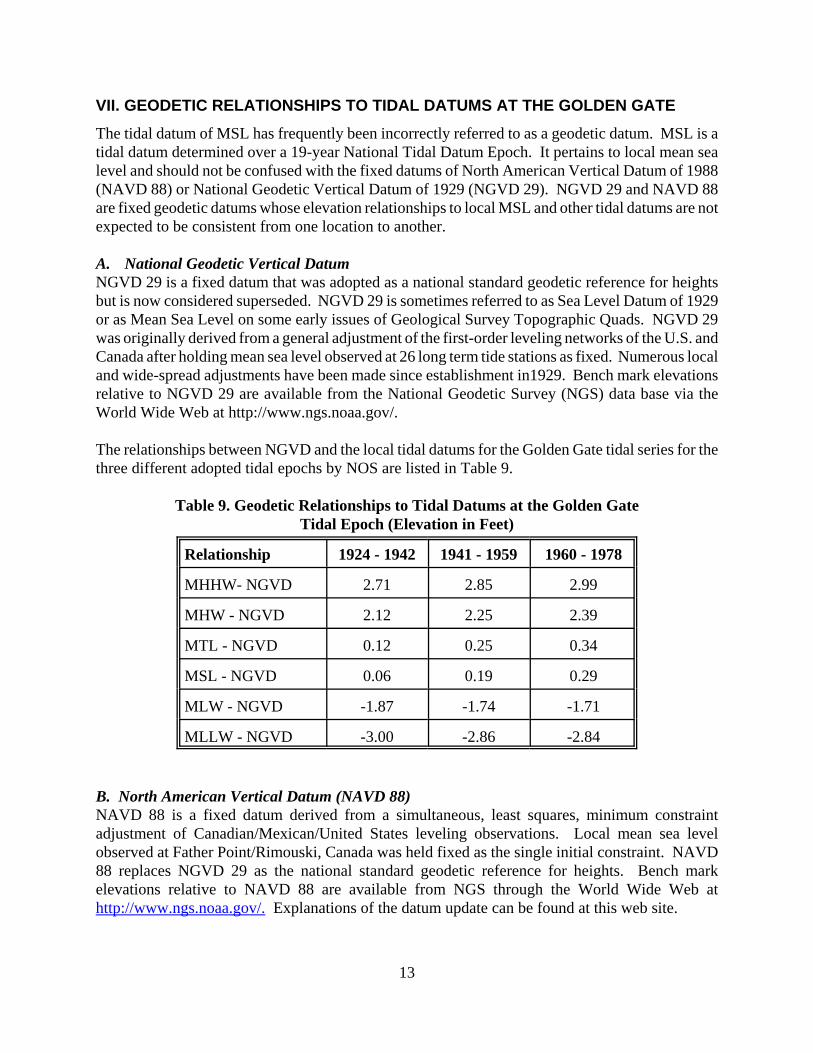
The relationships between NGVD and the local tidal datums for the Golden Gate tidal series for thethree different adopted tidal epochs by NOS are listed in Table 9.
Table 9. Geodetic Relationships to Tidal Datums at the Golden GateTidal Epoch (Elevation in Feet)
Relationship 1924 - 1942 1941 - 1959 1960 - 1978
MHHW- NGVD 2.71 2.85 2.99
MHW - NGVD 2.12 2.25 2.39
MTL - NGVD 0.12 0.25 0.34
MSL - NGVD 0.06 0.19 0.29
MLW - NGVD -1.87 -1.74 -1.71
MLLW - NGVD -3.00 -2.86 -2.84
B. North American Vertical Datum (NAVD 88)NAVD 88 is a fixed datum derived from a simultaneous, least squares, minimum constraintadjustment of Canadian/Mexican/United States leveling observations. Local mean sea levelobserved at Father Point/Rimouski, Canada was held fixed as the single initial constraint. NAVD88 replaces NGVD 29 as the national standard geodetic reference for heights. Bench markelevations relative to NAVD 88 are available from NGS through the World Wide Web athttp://www.ngs.noaa.gov/. Explanations of the datum update can be found at this web site.
14
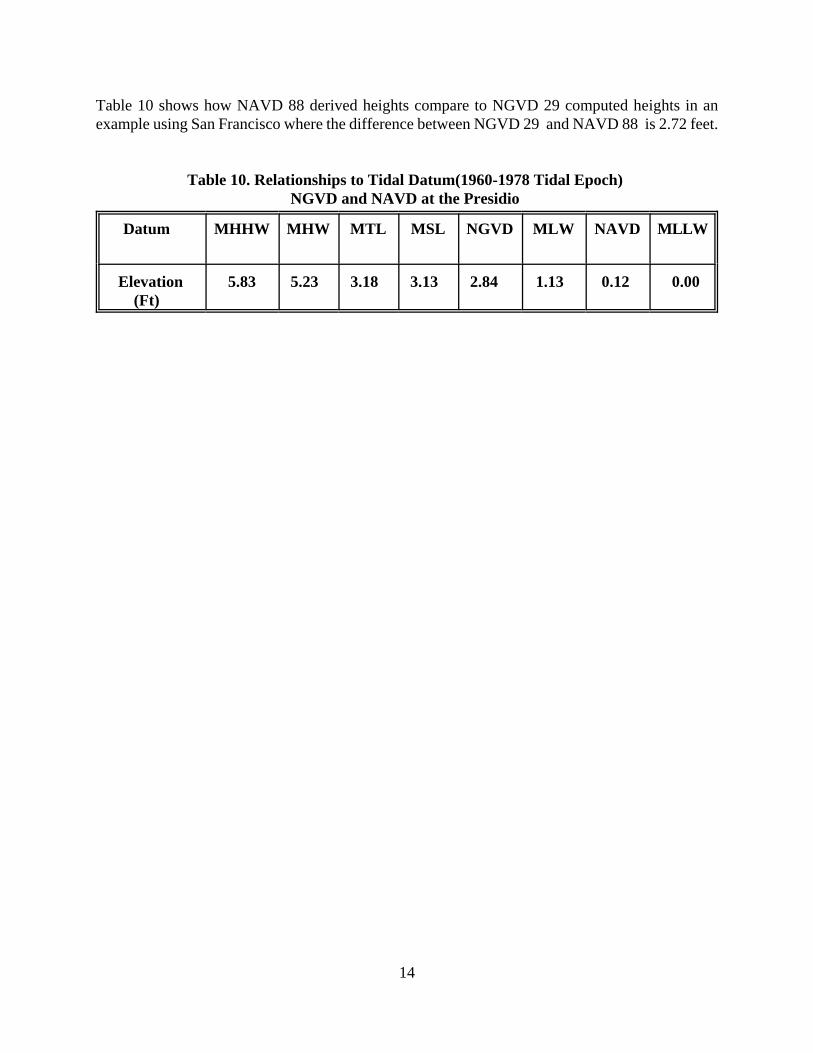
Table 10 shows how NAVD 88 derived heights compare to NGVD 29 computed heights in anexample using San Francisco where the difference between NGVD 29 and NAVD 88 is 2.72 feet.
Table 10. Relationships to Tidal Datum(1960-1978 Tidal Epoch)
NGVD and NAVD at the Presidio
Datum
MHHW MHW MTL MSL NGVD MLW NAVD MLLW
Elevation(Ft)
5.83 5.23 3.18 3.13 2.84 1.13 0.12 0.00

15
VIII. SPECIAL DATUMS
There are several local vertical datums adopted historically at San Francisco that appear onengineering drawings and other documents. For instance, the U.S. Army Corps of Engineers, state,county and local jurisdictions sometimes adopted a local datum as a reference to relate to elevationsof structures in the locality. Local datums for San Francisco are listed below with a background onhow the values were generated. Table 11 provides a tabular summary of the datum relationships. 1. San Francisco lower low water datum or Standard Lower Low Water.
This elevation is based on miscellaneous tide observations recorded before 1907 as adopted by theU.S. Army Corps of Engineers. It has a value of 5.55 feet above the 1897 tide staff zero at Presidio. 2. Standard Mean Sea Level at San Francisco Because of the continual variations in sea level recorded at the Presidio, the mean sea level elevationchanged as additional sea level measurements were incorporated into the accepted value of meansea level. It was cumbersome for scientists and engineers to frequently update datums prior use ofcomputers, therefore it was decided to adopted a "standard mean sea level datum" at Presidio of8.52 feet referred to the 1897 tide staff zero. This datum elevation was determined from the meanof the hourly heights at observed at Presidio over the continuous period from 1898 to 1913. Thisdatum was held fixed and was not updated.
3. Several other tidal datums have been computed and used historically by other countries, but arenot used by NOS.
a. Mean High Water Spring (MHWS)b. Mean Low Water Spring (MLWS)c. Mean High Water Neap (MHWN)d. Mean Low Water Neap (MLWN)
Two ways that these tidal datums may be computed are:
a. Mean of the high or low waters around the time of spring tide or neap tide each month overa specific 19-year period. There are 4 high waters and 4 low waters used each month for boththe spring tide and the neap tide. Spring tide occurs around the time of new and full moonand neap tide occurs around the time of the first and third quadrature of the moon eachmonth. It is sometimes subjective which days and tides to select.
b. The approach that can be used to compute approximate values for these tidal datumsinvolves calculations using amplitudes of selected harmonic constituents from harmonicanalysis for the location. The following is an example using the tidal parameters at Presidiofor the 1960 -1978 tidal epoch and a 365 day harmonic analysis for 1994.

16
The harmonic analyses results provide ratios of the mean ranges of tide:
1. Sg/Mn = Spring Range of Tide/Mean Range of tide = 1.182
2. Np/Mn = Neap Range of Tide/Mean Range of tide = 0.792
From the accepted datums for the Presidio:
3. Mn = 4.10 ft. and MTL = 8.95ft. (1960-78 tidal epoch)
Thus:
4. Sg = 4.10 x 1.182 = 4.84 ft.
5. Np= 4.10 x 0.792 = 3.25 ft.
6. MHWS = MTL+1/2 Sg = 11.37 ft.
7. MHWN= MTL+1/2 Np = 10.58 ft.
8. MLWS = MTL-1/2/ Sg = 7.32 ft.
9. MLWN = MTL-1/2 Np = 6.53 ft.
Table 11. Presidio Tidal Datums (1960-1978 Tidal Epoch) Related to Special Datums
Tidal Datum Elevation (Ft) Above 1897 Tide Staff Zero
MHHW 11.60
MHWS 11.37
MHW 11.00
MHWN 10.58
MTL 8.95
MSL 8.90
STD MSL 8.52
MLWN 7.32
MLW 6.90
MLWS 6.53
MLLW 5.77
STD LLW 5.55

17
IX. VARIATIONS IN MEAN SEA LEVEL AT THE GOLDEN GATE
The previous sections of this report describe how the tidal observations at the Golden Gate havebeen referenced to a common datum, the 1897 tide staff zero at the Presidio, resulting in a 146-yearcontinuous record of MSL as well as other tidal datums and tidal parameters. MSL is frequentlythought of as an equipotential surface, however it is known that MSL at any given location willdeviate from that surface due to the effects of wind, barometric pressure, circulation patterns, andriver flow. For tidal work, MSL is computed by averaging all hourly water level over specific timeperiods. NOS routinely computes monthly MSL, annual MSL, and the accepted tidal datum ofMSL. The accepted datum of MSL is computed using 19-years of data over the accepted NationalTidal Datum Epoch period. The long sea level series at the Golden Gate may provide importantclues to climate and global change investigations. Sea level records are the longest and highestquality records of any oceanographic parameter and the primary evidence suggesting apparent risein sea level comes from records of tide gauges such as San Francisco. In addition to reflectingchanges in sea level, measurements of water level at a tide gauge may reflect changes due to the landmovement in the region where the tide gauge is located. The following sections present analysesof the variations in mean sea level for the Golden Gate over various time scales. Previousexamination of water level variations along the California coast was carried out by Smith and Leffler(1980).
A. Seasonal Variations in Sea LevelThe seasonal variations in sea level over the months of the year differ from year to year due tometeorological and oceanographic influences. Generally sea level is lowest in the spring monthsand highest in the winter months at the Golden Gate. Seasonal MSL variations are shown in Figure4 for the four different years separated by 40 years between 1860 and 1980 at the Golden Gate.
Figure 4. Seasonal Variations in Sea Level for Select Years in the Golden Gate Tidal Series
7
7.5
8
8.5
9
9.5
10
Jan Feb Mar Apr May Jun Jul Aug Sept Oct Nov Dec
1980
1940
1900
1860
MonthElev
atio
ns in
Fee
t Abo
ve S
tatio
n Da
tum
. Figure 4. Seasonal Variations in Sea Level for Select Years in the Golden Gate tidal Series.
18
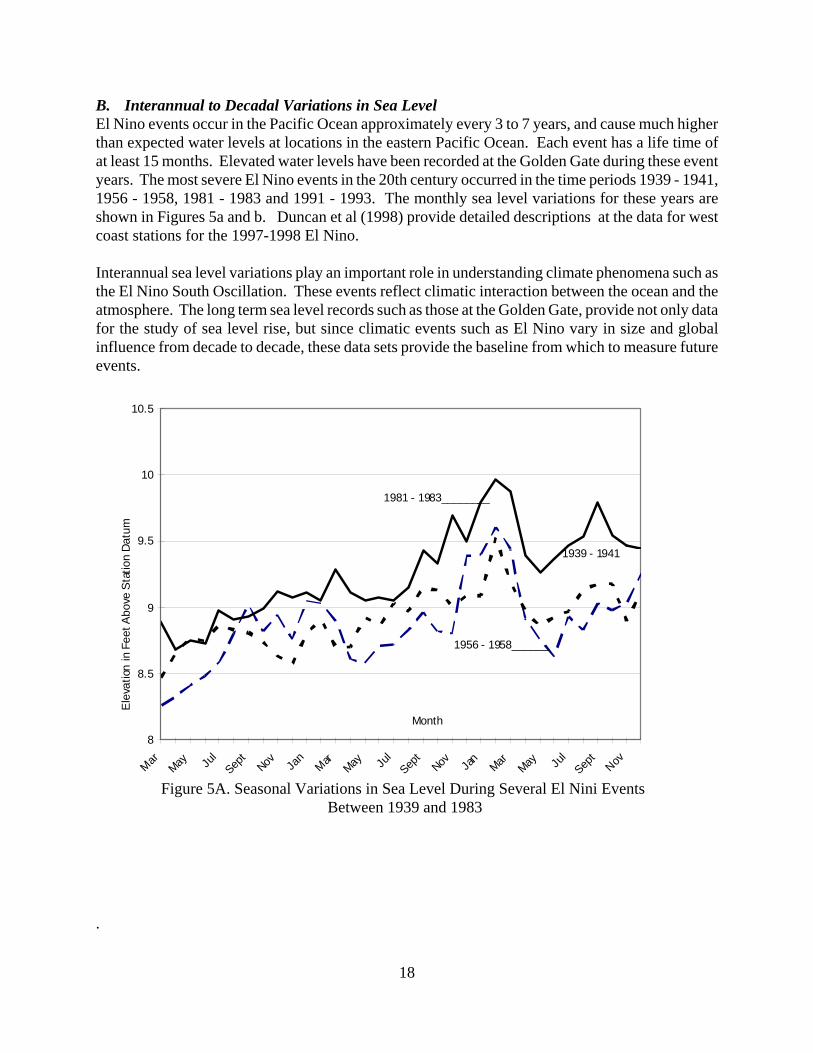
Figure 5A. Seasonal Variations in Sea Level During Several El Nino Events Between 1939 and 1983
8
8.5
9
9.5
10
10.5
MarMay Ju
lSep
tNov Ja
nMar
May Jul
Sept
Nov Jan
Mar May Jul
Sept
Nov
1981 - 1983________
1939 - 1941
Ele
vatio
n in
Fee
t Abo
ve S
tatio
n Da
tum
Month
1956 - 1958______
Figure 5A. Seasonal Variations in Sea Level During Several El Nini Events Between 1939 and 1983
B. Interannual to Decadal Variations in Sea LevelEl Nino events occur in the Pacific Ocean approximately every 3 to 7 years, and cause much higherthan expected water levels at locations in the eastern Pacific Ocean. Each event has a life time ofat least 15 months. Elevated water levels have been recorded at the Golden Gate during these eventyears. The most severe El Nino events in the 20th century occurred in the time periods 1939 - 1941,1956 - 1958, 1981 - 1983 and 1991 - 1993. The monthly sea level variations for these years areshown in Figures 5a and b. Duncan et al (1998) provide detailed descriptions at the data for westcoast stations for the 1997-1998 El Nino.
Interannual sea level variations play an important role in understanding climate phenomena such asthe El Nino South Oscillation. These events reflect climatic interaction between the ocean and theatmosphere. The long term sea level records such as those at the Golden Gate, provide not only datafor the study of sea level rise, but since climatic events such as El Nino vary in size and globalinfluence from decade to decade, these data sets provide the baseline from which to measure futureevents.
.
19
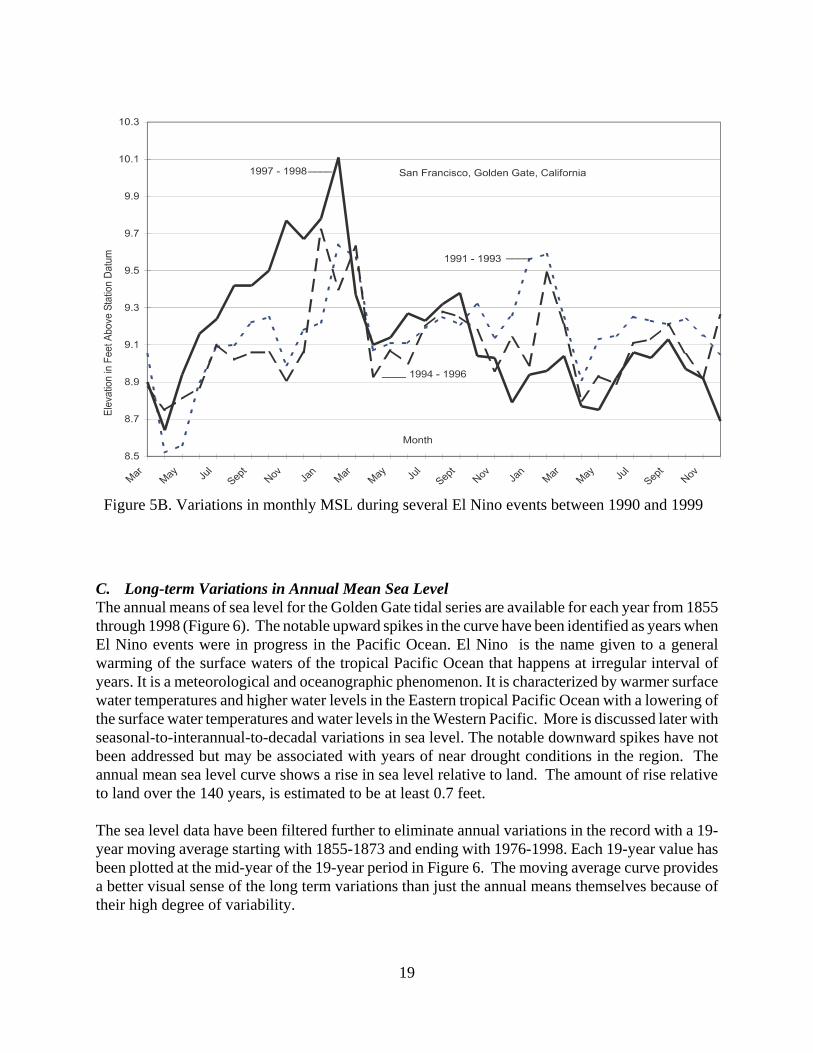
Figure 5B. Variations in monthly MSL during several El Nino events between 1990 and 1999
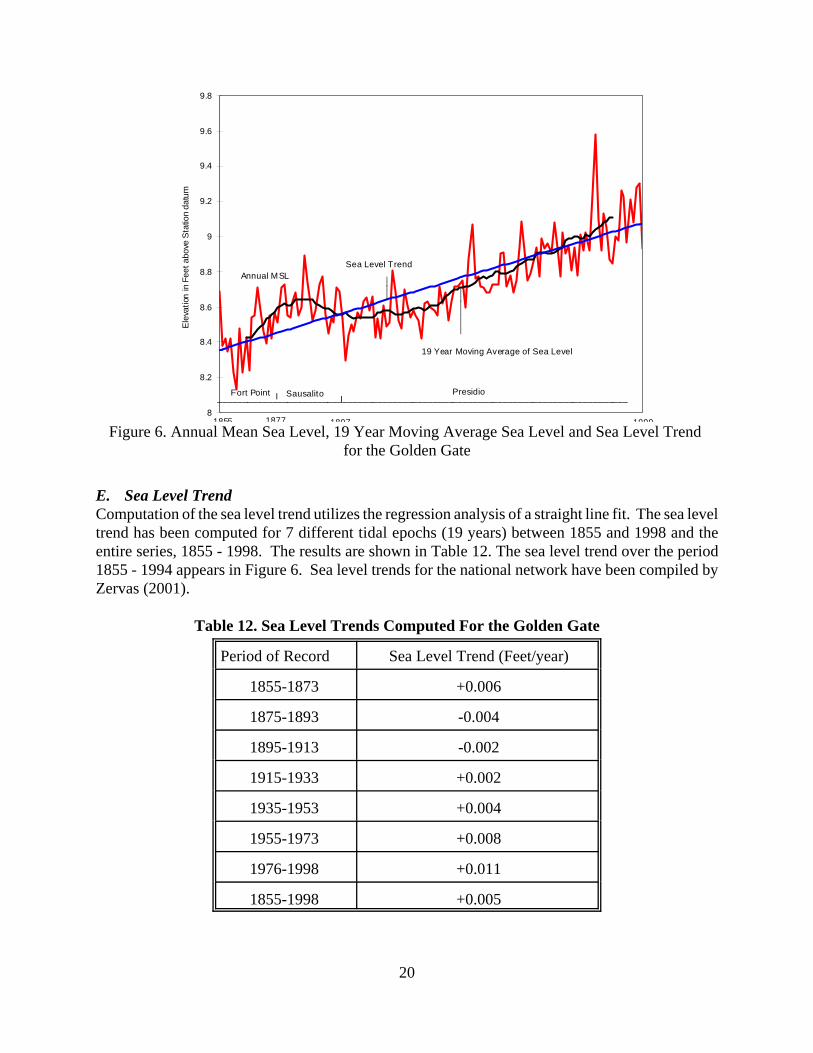
C. Long-term Variations in Annual Mean Sea LevelThe annual means of sea level for the Golden Gate tidal series are available for each year from 1855through 1998 (Figure 6). The notable upward spikes in the curve have been identified as years whenEl Nino events were in progress in the Pacific Ocean. El Nino is the name given to a generalwarming of the surface waters of the tropical Pacific Ocean that happens at irregular interval ofyears. It is a meteorological and oceanographic phenomenon. It is characterized by warmer surfacewater temperatures and higher water levels in the Eastern tropical Pacific Ocean with a lowering ofthe surface water temperatures and water levels in the Western Pacific. More is discussed later withseasonal-to-interannual-to-decadal variations in sea level. The notable downward spikes have notbeen addressed but may be associated with years of near drought conditions in the region. Theannual mean sea level curve shows a rise in sea level relative to land. The amount of rise relativeto land over the 140 years, is estimated to be at least 0.7 feet.
The sea level data have been filtered further to eliminate annual variations in the record with a 19-year moving average starting with 1855-1873 and ending with 1976-1998. Each 19-year value hasbeen plotted at the mid-year of the 19-year period in Figure 6. The moving average curve providesa better visual sense of the long term variations than just the annual means themselves because oftheir high degree of variability.
20
Figure 6. Annual Mean Sea Level, 19 Year Moving Avererge Sea Level and Sea Level Trend for the Golden Gate
8
8.2
8.4
8.6
8.8
9
9.2
9.4
9.6
9.8
Ele
vatio
n in
Fee
t abo
ve S
tatio
n da
tum
Annual MSLSea Level Trend
19 Year Moving Average of Sea Level
____
_
____
____
__
1855 1999
__________________________________________________________________________________PresidioSausalito
1877 1897
Fort Point l l
Figure 6. Annual Mean Sea Level, 19 Year Moving Average Sea Level and Sea Level Trend for the Golden Gate
E. Sea Level TrendComputation of the sea level trend utilizes the regression analysis of a straight line fit. The sea leveltrend has been computed for 7 different tidal epochs (19 years) between 1855 and 1998 and theentire series, 1855 - 1998. The results are shown in Table 12. The sea level trend over the period1855 - 1994 appears in Figure 6. Sea level trends for the national network have been compiled byZervas (2001).
Table 12. Sea Level Trends Computed For the Golden Gate
Period of Record Sea Level Trend (Feet/year)
1855-1873 +0.006
1875-1893 -0.004
1895-1913 -0.002
1915-1933 +0.002
1935-1953 +0.004
1955-1973 +0.008
1976-1998 +0.011
1855-1998 +0.005

21
The rates of relative sea level rise is not uniform as the data clearly do not follow a straight line fit.There is, in fact, a downward trend between 1875 and 1913 at the Golden Gate which the annual sealevel curve (Figure 6) indicates. This long period variation in the historical record also appears inother comparable long term sea level records around the world.

22

23
Figure 7. Observed Annual Highest Water Level at Golden Gate Between 1855 and 1999
X. EXTREME HIGH AND LOW WATER LEVELS AT THE GOLDEN GATE
Tabulations and summaries of observed highest water levels values at the Golden Gate are importantproducts for NOAA, USGS, USACE, FEMA, EPA and state and local agencies because of theconcern for impacts of coastal flooding the Bay area. Extreme low water levels have not receivedas much attention as the highest water levels in the Bay area, but these data are important as theyrelate to drought periods and salt water intrusion into the fresh water areas of the San Francisco BayEstuary.
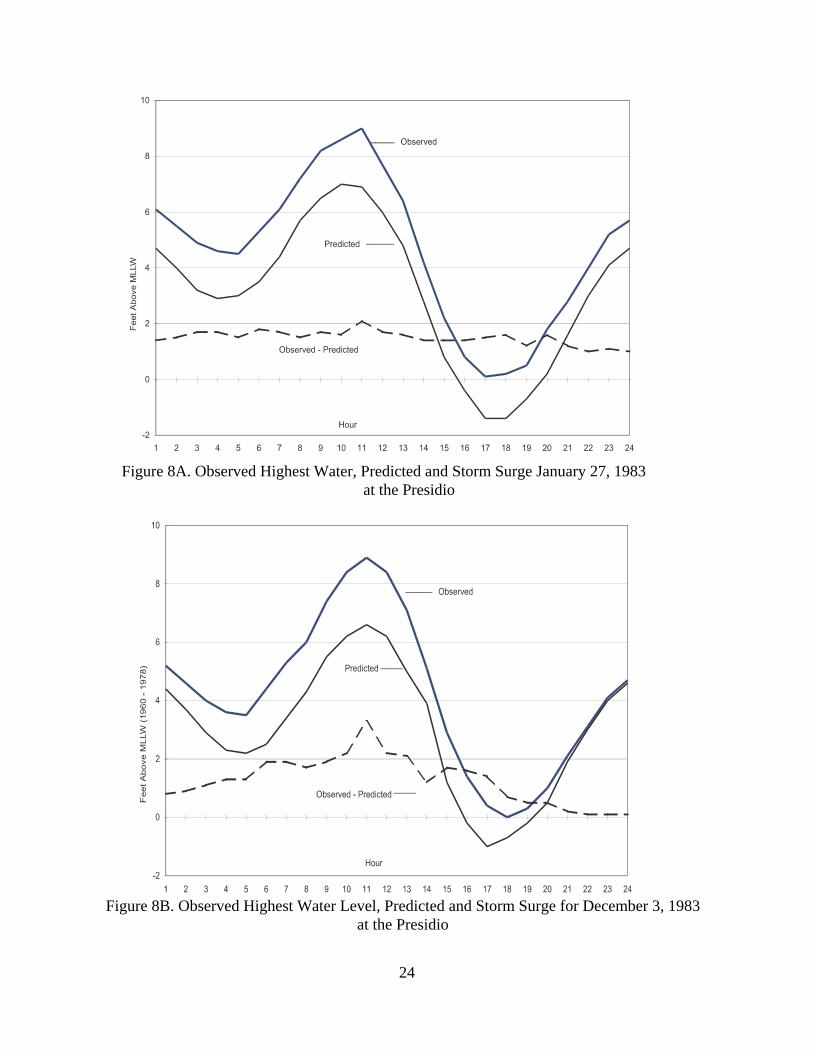
The California Department of Water Resources and U.S. Bureau of Reclamation(CADWR, 1970)summarizes the seasonal weather patterns in the bay region that partially drive the variations of thewater levels. It is generally dry in summer due to the migrating high pressure systems that deflectstorm patterns to the north. In the winter, the high pressures decrease in intensity and movesouthward and the intrusion of moisture-laden air is no longer blocked. The winter will frequentlyarrive as a series of storms that move in from the southeast and provide gale winds, heavy rains andlarge changes in atmospheric pressure. A. Observed Highest Water Levels Extreme high water levels result from the combined influence of meteorological and astronomicalphenomena. Meteorological phenomena include local barometric pressure and winds, as well aslarge scale disturbances such as El Nino episodes affecting the San Francisco Bay region. Figure 7shows the observed annual highest observed water levels between 1855 and 1999. The highestobserved water level at the Golden Gate occurred on January 27, 1983 and December 3, 1983(Figures 8A and 8B). The January 27, 1983 storm was wide spread over the West Coast while theDecember 3, 1983 storm was highly localized in the San Francisco Bay area.
24
Figure 8A. Observed Highest Water, Predicted and Storm Surge January 27, 1983 at the Presidio
Figure 8B. Observed Highest Water Level, Predicted and Storm Surge for December 3, 1983at the Presidio

25
Figure 9. Observed Annual Lowest Water Levels at the Golden GateBetween 1860 and 1999
The annual highest water levels for the Golden Gate have elevations between 6.7 and 8.9 feet aboveMLLW (1960 -1978). The storm surge associated with particular high water levels is of interest.For this report storm surge is defined as the difference between the observed and predicted waterlevels, both referenced to MLLW. For example, the storm surge for the January 27, 1983 stormevent (observed - predicted) is just over 2.0 feet, and for the December 3, 1983 it is over 3.0 feet.The highest water level does necessarily imply the greatest storm surge value because the highestwater level is the combination of storm surge with the astronomical tide.
B. Observed Lowest Water Levels Extreme low water levels in the San Francisco Bay region are caused primarily by the combinationof extreme tides to due particular earth-moon-sun alignments and the effects of large scale weatherpatterns. The lowest water level of record at the Golden Gate occurred on both December 26, 1932and December 17, 1933. The time series of the hourly heights for both events are shown in Figures10A and 10B. There are small differences of tenths of a foot in the annual lowest water levels fromyear to year with the range of annual lowest water levels being between 2.7 below to 1.0 feet belowMLLW (1960-78). A value of 5.77 feet can be subtracted from the values of the annual lowest waterlevels shown in Figure 9 to refer the elevations to MLLW (1960 - 1978).

26
Figure 10A. Observed Lowest Water Level, Predicted and Storm Surge for December 17, 1933 at the Presidio
Figure 10B. Observed Lowest Water Level, Predicted and Storm Surge for December 26,1932 at the Presidio

27
C. One Hundred Year Flood Level The observed annual highest water levels of record between 1854 and 1994 at the Golden Gate havebeen tabulated and summarized . These observed values are not adjusted for the sea level changeover the 140 year period and a separate analysis must be performed in order to use the informationfor some applications. Table 13 is a summarization of 100 year increments with the highestobserved water level of record in that period identified.
Table 13. Highest Observed Water level in 100-Year Periods for the Golden Gate
100 YearPeriod
Date of HighestWater Level in 100
Year-Period
Highest Observed
(Feet)
1855-1954 December 20, 1940 13.8
1865-1964 December 20, 1940 13.8
1875-1974 January 16, 1973January 18, 1973
14.114.1
1885-1984 January 27, 1983 December 3, 1983
14.614.6
1895-1994 January 27, 1983December 3, 1983
14.6 14.6
D. The Great January 1862 FloodsA good example of wide spread extreme flooding in the San Francisco Bay Estuary occurred inJanuary 1862. Rains were heavy between November 1861 and January 1862 in the Delta region ofEstuary such that Sacramento was under water along with most of the Central Valley. Reports fromjournals of the time state that for at least ten days "water flowed through the Golden Gate in a steadytorrent, blocking tide reversal." Such a flood today would probably cause billions of dollars indamage in the region. The Golden Gate tide records between November 1861 and January 1862have been reviewed for what influence such floods had on the water levels at that location. The rainswere heaviest during January 1862. Figure 11 shows that water levels at the Golden Gate betweenJanuary 22nd and 24th were influenced by the events. The observed low waters between January22 and 24, 1862 were higher than normal (the predicted low waters). From the January 23 eveninghigh water to the evening low water there was only a 0.3 foot change in the water level at the GoldenGate. Such occurrences are anomalous at the Golden Gate.

28
Figure 11. Observed, Predicted and Storm Surge for January 22 - 24, 1862 at Fort Point
-2
-1
0
1
2
3
4
5
6
7
Observed
Predicted
Observed - Predicted22-Jan 23-Jan 24-Jan
(Storm Surge)
Elev
atio
n in
Fee
t Abo
ve M
LLW
(185
5 - 1
873)
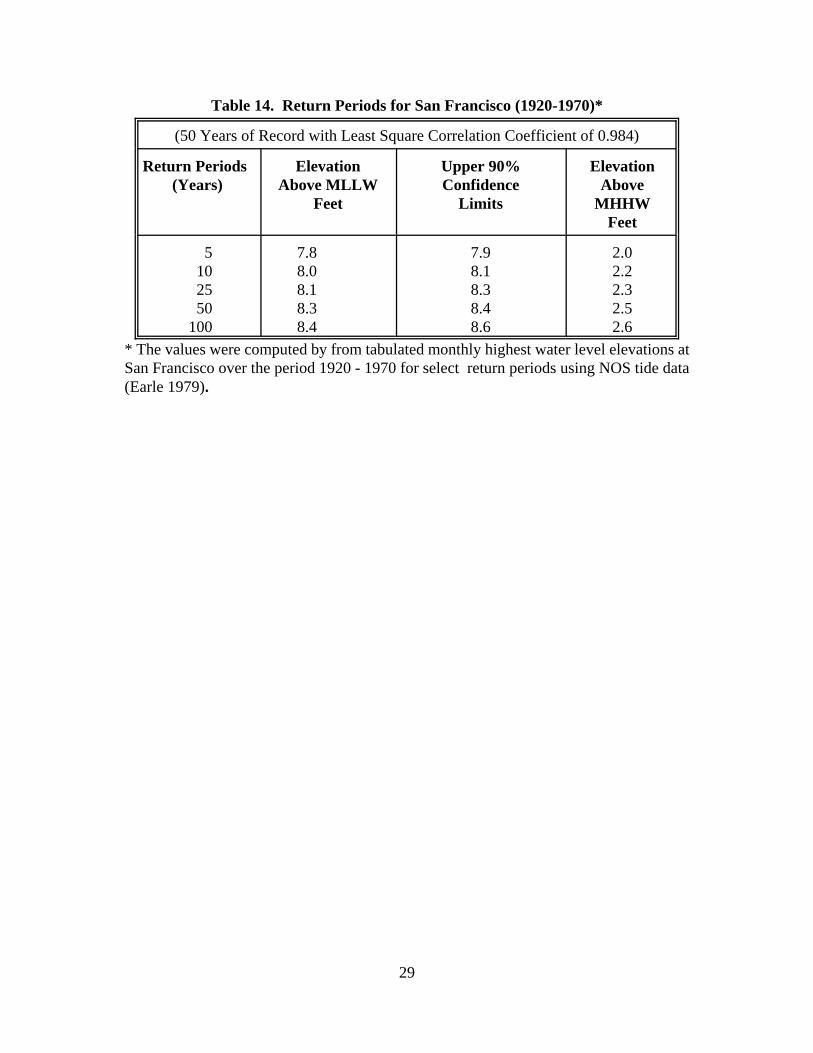
Return PeriodEarle (1979) defines return periods time intervals between the occurrence of extreme water levels.The return period, or recurrence interval, for a given elevation is the time interval betweenoccurrences of an elevation greater than or equal to the given elevation. Heights of and intervalsbetween storm surges, which add to the astronomical tide, occur in a random manner so that returnperiods are useful for extreme measured water elevations greater than normally occurringastronomical tides. The values can be obtained from a statistical analysis of extreme measuredelevations greater than normally occurring astronomical tides.
Return period results are useful for design elevations for sea walls, levees and other structures alongcoastal and waterways where extreme high water levels frequent such shores. Universities, coastalengineer firms, U.S. Corps of Engineers and the Federal Emergency Management Administration(FEMA) are among those that have a need for such information where flooding is a concern.
Table 14 provides return periods for San Francisco from a 50 year period between 1920 and 1970where there is a long history of extreme high water levels and concerns of flooding in the SanFrancisco Bay region. The 100 year estimate is lower than the maximum observed value (8.8 ft.)since the 1920– 1970 time period of the analysis.
29
Table 14. Return Periods for San Francisco (1920-1970)*
(50 Years of Record with Least Square Correlation Coefficient of 0.984)
Return Periods(Years)
ElevationAbove MLLW
Feet
Upper 90%Confidence
Limits
ElevationAbove
MHHWFeet
5 10 25 50
100
7.88.08.18.38.4
7.98.18.38.48.6
2.02.22.32.52.6
* The values were computed by from tabulated monthly highest water level elevations atSan Francisco over the period 1920 - 1970 for select return periods using NOS tide data(Earle 1979).

30
31
Figure 12A. Frequency of Inundation for High Waters at the Presidio Between 1922 and 1984
0
20
40
60
80
100
120
9 14.69.5 10 10.5 11 11.5 12 12.5 13 13.5 14
CUM
ULA
TIV
E FR
EQU
ENC
Y(%
)
Elevation in Feet Above Station Datum
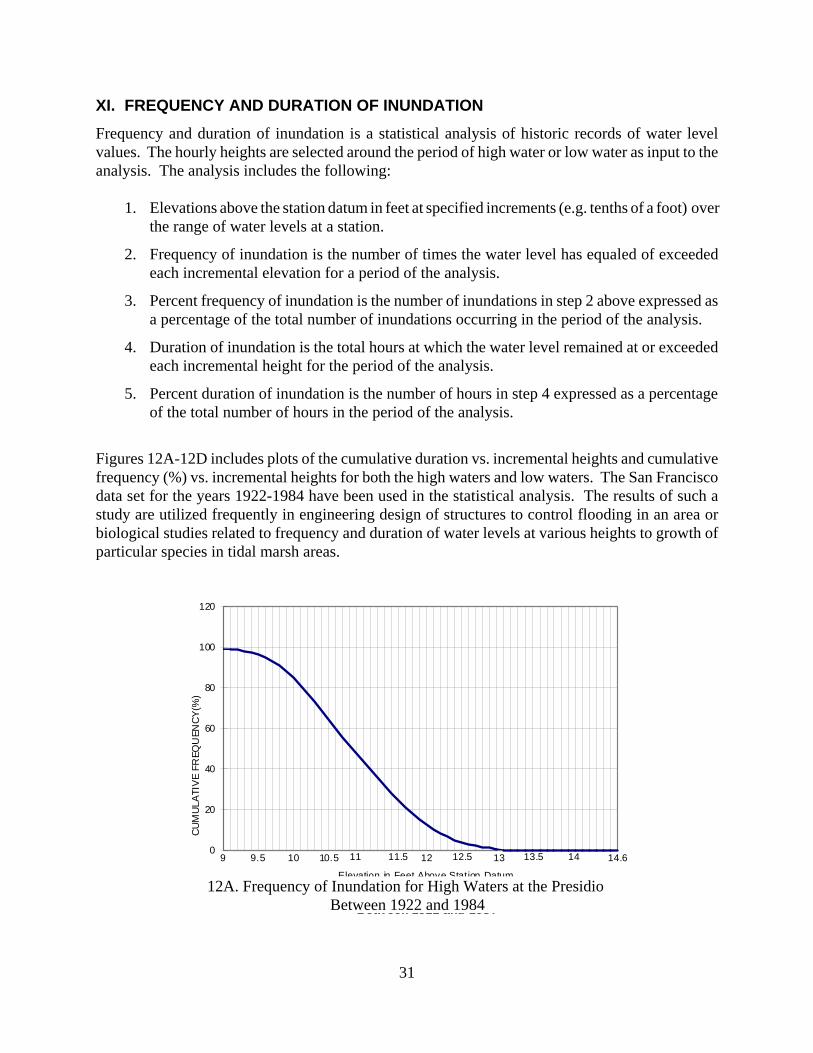
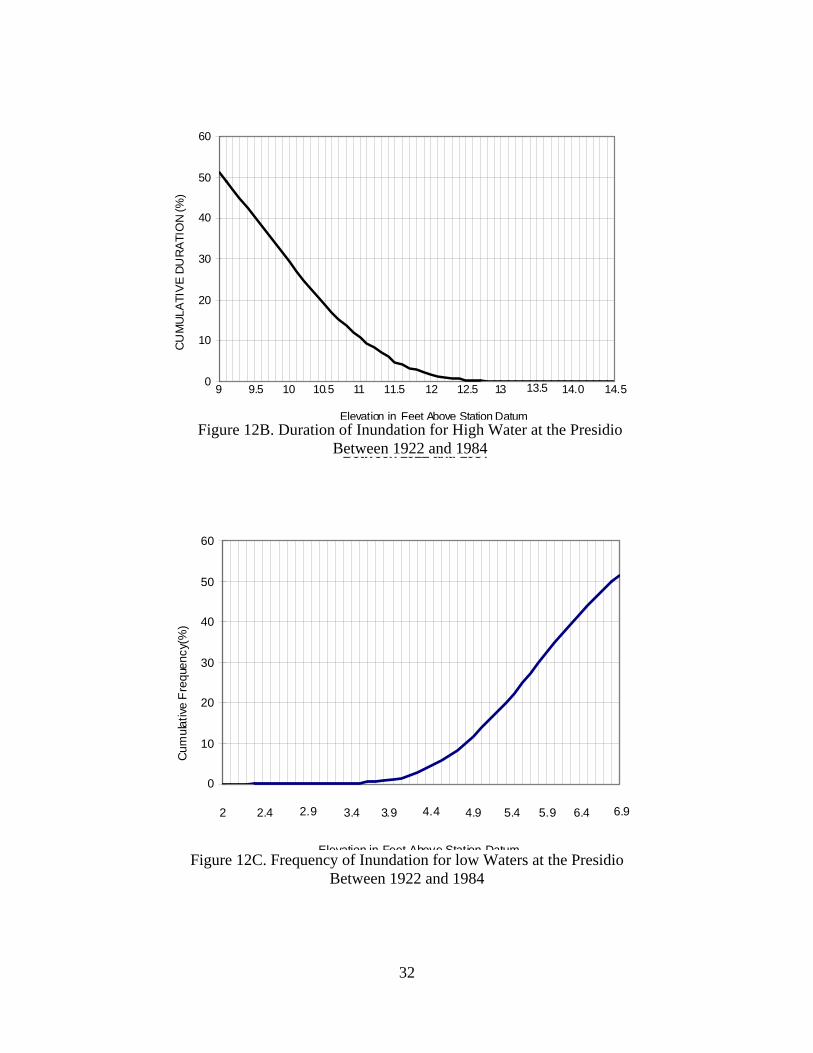
XI. FREQUENCY AND DURATION OF INUNDATION
Frequency and duration of inundation is a statistical analysis of historic records of water levelvalues. The hourly heights are selected around the period of high water or low water as input to theanalysis. The analysis includes the following:
1. Elevations above the station datum in feet at specified increments (e.g. tenths of a foot) overthe range of water levels at a station.
2. Frequency of inundation is the number of times the water level has equaled of exceededeach incremental elevation for a period of the analysis.
3. Percent frequency of inundation is the number of inundations in step 2 above expressed asa percentage of the total number of inundations occurring in the period of the analysis.
4. Duration of inundation is the total hours at which the water level remained at or exceededeach incremental height for the period of the analysis.
5. Percent duration of inundation is the number of hours in step 4 expressed as a percentageof the total number of hours in the period of the analysis.
Figures 12A-12D includes plots of the cumulative duration vs. incremental heights and cumulativefrequency (%) vs. incremental heights for both the high waters and low waters. The San Franciscodata set for the years 1922-1984 have been used in the statistical analysis. The results of such astudy are utilized frequently in engineering design of structures to control flooding in an area orbiological studies related to frequency and duration of water levels at various heights to growth ofparticular species in tidal marsh areas.
12A. Frequency of Inundation for High Waters at the Presidio Between 1922 and 1984
32
Figure 12B Duration of Inundation for High Water at the Presidio Between 1922 and 1984
0
10
20
30
40
50
60
9 14.59.5 10 10.5 11 11.5 12.5 13 13.5
CU
MU
LATI
VE
DU
RA
TIO
N (%
)
Elevation in Feet Above Station Datum
14.012
Figure 12B. Duration of Inundation for High Water at the PresidioBetween 1922 and 1984
Figure 12C Frequency of Inundation for Low Waters at the Presidio Between 1922 and 1984
0
10
20
30
40
50
60
2 2.4 2.9 3.4 3.9 4.4 4.9 5.4 5.9 6.4 6.9
Cum
ulat
ive F
requ
ency
(%)
Elevation in Feet Above Station DatumFigure 12C. Frequency of Inundation for low Waters at the Presidio
Between 1922 and 1984

33
Figure 12D. Duration of Inundation for Low Waters at the Presidio Between 1922 and 1984
0
2
4
6
8
10
12
14
16
18
Acc
umul
ativ
e Du
ratio
n (%
)
2 6.93.9 4.4 4.9 5.4 5.9 6.42.4 2.9 3.4Elevation in Feet Above Station
DatumFigure 12D. Duration of Inundation for low Waters at the Presidio
Between 1922 and 1984

34

35
Figure 13A. Frequency Distribution of Differences for High Water Heights at the Presidio
XII. COMPARISON OF OBSERVED AND PREDICTED HIGH AND LOW WATERS
NOS tide predictions are based on the pre-knowledge of the motions of the earth-moon-sun system.Differences between predicted and observed tides are typically due to the effects of weather on theobserved water levels. Table 8 of the NOS Tide Tables for the West Coast provides summarystatistics of the accuracy of tide predictions for several west coast stations. For San Francisco, forinstance, at the 90% distribution level, the times of the predicted high and low waters are within 0.3hours and 0.4 hours respectively. The heights of the predicted high and low waters are within 0.4foot and 0.6 foot respectively. Although there are variations in these observed - predicteddifferences occurring from year to year, a year of observed and predicted high waters and low watershas been chosen using the year 1981 at San Francisco to further analyze these differences. Afrequency distribution of differences between observed and predicted water level heights, referredto MLLW, have been generated from the 1981 data set and the results are presented in Figures 13Aand 13B.

36
Figure 13B. Frequency Distribution of Differences for Low Water Heights at the Presidio

37
XIII. CONCLUDING REMARKS FOR THE GOLDEN GATE TIDAL SERIES
With the connection of the three historical data sets at Fort Point, Sausalito and Presidio to one longcontinuous tidal series it has been possible to tap a wealth of information previously unavailable.Sea level variations over a long continuous data set referred to a common datum for 140 period atone location can now be studied. Tidal datums have been reduced to mean values for any numberof tidal epochs between 1855-1873 and 1976-1994. Datum recovery at Sausalito was completed,providing important assessment for one of the Golden Gate tide stations from two different tidalseries separated by 100 years. Relative sea level rise determinations and land movements are nowaccurately measured through the long series at the Golden Gate.
ACKNOWLEDGMENTS
The tide data sets in this report represent the cumulative effort of the National Ocean Service; thosewho installed and maintained the tide gauges for recording tide measurements and those whoanalyzed the data, documented the results and summarized them in an accessible manner. Specialrecognition should to go to those who have made the long tidal series and related historical tideinformation possible for the Golden Gate tidal series over the many decades since 1854. I thank themembers of the CO-OPS review committee for their patience, outstanding effort in the edits andrecommendations they have made in this detailed report to help improve the appearance of thisreport and maintain the high standards of National Ocean Service publications.

38
39
REFERENCES
Brick, William and Mathison, Alan, San Francisco Bay Tidal Stage vs. Frequency Study, U.S. ArmyCorps of Engineers, San Francisco District, San Francisco, California 1984
CADWR, 1970. Sacramento-San Joaquin River Low Tides in April-May 1970, CaliforniaDepartment of Water resources and U..S. Bureau of Reclamation Report, May 1970.
Conomos, T.S., Editor, San Francisco Bay The Urbanized Estuary, Pacific Division AmericanAssociation for the Advancement of Science, San Francisco, California 1979
Duncan,S., S.K. Gill, and K.A. Tronvig, 1998. Proceedings of the Ocean Community Conference“98, The Marine Technology Society Annual Conference, Baltimore, MD, November 1998.
Earle, Marshall D., Storm Surge Conditions for the California Coast and Continental Shelf, MarineEnvironments Corporation, Rockville, Maryland, 1979
Marmer, H.A., 1951. Tidal Datum Planes, Special Publication 135, GPO, Washington D.C. 1951
National Geodetic Survey, 1996. The New Adjustment of the North American Vertical Datum. ACollection of papers Describing the Planning and Implementation of the Adjustment of the NorthAmerican Vertical Datum of 1988, Compiled by the Spatial Reference System Division, NationalGeodetic Survey, November 1996 at www.ngs.noaa.gov.
National Ocean Service, 2000. Tide and Current Glossary, NOAA, National Ocean Service, SilverSpring, MD, January 2000.
Smith, R. A., 1980. Golden Gate Tidal Measurements 1854-1978, Journal of the Waterways PortCoast and Ocean Division, American Society of Civil Engineers, Vol 106 NO WW3, August 1980
Smith, R. A. and R.J. Leffler 1980. Water Level Variations for the California Coast, Journal of theWaterways Port Coastal and Ocean Division, American Society of Civil Engineers, Vol 106 NOWW# August 1980.
U.S. Coast and Geodetic Survey, Superintendent Reports of the Survey to Congress 1844-1927Washington, D.C.
Zervas, C. 2001. Sea Level Variations of the United States 1854-1999, NOAA Technical ReportNOS CO-OPS 36, NOAA/NOAS/Center for Operational Oceanographic Products and Services,Silver Spring, MD, July 20.

40

A-1
APPENDIX A
HISTORY OF TIDE GAUGES

A-2
Many types of tide gauges were proposed and constructed in the 19th century. The first self-registering tide gauge was used in 1831 by Henry Palmer of England. The earliest tide gauges in useare described below: A. Parts of a Tide GaugeThe essential parts of a tide gauge are composed of a stilling well to dampen wave action; a timepiece and some way of recording the height, either in a continuous manner or at discrete intervalsof time.
B. Workings of a Tide GaugeThe motion of the float as it rises and falls with the tide is communicated along the recording portionof the gauge by means of a flexible cord which passes over a grooved wheel (float wheel). Themotion is transferred, but on a reduced scale, through some mechanism depending upon theparticular kind of gauge, to a pencil which traces a curve upon a moving sheet of paper. The paperis driven or carried along by means of a cylinder connected with a well-regulated clock. The pencilis free to move in a direction perpendicular to the line of the motion of the paper.
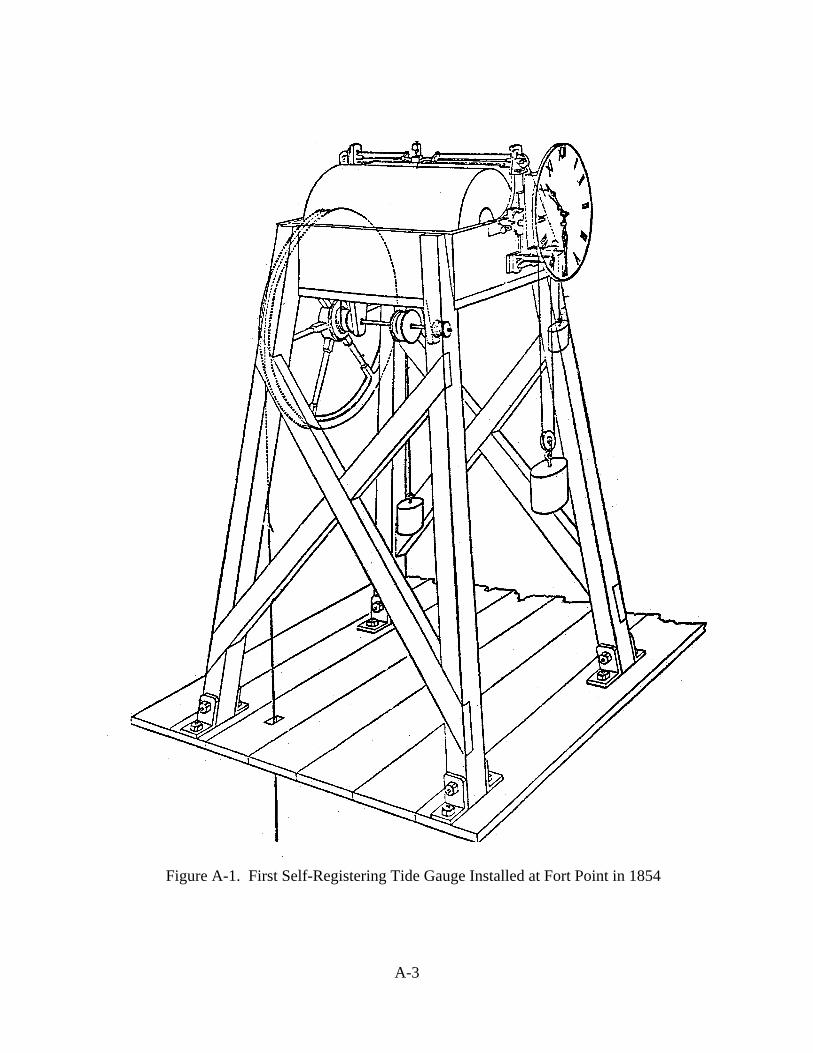
C. First Coast Survey Tide Gauge Joseph Saxton, of the Office of United States Weights and Measures, constructed the first self-registering tide gauge in the United States used by the Coast Survey. There were two principalmovements provided for in Saxton's gauge. The first being a uniform movement, proportional totime, of the record sheet under the pencil, and the second being a transverse movement of the pencil,strictly proportional to its rise and fall of the float. To give a uniform motion to the sheet of paper,a clock-work was used. The moving parts of the old-fashioned eight-day clock, with the strikingparts taken out, were employed for this purpose. The clock-work gives a uniform motion of rotationto the cylindrical roller that revolves 360 degrees once in twelve hours. The second principalmovement in the gauge originates in the vertical movement of the float, and extends to the recordingpencil. The float was an air-tight cylinder or canister-shaped copper box, which was first thoroughlypainted for protection. A small ballasting weight was attached to the center of its bottom. On its topwas an eye, in which was fastened the end of a wire leading up through the float box. This box wasa water-tight wooden case, large enough to permit a free play of the float, and terminating at thebottom in a funnel, with an orifice at its apex, through which the water could pass as rapidly asnecessary, but not so as freely as to make the float oscillate sensibly with the surface waves. FigureA-1 is a diagram of the type of tide gauge installed at Fort Point in 1854. Additional workings of thetide gauge may be obtained from the 1853 and 1876 Superintendent Report of the Coast Survey.
D. Other Tide Gauges Used by NOSAfter the tide staff or tide pole, that required an observer to physically be there and record changesin the water level, and the first self-registering tide gauge there have been many innovations in tidegauge technology. These include:
A-3
Figure A-1. First Self-Registering Tide Gauge Installed at Fort Point in 1854
A-4
1. Standard Tide GaugeThe standard automatic tide gauge first appeared in the marine environment in the 1890s with manyimprovements over the years until it was replaced with a completely new gauge, the analod digitalrecorder, in the 1960s. By the 1970s, all standard tide gauges operations ceased to be used by NOS.The product of its recordings was a marigram trace of the tide curve. The workings of the standardtide gauge may be found in NOS Publication 30-1 Manual of Tide Observations.
2. Gas-Purging Pressure Tide Gauge (Bubbler Gauge)This tide gauge has made it possible to obtain satisfactory records in areas where the installation ofthe structure-supported tide gauge was impractical. The compact size and relative ease ofinstallation and operation has lead to its use for reconnaissance surveys for tidal datum purposes.This tide gauge was pioneered at Woods Hole Oceanographic Institution by Alfred Redfield. It wasfirst used by NOS in the 1960s for use at subordinate stations which is a tide station from which arelatively short series of observations is reduced by comparison with simultaneous observationsfrom a tide station with a relatively long series of observations. The bubbler has been used as a back-up tide gauge at control stations starting in the 1970s for use in filling breaks in ADR data records.The workings of the gauge may be found in the NOS publication, "User's Guide for Gas-PurgedPressure Recording (Bubbler) Tide Gauge."
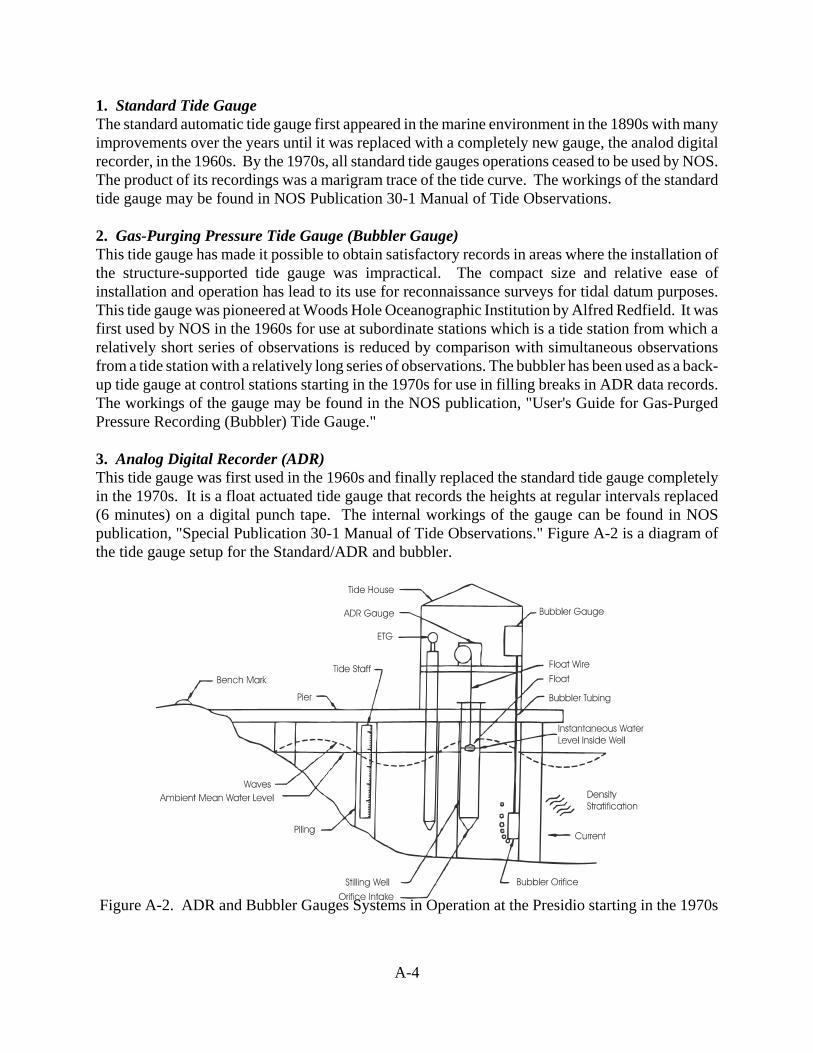
3. Analog Digital Recorder (ADR)This tide gauge was first used in the 1960s and finally replaced the standard tide gauge completelyin the 1970s. It is a float actuated tide gauge that records the heights at regular intervals replaced(6 minutes) on a digital punch tape. The internal workings of the gauge can be found in NOSpublication, "Special Publication 30-1 Manual of Tide Observations." Figure A-2 is a diagram ofthe tide gauge setup for the Standard/ADR and bubbler.
Figure A-2. ADR and Bubbler Gauges Systems in Operation at the Presidio starting in the 1970s

A-5
4. Next Generation Water Level Measurement System (NGWLMS)The Next Generation Water Level Measurement System began to be implemented into operationsin the National Water level Observation Network (NWLON) in the late 1980's and ending withcomplete implementation at Great Lakes stations in 2000. At most locations, the NGWLMS wasoperated simultaneously present ADR tide gauge system during a transition period, after which theADR was removed.
The NGWLMS uses state-of-the-art technology that includes self-calibrating downward-lookingacoustic water level sensors, back-up pressure sensors, micro-processor based data acquisition andstorage, telemetry to the GOES satellite with a telephone as back-up and the capability of automatedcollection of up to 11 ancillary measurements (meteorological data, for instance).
The NGWLMS acoustic sensor does not have the physical contact of a device with the watersurface, such as the float with the ADR, and the NGWLMS does require a full mechanical filterknown as the stilling well. A large source of systematic error and uncertainty in the older floatoperated systems that used stilling wells is being eliminated or reduced using the NGWLMS. Thestilling well is replaced by a more open protective well, much less subject to nonlinear filteringeffects and biofouling, less conducive to density gradient buildups, and more indicative of theoutside environment. The rapid sampling (1 - second pulses) possible with the acoustic sensor of theNGWLMS allows the well to be open to the dynamics of the ocean. High frequency waves areremoved by digital filtering (by the microprocessor that is part of the water level measurementsystem), rather than analog filtering through an orifice in the ADR system.
A significant improvement with the NGWLMS is that leveling from the bench marks can be donedirectly to the sensor itself (the head of the transducer at the end of the sound tube). The sensor canalso be replaced and re-calibrated. The elimination of the tide observer with the replacement of theADR with the NGWLMS does away with the systematic errors of observations read from a staff andadjustments to the ADR gauge itself. The NGWLMS does not require simultaneous observationsfrom a tide staff and tide gauge to compute the average monthly difference between the tide staffand marigram zero in the process of referring the water level heights to the station datum. Thepossibility of timer drift is also eliminated with the replacement of the ADR with the NGWLMS.

A-6
Figure A-3. NGWLMS Installed at the Presidio in the Late 1980s at the Presidio

B-1
APPENDIX B
LEVELING TECHNIQUES

B-2
A. Methods of LevelingThe method of leveling adopted was known as "leveling from the middle" or more properly defined,that of equidistant backsights and foresights. The manner of taking the sights was to bring the targetof the rod nearly into the horizon of the telescope, and to measure with the micrometer the verticalangle between the horizon and the target by repeated pointings, so as to eliminate errors of level andcollimation. The target reading on the rod was then reduced to the horizon by computation. Withthis method, two systems had been in use:
1. Simultaneous Double Leveling in One Direction
By this method the difference in height between two bench marks was determined byobserving from the same station and with the same instrument, backsights on two differentrods, set up at unequal distances from the instrument, and foresights on the same two rods,carried forward and placed at the same relative distance previously occupied.
2. Leveling in Opposite Directions
This procedure consisted of running a line between two bench marks in one direction, andreleveling it according to the same method in the opposite direction.
3. Comparison of the Two Systems
a. System 1 offers the advantage of a considerable savings in time over system 2, andaffords a perfect check against errors of observations from station to station, since thedifference in height between two rods, obtained in a foresight should be equal to thedifference in the following backsights.
b. System 2, on the other hand, offered the advantage of making the determination inopposite directions under different conditions, and exhibiting with greater certainty theexistence of any cumulative error.
B. Water CrossingWhen a line of levels was to be carried across a wide body of water, and, where, from the lownessof the banks, the line of sight would pass very near the water, the instrument was elevated so as tobe above the vitiating influence of irregular refraction. If possible, two instruments would bemounted on opposite sides of the waterway, and simultaneous observations would be made ontargets mounted near the respective instruments.
The elevation of each target above a bench mark on its side of the waterway must be carefullydetermined and each target and instrument should be as nearby as possible in the horizon of theother.The observations were made in the usual manner, if the distance across the waterway is nototherwise known with sufficient accuracy. The known value of micrometer would serve todetermine it sufficiently for the purpose of reduction, by measuring across the waterway the lengthof rod or other known length in terms of the micrometer.
If only one instrument was available, observations made in one direction would be repeated as soonas possible in the other direction and several times alternately in opposite directions. Withobservations in opposite directions, effects of refraction were minimized. Present leveling

B-3
procedures are available in many NOS manuals such as the Manual of Tide Observations SpecialPublication 30-1 and NOAA publication "User's Guide for the Installation of Bench Marks andLeveling Requirements for Water Level Stations."


C-1
Appendix C
Comparative Readings and Adjustments to Tidal Heights at Fort Point Between 1855 and 1859

C-2
A. Comparative ReadingsComparative readings (Table A) were made by tide observers hired to take readings of the waterlevel from the tide gauge and tide staff simultaneously. Both readings were written on the marigram.The monthly means of the differences between the staff and gauge reading were computed andapplied to the tidal heights tabulated from the marigram to refer the tidal heights to tide staff zero.Readings in the 1850s at Fort Point were made 3 times a day and daily averages computed.Attempts were made to hold comparative reading results relatively consistent over long periods oftime.
Table A. Comparative Readings Between 1854 and 1862 at Fort Point
Period of Time Average Staff - Marigram Difference*(ft)
1854 June 30 - 1856 June 2 + 1.50
1856 June 2 - 1857 June 16 + 1.80
1857 June 17 - October 20 + 3.00
1857 October 21 - 1858 February16
+ 3.55
1858 April 5 - November 30* + 2.75
1858 December 1 - 1859 January19
+ 2.10
1859 January 20 - July 31 + 2.00
1859 August 1 - November 24 + 0.90
1859 December 1 - 1860 June 18 + 1.80
1860 June 18 - 20 + 0.30
1860 June 21 - 1861 December 9 1.85
1861 December 10 - 31 + 2.05
1862 January 1 - June 12 + 2.00
1862 June 13 - 1868 December 31 + 2.10
*The change in the staff minus marigram differences between 1854 and 1959 are attributed to:
1. The wharf and staff settling at Fort Point.
2. New staff on April 2, 1858 with 2.4 feet movement of staff between June 30, 1854 andApril 2, 1858 and 0.78 foot settlement between April 2, 1858 and June 21, 1859.
C-3
Figure C-1. Monthly Means of MLLW Elevations at Fort Point corrected for the Wharf sinkingBetween 1855 and 1859
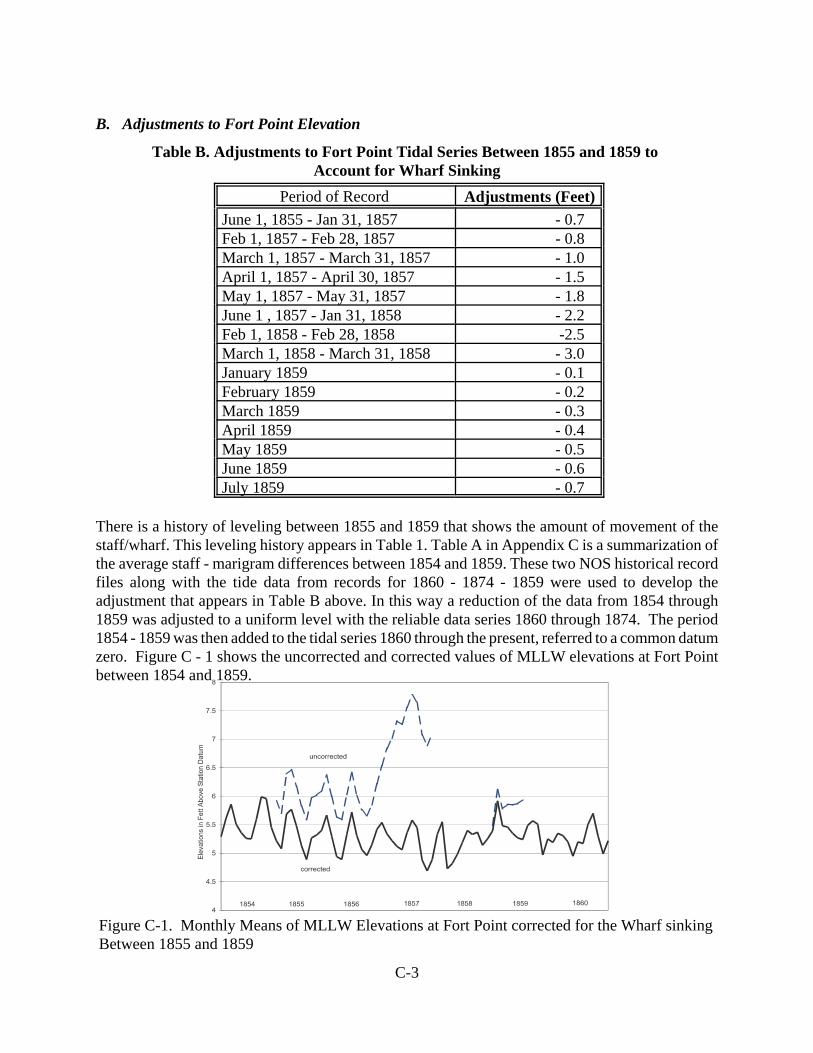
B. Adjustments to Fort Point Elevation
Table B. Adjustments to Fort Point Tidal Series Between 1855 and 1859 to Account for Wharf Sinking
Period of Record Adjustments (Feet)June 1, 1855 - Jan 31, 1857 - 0.7Feb 1, 1857 - Feb 28, 1857 - 0.8March 1, 1857 - March 31, 1857 - 1.0April 1, 1857 - April 30, 1857 - 1.5 May 1, 1857 - May 31, 1857 - 1.8June 1 , 1857 - Jan 31, 1858 - 2.2Feb 1, 1858 - Feb 28, 1858 -2.5March 1, 1858 - March 31, 1858 - 3.0January 1859 - 0.1February 1859 - 0.2March 1859 - 0.3April 1859 - 0.4May 1859 - 0.5June 1859 - 0.6July 1859 - 0.7
There is a history of leveling between 1855 and 1859 that shows the amount of movement of thestaff/wharf. This leveling history appears in Table 1. Table A in Appendix C is a summarization ofthe average staff - marigram differences between 1854 and 1859. These two NOS historical recordfiles along with the tide data from records for 1860 - 1874 - 1859 were used to develop theadjustment that appears in Table B above. In this way a reduction of the data from 1854 through1859 was adjusted to a uniform level with the reliable data series 1860 through 1874. The period1854 - 1859 was then added to the tidal series 1860 through the present, referred to a common datumzero. Figure C - 1 shows the uncorrected and corrected values of MLLW elevations at Fort Pointbetween 1854 and 1859.

C-4
It is believed that the pier settled because it was resting on a peat foundation. The shore in the regionwas comprised of marsh and peat bogs which were common in the area. According to NOShistorical files of the description of the locality, “The peat structure near the Fort Point pier wascovered in 1859 by gravel and pebbles to give the appearance of greater stability.” The question thatcomes to mind also is how piers were constructed in the 1850s. Letters from the National Archivesstate that the Fort Point wharf was “constructed on piers of a crib filled with stone.” On one of thesepiers the self-registering gauge was placed. In Webster’s unabridged dictionary a crib is describedas the following: “ In the engineering sense, a crib is a frame of logs or beams to be filled withstones, rubble or the like and sunk as a foundation or retaining wall in the building of docks, piers,dams, etc.” This is consistent with literature describing the construction of docks and piers in thetext, “The Construction of Harbors’ by Thomas Stevenson and published by the U.S. Coast andGeodetic Survey in 1886.
Marine organisms contributed to the decay of the timbers forming the cribs. This resulted in theshifting of the timbers as they weakened from the decay. In time, the stones within the confines ofthe timbers also started to shift. The Fort Point wharf being in a high wave and current energy areaalso contributed in the wharf sinking.
D-1
Appendix D
Water Leveling Crossings of the Golden Gate
.
D-2
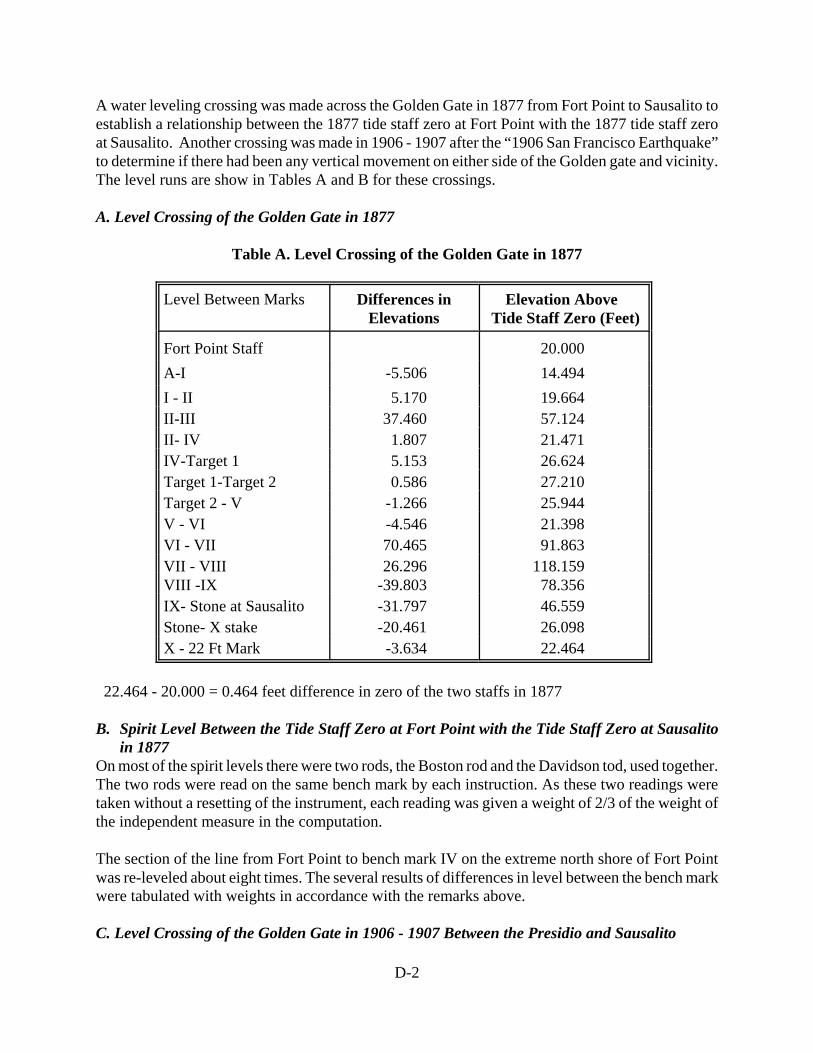
A water leveling crossing was made across the Golden Gate in 1877 from Fort Point to Sausalito toestablish a relationship between the 1877 tide staff zero at Fort Point with the 1877 tide staff zeroat Sausalito. Another crossing was made in 1906 - 1907 after the “1906 San Francisco Earthquake”to determine if there had been any vertical movement on either side of the Golden gate and vicinity.The level runs are show in Tables A and B for these crossings.
A. Level Crossing of the Golden Gate in 1877
Table A. Level Crossing of the Golden Gate in 1877
Level Between Marks Differences inElevations
Elevation Above Tide Staff Zero (Feet)
Fort Point Staff 20.000 A-I -5.506 14.494I - II 5.170 19.664II-III 37.460 57.124II- IV 1.807 21.471IV-Target 1 5.153 26.624Target 1-Target 2 0.586 27.210Target 2 - V -1.266 25.944V - VI -4.546 21.398VI - VII 70.465 91.863VII - VIII 26.296 118.159VIII -IX -39.803 78.356IX- Stone at Sausalito -31.797 46.559Stone- X stake -20.461 26.098X - 22 Ft Mark -3.634 22.464
22.464 - 20.000 = 0.464 feet difference in zero of the two staffs in 1877
B. Spirit Level Between the Tide Staff Zero at Fort Point with the Tide Staff Zero at Sausalitoin 1877
On most of the spirit levels there were two rods, the Boston rod and the Davidson tod, used together.The two rods were read on the same bench mark by each instruction. As these two readings weretaken without a resetting of the instrument, each reading was given a weight of 2/3 of the weight ofthe independent measure in the computation.
The section of the line from Fort Point to bench mark IV on the extreme north shore of Fort Pointwas re-leveled about eight times. The several results of differences in level between the bench markwere tabulated with weights in accordance with the remarks above.
C. Level Crossing of the Golden Gate in 1906 - 1907 Between the Presidio and Sausalito
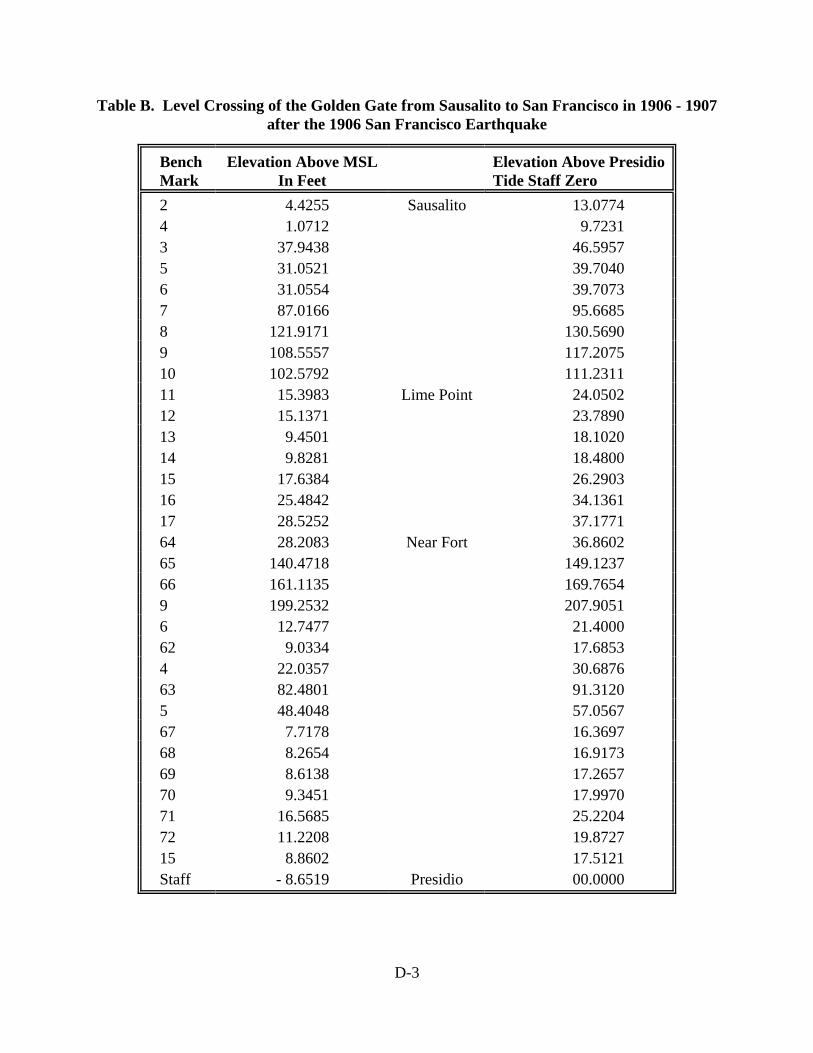
D-3
Table B. Level Crossing of the Golden Gate from Sausalito to San Francisco in 1906 - 1907after the 1906 San Francisco Earthquake
BenchMark
Elevation Above MSLIn Feet
Elevation Above PresidioTide Staff Zero
2 4.4255 Sausalito 13.07744 1.0712 9.72313 37.9438 46.59575 31.0521 39.70406 31.0554 39.70737 87.0166 95.66858 121.9171 130.56909 108.5557 117.207510 102.5792 111.231111 15.3983 Lime Point 24.050212 15.1371 23.789013 9.4501 18.102014 9.8281 18.480015 17.6384 26.290316 25.4842 34.136117 28.5252 37.177164 28.2083 Near Fort 36.860265 140.4718 149.123766 161.1135 169.76549 199.2532 207.90516 12.7477 21.400062 9.0334 17.68534 22.0357 30.687663 82.4801 91.31205 48.4048 57.056767 7.7178 16.369768 8.2654 16.917369 8.6138 17.265770 9.3451 17.997071 16.5685 25.220472 11.2208 19.872715 8.8602 17.5121Staff - 8.6519 Presidio 00.0000

D-4