noguera-díaz, a., bimbo, n., holyfield, l. t., ahmet, i. …...structure-property relationships in...
TRANSCRIPT

Noguera-Díaz, A., Bimbo, N., Holyfield, L. T., Ahmet, I. Y., Ting, V. P., &Mays, T. J. (2016). Structure-property relationships in metal-organicframeworks for hydrogen storage. Colloids and Surfaces A. Physicochemicaland Engineering Aspects, 496, 77-85.https://doi.org/10.1016/j.colsurfa.2015.11.061
Peer reviewed version
License (if available):CC BY-NC-ND
Link to published version (if available):10.1016/j.colsurfa.2015.11.061
Link to publication record in Explore Bristol ResearchPDF-document
This is the author accepted manuscript (AAM). The final published version (version of record) is available onlinevia Elsevier at http://www.sciencedirect.com/science/article/pii/S0927775715303927. Please refer to anyapplicable terms of use of the publisher.
University of Bristol - Explore Bristol ResearchGeneral rights
This document is made available in accordance with publisher policies. Please cite only the publishedversion using the reference above. Full terms of use are available:http://www.bristol.ac.uk/pure/about/ebr-terms

Structure-property relationships in metal-
organic frameworks for hydrogen storage
Antonio Noguera-Díaza, Nuno Bimbob, Leighton T Holyfielda,c, Ibbi Y Ahmetc,d, Valeska
P Tinga and Timothy J Maysa*
aDepartment of Chemical Engineering, University of Bath, Claverton Down, Bath, BA2
7AY, United Kingdom
bDepartment of Engineering, Lancaster University, Bailrigg, Lancaster, LA1 4YR,
United Kingdom
cDoctoral Training Centre for Sustainable Chemical Technologies, University of Bath,
Claverton Down, Bath, BA2 7AY, United Kingdom
dDepartment of Chemistry, University of Bath, Claverton Down, Bath, BA2 7AY,
United Kingdom
*Corresponding author. Tel.: +44 (0) 1225 386528.
Corresponding author e-mail address: [email protected]
Abstract
Experimental hydrogen isotherms on several metal-organic frameworks (IRMOF-1,
IRMOF-3, IRMOF-9, ZIF-7, ZIF-8, ZIF-9, ZIF-11, ZIF-12, ZIF-CoNIm, MIL-101
(Cr), NH2-MIL-101 (Cr), NH2-MIL-101 (Al), UiO-66, UiO-67 and HKUST-1)
synthesized in-house and measured at 77 K and pressures up to 18 MPa are presented,
along with N2 adsorption characterization. The experimental isotherms together with
literature high pressure hydrogen data were analysed in order to search for
relationships between structural properties of the materials and their hydrogen
uptakes. The total hydrogen capacity of the materials was calculated from the excess
adsorption assuming a constant density for the adsorbed hydrogen. The surface area,
pore volumes and pore sizes of the materials were related to their maximum hydrogen
excess and total hydrogen capacities. Results also show that ZIF-7 and ZIF-9 (SOD
topology) have unusual hydrogen isotherm shapes at relatively low pressures, which
is indicative of “breathing”, a phase transition in which the pore space increases due
to adsorption. This work presents novel correlations using the modelled total
hydrogen capacities of several MOFs. These capacities are more practically relevant
for energy storage applications than the measured excess hydrogen capacities. Thus,
these structural correlations will be advantageous for the prediction of the properties a
MOF will need in order to meet the US Department of Energy targets for the mass

and volume capacities of on-board storage systems. Such design tools will allow
hydrogen to be used as an energy vector for sustainable mobile applications such as
transport, or for providing supplementary power to the grid in times of high demand.
Keywords: hydrogen adsorption, nitrogen adsorption, hydrogen storage, MOF,
structure-property relationship, breathing structure.
1. Introduction
During the industrial revolution, humanity intensively used fossil fuels (mostly
petroleum and coal in the beginning), which caused a rapid growth in population and
economy, resulting in a corresponding increase in energy consumption. Today, coal,
oil and natural gas are the primary energy sources used across the world, and their use
has caused a continuous rise in CO2 levels in the atmosphere (exceeding 400 ppm in
January 2015) [1]. This increase in concentration of greenhouse gases is increasing the
Earth’s global temperature and predicts a rise in oceans’ level, contributing to what is
known as anthropogenic global warming [2]. It is predicted that energy consumption
will carry on growing in the 21st century, creating a colossal challenge in the future, as
societies will need to decarbonise their economies and replace increasingly scarce fossil
fuel energies with clean renewable energies [3].
This switch represents major challenges in many areas and highlights the need for
energy storage, due to the intermittence in production of renewable energies such as
solar and wind power, to balance supply and demand in the national electricity grid.
The transport sector is also one that needs to be decarbonised, as it was responsible for
13.1 % of all global emissions from 2004 and is almost completely reliant on oil [4].
Hydrogen shows great potential to be used as an energy vector due to its intrinsic
characteristics. Among its benefits, hydrogen is the chemical fuel with the highest
energy density by weight (after uranium and thorium), having a value of 142 MJ kg-1,
which is about three times more energy than gasoline and seven times more than coal
per unit mass [5-7]. Furthermore, hydrogen can be obtained from water, a very
abundant resource, which is more readily accessible than fossil fuels. However, its
energy density by unit volume is very low, presenting storage problems, particularly
for mobile applications. Mature storage technologies include compressed and cryogenic
hydrogen storage. However, their associated costs from compression and cooling
respectively are a concern, as well as safety issues from storing hydrogen at high

pressures when compressed [8]. One possible solution is to use nanoporous materials
to physically adsorb hydrogen, which reduces energy penalties by not requiring such
low temperatures as liquefaction, and stores hydrogen at more moderate pressures than
compression.
Among the materials that can be used as adsorbents there are metal-organic frameworks
(MOFs), activated carbons, zeolites and porous polymers [5]. MOFs are crystalline
materials formed by the connection of metal ions or clusters through organic molecules,
which act as linkers. MOFs have open channels or cavities with sizes ranging from
micro- to the meso-scale [9]. They show so far the highest hydrogen uptake and surface
area among all adsorbents but the overall costs can be high, depending on the type of
metal and linker used [10, 11]. The preparation of these materials is generally scalable,
giving high yield, and by carefully choosing the building blocks, targeted MOFs can be
created. They are usually synthesized using solvothermal methodologies at relatively
mild conditions. Due to the crystallinity of these materials, powder X-ray diffraction
can be used as an effective technique to determine the success of the synthesis [7, 12].
This peculiar type of material has become interesting for applications such as gas
storage, separation, and catalysis due to its accessible surface area and permanent
porosity. Therefore, this work aims to predict the hydrogen capacities of these materials
based on their structural properties. A methodology previously developed at Bath is
used to predict the total hydrogen capacity from the excess isotherms of several
materials tested with hydrogen at high pressures [13, 14]. The physical characterisation
of these materials, their maximum uptakes and their total hydrogen capacities have been
examined to identify useful correlations between them. The maximum uptake
correlations show similar correlations found in the past by other authors using measured
excess uptake data. The total hydrogen capacity correlations however, result in a novel
and more practical tool for determining the properties a MOF would need to have in
order to meet the US DOE (US Department of Energy) targets, given the mass and
volume of the tank, with the results having been compared across several different MOF
families with different metal centres.

2. Background study
The existence of relationships between different adsorbents and hydrogen adsorption
has been researched in the past. The first trends relating micropore volume and surface
area with hydrogen uptake were observed by Chahine and Bénard using different
microporous activated carbons [15, 16]. Materials were tested at 77 K at pressures up
to 3.5 MPa, taking from the isotherms either the maximum uptake value or a value close
to it for each of the tested materials. This led to the well-known “Chahine rule”, which
states a linear correlation between variables, predicting an increase of 1 wt % per 500
m2 g-1 and a 1 wt % per 0.2 cm3 g-1.
Panella and colleagues tested different microporous carbons at 77 K and RT: single-
walled carbon nanotubes (SWCNTs), multi-walled carbon nanotubes MWCNTs,
polyhedral nanoparticles and activated carbons [17] . In that report, the experimental
data was fitted to a Langmuir-type equation (type I isotherm). The saturation value of
each Langmuir fit for each material (denominated as the “storage capacity”) was used.
The work of Panella et al. also indicated the existence of a linear dependence between
BET surface area and pore volume at 77 K and RT with storage capacity. These findings
show independence with the type of carbon nanostructure, concluding that high surface
area and microporosity are desirable for high uptake materials. The maximum pressure
of these isotherms (up to 7 MPa) was sometimes not high enough to fully determine the
maximum excess uptake. This, combined with a limited number of isotherm points
resulted in large error bars in some cases. Also, materials were degassed and heated at
200 °C for approximately 2 hours, which might have not been enough to remove all
contaminants/He from the pores before testing them for hydrogen sorption. Gogotsi et
al. investigated a large number of carbide-derived carbons (CDCs) with tuned surface
area, pore volume and pore size in order to search for relationships between structural
properties and hydrogen storage [18]. All the tests and analyses were done at 77 K and
up to 6 MPa. A scattered relationship between hydrogen excess and surface area was
found. If details of pore structure (size, shape etc.) were irrelevant, then capacity would
be expected to vary linearly with surface area. Materials that outperformed the Chahine
rule generally show a greater fraction of pores with diameter smaller than 1.5 nm and/or
0.7 nm median pore size in their pore size distributions (PSDs). Therefore, a graph of
the excess capacity normalized per surface area of each material versus pore size
experimentally showed which pore ranges were best for hydrogen storage. From the

correlation it was concluded that pores larger than 1.5 nm had little contribution to
hydrogen storage. Pores of 0.6–0.7 nm in diameter provide the largest hydrogen uptake
per unit of surface at elevated pressures and liquid nitrogen temperatures. The results
also show that the effect of pore size is stronger than the effect of surface chemistry on
the hydrogen uptake. This shows that Chahine rule is not universal, meaning that even
if a material has a lower surface area than another, it may still have higher uptake if it
has more pores of a smaller diameter [17, 18].
Thomas tested materials of different nature (carbon, silica, alumina, metal-organic
frameworks and polymer porous materials) at 77 K and observed scattered linear trends
for surface area (especially for surface areas higher than 1000 m2 g-1) and pore volume.
The work also showed that materials with microporous pore volumes lower than 0.8 g
cm-3 have a hydrogen density in their pores similar to that of liquid H2 (0.0708 g cm-3).
The hydrogen isotherm data used in these correlations was limited to 0.1 MPa, making
it difficult to determine the maximum hydrogen excess accurately. Also, different
methods for calculating pore structure characteristics (surface area and pore volume)
such as surface areas obtained from BET and from t-method needed to be used [19].
Yaghi found an approximate linear correlation when plotting the maximum hydrogen
uptake of several MOFs against their Langmuir surface area [20]. The same materials
were used in this work because of their high pressure hydrogen isotherms, although
BET surface area was used instead of Langmuir, since it assumes multilayer adsorption,
while Langmuir assumes monolayer adsorption [20].
For this work, several MOFs from different classes were synthesized to look for
relationships between hydrogen uptake, total hydrogen capacity and structural
properties of the materials. MOFs were chosen because they show the highest hydrogen
uptakes among adsorbents. The materials were tested with N2 at 77 K to obtain their
structural properties and with hydrogen at high pressures (up to 18 MPa), clearly
showing their maximum excess points. Materials were degassed for periods between 6
and 8 h relying on Thermogravimetric analysis (TGA) to find the appropriate degassing
temperature. Different framework topologies were used to look for differences among
them and widen the validity of the correlation. This work also looked for consistency
in the methodologies to calculate surface areas, pore volumes and pore sizes. However,

different methodologies from literature and experiments had to be used for total pore
volume and pore size in order to be able to plot a reasonable number of data points.
Hydrogen adsorption excess isotherms in solid-state porous materials can be
experimentally obtained but the total amount stored in a material, a quantity of more
practical interest, cannot be measured directly using volumetric or gravimetric gas
sorption techniques. Total adsorption, unlike excess uptake, takes into account all the
hydrogen contained in the material, whether it is adsorbed or not. Adsorption
thermodynamics are described by the spreading pressure and pressure tensor of the
adsorptive, as well as the surface area of the material. Due to the complex geometry of
porous materials, it is not possible to analyse the pressure tensor of the hydrogen [21].
Hence, a model needs to be used to predict the total hydrogen capacity of the materials,
which is done here by fitting the excess hydrogen isotherms to a semi-empirical
mathematical model, using a Type 1 isotherm. High pressures were needed to reach
maximum excess uptake, which was necessary for obtaining reliable fits to the data for
calculation of total hydrogen capacity. The maximum pressures for some hydrogen
isotherms found in literature were insufficient, and thus resulted in greater uncertainties
in the modelled total uptake. The total hydrogen capacity has been calculated by
multiplying the pore volume by the density of the adsorbate obtained from the model
fitting (which is assumed as constant for the different pressures and temperatures),
assuming that the pore is completely filled with adsorbate (fractional filling ϴ equal to
1).
2. Materials and methods
The materials were synthesised according to methods reported in the literature [22-29].
In some cases, the synthesis was scaled up or larger sample sizes were produced by
combining multiple batches. HKUST-1 (BasoliteTM C300) was supplied by Sigma
Aldrich. A detailed explanation for the synthesis of all the tested can be found in the
Supplementary Information. For Powder XRD measurements, a Bruker D8 Advance
Diffractometer (Cu-Kα radiation, λ = 1.54184 Å) (Bruker, Billerica, US) with a lynxeye
detector at 40 kV and 40 mA was used. A step size of 0.041 ° s-1 (0.0081996 ° step-1
with a time per step of 0.2 seconds was chosen). Measurements were done in flat plate
mode at 298 K on wet crystalline samples. XRD spectra were compared with the
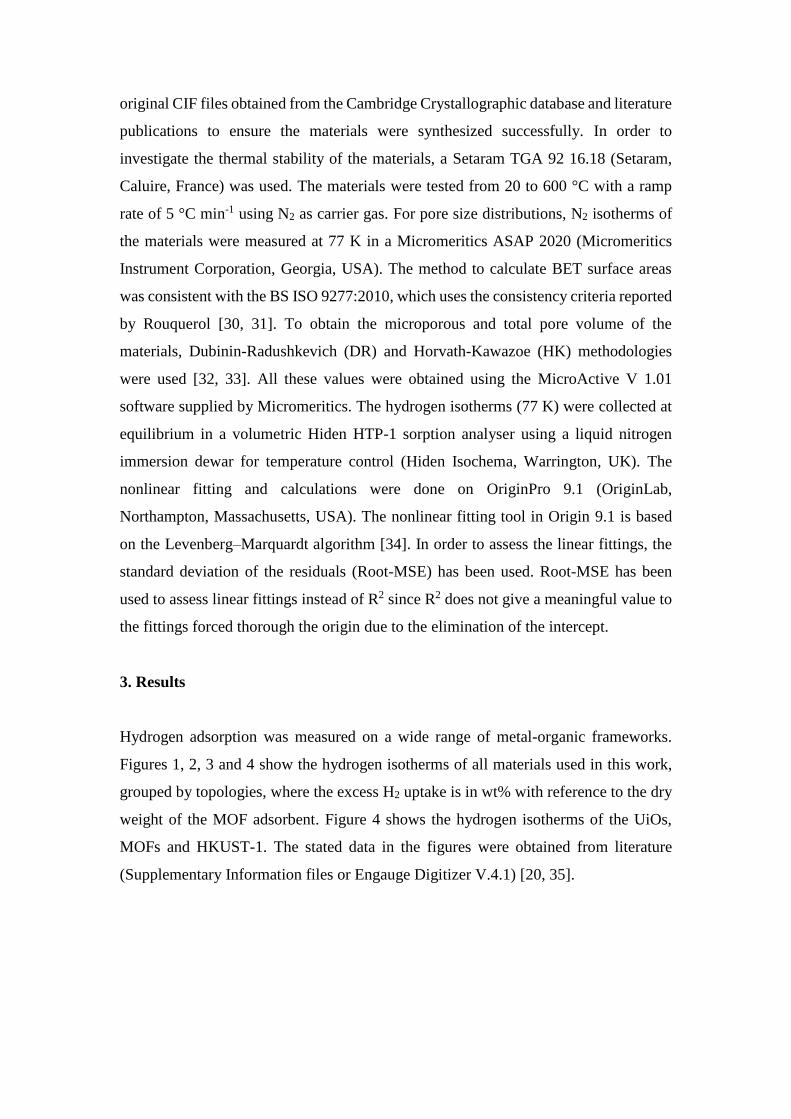
original CIF files obtained from the Cambridge Crystallographic database and literature
publications to ensure the materials were synthesized successfully. In order to
investigate the thermal stability of the materials, a Setaram TGA 92 16.18 (Setaram,
Caluire, France) was used. The materials were tested from 20 to 600 °C with a ramp
rate of 5 °C min-1 using N2 as carrier gas. For pore size distributions, N2 isotherms of
the materials were measured at 77 K in a Micromeritics ASAP 2020 (Micromeritics
Instrument Corporation, Georgia, USA). The method to calculate BET surface areas
was consistent with the BS ISO 9277:2010, which uses the consistency criteria reported
by Rouquerol [30, 31]. To obtain the microporous and total pore volume of the
materials, Dubinin-Radushkevich (DR) and Horvath-Kawazoe (HK) methodologies
were used [32, 33]. All these values were obtained using the MicroActive V 1.01
software supplied by Micromeritics. The hydrogen isotherms (77 K) were collected at
equilibrium in a volumetric Hiden HTP-1 sorption analyser using a liquid nitrogen
immersion dewar for temperature control (Hiden Isochema, Warrington, UK). The
nonlinear fitting and calculations were done on OriginPro 9.1 (OriginLab,
Northampton, Massachusetts, USA). The nonlinear fitting tool in Origin 9.1 is based
on the Levenberg–Marquardt algorithm [34]. In order to assess the linear fittings, the
standard deviation of the residuals (Root-MSE) has been used. Root-MSE has been
used to assess linear fittings instead of R2 since R2 does not give a meaningful value to
the fittings forced thorough the origin due to the elimination of the intercept.
3. Results
Hydrogen adsorption was measured on a wide range of metal-organic frameworks.
Figures 1, 2, 3 and 4 show the hydrogen isotherms of all materials used in this work,
grouped by topologies, where the excess H2 uptake is in wt% with reference to the dry
weight of the MOF adsorbent. Figure 4 shows the hydrogen isotherms of the UiOs,
MOFs and HKUST-1. The stated data in the figures were obtained from literature
(Supplementary Information files or Engauge Digitizer V.4.1) [20, 35].

Fig 1. Excess hydrogen isotherms for the IRMOF family of materials at 77 K. Open
symbols represent the desorption isotherms for each material. Data for IRMOF-6,
IRMOF-11, IRMOF-20 and IRMOF-62 were taken from literature [20, 35].
Fig 2. Excess hydrogen isotherms for the ZIF family of materials at 77 K. Open symbols
represent the desorption isotherms for each material.
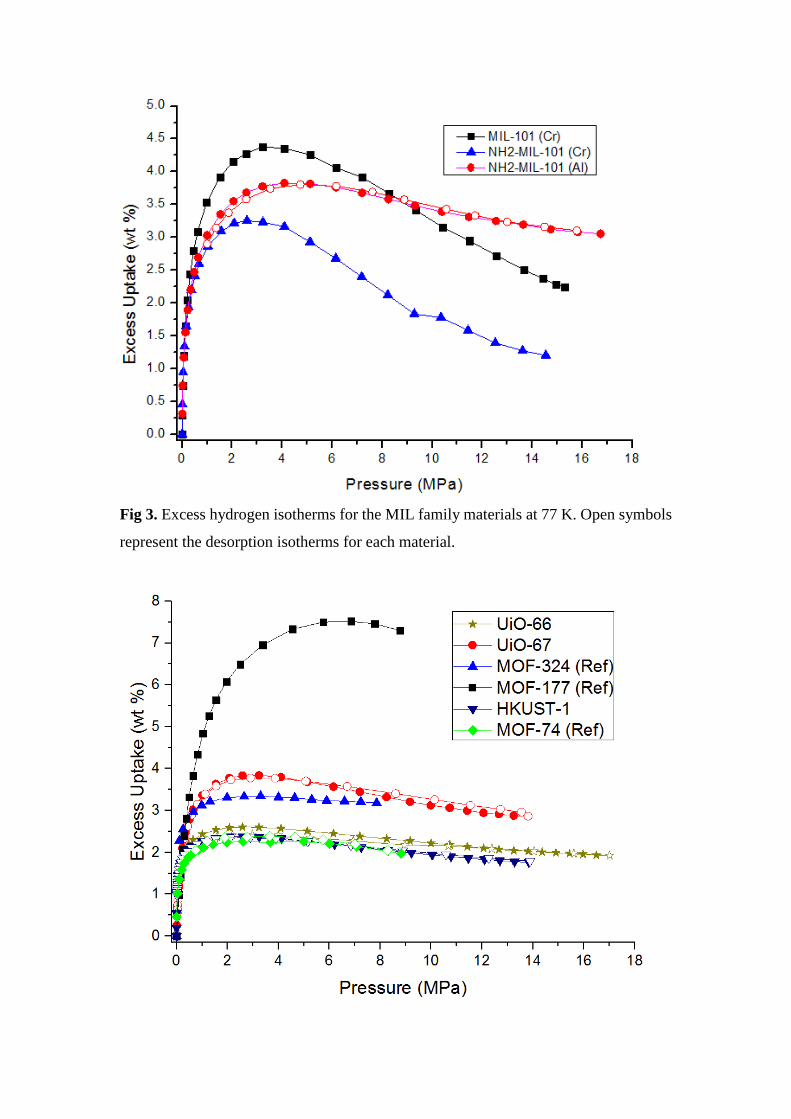
Fig 3. Excess hydrogen isotherms for the MIL family materials at 77 K. Open symbols
represent the desorption isotherms for each material.

Fig 4. Excess hydrogen isotherms for the UiOs, MOFs and HKUST-1 at 77 K. Open
symbols represent the desorption isotherms for each material. Data for MOF-324,
MOF-177 and MOF-74 were taken from literature [20, 35].
From Figures 1, 2, 3 and 4 the maximum excess uptake, used in the correlations, and
its pressure for each material can be seen in Table 1:
Table 1. Maximum excess and pressure of materials.
Material
name
Pressure
(MPa)
Maximum
excess
uptake
(wt %)
Material name Pressure
(MPa)
Maximum
excess
uptake
(wt %)
IRMOF-1 4.01 5.93 ZIF-7 4.12 1.43
IRMOF-3 4.07 5.02 ZIF-8 3.22 3.46
IRMOF-6 4.53 4.85 ZIF-9 3.86 1.37
IRMOF-9 4.12 2.41 ZIF-11 5.15 2.53
IRMOF-11 3.37 3.52 ZIF-12 5.15 2.63
IRMOF-20 7.76 6.67 ZIF-CoNIm 3.23 2.18
IRMOF-62 3.9 4.84 MIL-101 (Cr) 3.20 4.38
MOF-74 4.99 2.26 NH2-MIL-101 (Cr) 2.59 3.25
MOF-177 6.85 7.52 NH2-MIL-101 (Al) 4.08 3.82
MOF-324 3.30 3.34 UiO-66 2.59 2.60
HKUST-1 2.60 2.38 UiO-67 3.23 3.84
Figure 2 shows the hydrogen isotherms for all the tested ZIFs. ZIFs 7 (Zn), ZIF-8 (Zn)
and ZIF-9 (Co) possess SOD topology while ZIF-11 (Zn), ZIF-12 (Co) and ZIF-CoNIm
(Co) possess RHO topologies. SOD topology is formed of cuboctaedral cages (known
as beta cages). These cages are composed of 4 and 6 membered ring windows with 24
Co or Zn atoms per unit cell. Each β cage is connected to six other β cages by sharing
double 4 membered ring units. It differs from the RHO topology, which is formed of α
cages (with 4, 6 and 8 membered windows, with 48 Zn or Co per unit cell) connected
small polyhedral units (known as D8R) that link the α cages with each other [36, 37].
Both ZIF-7 and ZIF-9 (SOD topologies) show unusual hydrogen isotherm shapes at

relatively low pressures. ZIF-7 has been reported to have a sorbate-induced gate-
opening phenomena, involving a narrow-to-large pore phase transition [38-40]. This
peculiar sorption pattern has been confirmed in CO2 and C2-C4 alkane/alkaline
adsorption [40, 41]. Since ZIF-7 and ZIF-9 only differ in the nature of the metal cluster
and both show special hydrogen isotherm shapes, it indicates that ZIF-9 may also show
sorbate-induced gate-opening phenomena. Our results clearly show a feature that is
indicative of the same phase transition from a narrow to large pore at 77 K and at 1
MPa.
Also, the maximum hydrogen uptakes for ZIF-7 and ZIF-9 are very similar, having a
value of 1.43 (at 4.12 MPa) and 1.37 (at 3.86 MPa) wt. % respectively. These values
are also similar for their RHO homologues, as ZIF-11 and ZIF-12 show 2.53 and 2.63
wt % respectively, at the same pressure (5.15 MPa). This shows very similar maximum
excess uptakes for both forms, showing that the nature of the metal (Co or Zn) does not
have much influence on the hydrogen uptake of the material. Also, the maximum uptake
difference between topologies is slightly less than double in both cases.
Figure 3 shows that, while MIL-101 (Cr) has a higher excess uptake, NH2-MIL-101
(Al) has higher excess uptakes at higher pressures because of the different metal cluster
interaction between Al and Cr with H2. Also, the -NH2 group increases the weight of
the framework, giving a lower gravimetric uptake as later shown for the IRMOF-1 and
IRMOF-3 uptake differences. Figure 4 shows a UiO-67 excess isotherm with the same
shape as in literature but with 20 % less uptake [42]. This difference has been attributed
to sample variability. The synthesized UiO-67 batches show similar XRD patterns and
lower BET surface areas from the N2 isotherm data at 77 K (1347 ± 55 m2 g-1, compared
to 1877 m2 g-1 when using the same BET range, from 0.05 to 0.25 P/Po) that of
literature.
All the characterization data obtained from literature and experimentation, including
BET ranges used and detailed methodologies for each material can be found in the
supplementary information document.

4. Analysis and discussion
Comparing BET surface areas of MOFs with their uptakes at 0.1 MPa and 77 K proved
the need to use higher pressures to compare their maximum excess uptakes instead, due
to their different isotherm shapes [19]. As mentioned above, an approximate linear
relationship was found when plotting the maximum excess uptake against their
Langmuir surface area [20]. In Figure 5, the maximum hydrogen uptake of every MOF
against the BET surface area divided by one thousand is plotted. Two linear fits were
plotted, by fixing (black line) and not fixing the fit at the origin (red line), where x, y =
0. From the graph, it can be seen that high maximum excess corresponds to materials
with high BET surface area, showing a linear relationship between the two variables
with a certain degree of scattering. The red line fitting, (Root-MSE= 0.650 wt %) shows
a slightly better fit than the black one (Root-MSE = 0.787 wt %) giving (1.05 ± 0.33)
+ (1.35 ± 0.14) x and (1.76 ± 0.08) x wt % per 1000 m2 g-1 respectively. The correlation
shows higher scattering at lower BET ranges, which it is believed to be related to their
different pore volumes and smaller pore size. Also, it has been observed that the slope
of the fit with fixed origin, 1.76 ± 0.08 wt % per 1000 m2 g-1, shows a very similar value
that of the “Chahine rule”, with a value of 2 wt % per 1000 m2 g-1. However, these
values overestimate the value obtained from the best linear fit, 1.35 ± 0.14 wt % per
1000 m2 g-1. Both UiO-66 and 67 are above the linear correlation, outperforming
compared to other family groups. This might indicate that a different topology might
yield a higher uptake compared to other materials. Also, IRMOF-1 and IRMOF-3 show
a very high uptake compared to their BET values. IRMOF-3 shows a slightly lower
uptake than IRMOF-1, caused by differences in the functionalization of the linker.
When calculating the differences between their molecular weights (no solvent) (in g
mol IRMOF-1 [6, 12] and maximum molar uptakes (in g H2 mol IRMOF-1), values of
8.01 and 7.97 % were found respectively. This indicates that the amino group found in
IRMOF-3 linkers increases the molecular weight of the framework, with the increase
being inversely proportional to its hydrogen uptake. IRMOF-9 slightly underperforms
compared to its surface area, even when possessing an interpenetrated structure. This
adds extra weight in the structure together with the interpenetration itself that reduces
the available pore volume, giving a lower uptake compared with other IRMOFs. ZIF-
12 also shows higher uptake than expected compared to its surface area, probably due
its small pore diameters (0.66 and 1.4 nm).

Fig 5. Maximum excess capacity of MOFs at 77 K vs BET surface area (N2 at 77 K) in
1000 m2 g-1. Error bars correspond to the standard deviation obtained from the BET
calculation.
In Figure 6, all the available experimental and literature data with microporous volume
using the DR methodology has been plotted against their maximum excess uptake. The
graph shows a generalised increase in maximum excess uptake with increased
microporous volume, existing a high degree of scattering, especially due to IRMOFs 1
and 3. The linear fittings show very low correlation values (Root-MSEs of 1.18 and
1.06 wt % respectively) giving (1.61 ± 0.76) + (3.06 ± 0.98) x and (5.00 ± 0.38) x cm3
g-1. As in Figure 5, the value of the slope of the fit with fixed origin, 5.00 ± 0.38 wt %
per micropore cm3 g-1, yields a very similar value that of the “Chahine rule”, with a
value of 5 wt % per micropore cm3 g-1. Again, this value overestimates the value
obtained from the best linear fit 3.06 ± 0.98 wt % per micropore cm3 g-1. Previous
publications also indicated the existence of scattered micropore volume relationships
with activated carbons [15, 16, 19]. Also, it has been reported that the ideal pore size
for maximal attraction of an adsorbate is the same as its kinetic diameter, stating the

influence of pore size for hydrogen adsorption [12]. Therefore, since in Figure 6, the
micropore volume for each material is accounted for the same way, having different
pore sizes and the rest of the pore volume (total pore volume minus micropore volume)
is not considered, a high degree of scattering is observed. On top of that, the surface
area, which shows a more linear relationship than the rest of the variables with hydrogen
uptake, is higher in MOFs than other materials, such as activated carbons or zeolites,
adding higher dispersion. Similar reasoning to explain the scattering can be used to
describe Figure 7 since all pore volume is considered the same, neglecting any higher
contribution from the micropores for each material (Root-MSEs of 0.99 and 1.35 wt %
respectively).
Fig 6. Maximum excess capacity of MOFs at 77 K vs microporous pore volume using
the DR method.

Fig 7. Maximum excess capacity of MOFs at 77 K vs total pore volume (HK, Gurvitch,
Single crystal and Cerius2 methodologies from experiments and literature used).
In Figure 8, the pore volume values obtained from the non-linear fitting in every fitted
material are used, this being compared with all the pore values obtained from N2
sorption experiments and literature. A straight line with equation X = Y has also been
plotted to help the reader see how close the pore volumes from the fitting compare to
the experimental or literature ones. It can be seen that in many cases the fitted pore
volume is relatively close to the experimental value obtained from different sources,
especially at low pore volume values.

Fig 8. Theoretical pore volume obtained from fittings vs different experimental pore
volumes. Error bars correspond to the standard error obtained from the model fitting.
Figure 9 shows BET surface area against the modelled total hydrogen capacity from
model fitting, including error bars as the uncertainties from the calculation of the
density of the adsorbate and pore volume obtained from the model fitting. Due to
unrealistically high values from the fit and/or error bars, MIL-101 (Cr), MOF-74 and
IRMOF-62 (19.25 ± 2.65, 6.03 ± 12.04 and 29.18 ± 17.53 wt % respectively) have not
been used in the correlations. Although not as strongly correlated as when compared
with the maximum excess uptake (Root-MSEs of 1.48 and 1.88 wt % respectively), a
linear relationship between surface area and hydrogen capacity can be seen. From the
linear fittings a relationship of (2.69 ± 081) + (2.06 ± 0.28) x and 2.89 ± 0.16 total wt %
per 1000 m2 g-1 respectively has been obtained. The correlation predicts that several
materials will perform better than when compared with the excess uptake. Most of the
materials that outperformed in previous correlations, do outperform here as well,
showing also high potential for the MILs. This has been attributed to the MILs
mesoporosity, which require higher pressures in order to reach pore saturation.

Fig 9. Total hydrogen capacity of MOFs vs BET surface area (N2 at 77 K) in 1000 m
g-1. Error bars correspond to the standard error of the product of ρA * Vp to yield total
capacity.
In Figure 10, all available experimental and literature total pore volume methodologies
(HK total pore volume, Gurvitch, Single Crystal XRD and Cerius2) has been plotted as
a function of the total hydrogen capacity. With the exception of ZIF-8, all the materials
show a linear although scattered relationship (Root-MSE values 0.87 and 1.41 wt %
respectively), giving the fits (2.46 ± 0.52) + (4.14 ± 0.32) x and (5.43 ± 0.26) x total
wt % per cm3 g-1. Reports in literature state lower total pore volume for ZIF-8 compared
to the ones obtained experimentally, matching however, the BET surface area and
microporous volume values [43]. The correlation gives slightly better results that when
plotted against the maximum hydrogen excess for the linear fit that does not pass
through the origin. This result is related to the model’s assumption that all the materials’
pores are filled with adsorbed hydrogen. Although it has been reported in literature that
hydrogen is best adsorbed in micropores, at high pressures, the amount of hydrogen
that can be adsorbed in the rest of the pores cannot be considered negligible.
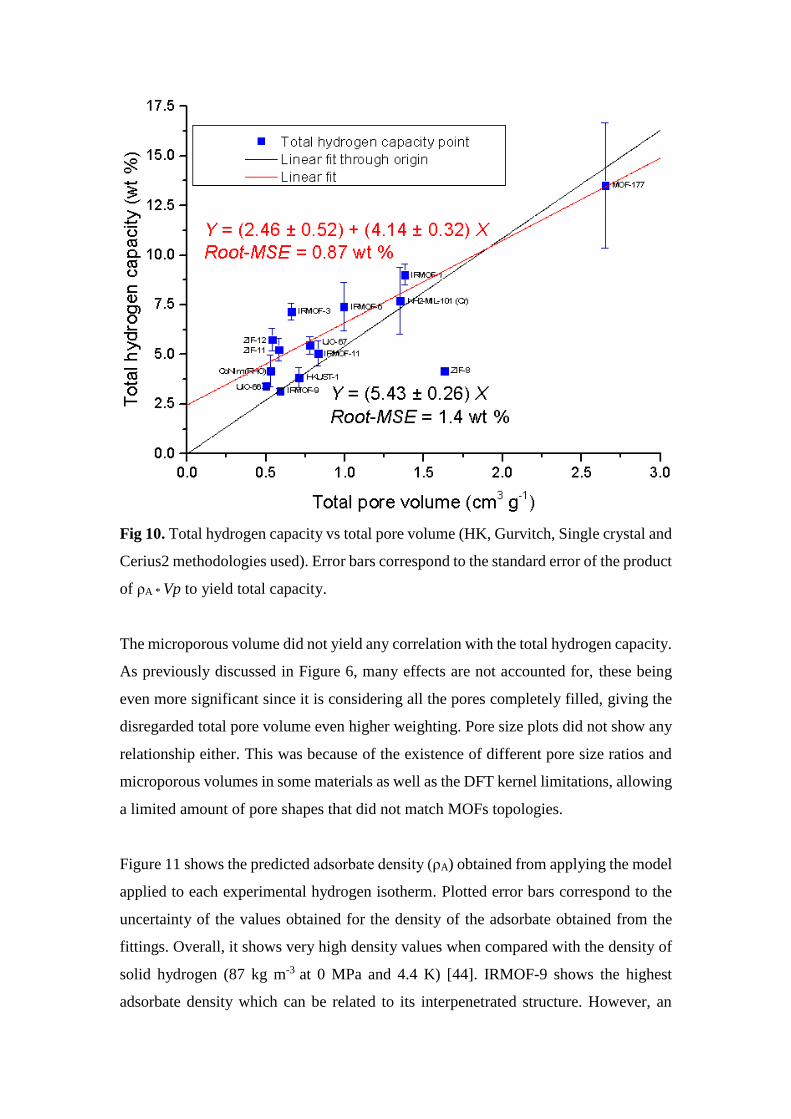
Fig 10. Total hydrogen capacity vs total pore volume (HK, Gurvitch, Single crystal and
Cerius2 methodologies used). Error bars correspond to the standard error of the product
of ρA * Vp to yield total capacity.
The microporous volume did not yield any correlation with the total hydrogen capacity.
As previously discussed in Figure 6, many effects are not accounted for, these being
even more significant since it is considering all the pores completely filled, giving the
disregarded total pore volume even higher weighting. Pore size plots did not show any
relationship either. This was because of the existence of different pore size ratios and
microporous volumes in some materials as well as the DFT kernel limitations, allowing
a limited amount of pore shapes that did not match MOFs topologies.
Figure 11 shows the predicted adsorbate density (ρA) obtained from applying the model
applied to each experimental hydrogen isotherm. Plotted error bars correspond to the
uncertainty of the values obtained for the density of the adsorbate obtained from the
fittings. Overall, it shows very high density values when compared with the density of
solid hydrogen (87 kg m-3 at 0 MPa and 4.4 K) [44]. IRMOF-9 shows the highest
adsorbate density which can be related to its interpenetrated structure. However, an

interpenetrated structure that increases the density of the framework together with a low
pore volume yields a low uptake and total hydrogen capacity. The second highest
adsorbate density observed belongs to IRMOF-20, a material with a high surface area
(4024 m2 g-1) [45] and pore volume, with micropores (1.4 and 1.73 nm) [45-47].
Overall, most of the materials (IRMOF-1, IRMOF-3, IRMOF-6, ZIF-CoNIm, UiO-67,
NH2-MIL-101 (Al) and HKUST-1) show a hydrogen density around 80-90 kg m-3.
Since the total hydrogen capacity is calculated as the product of pore volume times the
adsorbate density (Vp * ρA), the total value can come from a high adsorbate density or
a high Vp value that the model could have given.
Fig 11. Predicted adsorbate density of each MOF, including error bars from the model.
Error bars come from the standard error of ρA when fitting the hydrogen isotherms to
the model. Dashed line indicates the limiting density of solid hydrogen at 0 MPa (87
kg m-3) [44].
5. Conclusions
Several MOFs have been tested at high pressures and 77 K for hydrogen adsorption and
the pressure range at which some MOFs were tested in the past has been extended. ZIF-
9 shows a similar behaviour to ZIF-7, which is known for having a sorbate-induced
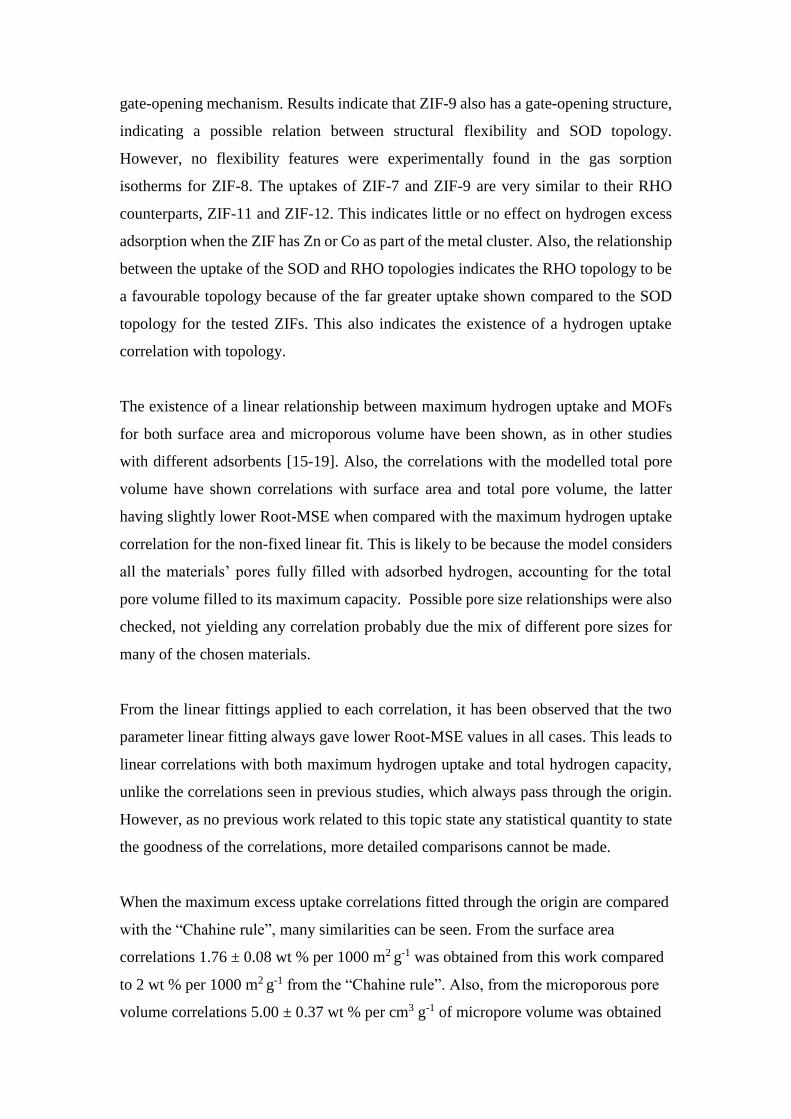
gate-opening mechanism. Results indicate that ZIF-9 also has a gate-opening structure,
indicating a possible relation between structural flexibility and SOD topology.
However, no flexibility features were experimentally found in the gas sorption
isotherms for ZIF-8. The uptakes of ZIF-7 and ZIF-9 are very similar to their RHO
counterparts, ZIF-11 and ZIF-12. This indicates little or no effect on hydrogen excess
adsorption when the ZIF has Zn or Co as part of the metal cluster. Also, the relationship
between the uptake of the SOD and RHO topologies indicates the RHO topology to be
a favourable topology because of the far greater uptake shown compared to the SOD
topology for the tested ZIFs. This also indicates the existence of a hydrogen uptake
correlation with topology.
The existence of a linear relationship between maximum hydrogen uptake and MOFs
for both surface area and microporous volume have been shown, as in other studies
with different adsorbents [15-19]. Also, the correlations with the modelled total pore
volume have shown correlations with surface area and total pore volume, the latter
having slightly lower Root-MSE when compared with the maximum hydrogen uptake
correlation for the non-fixed linear fit. This is likely to be because the model considers
all the materials’ pores fully filled with adsorbed hydrogen, accounting for the total
pore volume filled to its maximum capacity. Possible pore size relationships were also
checked, not yielding any correlation probably due the mix of different pore sizes for
many of the chosen materials.
From the linear fittings applied to each correlation, it has been observed that the two
parameter linear fitting always gave lower Root-MSE values in all cases. This leads to
linear correlations with both maximum hydrogen uptake and total hydrogen capacity,
unlike the correlations seen in previous studies, which always pass through the origin.
However, as no previous work related to this topic state any statistical quantity to state
the goodness of the correlations, more detailed comparisons cannot be made.
When the maximum excess uptake correlations fitted through the origin are compared
with the “Chahine rule”, many similarities can be seen. From the surface area
correlations 1.76 ± 0.08 wt % per 1000 m2 g-1 was obtained from this work compared
to 2 wt % per 1000 m2 g-1 from the “Chahine rule”. Also, from the microporous pore
volume correlations 5.00 ± 0.37 wt % per cm3 g-1 of micropore volume was obtained

from this work compared to 5 wt % per cm3 g-1 of micropore volume. However, the
two parameter linear fittings gave lower Root-MSE values, indicating that the
“Chahine rule” overestimates the maximum hydrogen uptake predictions.
Nevertheless, these correlations still only predict the increasing hydrogen uptake with
increasing surface area and pore volume, and does not allow prediction of the
minimum necessary intrinsic properties needed. By contrast, the novel correlations
with the modelled total hydrogen capacity presented here can provide more practical
predictions, enabling the calculation of a specific amount of hydrogen contained in a
tank from the surface area and pore volume of a given MOF.
Regarding these total hydrogen capacity correlations, two new equations for surface
area and total pore volume were obtained ((2.69 ± 0.81) + (2.06 ± 0.28) total wt % per
1000 m2 g-1 and (2.46 ± 0.52) + (4.14 ± 0.32) total wt % per cm3 g-1 of total pore volume.
However, the model showed higher hydrogen adsorbate density within the pores of
most of the materials compared to solid hydrogen (87 kg m-3 at 0 MPa and 4.4 K) [44].
Therefore these equations, in conjunction with system masses and volumes, would help
predict the properties a MOF would need to have in order to meet the US DOE targets,
to allow hydrogen to be used as an energy vector for sustainable applications such as
light-duty transport vehicles. A high surface area and a high pore volume are of utmost
importance for the design of high hydrogen capacity nanoporous materials. Also, from
literature, a narrow pore size distribution of around 0.7 nm has been proved to be of
paramount importance for a more optimal storage of hydrogen, and according to results
shown here, some topologies that have pore sizes in that range seem to perform better
for total hydrogen uptake [18]. The materials with UiO topology (Zr), UiO-66 and UiO-
67 outperformed most of the fittings through the origin in the correlations. This has
mainly been related to their small pore sizes and topology (0.75 and 1.2 nm for UiO-66
and 1.2 and 1.6 nm for UiO-67), these being close to the stated optimum for hydrogen
storage, 0.7 nm [18, 48]. However, UiO-67 pore size is over 35 % larger compared to
the optimum. HKUST-1, despite its reasonable surface area (1343 ± 82), micropore
volume (0.67 cm3 g-1) and very small pore sizes (0.46 and 0.85 nm, DFT slit N2) shows
a lower than predicted hydrogen uptake, being under the fixed linear fitting in most of
the correlations.

6. Acknowledgements
The authors thank the University of Bath for a URS studentship for AND and a Prize
Research Fellowship for VPT, the support from the UK Engineering and Physical
Sciences Research Council (EPSRC) and the SUPERGEN H2FC grant EP/J016454/1,
which funded most of this work. NB acknowledges funding from the EPSRC, grant
code EP/K021109/1, LTH and IYA acknowledge funding from the EPSRC Centre for
Doctoral Training in Sustainable Chemical Technologies (grant number
EP/G03768X/1) and LTH acknowledges funding from grant EP/L018365/1. VPT
acknowledges funding from the European Regional Development Fund (ERDF)
INTERREG IV programme for Materials for Energy Efficiency in Transport (MEET).
AND and LTH acknowledge sponsorship from Quantachrome UK to participate in the
7th International Symposium for Characterization of Porous Materials, where most of
this work was presented.
7. References
1. http://co2now.org/. Accesed on 13/04/15.
2. Global_Warming Is_changing_the_world_Science-2007-Kerr-188-90. 2007.
3. BP Statistical Review of World Energy June 2012. 2012.
4. http://www.ipcc.ch/pdf/assessment-report/ar4/wg3/ar4_wg3_full_report.pdf.
Accessed on 21/04/15. p. 29.
5. Lim K. L., K.H., Yaakob Z., Daud W. R. W., Solid-state Materials and Methods
for Hydrogen Storage: A Critical Review. Chemical Engineering &
Technology, 2010. 33(2): p. 213-226.
6. Mazloomi, K. and C. Gomes, Hydrogen as an energy carrier: Prospects and
challenges. Renewable & Sustainable Energy Reviews, 2012. 16(5): p. 3024-
3033.
7. Durbin, D.J. and C. Malardier-Jugroot, Review of hydrogen storage techniques
for on board vehicle applications. International Journal of Hydrogen Energy,
2013. 38(34): p. 14595-14617.
8. http://www.sigmaaldrich.com/technical-documents/articles/material-
matters/u-s-department-of.html. Accesed on 13/04/15. 2013.
9. Zuttel, A., Hydrogen storage methods. Naturwissenschaften, 2004. 91(4): p.
157-172.
10. Eberle, U., M. Felderhoff, and F. Schuth, Chemical and Physical Solutions for
Hydrogen Storage. Angewandte Chemie-International Edition, 2009. 48(36): p.
6608-6630.
11. David, W.I.F., Effective hydrogen storage: a strategic chemistry challenge.
Faraday Discussions, 2011. 151: p. 399-414.
12. Rowsell, J.L.C. and O.M. Yaghi, Strategies for Hydrogen Storage in Metal–
Organic Frameworks. Angewandte Chemie International Edition, 2005.
44(30): p. 4670-4679.

13. Sharpe, J.E., Bimbo, N., Ting, V. P., Burrows, A. D., Jiang, D. M., Mays, T. J.,
Supercritical hydrogen adsorption in nanostructured solids with hydrogen
density variation in pores. Adsorption-Journal of the International Adsorption
Society, 2013. 19(2-4): p. 643-652.
14. Bimbo, N., Ting, V.P., Hruzewicz-Kolodziejczyk, A., Mays, T.J., Analysis of
hydrogen storage in nanoporous materials for low carbon energy applications.
Faraday Discussions, 2011. 151: p. 59-74.
15. Channing, A. and P. Justin, Storage Materials Based on Hydrogen
Physisorption, in Hydrogen Storage Technology. 2012, Taylor & Francis. p.
213-238.
16. Chahine, R. and T.K. Bose, Characterization and optimization of adsorbents
for hydrogen storage. Hydrogen Energy Progress Xi, Vols 1-3, 1996: p. 1259-
1263.
17. Panella, B., M. Hirscher, and S. Roth, Hydrogen adsorption in different carbon
nanostructures. Carbon, 2005. 43(10): p. 2209-2214.
18. Gogotsi Y., P.C., Osswald S., Simmons J.M., Yidirim T. , Laudisio G., Fischer
J.E. , Importance of pore size in high-pressure hydrogen storage by porous
carbons. International Journal of Hydrogen Energy, 2009. 34(15): p. 6314-
6319.
19. Thomas, K.M., Hydrogen adsorption and storage on porous materials.
Catalysis Today, 2007. 120(3-4): p. 389-398.
20. Wong-Foy, A.G., A.J. Matzger, and O.M. Yaghi, Exceptional H-2 saturation
uptake in microporous metal-organic frameworks. Journal of the American
Chemical Society, 2006. 128(11): p. 3494-3495.
21. Myers, A.L. and P.A. Monson, Adsorption in porous materials at high pressure:
Theory and experiment. Langmuir, 2002. 18(26): p. 10261-10273.
22. Ferey G., M.-D.C., Serre C., Millange F., Dutour J., Surble S., Margiolaki, I., A
chromium terephthalate-based solid with unusually large pore volumes and
surface area. Science, 2005. 309(5743): p. 2040-2042.
23. Jiang, D.M., Keenan, L. L., Burrows, A. D., Edler, K. J., Synthesis and post-
synthetic modification of MIL-101(Cr)-NH2 via a tandem diazotisation process.
Chemical Communications, 2012. 48(99): p. 12053-12055.
24. Yaghi, O., Eddaoudi, M., Li, H., Kim, J., Rosi, N., Isoreticular metal-organic
frameworks, process for forming the same, and systematic design of pore size
and functionality therein, with application for gas storage. 2003, Google
Patents.
25. He M., Y.J.F., Liu Q., Zhong Z. X., Wang H. T., Toluene-assisted synthesis of
RHO-type zeolitic imidazolate frameworks: synthesis and formation mechanism
of ZIF-11 and ZIF-12. Dalton Transactions, 2013. 42(47): p. 16608-16613.
26. Cravillon, J., Munzer, S., Lohmeier, S. J., Feldhoff, A., Huber, K., Wiebcke,
M., Rapid Room-Temperature Synthesis and Characterization of Nanocrystals
of a Prototypical Zeolitic Imidazolate Framework. Chemistry of Materials,
2009. 21(8): p. 1410-1412.
27. Biswal, B.P., T. Panda, and R. Banerjee, Solution mediated phase
transformation (RHO to SOD) in porous Co-imidazolate based zeolitic
frameworks with high water stability. Chemical Communications, 2012. 48(97):
p. 11868-11870.
28. Cavka J.H., J.S., Olsbye U., Guillou N., Lamberti C., Bordiga S., Lillerud K.P.,
A new zirconium inorganic building brick forming metal organic frameworks

with exceptional stability. Journal of the American Chemical Society, 2008.
130(42): p. 13850-13851.
29. Serra-Crespo, P., Ramos-Fernandez, E. V., Gascon, J., Kapteijn, F., Synthesis
and Characterization of an Amino Functionalized MIL-101(Al): Separation and
Catalytic Properties. Chemistry of Materials, 2011. 23(10): p. 2565-2572.
30. Brunauer, S., P.H. Emmett, and E. Teller, Adsorption of Gases in
Multimolecular Layers. Journal of the American Chemical Society, 1938. 60(2):
p. 309-319.
31. Rouquerol, J., P. Llewellyn, and F. Rouquerol, Is the BET equation applicable
to microporous adsorbents? Characterization of Porous Solids Vii -
Proceedings of the 7th International Symposium on the Characterization of
Porous Solids (Cops-Vii), Aix-En-Provence, France, 26-28 May 2005, 2006.
160: p. 49-56.
32. Horvath, G. and K. Kawazoe, Method for the calculation of effective pore-size
distribution in molecular-sieve carbon. Journal of Chemical Engineering of
Japan, 1983. 16(6): p. 470-475.
33. Dubinin, M.M., The potential theory of adsorption of gases and vapors for
adsorbents with energetically nonuniform surfaces. Chemical Reviews, 1960
60(2): p. 235-241.
34. Marquardt, D.W., An algorithm for least-squares estimation of nonlinear
parameters. Journal of the Society for Industrial and Applied Mathematics,
1963. 11(2): p. 431-441.
35. Tranchemontagne, D.J., Park, K.S., Furukawa, H., Eckert, J., Knobler, C.B.,
Yaghi, O.M., Hydrogen Storage in New Metal-Organic Frameworks. Journal
of Physical Chemistry C, 2012. 116(24): p. 13143-13151.
36. Park K. S., N.Z., Cote A.P., Choi J.Y., Huang R.D., Uribe-Rom, F.J., Chae
H.K., O'Keeffe M., Yaghi O.M., Exceptional chemical and thermal stability of
zeolitic imidazolate frameworks. Proceedings of the National Academy of
Sciences of the United States of America, 2006. 103(27): p. 10186-10191.
37. Ruthven, D.M., Principles of adsorption & adsorption processes. 1984.
38. Aguado, S., Bergeret, , Titus, M.P., Moizan, V., Nieto-Draghi, C., Bats, N.,
Farrusseng, D., Guest-induced gate-opening of a zeolite imidazolate framework.
New Journal of Chemistry, 2011. 35(3): p. 546-550.
39. Ryder, M.R., Civalleri, Bartolomeo, B., Thomas D., Henke, S., Rudić, S.,
Cinque, G., Fernandez-Alonso, F., Tan, J.C., Identifying the Role of Terahertz
Vibrations in Metal-Organic Frameworks: From Gate-Opening Phenomenon
to Shear-Driven Structural Destabilization. Physical Review Letters, 2014.
113(21): p. 215502.
40. Pera-Titus, M., Intrinsic Flexibility of the Zeolitic Imidazolate Framework ZIF-
7 Unveiled by CO2 Adsorption and Hg Intrusion. ChemPhysChem, 2014. 15(8):
p. 1581-1586.
41. van den Bergh, J., Gucuyener, C., Pidko, E. A.,Hensen, E. J. M., Gascon, J.,
Kapteijn, F., Understanding the Anomalous Alkane Selectivity of ZIF-7 in the
Separation of Light Alkane/Alkene Mixtures. Chemistry-a European Journal,
2011. 17(32): p. 8832-8840.
42. Chavan, S., Vitillo, J. G., Gianolio, D., Zavorotynska, O., Civalleri, B.,
Jakobsen, S., Nilsen, M. H., Valenzano, L., Lamberti, C., Lillerud, K. P.,
Bordiga, S., H-2 storage in isostructural UiO-67 and UiO-66 MOFs. Physical
Chemistry Chemical Physics, 2012. 14(5): p. 1614-1626.

43. Zhang, Z.J., Xian, S. K., Xia, Q. B., Wang, H. H., Li, Z., Li, J., Enhancement of
CO2 Adsorption and CO2/N2 Selectivity on ZIF-8 via Postsynthetic
Modification. Aiche Journal, 2013. 59(6): p. 2195-2206.
44. Silvera, I.F., The solid molecular hydrogens in the condensed phase:
Fundamentals and static properties. Reviews of Modern Physics, 1980. 52(2):
p. 393-452.
45. Wong-Foy, A.G., A.J. Matzger, and O.M. Yaghi, Exceptional H2 saturation
uptake in microporous metal-organic frameworks. Journal of the American
Chemical Society, 2006. 128(11): p. 3494-3495.
46. Millward, A.R. and O.M. Yaghi, Metal-organic frameworks with exceptionally
high capacity for storage of carbon dioxide at room temperature. Journal of the
American Chemical Society, 2005. 127(51): p. 17998-17999.
47. Rowsell, J.L.C. and O.M. Yaghi, Effects of functionalization, catenation, and
variation of the metal oxide and organic linking units on the low-pressure
hydrogen adsorption properties of metal-organic frameworks. Journal of the
American Chemical Society, 2006. 128(4): p. 1304-1315.
48. Chavan S., V., J.G., Gianolio D., Zavorotynska O., Civalleri B., Jakobsen S.,
Nilsen M.H., Valenzano L., Lamberti C., Lillerud K.P., Bordiga S., H2storage
in isostructural UiO-67 and UiO-66 MOFs. Physical Chemistry Chemical
Physics, 2012. 14(5): p. 1614-1626.