non-aqueous vs aqueous overflush scale inhibitor squeeze ... · pdf file1 non-aqueous vs...
TRANSCRIPT

Heriot-Watt University Research Gateway
Heriot-Watt University
Non-aqueous vs aqueous overflush scale inhibitor squeeze treatment in an oilfield offshoreNorwayVazquez, Oscar; Herrero, Pablo; Mackay, Eric James; Jordan, Myles
Published in:Journal of Petroleum Science and Engineering
DOI:10.1016/j.petrol.2015.11.033
Publication date:2016
Document VersionPeer reviewed version
Link to publication in Heriot-Watt University Research Gateway
Citation for published version (APA):Vazquez, O., Herrero, P., Mackay, E. J., & Jordan, M. (2016). Non-aqueous vs aqueous overflush scale inhibitorsqueeze treatment in an oilfield offshore Norway. Journal of Petroleum Science and Engineering, 138, 1-10.DOI: 10.1016/j.petrol.2015.11.033

General rightsCopyright and moral rights for the publications made accessible in the public portal are retained by the authors and/or other copyright ownersand it is a condition of accessing publications that users recognise and abide by the legal requirements associated with these rights.
If you believe that this document breaches copyright please contact us providing details, and we will remove access to the work immediatelyand investigate your claim.
Download date: 26. Apr. 2018
1
Non-aqueous vs Aqueous Overflush Scale Inhibitor Squeeze Treatment
in an Oilfield Offshore Norway
Oscar Vazquez, Pablo Herrero, Eric Mackay, Myles Jordan
Corresponding author:
Oscar Vazquez
Institute of Petroleum Engineering
Heriot-Watt University
Edinburgh, EH14 4AS
Telephone: + 44 131 451 3609
Fax: +44 131 451 3127
Email: [email protected]
Abstract The field under study is located offshore Norway. Due to the need for pressure support, it is
anticipated that seawater will be injected and continuous gas lift will be used in a number of
wells. Barium sulphate scale deposition is expected as high concentrations of barium have been
measured in the formation brine. Scale inhibitor squeeze treatments will form an important part
of the scale mitigation plan.
Squeeze treatments entail the injection of an inhibitor chemical to prevent scale deposition, the
treatment generally consists of the following stages: preflush, main treatment, overflush and
shut-in. The preflush stage is normally injected to condition the formation, with typically a
mutual solvent being deployed to improve inhibitor retention and well clean–up times. The
chemical slug is injected in the main treatment stage, generally as an aqueous phase. The
overflush stage is deployed to displace the chemical slug deeper into the reservoir and thus
expose the chemical to a greater surface area of rock to achieve a higher level of retention.
Commonly, the overflush is deployed as an aqueous phase; however, it is not always feasible
to inject large volumes of water in wells which are water sensitive or which already require
artificial lift. Water is denser than hydrocarbons, and therefore more difficult to lift. In these
circumstances, a non-aqueous overflush, generally marine diesel, may be preferable. The diesel
volumes required are feasible for scale squeezes during the first years, although some
additional logistic effort and costs are to be considered.
The objective of this paper is to compare squeeze treatment lifetime achieved by conventional
aqueous and non-conventional squeeze treatments, where non-conventional refers to
treatments where the overflush is split into aqueous and non-aqueous stages, typically diesel
being used for the non-aqueous stage. The simulation and optimisation calculations were
performed using a specialised near wellbore model for scale treatments, where a two-phase
flow model was used to describe the displacement process during the multi-stage overflush.
Splitting the overflush was found to reduce the squeeze lifetime marginally, as the non-aqueous
overflush is not as effective as a purely aqueous overflush in propagating scale inhibitor deeper
into the formation. However, this is counterbalanced by the fact that a smaller volume of water
needs to be injected in the formation, and so reducing the risk of formation damage and most
important for this particular case, a smaller volume of water will need to be lifted, so the well
may be set back to production with ease.
2
1 Introduction
The oil field under study is located offshore Norway, it consists of two separated main reservoir
formations. Both formations are relatively at shallow depth, characterised by low pressures and
temperature. This study will be focused on the shallower formation, as seawater breakthrough
is not expected to occur in the deeper formation producing wells. Due to the low reservoir
pressure existing, it is anticipated that seawater injection will be injected for pressure support.
In addition, a number of the wells in the central and main segment require gas lift. The south
segment wells do not require gas lift, because of an existing gascap.
High levels of Barium measured in the formation brine is expected to cause barium sulphate
scale deposition. Barium sulphate precipitates due to the mixing of incompatible brines, namely
seawater rich in sulphate ions and formation brine rich in Barium ions. The deposition of
barium sulphate might occur deep in the reservoir, which is not damaging, and possibly the
contrary as shown in the Gyda field (Mackay et al, 2006), where sulphate is stripped form the
injected seawater, as the mixing front travels through the formation. Consequently, the levels
of sulphate and barium close to the production wells will not be as high, and although barite-
scaling tendency will be still present, it could be significant lower. In addition, carbonate scales
may occur when the fluids are heated up before entering the separators however is not
considered as a challenge from treatment perspective.
Squeeze treatments is one of the most common techniques for scale mitigation. They are
commonly deployed to inhibit sulphate scales and in particular barite, which has extremely low
solubility and is very hard. Prevention is key as sulphate scale only dissolves at a reasonable
rate in the best dissolvers if given enough time and temperature, (Kelland, 2009). Considering
the low reservoir temperature, scale dissolvers are not expected to be very effective. Preventive
over corrective squeeze treatments are thus the primary plan.
Scale inhibitor squeeze treatments are deployed to protect the near wellbore area from scale
deposition and formation damage. The inhibitor will, of course, be actively protecting the
pipeline to topside, but commonly topside facilities are further dosed. In a squeeze treatment,
a scale inhibitor solution is normally bull-headed into the formation and then normally pushed
for a few feet deeper in the formation. Then the well is shut-in for few hours to allow the
chemical further retain in the formation surface. Finally, the well is put back in production and
the chemical is slowly released and returned in the produced water. The produced water
contains chemical concentration that prevent scale deposition, as long as the concentration are
above a certain threshold, commonly known as MIC (minimum inhibitor concentration), when
the chemical level falls below this threshold the well has to be re-squeezed. Squeeze treatments
normally consist of the following stages: preflush, main treatment, overflush and shut-in. The
preflush stage is normally injected to condition the formation; in certain occasions, a mutual
solvent is deployed to improve inhibitor retention and well clean–up times. The chemical slug
is injected in the main treatment stage, generally in an aqueous phase. The overflush stage is
deployed to displace the chemical slug deeper into the reservoir and thus expose the chemical
to a greater surface area of rock to achieve a higher level of retention. Generally, the overflush
is deployed as an aqueous phase, which normally results in longer squeeze lifetimes, as the
chemical will be pushed deeper in the formation. However, in some occasions it is not feasible
or recommended to inject large volumes of water. Such as in water sensitive formations, pre-

3
emptive squeezes (wells at low water cuts) or/and where artificial gas lift is required, water is
denser than hydrocarbons, and therefore more difficult to lift.
The main goal of this paper is to compare squeeze treatment lifetime achieved between a
conventional aqueous treatment and a non-conventional squeeze treatments, which refers to
treatments where the overflush stage is split into an aqueous and non-aqueous stage, where
typically diesel is injected as the non-aqueous fluid. Splitting the overflush might not be as
effective as a purely aqueous stage, as the scale inhibitor propagation may not as effective.
However, this might be counterbalanced by the fact that a smaller volume of water will be
required to achieve comparable squeeze lifetimes, thus reducing the risk of formation damage,
well clean-up (a smaller volume of water needs to be produced back). And finally, a smaller
volume of water has to be lifted, easing the process to put the well back in production.
2 Scale Management
Reservoir scaling is a serious concern which has to be addressed during all the field life. The
same approach adopted by Mackay and co-authors (Mackay et al., 2005) will be followed in
this study, where an integrated risk analysis of scale management was proposed during the
Front End Engineering Design (FEED) stage. The study includes the following steps,
identification of maximum scale potential, evaluation of best suited chemistry by laboratory
testing, modification of full reservoir simulation model to predict seawater breakthrough and
finally, near wellbore squeeze modelling, which is based on the flow profiles derived from the
reservoir model simulations.
2.1 Scale potential
To calculate the scale potential a number of flash-type calculations to predict the scaling risk
associated to seawater injection in the reservoir formation were performed using PHREEQC,
a geochemical model, which accounts for the original acronym - pH-REdox-EQuilibrium
(Parkhusrts and Appelo, 1999). The calculation considers the mixing of seawater and formation
brine at the reservoir conditions, the formation brine and seawater can be found in Table 1.
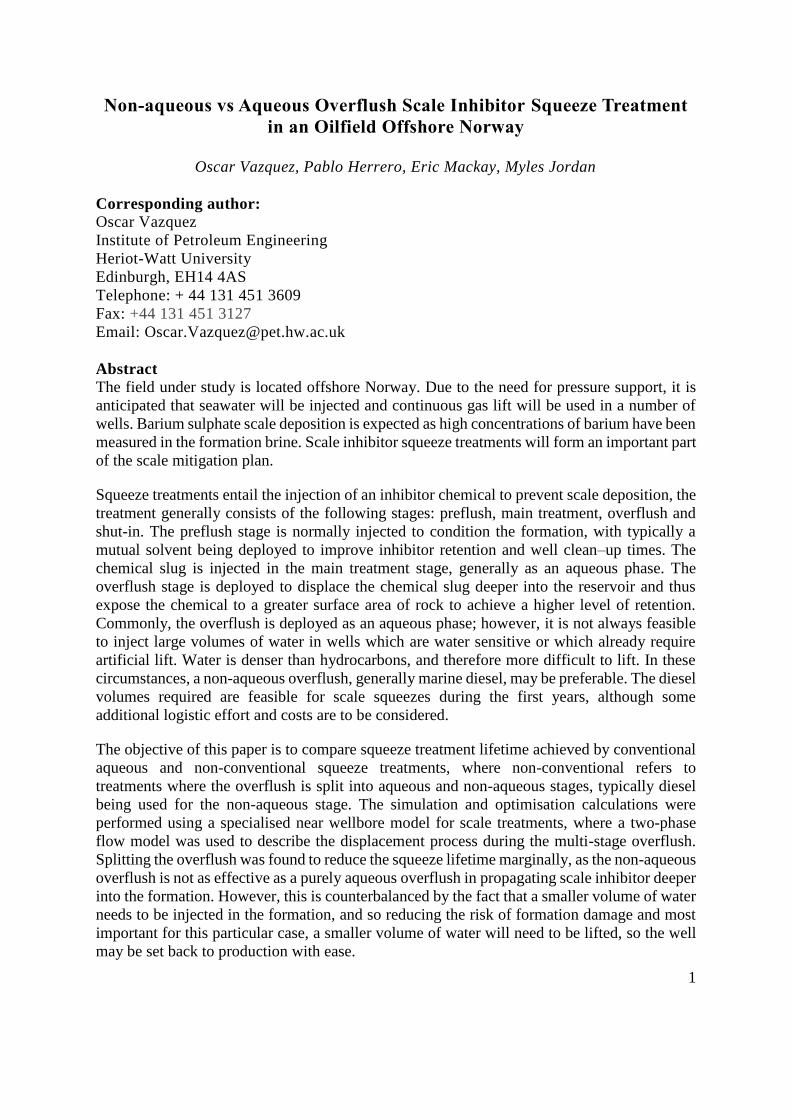
This type of calculation estimates the Saturation Ratio (SR) of the minerals that might
precipitate, and the mass of the deposits, in particular Barite and Celestite are likely to deposit
at the formation and topside facilities (separator), see Figure 1. The results show the highest
scaling tendency occurring around 60% seawater fraction, however the saturation ratio for
Barite above 200 occurs for almost all the mixing ratios, outlining the strong impact of the
problem over the field life. As mention before, carbonate scaling is not considered as major
challenge in terms of treatment.
4
Figure 1 Saturation Ratio of sulphate scales and precipitation (mg/kg of water) at reservoir
conditions (right) and topside conditions, separator (left).
Formation Brine Seawater
Na (mg/l) 39,600 11,510
K (mg/l) 466 420
Mg (mg/l) 772 1,410
Ca (mg/l) 3,030 435
Ba (mg/l) 366 0
Sr (mg/l) 626 7
SO4 (mg/l) - 2800
Total Alkalinity
(mg/l as HCO3) 2,200 150
Table 1 Formation and seawater compositions.
2.2 Evaluation of best suited chemistry
To evaluate the best suited chemistry for the reservoir under study, the amount of scale inhibitor
required to control scale deposition has to be performed. In particular for barium sulphate scales
static bottle test are be used as screening method (Kelland, 2009). From these tests the
minimum inhibitor concentration, commonly known as MIC, is determined. The MIC value is
normally based on the worst scaling conditions, which occurs around 60% of seawater
percentage where saturation ratio of BaSO4 reaches its maximum, see Figure 1. However, the
chemical supplier suggested that the MIC may vary from 7.5 to 2.5 ppm, which varies as a
function of the scaling tendency. The scaling tendency is a function of the produced water
composition, which is determined by the seawater fraction and may be lowered by barium
stripping.
2.2.1 Barium stripping
Barium reservoir stripping may lead to a reduction in the barite scaling precipitation tendency
in near wellbore areas (Mackay, et al., 2006), resulting in a lower MIC. To considered barium
stripping a reactive transport reservoir model was used to simulate the BaSO4 precipitation
5
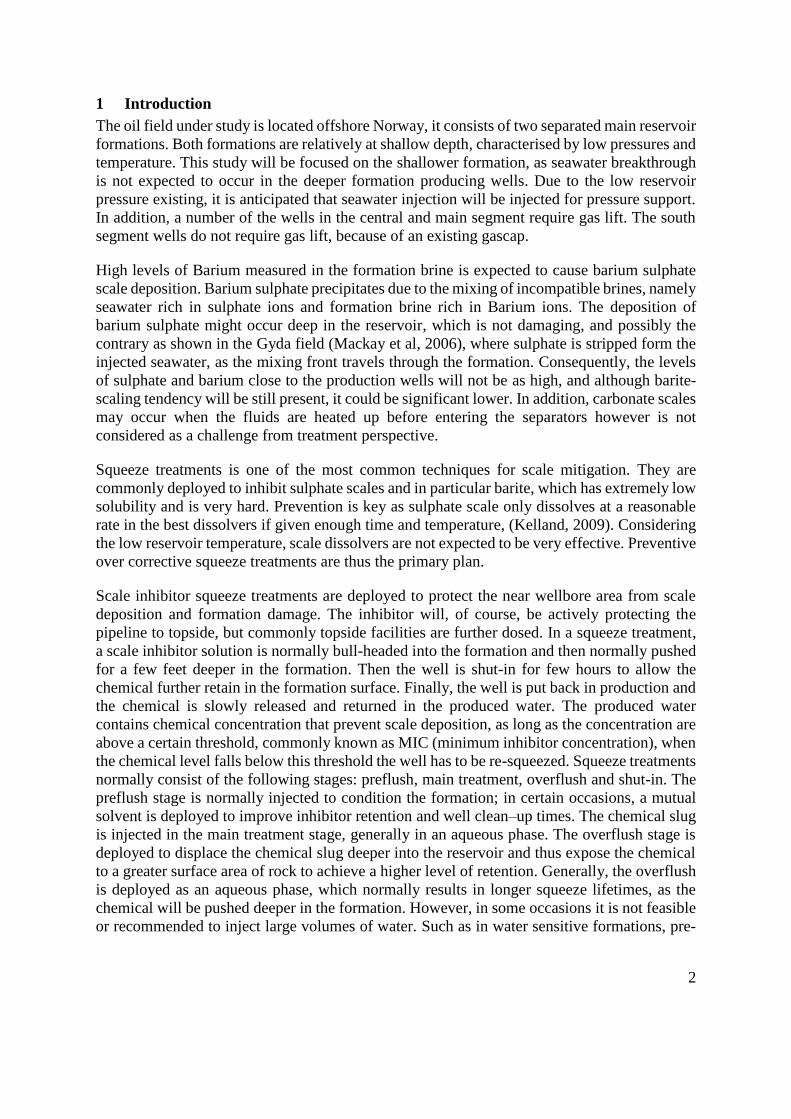
reaction to identify the impact of the occurrence of barite deposition in the reservoir on the
composition of the produced brine. Figure 2 shows the concentration of barium and sulphate
ions after barite precipitation versus seawater fraction for one of the wells, which is predicted
to produce significant volume of seawater.
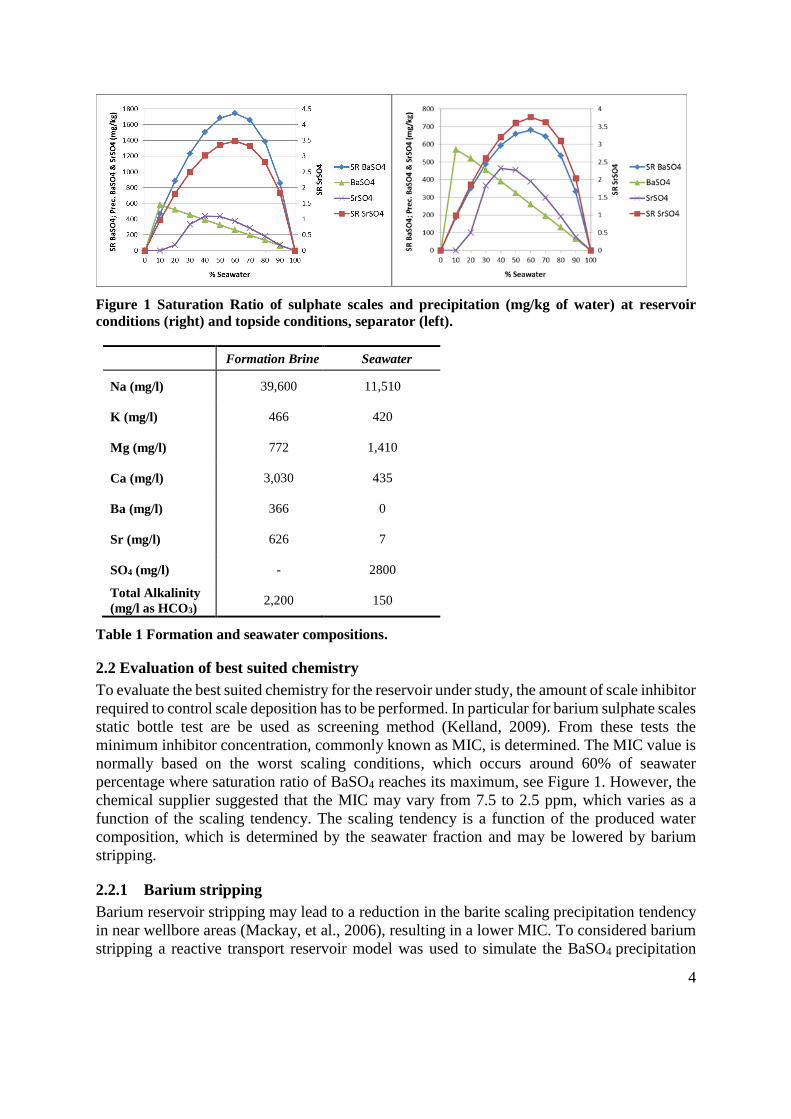
The estimated SR for barite and celestite and mass of deposits after barium stripping at
reservoir and topside facilities conditions (separator) can be found in Figure 3. As can be seen
the saturation ratio is almost six fold smaller for barite, while celestite is almost under-
saturated, translating in lower mass of deposits (approximately half) being formed. Barium
stripping may reduce the severity of the scaling tendency, and hence the chemical
concentrations required for inhibition.
Figure 2 Barium and sulphate concentrations predicted by reactive transport simulator for Well
A.
Figure 3 Saturation Ratio of sulphate scales and precipitation (mg/kg of water) at reservoir
conditions (right) and topside facilities conditions, separator (left).

6
2.3 Combined Scale management
The serious concern about the flow assurance situation related to scaling problems motivated
the implementation of a combined scale management, which may be divided in the following
sections.
2.3.1 Reservoir Simulation
The full field reservoir simulation is modified to extract the information about the reservoir to
assist scale management; in particular, the following can be predicted:
Seawater fraction per well versus production time
Injection and production profiles per well versus production time
Water/oil production rates over time for each well
The points listed above may be used to effectively design scale inhibitor squeeze treatments.
The seawater fraction is used to identify the seawater breakthrough timing, which normally
suggest the timing for the first squeeze treatment. The seawater breakthrough is considered to
occur when the seawater fraction is over 5%, when it is expected that sulphate scales may start
to deposit.
An important aspect to address is whether scale inhibitor could be placed in the scaling zones
in each well by bullheading, where coiled tubing is not an option, generally referred as easiness
of placement. To address this, the seawater fraction profile for each well can be extracted from
the reservoir simulation; examples will be shown later on.
The next step is to study injection profiles at different rates, normally relative high rates achieve
good placement, such as reaching the toe in a long horizontal well or high pressure zones. The
injection profile at the selected injection pump rate and production profile is then used to build
a near well squeeze simulator to simulate the scale inhibitor return concentration, which will
identify how long the treatment will last, since it is possible to predict at which point the
concentration level drops below the MIC. Furthermore, the squeeze treatment design may be
optimized to achieve the target protection, minimizing the volume of inhibitor injected and
possibly more critical, minimizing the volume of injected water.
The final point refers to the well water-cut, which is necessary for two phase flow calculations.
In many occasions the conventional treatment design process has been applied to near wellbore
modelling using the single-phase model (Børeng et al., 1994; Mackay et al., 2000; Mackay,
2001,;Mackay and Jordan., 2003; Sorbie et al., 1992, 1994; Yuan et al., 1993), considering
only water. However, to simulate non-conventional non-aqueous treatment, the two-phase flow
version needs to be applied, which considers the immiscible displacement of aqueous and non-
aqueous phases, which has been applied to simulate treatment designs before (Vazquez et al.,
2009b; Vazquez et al., 2011). The watercut is used to identify the water saturation at the time
of the treatment, using the water fractional flow equation.
2.3.2 Near Wellbore Squeeze Simulation
This is the final step, where the information extracted from the reservoir model is used to
perform near wellbore squeeze simulations. As discussed previously the timing of the first

7
treatment can be estimated. Then the injection and production profile are used to build the
simulation with the appropriate placement. The last step is to optimize the treatment, where
scale inhibitor concentration, main treatment and overflush volume can be minimize to achieve
the target protection, which corresponds to operational squeeze life. And finally using the two-
phase flow version of the near wellbore model to assess the feasibility of non-conventional
squeeze treatments, in particular, splitting the overflush between aqueous and non-aqueous
parts, where generally diesel is injected (Boagert et al., 2007; Jordan et al., 2001; Jordan et al.,
2008; Raju et al., 2010). The low reservoir pressure occurring is the main motivation to
introduce marine diesel in the split overflush, which will ease the restart of the wells. However,
it may present greater logistical challenges, in particular the handling and storage of significant
volumes of marine diesel in a platform and the extra associated costs.
2.3.3 Field Examples
In this section, two wells will be under study, where the methodology described in the section
before will be applied. As mentioned before, the first step is to determine seawater
breakthrough, as sulphate scales deposition is considered the main challenge in terms of
treatment. Seawater breakthrough is determined by modifying the reservoir model, where
seawater, connate water and aquifer water are tracked. Generally, connate and aquifer water
are considered to have the same ion composition, normally treated as formation brine.
Well A
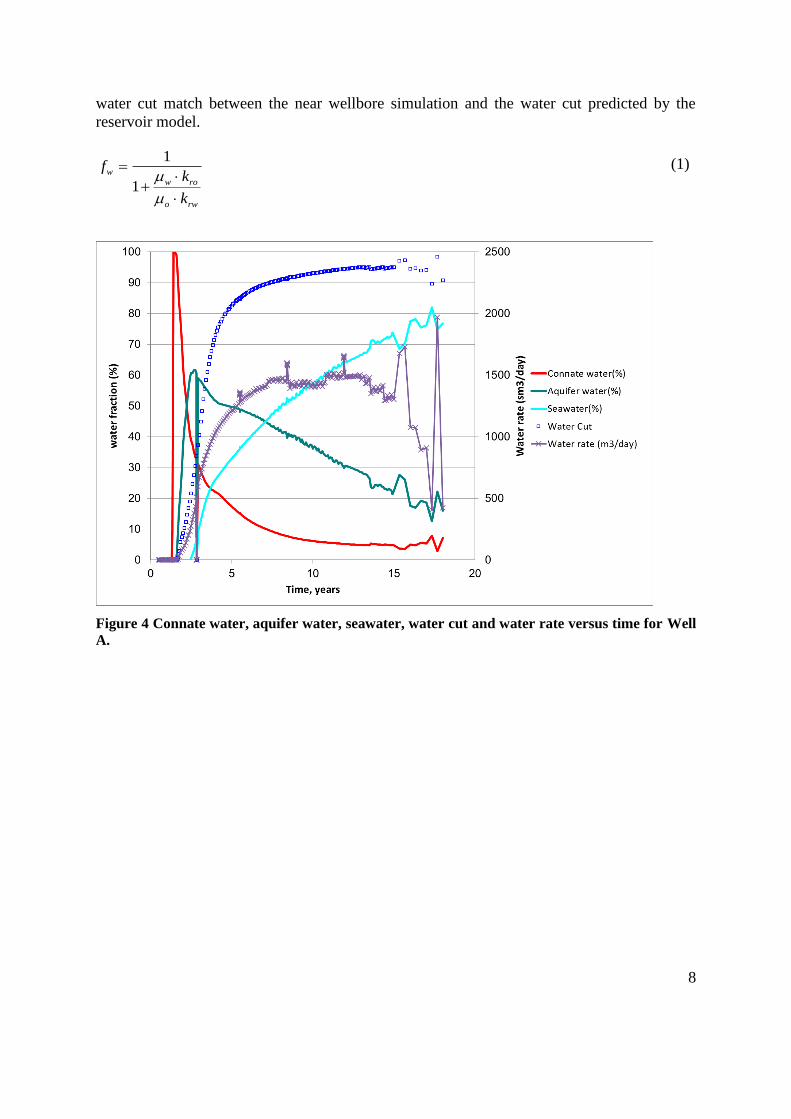
Figure 4 shows connate water, aquifer water, seawater, water cut and water rate versus time for
Well A, the graph encapsulates the main factors necessary to determine when a scale inhibition
treatment is necessary, which in this study is considered when the seawater fraction is above
5%. Water production and water-cut is included in the graph to evaluate the flow of the
different waters present in the reservoir. As mentioned before, namely connate, aquifer water
and seawater. The volume of water produced is used to evaluate the amount of mass of mineral
which may be deposited, and thus evaluate the risk of scale deposition. It is estimated that the
seawater breakthrough will occur in Well A, approximately after 3 years of production, despite
the relative low water cut of approximately 20%. The SR of Barite at 5% seawater fraction is
around 200, while celestite is under-saturated. In addition, the estimated mass of Barite, at the
predicted water production rate of 1,000sm3/day, is 290kg/day.
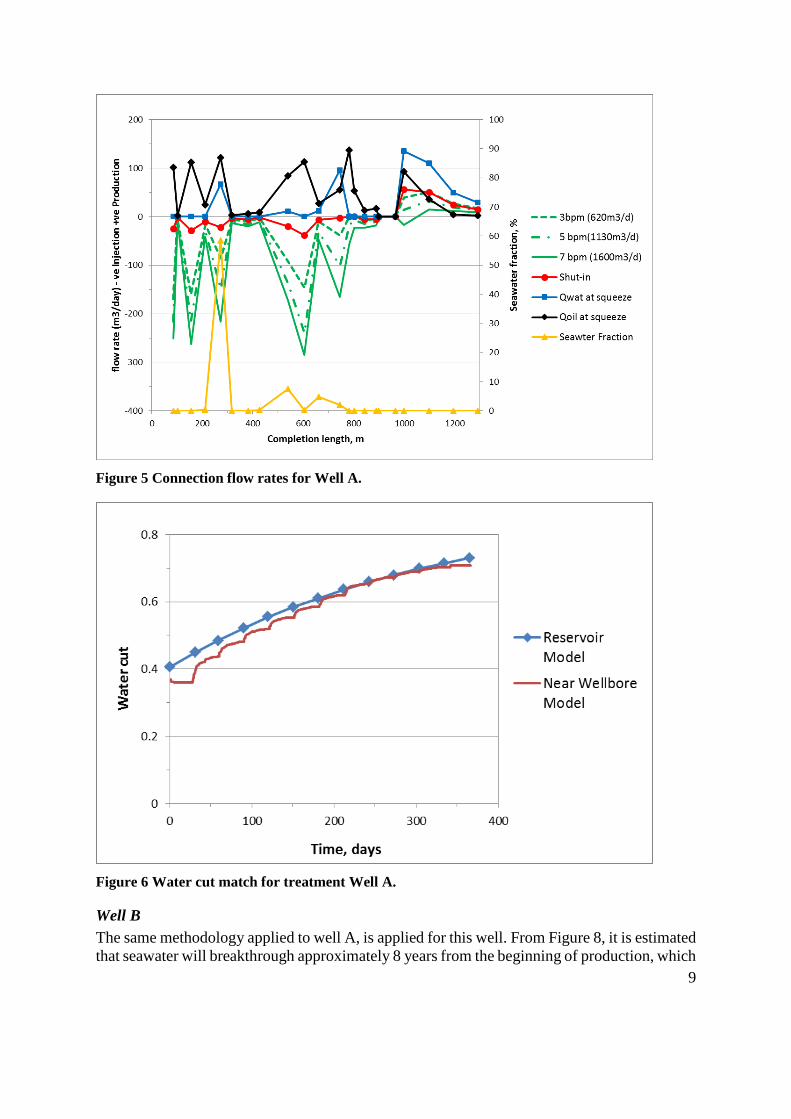
Seawater first breaks through the heel of the well, not the toe; see Figure 5. A bullhead squeeze
at 5 bpm would be adequate to ensure good placement in the heel and midsection of the well,
but the toe may be left unprotected. Therefore, it is recommended injecting at 7 bpm to achieve
full protection along the wellbore, as the toe of the well might be at higher pressure, as shown
in the shut-in profile.
Once the injection and production profile for the time of the treatment and the layering have
been identified, it is possible to build a near wellbore model. The next and last step is to match
the predicted water cut by the reservoir model, which is necessary to perform two phase flow
simulations. To match the well watercut, it is necessary to determine the layer water saturation
at the time of the treatment, which can be calculated from the fractional flow equation, equation
1, where capillary pressure is assumed to be negligible. The algorithm proposed by Vazquez
and co-authors (Vazquez et al., 2012) was adopted, where the layer water saturation is varied
honoring the kh (permeability height product) until a match is obtained, Figure 6 shows the
8
water cut match between the near wellbore simulation and the water cut predicted by the
reservoir model.
1
1w
w ro
o rw
fk
k
(1)
Figure 4 Connate water, aquifer water, seawater, water cut and water rate versus time for Well
A.
9
Figure 5 Connection flow rates for Well A.
Figure 6 Water cut match for treatment Well A.
Well B
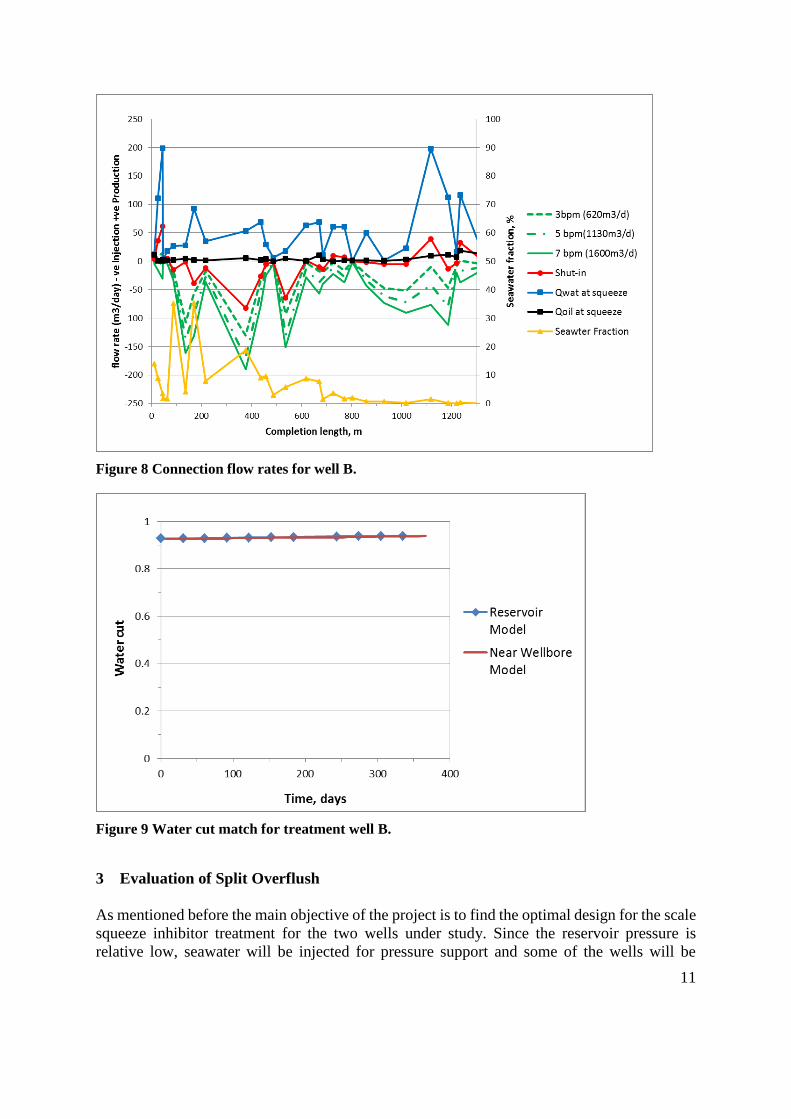
The same methodology applied to well A, is applied for this well. From Figure 8, it is estimated
that seawater will breakthrough approximately 8 years from the beginning of production, which
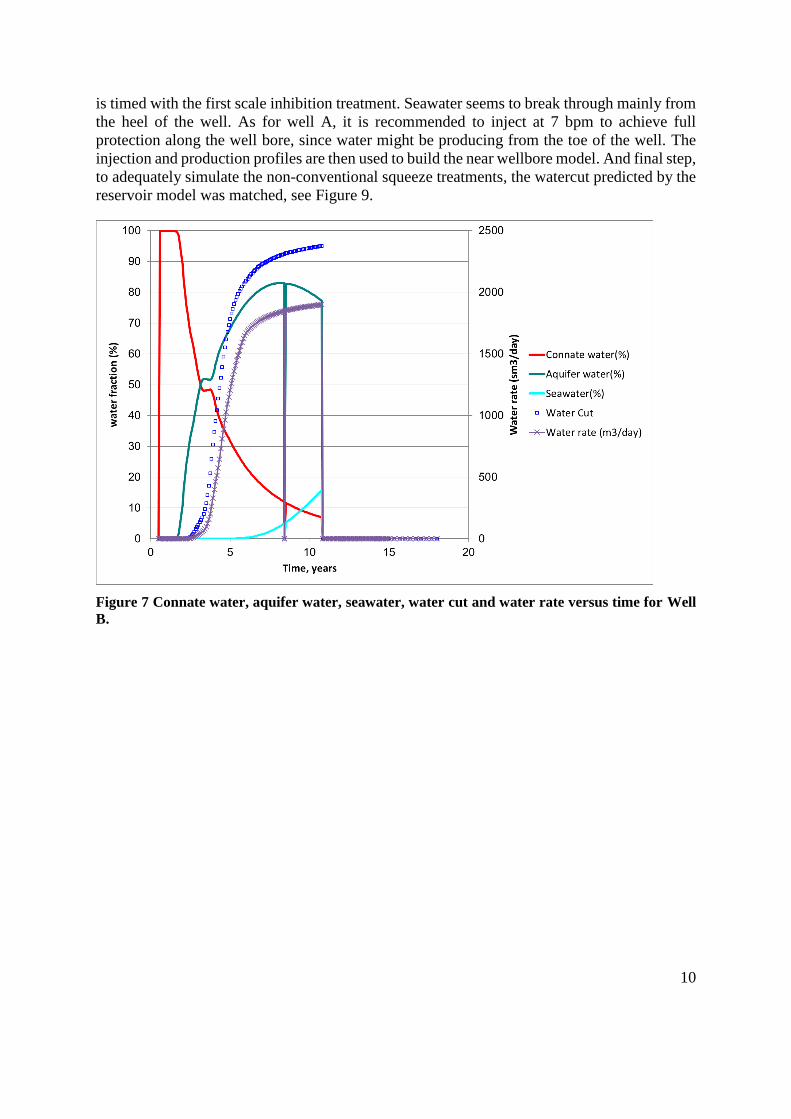
10
is timed with the first scale inhibition treatment. Seawater seems to break through mainly from
the heel of the well. As for well A, it is recommended to inject at 7 bpm to achieve full
protection along the well bore, since water might be producing from the toe of the well. The
injection and production profiles are then used to build the near wellbore model. And final step,
to adequately simulate the non-conventional squeeze treatments, the watercut predicted by the
reservoir model was matched, see Figure 9.
Figure 7 Connate water, aquifer water, seawater, water cut and water rate versus time for Well
B.
11
Figure 8 Connection flow rates for well B.
Figure 9 Water cut match for treatment well B.
3 Evaluation of Split Overflush
As mentioned before the main objective of the project is to find the optimal design for the scale
squeeze inhibitor treatment for the two wells under study. Since the reservoir pressure is
relative low, seawater will be injected for pressure support and some of the wells will be
12
assisted by gas lift. These facts motivated the introduction of diesel stages in order to minimize
the volume of water injected during the squeeze treatments, as water is denser than diesel, thus
easing the process to put the well back in production. A sensitivity study will be performed
studying the effect of splitting the overflush. The sensitivity calculations will be completed
using the near wellbore model built in the last section.
3.1 Scale inhibitor retention
Squeeze treatment consist in the injection of scale inhibitor in the formation, followed by a
shut-in stage that allows the further retention of the chemical. Then, when the well is back in
production and the chemical is slowly released in the flowing produced water. To fully describe
the squeeze treatment, it is necessary to simulate the retention process. In this study, it is
considered to be an adsorption process, which is described by an adsorption isotherm.
A scale inhibitor testing program is being carried out at the time of writing the paper based on
the predicted produced water compositions by the reservoir model. Coreflooding is considered
to be essential in chemical selection and in the design of the first squeeze treatment based on
the isotherm generated from the coreflooding test. However, several factors can affect the
accuracy of the predicted squeeze treatment behavior. Some of them are based on the nature of
the core flooding process: variations on lithology, differences between coreflood and near-
wellbore flow rates and temperatures, variations in production rates and flow profiles, and
changes in the produced fluid chemistry (Mackay and Jordan, 2003).
Meanwhile, an isotherm from a sister field with similar water chemistries and rock
characteristics are being used in order to run the simulations. At this stage, the information
from previous field experience is the most accurate information that can be used. Afterwards,
the squeeze treatment lifetime estimates can be compared with the isotherm derived from
coreflood data.
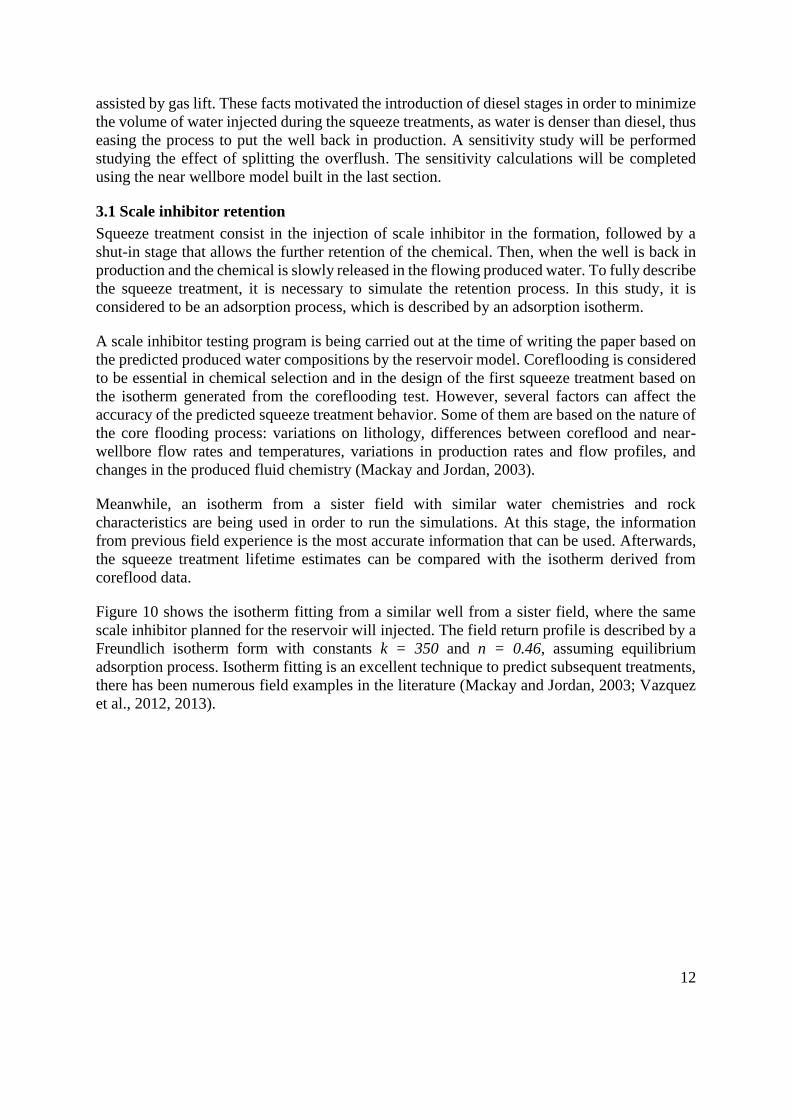
Figure 10 shows the isotherm fitting from a similar well from a sister field, where the same
scale inhibitor planned for the reservoir will injected. The field return profile is described by a
Freundlich isotherm form with constants k = 350 and n = 0.46, assuming equilibrium
adsorption process. Isotherm fitting is an excellent technique to predict subsequent treatments,
there has been numerous field examples in the literature (Mackay and Jordan, 2003; Vazquez
et al., 2012, 2013).
13
Figure 10 Isotherm fitting from a well part of a sister field.
3.2 Preliminary squeeze design
In this section, the methodology to design a squeeze treatment accounting for the operator goal
to squeeze twice per year with a downtime of 3 days or three times with 2 days downtime will
be described.
In the calculations, the main target will be to achieve 6 months squeeze treatment for 5ppm
MIC. The study starts with a relatively modest design, see Table 1. This preliminary design
was used to perform some preliminary calculations to evaluate the effect of splitting the
overflush. Then a series of sensitivity calculations will be performed to identify the target
squeeze design.
In all cases under study, the scale inhibitor is delivered into the formation in an aqueous
solution. The chemical slug will be bullheaded at 7 bpm, which will describe the placement.
This flow rate is achieved with a bullhead treatment through the production lines which can
handle higher flow rates than the typical service lines. The three values for the MIC suggested
by the chemical supplier are 7.5, 5 and 2.5 ppm.
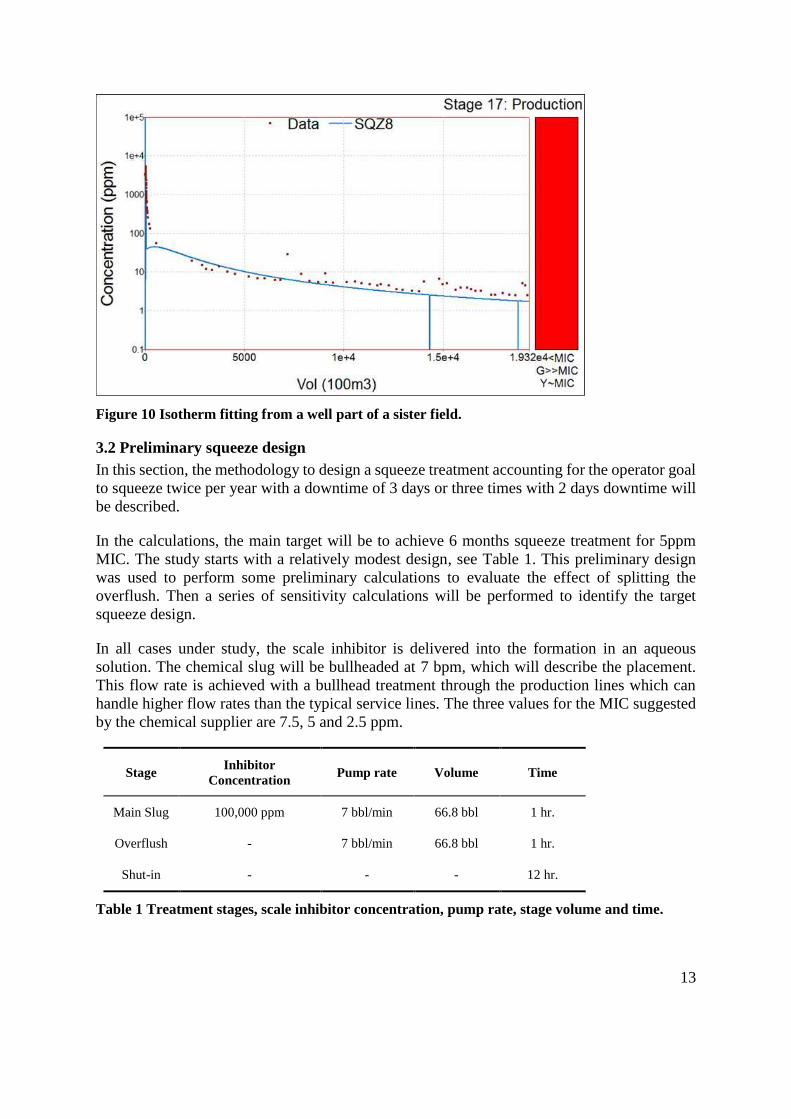
Stage Inhibitor
Concentration Pump rate Volume Time
Main Slug 100,000 ppm 7 bbl/min 66.8 bbl 1 hr.
Overflush - 7 bbl/min 66.8 bbl 1 hr.
Shut-in - - - 12 hr.
Table 1 Treatment stages, scale inhibitor concentration, pump rate, stage volume and time.
14
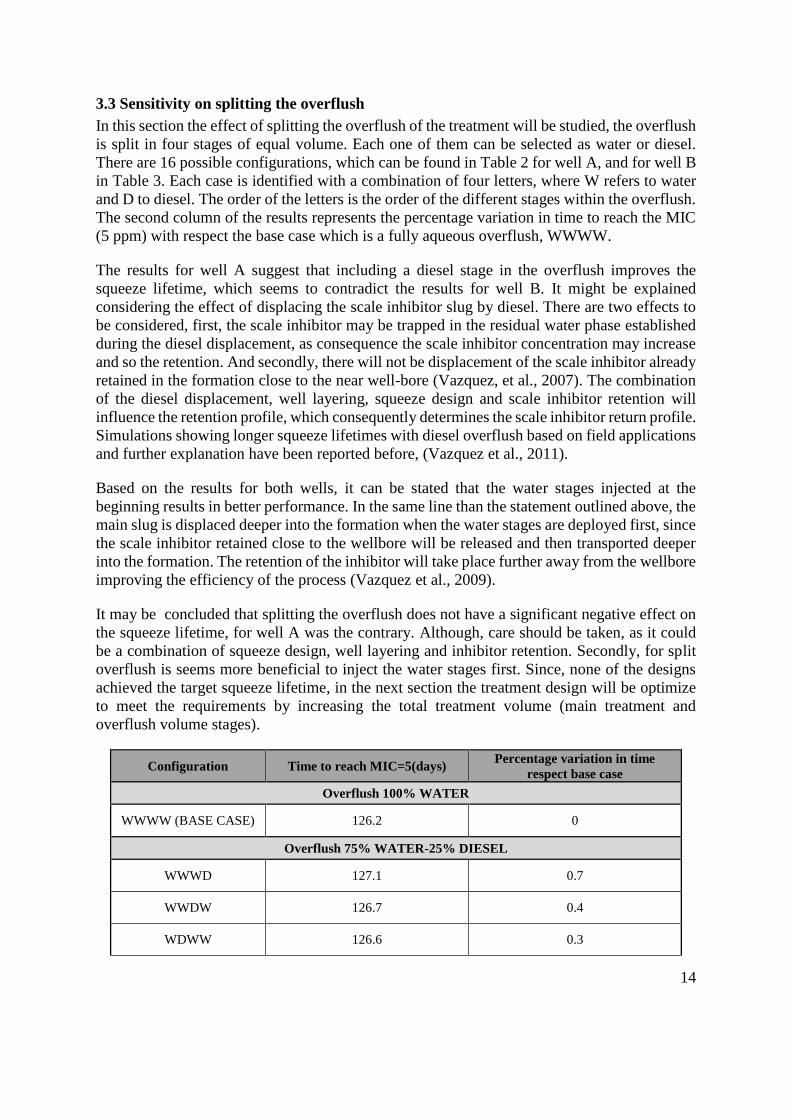
3.3 Sensitivity on splitting the overflush
In this section the effect of splitting the overflush of the treatment will be studied, the overflush
is split in four stages of equal volume. Each one of them can be selected as water or diesel.
There are 16 possible configurations, which can be found in Table 2 for well A, and for well B
in Table 3. Each case is identified with a combination of four letters, where W refers to water
and D to diesel. The order of the letters is the order of the different stages within the overflush.
The second column of the results represents the percentage variation in time to reach the MIC
(5 ppm) with respect the base case which is a fully aqueous overflush, WWWW.
The results for well A suggest that including a diesel stage in the overflush improves the
squeeze lifetime, which seems to contradict the results for well B. It might be explained
considering the effect of displacing the scale inhibitor slug by diesel. There are two effects to
be considered, first, the scale inhibitor may be trapped in the residual water phase established
during the diesel displacement, as consequence the scale inhibitor concentration may increase
and so the retention. And secondly, there will not be displacement of the scale inhibitor already
retained in the formation close to the near well-bore (Vazquez, et al., 2007). The combination
of the diesel displacement, well layering, squeeze design and scale inhibitor retention will
influence the retention profile, which consequently determines the scale inhibitor return profile.
Simulations showing longer squeeze lifetimes with diesel overflush based on field applications
and further explanation have been reported before, (Vazquez et al., 2011).
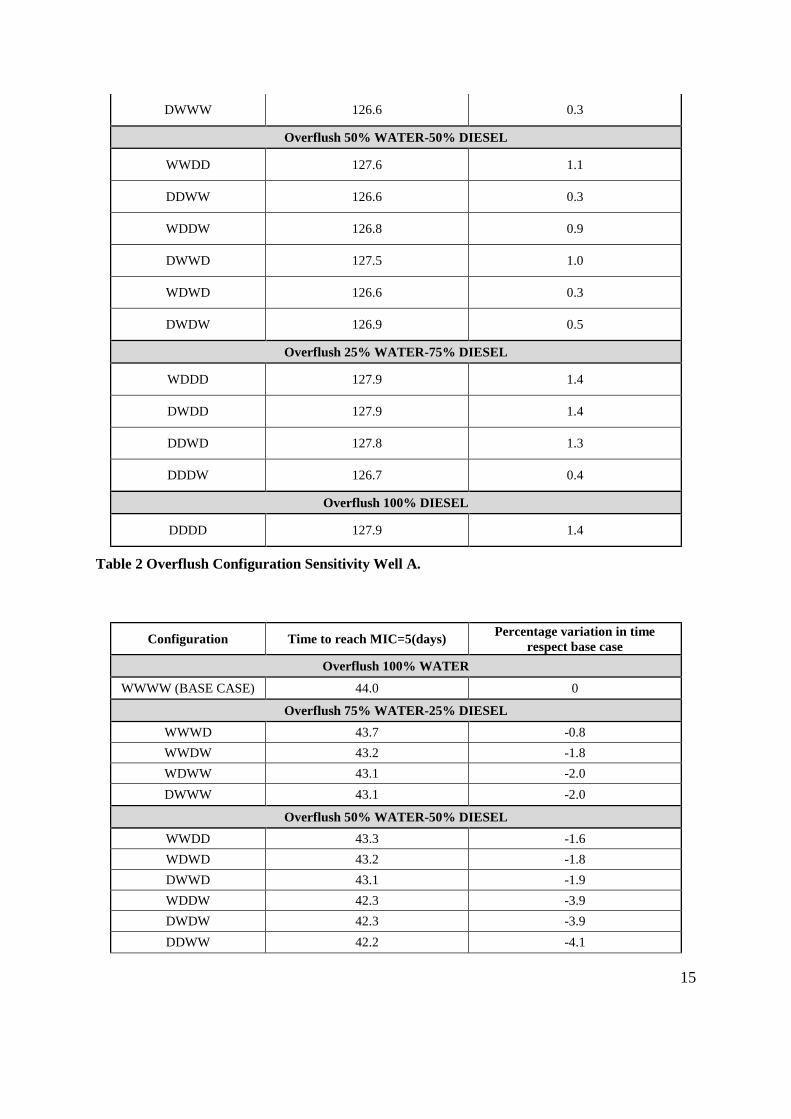
Based on the results for both wells, it can be stated that the water stages injected at the
beginning results in better performance. In the same line than the statement outlined above, the
main slug is displaced deeper into the formation when the water stages are deployed first, since
the scale inhibitor retained close to the wellbore will be released and then transported deeper
into the formation. The retention of the inhibitor will take place further away from the wellbore
improving the efficiency of the process (Vazquez et al., 2009).
It may be concluded that splitting the overflush does not have a significant negative effect on
the squeeze lifetime, for well A was the contrary. Although, care should be taken, as it could
be a combination of squeeze design, well layering and inhibitor retention. Secondly, for split
overflush is seems more beneficial to inject the water stages first. Since, none of the designs
achieved the target squeeze lifetime, in the next section the treatment design will be optimize
to meet the requirements by increasing the total treatment volume (main treatment and
overflush volume stages).
Configuration Time to reach MIC=5(days) Percentage variation in time
respect base case
Overflush 100% WATER
WWWW (BASE CASE) 126.2 0
Overflush 75% WATER-25% DIESEL
WWWD 127.1 0.7
WWDW 126.7 0.4
WDWW 126.6 0.3
15
DWWW 126.6 0.3
Overflush 50% WATER-50% DIESEL
WWDD 127.6 1.1
DDWW 126.6 0.3
WDDW 126.8 0.9
DWWD 127.5 1.0
WDWD 126.6 0.3
DWDW 126.9 0.5
Overflush 25% WATER-75% DIESEL
WDDD 127.9 1.4
DWDD 127.9 1.4
DDWD 127.8 1.3
DDDW 126.7 0.4
Overflush 100% DIESEL
DDDD 127.9 1.4
Table 2 Overflush Configuration Sensitivity Well A.
Configuration Time to reach MIC=5(days) Percentage variation in time
respect base case
Overflush 100% WATER
WWWW (BASE CASE) 44.0 0
Overflush 75% WATER-25% DIESEL
WWWD 43.7 -0.8
WWDW 43.2 -1.8
WDWW 43.1 -2.0
DWWW 43.1 -2.0
Overflush 50% WATER-50% DIESEL
WWDD 43.3 -1.6
WDWD 43.2 -1.8
DWWD 43.1 -1.9
WDDW 42.3 -3.9
DWDW 42.3 -3.9
DDWW 42.2 -4.1

16
Overflush 25% WATER-75% DIESEL
WDDD 42.4 -3.7
DWDD 42.4 -3.7
DDWD 42.3 -3.9
DDDW 41.0 -6.8
Overflush 100% DIESEL
DDDD 41.1 -6.6
Table 3 Overflush Configuration Sensitivity Well B.
3.4 Treatment Volume
The objective of this section is to determine the optimum total treatment volume. Firstly, the
treatment volume is increased gradually keeping the proportion of main slug and overflush
constant and equal, i.e. 50% main slug and 50 % overflush. Table 4 shows how the squeeze
lifetime increases as function of the total treatment volume for the base configuration WWWW
for well A, where the target lifetime is reached for MIC= 5ppm, after injecting 267 bbls, twice
the original total treatment volume; and 1,068 bbls (8 times) for well B, as shown in Table 5.
Total Treatment
Volume
Time to reach MIC=7.5
(days)
Time to reach MIC=5
(days)
Time to reach MIC=2.5
(days)
133.56 bbls 98.6 126.2 197.5
267.12 bbls 148.5 187.1 304.5
Table 4 Total Volume Treatment effect on squeeze lifetime considering configuration WWWW
for well A.
Total Treatment
Volume
Time to reach MIC=7.5
(days)
Time to reach MIC=5
(days)
Time to reach MIC=2.5
(days)
133.56 bbls 33.5 44.0 69.7
267.12 bbls 51.4 66.7 103.5
534.24 bbls 79.9 103.9 161.5
801.36 bbls 107.0 137.5 210.2
1068.48 bbls 137.3 176.9 271.0
Table 5 Total Volume Treatment effect on squeeze lifetime considering configuration WWWW
for well B.
Once the optimum treatment volume has been identified, the next step is to evaluate the effect
of diesel configurations on the squeeze lifetime, assuming water is injected first. Table 6 shows
the squeeze lifetime for configurations with the water stages injected at the beginning for well
A, and Table 7 for well B. The results for well A and B are as expected, where the squeeze

17
lifetime reduces with the injection of diesel. For well A is only a small percentage, less than
10% in the worst case. For well B, the worst case is almost 20%.
Overflush Configuration Time to reach MIC=7.5
(days)
Time to reach MIC=5
(days)
Time to reach
MIC=2.5 (days)
WWWW (0% DIESEL) 148. 187.1 304.5
WWWD (25% DIESEL) 149.1 187.8 304.5
WWDD (50% DIESEL) 147.3 186.4 303.9
WDDD (75% DIESEL) 143.5 182.5 298.8
DDDD (100% DIESEL) 136.3 181.4 280.3
Table 6 Total Volume Treatment of (267.12 bbls) effect on squeeze lifetime considering diesel
configurations for well A.
Overflush Configuration Time to reach MIC=7.5
(days)
Time to reach MIC=5
(days)
Time to reach
MIC=2.5 (days)
WWWW (0% DIESEL) 137.3 177.0 271.0
WWWD (25% DIESEL) 137.3 176.9 271.0
WWDD (50% DIESEL) 134.2 172.7 264.6
WDDD (75% DIESEL) 125.3 161.1 247.0
DDDD (100% DIESEL) 111.6 142.7 216.9
Table 7 Total Volume Treatment of (1,068bbls) effect on squeeze lifetime considering diesel
configurations for well B.
3.5 Overflush and Main Slug Volumes Sensitivities
Once identified the optimum total treatment volume for well A and B, twice and 8 fold the
original volume (267 and 1,068bbls respectively), the optimum ratio between the main
treatment and overflush volume may be found. Two set of calculations will be shown,
considering 5ppm MIC. First, studying the effect of divide the total treatment volume between
main slug and overflush, the base case is 50-50 split between main slug and overflush. The
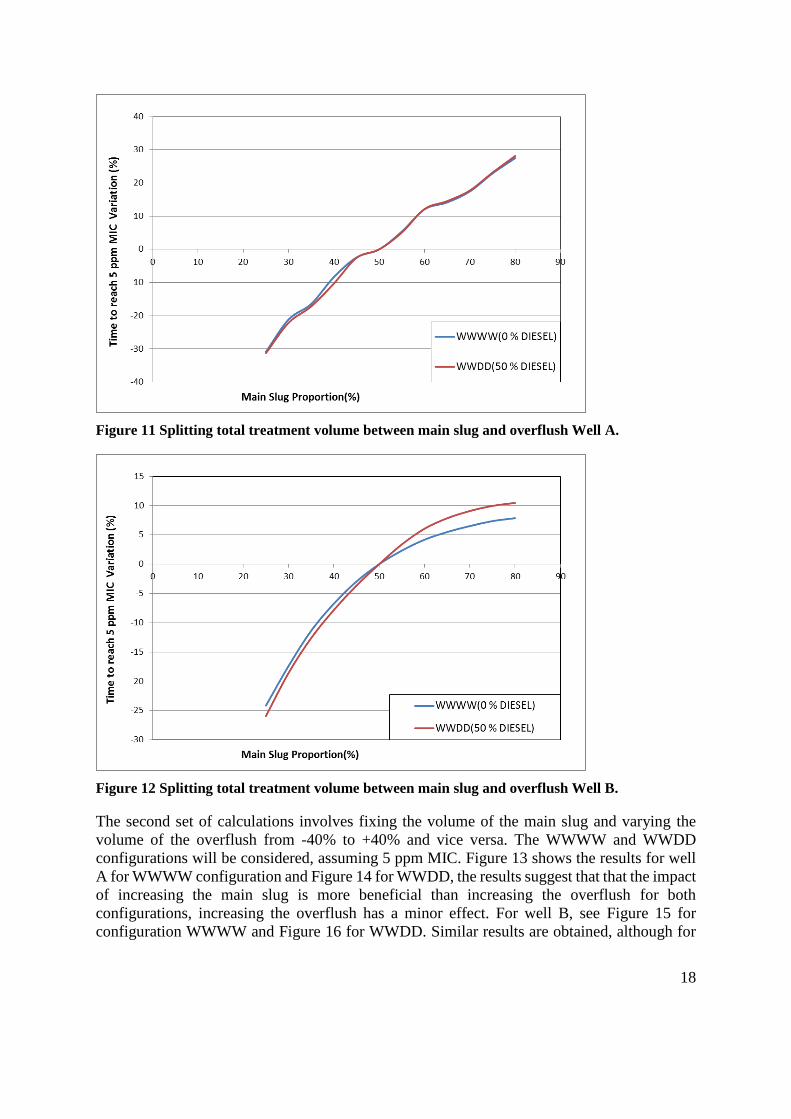
results seem to suggest that increasing the main slug over the overflush increases the squeeze
lifetime, which is expected as the volume of scale inhibitor is increased, however the extra
squeeze lifetime is moderate for both configurations, see Figure 11 for well A and Figure 12
for well B. Bearing in mind that the 80% main slug configuration implies injecting 60% more
chemical, squeeze lifetime is extended 30% for well A and merely 10% for well B.
18
Figure 11 Splitting total treatment volume between main slug and overflush Well A.
Figure 12 Splitting total treatment volume between main slug and overflush Well B.
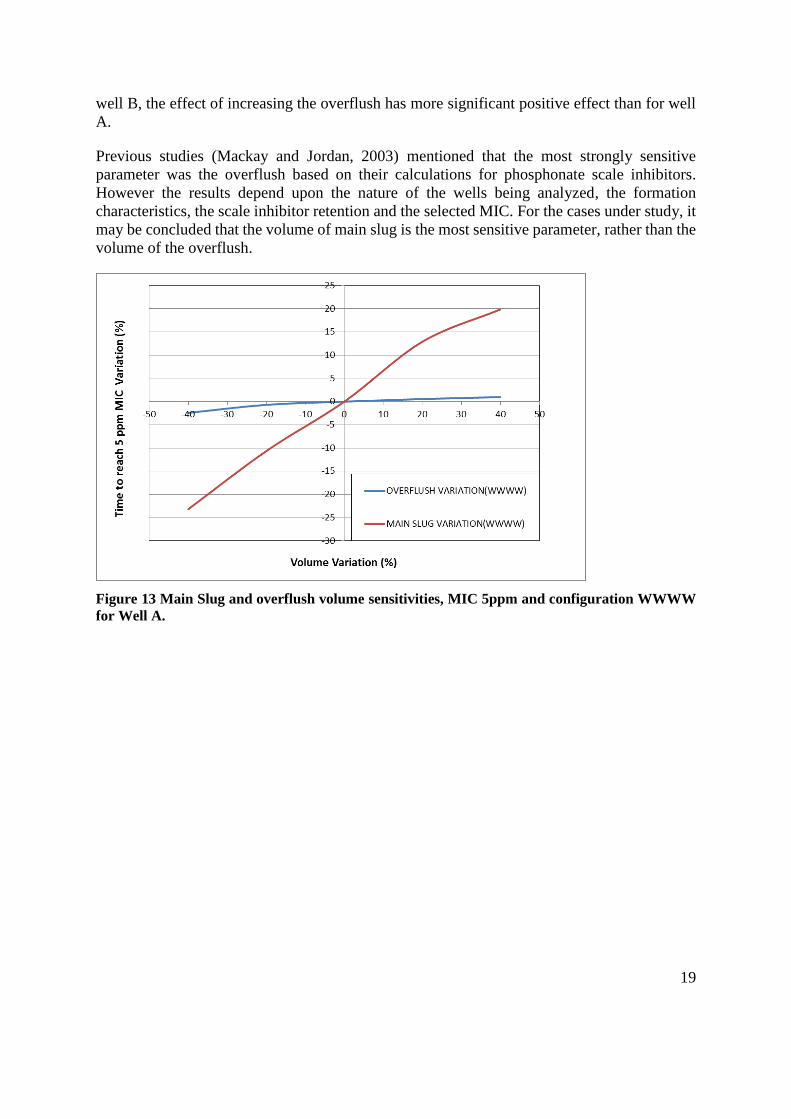
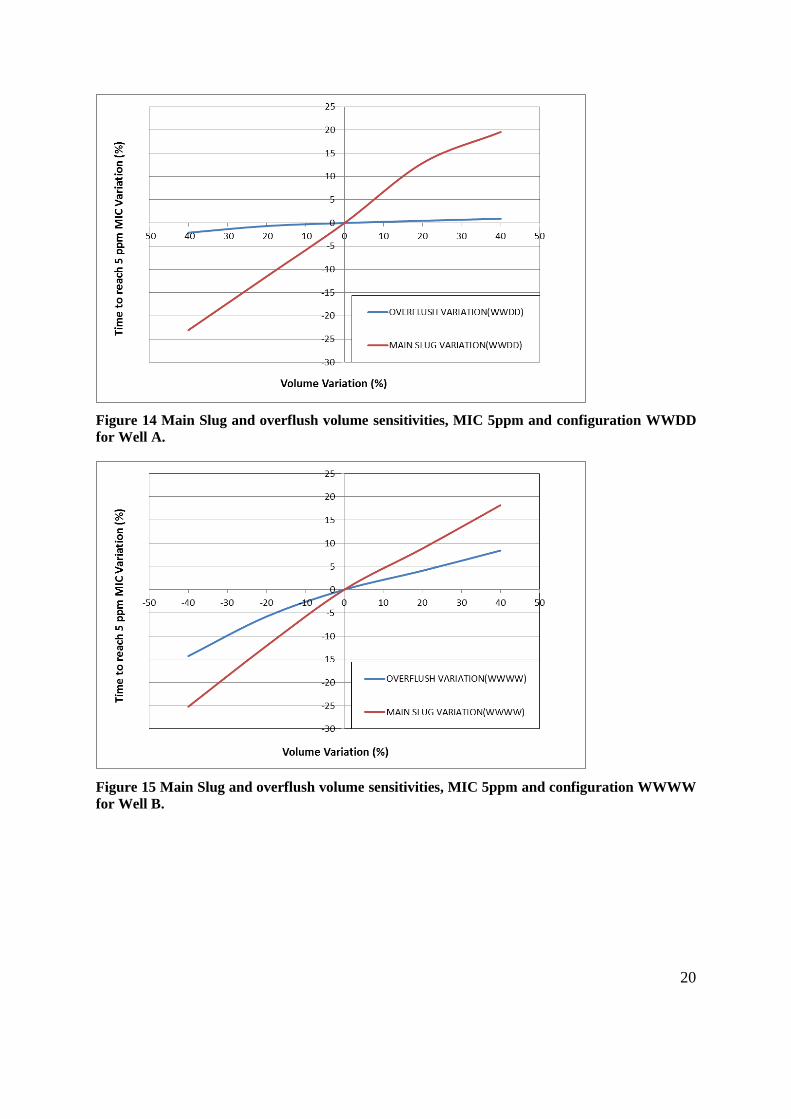
The second set of calculations involves fixing the volume of the main slug and varying the
volume of the overflush from -40% to +40% and vice versa. The WWWW and WWDD
configurations will be considered, assuming 5 ppm MIC. Figure 13 shows the results for well
A for WWWW configuration and Figure 14 for WWDD, the results suggest that that the impact
of increasing the main slug is more beneficial than increasing the overflush for both
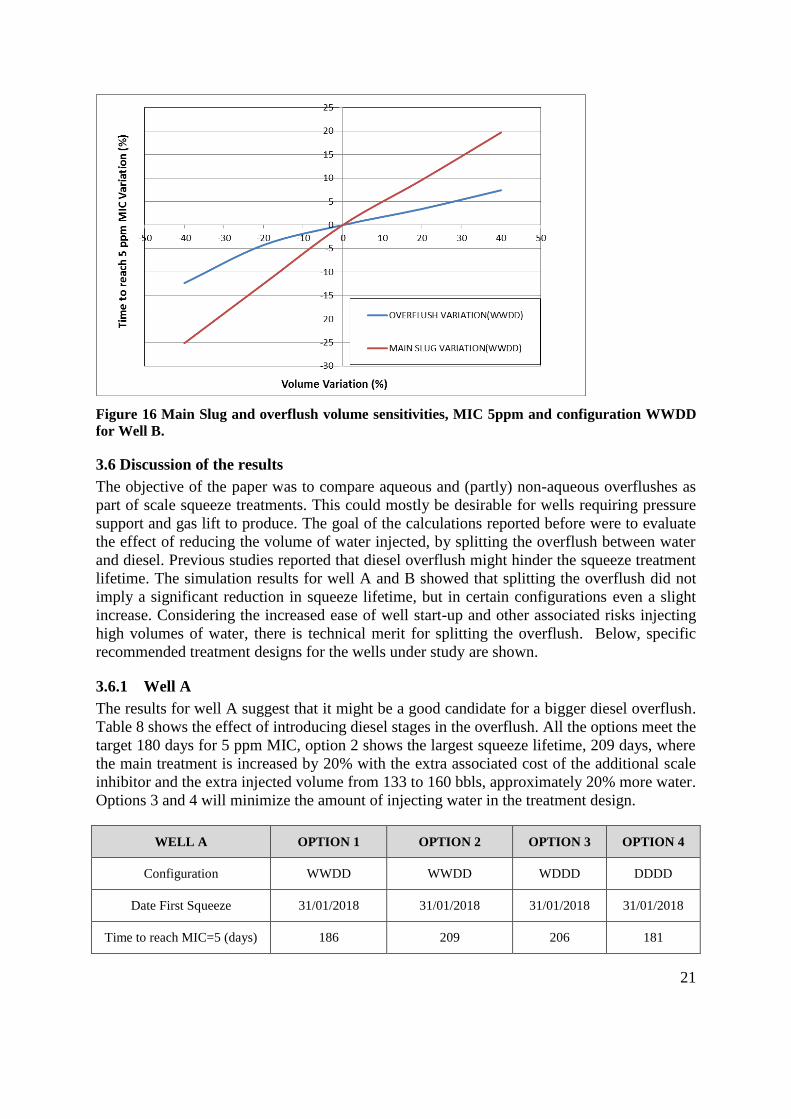
configurations, increasing the overflush has a minor effect. For well B, see Figure 15 for
configuration WWWW and Figure 16 for WWDD. Similar results are obtained, although for
19
well B, the effect of increasing the overflush has more significant positive effect than for well
A.
Previous studies (Mackay and Jordan, 2003) mentioned that the most strongly sensitive
parameter was the overflush based on their calculations for phosphonate scale inhibitors.
However the results depend upon the nature of the wells being analyzed, the formation
characteristics, the scale inhibitor retention and the selected MIC. For the cases under study, it
may be concluded that the volume of main slug is the most sensitive parameter, rather than the
volume of the overflush.
Figure 13 Main Slug and overflush volume sensitivities, MIC 5ppm and configuration WWWW
for Well A.
20
Figure 14 Main Slug and overflush volume sensitivities, MIC 5ppm and configuration WWDD
for Well A.
Figure 15 Main Slug and overflush volume sensitivities, MIC 5ppm and configuration WWWW
for Well B.
21
Figure 16 Main Slug and overflush volume sensitivities, MIC 5ppm and configuration WWDD
for Well B.
3.6 Discussion of the results
The objective of the paper was to compare aqueous and (partly) non-aqueous overflushes as
part of scale squeeze treatments. This could mostly be desirable for wells requiring pressure
support and gas lift to produce. The goal of the calculations reported before were to evaluate
the effect of reducing the volume of water injected, by splitting the overflush between water
and diesel. Previous studies reported that diesel overflush might hinder the squeeze treatment
lifetime. The simulation results for well A and B showed that splitting the overflush did not
imply a significant reduction in squeeze lifetime, but in certain configurations even a slight
increase. Considering the increased ease of well start-up and other associated risks injecting
high volumes of water, there is technical merit for splitting the overflush. Below, specific
recommended treatment designs for the wells under study are shown.
3.6.1 Well A
The results for well A suggest that it might be a good candidate for a bigger diesel overflush.
Table 8 shows the effect of introducing diesel stages in the overflush. All the options meet the
target 180 days for 5 ppm MIC, option 2 shows the largest squeeze lifetime, 209 days, where
the main treatment is increased by 20% with the extra associated cost of the additional scale
inhibitor and the extra injected volume from 133 to 160 bbls, approximately 20% more water.
Options 3 and 4 will minimize the amount of injecting water in the treatment design.
WELL A OPTION 1 OPTION 2 OPTION 3 OPTION 4
Configuration WWDD WWDD WDDD DDDD
Date First Squeeze 31/01/2018 31/01/2018 31/01/2018 31/01/2018
Time to reach MIC=5 (days) 186 209 206 181
22
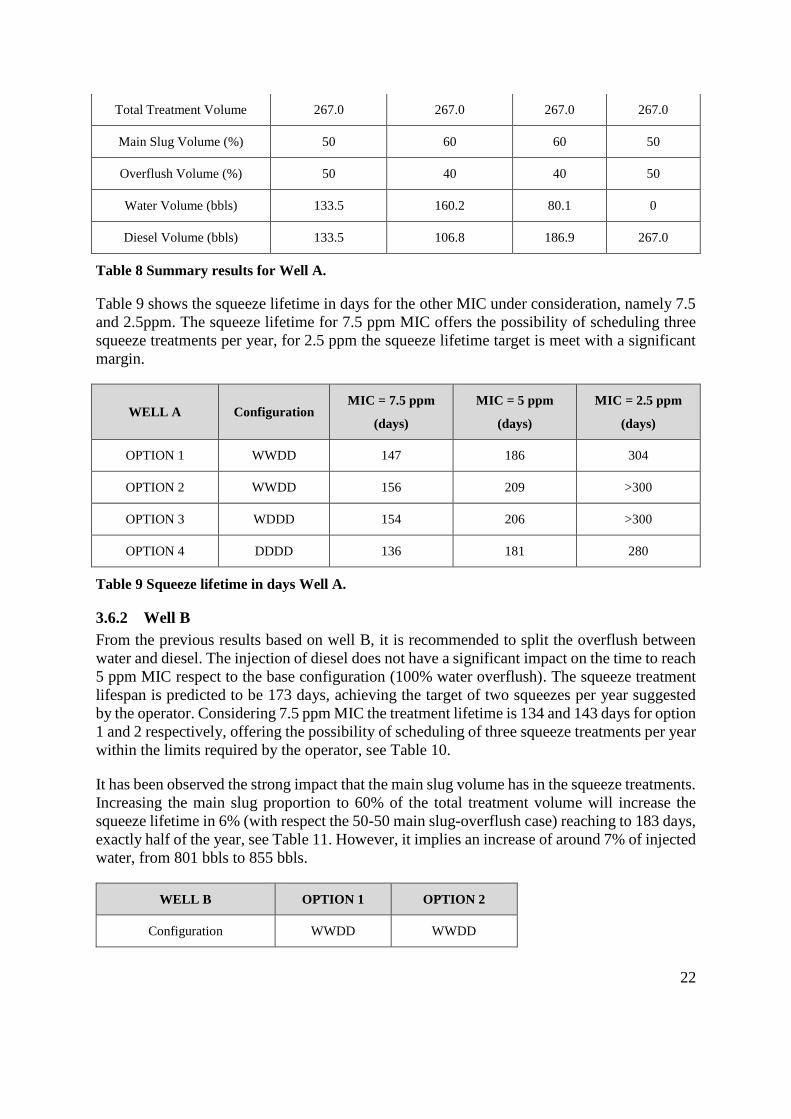
Total Treatment Volume 267.0 267.0 267.0 267.0
Main Slug Volume (%) 50 60 60 50
Overflush Volume (%) 50 40 40 50
Water Volume (bbls) 133.5 160.2 80.1 0
Diesel Volume (bbls) 133.5 106.8 186.9 267.0
Table 8 Summary results for Well A.
Table 9 shows the squeeze lifetime in days for the other MIC under consideration, namely 7.5
and 2.5ppm. The squeeze lifetime for 7.5 ppm MIC offers the possibility of scheduling three
squeeze treatments per year, for 2.5 ppm the squeeze lifetime target is meet with a significant
margin.
WELL A Configuration MIC = 7.5 ppm
(days)
MIC = 5 ppm
(days)
MIC = 2.5 ppm
(days)
OPTION 1 WWDD 147 186 304
OPTION 2 WWDD 156 209 >300
OPTION 3 WDDD 154 206 >300
OPTION 4 DDDD 136 181 280
Table 9 Squeeze lifetime in days Well A.
3.6.2 Well B
From the previous results based on well B, it is recommended to split the overflush between
water and diesel. The injection of diesel does not have a significant impact on the time to reach
5 ppm MIC respect to the base configuration (100% water overflush). The squeeze treatment
lifespan is predicted to be 173 days, achieving the target of two squeezes per year suggested
by the operator. Considering 7.5 ppm MIC the treatment lifetime is 134 and 143 days for option
1 and 2 respectively, offering the possibility of scheduling of three squeeze treatments per year
within the limits required by the operator, see Table 10.
It has been observed the strong impact that the main slug volume has in the squeeze treatments.
Increasing the main slug proportion to 60% of the total treatment volume will increase the
squeeze lifetime in 6% (with respect the 50-50 main slug-overflush case) reaching to 183 days,
exactly half of the year, see Table 11. However, it implies an increase of around 7% of injected
water, from 801 bbls to 855 bbls.
WELL B OPTION 1 OPTION 2
Configuration WWDD WWDD
23
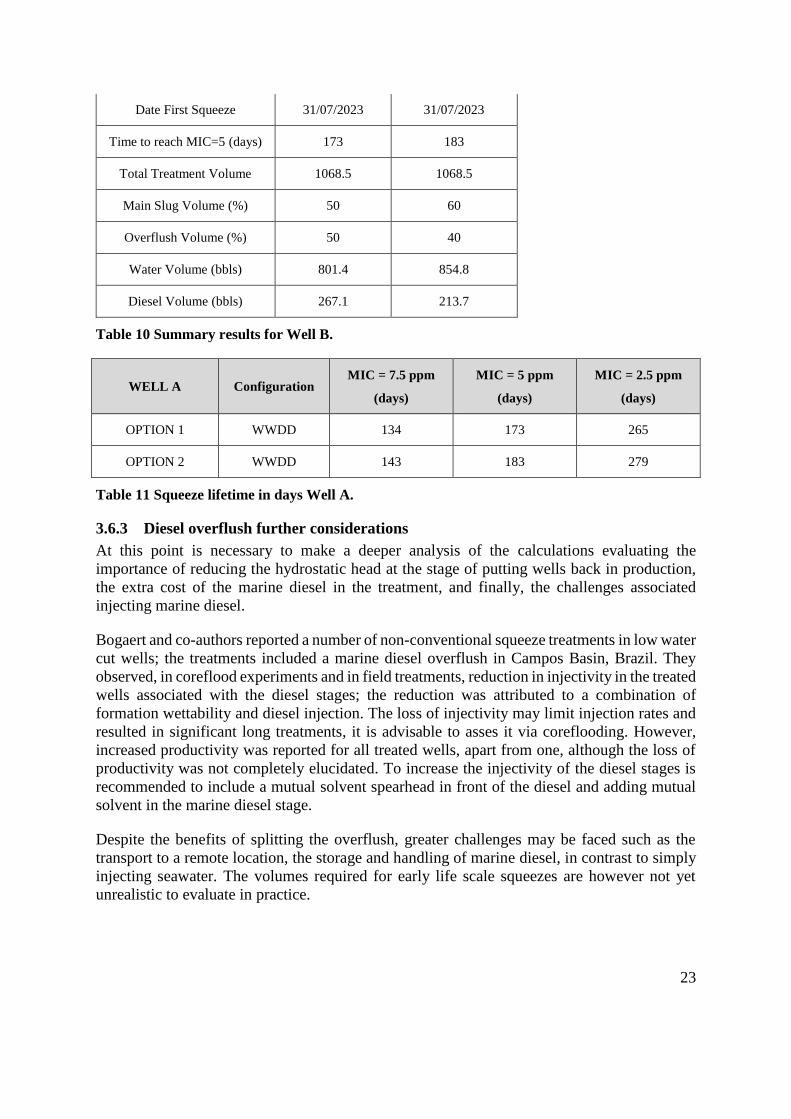
Date First Squeeze 31/07/2023 31/07/2023
Time to reach MIC=5 (days) 173 183
Total Treatment Volume 1068.5 1068.5
Main Slug Volume (%) 50 60
Overflush Volume (%) 50 40
Water Volume (bbls) 801.4 854.8
Diesel Volume (bbls) 267.1 213.7
Table 10 Summary results for Well B.
WELL A Configuration MIC = 7.5 ppm
(days)
MIC = 5 ppm
(days)
MIC = 2.5 ppm
(days)
OPTION 1 WWDD 134 173 265
OPTION 2 WWDD 143 183 279
Table 11 Squeeze lifetime in days Well A.
3.6.3 Diesel overflush further considerations
At this point is necessary to make a deeper analysis of the calculations evaluating the
importance of reducing the hydrostatic head at the stage of putting wells back in production,
the extra cost of the marine diesel in the treatment, and finally, the challenges associated
injecting marine diesel.
Bogaert and co-authors reported a number of non-conventional squeeze treatments in low water
cut wells; the treatments included a marine diesel overflush in Campos Basin, Brazil. They
observed, in coreflood experiments and in field treatments, reduction in injectivity in the treated
wells associated with the diesel stages; the reduction was attributed to a combination of
formation wettability and diesel injection. The loss of injectivity may limit injection rates and
resulted in significant long treatments, it is advisable to asses it via coreflooding. However,
increased productivity was reported for all treated wells, apart from one, although the loss of
productivity was not completely elucidated. To increase the injectivity of the diesel stages is
recommended to include a mutual solvent spearhead in front of the diesel and adding mutual
solvent in the marine diesel stage.
Despite the benefits of splitting the overflush, greater challenges may be faced such as the
transport to a remote location, the storage and handling of marine diesel, in contrast to simply
injecting seawater. The volumes required for early life scale squeezes are however not yet
unrealistic to evaluate in practice.
24
4 Conclusions
Thanks to extensive reservoir modelling an estimate of time, location and severity barium
sulphate scaling is available. A scale management plan has been developed which include scale
squeezes to inhibit scaling in the near well-bore area of the producing wells facing sulphate
scales deposits.
The design of the scale squeeze treatments for two wells has been described with the operator
target, consisting of two squeezes per year with a downtime of three days per squeeze
treatment, or three per year with a downtime of two days per squeeze treatment. A key issue in
the defining the design of these treatments is the inclusion of marine diesel stages in the
overflush stage. Due the low reservoir pressure, some wells will be assisted by gas lift, therefore
it is recommended to include non-aqueous (marine diesel) stage in the overflush to reduce the
hydrostatic head, in contrast to a fully aqueous overflush.
Including diesel stages did not significantly reduce the squeeze lifetime, where even in some
configurations was slighted extended. Loss of injectivity after injecting marine diesel after
water in field squeeze treatments has been reported, which may attributed to the formation
wettability. Thus, it is recommended to include a mutual solvent spearhead before diesel stages.
5 References
Bogaert, P., Berredo, M.C., Toschi, C.; Morgenthaler, L., Bryson, B.; Frigo, D.M.; Jordan,
M.M., and Afonso, M., 2007. “Scale Inhibitor Squeeze Treatments Deployed From an FPSO
in Deepwater Subsea Fields in the Campos Basin”, SPE 102503, SPE Production & Operations,
Volume 22, Number 4, pp. 451-471.
Børeng, R., Sorbie, K.S. and Yuan, M.D., 1994. The Underlying Theory and Modelling of
Scale Inhibitor Squeezes in Three Offshore Wells on the Norwegian Continental Shelf,
Proceedings of the Fifth International Oilfield Chemicals Symposium, Geilo, Norway, 20-23
March.
Jordan, M.M., Graff, C.J. and Cooper, K.N., 2001. Deployment of a Scale Squeeze Enhancer
and Oil-Soluble Scale Inhibitor to Avoid Oil Production Losses in Low Water-Cut Well. SPE
Production & Facilities, 16(4): 267-276.
Jordan, M., Mackay, E. & Vazquez, O., 2008. The Influence of Overflush Fluid on Scale
Squeeze Life Time- Field Examples and Placement Simulation Examples. NACE International
Corrosion Conference & Expo 08356.
Kelland, M. A. (2009). Production chemicals for the oil and gas industry. Boca Raton: CRC
Press.
Mackay, E.J., Matharu, A.P., Sorbie, K.S., Jordan, M.M., and Tomlins, R., 2000. Modelling
Scale-Inhibitor Treatments in Horizontal Wells: Application to the Alba Field paper SPE
63013, SPE Prod. & Facilities May 15 (2) 107-114.
Mackay, E. J., 2001. SQUEEZE Modelling: Current Best Practice and New Capabilities. SPE
International Symposium on Oilfield Scale, Aberdeen, UK.
25
Mackay, E.J. and Jordan, M.M., 2003. Squeeze Modelling: Treatment Design and Case
Histories, paper SPE 82227 presented at the SPE European Formation Damage Conference,
The Hague, The Netherlands, 13-14 May.
Mackay, E.J., Jordan, M.M., Feasey, N.D., Shah, D., Kumar, P., Ali, S.A., 2005. Integrated
Risk Analysis for Scale Management in Deepwater Developments. SPE Production &
Facilities Volume 20, Number 2, pp.138-154.
Mackay, E., Sorbie, K., Kavle, V., Sorhaug, E., Melvin, K., Sjursaeter, K., Jordan, M., 2006.
Impact of In Situ Sulphate Stripping on Scale Management in the Gyda Field. In SPE
International Oilfield Scale Symposium, Aberdeen, UK.
Parkhurst, D.L. and Appelo, C.A.J., 1999. User's guide to PHREEQC (version 2). US Geol.
Surv. Water Resour. Inv. Rep. 99-4259, 312p.
Raju, K.U., Al-Buali, M.H., Al-Saadoun, T. and Mackay, E.J., 2010. Scale Inhibitor Squeeze
Treatments based on Modeling Studies, SPE International Conference on Oilfield Scale.
Society of Petroleum Engineers, Aberdeen, UK.
Sorbie, K.S., Wat, R.M.S., and Todd, A.C., 1992. Interpretation and Theoretical Modelling of
Scale-Inhibitor/Tracer Corefloods, SPE Production Engineering, August 1992, 307-312.
Sorbie, K.S., Yuan, M.D., Jordan, M.M. and Hourston, K.E., 1994. Application Of A Scale
Inhibitor Squeeze Model to Improve Field Squeeze Treatment Design, SPE29001, Proceedings
of the SPE European Petroleum Conference, London, UK, 25-27 October.
Vazquez, O., Mackay, E.J., and Sorbie, K.S., 2007. Modelling of Non-Aqueous and Aqueous
Scale Inhibitor Squeeze Treatments, paper SPE 106422, presented at the 2007 SPE
International Symposium on Oilfield Chemistry held in Houston, Texas, USA, 28 February-2
March.
Vazquez, O., Mackay, E.J. and Jordan, M.M., 2009. Modeling the Impact of Diesel vs. Water
Overflush Fluids on Scale-Squeeze-Treatment Lives Using a Two-Phase Near-Wellbore
Simulator. SPE Production & Operations, 24(3): pp. 473-480.
Vazquez, O., Van Ommen, T., Chen, P., Selle, O.M., Juliussen, B., Kolstø, E.H., Gustavsen,
Ø., 2011. Modelling a Series of Non-Aqueous Field Scale Inhibitor Squeeze Treatments in the
Heidrun Field SPE Production & Operations, 26(1): pp. 98-110.
Vazquez, O., Mackay, E. & Sorbie, K. S., 2012. A two-phase near-wellbore simulator to model
non-aqueous scale inhibitor squeeze treatments. Journal of Petroleum Science and Engineering,
82-83, p. 90-99.
Vazquez, O., Corne, D., Mackay, E., & Jordan, M. M., 2013. Automatic Isotherm Derivation
From Field Data for Oilfield Scale-Inhibitor Squeeze Treatments. SPE Journal Volume 18,
Issue 03, pp 563 - 574.
Yuan, M.D., Sorbie, K.S., Todd, A.C., Atkinson, L.M., Riley, H. and Gurden, S., 1993. The
Modelling of Adsorption and Precipitation Scale Inhibitor Squeeze Treatments in North Sea
26
Fields, SPE 25163 presented at the SPE International Symposium on Oilfield Chemistry, New
Orleans, LA, 2-5 March.