non-core asset divestiture...cibc capital markets 9th floor, bankers hall east 855 – 2nd street sw...
TRANSCRIPT

CIBC Capital Markets9th Floor, Bankers Hall East855 – 2nd Street SWCalgary, Alberta T2P 4J7
NON-CORE ASSET DIVESTITURE
February 2018
1
Canlin Energy Corporation (“Canlin”) has engaged CIBC Capital Markets (“CIBC”) as its exclusive advisor to solicit and evaluate proposals for their assets in the Ashlar and Pincher areas of Alberta, and the Table area of Southwest Saskatchewan.
• 2017 production of ~2,940 boe/d (90% gas) from 731 producing wells
− Ashlar: ~2,100 boe/d (92% gas) from 435 wells1
− Pincher: ~ 440 boe/d (73% gas) from 54 wells1
− Table: ~ 400 boe/d (100% gas) from 242 wells1
• Conservatively booked 2P reserves
Production and Reserves Highlights
Opportunity Highlights
1 Working interest wells, Company production based on lease operating statements as of Jan. 2018.
Opportunity Overview
• Turnkey operation with ownership of key infrastructure directly connected to sales
• Owned sweet and sour gas processing provides the opportunity to increase processing income and/or add low-cost production growth
• No major land expiry issues allow buyer to develop at their own pace
• Assets are located in an industry friendly area, close to egress with favourable topography and year round access
• Large drilling inventory
− 121 net locations
• Mannville oil opportunity
− Two Lower Mannville oil pools in the Ashlar and Pincher areas (Ellerslie and Basal Quartz) have been mapped using 3D seismic providing low-risk, short cycle time opportunities
Significant Upside Potential
Optimization and
Reactivation Potential
• Crane Lake field in the Table area can be reactivated at minimal cost to add production with no exploration risk
• Significant low-cost recompletion and optimization opportunities using existing wellbores
• Infrastructure optimization potential
− Water pipeline could significantly reduce ongoing operating costs
Strategic Midstream
Assets
• Ownership of key infrastructure in high demand areas:
− Sweet and sour gas processing plants, compressors, water disposal well, and a large network of gas gathering infrastructure with direct access to egress
• $2.4 million of processing revenue received in 2017
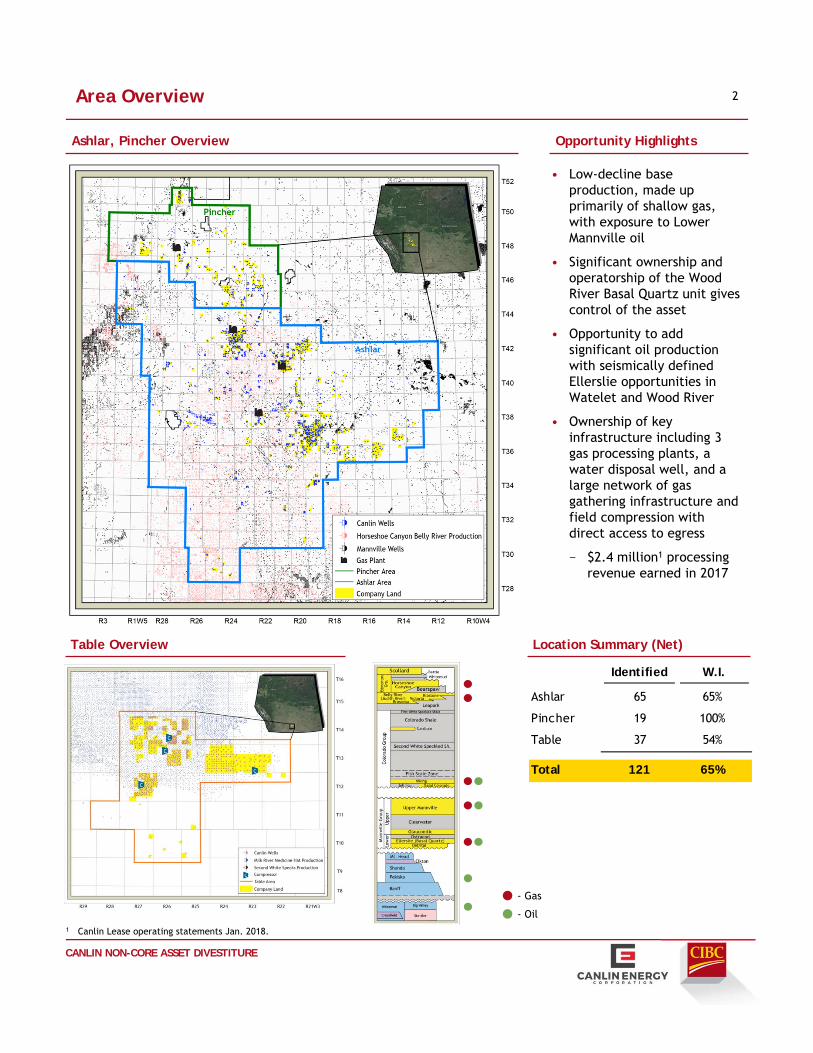
Area Overview
Ashlar, Pincher Overview
• Low-decline base production, made up primarily of shallow gas, with exposure to Lower Mannville oil
• Significant ownership and operatorship of the Wood River Basal Quartz unit gives control of the asset
• Opportunity to add significant oil production with seismically defined Ellerslie opportunities in Watelet and Wood River
• Ownership of key infrastructure including 3 gas processing plants, a water disposal well, and a large network of gas gathering infrastructure and field compression with direct access to egress
− $2.4 million1 processing revenue earned in 2017
Opportunity Highlights
CANLIN NON-CORE ASSET DIVESTITURE
2
1 Canlin Lease operating statements Jan. 2018.
- Gas
- Oil
Table Overview Location Summary (Net)
Identified W.I.
Ashlar 65 65%
Pincher 19 100%
Table 37 54%
Total 121 65%
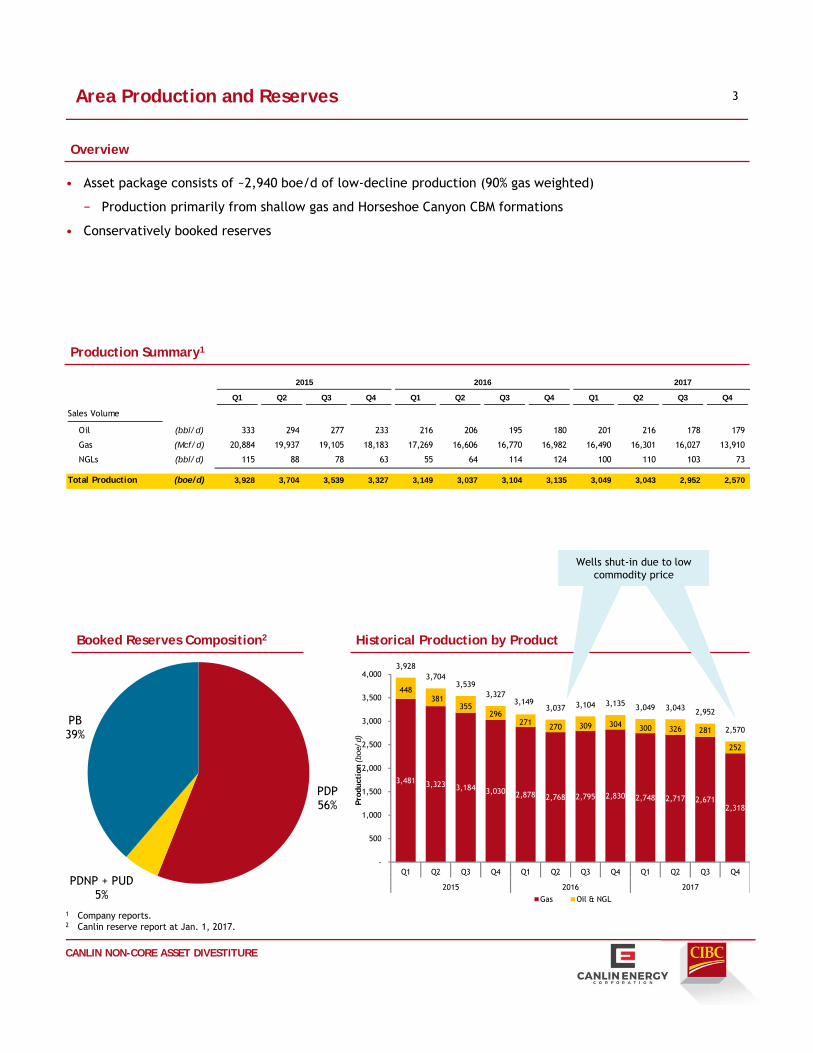
• Asset package consists of ~2,940 boe/d of low-decline production (90% gas weighted)
− Production primarily from shallow gas and Horseshoe Canyon CBM formations
• Conservatively booked reserves
Overview
Booked Reserves Composition2 Historical Production by Product
Production Summary1
1 Company reports.2 Canlin reserve report at Jan. 1, 2017.
3
CANLIN NON-CORE ASSET DIVESTITURE
Area Production and Reserves
3,481 3,323 3,184 3,030 2,878 2,768 2,795 2,830 2,748 2,717 2,671 2,318
448 381
355 296
271 270 309 304 300 326 281
252
3,928 3,704
3,539 3,327
3,149 3,037 3,104 3,135 3,049 3,043 2,952
2,570
-
500
1,000
1,500
2,000
2,500
3,000
3,500
4,000
Q1 Q2 Q3 Q4 Q1 Q2 Q3 Q4 Q1 Q2 Q3 Q4
2015 2016 2017
Pro
duct
ion (bo
e/d)
Gas Oil & NGL
Wells shut-in due to lowcommodity price
Wells shut-in due to lowcommodity price
Wells shut-in due to lowcommodity price
Wells shut-in due to lowcommodity price
2015 2016 2017
Q1 Q2 Q3 Q4 Q1 Q2 Q3 Q4 Q1 Q2 Q3 Q4
Sales Volume
Oil (bbl/d) 333 294 277 233 216 206 195 180 201 216 178 179
Gas (Mcf/d) 20,884 19,937 19,105 18,183 17,269 16,606 16,770 16,982 16,490 16,301 16,027 13,910
NGLs (bbl/d) 115 88 78 63 55 64 114 124 100 110 103 73
Total Production (boe/d) 3,928 3,704 3,539 3,327 3,149 3,037 3,104 3,135 3,049 3,043 2,952 2,570
PDP56%
PDNP + PUD5%
PB39%

0
500
1,000
1,500
2,000
2,500
3,000
3,500
Jan-13 Jan-14 Jan-15 Jan-16 Jan-17
Pro
duct
ion (
boe/
d)
Shallow Gas Ellerslie Wabamun Mannville Other Pekisko Viking
Net Company Land Summary 2017 Production1
W.I. Total Developed Undeveloped Total % Gas
(%) (acres) (acres) (acres) (boe/d) (%)
62% 140,045 131,822 8,223 ~2,100 92%
• ~2,100 boe/d (92% gas) from 435 wells1
• Ability to add reserves: 65 net locations at 33% – 98% working interest vs 5.7 booked
• Potential to infill drill 4 wells/section
• Targeted formations are low-risk, low-cost opportunities
• Inventory is located in a development-friendly area with favorable topography, and year-round access
• Minimal expiries: 512 net hectares in 2021
• LMR2 = 1.85
• $1.3 million1 2017 processing revenue
• 3D seismic included
• Ownership in a number of area units
4
Land and Production Summary
Ashlar Company Interest Overview
Ashlar Area Working Interest Production by Formation
Location Summary (Net)
Ashlar Overview
Wood River Ellerslie
Pool
Wood River Ellerslie
Pool
CANLIN NON-CORE ASSET DIVESTITURE
- Gas - Oil1 Company production based on lease operating statements as of Jan. 2018.2 Source: AER, wells only. As of Oct. 31, 2017.
Identified W.I.
Stettler 16 33%
Bashaw 42 98%
Wood River 4 80%
Rowley 3 100%
Total 65 65%
Ashlar Overview
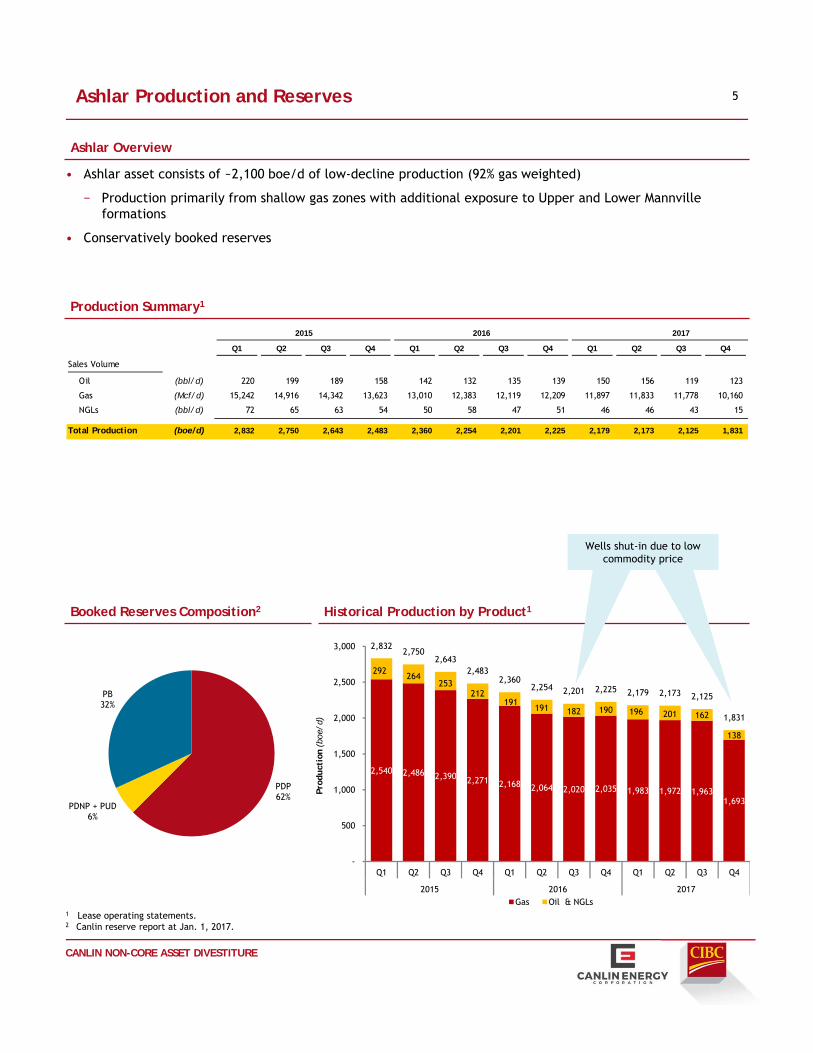
Booked Reserves Composition2
PDP62%
PDNP + PUD6%
PB32%
Historical Production by Product1
Production Summary1
1 Lease operating statements.2 Canlin reserve report at Jan. 1, 2017.
• Ashlar asset consists of ~2,100 boe/d of low-decline production (92% gas weighted)
− Production primarily from shallow gas zones with additional exposure to Upper and Lower Mannville formations
• Conservatively booked reserves
Ashlar Production and Reserves 5
CANLIN NON-CORE ASSET DIVESTITURE
2,540 2,486 2,390 2,271 2,168 2,064 2,020 2,035 1,983 1,972 1,963 1,693
292 264
253 212
191 191 182 190 196 201 162
138
2,832 2,750
2,643 2,483
2,360 2,254 2,201 2,225 2,179 2,173 2,125
1,831
-
500
1,000
1,500
2,000
2,500
3,000
Q1 Q2 Q3 Q4 Q1 Q2 Q3 Q4 Q1 Q2 Q3 Q4
2015 2016 2017
Pro
duct
ion (bo
e/d)
Gas Oil & NGLs
Wells shut-in due to lowcommodity price
Wells shut-in due to lowcommodity price
Wells shut-in due to lowcommodity price
Wells shut-in due to lowcommodity price
2015 2016 2017
Q1 Q2 Q3 Q4 Q1 Q2 Q3 Q4 Q1 Q2 Q3 Q4
Sales Volume
Oil (bbl/d) 220 199 189 158 142 132 135 139 150 156 119 123
Gas (Mcf/d) 15,242 14,916 14,342 13,623 13,010 12,383 12,119 12,209 11,897 11,833 11,778 10,160
NGLs (bbl/d) 72 65 63 54 50 58 47 51 46 46 43 15
Total Production (boe/d) 2,832 2,750 2,643 2,483 2,360 2,254 2,201 2,225 2,179 2,173 2,125 1,831

6Ashlar Infrastructure & Egress
Ashlar Infrastructure Overview
CANLIN NON-CORE ASSET DIVESTITURE
Egress Summary
• Gas egress
− Bashaw/Stettler: Gas is gathered and processed at company operated, high working-interest facilities, with direct connectivity to TCPL meter stations
− Nevis: Gas is compressed using Company-owned field compression, and processed at Keyera’s 16-33-38-22W4 gas plant
• Oil & water egress
− Wood River: Oil pipeline connected to a central tank farm then trucked to market. Water is trucked to the Company-owned water disposal well or 3rd party disposal well. Upside exists to pipeline connect the owned disposal well
− Nevis: Oil is trucked from an oil battery to market. Produced water is trucked for disposal
Infrastructure Summary
• 17 MMcf/d licensed gas processing capacity
− Bashaw Gas Plant 11-24-41-21W4: 7 MMcf/d
▪ 32.4% current utilization
− Wood River Gas Plant 1-28-43-24W4: 10 MMcf/d
▪ 25.4% current utilization
• Significant steel pipe allows optionality to produce nearby liquids-rich gas without additional pipelining
Compressor16-36-041-21W4
100% WI
Compressor06-15-042-20W4
90% WI
Gas PlantGas Plant11-24-041-21W4
78% WI
Compressor07-12-41-21W4
100% WI
Gas Plant01-28-043-23W4
91% WI
Compressor16-08-043-23W4
91% WI
Water Disposal WellWater Disposal Well08-05-042-23W4
WOOD RIVER
BASHAW
STETTLER
ROWLEY
NEVISKeyera Nevis
16-33-038-22W4
CompressorCompressor10-30-042-23W4
50% WI

7
Ashlar Oil Opportunity
• Distinct, seismically defined Basal Quartz pools with well defined water contacts
• Reservoir sands deposited within a fluvial system
• Logs show a baffle zone on the pools’ west side, creating a permeability barrier between oil and water intervals
• Proprietary seismic shows potential to add 4 new net locations to the west side of the existing pool
Ashlar Oil Development Opportunity Overview
Upside Opportunity: Wood Basal Quartz Oil Pool
100/03-08-043-23W4M Log
Presence of baffle creates permeability
barrier to underlying
water on west side of pool
Presence of baffle creates permeability
barrier to underlying
water on west side of pool
Ashlar Optimization Opportunities
Water Pipeline
• A pipeline could be constructed to transport produced water directly to the 08-05-043-23W4/2 disposal well
• Significantly reduced trucking costs
• Allows for the potential to increase oil production
CANLIN NON-CORE ASSET DIVESTITURE
• Cumulative production to October 2017
~46,600 bbl oil
~1,100 bbl water

0
200
400
600
800
1,000
1,200
Jan-13 Jan-14 Jan-15 Jan-16 Jan-17
Pro
duct
ion (
boe/
d)
Shallow Gas Ellerslie Mannville
• ~440 boe/d (73% gas) from 54 wells1
• Very active Duvernay focused area:
− December land sale had over 50,000 acres posted
• Located close to services, in a development friendly area with favorable topography, and year-round access
• Ability to add reserves: 19 net locations at 100% working interest vs 8 booked
• Drilling inventory consists of low-risk, low-cost opportunities
• Potential to infill drill to 4 wells/section
• No upcoming land expiries
• LMR2 = 1.51
• $0.96 million1 2017 processing revenue
• Trade seismic available
8
Land and Production Summary1
Pincher Company Interest Overview
Pincher Area Working Interest Production by Formation
Pincher Overview
Location Summary (Net)
Net Company Land Summary 2017 Production1
W.I. Total Developed Undeveloped Total % Gas
(%) (acres) (acres) (acres) (boe/d) (%)
78% 48,038 40,902 7,136 ~440 73%
Watelet Ellerslie
Pool
Watelet Ellerslie
Pool
- Gas - Oil
CANLIN NON-CORE ASSET DIVESTITURE
1 Company production based on lease operating statements as of Jan. 2018.2 Source: AER, wells only. As of Oct. 31, 2017.
Wells shut-in due to lowcommodity price
Wells shut-in due to lowcommodity price
Wells shut-in due to lowcommodity price
Wells shut-in due to lowcommodity price
Identified W.I.
Wetaskiwin 15 100%
Watelet 4 100%
Total 19 100%

Pincher Overview
Reserves Composition2
PDP29%
PDNP + PUD4%
PB67%
Historical Production by Product1
Production Summary1
• Pincher asset consists of ~440 boe/d of low-decline production (73% gas weighted)
− Production is primarily from shallow gas zones with some Upper and Lower Mannville
• Conservatively booked reserves
9
CANLIN NON-CORE ASSET DIVESTITURE
1 Lease operating statements.2 Canlin reserve report at Jan. 1, 2017.
498 403
358 327 285 286
358 387 362 346 324 239
155
117
102 84
80 79
127 114
104 125 119
114
654
520
460 412
365 365
485 501 467 471
443
353
-
100
200
300
400
500
600
700
800
Q1 Q2 Q3 Q4 Q1 Q2 Q3 Q4 Q1 Q2 Q3 Q4
2015 2016 2017
Pro
duct
ion (bo
e/d)
Gas Oil & NGLs
Wells shut-in due to lowcommodity price
Wells shut-in due to lowcommodity price
Wells shut-in due to lowcommodity price
Wells shut-in due to lowcommodity price
Pincher Production and Reserves
2015 2016 2017
Q1 Q2 Q3 Q4 Q1 Q2 Q3 Q4 Q1 Q2 Q3 Q4
Sales Volume
Oil (bbl/d) 113 94 88 75 74 74 60 40 51 60 59 56
Gas (Mcf/d) 2,990 2,418 2,150 1,964 1,711 1,718 2,149 2,325 2,175 2,076 1,946 1,434
NGLs (bbl/d) 42 23 15 9 5 5 67 73 53 65 60 58
Total Production (boe/d) 654 520 460 412 365 365 485 501 467 471 443 353

10Pincher Infrastructure & Egress
Pincher Infrastructure
CANLIN NON-CORE ASSET DIVESTITURE
Egress Summary
• Gas egress
− Watelet: Gas is processed at the Company-owned sour gas plant and sells to the ATCO Conjuring Creek Receipt Station. The gas plant generates significant third party revenue
− Bittern Lake: Gas is processed at a Company-owned sweet facility and sells to the ATCO Boulder Receipt Station
• Oil & water egress
− Company-owned oil battery at Watelet from which liquids are trucked to a third party battery for oil sales
Infrastructure Summary
WATELET
BITTERN LAKE/
CompressorCompressor03-13-047-25W4
100% WI
Oil BatteryOil Battery07-14-047-26W4
100% WI
Gas Plant08-18-048-26W4
100% WI
Compressor07-28-047-26W4
48% WI
Compressor03-33-046-22W4
100% WI
CompressorCompressor04-10-046-22W4
100% WI
• 20 MMcf/d licensed sour gas processing capacity at Watelet Gas Plant 8-18-48-26W4
− 11.4% current utilization
• Canlin’s sour gas infrastructure is highly coveted
− Regional gas production has increased significantly in recent years, leaving little available spare capacity
Recent Area Gas Production1
0
5,000
10,000
15,000
Jan-14 Jan-15 Jan-16 Jan-17
Gas
Pro
duct
ion
(Mcf
/d)
Nisku Other
Increased production at Leduc-
Woodbend Nisku field
Recent Mannville focused drilling
1 Public data to October 2017.

11
Upside Opportunity: Watelet Ellerslie Pool Pincher Oil Opportunity
Pincher Oil Development Opportunity Overview
• ~10 m of excellent pay
• Porosity averages 14%
• Perforated above -683 m TVDss
• Thick baffle between oil and water legs
• Baffle present where expected oil-water contact exists
• Cumulative production to October 2017: 12.3 MMbbl oil and 4.7 MMbbl water
• 4 net horizontal infill locations identified in well defined Ellerslie pool
• Trade 3D seismic available for purchase
• Low pool recovery factor to-date
• Close to existing infrastructure and operated oil battery provides low-cost egress
100/16-14-047-26W4M Log
CANLIN NON-CORE ASSET DIVESTITURE
0
100
200
300
400
500
600
Jan-13 Jan-14 Jan-15 Jan-16 Jan-17
Pro
duct
ion (
boe/
d)
Shallow Gas
12
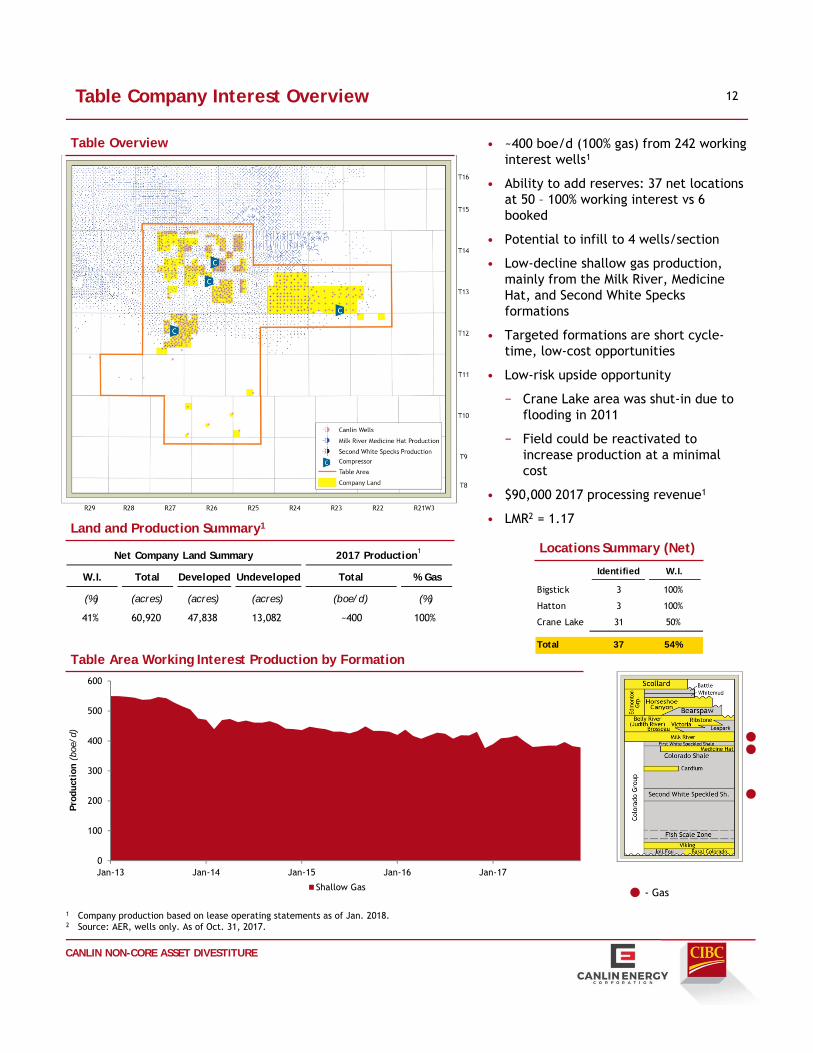
Table Area Working Interest Production by Formation
Table Company Interest Overview
Land and Production Summary1
Table Overview
Locations Summary (Net)Net Company Land Summary 2017 Production1
W.I. Total Developed Undeveloped Total % Gas
(%) (acres) (acres) (acres) (boe/d) (%)
41% 60,920 47,838 13,082 ~400 100%
• ~400 boe/d (100% gas) from 242 working interest wells1
• Ability to add reserves: 37 net locations at 50 – 100% working interest vs 6 booked
• Potential to infill to 4 wells/section
• Low-decline shallow gas production, mainly from the Milk River, Medicine Hat, and Second White Specks formations
• Targeted formations are short cycle-time, low-cost opportunities
• Low-risk upside opportunity
− Crane Lake area was shut-in due to flooding in 2011
− Field could be reactivated to increase production at a minimal cost
• $90,000 2017 processing revenue1
• LMR2 = 1.17
CANLIN NON-CORE ASSET DIVESTITURE
- Gas
1 Company production based on lease operating statements as of Jan. 2018.2 Source: AER, wells only. As of Oct. 31, 2017.
Identified W.I.
Bigstick 3 100%
Hatton 3 100%
Crane Lake 31 50%
Total 37 54%

PDP59%
PDNP + PUD4%
PB37%
Table Overview
Reserves Composition2 Historical Production by Product1
Production Summary1
• Table asset consists of ~400 boe/d of low-decline production (100% gas weighted)
− Production is primarily shallow gas
− Conservatively booked reserves
Table Production and Reserves 13
CANLIN NON-CORE ASSET DIVESTITURE
1 Lease operating statements.2 Canlin reserve report at Jan. 1, 2017.
442 434 436 433 425 418 417 408 403 399 384 386
-
100
200
300
400
500
Q1 Q2 Q3 Q4 Q1 Q2 Q3 Q4 Q1 Q2 Q3 Q4
2015 2016 2017
Pro
duct
ion (bo
e/d)
Gas
2015 2016 2017
Q1 Q2 Q3 Q4 Q1 Q2 Q3 Q4 Q1 Q2 Q3 Q4
Sales Volume
Oil (bbl/d) – – – – – – – – – – – –
Gas (Mcf/d) 2,652 2,603 2,613 2,596 2,548 2,505 2,502 2,449 2,418 2,391 2,302 2,316
NGLs (bbl/d) – – – – – – – – – – – –
Total Production (boe/d) 442 434 436 433 425 418 417 408 403 399 384 386

14Table Infrastructure & Egress
Table Overview
CANLIN NON-CORE ASSET DIVESTITURE
Egress Summary
• Gas egress
− The majority of wells produce to one of five compressors (4 Company-operated, 1 third-party)
− Operated compressors are high working interest; 2 at 100%, 1 at 51% and 1 at 50%
− All Company-operated compressor stations are sales TCPL connected
• Oil & water egress
− No significant water production
Infrastructure Optimization Summary
BIGSTICK
HATTON
CRANE LAKE
Compressor5-11-14-26W3
100% WI
Compressor16-27-13-26W3
51% WI
CompressorCompressor04-02-13-23W3
100% WI
2 Stage + Booster07-23-12-27W3
50% WI
• Flood Status
− Crane Lake Compressor and east leg of gathering system are in operable conditions
▪ Compressor modification required to meet sales line pressure
▪ Gathering lines and wells on west and north legs are still underwater from the flood and can be assessed once waters recede

ProcessCIBC has been retained by Canlin as its exclusive advisor to solicit and evaluate proposals for the divestiture of the company’s non-core assets in the Ashlar and Pincher areas of Alberta, and the Table area of Saskatchewan.
It is the intention of Canlin and CIBC to conduct the process such that it minimizes any disruption to Canlin’s operations. Interested parties should not contact Canlin directly regarding any aspect of the process. All communications, enquiries and requests for information relating to the process should be directed to one of the CIBC individuals listed herein.
Signed CAs should be forwarded by email or courier to CIBC. Once a CA has been executed, confidential information will be made available to qualified parties via a Virtual Data Room (“VDR”). Process timeline will be communicated to the counterparties upon executing of a CA.
Key Contacts
15
CIBC Capital Markets9th Floor, Bankers Hall East
855 – 2nd Street SWCalgary, Alberta T2P 4J7
Fax: (403) 260-0524
Investment Banking Acquisitions & Divestitures
John PeltierExecutive DirectorTel: (403) 260-8646
Ashley EngbloomDirector
Tel: (403) [email protected]
Doug AshtonChief Engineer
Tel: (403) [email protected]
David SmithChief Geologist
Tel: (403) [email protected]
DisclaimerThis document is confidential and has been prepared by CIBC Capital Markets. In preparing this presentation, CIBC Capital Markets has relied without any independent verification on information provided or that is publicly available. The information and any analyses in this document are preliminary and is not intended to constitute a “valuation,” “formal valuation,” “appraisal,” “prior valuation,” or a “report, statement or opinion of an expert” for purposes of any securities legislation in Canada or otherwise. We are not legal, tax or accounting experts and we express no opinion concerning any legal, tax or accounting matters or the sufficiency of this document for your purposes. Prospective counterparties are responsible for their own due diligence investigation in respect of any investment or joint venture in the assets described herein. This printed document is incomplete without reference to discussions and any related written materials that supplement it. These materials are confidential and are intended solely for your benefit and for your internal use only and may not be reproduced, disseminated, quoted from or referred to in whole or in part at any time, in any manner or for any purpose, without obtaining the prior written consent of CIBC Capital Markets in each specific instance. CIBC Capital Markets employees are prohibited from offering to change or otherwise influence any research report, rating or price target to any company as inducement for the receipt of any business or compensation. This document does not constitute an offer or solicitation to buy or sell any securities in any jurisdiction where such would be prohibited. CIBC World Markets Inc. is a legal entity name. CIBC Capital Markets is a trademark brand name under which different legal entities provide different services under this umbrella brand. Products and/or services offered through CIBC Capital Markets include products and/or services offered by the Canadian Imperial Bank of Commerce, the parent bank of CIBC World Markets Inc. and various other subsidiaries of the Canadian Imperial Bank of Commerce. Services offered by the Canadian Imperial Bank of Commerce include corporate lending services, foreign exchange, money market instruments, structured notes, interest rate products and commodities, equity options and OTC derivatives. Canadian exchange-traded equity options are executed through CIBC World Markets Inc. Equity and fixed income securities are executed through CIBC World Markets Inc. and other directly or indirectly held subsidiaries of CIBC. CIBC World Markets Inc. is a member of the Canadian Investor Protection Fund and the Investment Industry Regulatory Organization of Canada. CIBC World Markets Corp. is a member of the Financial Industry Regulatory Authority. CIBC World Markets plc is regulated by the Prudential Regulation Authority and Financial Conduct Authority. CIBC World Markets Securities Ireland Limited is regulated by the Central Bank of Ireland. CIBC Australia Ltd is regulated by the Australia Securities and Investment Commission. CIBC World Markets (Japan) Inc. is a member of the Japanese Securities Dealer Association. Canadian Imperial Bank of Commerce, Hong Kong Branch, is a registered institution under the Securities and Futures Ordinance, Cap 571. Canadian Imperial Bank of Commerce, Singapore Branch, is an offshore bank licensed and regulated by the Monetary Authority of Singapore. All values are expressed in Canadian dollars, unless otherwise noted.
Process Overview