non-destructive testing of bridge deck using passive ... · non-destructive testing of bridge deck...
TRANSCRIPT

1
Non-Destructive Testing of Bridge Deck Using Passive Infrared Thermography and Ground Penetrating Radar
Tarek Omar, PhD Candidate
Department of Civil and Environmental Engineering Western University
London, Ontario, Canada N6A 5B9 Email: [email protected]
Moncef L. Nehdi, Professor
Department of Civil and Environmental Engineering Western University
London, Ontario, Canada N6A 5B9 Email: [email protected]
Paper prepared for presentation at the Structures Session
of the 2016 Conference of the Transportation Association of Canada
Toronto, ON
ABSTRACT Bridge decks in Canada are deteriorating rapidly due to exposure to various degradation mechanisms. Exposure to freezing and thawing cycles coupled with the ingress of chloride ions from de-icing salts used during winter seasons typically damage bridge decks at a higher rate than other bridge components. Recently, there has been an increase in the use of non-destructive testing (NDT) methods to augment visual inspection of bridge decks for better informed decisions related to deck rehabilitation and replacement. Detecting subsurface delamination defects using remote sensing and data collection, without physical contact, is a paramount advantage of infrared thermography (IRT). Moreover, detecting corrosion defects with minimal human data interpretation is a key advantage of ground penetrating radar (GPR). In the present study, IRT and GPR are combined to inspect a full-scale reinforced concrete bridge deck in order to detect anomalies such as subsurface delamination, cracking, and corrosion defects. The IRT data are presented as temperature contrast on the concrete surface and analyzed to create a delamination map of the bridge deck, while the GPR data are presented as reflected amplitude profiles of the top rebar layer and analyzed to create a corrosion map of the bridge deck. While the two techniques rely on different mechanisms, their results show good agreement. The findings from this case study demonstrate that the combination of IRT and GPR is a practical option for consistent and rapid in-situ evaluation of reinforced concrete bridge decks, representing a strong contender for incorporation in bridge deck inspection manuals.
2
INTRODUCTION Concrete bridge decks in Canada and the United States are rapidly deteriorating and require enormous financial and human resources for its maintenance and rehabilitation. A major challenge associated with inspecting bridge decks is that defects are often concealed subsurface mechanisms that increase in severity until the damage becomes too severe for cost-effective repair. Non-destructive testing (NDT) technologies can be effective in locating and monitoring concrete bridge deterioration. NDT approaches enable the detection of deterioration processes at its early stages and can be incorporated into the inspection process to evaluate hidden defects such as reinforcing steel corrosion, delamination and crack propagation (Gucunski et al., 2013). For instance, infrared thermography (IRT) is a remote sensing technology that is commonly applicable for detecting subsurface flaws, such as internal cracks and delaminations in concrete bridge components. The subsurface anomalies can be detected on the basis of variable concrete properties, such as density, thermal conductivity and specific heat capacity. The resulting heating and cooling behavior is compared with the surrounding sound concrete (Manning and Holt, 1982). ASTM D4788-03 (2013) describes the standard procedure and equipment necessary for conducting IRT testing for detecting delaminations in bridge decks. Ground Penetrating Radar (GPR) has been recognized as a NDT technique capable of detecting the location and extent of corrosions in reinforced concrete bridge decks. It can also assess the thickness of a bridge deck and concrete cover of the steel reinforcement. GPR is based on transmitting brief pulses of electromagnetic energy into the bridge deck, then receiving and recording the partially reflected energy from various layer interfaces based on the difference in their dielectric permittivity (Zhao et al., 2005). ASTM D6087-08 (2010) describes the standard procedure and equipment necessary for conducting GPR testing as well as data processing methodologies. RESEARCH OBJECTIVES The goal of the present study is to evaluate the capability and reliability of using passive IRT and GPR technologies as bridge inspection tools to detect the subsurface defects in reinforced concrete bridge decks. The objectives of the study are: (1) evaluate the capability and reliability of passive IRT testing for the detection of delaminations in bridge decks; (2) evaluate the capability and reliability of GPR for the detection of corrosions in bridge decks; and (3) compare the quantified results obtained from both technologies.
BACKGROUND Deterioration Mechanisms of RC Bridges Reinforced concrete bridges undergo loss of integrity over time caused by poor initial quality, damage due to deicing salts, overloading, freeze-thaw cycling, fatigue and corrosion of rebar. Deterioration processes in concrete can be chemical (e.g. alkali-silica reaction, carbonation, corrosion, crystallization, leaching and acid action), physical (freeze-thaw cycles, salt crystallization, creep, fatigue, overloading, shrinkage, fire, etc.)

3
or biological mechanisms (accumulation of organic matter, living organisms). However, corrosion of the reinforcing steel often represents the primary deterioration mechanism and is a major concern for reinforced concrete bridges. The steel becomes susceptible to corrosion when the ingress of chloride ions exceed a threshold concentration level, which is dependent on many factors such as the quality of concrete, relative humidity, temperature and pH value of the pore solution. In addition, carbonation resulting from the reaction of carbon dioxide and other alkaline constituents of the cement paste reduces the alkalinity of the concrete and thus, the steel is no longer protected against corrosion. When a steel rebar corrodes, it expands causing cracks that can lead to delaminations and spalling. Such spalling further exposes the embedded steel to the environment, accelerating deterioration, possibly compromising the structural capacity of the bridge. NDT Evaluation of RC Bridge Decks Conventional NDT Techniques Visual inspection (VI) is the default bridge inspection methodology, yet its results heavily depend on the expertise and judgment of bridge inspectors, yielding primarily qualitative and subjective decisions (Jain and Bhattacharjee, 2011). A key benefit of visual inspection is that it is low cost, relatively quick and requires minimal training. However, research results indicate that assessing a bridge condition by VI is unreliable, being unable to identify correctly the repair priorities (Moore et al., 2001). The quality and consistency of visual inspection results greatly depend on the motivation, qualification and equipment of those conducting such inspections. The use of simple nondestructive methods such as chain drag and hammer sounding have been widely used to inspect concrete bridge elements. A delamination in the concrete causes a dull sound when the deck surface is struck. They are inexpensive methods, but the interpretation of the sound produced is subject to the operator’s judgment and experience. Such techniques require hands-on access and can be a labor-intensive and time-consuming for large areas of concrete. Traffic control must also be in place so that inspectors can safely access the concrete element. Infrared Thermography (IRT) Infrared thermography (IRT) is a technology to detect thermal radiation emitted from materials. It creates an image of surface temperatures based on the emitted radiation. Thermal IR radiant energy is emitted from all objects that have a temperature greater than absolute zero. The rate at which this energy is emitted is a function of the temperature of the material and its emissivity. A material’s emissivity is the ability of its surface to emit energy by radiation relative to a black body and has a value between 0 and 1. This value is typically greater than 0.9 for concrete. There are two testing approaches for IR thermography based on the source of heat. The active approach uses an external thermal stimulus to induce the required heat flow condition on the concrete being tested. The passive approach uses natural heat sources such as solar heating and ambient

4
temperature changes (Robert, 1982). The concept behind the application of IRT in concrete bridge evaluation is that subsurface defects such as delamination disrupt the heat transfer through the concrete. When the temperature of the concrete increases, such as during daytime when the sun and ambient environment are heating the concrete, the surface area above a subsurface delamination warms up at a faster rate than that of surface areas where the concrete is intact. Delaminations can be detected as “hot spots” on the surface of the material, relative to intact concrete. Conversely, during nighttime, the air temperatures usually decrease and the material cools. Thus, the surface area above the delaminations cool at a faster rate than the intact concrete and appear as “cold spots” relative to the intact concrete (Washer et al., 2009). Ground Penetrating Radar (GPR) Ground penetrating radar (GPR) emits electromagnetic waves for subsurface imagery to detect anomalies in concrete bridge components. A transmitter antenna emits short pulses from the surface of the concrete member being investigated at a desired frequency, and then these pulses propagate through the member. The receiving antenna collects the reflected pulses and records their properties. The intensity of reflection is determined by the change in the dielectric permittivity and conductivity of materials. Strong reflections indicate higher change in the electrical properties at the interfaces (Barnes et al., 2008). Based on the operation methods, there are two types of GPR systems: air-coupled and ground-coupled. An air-coupled system is connected to a moving vehicle, and is usually used to survey highways in a short time with minimum traffic interruption. Conversely, a ground-coupled system is dragged manually on a pushing cart and requires direct contact with the surface under investigation. The evaluation of GPR system performance depends on the ability of the signals to propagate to the required depth and the resolution of the resulting (images). The propagation depth and the resolution are both based on the wavelength of the transmitted signal. This is because the frequency is inversely related to the wavelength. To obtain high-quality images, the wavelength should be short, which means that the frequency will be high. In other words, the higher the frequency, the better the resolution, and the shallower will be the propagation depth (Alani et al., 2013). RESEARCH METHODOLOGY The methodology adopted for achieving the objectives of the present study consists of: (1) conducting passive IRT testing on a deteriorated full-scale concrete bridge deck; (2) conducting GPR scanning on the same bridge deck; (3) analyzing the collected IR images to produce a thermal thermogram for the entire bridge deck; (4) analyzing the GPR scan profiles to extract the amplitude of the reflected waves; (5) producing a bridge deck condition map identifying the delaminated areas from the IRT testing; (6) producing a bridge deck condition map identifying the corroded areas based on the GPR testing; and (7) comparing the results obtained from applying the two technologies.
5
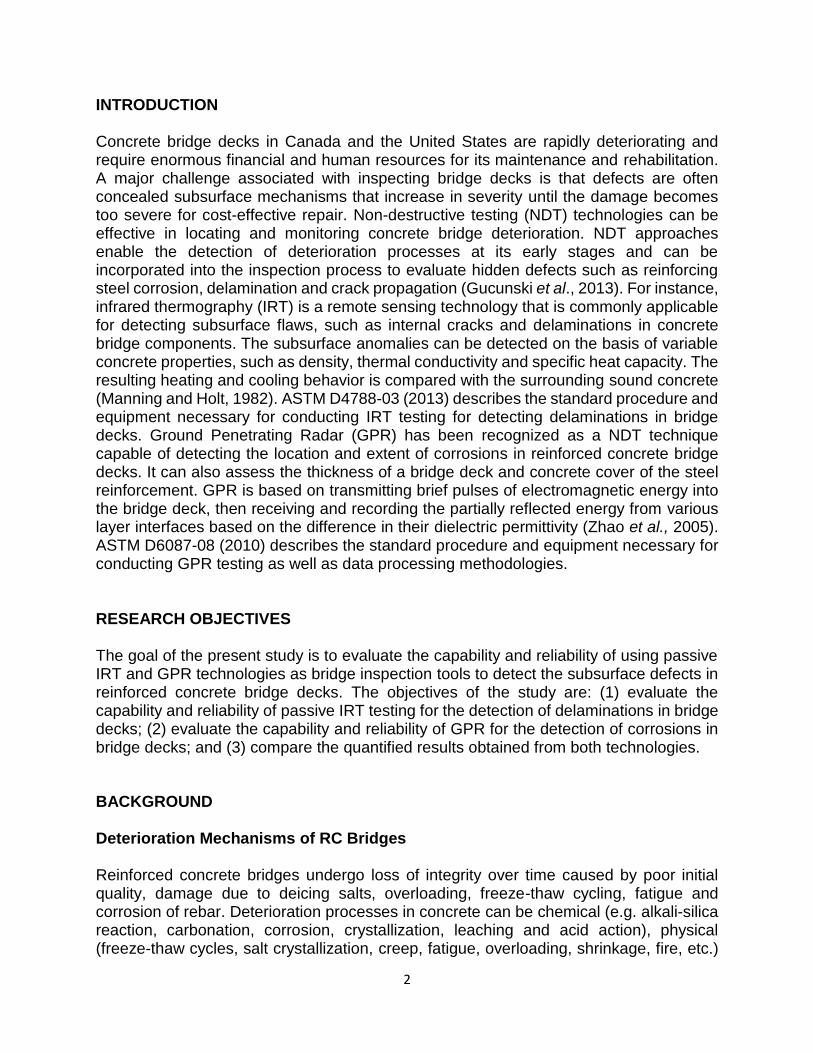
SURVEY OF RC BRIDGE DECK Field testing was conducted in the present study on an in-service reinforced concrete bridge deck. The bridge is located in Quebec, Canada and the deck was rated as having poor condition, which make it a good candidate for a bridge deck evaluation study using thermal IR and GPR imagery to detect subsurface anomalies. The bridge was constructed in 1969, and the deck is connected directly to the supporting abutments with no provision in the form of bearings. The critical deck characteristics include a total length of 147 ft with a transverse width of 29.53 ft, which translates into 26.25 ft of drivable surface (supports one lane of traffic in each direction) with one side shoulder. Figure 1 shows a location map of the surveyed bridge.
Figure 1: Illustration of the surveyed concrete bridge in Quebec.
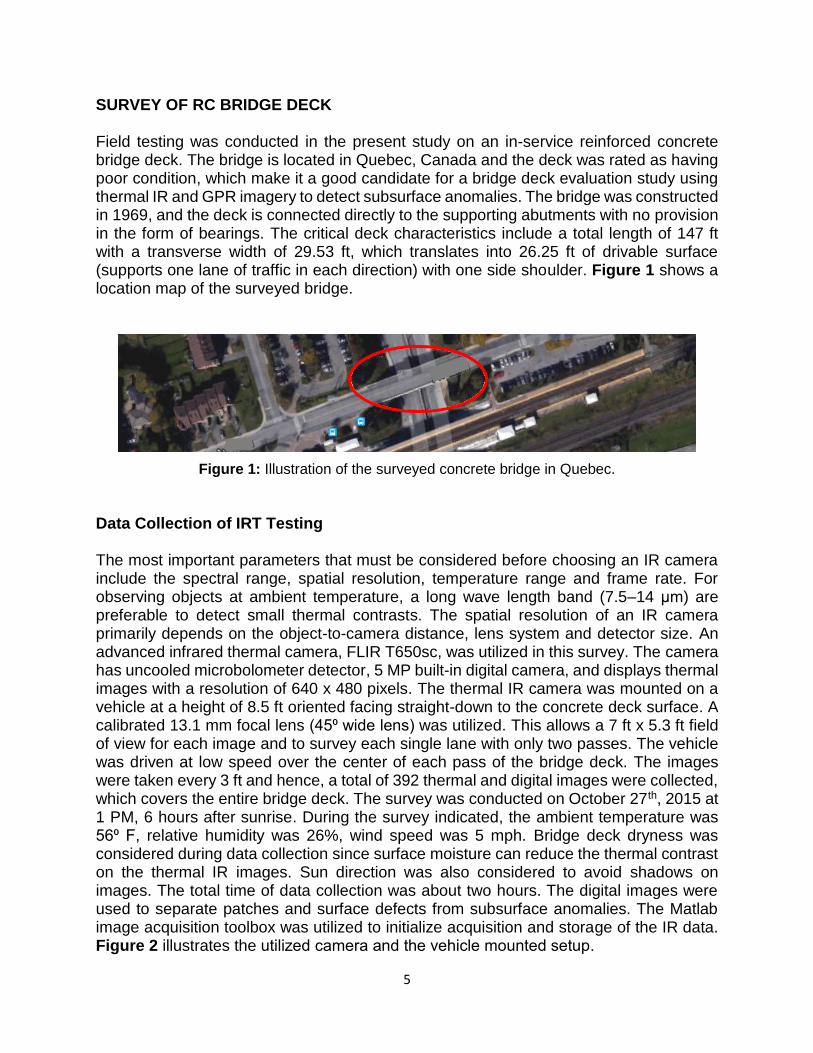
Data Collection of IRT Testing The most important parameters that must be considered before choosing an IR camera include the spectral range, spatial resolution, temperature range and frame rate. For observing objects at ambient temperature, a long wave length band (7.5–14 μm) are preferable to detect small thermal contrasts. The spatial resolution of an IR camera primarily depends on the object-to-camera distance, lens system and detector size. An advanced infrared thermal camera, FLIR T650sc, was utilized in this survey. The camera has uncooled microbolometer detector, 5 MP built-in digital camera, and displays thermal images with a resolution of 640 x 480 pixels. The thermal IR camera was mounted on a vehicle at a height of 8.5 ft oriented facing straight-down to the concrete deck surface. A calibrated 13.1 mm focal lens (45⁰ wide lens) was utilized. This allows a 7 ft x 5.3 ft field of view for each image and to survey each single lane with only two passes. The vehicle was driven at low speed over the center of each pass of the bridge deck. The images were taken every 3 ft and hence, a total of 392 thermal and digital images were collected, which covers the entire bridge deck. The survey was conducted on October 27th, 2015 at 1 PM, 6 hours after sunrise. During the survey indicated, the ambient temperature was 56⁰ F, relative humidity was 26%, wind speed was 5 mph. Bridge deck dryness was considered during data collection since surface moisture can reduce the thermal contrast on the thermal IR images. Sun direction was also considered to avoid shadows on images. The total time of data collection was about two hours. The digital images were used to separate patches and surface defects from subsurface anomalies. The Matlab image acquisition toolbox was utilized to initialize acquisition and storage of the IR data. Figure 2 illustrates the utilized camera and the vehicle mounted setup.
6
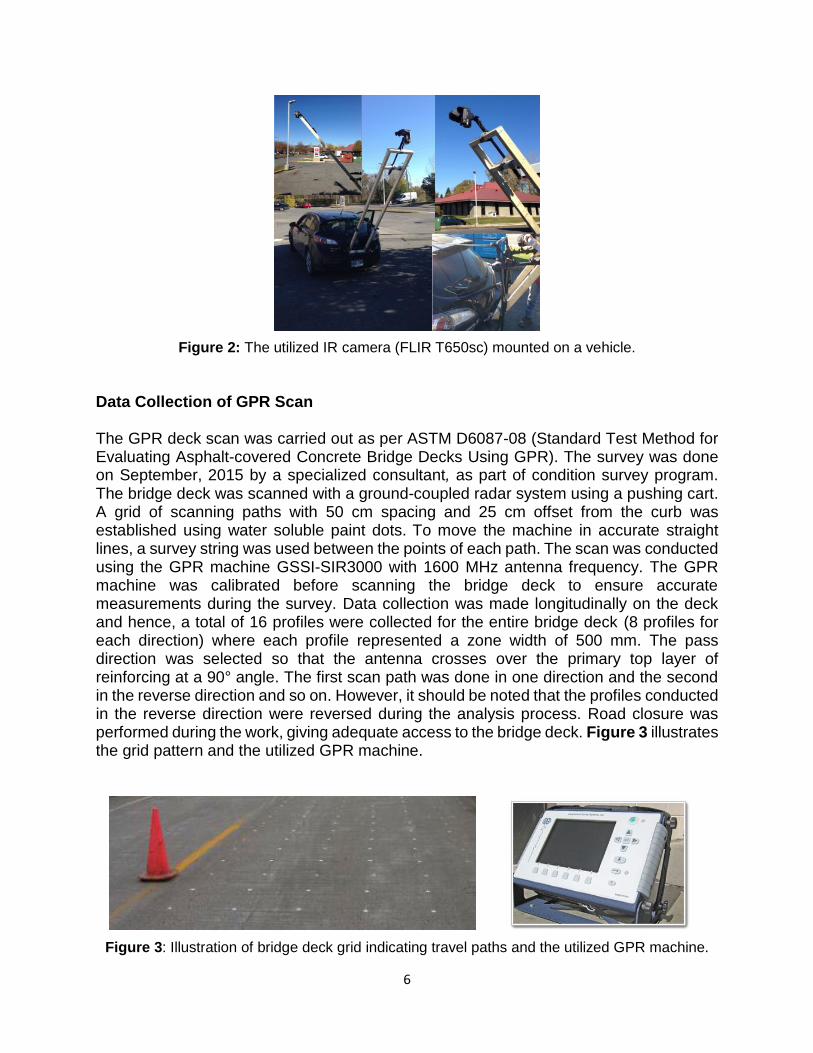
Figure 2: The utilized IR camera (FLIR T650sc) mounted on a vehicle. Data Collection of GPR Scan The GPR deck scan was carried out as per ASTM D6087-08 (Standard Test Method for Evaluating Asphalt-covered Concrete Bridge Decks Using GPR). The survey was done on September, 2015 by a specialized consultant, as part of condition survey program. The bridge deck was scanned with a ground-coupled radar system using a pushing cart. A grid of scanning paths with 50 cm spacing and 25 cm offset from the curb was established using water soluble paint dots. To move the machine in accurate straight lines, a survey string was used between the points of each path. The scan was conducted using the GPR machine GSSI-SIR3000 with 1600 MHz antenna frequency. The GPR machine was calibrated before scanning the bridge deck to ensure accurate measurements during the survey. Data collection was made longitudinally on the deck and hence, a total of 16 profiles were collected for the entire bridge deck (8 profiles for each direction) where each profile represented a zone width of 500 mm. The pass direction was selected so that the antenna crosses over the primary top layer of reinforcing at a 90° angle. The first scan path was done in one direction and the second in the reverse direction and so on. However, it should be noted that the profiles conducted in the reverse direction were reversed during the analysis process. Road closure was performed during the work, giving adequate access to the bridge deck. Figure 3 illustrates the grid pattern and the utilized GPR machine.
Figure 3: Illustration of bridge deck grid indicating travel paths and the utilized GPR machine.
7
DATA ANALYSIS AND CONDITION MAPS Infrared Thermography The captured IR images of the bridge deck were enhanced using several functions in the FLIR Tools+ and ResearchIR software to improve the images’ quality. For instance, the Gaussian smoothing filter was used to reduce noise whereby the software selects the size of the filter automatically. Histogram equalization function was used to distribute the intensities on the histogram, which in turn enhanced the image’s thermal contrasts. The thermal MSX function (multi-spectral dynamic imaging), which is a fusion algorithm that embosses visible spectrum details (from the digital camera) onto the infrared image, was used to enable sharper-looking images and quicker target orientation. This pre-processing was required for further analysis and to differentiate delaminated areas from surface features (discoloration, oil stains, sand and rust deposits, etc.) that appear in the infrared image, yet are unrelated to subsurface conditions. The temperature data of each image was then saved in a separate excel file using the ResearchIR software. To create a mosaicked thermogram of the entire bridge deck from the individual images, a selected window from each image was extracted and stitched together with the extracted window from the next image and so on. The height of each stitch window is the number of pixels that are equivalent to the images’ spacing. Hence, this appending process produces continuous data for each survey pass. The dimension in pixels depends upon the pixel resolution in each direction. For the surveyed bridge, the dimension of the stitched strip was 600 x 13,230 pixels and 2400 x 13,230 = 31.75 million pixels for the entire 2-lanes deck. A Matlab code was written to extract and stitch the selected pixels from each image. For visualization and to simplify further processing, it was necessary to scale-down the data dimension of the mosaic. This was achieved by assuming that the entire deck was divided into small boxes of 10 cm x 10 cm in dimension, with temperature unable to change within each box, then, computing the average of pixels, which represents the resolution within the selected dimension. This resulted in a reduced file with 80 x 450 = 36,000 pixels. The mean function in Matlab was modified and a new code to calculate the mean for specified dimension of input data was written. Another Matlab code was also written to identify the co-ordinates of each pixel in the temperature data file. The origin point (0, 0) was assigned to the corner of the bridge deck where the survey started. Thresholding classification using the saved temperature values was implemented in the present study to identify the defective areas in the concrete deck. Firstly, the thermal contrasts were calculated from the temperature values of the mosaicked thermogram. The max thermal contrast of the recorded data was 7.7 ⁰ C. It was then necessary to select a threshold value for the calculated thermal contrasts that could indicate where delamination was likely to be detectable. A 1°C threshold was selected for two reasons: (1) it is 20 times higher than the sensitivity of the utilized camera such that much smaller variations in surface temperature were easily detectable; (2) it is twice the ASTM D4788-

8
03 requirement (0.5°C minimum contrast between sound concrete and a defect). The pixels with a higher temperature than this threshold value were highlighted because delaminations appear with a higher temperature. Finally, the temperature values were grouped and a condition map was plotted using a commercial mapping software to construct a high contrast image, accurately delineating the location of subsurface defects. Figure 4 illustrates the created map of the surveyed bridge deck.
Figure 4: IRT condition map indicating delaminated areas in the surveyed bridge deck.
Ground Penetrating Radar The numerical amplitude analysis method was utilized in the present study. The scanning profiles were post-processed using the commercial radar software, RADAN, to extract important information for further analysis. First, each profile was cut down to remove the extremes and just include the bridge deck length. Next, the top reinforcing steel bars were selected (peak of the parabolic shapes). When the entire bars are selected, the software generates an Excel sheet containing the scan number, amplitude, and two-way travel time for each point (bar). This step is repeated for the entire bridge deck’s profiles. Figure 5 illustrates the picked top reinforcing bars, represented as red points, in a B-scan profile.
Figure 5: Picking top reinforcing bars in a B-scan profile.

9
Reinforcing steel is not always placed at an exact depth throughout the deck during construction and thus, this can lead to a difference in the amplitude of the reflected waves. Consequently, deeper rebar has lower amplitudes than rebar at higher depths due to the dissipation of energy as the signal travels through concrete. Therefore, to relate deterioration of concrete using the attenuation of the signal at the rebar level, the varying depths of rebar must be accounted for. The depth correction method for GPR profiles was invented by Barnes et al., (2008). After processing all profiles and generating the Excel sheets, the saved data were imported to a software developed by Dinh et al., (2014) in order to perform a depth correction for the reinforcing bars. The principle of the depth correction is to normalize the depth of all reinforcing bars based on the relation between the amplitudes of the reflected waves and the corresponding two-way travel time. Thresholding classification was implemented in the present study to identify the defective areas in the concrete bridge deck. Upon completion of the numerical amplitude analysis and the depth correction process, it is common for the amplitudes to be contour plotted based on a selected threshold value. Martino et al., (2014) developed a model based on a correlation between GPR and half-cell potential to find a threshold for GPR that can differentiate sound from corroded areas. The model was developed based on the observation that the histogram of a sound bridge deck’s amplitude is compacted and symmetric and has almost a normal distribution, while for the corroded bridge deck is quite spread out and skewed to one side. A linear regression formula was used to calculate the corroded area, which is equal to skew multiplied by the mean of the amplitude values. After the percentage of total corroded area was calculated, GPR threshold was determined by trial and error to have almost the same area of corrosion. The final output was an Excel file containing information on the selected reinforcing bars (co-ordinates and amplitude). Then, the amplitude values were grouped and a condition map was plotted using a commercial mapping software to construct a high contrast image, accurately delineating the location of corroded areas. Figure 6 illustrates the created map of the surveyed bridge deck.
Figure 6: GPR condition map indicates location of corrosion in the surveyed bridge deck.
DISCUSSION The present study aims to expand the use of IRT and GPR as NDT tools for bridge deck inspection. IRT highlights overlay and rebar-level delamination, while GPR highlights
10
areas where corrosion is active. When conducting IRT testing on full-scale bridges, the defects’ characteristics are unknown and extracting quantitative measures of subsurface defective areas depends on the analyzer’s personal experience. In such a qualitative and subjective analysis, the defective areas are identified based on a visual interpretation methodology, which is rapid but does not warrant rigorous evaluation of the acquired thermal images. Creating a plan view mosaic of the entire bridge deck in the presented case study facilitated the application of thresholding classification to identify the subsurface delaminated areas. The thermal contrast developed from the concrete subsurface provided numerical values for the color contrasts that were used to process data more effectively than simply comparing multiple images. On the other hand, when conducting GPR testing, the relationship between GPR measurements and the condition of decks is still not well understood. Although the amplitude analysis provides an objective and a detailed decibel scale, subjective selection of threshold values remains a limitation. The developed models by Maser et al., (2012) and Martino et al., (2014) determine one threshold to differentiate only between sound and corroded areas. However, transportation agencies need more conclusive decision making information to determine which concrete should be repaired, or removed and replaced. Therefore, creating condition maps with highlighted delaminated and corrosion areas from thermal IR and GPR data is useful to bridge management teams and bridge inspectors responsible for ratings. It can be observed in Figs. 5 and 6 that the location and geometry of subsurface defect regions were identified. For the IRT testing, the images were taken after the defect had a chance to warm up, thus appearing warmer than the surrounding concrete. The sound concrete areas have the lowest temperature values and highest amplitude measures, while the defected concrete areas have the highest temperature values and amplitude attenuation measures. In spite of the different mechanisms of both techniques and their capabilities of detecting different deterioration types, the condition maps in both figures are comparable. Though the shapes (geometry) of the two analyses do not match exactly, the areas in which delaminations/corrosion were detected have good correlation. Calculating the total delaminated and corroded areas from these thermal and corrosion maps provides a quantitative basis for powerful decision making and hence, for prioritizing alternatives in a bridge deck rehabilitation plan. In general, the total delaminated and corroded areas calculated from Figs. 5 and 6 were 36% and 24%, respectively. Thus, 67% of subsurface defects were identified with either GPR or IRT, or both. This complies with the results of previous studies. For instance, Maser, (2009) reported that in most bridge structures, areas of corrosion are usually associated with delamination even if cracks are not detected directly. Washer et al., (2013) reported that not all delamination can be observed in GPR images. Hence, GPR and IRT should be combined for accurate identification of anomalies in concrete bridge decks. CONCLUSIONS An accurate condition assessment of the extent and severity of bridge deck deterioration is essential for transportation agencies in prioritizing preventive maintenance and
11
rehabilitation to preserve and extend the deck life and reduce its life cycle cost. IRT and GPR represent two NDT technologies that can provide reliable, rapid and cost-effective evaluation. Hence, they were employed on a full-scale bridge deck in the present study. Both methods require post-processing analysis of the acquired data to reveal subsurface anomalies. The findings are presented in terms of condition maps delineating the location of delaminations and corrosion in the surveyed bridge deck. The boundary between the defective and non-defective areas were determined based on a threshold value applied on the recorded concrete surface temperature, and the reflected amplitudes of reinforcing rebar. Accordingly, the percentage of delaminated and corroded areas in the bridge deck were calculated.
IRT testing produces visual delamination images with good location accuracy. However, as a surface temperature method, its detection capability is depth limited. While it is very effective for non-overlaid decks, its effectiveness can be reduced in the presence of overlays. Also, IRT data requires adequate solar radiation and weather conditions to produce the required temperature differentials. The sensitivity of GPR to the presence of chlorides and concrete corrosion makes the technology an ideal tool to detect corroded areas in concrete bridge decks. However, while GPR provides good quantity estimates and general locations of corroded areas, it is not as strong at precisely locating delaminated areas. In addition to rebar depth variation, there are still several factors that may lead to the inefficiency of analyzing GPR reflection amplitudes. These factors include the variation of rebar spacing, surface properties, structural variation and construction quality. Currently, rebar depth variation is the only factor that has been taken into account. GPR survey requires dry pavement conditions, but is not otherwise temperature or weather dependent. In a nutshell, both IRT and GPR testing have strengths and limitations. However, combining the two technologies in inspecting deteriorated bridge decks is very powerful, maximizing the capabilities of each method and compensating for mutual limitations. This approach can enable transportation agencies to not only prioritize which bridge decks need immediate attention, but will also allow them to properly allocate necessary repair funds. ACKNOWLEDGMENTS The authors wish to thank Alex Tarussov, president of Radex Detection Inc. for providing the GPR raw data. REFERENCES ACI 228.2R-13 (2013). “Report on Nondestructive Test Methods for Evaluation of Concrete in
Structures.” ACI Committee 228, American Concrete Institute, Report, 83 p.
Alani, A., Aboutalebi, M., and Kilic, G. (2013). "Applications of ground penetrating radar (GPR) in bridge deck monitoring and assessment." J. of Application Geophysics, Vol. 97, pp: 45-54.

12
ASTM Standard D4788-03 (2013). “Standard Test Method for Detecting Delaminations in Bridge Decks Using Infrared Thermography.” ASTM International, West Conshohocken, PA.
ASTM D6087-08 (2010). “Standard Test Method for Evaluating Asphalt-Covered Concrete Bridge Decks Using Ground Penetrating Radar,” ASTM International, West Conshohocken, PA.
Barnes, C., Trottier, J., and Forgeron, D. (2008). “Improved Concrete Bridge Deck Evaluation Using GPR by Accounting for Signal Depth-Amplitude Effects.” J. of NDT & E International, Vol. 41 (6), pp: 427-433.
Dinh, K., and Zayed, T. (2014). "Innovative Method for Interpreting Ground-Penetrating Radar (GPR) Data from Concrete Bridge Decks." 93rd Annual Meeting, TRB, Washington, DC, pp: 1-11.
Gucunski, N., Imani, A., Romero, F., Nazarian, S., Yuan, D., Wiggenhauser, H., Shokouhi, P., Taffe, A., and Kutrubes, D. (2013). “Non-destructive testing to identify concrete bridge deck deterioration.” 92nd Annual Meeting, TRB, Washington, D.C. SHRP 2 Report, 96 p.
Jain, K., and Bhattacharjee, B. (2011). "Application of fuzzy concepts to the visual assessment of deteriorating reinforced concrete structures." J. of Construction Engineering Management. Vol. 138 (3), pp: 399-408.
Manning, D., and Holt, F. (1982). "Detecting Delaminations in Concrete Bridge Decks." J. of Concrete International, Vol. 34, pp: 1-8.
Maser, K., Martino, N., Doughty, J. and Birken, R. (2012). “Understanding and Detecting Bridge Deck Deterioration Using Ground Penetrating Radar.” Transportation Research Record No. 2313, TRB, pp: 116-123.
Maser, K. (2009). “Integration of Ground Penetrating Radar and Infrared Thermography for Bridge Deck Condition Assessment.” Proceedings of the 7th International Symposium on Non-Destructive Testing in Civil Engineering, Nantes, France, pp: 1-8.
Martino, N., Birken, R., Maser, K., and Wang, M. (2014). “Developing a deterioration threshold model for assessment of concrete bridge decks using ground penetrating radar.” 93rd Annual Meeting, TRB, (No. 14-3861).
Moore, M., Phares, B., Graybeal, B., Rolander, D., and Washer, G. (2001). “Reliability of Visual Inspection of Highway Bridges.” Report, FHWA, RD-01-020, 118 p.
Robert, M. (1982). “Science behind Thermography-Thermal Infrared Sensing for Diagnostics and Control.” J. of Thermosense, Vol. 371, pp: 2-9.
Washer, G., Fenwick, R., and Nelson, S. (2013). “Guidelines for the Thermographic Inspection of Concrete Bridge Components in Shaded Conditions.” 92nd Annual Meeting, TRB, Washington, D.C. pp: 1-14.
Washer, G., Fenwick, R., and Harper, J. (2009). “Effects of Environmental Variables on Infrared Imaging of Subsurface Features in Concrete Bridges.” J. of the Transportation Research Board. Vol. 2108/2109, pp: 107-114.
Zhao, A., Jiang, Y., Wang, W., and Jiaotong, X. (2005). "Exploring independent component analysis for GPR signal processing." Progress in Electromagnetics Research Symposium, Hangzhou, China, pp: 750-753.