non-speech environmental sound classification … · non-speech environmental sound classification...
TRANSCRIPT
International Journal of InnovativeComputing, Information and Control ICIC International c©2012 ISSN 1349-4198Volume 8, Number 5(B), May 2012 pp. 3511–3524
NON-SPEECH ENVIRONMENTAL SOUND CLASSIFICATION USINGSVMS WITH A NEW SET OF FEATURES
Burak Uzkent1, Buket D. Barkana1,∗ and Hakan Cevikalp2
1School of EngineeringUniversity of Bridgeport
No. 126, Park Ave., Bridgeport, CT 06604, [email protected]; ∗Corresponding author: [email protected]
2Department of Electrical-Electronics EngineeringEskisehir Osmangazi UniversityBati Meselik, Eskisehir, Turkey
Received February 2011; revised June 2011
Abstract. Mel Frequency Cepstrum Coefficients (MFCCs) are considered as a methodof stationary/pseudo-stationary feature extraction. They work very well for the classifi-cation of speech and music signals. MFCCs have also been used to classify non-speechsounds for audio surveillance systems, even though MFCCs do not completely reflectthe time-varying features of non-stationary non-speech signals. We introduce a new2D-feature set, used with a feature extraction method based on the pitch range (PR)of non-speech sounds and the Autocorrelation Function. We compare the classificationaccuracies of the proposed features of this new method to MFCCs by using Support Vec-tor Machines (SVMs) and Radial Basis Function Neural Network classifiers. Non-speechenvironmental sounds: gunshot, glass breaking, scream, dog barking, rain, engine, andrestaurant noise, were studied. The new feature set provides high accuracy rates whenused as a classifier. Its usage with MFCCs significantly improves the accuracy rates ofthe given classifiers in the range of 4% to 35% depending on the classifier used, suggest-ing that both feature sets are complementary. SVM classifier using the Gaussian kernelprovided the highest accuracy rates among the classifiers used in this study.Keywords: Environmental sound classification, Feature extraction, Mel-frequency cep-stral coefficients (MFCCs), Support vector machines, Radial basis function (RBF) neuralnetwork
1. Introduction. Over the past several decades, many researchers have been workingon developing audio and video-based surveillance tools to automatically detect abnormalsituations. Audio surveillance systems constitute a popular research area due to theirpotential benefit in both public and private systems [1]. Most systems used by homelandsecurity are based on visual clues to detect an abnormal event, such as a gunshot or glassbreaking. However, this is not enough. Audio systems provide information in many caseswhere video systems fail to detect occurrences reliably – for example, something occursin the dark, and video sensors do not detect it. The use of audio and video surveillancetogether makes any environment safer.
Occurrences that can be detected more effectively by using audio surveillance systemsinclude gunshot, screaming, glass breaking, knocking on a door, talking, footsteps/soundof walking, etc. The audio-based surveillance system can also be used as a complement toa video-based surveillance. The cost of an audio/video system is comparable to a simplevideo system [2].
3511
3512 B. UZKENT, B. D. BARKANA AND H. CEVIKALP
The first step in building a surveillance system is to extract the relevant events from anaudio stream – raw data are processed to extract features that will be used to discriminatebetween normal and abnormal events. The most widely used feature set is known as MelFrequency Cepstrum Coefficients (MFCCs). However, using only MFCCs does not givethe best recognition rates. We can achieve faster rates by using other features togetherwith MFCCs. At the front end of the audio surveillance system, features are extracted.At the backend, classification takes place, using a classifier. Some of the popular pat-tern recognition methods are Hidden Markov Models (HMM), Gaussian Mixture Models(GMM), Artificial Neural Networks (ANN) and Support Vector Machines (SVMs).Audio surveillance systems have been studied by many researchers [3-8,29]. Kuklyte
et al. have studied abnormal events in a noisy environment using an MFCC featureset. There are four main classes in their dataset – explosion, gunshot, screaming as anabnormal event, and subway noise as a normal event. Using HMM as a classifier producesa 93.3% correct classification [3]. Radhakrishnan et al. have studied a hybrid audioanalysis framework for audio surveillance. It includes two parts: (i) audio classificationframework analysis, and (ii) unsupervised audio analysis. The study consists of 126 clipswith suspicious events and 4 clips without an event. The extracted low level featureswere 12 MFCC features for an 8 millisecond frame of audio data. Their database has 4audio classes: banging, footsteps, non-neutral speech, and normal speech. The GaussianMixture Model is applied to the feature set, and an 85% recognition rate was achieved [4].In another study [5], an audio based surveillance system detecting anomalous audio eventsin a public square was presented. Different feature sets (based on temporal, spectral,perceptual, and correlations) were used for each classifier. Two GMM classifiers runningin parallel discriminated data between screams and noise and gunshots and noise. Inthe testing step, they classified each frame by both binary classifiers. The final decisionon whether an event occurred or not was given by computing the logical OR of the twoclassifiers. In [6], the author characterizes unstructured environmental sounds in orderto understand and predict the context that surrounds the agent, and in the process, hedemonstrates the importance of the used feature. It was reported that high dimensionalfeature sets do not always lead to good performance. A smaller feature set is bettersince it reduces the computational cost and running time. Recent work [7] illustrates abetter understanding of audio surveillance systems. Audio event detection in a publictransport vehicle has 5 scenarios: fights between two or more men, two or more women,men and women, as well as violent robbery and bag snatching. In this study, MFCC,Linear Prediction Coefficients, Energy and Perceptual Linear Prediction Coefficients wereused as features, and with these features SVM and GMM provided 75% accuracy forshout detection and 98% accuracy for non-shout event detection.In our study, we introduce a new 2-dimensional feature set for audio surveillance sys-
tems. The new features are determined by using the pitch range (PR) of the sound. Inorder to test the performance of the new feature set, the results are compared with a13-dimensional MFCC feature set (1 (energy) + 12 (MFCC coefficients)). We also testedcombined features. Our audio database has 4 abnormal events (glass breaking, dog bark-ing, scream, and gunshot) and 3 normal events (engine noise, rain, and restaurant noise).Support Vector Machines (SVMs) and Radial Basis Function (RBF) Neural Networks areused as the classifier.
2. Problem Statement and Preliminaries.
Feature Extraction:

NON-SPEECH ENVIRONMENTAL SOUND CLASSIFICATION USING SVMS 3513
Feature extraction can be divided into two major types: stationary (frequency-based)and non-stationary (time-frequency based) feature extraction. Stationary feature extrac-tion produces an overall result detailing the frequencies contained in the entire signal.With stationary feature extraction, no distinction is made on where these frequenciesoccurred in the signal. However, non-stationary feature extraction divides the signal upinto discrete time units. This allows frequency to be identified as occurring in a particulararea of the signal, and this helps someone to understand the signal [9]. Using MFCC as astationary/pseudo-stationary feature extraction technique is standard, and this techniqueperforms very well for speech and music signals. MFCCs are also used for non-speechsound recognition [9], although they do not completely reflect the time varying featuresof non-stationary non-speech signals.
Most non-speech sounds have different characteristics, and they can be classified ac-cording to how rapidly they change over time as stationary, quasi-stationary, and non-stationary. Stationary sounds do not contain large or rapid changes in their spectrumover time. Quasi-stationary sounds have a mainly constant spectrum over time. Non-stationary sounds contain large or rapid changes in their spectrum over time. Usingconventional digital signal processing techniques, such as the Fast Fourier Transform andspectral subtraction, one can recognize stationary sounds. However, it is difficult to rec-ognize quasi-and non-stationary sounds because of their changing characteristics. Theproposed feature extraction method characterizes different non-speech sounds in the timedomain, while the MFCC feature set characterizes it in the frequency domain.
Since most environmental sounds, by nature, are non-stationary, non-stationary featureextraction techniques are better for recognizing environmental sounds. We present a newfeature extraction technique, based on the pitch range of non-speech environmental soundsand using the Autocorrelation Function (ACF).
2.1. PR-based feature set. Pitch is a perceptual feature of sound and its perceptionplays an important part in human hearing and understanding of different sounds. In anacoustic environment, human listeners are able to recognize the pitch of several real-timesounds and make efficient use of the pitch to acoustically separate a sound in a mixture[10]. However, noise-like non-speech audio signals such as street noise, rain, the sound ofa fan, a scream, a gunshot, or a glass breaking do not have a constant pitch value but arange of values.
Pitch tracking in real-time situations involves additional steps beyond frame-by-framepitch detection to enhance the quality of the measured pitch [11]. The ACF techniquegenerates the instantaneous pitch for the input signal which will invariably contain sometracking errors. Most noticeable, if the input signal changes its pitch during an analysisframe, the resulting pitch measurement may be misleading. Since non-speech audio signalsmay change their acoustical characteristics in time, PR-based feature extraction focuseson the range of the pitch of the noise signal instead of the pitch itself.
The deterministic autocorrelation function of a discrete-time signal is defined as
φ[k] =∞∑
m=−∞
x[m]x[m+ k], (1)
where x[m] is the signal. If the signal is stationary random or periodic, the appropriatedefinition of the ACF is
φ[k] = limN→∞
1
(2N + 1)
N∑m=−N
x[m]x[m+ k]. (2)

3514 B. UZKENT, B. D. BARKANA AND H. CEVIKALP
In both cases, the ACF contains a great deal of information about the detailed struc-ture of the signal [12]. It contains the energy, and it emphasizes periodicity. As thedeterministic ACF of the finite-length windowed segment of the signal (x[m]w[n − m]),the short-time ACF at analysis time n is given as
Rn[k] =∞∑
m=−∞
(x[m]w[n−m])(x[m+ k]w[n− k −m]). (3)
The quantity n determines the shift of the window and is therefore the analysis time. Theindex k is called the autocorrelation lag index, and it is the amount of the relative shiftbetween the sequences (x[m]w[n−m]) and (x[m + k]w[n − k −m]). In (3), the windowis moved to the analysis time n in order to select a segment of the signal x[m]w[n −m]from which to find values of m that support the window w[n−m]. Assuming the windowis of finite-duration, we can write (3) as
Rn[k] =L−1−k∑m=0
(x[n+m]w′[m])(x[n+m+ k]w′[k +m]), (4)
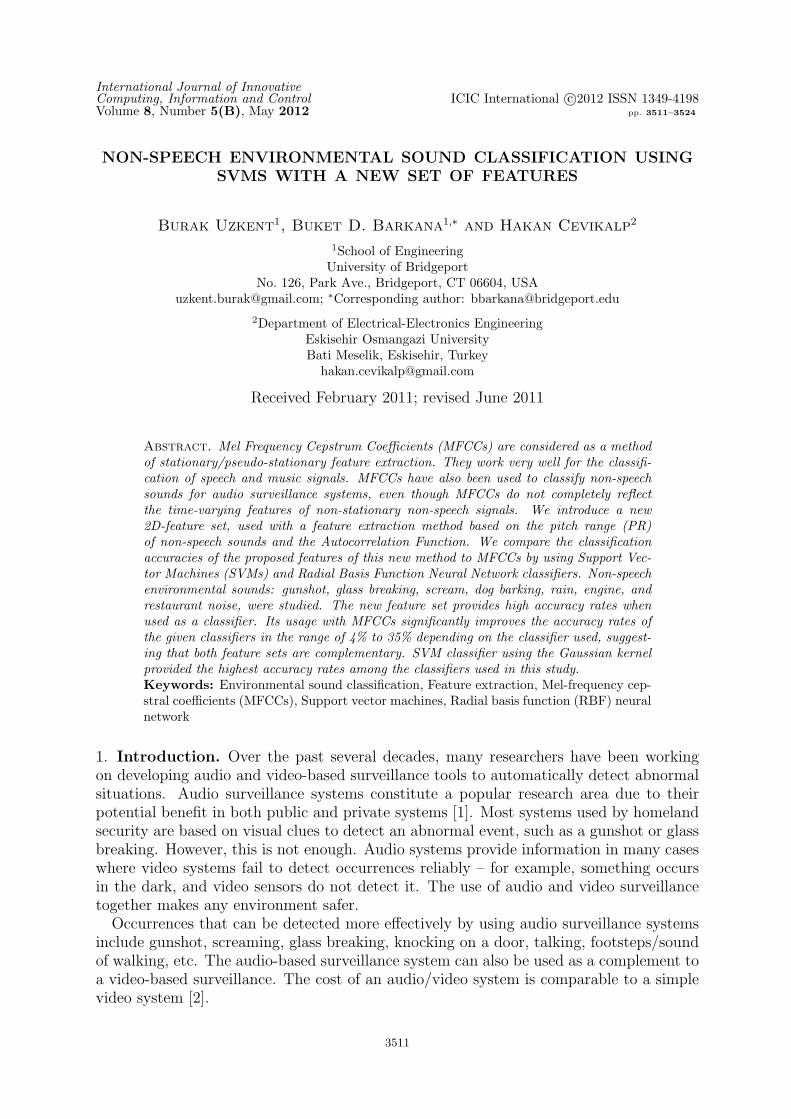
where w′[m] = w[−m], and L is the window size. Equation (4) measures the extentto which a signal correlates with a time offset (k) version of itself. Because a periodicsignal will correlate strongly with itself, we can expect to find a peak in the ACF at thevalue corresponding to a multiple of its period. When Rn[k] is large, then signal samplesspaced by k are highly correlated. Pitch values are calculated by using the short-timeACF method. Figure 1 illustrates this operation.The time delay, T , between the first and second positive peak values of the ACF for
each window is calculated as shown in Figure 1(b). Pitch (P ) is defined as the reciprocalof the time delay (T ) in (6), where M is the total number of windows for any sound event.
T (i), 1 < i < M (5)
P (i) =1
T (i), 1 < i < M (6)
We define two features using pitch range. Feature 1 is defined in (7) as the ratio of themaximum to the minimum of the pitch range, and feature 2 is defined in (8) as the ratioof the standard deviation to the mean value of the pitch range, with
feature 1 = max{P (i)}/min{P (i)}, (7)
feature 2 = std{P (i)}/P , (8)
P =1
N
M∑i=1
P (i), (9)
and
std{P (i)} =
(1
N − 1
M∑i=1
(P (i)− P )2
)1/2
. (10)
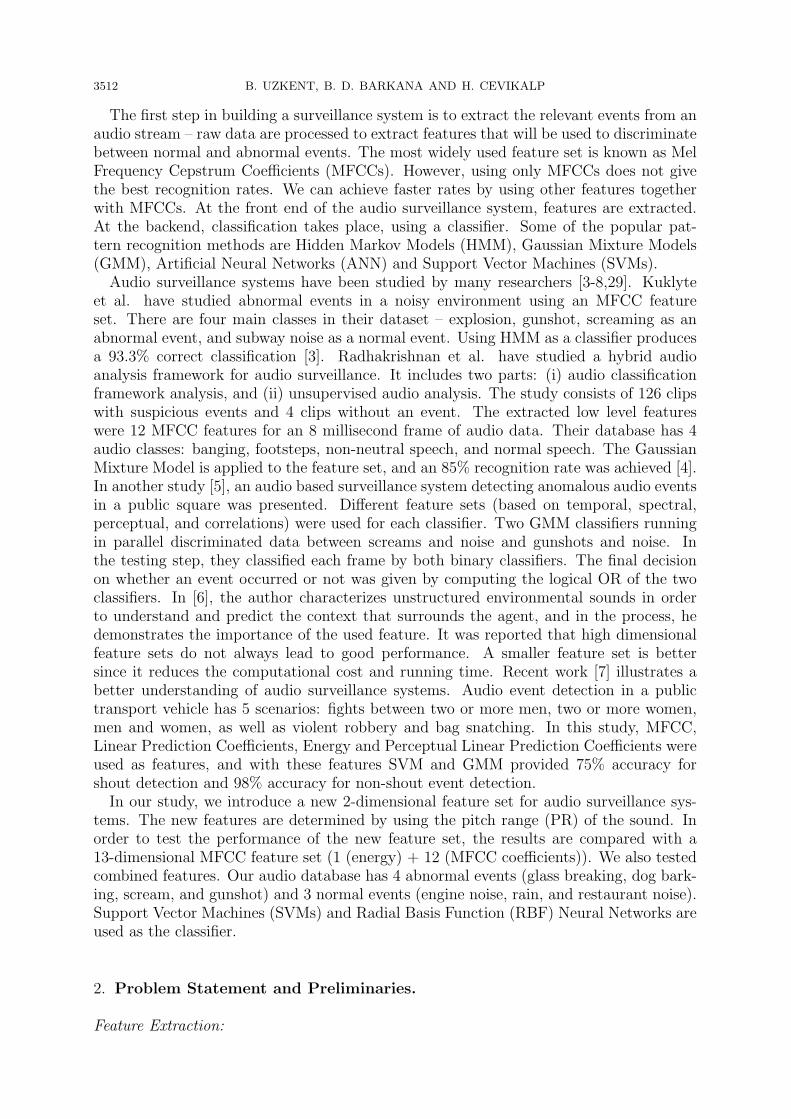
The typical pitch ranges for non-speech environmental sounds (gunshot, glass breaking,dog barking, scream, engine noise, rain, and restaurant noise) are depicted in Figure 2.Each sound has different characteristics in the time domain.In this study, non-speech environmental sound samples were taken from the Freesound
Project database and other reliable sources. The Freesound Project is a collaborativedatabase of Creative Common licensed sounds [13]. We re-sampled the sounds of a dogbarking, gunshot, a glass breaking, screaming, engine noise, rain, and restaurant noise;background noise was sampled at 96 kHz to build our database. In order to have both

NON-SPEECH ENVIRONMENTAL SOUND CLASSIFICATION USING SVMS 3515
a good time resolution and a wide frequency bandwidth, 16 bits resolution signals wereused. A wide frequency band will cover harmonics as well as impulsive (transient) sounds.Since most non-speech sound signals change their acoustical characteristics very quicklyin time, we used a small window length in our calculations. We applied 2.1 millisecondrectangular windows with 50% overlap to each sound to calculate the pitch range. Theselected sound classes and the profile of the PR-based feature set are given in Table 1.
(a)
(b)
Figure 1. (a) The auto-correlation function (ACF); (b) the calculation oftime delay between the first positive peak and the second positive peak (for“glass breaking” sound)

3516 B. UZKENT, B. D. BARKANA AND H. CEVIKALP
Figure 2. Typical pitch range of the non-speech environmental sounds
Table 1. The profile of the PR-based feature set
Non-speech Total Feature 1 Feature 2sound events Samples Mean STD Min-Max Mean STD Min-Max
Gunshot 51 4.84 1.51 1.73-7.86 1.43 0.12 1.18-1.77Glass B. 27 7.22 1.01 4.21-7.96 1.22 0.09 1.11-1.45Dog B. 60 3.25 1.53 1.76-1.96 1.41 0.17 1.04-1.84Scream 24 3.49 0.74 2.18-5.43 1.43 0.27 1.05-2.07Engine 19 1.64 0.89 1.08-4.72 3.91 2.81 1.17-13.1Rain 52 3.27 3.39 1.27-18.2 4.17 0.87 2.54-6.7
Restaurant 25 2.84 1.29 1.18-6.40 3.11 0.63 1.20-4.25

NON-SPEECH ENVIRONMENTAL SOUND CLASSIFICATION USING SVMS 3517
Glass breaking sounds include window and bottle breaking. The mean value of feature 1for this type of sound is calculated to be 7.22, which is the highest among all classes. Thestandard deviation value for feature 2 is calculated to be slightly lower than that of theother sounds. Gunshot is classified as an impulsive sound. Its frequency bandwidth isextended, because of sharp temporal attacks. This feature has been reflected in the rangefor feature 1. This class of sounds has the widest range after “rain”. Normal events (rainand engine noise) have higher mean values than the other sounds for feature 2. Barkingdog sounds include different dog breeds, such as the poodle and bulldog. As seen in Table1, the PR-based feature set is capable of differentiating abnormal and normal events inour database.
2.2. MFCC feature set. MFCC vectors are used in audio surveillance systems in orderto detect abnormal events. The procedure for extracting MFCC vectors from speechresults in the loss of much information important to the structure of the original speech.MFCC vectors are extracted in accordance with the ETSI Aurora Extended Front Endstandard [14]. During the MFCC extraction procedure, phase information is lost in themagnitude operation. Due to the non-uniform spacing of the mel-scale filterbank channels,the lowest frequency filterbank channels have the best frequency resolution of 64 Hz. Forhigher frequency filterbank channels, the frequency resolution is worse [15]. This issuehas a negative effect on the recognition system which classifies non-speech audio signals(gunshot, screams, glass breaking, dog barking, engine, etc.), since those signals havestrong high frequency components.
Classification Methods
SVMs and RBF neural networks, a special type of Artificial Neural Networks (ANNs),have been studied extensively, and they have attracted widespread attention for theiranalysis performance. SVMs and RBF Neural Networks are used as a method of clas-sification in this study. We also tested our feature sets by using the Nearest Neighbormethod (NN).
Support Vector Machines (SVMs):
The Support Vector Machine (SVM) classifier is considered one of the best methodsto deal with tough classification problems, such as those arising in speech recognition,visual object classification, text classification [16-18,28]. The SVM method was originallyproposed as a binary classification method, and it finds the optimal separating hyperplanethat maximizes the distance from the closest points of the classes to the separating hy-perplane. Therefore, it is also called the maximum margin classifier [19]. Maximizing themargin between two classes on the training data usually leads to a better classificationperformance on the test data, especially in high-dimensional spaces when using a limitednumber of samples. Figure 3 demonstrates how SVMs work for two linearly separableclasses.
As can be seen in the figure, the margin between classes is determined by the nearestdata samples which are also called the support vectors. Now, consider a binary classifica-tion problem with the training data given in the form {xi, yi}, i = 1, . . . , n, yi ∈ {−1,+1},xi ∈ <d. The points x which lie on the separating hyperplane satisfy 〈w,x〉+b = 0, wherew is the normal of the separating hyperplane, |b|/||w|| is the perpendicular distance fromthe hyperplane to the origin, and ||w|| is the Euclidean norm of w. For any separatinghyperplane, all points xi in the positive class satisfy 〈w,xi〉 + b > 0 and all points xi inthe negative class satisfy 〈w,xi〉+ b < 0, so that yi(〈w,xi〉+ b) > 0 for all training datapoints. In the linearly separable case, finding the best separating hyperplane is formulated

3518 B. UZKENT, B. D. BARKANA AND H. CEVIKALP
Figure 3. An example of the classification of two classes by the SVM clas-sifier. The margin is determined by the samples near the decision boundary.This figure is adapted from [20].
by the following quadratic optimization problem
min1
2||w||2 + C
n∑i=1
ξi
s.t. yi(〈w,xi〉+ b)− 1 + ξi ≥ 0, ξi ≥ 0,(11)
where ξis are slack variables for the samples that violate the constraints and C is the errorpenalty term that must be set by the user. The dual of the optimization problem givenin (11) is equivalent to
minα
1
2
n∑i=1
n∑j=1
αiαjyiyj 〈xi,xj〉 −n∑
i=1
αi
s.t.n∑
i=1
yiαi = 0, 0 ≤ αi ≤ C,(12)
where αis are the Lagrange coefficients we want to find. The objective function of thequadratic programming problem given in (12) is convex, and a global minimum exists.Once we compute the optimal coefficients, the normal of the separating hyperplane has an
expansion in the form w =n∑
i=1
αiyixi where nonzero coefficients αi occur if the associated
sample xi precisely satisfies the constraints in (11). After we determine the best separatinghyperplane, a new sample x is classified based on the sign of the decision function f(x) =〈w,x〉+ b. For the linearly non-separable data, the data samples aremapped into a higher-dimensional space where the classes become separable and we find
the best separating hyperplane in the mapped space. Note that the objective function of(12) can be written in terms of the dot products of samples, which allows the use of thekernel trick [21]. Thus, by using the kernel trick – i.e., replacing 〈xi,xj〉 with the kernelfunction k(xi,xj) = 〈φ(xi), φ(xj)〉, where φ : <d → = is the mapping function from theinput space to the mapped space = – we can find the best separating hyperplane featuresin the mapped space. As a result, more complex nonlinear decision boundaries betweenclasses can be approximated by using this trick.

NON-SPEECH ENVIRONMENTAL SOUND CLASSIFICATION USING SVMS 3519
It should be noted that the SVM classifier was originally designed for binary classifica-tion, and extending this formulation to more than two classes makes it very complex andis therefore generally avoided. Yet, many classification applications have more than twoclasses, as in our case. The multi-class SVM problems are dealt with constructing severalbinary classifiers and combining them based on some strategies. There are various waysto achieve this goal. In our study, we used the most popular three strategies, namely, one-against-the-rest (OAR), one-against-one (OAO) [22], and directed acrylic graph (DAG)SVMs [23]. For a C-class classification problem, OAR strategy trains C binary classifiers,in which each classifier separates one class from the remaining C−1 classes. All classifiersare trained on the entire training set, and the class label of a test sample is determinedbased on the highest output value of the classifier in the ensemble. The OAO strategyconstructs all possible C(C − 1)/2 binary classifiers out of C classes. The decision of theensemble is typically made using the max-wins algorithm: each OAO classifier casts onevote for its preferred class, and the final decision is made for the class with the most votes.The DAG strategy first trains C(C − 1)/2 binary classifiers and uses a directed acyclicgraph (DAG) during the testing phase.
RBF Neural Network Classifier:
Artificial neural networks are widely used in classification applications. Among thesenetworks, the RBF network forms a special architecture with several distinctive features.A typical RBF neural network classifier has three layers, namely input, hidden, and outputlayer. The input layer of the network is made of source nodes that connect the coordinatesof the input vector to the nodes in the second layer. The second layer, the only hiddenlayer in the network, includes processing units called the hidden basis function units whichare located on the centers of well chosen clusters. Each hidden layer node adopts a radialactivated function, and output nodes implement a weighted sum of hidden unit outputs[24]. The output layer is linear, and it produces the predicted class labels based on theresponse of the hidden units. The structure of multi-input and multi-output (MIMO)RBF neural network is represented by Figure 4.
The performance of the RBF network depends highly on the number and initial loca-tions of the hidden units. Generally, the positions of the hidden units are initialized usingunsupervised clustering algorithms such as k-means or Expectation Maximization or su-pervised clustering algorithms such as the ones introduced in [25,26]. In this study, weinitialized the hidden unit centers using the k-means clustering. Unlike the SVM classifier,
Figure 4. Typical MIMO RBF neural network structure

3520 B. UZKENT, B. D. BARKANA AND H. CEVIKALP
the RBF neural network classifier returns a local minimum, thus there is no guaranteethat the every training phase will yield the same classifier.
3. Main Results. To assess the performance of the new feature set, we applied theSVM and RBF network classifiers to the extracted features. Besides PR-based features,MFCC based features were also tested. As a baseline, we computed the classificationaccuracies using the Nearest Neighbor (NN) classification rule. For the SVM classifier,the LIBSVM kit that is available as shareware [27] was used. LIBSVM is capable ofhandling classification tasks with large datasets. Since a dog barking, gunshot, a glassbreaking, screaming, engine noise, rain, and restaurant noise signals would be classifiedthrough SVMs, our study is a problem of multiclass classification. We used the OAO,OAR, and DDAG methods for extending the binary SVM classifier to the multi-class case.In this study, 258 audio event samples were used for classification. We used linear and
Gaussian kernels for the SVM classifier. To obtain a good performance, the regularizationparameter C, which determines the trade-off between minimizing the training error andmodel complexity, and the width parameter σ of the Gaussian kernel function have beenchosen carefully through 5-fold cross-validation. The error penalty parameter C in (9)was set to the value 100 for the OAR and OAO methods and it was set to 50 for the DAGmethod. The best classification accuracies are obtained using the Gaussian kernel withσ = 3 during cross-validation. For the RBF network classifier, the unsupervised k-means(KM) clustering algorithm is used to initialize the centers of the hidden layer units. Thenumber of hidden units is set to 20 by using a 5-fold cross-validation and by consideringthe numbers in the interval [10, 50].Since we have a limited number of samples, we used the leave-one-out technique to test
the classification accuracies of the methods. Leave-one-out uses one sample for the testingwhile the remaining samples are used for training. This procedure is repeated for everysample in the database. Tables 2 and 3 show the classification accuracies obtained usingthe standard SVM classifier with the linear and Gaussian kernels, respectively. Table 4shows the classification accuracies obtained using the RBF Neural Network classifier andTable 5 shows the accuracies using the Nearest Neighbor classifier.As shown in Tables 2 and 3, the Gaussian kernel outperforms the linear kernel. The
Gaussian kernel nonlinearly maps samples into a higher dimensional space, so it, unlikethe linear kernel, can handle the case when the relation between class labels and attributesis nonlinear. The OAO method is slightly better than the other methods for the Gaussian
Table 2. The classification accuracies (%) for SVM classifier with thelinear kernel
SVM WITH LINEAR KERNELPR MFCC PR + MFCC
Classes OAR OAO DAG-SVM OAR OAO DAG-SVM OAR OAO DAG-SVMGunshot 7.8 58.8 58.8 76.4 64.7 62.7 84.3 86.2 84.3Glass B. 85.1 77.7 77.7 25.9 37.0 44.4 74.0 81.4 81.4Dog B. 85.0 81.6 81.6 85.0 76.6 80.0 83.3 78.3 83.3Scream 58.3 50.0 54.1 45.8 41.6 54.1 75.0 75.0 83.3Engine 36.8 42.1 36.8 57.8 63.1 47.3 57.8 63.1 57.8Rain 98.0 80.7 80.7 55.7 80.7 80.7 96.1 98.0 98.0Restaurant 3.7 55.5 59.2 66.6 85.1 81.4 88.8 88.8 88.8OverallAccuracy
58.5 68.6 68.9 64.3 68.2 68.9 83.7 84.4 85.6

NON-SPEECH ENVIRONMENTAL SOUND CLASSIFICATION USING SVMS 3521
Table 3. The classification accuracies (%) for SVM classifier with theGaussian kernel
SVM WITH THE GAUSSIAN KERNELPR MFCC PR + MFCC
Classes OAR OAO DAG-SVM OAR OAO DAG-SVM OAR OAO DAG-SVMGunshot 62.7 64.7 64.7 90.1 90.1 90.1 92.1 94.1 94.1Glass B. 74.0 85.1 85.1 62.9 59.2 62.9 85.1 88.8 88.8Dog B. 80.0 80.0 78.3 86.6 86.6 86.6 88.3 88.3 88.3Scream 54.1 62.5 62.5 54.1 70.8 66.6 66.6 83.3 83.3Engine 47.3 42.1 36.8 57.8 68.4 63.1 57.8 68.4 63.1Rain 86.5 88.4 88.4 94.2 94.2 92.3 96.1 96.1 96.1Restaurant 70.3 55.5 59.2 85.1 81.4 85.1 81.4 81.4 81.4OverallAccuracy
72.0 72.8 72.4 81.7 83.3 82.9 86.0 89.1 88.7
Table 4. The classification accuracies (%) for the RBF neural network classifier
THE RBF NEURAL NETWORK CLASSIFIERClasses PR MFCC PR + MFCCGunshot 49.02 78.43 84.31Glass B. 37.04 44.44 48.15Dog B. 61.67 86.67 91.67Scream 58.33 66.67 79.17Engine 52.63 57.89 63.16Rain 59.62 59.62 94.23Restaurant 60.00 76.00 80.00OverallAccuracy
55.04 70.15 81.78
Table 5. The classification accuracies (%) for the NN classifier
THE NEAREST NEIGHBOUR CLASSIFIERClasses PR MFCC PR + MFCCGunshot 66.6 90.1 92.1Glass B. 62.9 40.7 81.4Dog B. 75.0 81.6 85.0Scream 58.3 62.5 66.6Engine 52.6 52.6 57.8Rain 82.6 100.0 100.0Restaurant 51.8 85.1 88.8OverallAccuracy
68.6 79.8 86.4
kernel. It should be noted that the NN classifier usually outperforms the SVM classi-fier using the linear kernel, but the SVM classifier using the Gaussian kernel beats theNN classifier. The application of the PR-based features with the MFCC based featuresdemonstrates the best performance for all classifiers in this study. The accuracy ratehas improved by approximately 5% for all methods. The most significant improvement(19.4%) has been observed in the classifier using the linear kernel with OAR strategy.

3522 B. UZKENT, B. D. BARKANA AND H. CEVIKALP
These improvements show that the PR-based features carry different feature informationthan the MFCC features of non-speech audio signals.In Table 5, the overall classification accuracy for the RBF Neural Network classifier is
calculated as 55.04% for the PR-based classifier versus 70.15% for the MFCCs classifier.Its usage along with the MFCC feature set improved the classification accuracies of classesin the range of 4% to 35%. For a MFCCs + PR-based feature set, test accuracy iscalculated around 81.78%.Overall classification accuracies of the feature sets by different classifiers are given in
Figure 5.
Figure 5. Overall classification accuracies of the feature sets by different classifiers
The proposed PR-based classifier using only a 2-dimensional feature set has been shownto be very promising for use in the recognition of non-speech signals. Its usage withMFCCs improves the accuracy rates of the given classifiers in the range of 4% to 19.4%,suggesting that they are complementary. It is important to increase the classificationaccuracies of non-speech audio events. Audio-based surveillance tools can be used asa complement to video-based surveillance to automatically detect abnormal events andemergency situations. It can be used to detect activity in areas outside of the camera’sview. The ability of audio to cover a 360-degree area enables a video surveillance systemto extend its coverage beyond a camera’s field of view. It can also react to events in areastoo dark for the video motion detection functionality to work properly. For example,when sounds, such as the breaking of a window, gunshot, scream, or dog barking, aredetected, they can trigger a network camera to send and record video and audio, sende-mail or other alerts, and activate external devices such as alarms.
4. Conclusions. In an acoustic environment, listeners can recognize the pitch of sev-eral real-time sounds and separate a sound in a mixture. We have introduced a newlydeveloped pitch range (PR) based feature set in order to classify non-speech environ-mental sounds, gunshot, glass breaking, scream, dog barking, rain, engine, and restaurantnoise. The performance of the feature set is compared with the performance of well knownMFCCs using support vector machines, the RBF neural network classifier, and the nearestneighbour classifier. The LIBSVM tool is used with the OAR, the OAO, the DAG-SVM,with Gaussian and linear kernels for SVM classifier. Our results show that the proposed

NON-SPEECH ENVIRONMENTAL SOUND CLASSIFICATION USING SVMS 3523
2-dimensiaonal PR-based feature set provides high accuracy rates as a classifier. Its us-age with MFCCs significantly improves the accuracy rates of the given classifiers in therange of 4% to 35% depending on the classifier used, suggesting that both feature sets arecomplementary. SVM classifier using the Gaussian kernel provided the highest accuracyrates among the classifiers used in this study.
REFERENCES
[1] A. Harma, M. F. McKinney and J. Skowronek, Automatic surveillance of the acoustic activityin our living environment, Proc. of the IEEE International Conference on Multimedia and Expo,Amsterdam, 2005.
[2] P. Atrey, N. Maddage and M. Kankanhalli, Audio based event detection for multimedia surveillance,Proc. of the IEEE International Conference on Acoustics, Speech, and Signal Processing, 2006.
[3] J. Kuklyte, P. Kelly, C. Conaire, N. E. O’Connor and L. Xu, Anti-social behavior detection inaudio-visual surveillance systems, The Workshop on Pattern Recognition and Artificial Intelligencefor Human Behavior Analysis, Reggio Emilia, Italy, 2009.
[4] R. Radhakrishnan, A. Divakaran and P. Smaragdis, Audio analysis for surveillance applications,IEEE Workshop on Applications of Signal Processing to Audio and Acoustics, 2005.
[5] S. Ntalampiras, I. Potamitis and N. Fakotakis, On acoustic surveillance of hazardous situations,Proc. of the International Conference on Acoustics, Speech and Signal Processing, 2009.
[6] S. Chu, Unstructured audio classification for environment recognition, Proc. of the 23rd AAAI Con-ference on Artificial Intelligence, 2008.
[7] J.-L. Rouas, J. Louradour and S. Ambellouis, Audio events detection in public transport vehicle,Proc. of the IEEE Intelligent Transportation Systems Conference, pp.733-738, 2006.
[8] B. Uzkent, B. D. Barkana and J. Yang, Automatic environmental noise source classification modelusing fuzzy logic, Expert Systems with Applications, 2011.
[9] M. Cowling and R. Sitte, Comparision of thecniques for environmental sound recognition, PatternRecognition Letters, vol.24, pp.2895-2907, 2003.
[10] S. Bregman, Auditory Scene Analysis: The Perceptual Organization of Sound, MIT Press, Cam-bridge, MA, 1990.
[11] P. Cuadra, A. Master and C. Sapp, Efficient pitch detection techniques for interactive music, Proc.of the International Computer Music Conference, Havana, Cuba, pp.403-406, 2001.
[12] L. R. Rabiner and R. W. Schafer, Theory and Applications of Digital Speech Processing, 1st Edition,Prentice Hall, 2011.
[13] The Freesound Project, http://www.freesound.org, 2009.[14] A. Sorin and T. Ramabadram, Extended advanced front end algorithm description, version 1.1, Tech.
Rep. ES 202 212, ETSI STQ-Aurora DSR Working Group, 2003.[15] J. Darch, B. Milner and S. Vaseghi, MAP prediction of formant frequencies and voicing class from
MFCC vectors in noise, Speech Communication, vol.48, pp.1556-1572, 2006.[16] C. Cortes and V. Vapnik, Support vector networks, Machine Learning, vol.20, pp.273-297, 1995.[17] A. Ganapathiraju, J. Hamaker and J. Picone, Support vector machines for speech recognition, Proc.
of the ICSLP, Sydney, Australia, 1998.[18] O. Chapelle, P. Haffner and V. N. Vapnik, Support vector machines for histogram-based image
classification, IEEE Transactions on Neural Networks, vol.10, no.5, pp.1055-1064, 1999.[19] C. J. C. Burges, Tutorial on support vector machines for pattern recognition, Data Min. Knowl.
Discovery, vol.2, pp.121-167, 1998.[20] T. K. Truong, L. C. Chien and S. H. Chen, Segmentation of speech signals from multidialog envi-
ronment using SVM and wavelet, Pattern Recognition Letters, vol.28, pp.1307-1313, 2007.[21] B. Scholkopf, Support Vector Learning, Ph.D. Thesis, Informatik der Technischen Universitat, 1997.[22] C. Hsu and C. Lin, A comparison of methods for multi-class support vector machines, IEEE Trans.
Neural Networks, vol.13, pp.415-425, 2002.[23] J. C. Platt, N. Cristianini and J. Shawe-Taylor, Large margin dags for multi-class classification, Adv.
Neural Inform. Process. Syst., pp.547-553, 2000.[24] K. Meng, Z. Y. Dong, D. H. Wang and K. P. Wong, A self-adaptive RBF neural network classifier for
transformer fault analysis, IEEE Transactions on Power Systems, vol.25, no.3, pp.1350-1360, 2010.[25] H. Cevikalp, D. Larlus and F. Jurie, A supervised clustering algorithm for the initialization of
RBF neural network classifiers, Proc. of the 15th IEEE Signal Processing and CommunicationsApplications Conference, Eskisehir, Turkey, 2007.

3524 B. UZKENT, B. D. BARKANA AND H. CEVIKALP
[26] B. Scholkopf, K. K. Sung, C. J. C. Burges, F. Girosi, P. Niyogi, T. Poggio and V. Bapnik, Comparingsupport vector machines with Gaussian kernels to radial basis function classifiers, IEEE Transactionson Signal Processing, vol.45, no.10, pp.2758-2765, 1997.
[27] H. Cevikalp, New clustering algorithms for the support vector machine based hierarchical classifica-tion, Pattern Recognition Letters, vol.31, pp.1285-1291, 2010.
[28] C.-W. Tsai, K.-M. Cho, W.-S. Yang, Y.-C. Su, C.-S. Yang and M.-C. Chiang, A support vector ma-chine based dynamic classifier for face recognition, International Journal of Innovative Computing,Information and Control, vol.7, no.6, pp.3437-3455, 2011.
[29] A. Shibata, M. Konishi, Y. Abe, R. Hasegawa, M. Watanabe and H. Kamijo, Neuro based classi-fication of facility sounds with background noises, International Journal of Innovative Computing,Information and Control, vol.6, no.7, pp.2861-2872, 2010.