(‘non standard finance’, ‘nsf’, the ‘company’ or the...
TRANSCRIPT
PRESS RELEASE
Non-Standard Finance plc
(‘Non-Standard Finance’, ‘NSF’, the ‘Company’ or the ‘Group’)
Unaudited Full Year Results to 31 December 2017 13 March 2018
Operational highlights • Combined loan book up 30% on a like-for-like basis to £247.9m before fair value adjustments
(£259.8m after fair value adjustments) at 31 December 2017 • Reduced rate of impairment for the Group as a whole of 24.0% of normalised revenue
1 (2016: 29.2%)
• 34 new offices opened and over 650 new staff and self-employed agents added • Total number of customers up 24% to 169,000 (2016: 136,500); up 16% on a pro forma basis • Acquisition of George Banco to create the clear number two in the UK’s guarantor loans market • Each of our three divisions has a fully-scalable operating platform to support our future growth plans • £260m of long-term debt funding now in place Financial highlights
• Normalised revenue
1 up 48% to £119.8m (2016: £81.1m); reported revenue of £107.8m (2016:
£72.8m) • Normalised operating profit
2 before temporary additional commission up 72% to £26.9m (2016:
£15.6m); reported operating profit of £3.8m (2016: operating loss of £5.2m) • Normalised profit after tax
2 before temporary additional commission up 42% to £13.5m (2016: £9.5m);
the reported loss after tax of £10.3m (2016: £8.0m) is after fair value adjustments, amortisation of acquired intangibles and exceptional items
• Recommended final dividend of 1.70p per share (2016: 0.9p) making a total dividend for the year of 2.20p per share (2016: 1.2p)
• Current trading: Each of our businesses has made a good start to the year with continued strong loan book growth whilst maintaining tight control of impairment
Year to 31 December 2017 2016 % change
£'000 £'000
Normalised revenue1 119,756 81,099 +48%
Reported revenue 107,771 72,757 +48%
Normalised operating profit2 before temporary additional commission 26,868 15,595 +72%
Reported operating profit (loss) 3,802 (5,232) n/a
Normalised profit before tax before temporary additional commission2 16,387 12,111 +35%
Reported (loss) before tax (13,021) (9,342) -39%
Normalised profit after tax before temporary additional commission2 13,461 9,492 +42%
Reported (loss) after tax (10,335) (7,998) -29%
Normalised earnings per share3
before temporary additional commission
4.25p 3.09p +38%
Reported (loss) per share (3.26)p (2.60)p -25%
Full year dividend per share 2.20p 1.20p +83% 1 Adjusted to exclude fair value adjustments
2 Adjusted to exclude fair value adjustments, amortisation of acquired intangibles and exceptional items
3Basic and diluted earnings (loss) per share based on the weighted average number of shares in issue of 316,901,254 (2016: 307,315,588)
John van Kuffeler, Group Chief Executive Officer, said
“2017 was a year of delivery with significant organic loan book growth whilst impairment reduced from 29% to 24% of normalised revenue. I am pleased to say that these trends have continued into the current year. With strong market positions in each of our chosen segments, a clear plan for growth and long-term funding in place, we remain confident in the full year outlook and are pleased to recommend a final dividend to 1.70p per share making 2.20p for the year as a whole (2016: 1.2p), an increase of 83% over the prior year.”
2
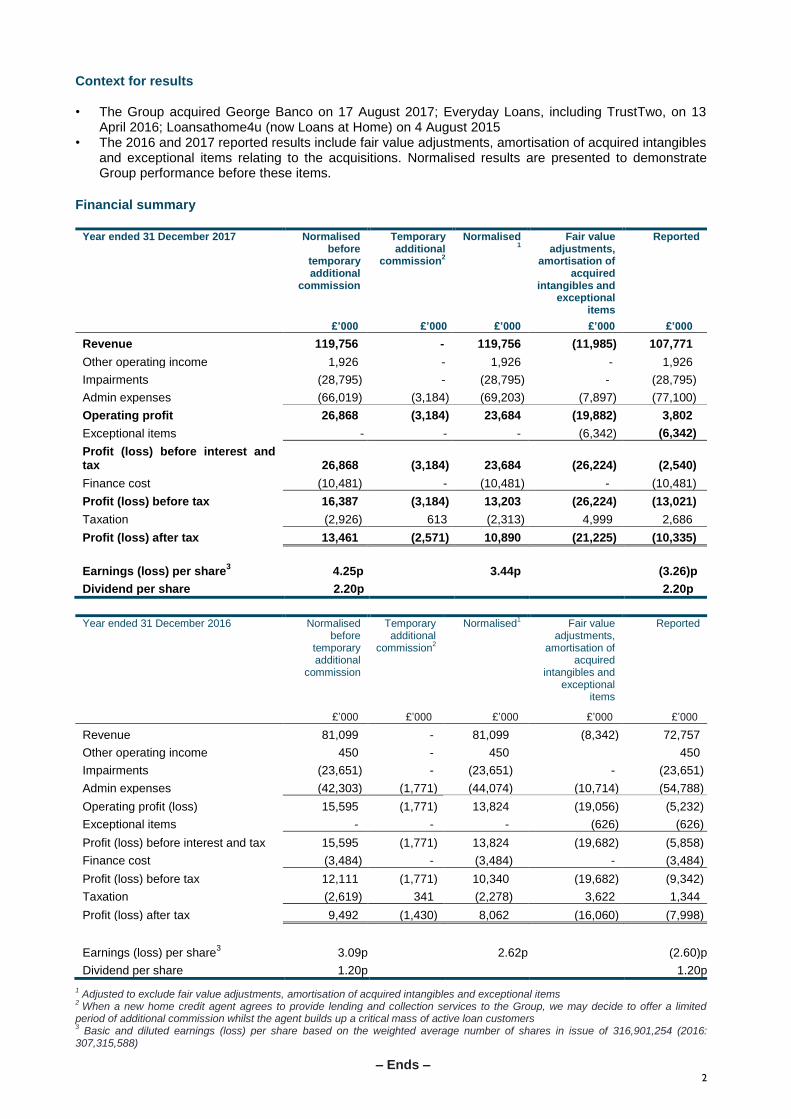
Context for results
• The Group acquired George Banco on 17 August 2017; Everyday Loans, including TrustTwo, on 13 April 2016; Loansathome4u (now Loans at Home) on 4 August 2015
• The 2016 and 2017 reported results include fair value adjustments, amortisation of acquired intangibles and exceptional items relating to the acquisitions. Normalised results are presented to demonstrate Group performance before these items.
Financial summary
Year ended 31 December 2017
Normalised before
temporary additional
commission
Temporary additional
commission2
Normalised1
Fair value adjustments,
amortisation of acquired
intangibles and exceptional
items
Reported
£’000 £’000 £’000 £’000 £’000
Revenue 119,756 - 119,756 (11,985) 107,771
Other operating income 1,926 - 1,926 - 1,926
Impairments (28,795) - (28,795) - (28,795)
Admin expenses (66,019) (3,184) (69,203) (7,897) (77,100)
Operating profit 26,868 (3,184) 23,684 (19,882) 3,802
Exceptional items - - - (6,342) (6,342)
Profit (loss) before interest and tax 26,868 (3,184) 23,684 (26,224) (2,540)
Finance cost (10,481) - (10,481) - (10,481)
Profit (loss) before tax 16,387 (3,184) 13,203 (26,224) (13,021)
Taxation (2,926) 613 (2,313) 4,999 2,686
Profit (loss) after tax 13,461 (2,571) 10,890 (21,225) (10,335)
Earnings (loss) per share3 4.25p 3.44p (3.26)p
Dividend per share 2.20p 2.20p
Year ended 31 December 2016
Normalised before
temporary additional
commission
Temporary additional
commission2
Normalised1 Fair value
adjustments, amortisation of
acquired intangibles and
exceptional items
Reported
£’000 £’000 £’000 £’000 £’000
Revenue 81,099 - 81,099 (8,342) 72,757
Other operating income 450 - 450 450
Impairments (23,651) - (23,651) - (23,651)
Admin expenses (42,303) (1,771) (44,074) (10,714) (54,788)
Operating profit (loss) 15,595 (1,771) 13,824 (19,056) (5,232)
Exceptional items - - - (626) (626)
Profit (loss) before interest and tax 15,595 (1,771) 13,824 (19,682) (5,858)
Finance cost (3,484) - (3,484) - (3,484)
Profit (loss) before tax 12,111 (1,771) 10,340 (19,682) (9,342)
Taxation (2,619) 341 (2,278) 3,622 1,344
Profit (loss) after tax 9,492 (1,430) 8,062 (16,060) (7,998)
Earnings (loss) per share3 3.09p 2.62p (2.60)p
Dividend per share 1.20p 1.20p
1 Adjusted to exclude fair value adjustments, amortisation of acquired intangibles and exceptional items
2 When a new home credit agent agrees to provide lending and collection services to the Group, we may decide to offer a limited
period of additional commission whilst the agent builds up a critical mass of active loan customers 3 Basic and diluted earnings (loss) per share based on the weighted average number of shares in issue of 316,901,254 (2016:
307,315,588)
– Ends –

3
Interviews with John van Kuffeler, Group Chief Executive Officer and Nick Teunon, Chief Financial Officer
Interviews with John van Kuffeler and Nick Teunon will be available as video and text from 7.00 am on 13 March 2018 on the Group’s website: www.nsfgroupplc.com.
Analyst meeting, webcast, dial-in and conference call details for 13 March 2018
There will be an analyst meeting at 11.00 am on 13 March 2018 for invited UK-based analysts at the offices
of JP Morgan, 60 Victoria Embankment, London, EC4Y 0JP (the entrance is in John Carpenter Street). The
meeting will be simultaneously broadcast via webcast and conference call. To watch the live webcast,
please register for access by visiting the Group’s website: www.nsfgroupplc.com. Details for the dial-in
facility are given below. A copy of the webcast and slide presentation given at the meeting will be available
on the Group’s website later today.
Dial-in details to listen to the analyst presentation at 11.00 am, 13 March 2018 10.50 am Please call + 44 330 336 9105 (PIN: 9257286) Title NSF Full Year Results
11.00 am Meeting starts
All times are Greenwich Mean Time (GMT).
For more information:
Non-Standard Finance plc John van Kuffeler, Group Chief Executive Nick Teunon, Chief Financial Officer Peter Reynolds, Director, IR and Communications
+44 (0) 20 3869 9020
The Maitland Consultancy Andy Donald Peter Hamid Finlay Donaldson
+44 (0) 207 379 5151
About Non-Standard Finance
Non-Standard Finance plc is listed on the main market of the London Stock Exchange (ticker: NSF) and was established in 2014 to acquire and grow businesses in the UK’s non-standard consumer finance sector. Under the direction of its highly experienced main board, the Company has acquired a sustainable group of businesses offering credit to the c.10-12 million UK adults who are not served by (or choose not to use) mainstream financial institutions. Its three business divisions are: unsecured branch-based lending, home-collected credit and guarantor loans. Each division is fully authorised by the FCA and has benefited from significant investment in branch expansion, recruitment, training and new IT infrastructure and systems. These investments have supported the delivery of improved customer outcomes together with growing financial returns for shareholders.
4
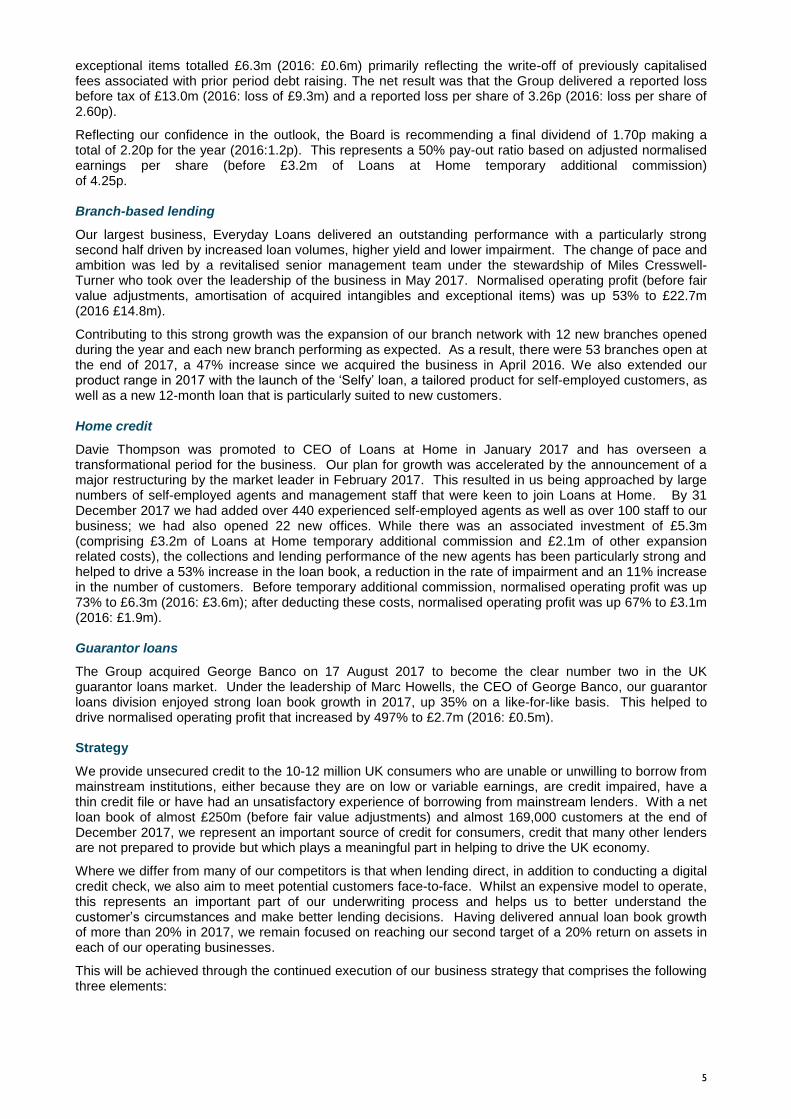
Group Chief Executive’s Report 2017 Full year results
A number of key operational and strategic milestones were achieved in 2017:
Everyday Loans:
o appointed Miles Cresswell-Turner as CEO and strengthened the senior management team
o opened 12 new branches
o launched two new products and added 77 new staff
o processed over 1 million loan applications for the first time
Loans at Home:
o promoted Davie Thompson to become CEO and invested £5.3m to help drive a 53%
increase in the net loan book
o opened 22 new offices
o added over 100 staff and 442 self-employed agents to our network
o completed the roll-out of our latest handheld technology to all agents
o reached over 104,000 customers
o obtained a full licence from the FCA
Guarantor loans:
o acquired George Banco to become the clear number two player
o obtained a full licence from the FCA for George Banco following its acquisition
Group
o refinanced £115m of existing bank facilities with £260m of new long-term funding
o Recommended final dividend equates to a payout ratio of more than 50% of underlying
earnings
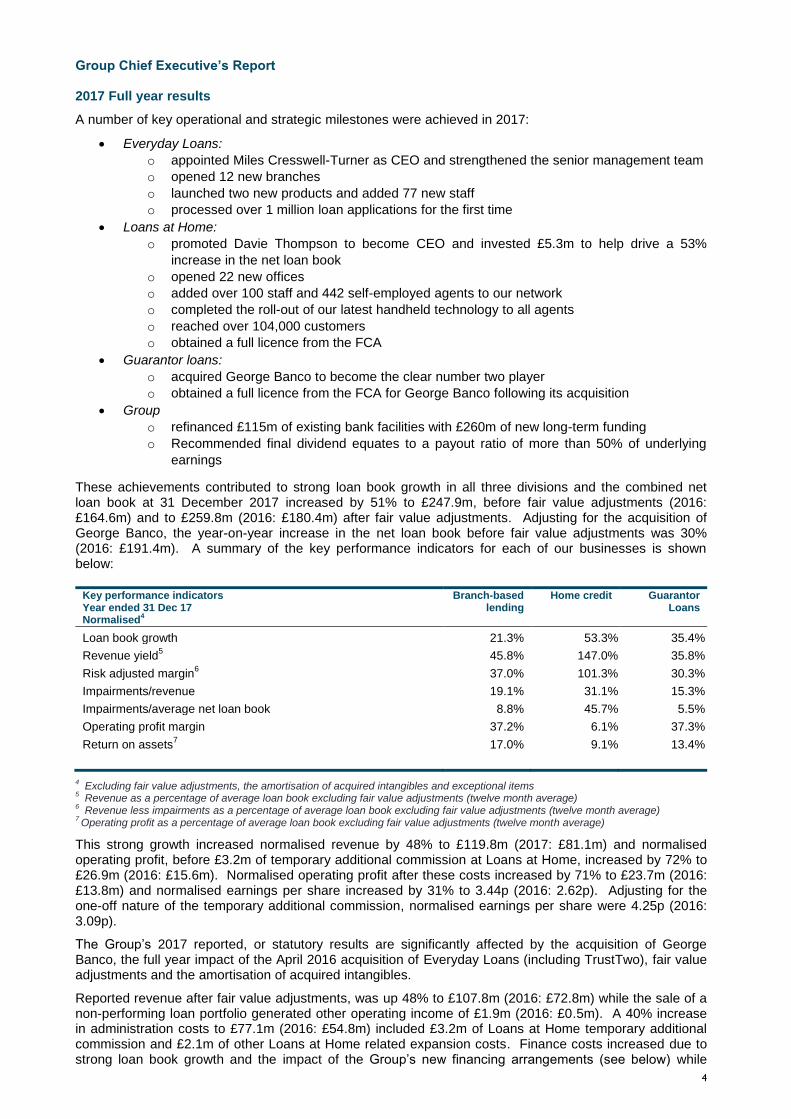
These achievements contributed to strong loan book growth in all three divisions and the combined net loan book at 31 December 2017 increased by 51% to £247.9m, before fair value adjustments (2016: £164.6m) and to £259.8m (2016: £180.4m) after fair value adjustments. Adjusting for the acquisition of George Banco, the year-on-year increase in the net loan book before fair value adjustments was 30% (2016: £191.4m). A summary of the key performance indicators for each of our businesses is shown below:
Key performance indicators Year ended 31 Dec 17 Normalised
4
Branch-based lending
Home credit
Guarantor Loans
Loan book growth 21.3% 53.3% 35.4%
Revenue yield5 45.8% 147.0% 35.8%
Risk adjusted margin6 37.0% 101.3% 30.3%
Impairments/revenue 19.1% 31.1% 15.3%
Impairments/average net loan book 8.8% 45.7% 5.5%
Operating profit margin 37.2% 6.1% 37.3%
Return on assets7 17.0% 9.1% 13.4%
4 Excluding fair value adjustments, the amortisation of acquired intangibles and exceptional items
5 Revenue as a percentage of average loan book excluding fair value adjustments (twelve month average)
6 Revenue less impairments as a percentage of average loan book excluding fair value adjustments (twelve month average)
7 Operating profit as a percentage of average loan book excluding fair value adjustments (twelve month average)
This strong growth increased normalised revenue by 48% to £119.8m (2017: £81.1m) and normalised operating profit, before £3.2m of temporary additional commission at Loans at Home, increased by 72% to £26.9m (2016: £15.6m). Normalised operating profit after these costs increased by 71% to £23.7m (2016: £13.8m) and normalised earnings per share increased by 31% to 3.44p (2016: 2.62p). Adjusting for the one-off nature of the temporary additional commission, normalised earnings per share were 4.25p (2016: 3.09p).
The Group’s 2017 reported, or statutory results are significantly affected by the acquisition of George Banco, the full year impact of the April 2016 acquisition of Everyday Loans (including TrustTwo), fair value adjustments and the amortisation of acquired intangibles.
Reported revenue after fair value adjustments, was up 48% to £107.8m (2016: £72.8m) while the sale of a non-performing loan portfolio generated other operating income of £1.9m (2016: £0.5m). A 40% increase in administration costs to £77.1m (2016: £54.8m) included £3.2m of Loans at Home temporary additional commission and £2.1m of other Loans at Home related expansion costs. Finance costs increased due to strong loan book growth and the impact of the Group’s new financing arrangements (see below) while
5
exceptional items totalled £6.3m (2016: £0.6m) primarily reflecting the write-off of previously capitalised fees associated with prior period debt raising. The net result was that the Group delivered a reported loss before tax of £13.0m (2016: loss of £9.3m) and a reported loss per share of 3.26p (2016: loss per share of 2.60p).
Reflecting our confidence in the outlook, the Board is recommending a final dividend of 1.70p making a total of 2.20p for the year (2016:1.2p). This represents a 50% pay-out ratio based on adjusted normalised earnings per share (before £3.2m of Loans at Home temporary additional commission) of 4.25p. Branch-based lending
Our largest business, Everyday Loans delivered an outstanding performance with a particularly strong second half driven by increased loan volumes, higher yield and lower impairment. The change of pace and ambition was led by a revitalised senior management team under the stewardship of Miles Cresswell-Turner who took over the leadership of the business in May 2017. Normalised operating profit (before fair value adjustments, amortisation of acquired intangibles and exceptional items) was up 53% to £22.7m (2016 £14.8m).
Contributing to this strong growth was the expansion of our branch network with 12 new branches opened during the year and each new branch performing as expected. As a result, there were 53 branches open at the end of 2017, a 47% increase since we acquired the business in April 2016. We also extended our product range in 2017 with the launch of the ‘Selfy’ loan, a tailored product for self-employed customers, as well as a new 12-month loan that is particularly suited to new customers. Home credit
Davie Thompson was promoted to CEO of Loans at Home in January 2017 and has overseen a transformational period for the business. Our plan for growth was accelerated by the announcement of a major restructuring by the market leader in February 2017. This resulted in us being approached by large numbers of self-employed agents and management staff that were keen to join Loans at Home. By 31 December 2017 we had added over 440 experienced self-employed agents as well as over 100 staff to our business; we had also opened 22 new offices. While there was an associated investment of £5.3m (comprising £3.2m of Loans at Home temporary additional commission and £2.1m of other expansion related costs), the collections and lending performance of the new agents has been particularly strong and helped to drive a 53% increase in the loan book, a reduction in the rate of impairment and an 11% increase in the number of customers. Before temporary additional commission, normalised operating profit was up 73% to £6.3m (2016: £3.6m); after deducting these costs, normalised operating profit was up 67% to £3.1m (2016: £1.9m). Guarantor loans
The Group acquired George Banco on 17 August 2017 to become the clear number two in the UK guarantor loans market. Under the leadership of Marc Howells, the CEO of George Banco, our guarantor loans division enjoyed strong loan book growth in 2017, up 35% on a like-for-like basis. This helped to drive normalised operating profit that increased by 497% to £2.7m (2016: £0.5m). Strategy
We provide unsecured credit to the 10-12 million UK consumers who are unable or unwilling to borrow from mainstream institutions, either because they are on low or variable earnings, are credit impaired, have a thin credit file or have had an unsatisfactory experience of borrowing from mainstream lenders. With a net loan book of almost £250m (before fair value adjustments) and almost 169,000 customers at the end of December 2017, we represent an important source of credit for consumers, credit that many other lenders are not prepared to provide but which plays a meaningful part in helping to drive the UK economy.
Where we differ from many of our competitors is that when lending direct, in addition to conducting a digital credit check, we also aim to meet potential customers face-to-face. Whilst an expensive model to operate, this represents an important part of our underwriting process and helps us to better understand the customer’s circumstances and make better lending decisions. Having delivered annual loan book growth of more than 20% in 2017, we remain focused on reaching our second target of a 20% return on assets in each of our operating businesses.
This will be achieved through the continued execution of our business strategy that comprises the following three elements:
6
1. Being a leader in each of our chosen business segments
We subscribe to the view that leadership is a key driver of long-term success and are well-placed in all three areas of our business:
Branch-based lending – Everyday Loans is the clear market leader in unsecured branch-based
lending to the credit impaired with 47,000 customers.
Home credit – Loans at Home is ranked third in the market having grown strongly with over
104,000 customers in 2017.
Guarantor loans – Following the acquisition of George Banco, we are now the clear number two
in the market with a loan book of close to £50m and over 17,000 customers.
2. Investing in our core assets
Through suitable investment in people, our distribution networks, technology and brands, we are increasing our capacity to drive further loan book growth whilst at the same time managing operational risks through effective spans of control. People – establishing a good relationship with our customers through face-to-face contact is at the heart of our business model and in 2017 we increased the size of our workforce by 40% to over 750 full time employees. We launched a sharesave scheme for all staff so they can participate in the future success of the Group. In home credit, we also recruited over 440 experienced self-employed agents taking our total number to over 1,000. Such expansion required significant investment in training and incentives that are focused on rewarding both financial results and the delivery of good customer outcomes. Distribution networks – we opened 12 new Everyday Loans branches in 2017 taking the total number now open to 53 - we plan to open a further 12 in the first half of 2018. At Loans at Home we opened 22 new offices to support the rapid expansion of our self-employed agent network and we now have 69 locations (including the head office) across the UK. Technology – while face-to-face contact lies at the heart of both branch-based lending and home credit, all three of our business divisions rely heavily on 24/7 access to scalable and robust technology. With thousands of customers up and down the country, effective data management and analysis ensures that we can process large volumes of transactions, conduct full credit scoring and lead management and can monitor and optimise our day-to-day business performance. Brands – securing the trust and confidence of your customers and other key stakeholders is vitally important, especially now that purchase decisions for financial services are increasingly made online or through remote channels. The quality of our service and size of our customer base means that continuing to invest in our brands and reputation is a source of substantial long-term value for the Group. 3. Acting responsibly
How we behave as a business is not just defined by prevailing laws or regulations but also by our culture or ‘how we do things around here’. Right at the outset and at the very heart of our long-term strategic plan was the vision that Non-Standard Finance plc would represent the very best in consumer credit, with the highest standards of compliance and best practice.
We monitor closely how our behaviour and conduct might impact our key stakeholders, whether they be customers, staff, self-employed agents, suppliers, our environment or the communities where we have a physical presence. Through a number of initiatives across the Group, including a series of employee workshops, we have identified a number of core behaviours that we see as being vital if we are to achieve our strategic goals:
Doing the right thing: we recognise our collective responsibility for delivering great outcomes for our customers, even when others are not looking.
Integrity: we respect colleagues and other key stakeholders and always do what we say we will do.
Shared purpose delivered through teamwork: we have clear goals and expect all of our people to share in that vision. By working together we are likely to solve problems more effectively than trying to do things on our own.
Clear communication: we are well-informed and listen carefully to those dealing direct with our customers; we also speak up when something is not right; we celebrate success and don’t blame others when something goes wrong, always learning from our mistakes.
Entrepreneurial leadership: we lead by example and use our initiative, trying new things so we can improve.
7
By embedding each of these into our employee review protocol we aim to formalise the process by which we recognise and reward these values and behaviours so that we can stand out from our competitors. Financing
On 3 August 2017 we announced the acquisition of George Banco, the number two provider of guarantor loans in the non-standard sector, for £18.6m (representing an enterprise value of approximately £53.5m). To finance the acquisition and refinance all of the Group’s existing debt facilities, as well as to provide additional funding to support future growth, we secured a new £175m term loan facility (the ‘Term Loan’), provided by a group of institutional investors, led by Alcentra Limited. The new six-year loan bears an interest rate of LIBOR plus 7.25% per year with interest payable every six months. The same investors also agreed to provide an additional committed facility of up to £50m under the same terms as the Term Loan taking their total commitment to the Group to £225m. In addition, the Group secured a new £35m revolving credit facility provided by Royal Bank of Scotland at an interest rate of LIBOR plus 3.5% per year.
As at 31 December 2017 the Group had cash at bank of £11.0m (2016: £5.2m) and gross borrowings of £208.1m (2016: £87.3m) leaving total headroom on the Group’s debt facilities of £51.9m (2016: £12.9m). Regulation
With each of our three business divisions now fully authorised by the Financial Conduct Authority (‘FCA’), we believe we have established a constructive dialogue with the regulator at both an operational as well as at a more strategic level.
The FCA published a number of documents regarding consumer credit in 2017 and while there appear to be no concerns regarding branch-based lending or guarantor loans, through its ongoing review of high-cost credit, the FCA is continuing to improve its understanding of certain segments, including home credit. We welcomed the FCA’s latest update confirming that they are making good progress and recognising that:
“Consumers can benefit from using high-cost credit where repayments are sustainable and appropriate forbearance is shown if they have temporary repayment problems.” (Source – High-Cost Credit Review – Update – FCA, 30 January 2018) Through our regular interactions with the FCA, as well as through formal consultations, we continue to inform the FCA’s understanding around home credit and its importance to over a million UK consumers. In its response to ‘Good work: the Taylor Review of modern working practices’, the Government announced in February 2018 its intention to consult widely on a variety of matters affecting the UK workforce, including employment status. With a network of over 1,000 self-employed agents, the majority of whom are women, we are monitoring these developments closely and will be contributing to the consultations in due course. Final dividend
Having declared a half-year dividend of 0.5p per share in August 2017 (2016: 0.3p), the Board is pleased to recommend a final dividend of 1.70p per share (2016: 0.9p), making a total of 2.20p for the year as a whole (2016: 1.2p). If approved by shareholders, based on normalised post-tax earnings before temporary agent commission, this would mean that we had exceeded our medium-term target of a payout ratio of 50%.
If approved at the Company’s Annual General Meeting on 14 May 2018, the final dividend would be paid to those shareholders on the Company’s share register on 18 May 2018 (the ‘Record Date’), with payment being made on 15 June 2018.
Current trading and outlook
We have made a good start to the year with each of our business divisions continuing to deliver strong loan book growth whilst maintaining tight control on impairment. We therefore remain confident about the Group’s full year prospects. John van Kuffeler Group Chief Executive 13 March 2018
8
Financial review
Given the unusual circumstances that prevailed in the home credit market during 2017, we have broken out the temporary additional commission paid to newly signed-up agents during 2017. Normalised figures are before fair value adjustments, the amortisation of acquired intangibles and exceptional items.
Group 2017 full year results
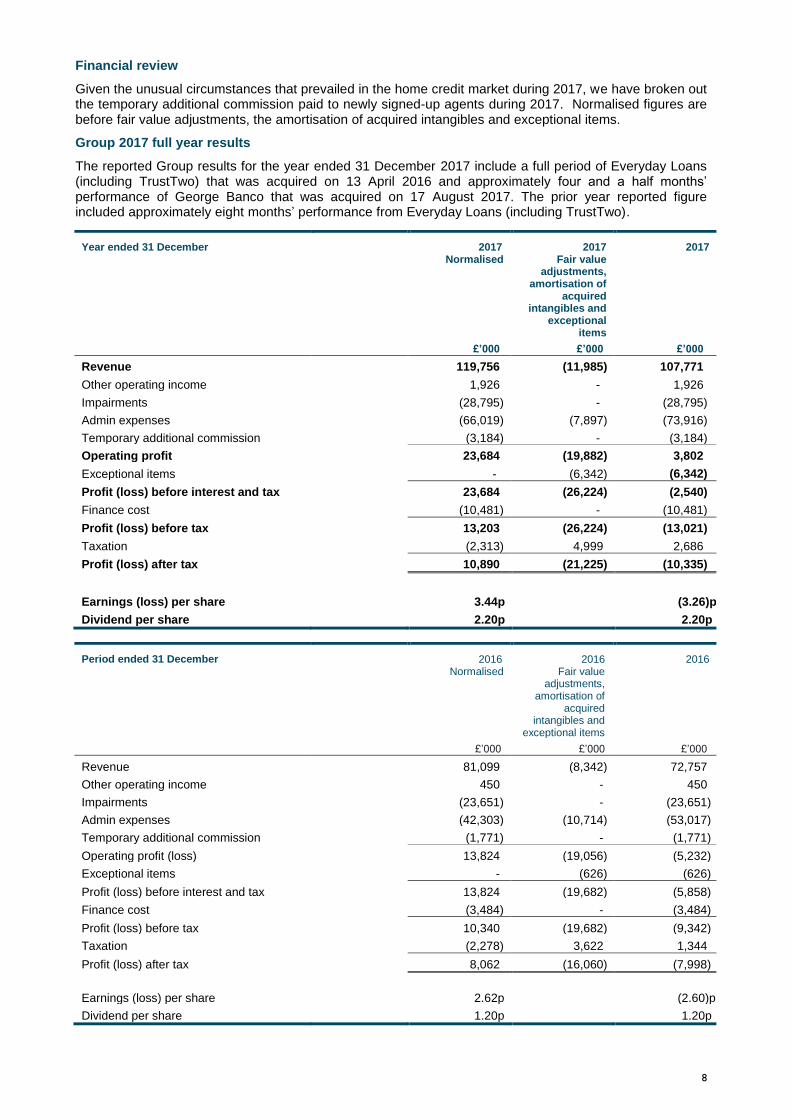
The reported Group results for the year ended 31 December 2017 include a full period of Everyday Loans (including TrustTwo) that was acquired on 13 April 2016 and approximately four and a half months’ performance of George Banco that was acquired on 17 August 2017. The prior year reported figure included approximately eight months’ performance from Everyday Loans (including TrustTwo).
Year ended 31 December
2017 Normalised
2017 Fair value
adjustments, amortisation of
acquired intangibles and
exceptional items
2017
£’000 £’000 £’000
Revenue 119,756 (11,985) 107,771
Other operating income 1,926 - 1,926
Impairments (28,795) - (28,795)
Admin expenses (66,019) (7,897) (73,916)
Temporary additional commission (3,184) - (3,184)
Operating profit 23,684 (19,882) 3,802
Exceptional items - (6,342) (6,342)
Profit (loss) before interest and tax 23,684 (26,224) (2,540)
Finance cost (10,481) - (10,481)
Profit (loss) before tax 13,203 (26,224) (13,021)
Taxation (2,313) 4,999 2,686
Profit (loss) after tax 10,890 (21,225) (10,335)
Earnings (loss) per share 3.44p (3.26)p
Dividend per share 2.20p 2.20p
Period ended 31 December
2016 Normalised
2016 Fair value
adjustments, amortisation of
acquired intangibles and
exceptional items
2016
£’000 £’000 £’000
Revenue 81,099 (8,342) 72,757
Other operating income 450 - 450
Impairments (23,651) - (23,651)
Admin expenses (42,303) (10,714) (53,017)
Temporary additional commission (1,771) - (1,771)
Operating profit (loss) 13,824 (19,056) (5,232)
Exceptional items - (626) (626)
Profit (loss) before interest and tax 13,824 (19,682) (5,858)
Finance cost (3,484) - (3,484)
Profit (loss) before tax 10,340 (19,682) (9,342)
Taxation (2,278) 3,622 1,344
Profit (loss) after tax 8,062 (16,060) (7,998)
Earnings (loss) per share 2.62p (2.60)p
Dividend per share 1.20p 1.20p
9
Normalised revenue was £119.8m (2016: £81.1m) reflecting just over four months’ contribution from George Banco that was acquired on 17 August 2017 and a full period of Everyday Loans (including TrustTwo). Figures for the prior year included just eight months of Everyday Loans (including TrustTwo).
Normalised operating profit, before temporary additional commission of £3.2m (2016: £1.8m), was up 72% to £26.9m (2016: £15.6m). After deducting these costs, normalised operating profit was up 71% to £23.7m (2016: £13.8m). As a result, the reported operating profit was £3.8m (2016: loss of £5.2m). Exceptional costs of £6.3m (2016: £0.6m) included the write-off of previously capitalised fees incurred in connection with the Group’s previous debt raising as well as M&A-related costs. Finance costs increased to £10.5m (2016: £3.5m) due to the increased levels and higher cost of borrowing under the Group’s new debt arrangements resulting in a reported loss before tax of £13.0m (2016: loss of £9.3m). A tax credit of £2.7m (2016: £1.3m) meant that the loss after tax was £10.3m (2016: £8.0m) equating to a reported loss per share of 3.26p (2016: loss per share of 2.60p).
A more detailed review of each of the operating businesses is outlined below. Pro forma normalised divisional results
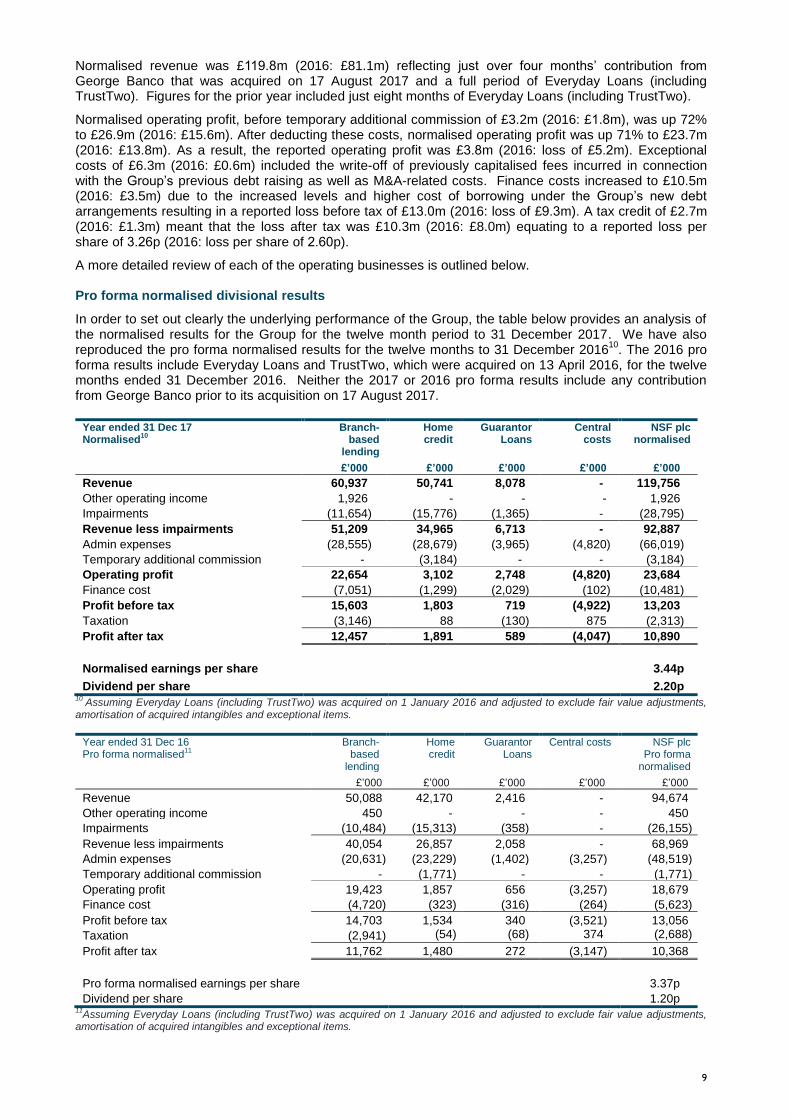
In order to set out clearly the underlying performance of the Group, the table below provides an analysis of the normalised results for the Group for the twelve month period to 31 December 2017. We have also reproduced the pro forma normalised results for the twelve months to 31 December 2016
10. The 2016 pro
forma results include Everyday Loans and TrustTwo, which were acquired on 13 April 2016, for the twelve months ended 31 December 2016. Neither the 2017 or 2016 pro forma results include any contribution from George Banco prior to its acquisition on 17 August 2017.
Year ended 31 Dec 17 Normalised
10
Branch-based
lending
Home credit
Guarantor Loans
Central costs
NSF plc normalised
£’000 £’000 £’000 £’000 £’000
Revenue 60,937 50,741 8,078 - 119,756
Other operating income 1,926 - - - 1,926
Impairments (11,654) (15,776) (1,365) - (28,795)
Revenue less impairments 51,209 34,965 6,713 - 92,887
Admin expenses (28,555) (28,679) (3,965) (4,820) (66,019)
Temporary additional commission - (3,184) - - (3,184)
Operating profit 22,654 3,102 2,748 (4,820) 23,684
Finance cost (7,051) (1,299) (2,029) (102) (10,481)
Profit before tax 15,603 1,803 719 (4,922) 13,203
Taxation (3,146) 88 (130) 875 (2,313)
Profit after tax 12,457 1,891 589 (4,047) 10,890
Normalised earnings per share 3.44p
Dividend per share 2.20p 10
Assuming Everyday Loans (including TrustTwo) was acquired on 1 January 2016 and adjusted to exclude fair value adjustments, amortisation of acquired intangibles and exceptional items.
Year ended 31 Dec 16 Pro forma normalised
11
Branch-based
lending
Home credit
Guarantor Loans
Central costs
NSF plc Pro forma
normalised
£’000 £’000 £’000 £’000 £’000
Revenue 50,088 42,170 2,416 - 94,674
Other operating income 450 - - - 450
Impairments (10,484) (15,313) (358) - (26,155)
Revenue less impairments 40,054 26,857 2,058 - 68,969
Admin expenses (20,631) (23,229) (1,402) (3,257) (48,519)
Temporary additional commission - (1,771) - - (1,771)
Operating profit 19,423 1,857 656 (3,257) 18,679
Finance cost (4,720) (323) (316) (264) (5,623)
Profit before tax 14,703 1,534 340 (3,521) 13,056
Taxation (2,941) (54) (68) 374 (2,688)
Profit after tax 11,762 1,480 272 (3,147) 10,368
Pro forma normalised earnings per share 3.37p
Dividend per share 1.20p 11
Assuming Everyday Loans (including TrustTwo) was acquired on 1 January 2016 and adjusted to exclude fair value adjustments, amortisation of acquired intangibles and exceptional items.
10
Divisional overview
Branch-based lending
Everyday Loans is the largest branch-based provider of unsecured loans in the UK’s non-standard finance sector. With 53 branches across the UK, the business ended 2017 with over 47,000 active customers, an increase of 19% over the prior year (2016: 39,600) and a total net loan book of £148.5m, up 21% (2016: £122.4m).
Having made some management changes in May 2017, the business responded with newfound pace and ambition under the leadership of Miles Cresswell-Turner, supported by a strengthened senior management team. As well as increasing the expectations of what could be achieved, management also delivered against our key operational objectives for the year, including the opening of 12 new branches and the adoption of a new management structure, the introduction of eSignature and Faster Payments, increasing the volume and quality of leads coming into the network and extending our product range.
Network expansion - Our branch opening programme was a key source of growth in 2017, further extending our customer reach as well as increasing our capacity to deliver additional loan book growth. By meeting our customers face-to-face we are able to build a relationship and improve our understanding of their needs, both of which form key elements of our underwriting process. Where a customer is unable to attend one of our branches, we may be comfortable to complete the loan by telephone. However, we have no plans to shift away from using our branch network that has proven its ability to deliver strong revenue growth whilst at the same time maintaining a tight control on impairment.
Operational improvements – the introduction of eSignature and Faster Payments during 2017 helped us improve our service to customers through more timely execution. Having strengthened the senior management team, we also introduced a new structure for the branch network with six new area managers that are responsible for between two and four branches. This has improved knowledge across the network and increased the sharing of best practice, both of which have contributed to increased conversion and lower impairment.
Increased volumes - Growth is a function of the number and quality of the leads we receive and our ability to convert those leads into loans. By expanding our capacity with 12 more branches during the year we were able to process more leads from financial brokers, through direct marketing and also from our existing customers. In 2017 we processed over 1 million leads (2016: 860,000) and converted these into 32,668 loans (2016: 26,535), with an improvement in conversion from new borrowers from 1.97% in 2016 to 2.23% in 2017.
New products - Other drivers of growth include the introduction of new products and in 2017 loan volumes of our new ‘Selfy’ loan continued to build on the back of an increased number of applications. The self-employed represent around 15% of the total UK workforce and we plan to grow lending volumes significantly to this large and growing segment of the UK economy. Our new 12-month loan product was launched in August 2017 and provides branches with an opportunity to offer new customers a ‘starter loan’, that is typically smaller in size and so allows the customer to prove their ability to manage their repayments before moving on to a larger, longer-term loan. The success of this new product contributed to a small reduction in average loan size to £3,584 (2016: £3,842).
Results
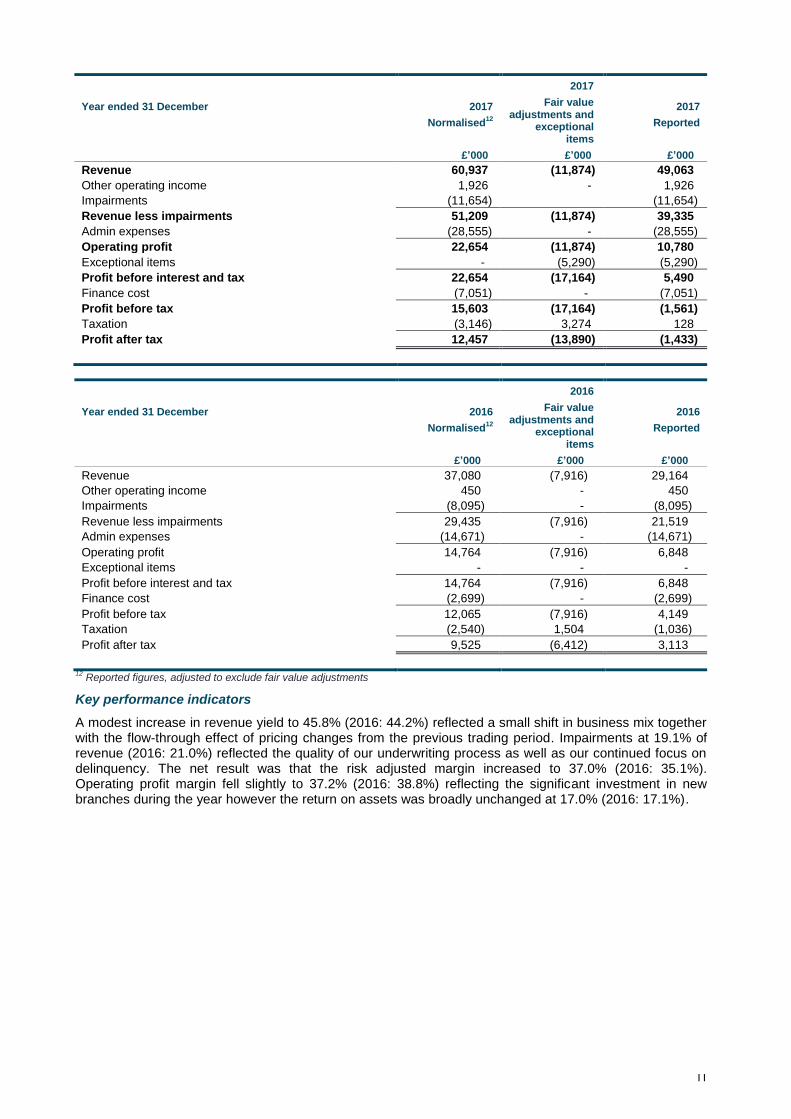
Normalised revenue was up 64% to £60.9m (2016: £37.1m) reflecting strong loan book growth as well as the inclusion of Everyday Loans for a full period. Fair value adjustments increased to £11.9m (2016: £7.9m) reflecting a full period of the fair value unwind of the acquired loan portfolio and resulted in reported revenue of £49.1m (2016: £29.2m). Impairments increased to £11.7m (2016: £8.1m) but fell as a percentage of revenue, reflecting our continued focus on quality underwriting and collections.
Administrative expenses increased to 47% of normalised revenue (2016: 40%) reflecting the substantial investment in new branch openings together with the associated costs of recruitment and training. We added 77 new staff during the year taking the total to 307, an increase of 33% versus the prior year. As a result, administration costs increased to £28.6m (2016: £14.7m) and the net impact of all of these movements was that normalised operating profit increased by 53% to £22.7m (2016: £14.8m). Exceptional costs of £5.3m (2016: nil) related to the refinancing of the Everyday Loans bank facilities and restructuring costs.
Finance costs increased to £7.1m (2016: £2.7m) reflecting the growth in the loan book as well as the increased average cost of the Group’s new debt arrangements that were put in place in August 2017. As a result, normalised profit before tax increased by 29% to £15.6m (2016: £12.1m).
11
Year ended 31 December
2017
Normalised12
2017
Fair value adjustments and
exceptional items
2017
Reported
£’000 £’000 £’000
Revenue 60,937 (11,874) 49,063
Other operating income 1,926 - 1,926
Impairments (11,654) (11,654)
Revenue less impairments 51,209 (11,874) 39,335
Admin expenses (28,555) - (28,555)
Operating profit 22,654 (11,874) 10,780
Exceptional items - (5,290) (5,290)
Profit before interest and tax 22,654 (17,164) 5,490
Finance cost (7,051) - (7,051)
Profit before tax 15,603 (17,164) (1,561)
Taxation (3,146) 3,274 128
Profit after tax 12,457 (13,890) (1,433)
Year ended 31 December
2016
Normalised12
2016
Fair value adjustments and
exceptional items
2016
Reported
£’000 £’000 £’000
Revenue 37,080 (7,916) 29,164
Other operating income 450 - 450
Impairments (8,095) - (8,095)
Revenue less impairments 29,435 (7,916) 21,519
Admin expenses (14,671) - (14,671)
Operating profit 14,764 (7,916) 6,848
Exceptional items - - -
Profit before interest and tax 14,764 (7,916) 6,848
Finance cost (2,699) - (2,699)
Profit before tax 12,065 (7,916) 4,149
Taxation (2,540) 1,504 (1,036)
Profit after tax 9,525 (6,412) 3,113
12
Reported figures, adjusted to exclude fair value adjustments
Key performance indicators
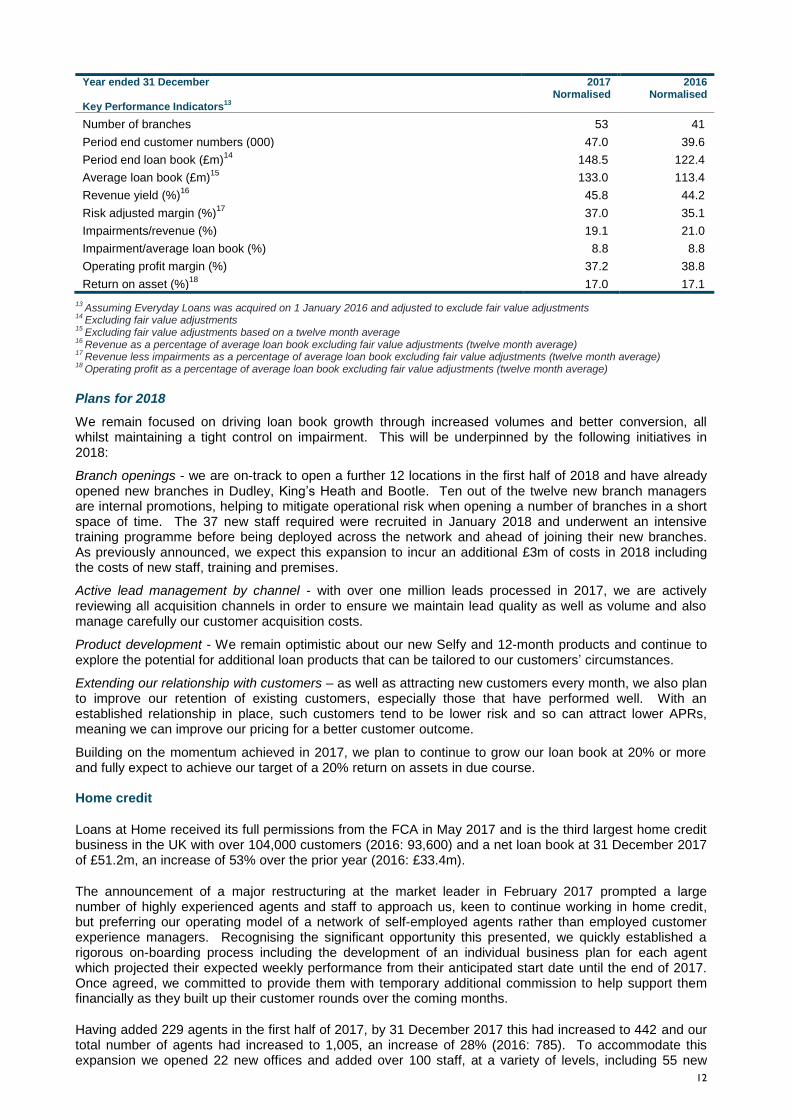
A modest increase in revenue yield to 45.8% (2016: 44.2%) reflected a small shift in business mix together with the flow-through effect of pricing changes from the previous trading period. Impairments at 19.1% of revenue (2016: 21.0%) reflected the quality of our underwriting process as well as our continued focus on delinquency. The net result was that the risk adjusted margin increased to 37.0% (2016: 35.1%). Operating profit margin fell slightly to 37.2% (2016: 38.8%) reflecting the significant investment in new branches during the year however the return on assets was broadly unchanged at 17.0% (2016: 17.1%).
12
Year ended 31 December Key Performance Indicators
13
2017 Normalised
2016 Normalised
Number of branches 53 41
Period end customer numbers (000) 47.0 39.6
Period end loan book (£m)14
148.5 122.4
Average loan book (£m)15
133.0 113.4
Revenue yield (%)16
45.8 44.2
Risk adjusted margin (%)17
37.0 35.1
Impairments/revenue (%) 19.1 21.0
Impairment/average loan book (%) 8.8 8.8
Operating profit margin (%) 37.2 38.8
Return on asset (%)18
17.0 17.1
13 Assuming Everyday Loans was acquired on 1 January 2016 and adjusted to exclude fair value adjustments
14 Excluding fair value adjustments
15 Excluding fair value adjustments based on a twelve month average
16 Revenue as a percentage of average loan book excluding fair value adjustments (twelve month average)
17 Revenue less impairments as a percentage of average loan book excluding fair value adjustments (twelve month average)
18 Operating profit as a percentage of average loan book excluding fair value adjustments (twelve month average)
Plans for 2018
We remain focused on driving loan book growth through increased volumes and better conversion, all whilst maintaining a tight control on impairment. This will be underpinned by the following initiatives in 2018:
Branch openings - we are on-track to open a further 12 locations in the first half of 2018 and have already opened new branches in Dudley, King’s Heath and Bootle. Ten out of the twelve new branch managers are internal promotions, helping to mitigate operational risk when opening a number of branches in a short space of time. The 37 new staff required were recruited in January 2018 and underwent an intensive training programme before being deployed across the network and ahead of joining their new branches. As previously announced, we expect this expansion to incur an additional £3m of costs in 2018 including the costs of new staff, training and premises.
Active lead management by channel - with over one million leads processed in 2017, we are actively reviewing all acquisition channels in order to ensure we maintain lead quality as well as volume and also manage carefully our customer acquisition costs.
Product development - We remain optimistic about our new Selfy and 12-month products and continue to explore the potential for additional loan products that can be tailored to our customers’ circumstances.
Extending our relationship with customers – as well as attracting new customers every month, we also plan to improve our retention of existing customers, especially those that have performed well. With an established relationship in place, such customers tend to be lower risk and so can attract lower APRs, meaning we can improve our pricing for a better customer outcome.
Building on the momentum achieved in 2017, we plan to continue to grow our loan book at 20% or more and fully expect to achieve our target of a 20% return on assets in due course. Home credit
Loans at Home received its full permissions from the FCA in May 2017 and is the third largest home credit business in the UK with over 104,000 customers (2016: 93,600) and a net loan book at 31 December 2017 of £51.2m, an increase of 53% over the prior year (2016: £33.4m).
The announcement of a major restructuring at the market leader in February 2017 prompted a large number of highly experienced agents and staff to approach us, keen to continue working in home credit, but preferring our operating model of a network of self-employed agents rather than employed customer experience managers. Recognising the significant opportunity this presented, we quickly established a rigorous on-boarding process including the development of an individual business plan for each agent which projected their expected weekly performance from their anticipated start date until the end of 2017. Once agreed, we committed to provide them with temporary additional commission to help support them financially as they built up their customer rounds over the coming months.
Having added 229 agents in the first half of 2017, by 31 December 2017 this had increased to 442 and our total number of agents had increased to 1,005, an increase of 28% (2016: 785). To accommodate this expansion we opened 22 new offices and added over 100 staff, at a variety of levels, including 55 new
13
business managers and 23 new area managers, thereby maintaining an effective span of control with six agents per business manager and three business managers per area manager. While this required a sizeable investment in infrastructure and temporary additional commission totalling £5.3m, it also delivered substantial loan book growth and improved the quality of our customer base – at 31 December 2017 the number of quality customers, who had paid 70% or more of their due payments over the previous 13 weeks, had increased to 66,000 or 64% of the total (2016: 53%).
We rolled-out our collections app for agents in February 2017 and our lending app became fully operational during the fourth quarter of 2017. Both have been well-received by agents, removing the need for a paper-based process. They also provide managers with real-time performance data by customer and agent so that any issues can be quickly identified and acted upon. An additional advantage is that we now have a digital audit trail of lending and collecting and can easily perform quality assurance reviews on individual agents and customers.
Results
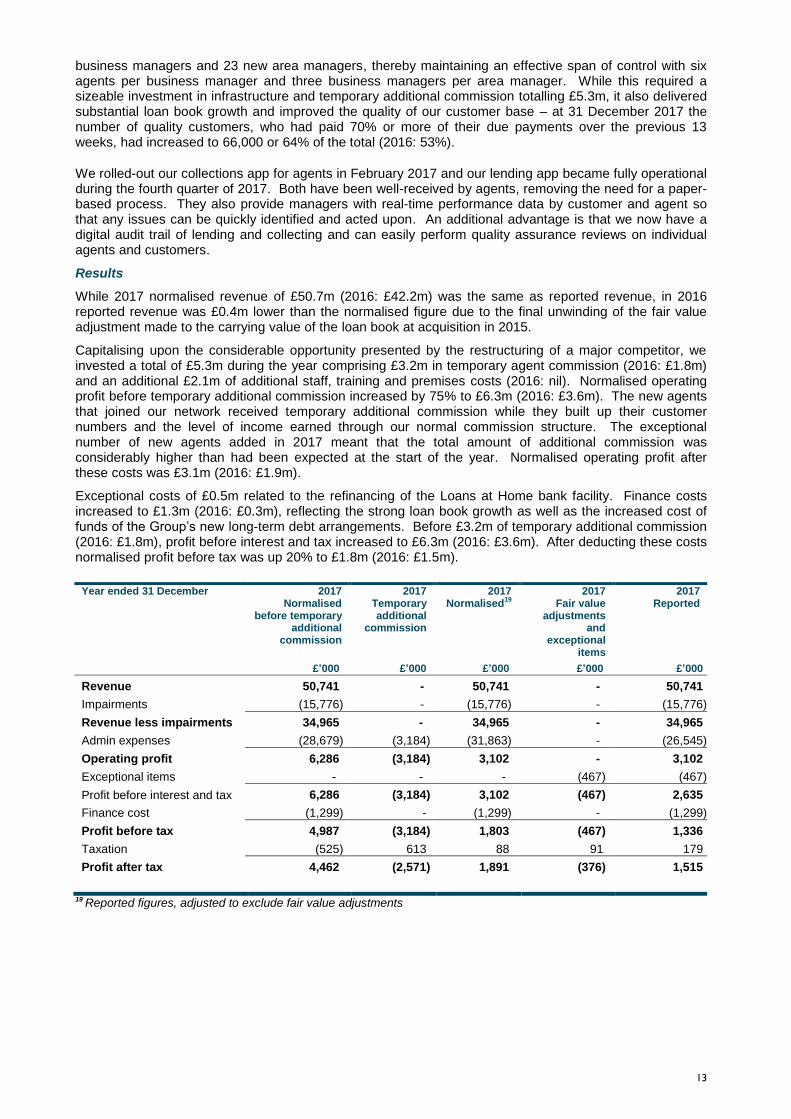
While 2017 normalised revenue of £50.7m (2016: £42.2m) was the same as reported revenue, in 2016 reported revenue was £0.4m lower than the normalised figure due to the final unwinding of the fair value adjustment made to the carrying value of the loan book at acquisition in 2015.
Capitalising upon the considerable opportunity presented by the restructuring of a major competitor, we invested a total of £5.3m during the year comprising £3.2m in temporary agent commission (2016: £1.8m) and an additional £2.1m of additional staff, training and premises costs (2016: nil). Normalised operating profit before temporary additional commission increased by 75% to £6.3m (2016: £3.6m). The new agents that joined our network received temporary additional commission while they built up their customer numbers and the level of income earned through our normal commission structure. The exceptional number of new agents added in 2017 meant that the total amount of additional commission was considerably higher than had been expected at the start of the year. Normalised operating profit after these costs was £3.1m (2016: £1.9m).
Exceptional costs of £0.5m related to the refinancing of the Loans at Home bank facility. Finance costs increased to £1.3m (2016: £0.3m), reflecting the strong loan book growth as well as the increased cost of funds of the Group’s new long-term debt arrangements. Before £3.2m of temporary additional commission (2016: £1.8m), profit before interest and tax increased to £6.3m (2016: £3.6m). After deducting these costs normalised profit before tax was up 20% to £1.8m (2016: £1.5m).
Year ended 31 December 2017 Normalised
before temporary additional
commission
2017 Temporary additional
commission
2017 Normalised
19
2017 Fair value
adjustments and
exceptional items
2017 Reported
£’000 £’000 £’000 £’000 £’000
Revenue 50,741 - 50,741 - 50,741
Impairments (15,776) - (15,776) - (15,776)
Revenue less impairments 34,965 - 34,965 - 34,965
Admin expenses (28,679) (3,184) (31,863) - (26,545)
Operating profit 6,286 (3,184) 3,102 - 3,102
Exceptional items - - - (467) (467)
Profit before interest and tax 6,286 (3,184) 3,102 (467) 2,635
Finance cost (1,299) - (1,299) - (1,299)
Profit before tax 4,987 (3,184) 1,803 (467) 1,336
Taxation (525) 613 88 91 179
Profit after tax 4,462 (2,571) 1,891 (376) 1,515
19
Reported figures, adjusted to exclude fair value adjustments
14
Period ended 31 December 2016 Normalised before
temporary additional
commission
2016 Temporary additional
commission
2016 Normalised
2016 Fair value
adjustments and exceptional
items
2016 Reported
£’000 £’000 £’000 £’000 £’000
Revenue 42,170 - 42,170 (426) 41,744
Impairments (15,313) - (15,313) - (15,313)
Revenue less impairments 26,857 - 26,857 (426) 26,431
Admin expenses (23,229) (1,771) (25,000) - (23,229)
Operating profit/(loss) 3,628 (1,771) 1,857 (426) 1,431
Exceptional items - - - - -
Profit before interest and tax 3,628 (1,771) 1,857 (426) 1,431
Finance cost (323) - (323) - (323)
Profit/(loss) before tax 3,305 (1,771) 1,534 (426) 1,108
Taxation (395) 341 (54) 81 27
Profit/(loss) after tax 2,910 (1,430) 1,480 (345) 1,135
Key performance indicators
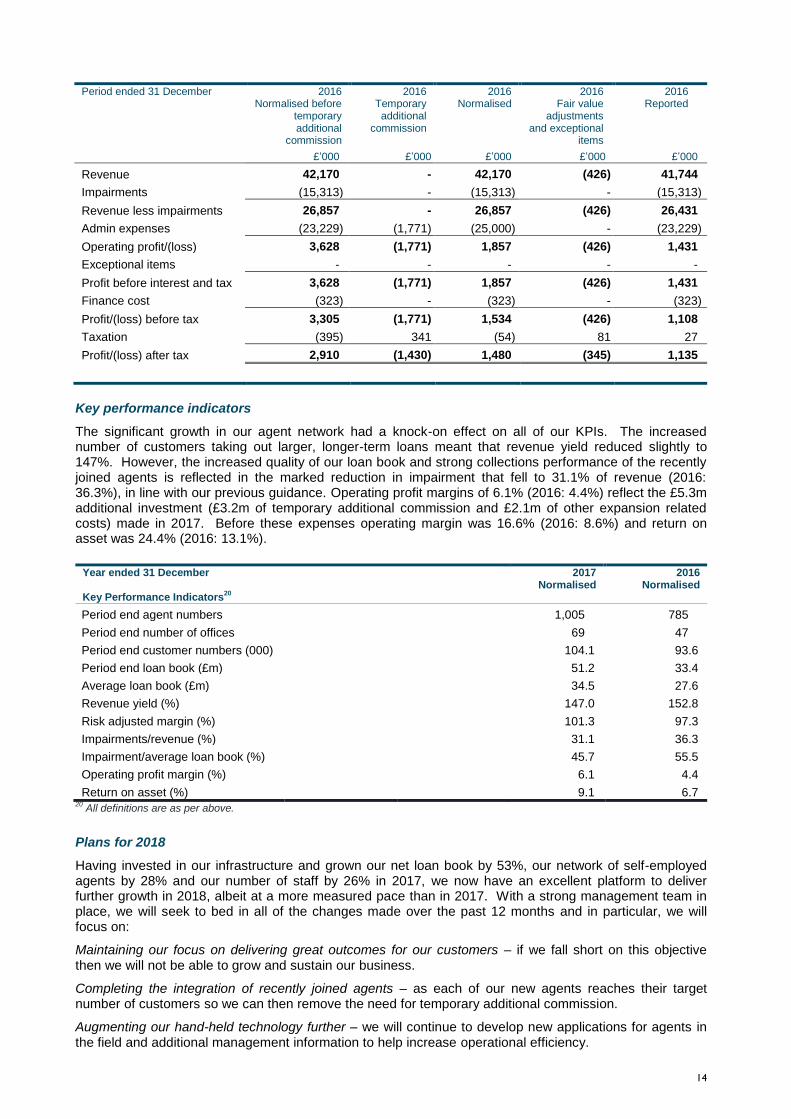
The significant growth in our agent network had a knock-on effect on all of our KPIs. The increased number of customers taking out larger, longer-term loans meant that revenue yield reduced slightly to 147%. However, the increased quality of our loan book and strong collections performance of the recently joined agents is reflected in the marked reduction in impairment that fell to 31.1% of revenue (2016: 36.3%), in line with our previous guidance. Operating profit margins of 6.1% (2016: 4.4%) reflect the £5.3m additional investment (£3.2m of temporary additional commission and £2.1m of other expansion related costs) made in 2017. Before these expenses operating margin was 16.6% (2016: 8.6%) and return on asset was 24.4% (2016: 13.1%).
Year ended 31 December Key Performance Indicators
20
2017 Normalised
2016 Normalised
Period end agent numbers 1,005 785
Period end number of offices 69 47
Period end customer numbers (000) 104.1 93.6
Period end loan book (£m) 51.2 33.4
Average loan book (£m) 34.5 27.6
Revenue yield (%) 147.0 152.8
Risk adjusted margin (%) 101.3 97.3
Impairments/revenue (%) 31.1 36.3
Impairment/average loan book (%) 45.7 55.5
Operating profit margin (%) 6.1 4.4
Return on asset (%) 9.1 6.7 20
All definitions are as per above.
Plans for 2018
Having invested in our infrastructure and grown our net loan book by 53%, our network of self-employed agents by 28% and our number of staff by 26% in 2017, we now have an excellent platform to deliver further growth in 2018, albeit at a more measured pace than in 2017. With a strong management team in place, we will seek to bed in all of the changes made over the past 12 months and in particular, we will focus on:
Maintaining our focus on delivering great outcomes for our customers – if we fall short on this objective then we will not be able to grow and sustain our business.
Completing the integration of recently joined agents – as each of our new agents reaches their target number of customers so we can then remove the need for temporary additional commission.
Augmenting our hand-held technology further – we will continue to develop new applications for agents in the field and additional management information to help increase operational efficiency.
15
Maintaining a tight span of control – whilst new technology and improved management information might present an opportunity to relax the current spans of control at some point in the future, we plan to maintain these at current levels in 2018 whilst we continue to grow..
Selectively expanding our network – we will look to add more agents and field staff but only on a highly selective basis to ensure that any additions are profitable in 2018.
Continuing to improve the quality of our customer base – whilst we believe that there remains a significant opportunity for loan book growth, we are determined that this will not be at the expense of quality. We will continue to improve our underwriting and collections performance through the further deployment of behavioural scoring as well as through access to third-party datasets as they become available.
Each of these initiatives should help us to continue to drive loan book growth, albeit at a slower pace than in 2017, and we still plan to achieve 20% per annum while maintaining a tight grip on impairment.
Guarantor Loans
The acquisition of George Banco on 17 August 2017 transformed our guarantor loans business that is now the clear number two in the UK market. Marc Howells, the CEO of George Banco, was appointed Managing Director of the newly named Guarantor Loans Division that now has a clearly defined management structure and in its first few months as a combined business has delivered strong growth in loan book, revenue and profit.
By retaining both the TrustTwo and George Banco brands, we are able to address complementary segments of the market, offering different customer journeys through different channels, but with a common underwriting approach. While TrustTwo is focused on price comparison websites and the direct channel, George Banco specialises in capturing leads from the financial broker community.
We announced our receipt of full authorisation from the FCA for George Banco on 28 September 2017 and completed our 100-day plan for the enlarged business on schedule. Having been held back by funding constraints prior to acquisition, George Banco quickly returned to its previous levels of lending and TrustTwo responded positively to the change of leadership. As a result, the division reached record volumes in November and December 2017 and risk adjusted margin was over 30%.
Despite growing quickly, both brands continue to deliver great outcomes for our customers and score well on customer review websites such as Trustpilot.com and Feefo.com. Results
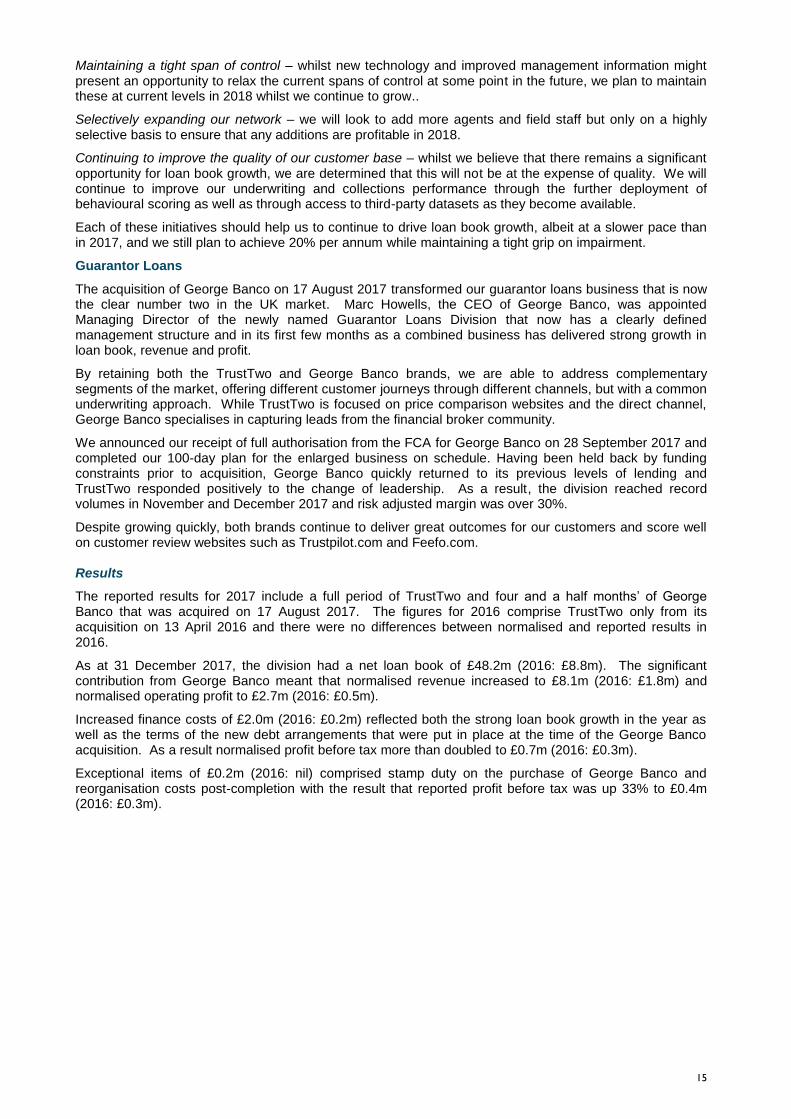
The reported results for 2017 include a full period of TrustTwo and four and a half months’ of George Banco that was acquired on 17 August 2017. The figures for 2016 comprise TrustTwo only from its acquisition on 13 April 2016 and there were no differences between normalised and reported results in 2016.
As at 31 December 2017, the division had a net loan book of £48.2m (2016: £8.8m). The significant contribution from George Banco meant that normalised revenue increased to £8.1m (2016: £1.8m) and normalised operating profit to £2.7m (2016: £0.5m).
Increased finance costs of £2.0m (2016: £0.2m) reflected both the strong loan book growth in the year as well as the terms of the new debt arrangements that were put in place at the time of the George Banco acquisition. As a result normalised profit before tax more than doubled to £0.7m (2016: £0.3m).
Exceptional items of £0.2m (2016: nil) comprised stamp duty on the purchase of George Banco and reorganisation costs post-completion with the result that reported profit before tax was up 33% to £0.4m (2016: £0.3m).
16
Year ended 31 December
2017 Normalised
21
Fair value adjustments and
exceptional items
2017 Reported
£000
2016 Reported
£000 £’000 £’000 £’000 £’000
Revenue 8,078 (111) 7,967 1,849
Impairments (1,365) - (1,365) (243)
Revenue less cost of sales 6,713 (111) 6,602 1,606
Admin expenses (3,965) - (3,965) (1,146)
Operating profit 2,748 (111) 2,637 460
Exceptional items - (230) (230) -
Profit before interest and tax 2,748 (341) 2,407 460
Finance cost (2,029) - (2,029) (198)
Profit before tax 719 (341) 378 262
Taxation (130) 65 (65) (58)
Profit after tax 589 (276) 313 204
21
Reported figures, adjusted to exclude fair value adjustments and exceptional items
Key performance indicators
All of the KPIs were transformed by the acquisition of George Banco. The 2017 KPIs include George Banco for a full 12 months while the 2016 KPIs only reflect 12 months of TrustTwo emphasising the significant impact of George Banco on the division. In particular the differential in pricing between George Banco and TrustTwo lifted revenue yield and also drove risk adjusted margin which was over 30% in 2017. Rates of impairment remained within our target range and while return on asset is below our target of 20%, we remain confident that this can be reached as the business continues to grow strongly.
Year ended 31 December Key Performance Indicators
22
2017 Normalised
2016 Normalised
Period end customer numbers (000) 17.4 3.3
Period end loan book (£m) 48.2 8.8
Average loan book (£m) 40.4 7.7
Revenue yield (%) 35.8 31.9
Risk adjusted margin (%) 30.3 26.7
Impairment/revenue (%) 15.3 14.8
Impairment/average loan book (%) 5.5 4.6
Operating profit margin (%) 37.3 27.2
Return on asset (%) 13.4 8.5 22
2016 KPIs assume TrustTwo was acquired on 1 January 2016. 2017 KPIs assume George Banco was acquired on 1 January 2017. Revenue for the full year was £14.5m (2016: £2.4m) and operating profit was £5.4m (2016:£0.8m). All definitions are as per above.
Plans for 2018
There are a number of initiatives underway for 2018 including:
Move to a single loan management platform – this significant project is our number one priority in 2018. The project is well underway and we expect it to be complete before the end of the current year. Benefits include improved management information, reduced reliance on third parties and scale economies.
Development of a more tailored customer journey – our objective is to be able to identify the best customer journey for an individual applicant depending upon a range of criteria including size of loan asked for, income, credit score and application channel. We are developing this capability in parallel with our move to a single loan management platform.
Maintain a well-balanced channel mix – whilst keen to capitalise on our strengths in order to drive down customer acquisition costs, we will also continue to diversify our acquisition channels and seek to increase significantly the volume of branch referrals from Everyday Loans as this represents a unique source of high quality traffic for the division.
Common underwriting approach – we are moving to a unified approach, one that will enable more dynamic, risk-based pricing and which should expand our customer reach.
17
Harmonised collections – where we have been unable to contact or take a payment from a customer for some time, we plan to move such loans into a centralised collections function, one that pools the division’s expertise and ensures a consistent approach and to free-up capacity. We are excited about the prospects for our Guarantor Loans Division and given our strong position in the market we remain confident of being able to meet our target of 20% annual loan book growth and a 20% return on assets.
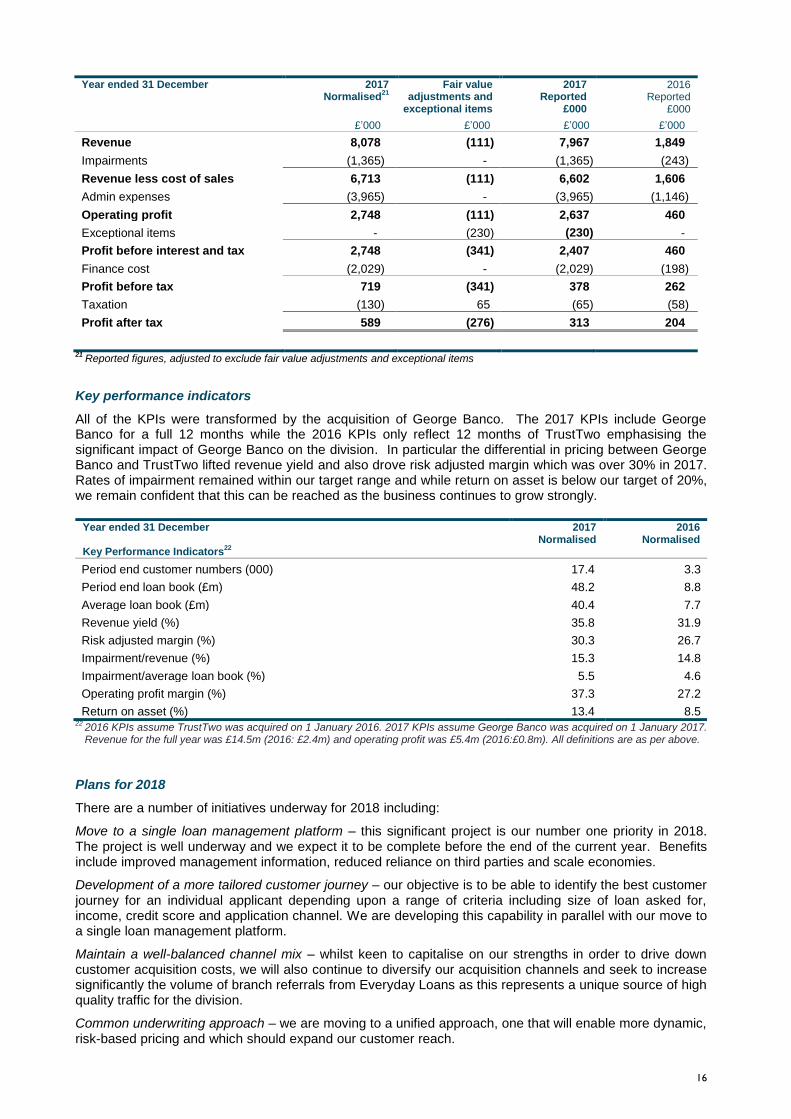
Central costs
Year ended 31 December 2017 Normalised
23
2017 Amortisation of
acquired intangibles and exceptional items
2017 Reported
£’000 £’000 £’000
Revenue - - -
Admin expenses (4,820) (7,897) (12,717)
Operating loss (4,820) (7,897) (12,717)
Exceptional items - (355) (355)
Loss before interest and tax (4,820) (8,252) (13,072)
Finance cost (102) - (102)
Loss before tax (4,922) (8,252) (13,174)
Taxation 875 1,569 2,444
Loss after tax (4,047) (6,683) (10,730)
23 Adjusted to exclude the amortisation of acquired intangibles related to the acquisition of Loans at Home, Everyday Loans, George
Banco and exceptional items
Period ended 31 December 2016 Normalised
24
2016 Amortisation of acquired
intangibles and exceptional items
2016 Reported
£’000 £’000 £’000
Revenue - - -
Admin expenses (3,257) (10,714) (13,971)
Operating loss (3,257) (10,714) (13,971)
Exceptional items - (626) (626)
Loss before interest and tax (3,257) (11,340) (14,597)
Finance cost (264) - (264)
Loss before tax (3,521) (11,340) (14,861)
Taxation 374 2,037 2,411
Loss after tax (3,147) (9,303) (12,450)
24 Adjusted to exclude the amortisation of acquired intangibles related to the acquisition of Loans at Home and Everyday Loans and
exceptional items
Normalised administrative expenses increased to £4.8m (2016: £3.3m), reflecting growth in the scale of the Group and includes the accrual of bonus payments to Executive Directors (none having been paid in 2016) and a full year of costs relating to certain head office staff who were recruited during 2016. The amortisation of acquired intangible assets fell to £7.9m (2016: £10.7m) reflecting a reduced charge for Loans at Home, a full period of amortisation for Everyday Loans and a small charge relating to George Banco. Finance costs of £0.1m (2016: £0.3m) related to the amortisation of fees capitalised on the prior year fund raising while the £0.4m exceptional charge comprised acquisition costs together with the write-off of the remaining balance of capitalised fees referred to above. The prior year exceptional charge of £0.6m related to stamp duty paid on the acquisition of Everyday Loans. Stamp duty on the acquisition of George Banco in the current year is included in exceptional costs of Everyday Loans. IFRS 9
The International Accounting Standard Board’s introduction of a new accounting standard covering financial instruments became effective for accounting periods beginning on or after 1 January 2018. This standard replaces IAS39: Financial Instruments: Recognition and Measurement.
18
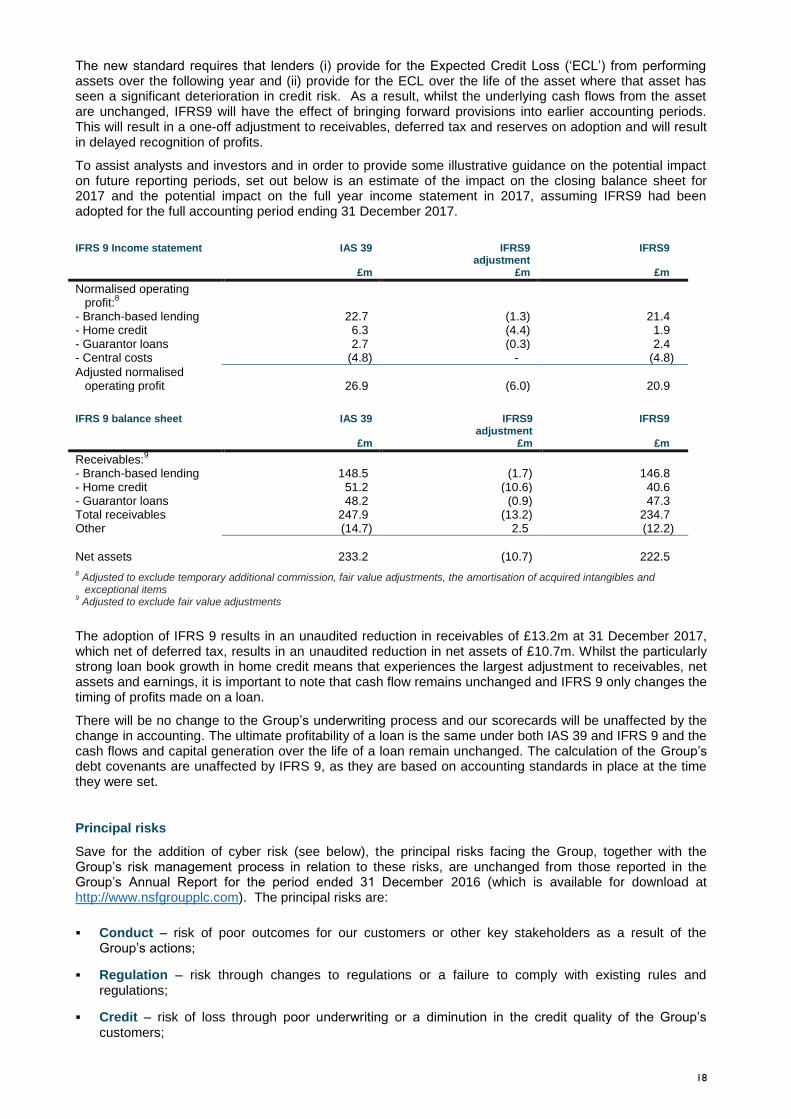
The new standard requires that lenders (i) provide for the Expected Credit Loss (‘ECL’) from performing assets over the following year and (ii) provide for the ECL over the life of the asset where that asset has seen a significant deterioration in credit risk. As a result, whilst the underlying cash flows from the asset are unchanged, IFRS9 will have the effect of bringing forward provisions into earlier accounting periods. This will result in a one-off adjustment to receivables, deferred tax and reserves on adoption and will result in delayed recognition of profits.
To assist analysts and investors and in order to provide some illustrative guidance on the potential impact on future reporting periods, set out below is an estimate of the impact on the closing balance sheet for 2017 and the potential impact on the full year income statement in 2017, assuming IFRS9 had been adopted for the full accounting period ending 31 December 2017.
IFRS 9 Income statement IAS 39
£m
IFRS9 adjustment
£m
IFRS9
£m
Normalised operating profit:
8
- Branch-based lending 22.7 (1.3) 21.4 - Home credit 6.3 (4.4) 1.9 - Guarantor loans 2.7 (0.3) 2.4 - Central costs (4.8) - (4.8)
Adjusted normalised operating profit 26.9 (6.0) 20.9
IFRS 9 balance sheet IAS 39
£m
IFRS9 adjustment
£m
IFRS9
£m
Receivables:9
- Branch-based lending 148.5 (1.7) 146.8 - Home credit 51.2 (10.6) 40.6 - Guarantor loans 48.2 (0.9) 47.3 Total receivables 247.9 (13.2) 234.7 Other (14.7) 2.5 (12.2)
Net assets 233.2 (10.7) 222.5
8 Adjusted to exclude temporary additional commission, fair value adjustments, the amortisation of acquired intangibles and exceptional items
9 Adjusted to exclude fair value adjustments
The adoption of IFRS 9 results in an unaudited reduction in receivables of £13.2m at 31 December 2017, which net of deferred tax, results in an unaudited reduction in net assets of £10.7m. Whilst the particularly strong loan book growth in home credit means that experiences the largest adjustment to receivables, net assets and earnings, it is important to note that cash flow remains unchanged and IFRS 9 only changes the timing of profits made on a loan.
There will be no change to the Group’s underwriting process and our scorecards will be unaffected by the change in accounting. The ultimate profitability of a loan is the same under both IAS 39 and IFRS 9 and the cash flows and capital generation over the life of a loan remain unchanged. The calculation of the Group’s debt covenants are unaffected by IFRS 9, as they are based on accounting standards in place at the time they were set.
Principal risks
Save for the addition of cyber risk (see below), the principal risks facing the Group, together with the Group’s risk management process in relation to these risks, are unchanged from those reported in the Group’s Annual Report for the period ended 31 December 2016 (which is available for download at http://www.nsfgroupplc.com). The principal risks are:
Conduct – risk of poor outcomes for our customers or other key stakeholders as a result of the Group’s actions;
Regulation – risk through changes to regulations or a failure to comply with existing rules and regulations;
Credit – risk of loss through poor underwriting or a diminution in the credit quality of the Group’s customers;
19
Business strategy and operations – risk that the Group fails to execute its plan, including the integration of George Banco, as expected or that the outcome from executing such strategy is not as planned;
Cyber risk – increased connectivity in the workplace coupled with the increasing importance of data and data analytics in operating and managing consumer finance businesses means that this risk has been identified separately from operational risk;
Liquidity – while the Group is well-capitalised and has secured committed, six-year debt facilities for £225m and a revolving credit facility for a further £35m, prevailing uncertainty in global financial markets means that there is a risk that the Group may be unable to secure sufficient finance in the future to execute its long-term business strategy; and
Reputation – a failure to manage one or more of the risks above may damage the reputation of the Group or any of its subsidiaries that in turn may materially impact the future operational and/or financial performance of the Group.
On behalf of the Board of Directors Nick Teunon Chief Financial Officer
13 March 2018
20
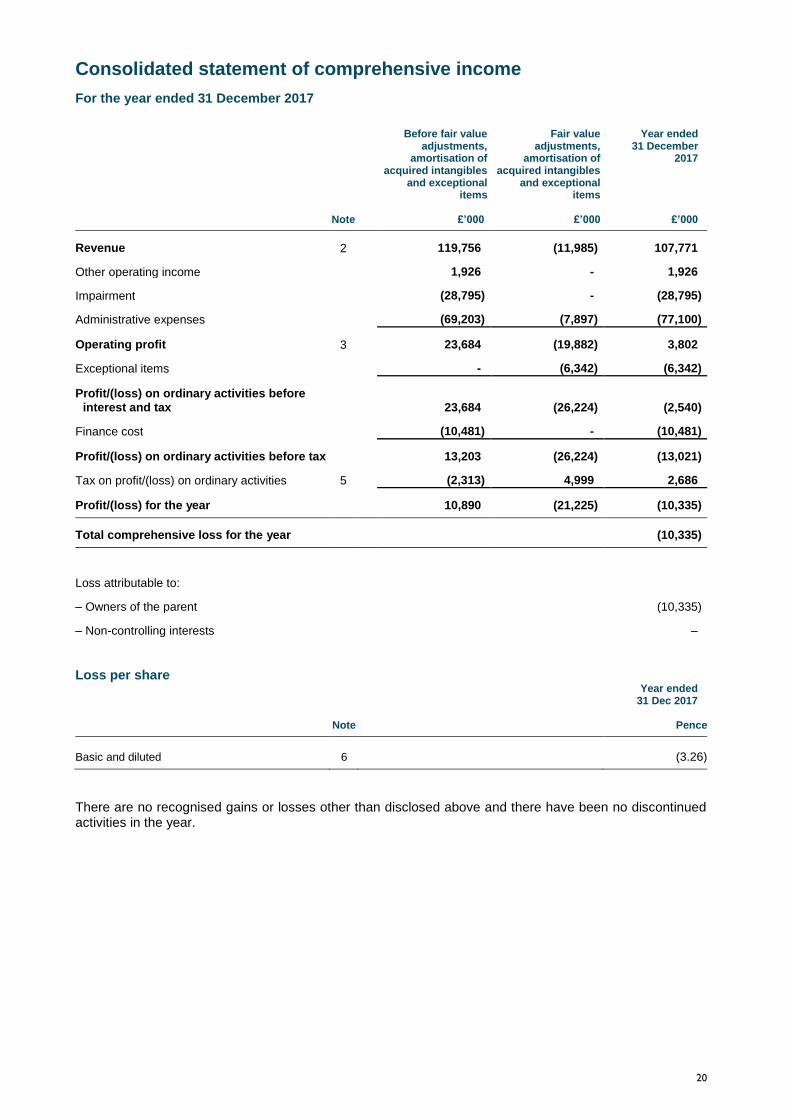
Consolidated statement of comprehensive income
For the year ended 31 December 2017
Note
Before fair value adjustments,
amortisation of acquired intangibles
and exceptional items
£’000
Fair value adjustments,
amortisation of acquired intangibles
and exceptional items
£’000
Year ended 31 December
2017
£’000
Revenue 2 119,756 (11,985) 107,771
Other operating income 1,926 - 1,926
Impairment (28,795) - (28,795)
Administrative expenses (69,203) (7,897) (77,100)
Operating profit 3 23,684 (19,882) 3,802
Exceptional items - (6,342) (6,342)
Profit/(loss) on ordinary activities before
interest and tax 23,684 (26,224) (2,540)
Finance cost (10,481) - (10,481)
Profit/(loss) on ordinary activities before tax 13,203 (26,224) (13,021)
Tax on profit/(loss) on ordinary activities 5 (2,313) 4,999 2,686
Profit/(loss) for the year 10,890 (21,225) (10,335)
Total comprehensive loss for the year (10,335)
Loss attributable to:
– Owners of the parent (10,335)
– Non-controlling interests –
Loss per share
Note
Year ended 31 Dec 2017
Pence
Basic and diluted 6 (3.26)
There are no recognised gains or losses other than disclosed above and there have been no discontinued activities in the year.
21
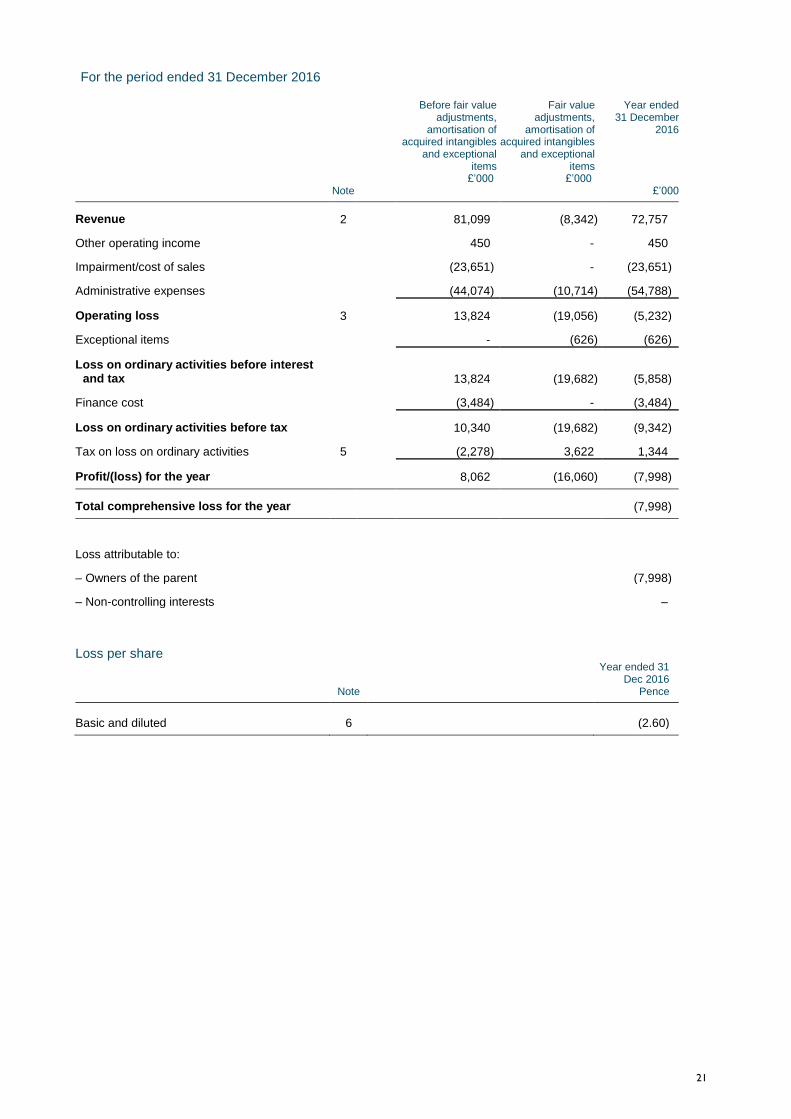
For the period ended 31 December 2016
Note
Before fair value adjustments,
amortisation of acquired intangibles
and exceptional items
£’000
Fair value adjustments,
amortisation of acquired intangibles
and exceptional items
£’000
Year ended 31 December
2016
£’000
Revenue 2 81,099 (8,342) 72,757
Other operating income 450 - 450
Impairment/cost of sales (23,651) - (23,651)
Administrative expenses (44,074) (10,714) (54,788)
Operating loss 3 13,824 (19,056) (5,232)
Exceptional items - (626) (626)
Loss on ordinary activities before interest and tax 13,824 (19,682) (5,858)
Finance cost (3,484) - (3,484)
Loss on ordinary activities before tax 10,340 (19,682) (9,342)
Tax on loss on ordinary activities 5 (2,278) 3,622 1,344
Profit/(loss) for the year 8,062 (16,060) (7,998)
Total comprehensive loss for the year (7,998)
Loss attributable to:
– Owners of the parent (7,998)
– Non-controlling interests –
Loss per share
Note
Year ended 31 Dec 2016
Pence
Basic and diluted 6 (2.60)
22
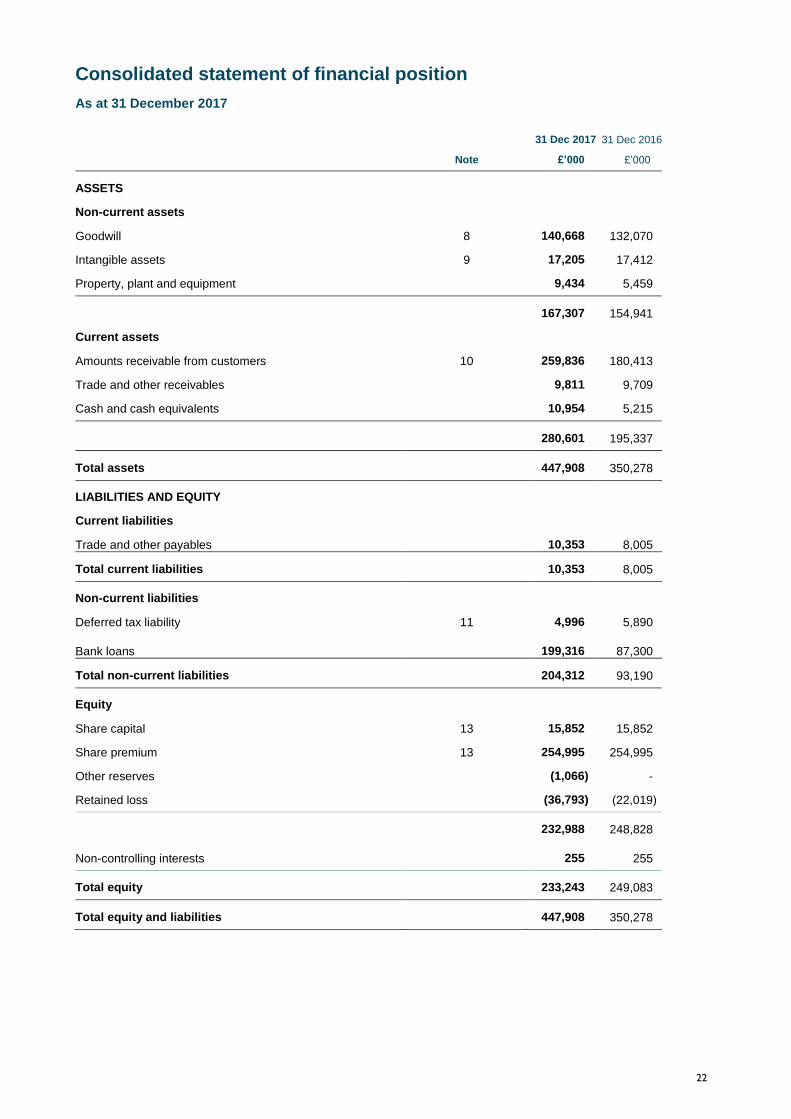
Consolidated statement of financial position
As at 31 December 2017
Note
31 Dec 2017
£’000
31 Dec 2016
£’000
ASSETS
Non-current assets
Goodwill 8 140,668 132,070
Intangible assets 9 17,205 17,412
Property, plant and equipment 9,434 5,459
167,307 154,941
Current assets
Amounts receivable from customers 10 259,836 180,413
Trade and other receivables 9,811 9,709
Cash and cash equivalents 10,954 5,215
280,601 195,337
Total assets 447,908 350,278
LIABILITIES AND EQUITY
Current liabilities
Trade and other payables 10,353 8,005
Total current liabilities 10,353 8,005
Non-current liabilities
Deferred tax liability 11 4,996 5,890
Bank loans 199,316 87,300
Total non-current liabilities 204,312 93,190
Equity
Share capital 13 15,852 15,852
Share premium 13 254,995 254,995
Other reserves (1,066) -
Retained loss (36,793) (22,019)
232,988 248,828
Non-controlling interests 255 255
Total equity 233,243 249,083
Total equity and liabilities 447,908 350,278
23
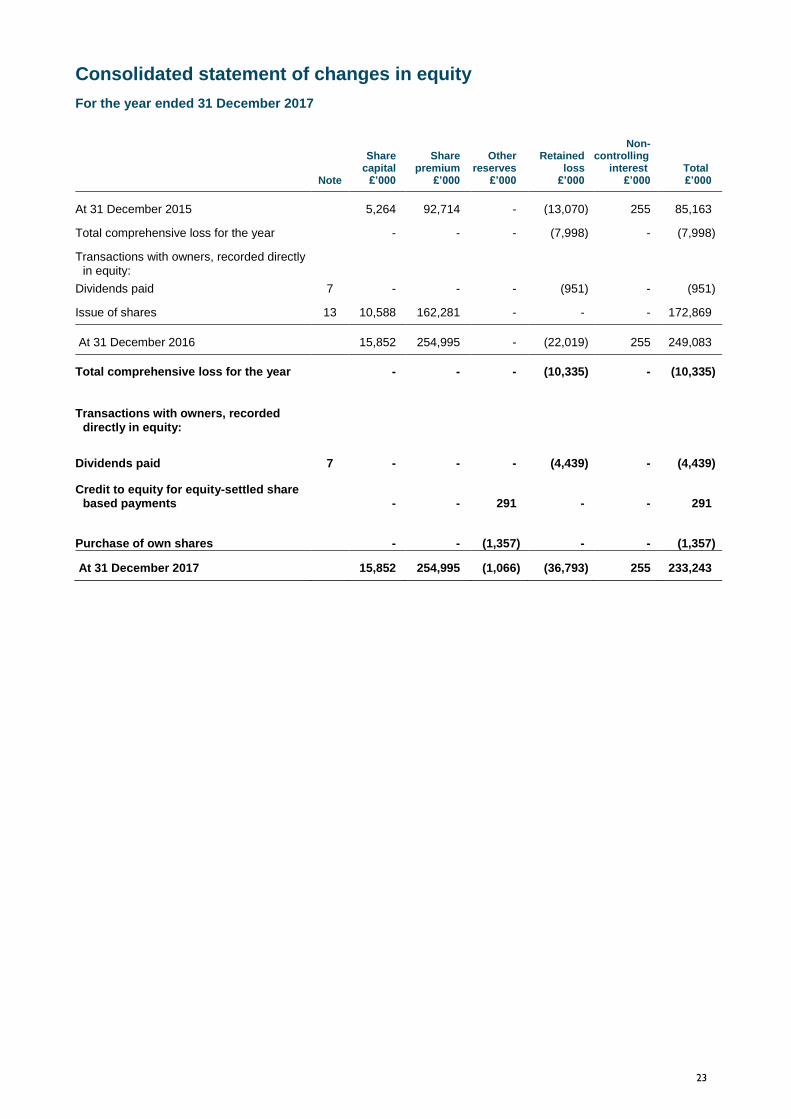
Consolidated statement of changes in equity
For the year ended 31 December 2017
Note
Share capital
£’000
Share premium
£’000
Other reserves
£’000
Retained loss
£’000
Non-controlling
interest £’000
Total £’000
At 31 December 2015 5,264 92,714 - (13,070) 255 85,163
Total comprehensive loss for the year - - - (7,998) - (7,998)
Transactions with owners, recorded directly
in equity:
Dividends paid 7 - - - (951) - (951)
Issue of shares 13 10,588 162,281 - - - 172,869
At 31 December 2016 15,852 254,995 - (22,019) 255 249,083
Total comprehensive loss for the year - - - (10,335) - (10,335)
Transactions with owners, recorded
directly in equity:
Dividends paid 7 - - - (4,439) - (4,439)
Credit to equity for equity-settled share based payments - - 291 - - 291
Purchase of own shares - - (1,357) - - (1,357)
At 31 December 2017 15,852 254,995 (1,066) (36,793) 255 233,243
24
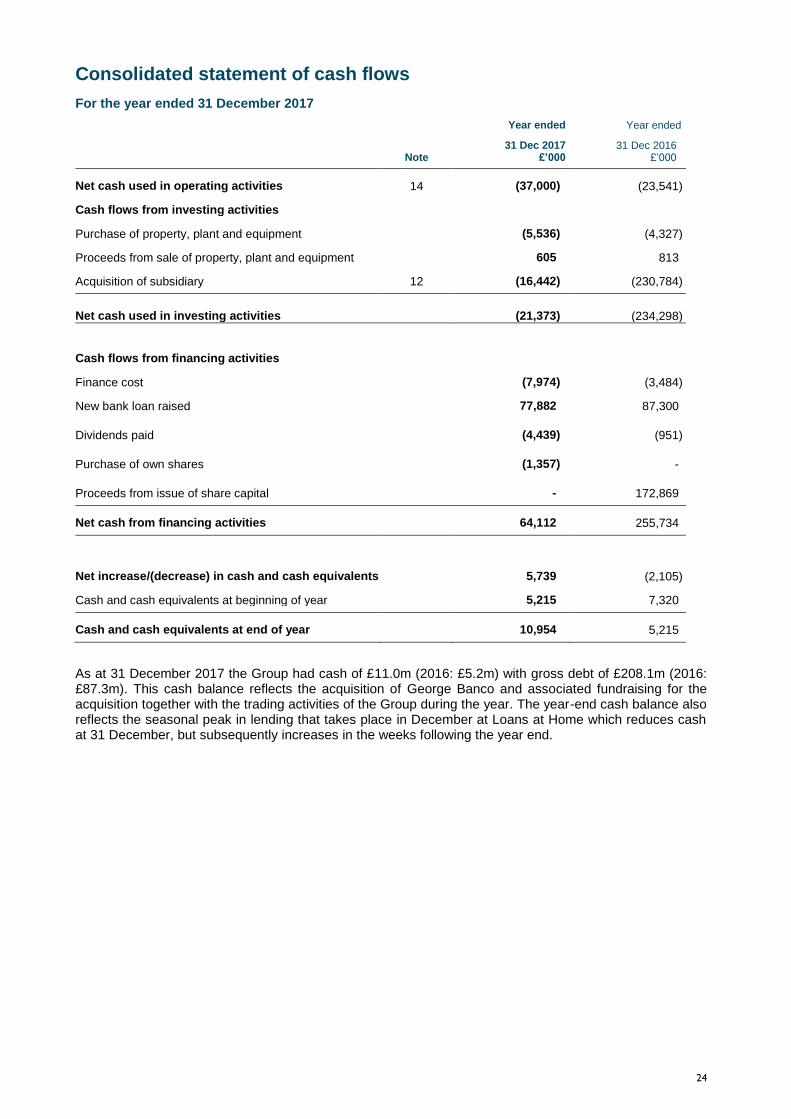
Consolidated statement of cash flows
For the year ended 31 December 2017
Note
Year ended
31 Dec 2017 £’000
Year ended
31 Dec 2016 £’000
Net cash used in operating activities 14 (37,000) (23,541)
Cash flows from investing activities
Purchase of property, plant and equipment (5,536) (4,327)
Proceeds from sale of property, plant and equipment 605 813
Acquisition of subsidiary 12 (16,442) (230,784)
Net cash used in investing activities (21,373) (234,298)
Cash flows from financing activities
Finance cost (7,974) (3,484)
New bank loan raised 77,882 87,300
Dividends paid (4,439) (951)
Purchase of own shares (1,357) -
Proceeds from issue of share capital - 172,869
Net cash from financing activities 64,112 255,734
Net increase/(decrease) in cash and cash equivalents 5,739 (2,105)
Cash and cash equivalents at beginning of year 5,215 7,320
Cash and cash equivalents at end of year 10,954 5,215
As at 31 December 2017 the Group had cash of £11.0m (2016: £5.2m) with gross debt of £208.1m (2016: £87.3m). This cash balance reflects the acquisition of George Banco and associated fundraising for the acquisition together with the trading activities of the Group during the year. The year-end cash balance also reflects the seasonal peak in lending that takes place in December at Loans at Home which reduces cash at 31 December, but subsequently increases in the weeks following the year end.
25
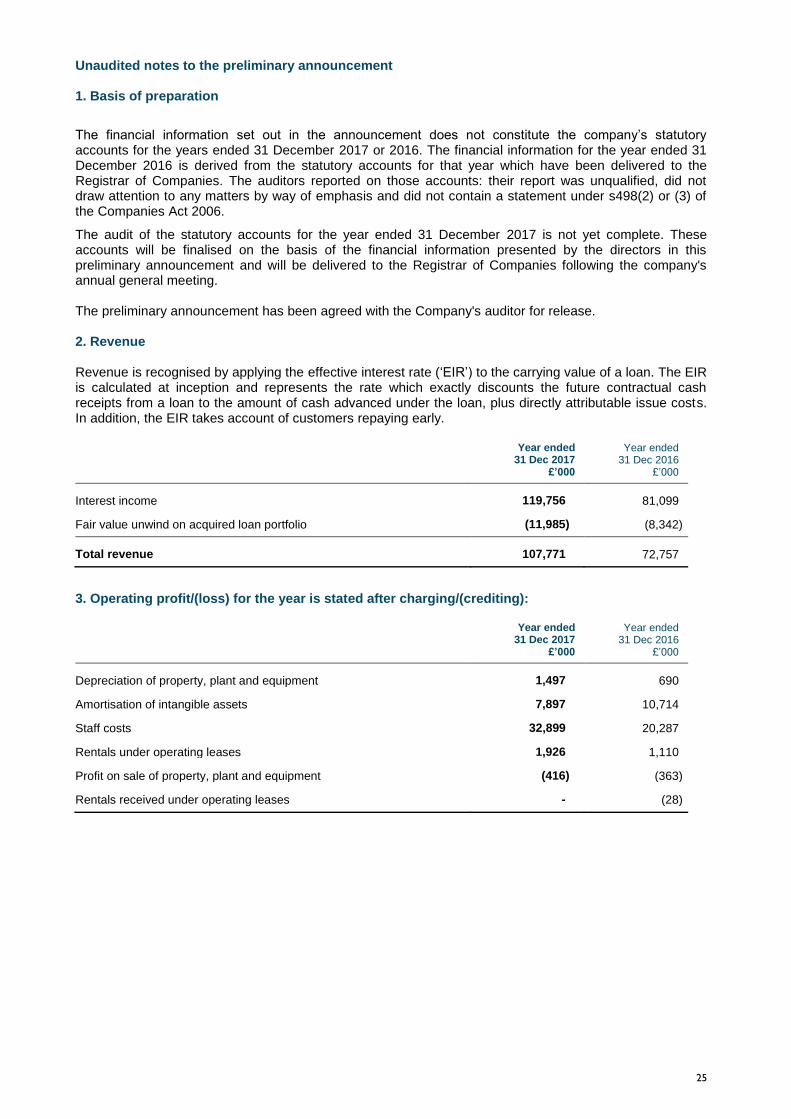
Unaudited notes to the preliminary announcement 1. Basis of preparation
The financial information set out in the announcement does not constitute the company’s statutory accounts for the years ended 31 December 2017 or 2016. The financial information for the year ended 31 December 2016 is derived from the statutory accounts for that year which have been delivered to the Registrar of Companies. The auditors reported on those accounts: their report was unqualified, did not draw attention to any matters by way of emphasis and did not contain a statement under s498(2) or (3) of the Companies Act 2006.
The audit of the statutory accounts for the year ended 31 December 2017 is not yet complete. These accounts will be finalised on the basis of the financial information presented by the directors in this preliminary announcement and will be delivered to the Registrar of Companies following the company's annual general meeting. The preliminary announcement has been agreed with the Company's auditor for release. 2. Revenue Revenue is recognised by applying the effective interest rate (‘EIR’) to the carrying value of a loan. The EIR is calculated at inception and represents the rate which exactly discounts the future contractual cash receipts from a loan to the amount of cash advanced under the loan, plus directly attributable issue costs. In addition, the EIR takes account of customers repaying early.
Year ended 31 Dec 2017
£’000
Year ended 31 Dec 2016
£’000
Interest income 119,756 81,099
Fair value unwind on acquired loan portfolio (11,985) (8,342)
Total revenue 107,771 72,757
3. Operating profit/(loss) for the year is stated after charging/(crediting):
Year ended 31 Dec 2017
£’000
Year ended 31 Dec 2016
£’000
Depreciation of property, plant and equipment 1,497 690
Amortisation of intangible assets 7,897 10,714
Staff costs 32,899 20,287
Rentals under operating leases 1,926 1,110
Profit on sale of property, plant and equipment (416) (363)
Rentals received under operating leases - (28)
26
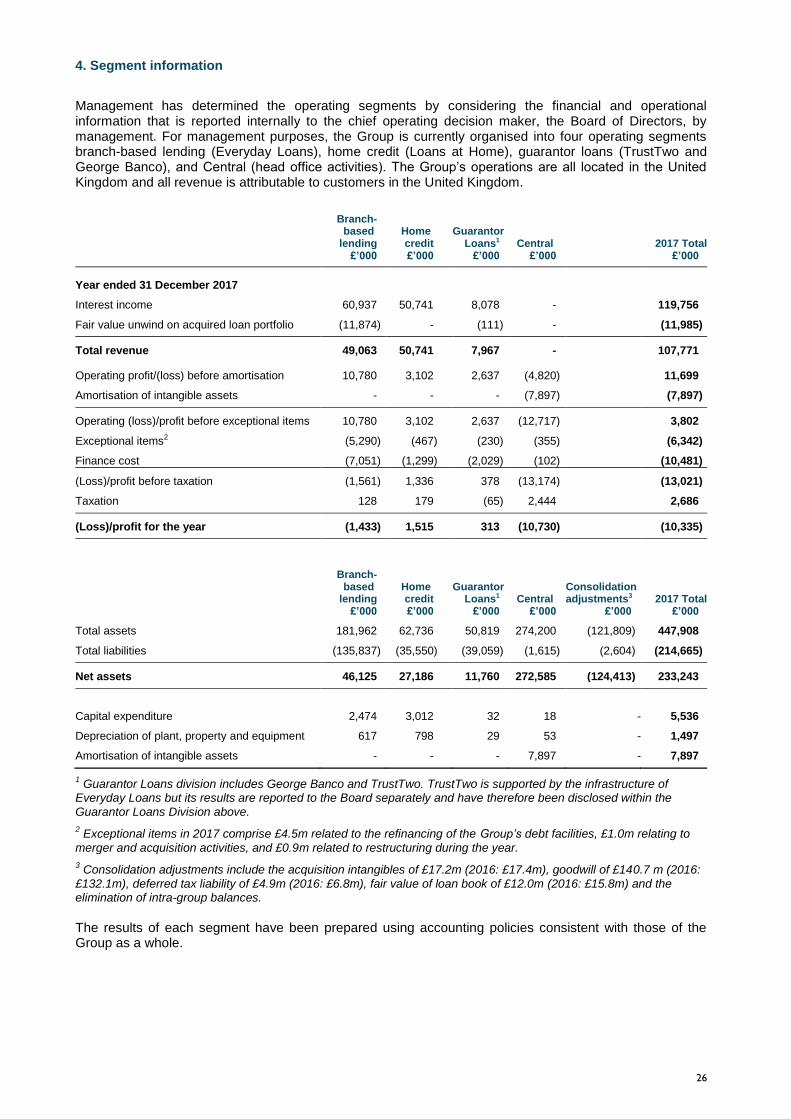
4. Segment information
Management has determined the operating segments by considering the financial and operational information that is reported internally to the chief operating decision maker, the Board of Directors, by management. For management purposes, the Group is currently organised into four operating segments branch-based lending (Everyday Loans), home credit (Loans at Home), guarantor loans (TrustTwo and George Banco), and Central (head office activities). The Group’s operations are all located in the United Kingdom and all revenue is attributable to customers in the United Kingdom.
Branch-based
lending £’000
Home credit £’000
Guarantor Loans1
£’000 Central
£’000 2017 Total
£’000
Year ended 31 December 2017
Interest income 60,937 50,741 8,078 - 119,756
Fair value unwind on acquired loan portfolio (11,874) - (111) - (11,985)
Total revenue 49,063 50,741 7,967 - 107,771
Operating profit/(loss) before amortisation 10,780 3,102 2,637 (4,820) 11,699
Amortisation of intangible assets - - - (7,897) (7,897)
Operating (loss)/profit before exceptional items 10,780 3,102 2,637 (12,717) 3,802
Exceptional items2 (5,290) (467) (230) (355) (6,342)
Finance cost (7,051) (1,299) (2,029) (102) (10,481)
(Loss)/profit before taxation (1,561) 1,336 378 (13,174) (13,021)
Taxation 128 179 (65) 2,444 2,686
(Loss)/profit for the year (1,433) 1,515 313 (10,730) (10,335)
Branch-based
lending £’000
Home credit £’000
Guarantor Loans1
£’000 Central
£’000
Consolidation adjustments3
£’000 2017 Total
£’000
Total assets 181,962 62,736 50,819 274,200 (121,809) 447,908
Total liabilities (135,837) (35,550) (39,059) (1,615) (2,604) (214,665)
Net assets 46,125 27,186 11,760 272,585 (124,413) 233,243
Capital expenditure
2,474
3,012
32
18
-
5,536
Depreciation of plant, property and equipment 617 798 29 53 - 1,497
Amortisation of intangible assets - - - 7,897 - 7,897
1 Guarantor Loans division includes George Banco and TrustTwo. TrustTwo is supported by the infrastructure of
Everyday Loans but its results are reported to the Board separately and have therefore been disclosed within the
Guarantor Loans Division above.
2 Exceptional items in 2017 comprise £4.5m related to the refinancing of the Group’s debt facilities, £1.0m relating to
merger and acquisition activities, and £0.9m related to restructuring during the year.
3 Consolidation adjustments include the acquisition intangibles of £17.2m (2016: £17.4m), goodwill of £140.7 m (2016:
£132.1m), deferred tax liability of £4.9m (2016: £6.8m), fair value of loan book of £12.0m (2016: £15.8m) and the elimination of intra-group balances.
The results of each segment have been prepared using accounting policies consistent with those of the Group as a whole.
27
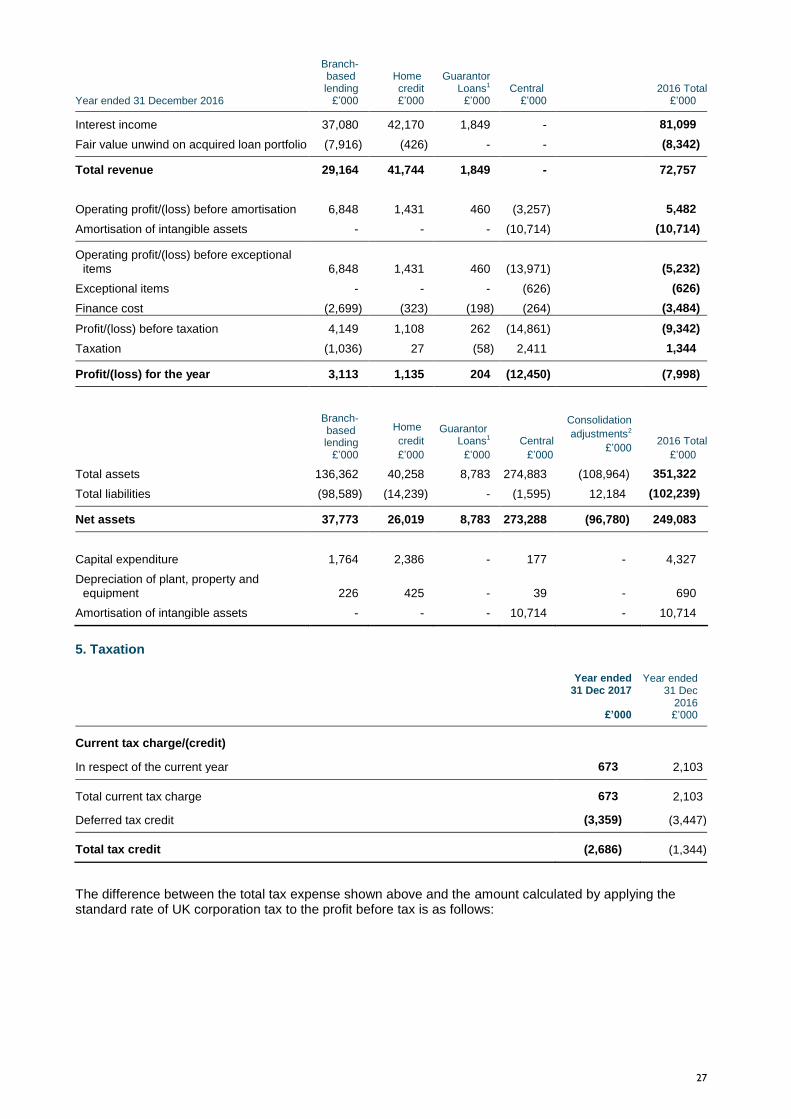
Year ended 31 December 2016
Branch-based lending
£’000
Home credit £’000
Guarantor Loans1
£’000 Central
£’000 2016 Total
£’000
Interest income 37,080 42,170 1,849 - 81,099
Fair value unwind on acquired loan portfolio (7,916) (426) - - (8,342)
Total revenue 29,164 41,744 1,849 - 72,757
Operating profit/(loss) before amortisation 6,848
1,431 460
(3,257) 5,482
Amortisation of intangible assets - - - (10,714) (10,714)
Operating profit/(loss) before exceptional
items 6,848 1,431 460 (13,971) (5,232)
Exceptional items - - - (626) (626)
Finance cost (2,699) (323) (198) (264) (3,484)
Profit/(loss) before taxation 4,149 1,108 262 (14,861) (9,342)
Taxation (1,036) 27 (58) 2,411 1,344
Profit/(loss) for the year 3,113 1,135 204 (12,450) (7,998)
Branch-based lending
£’000
Home
credit
£’000
Guarantor Loans1
£’000
Central
£’000
Consolidation
adjustments2
£’000 2016 Total
£’000
Total assets 136,362 40,258 8,783 274,883 (108,964) 351,322
Total liabilities (98,589) (14,239) - (1,595) 12,184 (102,239)
Net assets 37,773 26,019 8,783 273,288 (96,780) 249,083
Capital expenditure
1,764
2,386
-
177
-
4,327
Depreciation of plant, property and
equipment 226 425 - 39 - 690
Amortisation of intangible assets - - - 10,714 - 10,714
5. Taxation
Year ended 31 Dec 2017
£’000
Year ended 31 Dec
2016 £’000
Current tax charge/(credit)
In respect of the current year 673 2,103
Total current tax charge 673 2,103
Deferred tax credit (3,359) (3,447)
Total tax credit (2,686) (1,344)
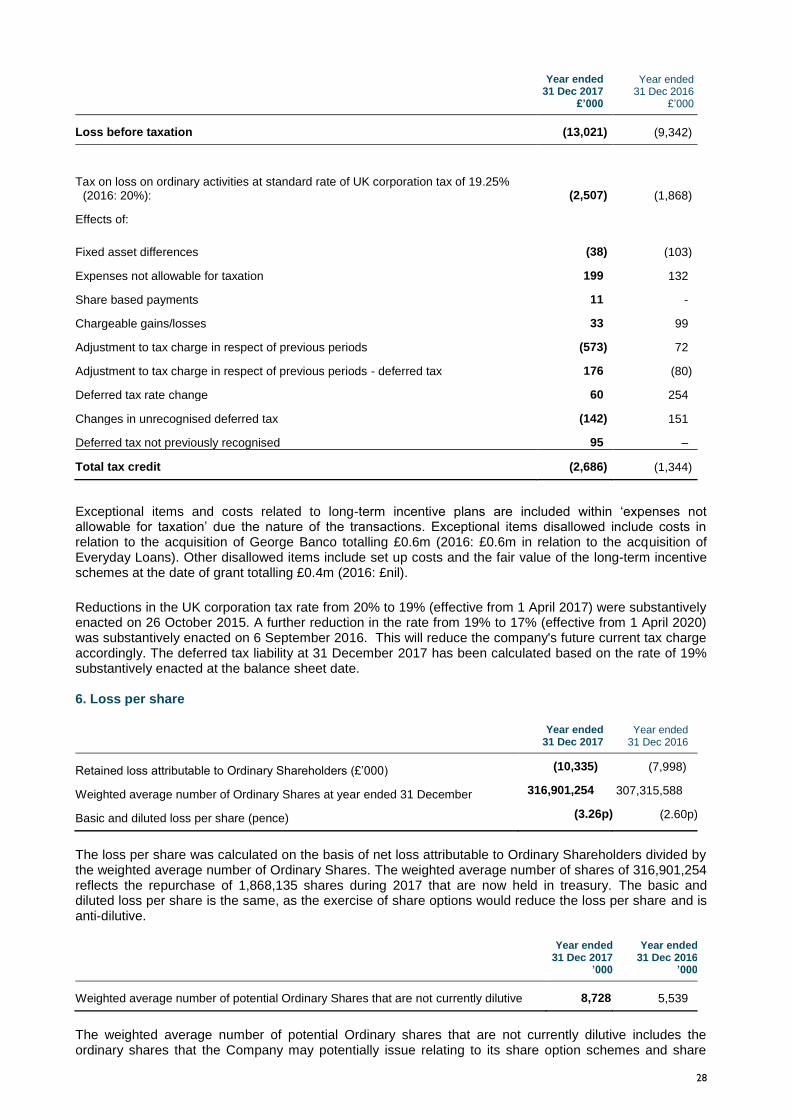
The difference between the total tax expense shown above and the amount calculated by applying the standard rate of UK corporation tax to the profit before tax is as follows:
28
Year ended 31 Dec 2017
£’000
Year ended 31 Dec 2016
£’000
Loss before taxation (13,021) (9,342)
Tax on loss on ordinary activities at standard rate of UK corporation tax of 19.25% (2016: 20%): (2,507) (1,868)
Effects of:
Fixed asset differences (38) (103)
Expenses not allowable for taxation 199 132
Share based payments 11 -
Chargeable gains/losses 33 99
Adjustment to tax charge in respect of previous periods (573) 72
Adjustment to tax charge in respect of previous periods - deferred tax 176 (80)
Deferred tax rate change 60 254
Changes in unrecognised deferred tax (142) 151
Deferred tax not previously recognised 95 –
Total tax credit (2,686) (1,344)
Exceptional items and costs related to long-term incentive plans are included within ‘expenses not allowable for taxation’ due the nature of the transactions. Exceptional items disallowed include costs in relation to the acquisition of George Banco totalling £0.6m (2016: £0.6m in relation to the acquisition of Everyday Loans). Other disallowed items include set up costs and the fair value of the long-term incentive schemes at the date of grant totalling £0.4m (2016: £nil).
Reductions in the UK corporation tax rate from 20% to 19% (effective from 1 April 2017) were substantively enacted on 26 October 2015. A further reduction in the rate from 19% to 17% (effective from 1 April 2020) was substantively enacted on 6 September 2016. This will reduce the company's future current tax charge accordingly. The deferred tax liability at 31 December 2017 has been calculated based on the rate of 19% substantively enacted at the balance sheet date. 6. Loss per share
Year ended
31 Dec 2017 Year ended
31 Dec 2016
Retained loss attributable to Ordinary Shareholders (£’000) (10,335) (7,998)
Weighted average number of Ordinary Shares at year ended 31 December 316,901,254 307,315,588
Basic and diluted loss per share (pence) (3.26p) (2.60p)
The loss per share was calculated on the basis of net loss attributable to Ordinary Shareholders divided by the weighted average number of Ordinary Shares. The weighted average number of shares of 316,901,254 reflects the repurchase of 1,868,135 shares during 2017 that are now held in treasury. The basic and diluted loss per share is the same, as the exercise of share options would reduce the loss per share and is anti-dilutive.
Year ended 31 Dec 2017
’000
Year ended 31 Dec 2016
’000
Weighted average number of potential Ordinary Shares that are not currently dilutive 8,728 5,539
The weighted average number of potential Ordinary shares that are not currently dilutive includes the ordinary shares that the Company may potentially issue relating to its share option schemes and share

29
awards under the Group’s long-term incentive plans and Save As You Earn schemes. The amount is based upon the number of shares that would be issued if 31 December 2017 was the end of the contingency period. 7. Dividends A half-year dividend of 0.5p per share was paid in August 2017 (2016: 0.3p). The Directors have recommended a final dividend in respect of the year ended 31 December 2017 of 1.70 pence per share (31 December 2016: 0.9 pence per share) which will amount to an estimated final dividend payment of £5.4m. This final dividend is not reflected in the balance sheet as at 31 December 2017 as it is subject to shareholder approval.
8. Goodwill
£’000
Cost and net book amount
At 31 December 2015 40,176
Acquisition of subsidiary (Everyday Loans) 91,894
At 31 December 2016 132,070
Acquisition of subsidiary (George Banco) 8,598
At 31 December 2017 140,668
The goodwill recognised represents the difference between the purchase consideration and the net assets acquired (including intangible assets recognised upon acquisition). Total goodwill as at 31 December 2017 comprises £40.2m related to the acquisition of Loans at Home, £91.9m related to the acquisition of Everyday Loans, and £8.6m related to the acquisition of George Banco (refer note 12).
The Group tests goodwill annually for impairment or more frequently if there are indications that goodwill might be impaired. The assessment of impairment of goodwill reflects a number of key estimates, each of which can have a material effect on the carrying value of the asset. These include:
earnings forecasts which have been extracted from the budget, which involves inherent uncertainty, particularly in respect of gross loan values, collections performance and the cost base of the business;
the price earnings multiple applied to the cash flow forecasts;
estimates made on the disposal costs of the business; and
the discount rate applied to determine the NPV of future cash flows.
The recoverable amount has been determined based on a fair value less cost-to-sell calculation. That calculation uses earnings projections based on financial budgets approved by management covering a three year period to 31 December 2020, disposal costs have been estimated at 2% and a discount rate of 12% has been used for the Group. The Directors have estimated the discount rate using post-tax rates that reflect current market assessments of the time value of money and the risks specific to the market. None of the goodwill is tax deductible. Considering the key estimates above, the Group has identified that it would require a movement in all of the judgements and estimates of greater than 33% (Loans at Home), 10% (Everyday Loans) and 35% (George Banco), to give rise to a potential impairment charge to the carrying value of goodwill recognised for each CGU. Furthermore, it would require the following percentage decreases in 2020 forecast earnings to necessitate an impairment charge to the carrying value of goodwill: 61% at Loans at Home, 21% at Everyday Loans and 54% at George Banco.
The Group considers that there is no reasonably foreseeable reduction in the assumptions which would give rise to impairment and therefore no further sensitivity has been presented.
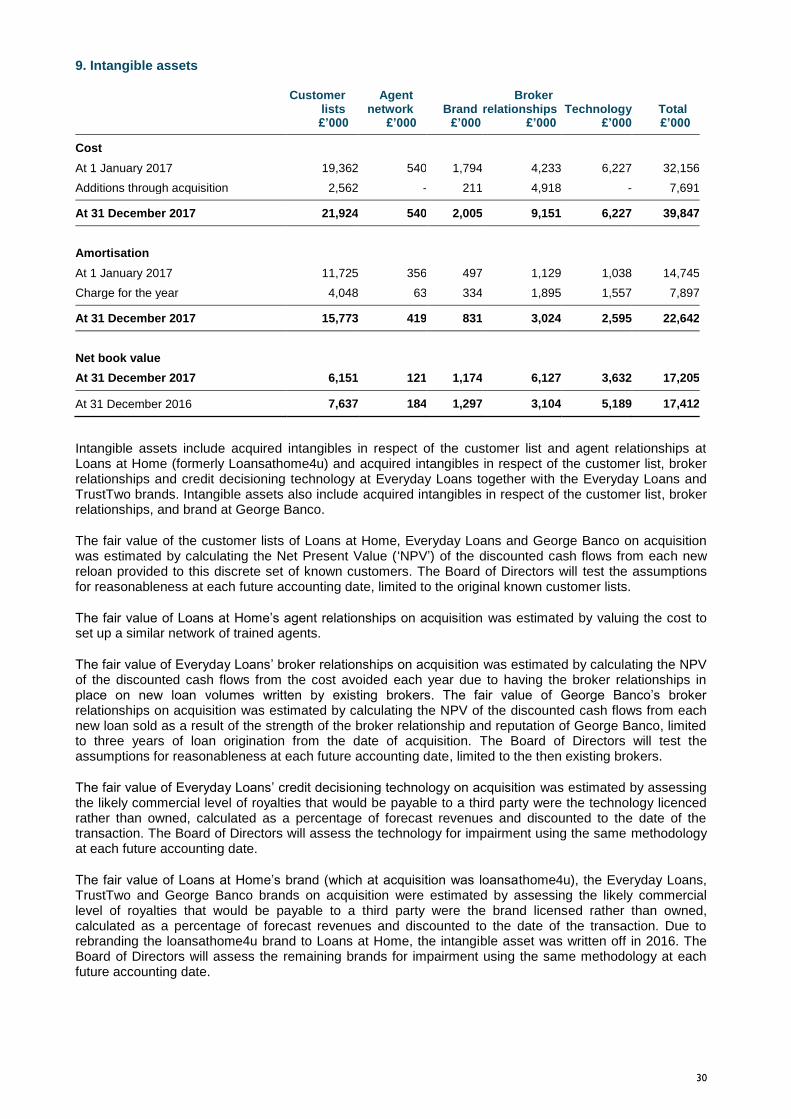
30
9. Intangible assets
Customer lists £’000
Agent network
£’000 Brand
£’000
Broker relationships
£’000 Technology
£’000 Total £’000
Cost
At 1 January 2017 19,362 540 1,794 4,233 6,227 32,156
Additions through acquisition 2,562 - 211 4,918 - 7,691
At 31 December 2017 21,924 540 2,005 9,151 6,227 39,847
Amortisation
At 1 January 2017 11,725 356 497 1,129 1,038 14,745
Charge for the year 4,048 63 334 1,895 1,557 7,897
At 31 December 2017 15,773 419 831 3,024 2,595 22,642
Net book value
At 31 December 2017 6,151 121 1,174 6,127 3,632 17,205
At 31 December 2016 7,637 184 1,297 3,104 5,189 17,412
Intangible assets include acquired intangibles in respect of the customer list and agent relationships at Loans at Home (formerly Loansathome4u) and acquired intangibles in respect of the customer list, broker relationships and credit decisioning technology at Everyday Loans together with the Everyday Loans and TrustTwo brands. Intangible assets also include acquired intangibles in respect of the customer list, broker relationships, and brand at George Banco.
The fair value of the customer lists of Loans at Home, Everyday Loans and George Banco on acquisition was estimated by calculating the Net Present Value (‘NPV’) of the discounted cash flows from each new reloan provided to this discrete set of known customers. The Board of Directors will test the assumptions for reasonableness at each future accounting date, limited to the original known customer lists.
The fair value of Loans at Home’s agent relationships on acquisition was estimated by valuing the cost to set up a similar network of trained agents.
The fair value of Everyday Loans’ broker relationships on acquisition was estimated by calculating the NPV of the discounted cash flows from the cost avoided each year due to having the broker relationships in place on new loan volumes written by existing brokers. The fair value of George Banco’s broker relationships on acquisition was estimated by calculating the NPV of the discounted cash flows from each new loan sold as a result of the strength of the broker relationship and reputation of George Banco, limited to three years of loan origination from the date of acquisition. The Board of Directors will test the assumptions for reasonableness at each future accounting date, limited to the then existing brokers.
The fair value of Everyday Loans’ credit decisioning technology on acquisition was estimated by assessing the likely commercial level of royalties that would be payable to a third party were the technology licenced rather than owned, calculated as a percentage of forecast revenues and discounted to the date of the transaction. The Board of Directors will assess the technology for impairment using the same methodology at each future accounting date.
The fair value of Loans at Home’s brand (which at acquisition was loansathome4u), the Everyday Loans, TrustTwo and George Banco brands on acquisition were estimated by assessing the likely commercial level of royalties that would be payable to a third party were the brand licensed rather than owned, calculated as a percentage of forecast revenues and discounted to the date of the transaction. Due to rebranding the loansathome4u brand to Loans at Home, the intangible asset was written off in 2016. The Board of Directors will assess the remaining brands for impairment using the same methodology at each future accounting date.
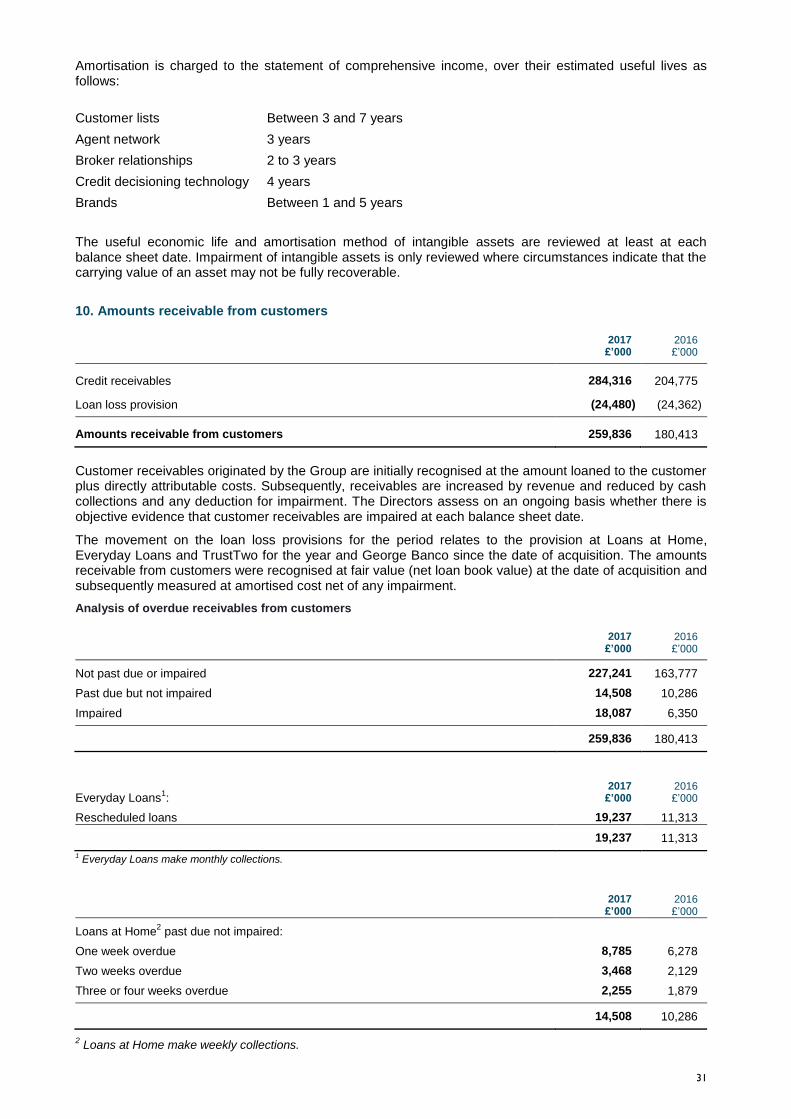
31
Amortisation is charged to the statement of comprehensive income, over their estimated useful lives as follows:
Customer lists Between 3 and 7 years
Agent network 3 years
Broker relationships 2 to 3 years
Credit decisioning technology 4 years
Brands Between 1 and 5 years
The useful economic life and amortisation method of intangible assets are reviewed at least at each balance sheet date. Impairment of intangible assets is only reviewed where circumstances indicate that the carrying value of an asset may not be fully recoverable.
10. Amounts receivable from customers 2017
£’000 2016 £’000
Credit receivables 284,316 204,775
Loan loss provision (24,480) (24,362)
Amounts receivable from customers 259,836 180,413
Customer receivables originated by the Group are initially recognised at the amount loaned to the customer plus directly attributable costs. Subsequently, receivables are increased by revenue and reduced by cash collections and any deduction for impairment. The Directors assess on an ongoing basis whether there is objective evidence that customer receivables are impaired at each balance sheet date.
The movement on the loan loss provisions for the period relates to the provision at Loans at Home, Everyday Loans and TrustTwo for the year and George Banco since the date of acquisition. The amounts receivable from customers were recognised at fair value (net loan book value) at the date of acquisition and subsequently measured at amortised cost net of any impairment.
Analysis of overdue receivables from customers
2017
£’000 2016 £’000
Not past due or impaired 227,241 163,777
Past due but not impaired 14,508 10,286
Impaired 18,087 6,350
259,836 180,413
Everyday Loans1:
2017 £’000
2016 £’000
Rescheduled loans 19,237 11,313
19,237 11,313
1 Everyday Loans make monthly collections.
2017 £’000
2016 £’000
Loans at Home2 past due not impaired:
One week overdue 8,785 6,278
Two weeks overdue 3,468 2,129
Three or four weeks overdue 2,255 1,879
14,508 10,286
2 Loans at Home make weekly collections.
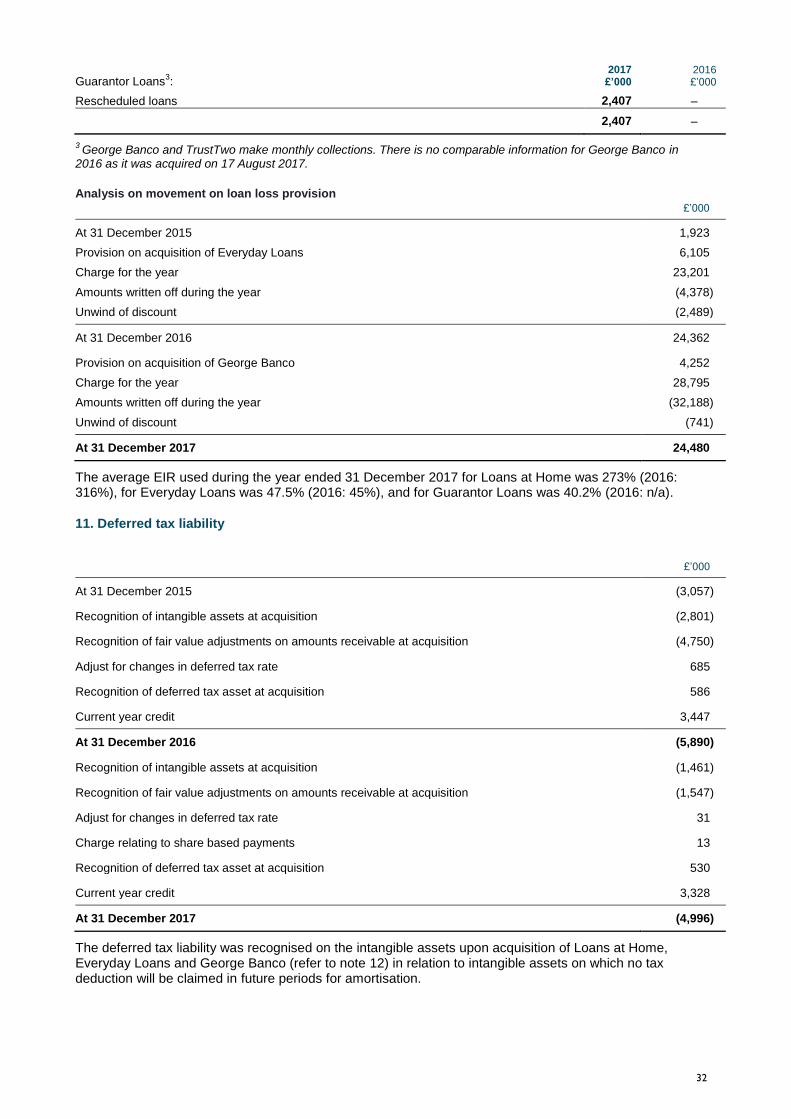
32
Guarantor Loans3:
2017 £’000
2016 £’000
Rescheduled loans 2,407 –
2,407 –
3 George Banco and TrustTwo make monthly collections. There is no comparable information for George Banco in
2016 as it was acquired on 17 August 2017.
Analysis on movement on loan loss provision
£’000
At 31 December 2015 1,923
Provision on acquisition of Everyday Loans 6,105
Charge for the year 23,201
Amounts written off during the year (4,378)
Unwind of discount (2,489)
At 31 December 2016 24,362
Provision on acquisition of George Banco 4,252
Charge for the year 28,795
Amounts written off during the year (32,188)
Unwind of discount (741)
At 31 December 2017 24,480
The average EIR used during the year ended 31 December 2017 for Loans at Home was 273% (2016: 316%), for Everyday Loans was 47.5% (2016: 45%), and for Guarantor Loans was 40.2% (2016: n/a).
11. Deferred tax liability
£’000
At 31 December 2015 (3,057)
Recognition of intangible assets at acquisition (2,801)
Recognition of fair value adjustments on amounts receivable at acquisition (4,750)
Adjust for changes in deferred tax rate 685
Recognition of deferred tax asset at acquisition 586
Current year credit 3,447
At 31 December 2016 (5,890)
Recognition of intangible assets at acquisition (1,461)
Recognition of fair value adjustments on amounts receivable at acquisition (1,547)
Adjust for changes in deferred tax rate 31
Charge relating to share based payments 13
Recognition of deferred tax asset at acquisition 530
Current year credit 3,328
At 31 December 2017 (4,996)
The deferred tax liability was recognised on the intangible assets upon acquisition of Loans at Home, Everyday Loans and George Banco (refer to note 12) in relation to intangible assets on which no tax deduction will be claimed in future periods for amortisation.
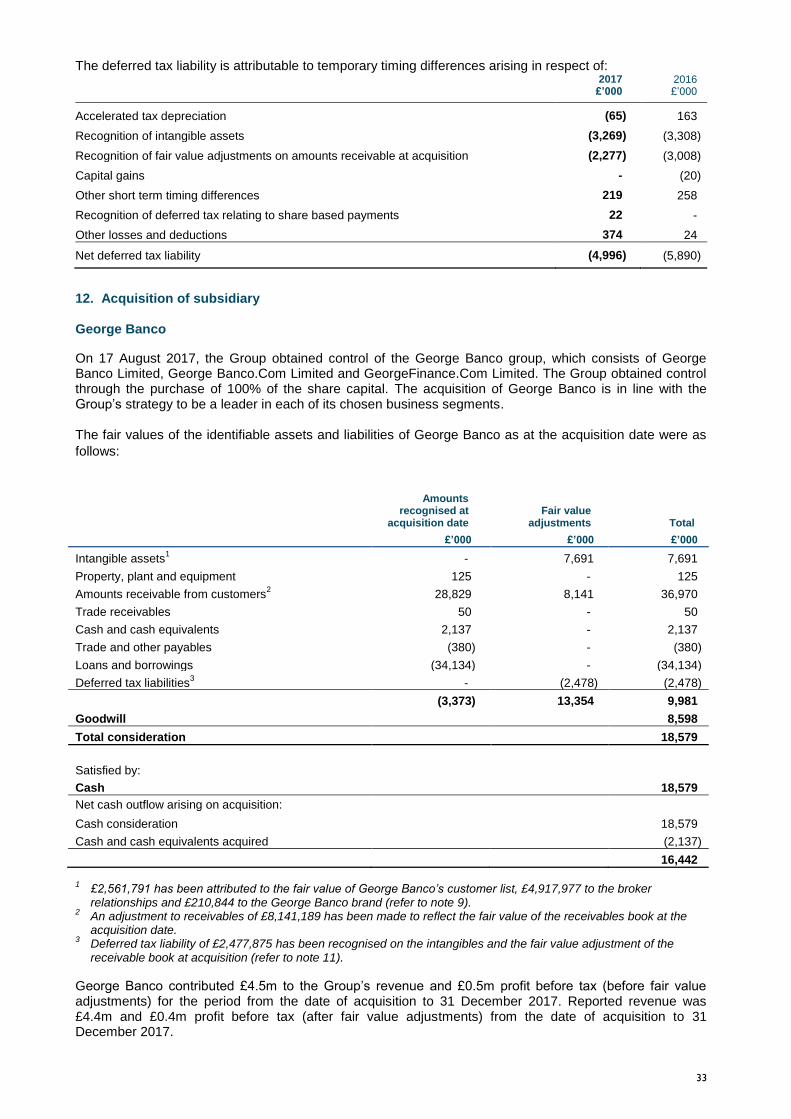
33
The deferred tax liability is attributable to temporary timing differences arising in respect of:
2017
£’000 2016 £’000
Accelerated tax depreciation (65) 163
Recognition of intangible assets (3,269) (3,308)
Recognition of fair value adjustments on amounts receivable at acquisition (2,277) (3,008)
Capital gains - (20)
Other short term timing differences 219 258
Recognition of deferred tax relating to share based payments 22 -
Other losses and deductions 374 24
Net deferred tax liability (4,996) (5,890)
12. Acquisition of subsidiary George Banco
On 17 August 2017, the Group obtained control of the George Banco group, which consists of George Banco Limited, George Banco.Com Limited and GeorgeFinance.Com Limited. The Group obtained control through the purchase of 100% of the share capital. The acquisition of George Banco is in line with the Group’s strategy to be a leader in each of its chosen business segments. The fair values of the identifiable assets and liabilities of George Banco as at the acquisition date were as
follows:
Amounts recognised at
acquisition date Fair value
adjustments Total
£’000 £’000 £’000
Intangible assets1 - 7,691 7,691
Property, plant and equipment 125 - 125
Amounts receivable from customers2 28,829 8,141 36,970
Trade receivables 50 - 50
Cash and cash equivalents 2,137 - 2,137
Trade and other payables (380) - (380)
Loans and borrowings (34,134) - (34,134)
Deferred tax liabilities3 - (2,478) (2,478)
(3,373) 13,354 9,981
Goodwill
8,598
Total consideration 18,579
Satisfied by:
Cash 18,579
Net cash outflow arising on acquisition:
Cash consideration
18,579
Cash and cash equivalents acquired
(2,137)
16,442
1 £2,561,791 has been attributed to the fair value of George Banco’s customer list, £4,917,977 to the broker
relationships and £210,844 to the George Banco brand (refer to note 9). 2 An adjustment to receivables of £8,141,189 has been made to reflect the fair value of the receivables book at the
acquisition date. 3 Deferred tax liability of £2,477,875 has been recognised on the intangibles and the fair value adjustment of the
receivable book at acquisition (refer to note 11).
George Banco contributed £4.5m to the Group’s revenue and £0.5m profit before tax (before fair value adjustments) for the period from the date of acquisition to 31 December 2017. Reported revenue was £4.4m and £0.4m profit before tax (after fair value adjustments) from the date of acquisition to 31 December 2017.
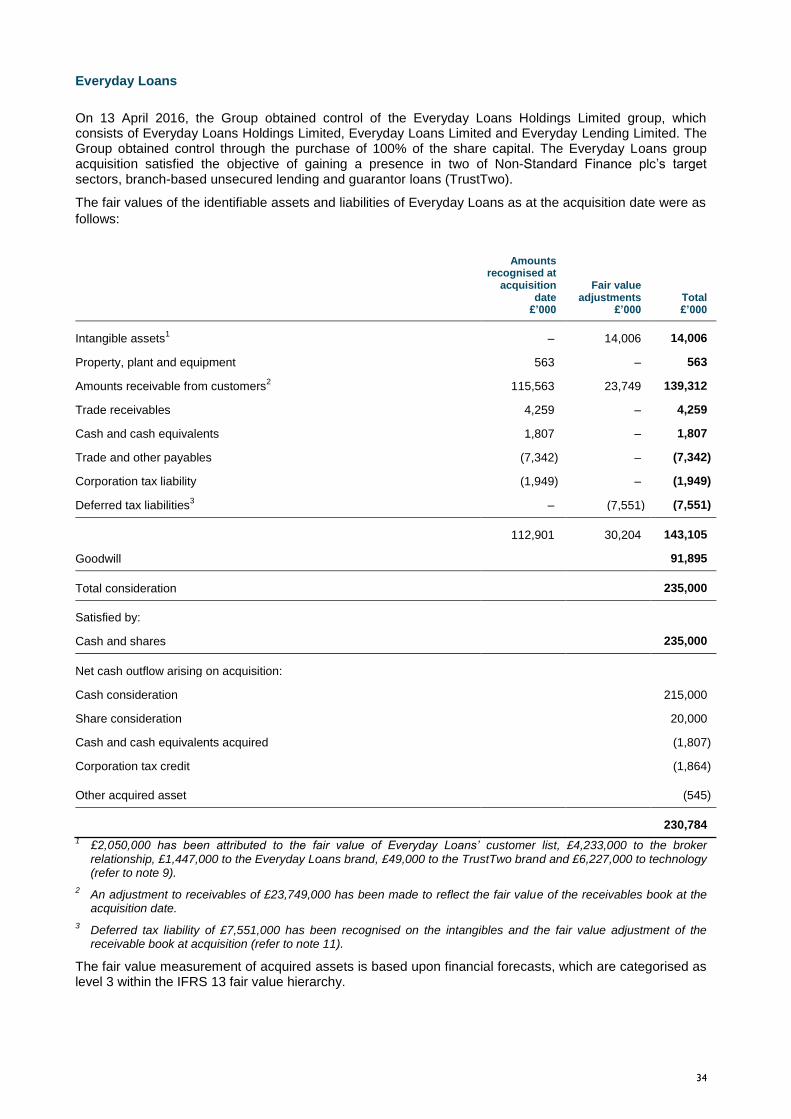
34
Everyday Loans
On 13 April 2016, the Group obtained control of the Everyday Loans Holdings Limited group, which consists of Everyday Loans Holdings Limited, Everyday Loans Limited and Everyday Lending Limited. The Group obtained control through the purchase of 100% of the share capital. The Everyday Loans group acquisition satisfied the objective of gaining a presence in two of Non-Standard Finance plc’s target sectors, branch-based unsecured lending and guarantor loans (TrustTwo).
The fair values of the identifiable assets and liabilities of Everyday Loans as at the acquisition date were as
follows:
Amounts recognised at
acquisition date
£’000
Fair value adjustments
£’000 Total £’000
Intangible assets1 – 14,006 14,006
Property, plant and equipment 563 – 563
Amounts receivable from customers2 115,563 23,749 139,312
Trade receivables 4,259 – 4,259
Cash and cash equivalents 1,807 – 1,807
Trade and other payables (7,342) – (7,342)
Corporation tax liability (1,949) – (1,949)
Deferred tax liabilities3 – (7,551) (7,551)
112,901 30,204 143,105
Goodwill 91,895
Total consideration 235,000
Satisfied by:
Cash and shares 235,000
Net cash outflow arising on acquisition:
Cash consideration 215,000
Share consideration 20,000
Cash and cash equivalents acquired (1,807)
Corporation tax credit (1,864)
Other acquired asset (545)
230,784
1 £2,050,000 has been attributed to the fair value of Everyday Loans’ customer list, £4,233,000 to the broker
relationship, £1,447,000 to the Everyday Loans brand, £49,000 to the TrustTwo brand and £6,227,000 to technology (refer to note 9).
2 An adjustment to receivables of £23,749,000 has been made to reflect the fair value of the receivables book at the
acquisition date.
3 Deferred tax liability of £7,551,000 has been recognised on the intangibles and the fair value adjustment of the
receivable book at acquisition (refer to note 11).
The fair value measurement of acquired assets is based upon financial forecasts, which are categorised as level 3 within the IFRS 13 fair value hierarchy.
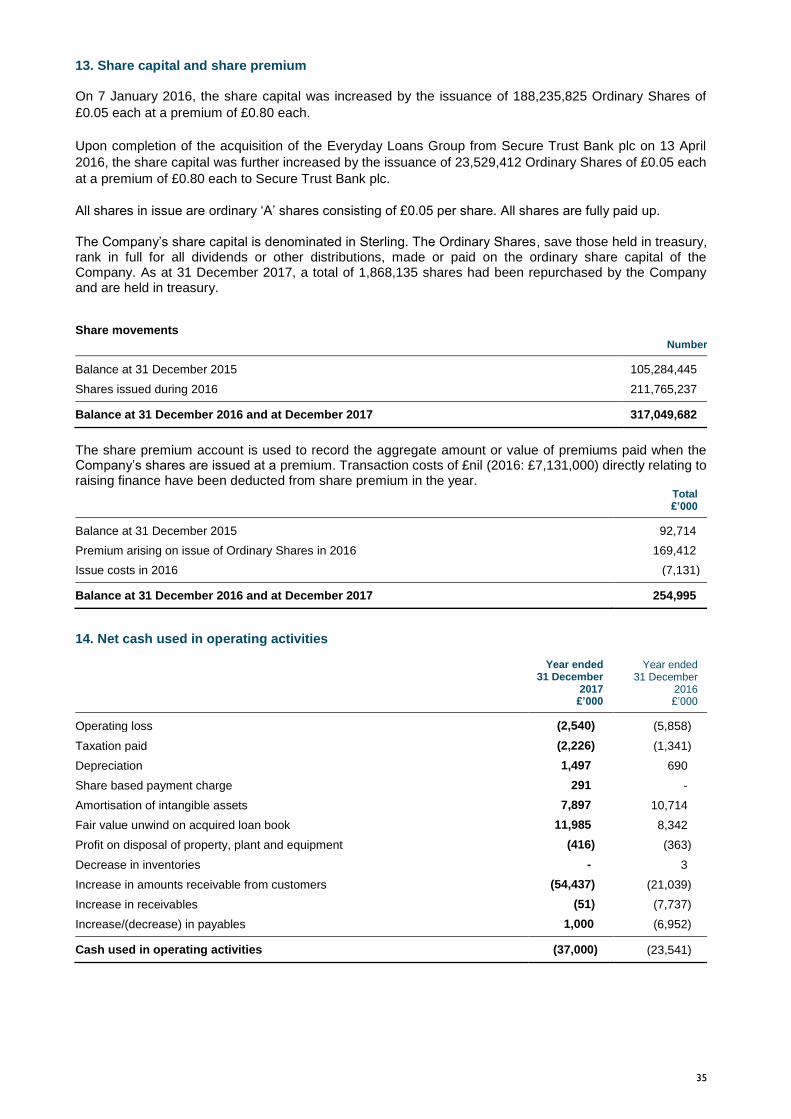
35
13. Share capital and share premium On 7 January 2016, the share capital was increased by the issuance of 188,235,825 Ordinary Shares of
£0.05 each at a premium of £0.80 each.
Upon completion of the acquisition of the Everyday Loans Group from Secure Trust Bank plc on 13 April
2016, the share capital was further increased by the issuance of 23,529,412 Ordinary Shares of £0.05 each
at a premium of £0.80 each to Secure Trust Bank plc.
All shares in issue are ordinary ‘A’ shares consisting of £0.05 per share. All shares are fully paid up.
The Company’s share capital is denominated in Sterling. The Ordinary Shares, save those held in treasury, rank in full for all dividends or other distributions, made or paid on the ordinary share capital of the Company. As at 31 December 2017, a total of 1,868,135 shares had been repurchased by the Company and are held in treasury. Share movements
Number
Balance at 31 December 2015 105,284,445
Shares issued during 2016 211,765,237
Balance at 31 December 2016 and at December 2017 317,049,682
The share premium account is used to record the aggregate amount or value of premiums paid when the Company’s shares are issued at a premium. Transaction costs of £nil (2016: £7,131,000) directly relating to raising finance have been deducted from share premium in the year.
Total £’000
Balance at 31 December 2015 92,714
Premium arising on issue of Ordinary Shares in 2016 169,412
Issue costs in 2016 (7,131)
Balance at 31 December 2016 and at December 2017 254,995
14. Net cash used in operating activities
Year ended
31 December 2017
£’000
Year ended
31 December 2016 £’000
Operating loss (2,540) (5,858)
Taxation paid (2,226) (1,341)
Depreciation 1,497 690
Share based payment charge 291 -
Amortisation of intangible assets 7,897 10,714
Fair value unwind on acquired loan book 11,985 8,342
Profit on disposal of property, plant and equipment (416) (363)
Decrease in inventories - 3
Increase in amounts receivable from customers (54,437) (21,039)
Increase in receivables (51) (7,737)
Increase/(decrease) in payables 1,000 (6,952)
Cash used in operating activities (37,000) (23,541)