nonlinear analysis of the baroreceptor reflex...
TRANSCRIPT
Nonlinear Analysis of the BaroreceptorReflex System
By William H. Levison, Sc.D., G. Octo Barnett, M.D., and
William D. Jackson, Ph.D.
• The cardiovascular system is a complexmechanical, chemical, and hemodynamic sys-tem in which the variables are interrelatedthrough a variety of feedback mechanisms. Ofthe various mechanisms that control cardio-vascular function, the one that has been mostthoroughly investigated is the baroreceptorreflex. The performance of the baroreceptorreflex has been studied previously in prepara-tions in which the feedback path was eitherintact1'2 or broken,3'4 and several models ofblood pressure regulation have been pro-posed.3- "•6 Physiological processes involved inthe reflex control of blood pressure (such assinus and aortic nerve activity,7'8 changes incardiac output9 and peripheral resistance,9'10
and renal and adrenal hormonal changes11)have been studied individually. But complete,quantitative descriptions of the overall re-sponse and of the individual processes arelacking at present.
Many investigators have applied methods ofcontrol analysis to a number of biologicalcontrol systems in order to formulate mathe-
From the Department of Medicine, Harvard Med-ical School, Boston, Massachusetts and the Depart-ment of Electrical Engineering and the ResearchLaboratory of Electronics, Massachusetts Institute ofTechnology, Cambridge, Massachusetts.
The research work was submitted in partial ful-fillment of the requirements for the degree of Doctorof Science for William H. Levison at the Massachu-setts Institute of Technology.
Supported in part by training Grant HTS-5550 andresearch Grant HE-08666 from the U. S. PublicHealth Service, and in part by the American HeartAssociation. The data reduction was done in part inthe Laboratory of Mathematical Biology at the PeterBent Brigham Hospital and in part at the Com-putation Center at the Massachusetts Institute ofTechnology, Cambridge, Massachusetts.
Accepted for publication December 1, 1965.
matical descriptions, or models, of these sys-tems.5' 12"14 The ideal model would consistof direct analogs of each functional unit of thebiological system and would correctly inter-relate these units. A model which fulfilledthese requirements would predict correctlythe overall performance of the system and,more importantly from a medical point ofview, would reveal how malfunction of oneor more of the constituent processes affectsthis performance.
The experimental work presented in thisreport examines in greater detail the regula-tion of blood pressure by the baroreceptorreflex. The receptor feedback in anesthetizeddogs was broken by surgical intervention, theinput (carotid sinus pressure) was controlledexperimentally, and simultaneous records ofinput and output (systemic arterial pressure)were processed. A wide variety of input-outputmeasurements were made; some of the experi-ments were designed to explore particularlythe nonlinear aspects of the reflex. The baro-receptor reflex was defined operationally asthose biological processes that collectivelycaused the systemic arterial pressure to respondto changes in carotid sinus pressure. Changesin arterial pressure due to factors unrelatedto changes in sinus pressure were not in-vestigated. All biological feedback loops thatwere not opened by the experimental pro-cedures were part of the experimentally-de-fined baroreceptor reflex.
An electronic simulator was constructed tomodel the input-output behavior of the sys-tem and to predict the performance of thereflex over a range of physiologic situations.This model was designed to have the simpleststructure that would approximate the experi-mentally-observed behavior. Some portions ofthe model were designed to correspond to
Circulation Research, Vol. XV111, June 1966 673
by guest on May 14, 2018
http://circres.ahajournals.org/D
ownloaded from

674 LEVISON, BARNETT, JACKSON
known physiological components of the reflex;others were chosen solely to provide the cor-rect input-output performance.
MethodsExperiments were performed on eight mongrel
dogs (weighing 16 to 18 kg) anesthetized withintravenous chloralose (80 mg/kg). Additionalanesthetic agent was generally given when theanimal developed spontaneous respiratory activ-ity. Heparin was administered to prevent clot-ting and positive-pressure respiration was applied.
In all experimental preparations the carotidsinus receptors were partially isolated from thearterial circulation. The sinus nerves were keptintact, as were the vago-sympathetic trunks.Feedback through the aortic receptors was in-terrupted by denervation, as described byDerom.15 The major vessels denervated were theaortic arch, the brachiocephalic artery, and thecommon carotid arteries. Denervation was per-formed under sterile conditions at least two weeksprior to the experiment, and the animal wasallowed to recover.
An external perfusion circuit, controlled bymeans of a pump and a servo-valve, enabled avariety of pressure waveforms to be applied tothe carotid sinus. A diagram of the pressurecontrol apparatus appears in figure 1. Bothcommon carotid arteries and the left jugularvein were cut, and the cephalic segments of thecarotid arteries were joined by a Y-tube. Bloodwithdrawn from the cardiac segment of the leftcarotid was raised to a high pressure by aroller pump. A buffer chamber and a large fixedresistance in series with the pump provided aconstant, nonpulsatile flow.
A servo system regulated the pressure in bothsinuses by apportioning the pump flow betweenthe sinuses and a shunt path to the jugular vein.An analog of the desired pressure waveform,generated by electronic oscillators, was comparedto the output of a transducer monitoring the
^ . TO R. CAROTIDARTERY
FIGURE 1
Diagram of apparatus used to control carotid sinuspressure.
carotid sinus pressure. The error signal drove aservo amplifier which in turn controlled a variableresistance located in the shunt path.
The carotid sinus pressure was monitored viaa catheter inserted into the left lingual artery;the right sinus pressure was not monitored. Pres-sure in the central aorta was measured througha catheter placed in the cardiac segment of theright common carotid. In order to reduce theflow necessary for adequate control of sinuspressure, the external maxillary, internal maxil-lary, occipital and thyroid arteries were tied.The ligation of these arteries was done in sucha way as to avoid damage to the carotid sinusnerves.
The pump flow was determined by the pumpspeed and the setting of the fixed resistance,both of which were kept constant during eachexperimental run. The pump speed was fixed,and the resistance was adjusted to provide theminimum flow that would allow adequate controlof the carotid sinus pressure. When the flowrate was 300 cc per minute the sinus pressurecould generally be varied between a minimum of50 to 75 mm Hg and a maximum of 125 to 150mm Hg. The use of the perfusion circuit loweredthe mean systemic arterial pressure by about 20mm Hg as a result of decreasing the amount ofblood perfusing the remainder of the arterialsystem. Since the pump flow was kept constantduring each experimental run, it could not di-rectly influence the shape of the arterial pressureresponse although it did affect the operating pointof the system.
The physiological data were processed to re-duce the effects of noise, i.e., pressure varia-tions unrelated to the sinus pressure waveform.Noise sources were 1) the pressure pulse, 2)variations caused by respiratory activity, and 3)changes in the physiological state of the animal.The output waveform was filtered to reducehigh-frequency (pressure pulse) noise. Succes-sive cycles of data were averaged to reduce theremainder of the noise when the input was aperiodic waveform. When the input consisted ofone or more sinusoids, Fourier analysis of theaveraged data yielded the amplitude and phaseof the fundamental component and the amountof harmonic distortion. The number of cyclesaveraged per datum point (from 4 to 45) de-pended on the test frequency; more cycles wereaveraged at the high end of the spectrum.
THE MODEL
The model referred to in this paper is ananalog device that was constructed from standardelectronic components to simulate the input-output behavior of the baroreceptor reflex. Devel-opment of the model proceeded simultaneously
Circulation Research, Vol. XVIII, June 1966
by guest on May 14, 2018
http://circres.ahajournals.org/D
ownloaded from
ANALYSIS OF THE BARORECEPTOR REFLEX 675
1NPUTO "r,5»l
Y
L^ix
0
NONLINEARSECOND-ORDER
SYSTEM
E
1
l '2{T5S*rfs2
F
-1
FIGURE 1
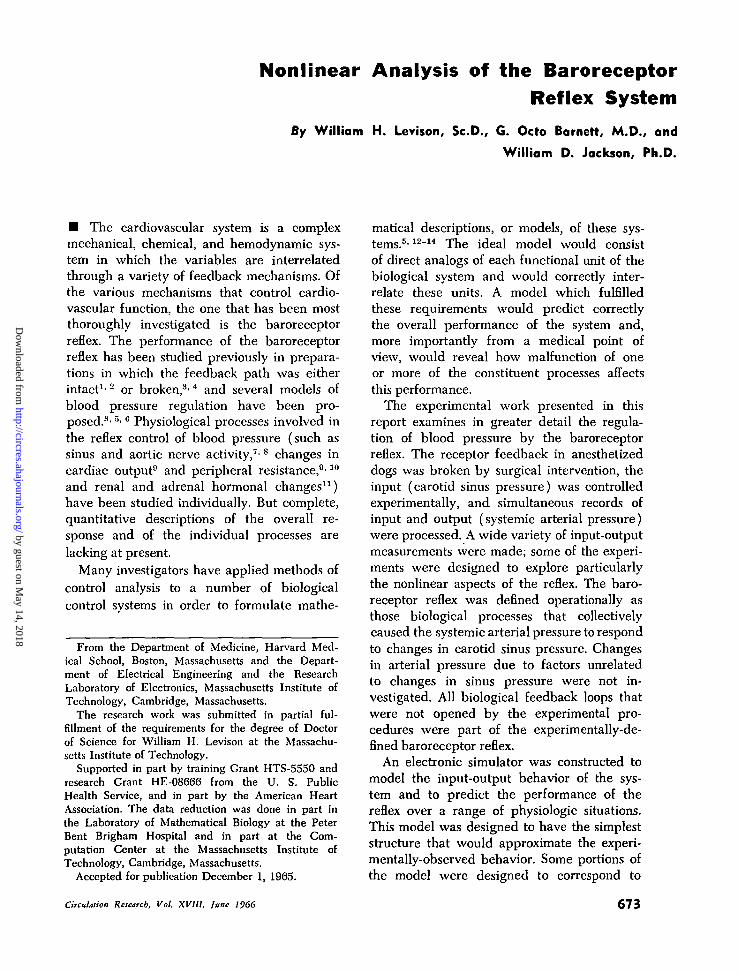
Block diagram of the analog model of the barore-ceptor reflex.
with the physiological experimentation; often theacquisition of the new data led to a modifica-tion of the design. The design and performanceof the final version of the model are presentedin this paper.
A block diagram of the model is shown infigure 2; additional details of the model arepresented in Appendix A. The voltage waveformapplied to the input of the model was ana-logous to the carotid sinus pressure waveform;the output voltage corresponded to systemicarterial pressure (neglecting the pressure pulse).All references to the model and to data obtainedfrom the model are in terms of analogous physio-logical dimensions.
The first linear section (unit A) of the modelprovided high-frequency emphasis. The rectifier(B) yielded zero output for inputs less thanXT and had unity incremental gain for inputsgreater than XT. Further nonlinearities were in-cluded in the second-order system (unit D) inorder to simulate the observed nonlinear be-havior of the physiological system. Two addition-al linear networks, C and E, were included toimprove the sinewave response of the model.A sign inversion was included to simulate theinverse relationship between sinus and systemicarterial pressures. The parameters of the modelwere adjusted to simulate the average behaviorof all the experimental preparations.
Results
Eight different kinds of input-output mea-surements were made in order to provide areasonable basis for the construction of themodel. Three of these measurements wereconcerned with the determination of the rela-tion between carotid sinus pressure and meansystemic arterial pressure. The following pa-rameters of the sinus pressure were varied in-dividually: (1) mean level, (2) the amplitude
Circulation Research, Vol. XVIII, June 1966
COCOUJ
ccQ.
UJ
<UJ
150
125
100
75
50I
0 25 50INPUT AMPLITUDE
(MM Hg)FIGURE 3
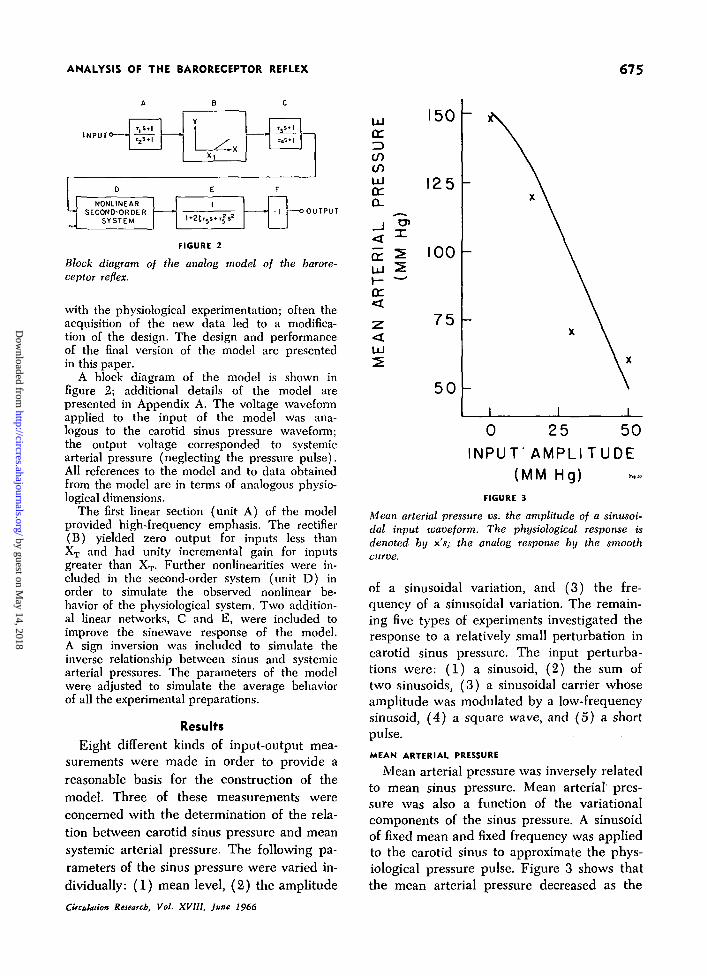
Mean arterial pressure vs. the amplitude of a sinusoi-dal input waveform. The physiological response isdenoted by x's; the analog response by the smoothcurve.
of a sinusoidal variation, and (3) the fre-quency of a sinusoidal variation. The remain-ing five types of experiments investigated theresponse to a relatively small perturbation incarotid sinus pressure. The input perturba-tions were: (1) a sinusoid, (2) the sum oftwo sinusoids, (3) a sinusoidal carrier whoseamplitude was modulated by a low-frequencysinusoid, (4) a square wave, and (5) a shortpulse.
MEAN ARTERIAL PRESSURE
Mean arterial pressure was inversely relatedto mean sinus pressure. Mean arterial pres-sure was also a function of the variationalcomponents of the sinus pressure. A sinusoidof fixed mean and fixed frequency was appliedto the carotid sinus to approximate the phys-iological pressure pulse. Figure 3 shows thatthe mean arterial pressure decreased as the
by guest on May 14, 2018
http://circres.ahajournals.org/D
ownloaded from
676 LEVISON, BARNETT, JACKSON
amplitude of the sinusoid increased.* Theseresults were expected on the basis of the workreported by Ead et al.16 who showed in theintact animal that the arterial pressure wasinversely related to the sinus pressure pulse.
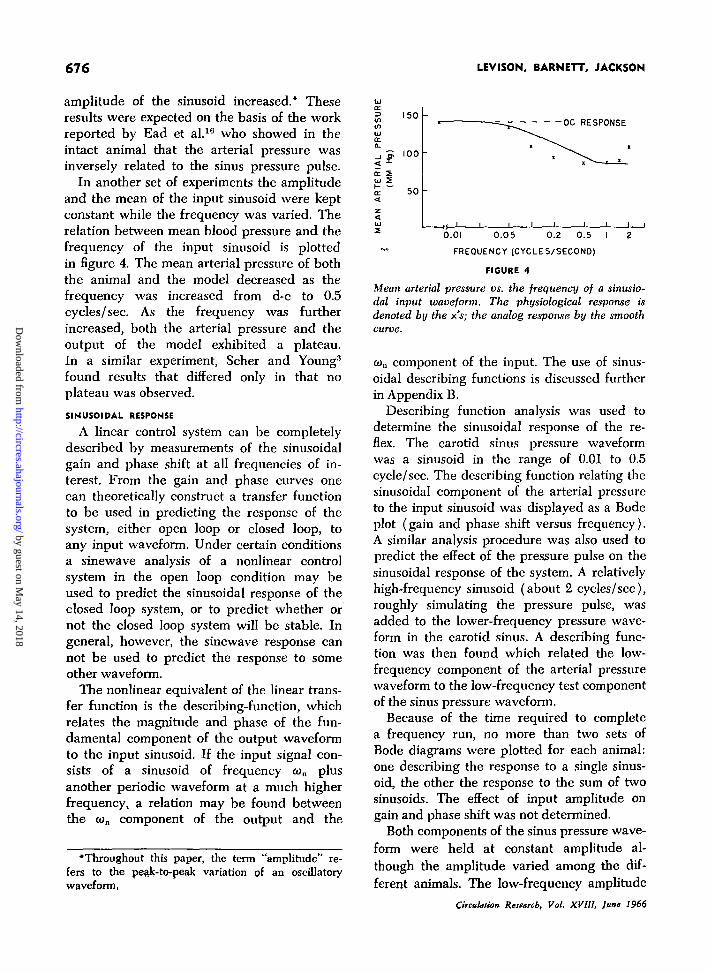
In another set of experiments the amplitudeand the mean of the input sinusoid were keptconstant while the frequency was varied. Therelation between mean blood pressure and thefrequency of the input sinusoid is plottedin figure 4. The mean arterial pressure of boththe animal and the model decreased as thefrequency was increased from d-c to 0.5cycles/sec. As the frequency was furtherincreased, both the arterial pressure and theoutput of the model exhibited a plateau.In a similar experiment, Scher and Young3
found results that differed only in that noplateau was observed.
SINUSOIDAL RESPONSE
A linear control system can be completelydescribed by measurements of the sinusoidalgain and phase shift at all frequencies of in-terest. From the gain and phase curves onecan theoretically construct a transfer functionto be used in predicting the response of thesystem, either open loop or closed loop, toany input waveform. Under certain conditionsa sinewave analysis of a nonlinear controlsystem in the open loop condition may beused to predict the sinusoidal response of theclosed loop system, or to predict whether ornot the closed loop system will be stable. Ingeneral, however, the sinewave response cannot be used to predict the response to someother waveform.
The nonlinear equivalent of the linear trans-fer function is the describing-function, whichrelates the magnitude and phase of the fun-damental component of the output waveformto the input sinusoid. If the input signal con-sists of a sinusoid of frequency o>n plusanother periodic waveform at a much higherfrequency, a relation may be found betweenthe (oa component of the output and the
'Throughout this paper, the term "amplitude" re-fers to the peak-to-peak variation of an oscillatorywaveform,
UJCL3in01
UJ 2
50
00
50
-
X
-
x 1 I I I
X
1
RESPONSE
X
1 1 1
0.01 0.05 0.2 0.5 I 2
FREQUENCY (CYCLES/SECOND)
FIGURE 4
Mean arterial pressure vs. the frequency of a sinusio-dal input waveform. The physiological response isdenoted by the x's; the analog response by the smoothcurve.
con component of the input. The use of sinus-oidal describing functions is discussed furtherin Appendix B.
Describing function analysis was used todetermine the sinusoidal response of the re-flex. The carotid sinus pressure waveformwas a sinusoid in the range of 0.01 to 0.5cycle/sec. The describing function relating thesinusoidal component of the arterial pressureto the input sinusoid was displayed as a Bodeplot (gain and phase shift versus frequency).A similar analysis procedure was also used topredict the effect of the pressure pulse on thesinusoidal response of the system. A relativelyhigh-frequency sinusoid (about 2 cycles/sec),roughly simulating the pressure pulse, wasadded to the lower-frequency pressure wave-form in the carotid sinus. A describing func-tion was then found which related the low-frequency component of the arterial pressurewaveform to the low-frequency test componentof the sinus pressure waveform.
Because of the time required to completea frequency run, no more than two sets ofBode diagrams were plotted for each animal:one describing the response to a single sinus-oid, the other the response to the sum of twosinusoids. The effect of input amplitude ongain and phase shift was not determined.
Both components of the sinus pressure wave-form were held at constant amplitude al-though the amplitude varied among the dif-ferent animals. The low-frequency amplitude
Circulation Research, Vol. XVlll, June 1966
by guest on May 14, 2018
http://circres.ahajournals.org/D
ownloaded from

ANALYSIS OF THE BARORECEPTOR REFLEX 677
ARTERIALPRESSURE
150 -
75 J
CAROTID SINUS '25 -PRESSURE ioc
A: INPUT WAVEFORMIS A 0.04-CPS
SINUSOID.
•A A A A. A ^
B: INPUT WAVEFORMIS A 0.04-CPSSINUSOID PLUS A1.8-CPS SINUSOID.
FIGURE 5
Typical tracings of arterial and carotid sinus pressure obtained in the investigation of thesinusoidal response.
ranged from 5 to 30 mm Hg, whereas thehigh-frequency amplitude ranged from 25 to40 mm Hg. The mean sinus pressure wasadjusted to equal the mean arterial pressureduring each experimental run. (This pro-cedure was also followed when the square-wave and pulse responses were determined).In all tests performed on the model, the low-frequency amplitude was 10 mm Hg, and thehigh-frequency waveform corresponded to a1.5 cycles/sec sinusoid having an amplitudeof 30 mm Hg.
Carotid sinus and arterial pressure tracingsare shown in figure 5. The sinus waveformin the left part of the figure is a single sinus-oid; the sinus waveform in the right part ofthe figure is the sum of two sinusoids. A resid-ual pressure pulse of about 5 mm Hg appearsin the sinus waveform. In both cases the ar-terial pressure waveform contains a sinusoidalcomponent correlated with the 0.04 cycle/seccomponent of the sinus waveform. Note thatthe amplitude of the 0.04 cycle/sec compo-nent of the arterial pressure is reduced by theaddition of the high-frequency sinusoid to thesinus pressure waveform.
Figure 6 shows the responses of three ani-mals and of the model to low-frequencysinusoids. In keeping with standard controlsystem practice the phase shift has been de-fined to be zero degrees when the output isexactly out of phase with the input. All phys-
CircuUtion Reiearch, Vol. XVIII, June 1966
iological and model responses showed thefollowing trends: (1) a peak in the gaincurve at a frequency between 0.03 and 0.05cycle/sec, (2) a phase lag of 180° at a fre-quency between 0.1 and 0.2 cycle/sec, (3) again less than unity at the 180° point, (4)an attenuation between 30 and 40 db/decadeat higher frequencies, and (5) distortion in
- 0.5
2 120 -
in<IQ.
180 -
240 -
0.01 0.05 O.I
FREQUENCY (CYCLES/SECOND)
FIGURE 6
Bode plots for three animals and for the model.—; response of the model. •: response of dog 10.A: response of dog 9. x: response of dog 16.
by guest on May 14, 2018
http://circres.ahajournals.org/D
ownloaded from
678 LEVISON, BARNETT, JACKSON
the output waveform in which the fallingportion was steeper than the rising portion.(The sinus pressure contained no measurabledistortion.) Maximum sinusoidal gains rangedfrom 2.0 to 4.4 among the experimental prepa-rations. The addition of the high-frequencysinusoid generally reduced the physiologicalgain by 20 to 50% but did not alter the contourof the gain curve nor significantly affect thephase shift. The gain of the model was re-duced uniformly by about 30%, whereas thephase shift was unaffected.
SINUSOIDALLY-MODULATED CARRIER
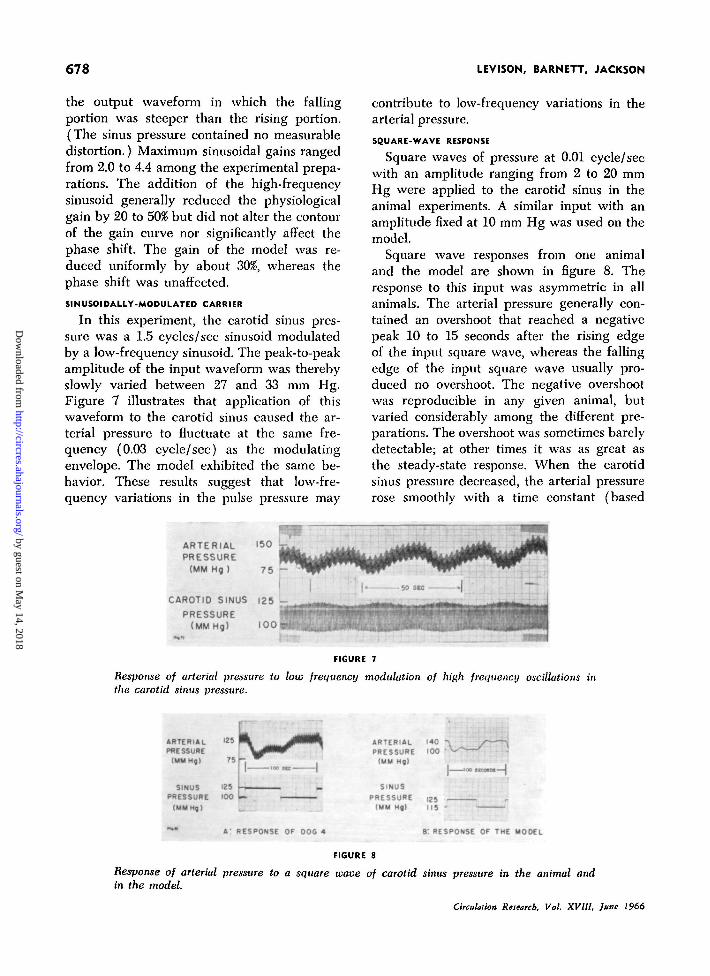
In this experiment, the carotid sinus pres-sure was a 1.5 cycles/sec sinusoid modulatedby a low-frequency sinusoid. The peak-to-peakamplitude of the input waveform was therebyslowly varied between 27 and 33 mm Hg.Figure 7 illustrates that application of thiswaveform to the carotid sinus caused the ar-terial pressure to fluctuate at the same fre-quency (0.03 cycle/sec) as the modulatingenvelope. The model exhibited the same be-havior. These results suggest that low-fre-quency variations in the pulse pressure may
contribute to low-frequency variations in thearterial pressure.
SQUARE-WAVE RESPONSE
Square waves of pressure at 0.01 cycle/ secwith an amplitude ranging from 2 to 20 mmHg were applied to the carotid sinus in theanimal experiments. A similar input with anamplitude fixed at 10 mm Hg was used on themodel.
Square wave responses from one animaland the model are shown in figure 8. Theresponse to this input was asymmetric in allanimals. The arterial pressure generally con-tained an overshoot that reached a negativepeak 10 to 15 seconds after the rising edgeof the input square wave, whereas the fallingedge of the input square wave usually pro-duced no overshoot. The negative overshootwas reproducible in any given animal, butvaried considerably among the different pre-parations. The overshoot was sometimes barelydetectable; at other times it was as great asthe steady-state response. When the carotidsinus pressure decreased, the arterial pressurerose smoothly with a time constant (based
ARTERIAL '50PRESSURE
(MM Hg ) 75 •-
CAROTID SINUS 125 LPRESSURE
(MMHg) 100t ;T:
FIGURE 7
Response of arterial pressure to low frequency modulation of high frequency oscillations inthe carotid sinus pressure.
ARTERIAL '25PRESSURE
(MMHg) 75
SINUS 125
PRESSURE 100
(MMHg)
ARTERIAL 140PRESSURE 100 •
(MM Hg)
SINUS
PRESSURE |J5(MM Hg) IIS -
'oo scon*—1
A' RESPONSE OF 00& 4 8: RESPONSE OF THE M00F.L
FIGURE 8
Response of arterial pressure to a square wave of carotid sinus pressure in the animal andin the model.
Circulation Research, Vol. XVIII, June 1966
by guest on May 14, 2018
http://circres.ahajournals.org/D
ownloaded from
ANALYSIS OF THE BARORECEPTOR REFLEX 679
on two-thirds final response) of 20 to 30seconds. The square wave response of themodel was also asymmetric, although to alesser degree than the physiological response.
PULSE RESPONSE
Clynes17 has suggested that biological sys-tems generally exhibit unidirectional rate-sensitivity. One of the properties of this typeof nonlinearity is that the impulse responseis independent of the sign of the impulse.In order to determine the applicability ofthis hypothesis to the baroreceptor reflex,positive and negative pulses of 25 mm Hg inamplitude were applied to the carotid sinusand to the model. The pulse width of onesecond was an order of magnitude less thanthe response time of the baroreceptor reflex.The physiological responses to pulses of likesign were averaged for visual presentation.
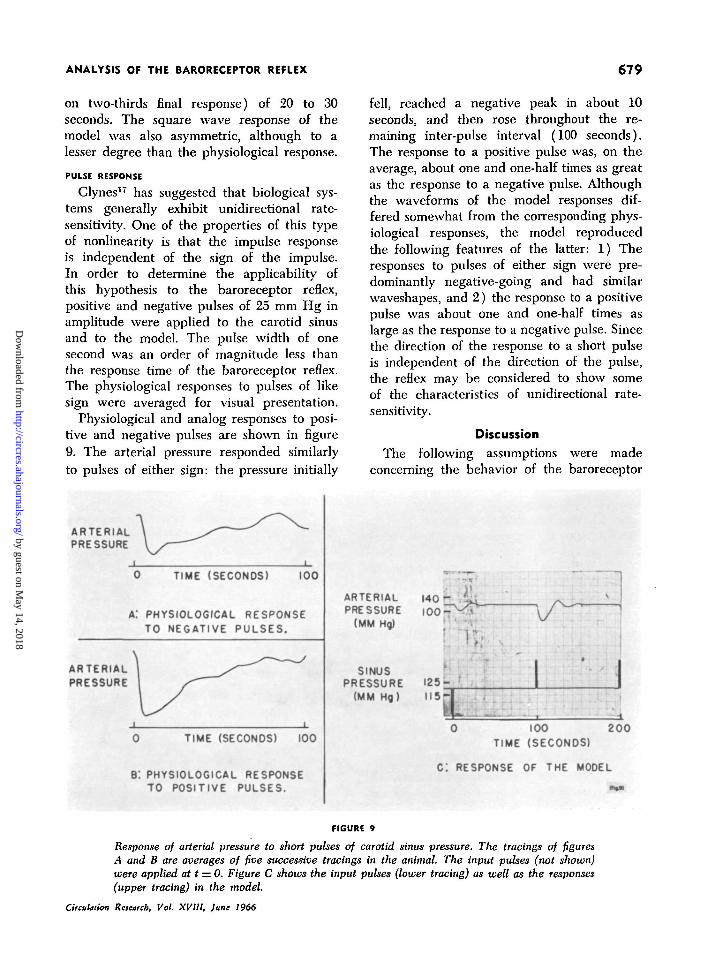
Physiological and analog responses to posi-tive and negative pulses are shown in figure9. The arterial pressure responded similarlyto pulses of either sign: the pressure initially
fell, reached a negative peak in about 10seconds, and then rose throughout the re-maining inter-pulse interval (100 seconds).The response to a positive pulse was, on theaverage, about one and one-half times as greatas the response to a negative pulse. Althoughthe waveforms of the model responses dif-fered somewhat from the corresponding phys-iological responses, the model reproducedthe following features of the latter: 1) Theresponses to pulses of either sign were pre-dominantly negative-going and had similarwaveshapes, and 2) the response to a positivepulse was about one and one-half times aslarge as the response to a negative pulse. Sincethe direction of the response to a short pulseis independent of the direction of the pulse,the reflex may be considered to show someof the characteristics of unidirectional rate-sensitivity.
DiscussionThe following assumptions were made
concerning the behavior of the baroreceptor
ARTERIALPRESSURE
TIME (SECONDS) 100
A: PHYSIOLOGICAL RESPONSETO NEGATIVE PULSES.
ARTERIALPRESSURE
TIME (SECONOS) 100
B: PHYSIOLOGICAL RESPONSETO POSITIVE PULSES.
1 4 0 -ARTERIALPRESSURE
(MM Hg)
SINUSPRESSURE 125-
(MM Hg) 115-L i
0 100 200TIME (SECONOS)
Ci RESPONSE OF THE MODEL
FIGURE 9
Response of arterial pressure to short pulses of carotid sinus pressure. The tracings of figuresA and B are averages of five successive tracings in the animal. The input pulses (not shown)were applied at t = 0. Figure C shows the input pulses (lower tracing) as well as the responses(upper tracing) in the model.
Circulation Research, Vol. XV111, June 1966
by guest on May 14, 2018
http://circres.ahajournals.org/D
ownloaded from
680 LEVISON, BARNETT, JACKSON
reflex: 1) The system contains no hysteresis.2) Low frequency variations in arterial pres-sure that are not directly related to varia-tions in carotid sinus pressure are small andcan be effectively reduced through an aver-aging process. 3) All dogs in like experimentalconditions have the same form of system re-sponse. That is, the responses are similarenough to warrant generalizations about thebehavior of the reflex. Only in this case is itpossible to construct a single model withpredictive capabilities. The first and thirdassumptions were verified experimentally. Tofulfill the second condition, only those experi-mental runs which showed relatively repeat-able responses were accepted. When the meanarterial pressure suffered a progressive de-crease, or when extraneous effects such asMayer waves were evident, experimentationwas discontinued.
The responses of all physical systems, es-pecially biological ones, exhibit saturation.The behavior of a system containing onlysaturation nonlinearities can often be repre-sented with reasonable accuracy by linearequations when the excitation consists of arelatively small perturbation about a fixedoperating point. Therefore, the input varia-tions used in this experiment were of rela-tively small magnitude in order to investigatethe nonlinearities other than saturation. Therewere, however, limitations to this procedurein that the input variations had to be largeenough so that the response could be extractedfrom this noise.
There was no straightforward method fordetermining which input waveforms were tobe investigated. Some of the measurements,such as the static behavior and the step re-sponse, were performed primarily becausethey are standard ways of investigating a sys-tem. Other waveforms, such as the sum oftwo sinusoids, were suggested by the normaloperating conditions of the circulatory sys-tem. No statistical analysis of system perform-ance was undertaken, since the difficulty inobtaining a workable preparation and thetime required to gather data prevented an
investigation of each of the relationships on alarge number of animals.
In the ideal situation, a complete set ofphysiological experiments would be conductedon each of a number of animals. A model offixed form and adjustable parameters wouldbe constructed. A given setting of the adjust-ments would simulate the physiological dataobtained from a particular animal; the param-eters would be readjusted to simulateanother preparation. However, since there wasno single preparation on which all eight in-put-output measurements could be made, theparameters of the model were held fixed. Thismodel was not expected to simulate the re-sponse to any one waveform as well as a modelwith adjustable parameters, but was designedto approximate the average behavior of all theexperimental preparations.
The combination of units A and B of themodel was intended to simulate roughly theresponse of the carotid sinus pressoreceptors.The step response of this combination issimilar to the step response of various me-chanoreceptors8'18 in that 1) the firing ratequickly reaches a maximum and then decaysto a steady value in response to a suddenstretch, and 2) in response to a reduction instretch the output drops to zero, remainsthere momentarily, and rises to a steady levelappropriate to the maintained stimulus level.Units C, D, and E do not correspond directlyto specific physiologic processes; they weredesigned solely to produce an adequateinput-output behavior of the model.
SummaryThe regulation of blood pressure by the
baroreceptor reflex was examined in anes-thetized dogs. The receptor feedback pathwas broken by surgical intervention, the input(carotid sinus pressure) was controlled by anexternal servo system, and simultaneous re-cords of input and output (systemic arterialpressure) were obtained. A variety of pressurewaveforms were applied to the carotid sinusso that the nonlinear behavior could be ex-plored thoroughly. Most of the input wave-forms consisted of relatively small signals
Circulation Research, Vol. XV111, June 1966
by guest on May 14, 2018
http://circres.ahajournals.org/D
ownloaded from
ANALYSIS OF THE BARORECEPTOR REFLEX 681
about an operating point in the normal bloodpressure range.
The nonlinear behavior of the reflex wasillustrated in a number of ways. Square waves,sinusoids, and short pulses produced asymmet-ric arterial pressure waveforms. An overshootin the arterial pressure always followed therising edge of the input square wave, but wasgenerally absent following the negative-goingpart of the square wave. Either positive ornegative pulses caused a transient drop inarterial pressure. The sinusoidal response wasoften distorted, with the falling portion ofthe output waveform steeper than the risingportion. The system behaved as a rectifier,or envelope-detector, as illustrated by 1) thedecrease in mean arterial pressure when eitherthe amplitude or the frequency of a sinusoi-dal input was increased and 2) the appearancein the arterial pressure waveform of a com-ponent correlated with the envelope of amodulated carrier. Another nonlinear phenom-enon was the decrease in low-frequencysinusoidal gain caused by the addition of ahigh-frequency sinusoid to the sinus pressurewaveform. This behavior indicates that ifclosed loop behavior in the intact animal isto be predicted from the open loop sinewaveresponse, the effects of the cardiac pressurepulse must be considered.
A model was constructed from standardelectronic components to simulate the input-output behavior of the baroreceptor reflex.The model was able to simulate the responseto high- and low-frequency sinusoids and toreproduce the essential features of the square-wave and pulse responses. On this basis themodel was considered adequate for simu-lating the performance of the baroreceptorreflex in certain open loop and closed loopsituations.
Appendix AADDITIONAL DETAILS OF THE MODEL
The critical frequencies of the model in cycles persecond were as follows: fx = 0.05, f2 = 0.03, f3 = 0.02,/4 = 0.01, /5 = 0.3. (The critical frequency / is 'Av T,where T is the time constant.) The damping coeffi-cient of unit E was 1.0. Figure 10 contains the sche-matic diagram of the nonlinear second-order system(block D of fig. 2) . When the diodes are removed,
Circulation Research, Vol. XV1I1, June 1966
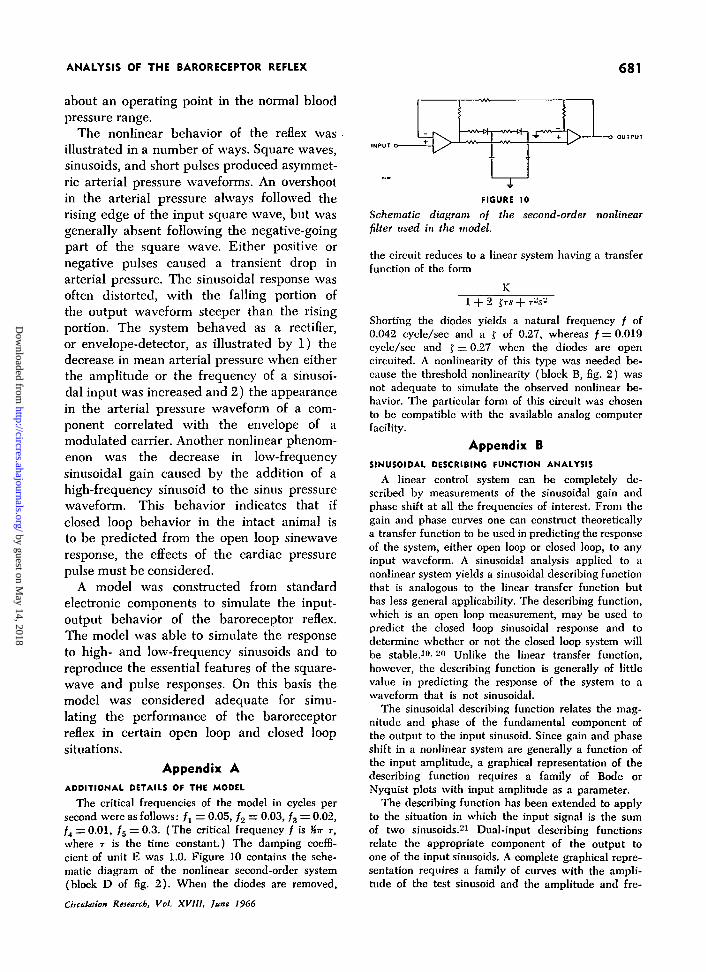
FIGURE 10
Schematic diagram of the second-order nonlinearfilter used in the model.
the circuit reduces to a linear system having a transferfunction of the form
1 + 2 fri + T-S-
Shorting the diodes yields a natural frequency / of0.042 cycle/sec and a f of 0.27, whereas / = 0.019cycle/sec and f = 0.27 when the diodes are opencircuited. A nonlinearity of this type was needed be-cause the threshold nonlinearity (block B, fig. 2) wasnot adequate to simulate the observed nonlinear be-havior. The particular form of this circuit was chosento be compatible with the available analog computerfacility.
Appendix BSINUSOIDAL DESCRIBING FUNCTION ANALYSIS
A linear control system can be completely de-scribed by measurements of the sinusoidal gain andphase shift at all the frequencies of interest. From thegain and phase curves one can construct theoreticallya transfer function to be used in predicting the responseof the system, either open loop or closed loop, to anyinput waveform. A sinusoidal analysis applied to anonlinear system yields a sinusoidal describing functionthat is analogous to the linear transfer function buthas less general applicability. The describing function,which is an open loop measurement, may be used topredict the closed loop sinusoidal response and todetermine whether or not the closed loop system willbe stable.10 '20 Unlike the linear transfer function,however, the describing function is generally of littlevalue in predicting the response of the system to awaveform that is not sinusoidal.
The sinusoidal describing function relates the mag-nitude and phase of the fundamental component ofthe output to the input sinusoid. Since gain and phaseshift in a nonlinear system are generally a function ofthe input amplitude, a graphical representation of thedescribing function requires a family of Bode orNyquist plots with input amplitude as a parameter.
The describing function has been extended to applyto the situation in which the input signal is the sumof two sinusoids.21 Dual-input describing functionsrelate the appropriate component of the output toone of the input sinusoids. A complete graphical repre-sentation requires a family of curves with the ampli-tude of the test sinusoid and the amplitude and fre-
by guest on May 14, 2018
http://circres.ahajournals.org/D
ownloaded from
682 LEVISON, BARNETT, JACKSON
quency of the second sinusoid as parameters. One useof such a dual-input describing function is to predictthe sinusoidal response of a nonlinear control systemin the presence of self-sustained oscillations.--
For a describing-function representation to bemeaningful, a sinusoidal input signal must yield at theoutput a relatively undistorted sinusoid of the samefrequency. In the more general case, an input wave-form that consists of sinusoid plus a waveform x.,(t) should yield an outward waveform that consistsof x,, (t) plus a sinusoid of the same frequency (butnot necessarily the same amplitude or phase) as theinput sinusoid. Although it is not necessary that theinput and output waveforms have zero means, theymust have identical mean levels. (The input and out-put must be investigated about the same operatingpoint; otherwise, the closed loop behavior cannot bepredicted.)
In the experiment described in this paper, themean sinus pressure was adjusted so that the meansinus and mean arterial pressures would be equal.Strictly speaking, the high frequency waveform ap-plied to the sinus should have been made identical tothe arterial pressure pulse to insure identical operatingconditions at both input and output. It was felt, how-ever, that a high-frequency sinusoid was sufficientlysimilar to the pressure pulse to indicate the effect ofthe latter on the low-frequency behavior of the baro-receptor reflex.
References1. GUYTON, A. C , BATSON, H. M., SMITH, C. M.,
ARMSTRONG, G. G.: Method for studyingcompetence of the body's blood pressure reg-ulatory mechanisms and effect of pressorecep-tor denervation. Am. J. Physiol. 164: 360,1951.
2. KILLIP, T. I l l : Oscillation of blood flow andvascular resistance during Mayer waves. Cir-culation Res. 11: 987, 1962.
3. SCHER, A. M., YOUNG, A. C.: Servoanalysis of
carotid sinus reflex effects on peripheral re-sistance. Circulation Res. 12: 152, 1963.
4. STECEMANN, J.: Der Einfluss sinusformigerDruckanderungen im isolierten Karotissinusauf Blutdruck und Pulsfrequenz beim Hund.Verhandlungen der Deutschen Gesellschaftfur Kreislaufforschung 23: 392, 1957.
5. GRODINS, F.: Control theory and biological sys-tems. New York, Columbia Univ. Press, 1963.
6. DEFARES, J. G., HARA, H. H., OSBOHN, J. J., AND
MCLEOD, J.: Theoretical analysis and com-puter simulation of the circulation with specialreference to the Starling properties of theventricles. Circulatory Analogue Computers, ed.by Abraham Noordergraaf. Amsterdam, North-Holland Publishing Company, 1963, pp. 91-122.
7. DOUGLAS, W. W., SCHAUMANN, W.: A study of
the depressor and pressor components of the
cat's carotid sinus and aortic nerves usingelectrical stimuli of different intensities andfrequencies. J. Physiol. 132: 173, 1956.
8. LANDCREN, S.: On the excitation mechanism ofthe carotid baroreceptors. Acta Physiol. Scand.26: 1, 1952.
9. POLOSA, C , Rossi, G.: Cardiac output andperipheral blood flow during occlusion of ca-rotid arteries. Am. J. Physiol. 200: 1185, 1961.
10. BRAUNWALD, E., ROSS, J., JR., KAHLER, R. L.,
GAFFNEY, T. E., GOLDDLATT, A., AND MASON,
D. T.: Reflex control of the systemic venousbed. Effects on venous tone of vasoactivedrugs, and of baroreceptor and chemorecep-tor stimulation. Circulation Res. 12: 539, 1963.
11. MCCUBBIN, J. W., PAGE, I. H.: Renal pressorsystem and neurogenic control of arterialpressure. Circulation Res. 12: 553, 1963.
12. STARK, L.: Stability, oscillations, and noise in thehuman pupil servomechanism. Proc. Inst. RadioEngrs. 47: 1925, 1959.
13. WARNER, H. R., COX, A.: A mathematical modelof heart rate control by sympathetic andvagus efferent information. J. Appl. Physiol.17: 349, 1962.
14. JONES, R. W.: Physiological control systems. Proc.16th Ann. Conf. Eng. Med. Biol. Baltimore,Harry S. Scott, 1963, p. 237.
15. DEROM, F. E.: Methode d'hypertension chroniqueneurogene chez le chien. Arch. Intern. Pharma-codyn. 116: 237, 1958.
16. EAD, H. W., GREEN, J. H., NEIL, E.: A com-
parison of the effects of pulsatile and non-pulsatile blood flow through the carotid sinuson the reflexogenic activity of the sinus baro-receptors in the cat. J. Physiol. 118: 509,1952.
17. CLYNES, M.: Unidirectional rate sensitivity: abiocybernetic law of reflex and humoral sys-tems as physiologic channels of control andcommunication. Ann. N. Y. Acad. Sci. 92: 946,1961.
18. LOEWENSTEIN, W. R.: Excitation and changesin adaptation by stretch of mechanoreceptors.J. Physiol. 133: 588, 1956.
19. SEIFERT, W. W., STEEC, C. W., JR.: Control
Systems Engineering. New York, McCraw-Hill Book Company, Inc., 1960.
20. THALER, G. J., PASTEL, M. F.: Analysis and
Design of Nonlinear Feedback Control Sys-tems. New York, McGraw-Hill Book Com-pany, Inc., 1962.
21. WEST, J. C , ET AL.I The dual-input describingfunction and its use in the analysis of non-linear feedback systems. Proc. Inst. Elec.Engrs. 103 pt. B: 463, 1956.
22. GELB, A., VANDER VELDE, W. E.: On limit cycl-
ing control systems. Inst. EJec. Electron. Engrs.Trans. Auto. Control AC-8: 142, 1963.
Circulation Research, Vol. XVIII, June 1966
by guest on May 14, 2018
http://circres.ahajournals.org/D
ownloaded from
William H. Levison, G. Octo Barnett and William D. JacksonNonlinear Analysis of the Baroreceptor Reflex System
Print ISSN: 0009-7330. Online ISSN: 1524-4571 Copyright © 1966 American Heart Association, Inc. All rights reserved.
75231is published by the American Heart Association, 7272 Greenville Avenue, Dallas, TXCirculation Research
doi: 10.1161/01.RES.18.6.6731966;18:673-682Circ Res.
http://circres.ahajournals.org/content/18/6/673on the World Wide Web at:
The online version of this article, along with updated information and services, is located
http://circres.ahajournals.org//subscriptions/
is online at: Circulation Research Information about subscribing to Subscriptions:
http://www.lww.com/reprints Information about reprints can be found online at: Reprints:
document. Answer
Permissions and Rights Question andServices. Further information about this process is available in thebeing requested is located, click Request Permissions in the middle column of the Web page under
isCenter, not the Editorial Office. Once the online version of the published article for which permission can be obtained via RightsLink, a service of the Copyright ClearanceCirculation Researchpublished in
Requests for permissions to reproduce figures, tables, or portions of articles originallyPermissions: by guest on M
ay 14, 2018http://circres.ahajournals.org/
Dow
nloaded from