nonresponse bias in 2016 from the 2012 · pdf filenonresponse bias in estimates from the 2012...
TRANSCRIPT
Nonresponse Bias in Estimates From the 2012 National Ambulatory Medical Care Survey
Se
rie
s 2
, Nu
mb
er
17
1
Feb
rua
ry 2
01
6
Copyright information
All material appearing in this report is in the public domain and may be reproduced or copied without permission; citation as to source, however, is appreciated.
Suggested citation
Hing E, Shimizu IM, Talwalkar A. Nonresponse bias in estimates from the 2012 National Ambulatory Medical Care Survey. National Center for Health Statistics. Vital Health Stat 2(171). 2016.
Library of Congress Cataloging-in-Publication Data
Names: National Center for Health Statistics (U.S.), issuing body. Title: Nonresponse bias in estimates from the 2012 National Ambulatory Medical Care Survey. Other titles: Vital and health statistics. Series 2, Data evaluation and methods research ; no. 171. | DHHS publication ; no. 2016–1371. 0276–4733 Description: Hyattsville, Maryland : U.S. Department of Health and Human Services, Centers for Disease Control and Prevention, National Center for Health Statistics, 2016. | Series: Vital and health statistics, series 2, data evaluation and methods research ; number 171 | Series: DHHS publication ; no. (PHS) 2016–1371 | Includes bibliographical references and index. Identifiers: LCCN 2015045700 | ISBN 0840606745 (alk. paper) | ISBN 9780840606747 (alk. paper) Subjects: | MESH: National Ambulatory Medical Care Survey (U.S.) | Health Care Surveys—United States. | Ambulatory Care—statistics & numerical data—United States. | Health Records, Personal—United States. | Interviews as Topic—United States. | Sampling Studies—United States. Classification: LCC RA974 | NLM W2 A N148vb no.171 2015 | DDC 362.12072/7—dc23 LC record available at http://lccn.loc.gov/2015045700
For sale by the U.S. Government Printing Office Superintendent of Documents Mail Stop: SSOP Washington, DC 20402–9328 Printed on acid-free paper.
Series 2, Number 171
Nonresponse Bias in Estimates From the 2012 National Ambulatory Medical Care Survey
Data Evaluation and Methods Research
U.S. DEPARTMENT OF HEALTH AND HUMAN SERVICES Centers for Disease Control and Prevention National Center for Health Statistics
Hyattsville, Maryland February 2016 DHHS Publication No. 2016–1371

National Center for Health Statistics
Charles J. Rothwell, M.S., M.B.A., Director
Nathaniel Schenker, Ph.D., Deputy Director
Jennifer H. Madans, Ph.D., Associate Director for Science
Division of Health Care Statistics
Clarice Brown, M.S., Director
Alexander Strashny, Ph.D., Associate Director for Science
Contents
Abstract . . . . . . . . . . . . . . . . . . . . . . . . . . . . . . . . . . . . . . . . . . . . . . . . . . . . . . . . . . . . . . . . . . . . . . . . . . . . . . . . . . . . . . . . . . . . . . . . . 1
Introduction . . . . . . . . . . . . . . . . . . . . . . . . . . . . . . . . . . . . . . . . . . . . . . . . . . . . . . . . . . . . . . . . . . . . . . . . . . . . . . . . . . . . . . . . . . . . . . 1
Background . . . . . . . . . . . . . . . . . . . . . . . . . . . . . . . . . . . . . . . . . . . . . . . . . . . . . . . . . . . . . . . . . . . . . . . . . . . . . . . . . . . . . . . . . . . . . . 2 2012 Sampling Design . . . . . . . . . . . . . . . . . . . . . . . . . . . . . . . . . . . . . . . . . . . . . . . . . . . . . . . . . . . . . . . . . . . . . . . . . . . . . . . . . . . 2 Data Collection . . . . . . . . . . . . . . . . . . . . . . . . . . . . . . . . . . . . . . . . . . . . . . . . . . . . . . . . . . . . . . . . . . . . . . . . . . . . . . . . . . . . . . . . . 2
Methods . . . . . . . . . . . . . . . . . . . . . . . . . . . . . . . . . . . . . . . . . . . . . . . . . . . . . . . . . . . . . . . . . . . . . . . . . . . . . . . . . . . . . . . . . . . . . . . . . 3 Response Analysis . . . . . . . . . . . . . . . . . . . . . . . . . . . . . . . . . . . . . . . . . . . . . . . . . . . . . . . . . . . . . . . . . . . . . . . . . . . . . . . . . . . . . . . 3 Bias Analysis . . . . . . . . . . . . . . . . . . . . . . . . . . . . . . . . . . . . . . . . . . . . . . . . . . . . . . . . . . . . . . . . . . . . . . . . . . . . . . . . . . . . . . . . . . . 4
Results . . . . . . . . . . . . . . . . . . . . . . . . . . . . . . . . . . . . . . . . . . . . . . . . . . . . . . . . . . . . . . . . . . . . . . . . . . . . . . . . . . . . . . . . . . . . . . . . . . 5 Response to Induction Interview . . . . . . . . . . . . . . . . . . . . . . . . . . . . . . . . . . . . . . . . . . . . . . . . . . . . . . . . . . . . . . . . . . . . . . . . . . . 5 Response to Patient Record Forms. . . . . . . . . . . . . . . . . . . . . . . . . . . . . . . . . . . . . . . . . . . . . . . . . . . . . . . . . . . . . . . . . . . . . . . . . . 5 Nonresponse Bias Analyses . . . . . . . . . . . . . . . . . . . . . . . . . . . . . . . . . . . . . . . . . . . . . . . . . . . . . . . . . . . . . . . . . . . . . . . . . . . . . . . 7
Discussion . . . . . . . . . . . . . . . . . . . . . . . . . . . . . . . . . . . . . . . . . . . . . . . . . . . . . . . . . . . . . . . . . . . . . . . . . . . . . . . . . . . . . . . . . . . . . . . 9
Limitations . . . . . . . . . . . . . . . . . . . . . . . . . . . . . . . . . . . . . . . . . . . . . . . . . . . . . . . . . . . . . . . . . . . . . . . . . . . . . . . . . . . . . . . . . . . . . . . 10
Conclusions . . . . . . . . . . . . . . . . . . . . . . . . . . . . . . . . . . . . . . . . . . . . . . . . . . . . . . . . . . . . . . . . . . . . . . . . . . . . . . . . . . . . . . . . . . . . . . 10
References . . . . . . . . . . . . . . . . . . . . . . . . . . . . . . . . . . . . . . . . . . . . . . . . . . . . . . . . . . . . . . . . . . . . . . . . . . . . . . . . . . . . . . . . . . . . . . . 10
Appendix I. Glossary. . . . . . . . . . . . . . . . . . . . . . . . . . . . . . . . . . . . . . . . . . . . . . . . . . . . . . . . . . . . . . . . . . . . . . . . . . . . . . . . . . . . . . . 37
Appendix II. NAMCS Estimation Procedures . . . . . . . . . . . . . . . . . . . . . . . . . . . . . . . . . . . . . . . . . . . . . . . . . . . . . . . . . . . . . . . . . . . 38
Appendix III. Physicians With Full or Adequate Response to Patient Record Forms . . . . . . . . . . . . . . . . . . . . . . . . . . . . . . . . . . . . 39
Text Figure
Survey participation, full Patient Record Form response, and Patient Record Form completion rates: National Ambulatory Medical Care Survey, 2002–2012 . . . . . . . . . . . . . . . . . . . . . . . . . . . . . . . . . . . . . . . . . . . . . . . . . . . . . . . . . . . . 7
Text Table
Percentage of in-scope sample physicians, by type of physician response to Patient Record Form: National Ambulatory Medical Care Survey, 2010–2012 . . . . . . . . . . . . . . . . . . . . . . . . . . . . . . . . . . . . . . . . . . . . . . . . . . . . . . . . . . . . 8
Detailed Tables
1. In-scope sample physicians and their weighted percent distributions and rates of response to the physician induction interview, by physician characteristics: National Ambulatory Medical Care Survey, 2012 . . . . . . . . . . . . . . . . . . . . . . . . . 12
2. In-scope sample physicians and their weighted percent distributions and rates of response to the physician induction interview, by division and state where interview occurred: National Ambulatory Medical Care Survey, 2012 . . . . . . . . . 14
3. In-scope sample physicians, their weighted percent distributions by Patient Record Form status, and Patient Record Form completion rate, by physician characteristics: National Ambulatory Medical Care Survey, 2012 . . . . . . . . . . . . . . 16
iii
4. In-scope sample physicians, their weighted percent distributions by Patient Record Form status, and Patient Record Form completion rate, by state location of office where the most visits were seen: National Ambulatory Medical Care Survey, 2012 . . . . . . . . . . . . . . . . . . . . . . . . . . . . . . . . . . . . . . . . . . . . . . . . . . . . . . . . . . . . . . . . . . . . . . . . . . . . . . . . . . . . . . 18
5. Patient Record Forms expected and completed, their weighted percent distributions, and percentage of expected Patient Record Forms completed, by physician characteristics: National Ambulatory Medical Care Survey, 2012 . . . . . 20
6. Patient Record Forms expected and completed, their weighted percent distributions, and percentage of expected Patient Record Forms completed, by state location of office where the most visits were seen: National Ambulatory Medical Care Survey, 2012 . . . . . . . . . . . . . . . . . . . . . . . . . . . . . . . . . . . . . . . . . . . . . . . . . . . . . . . . . . . . . . . . . . . . . . . . . . . 22
7. Percent distributions of in-scope sample, numbers of respondents to physician induction interview, and potential bias in nonresponse-adjusted estimates of percent distributions based on those respondents, by physician characteristic: National Ambulatory Medical Care Survey, 2012 . . . . . . . . . . . . . . . . . . . . . . . . . . . . . . . . . . . . . . . . . . . . . . . . . . . . . . . . . 24
8. Percent distribution of in-scope sample, numbers of respondents to physician induction interview, and potential bias in nonresponse-adjusted estimates of percent distributions based on those respondents, by state location where induction interview occurred: National Ambulatory Medical Care Survey, 2012 . . . . . . . . . . . . . . . . . . . . . . . . . . . . . . . . 26
9. Percent distributions of in-scope sample, numbers of physicians completing Patient Record Forms, and potential bias in nonresponse-adjusted estimates of percent distributions based on Patient Record Form completers, by physician characteristics: National Ambulatory Medical Care Survey, 2012 . . . . . . . . . . . . . . . . . . . . . . . . . . . . . . . . . . . . . . . . . . . . 28
10. Percent distribution of in-scope sample, numbers of physicians completing Patient Record Forms, and potential bias in nonresponse-adjusted estimates of percent distributions based on Patient Record Form completers, by state location of office where the most visits were seen: National Ambulatory Medical Care Survey, 2012 . . . . . . . . . . . . . . . . . . . . . . 30
11. Estimated percentages of physicians, by selected physician characteristics from the National Electronic Health Record Survey and the National Ambulatory Medical Care Survey: 2012 . . . . . . . . . . . . . . . . . . . . . . . . . . . . . . . . . . . . . . . . . . . . 32
12. Percent distributions of visits based on in-scope physician sample, numbers of sampled visits, and potential bias in nonresponse-adjusted estimates of percent distributions of visits, by physician characteristics: National Ambulatory Medical Care Survey, 2012 . . . . . . . . . . . . . . . . . . . . . . . . . . . . . . . . . . . . . . . . . . . . . . . . . . . . . . . . . . . . . . . . . . . . . . . . . . . 33
13. Percent distributions of visits based on in-scope physician sample, numbers of sampled visits, and potential bias in nonresponse-adjusted estimates of percent distributions of visits, by state location of office where the most visits were seen: National Ambulatory Medical Care Survey, 2012. . . . . . . . . . . . . . . . . . . . . . . . . . . . . . . . . . . . . . . . . . . . . . . . . . . . . 35
Appendix Tables
I. In-scope sample physicians, their weighted percent distributions by Patient Record Form response status, and Patient Record Form response rate, by physician characteristics: National Ambulatory Medical Care Survey, 2012. . . . . . . . . . . 39
II. In-scope sample physicians, their weighted percent distributions by Patient Record Form response status, and Patient Record Form response rate, by state location of office where the most visits were seen: National Ambulatory Medical Care Survey, 2012 . . . . . . . . . . . . . . . . . . . . . . . . . . . . . . . . . . . . . . . . . . . . . . . . . . . . . . . . . . . . . . . . . . . . . . . . . . . 41
iv
Background The National Ambulatory Medical
Care Survey (NAMCS) is an annual, nationally representative sample survey of physicians and of visits to physicians. Two major changes were made to the 2012 NAMCS to support reliable state estimates. The sampling design changed from an area sample to a fivefold-larger list sample of physicians stratified by the nine U.S. Census Bureau divisions and 34 states. At the same time, the data collection mode changed from paper forms to laptop-assisted data collection and from physician or office staff abstraction of medical records to predominantly Census interviewer abstraction using automated Patient Record Forms (PRFs).
Objectives This report presents an analysis of
potential nonresponse bias in 2012 NAMCS estimates of physicians and visits to physicians. This analysis used two sets of physician-based estimates: one measuring the completion of the physician induction interview and another based on completing any PRF. Evaluation of visit response was measured by the percentage of expected PRFs completed. For each type of physician estimate, response was evaluated by (a) comparing percent distributions of respondents and nonrespondents by physician characteristics available for all in-scope sample physicians, (b) comparing response rates by physician characteristics with the national response rate, and (c) analyzing nonresponse bias after adjustments for nonresponse were applied in survey weights. For visit estimates, response was evaluated by (a) comparing the percent distributions of expected visits and completed visits, (b) comparing visit response rates by physician characteristics with the national visit response rate, and (c) analyzing visit-level nonresponse bias after adjustments for nonresponse were applied in visit survey weights. Finally, potential bias in the two physician-level estimates was computed by comparing them with those from an external survey.
Keywords: Response rate • evaluation • NAMCS
Nonresponse Bias in Estimates From the 2012 National Ambulatory Medical Care Survey by Esther Hing, M.P.H.; Iris M. Shimizu, Ph.D.; and Anjali Talwalkar, M.D., M.P.H.
Introduction
The National Ambulatory Medical Care Survey (NAMCS) began in 1973 as a nationally representative sample survey of nonfederal office-based physicians (excluding anesthesiologists, pathologists, and radiologists) and their patient visits. It has been conducted annually (except during 1982–1984 and 1986–1988) by the Centers for Disease Control and Prevention’s (CDC) National Center for Health Statistics (NCHS). Sample physicians are selected from lists obtained from the American Medical Association (AMA) and the American Osteopathic Association (AOA). Starting in 2006, the survey was expanded to include samples of providers in community health centers and their patient visits. However, analysis in this report is limited to potential bias in the 2012 base NAMCS alone; that is, the 2012 NAMCS survey of community health centers and their providers is excluded from this study (1). Thus, for convenience, in the remainder of this report the term NAMCS refers to the base NAMCS unless otherwise stated. Prior to 2012, the expanded NAMCS (with community health centers) used a multistage probability sampling design involving samples of geographic primary sampling units (PSUs), physicians and community health centers within PSUs, and visits to sampled providers. The sample size permitted national and regional estimates but did not support reliable estimates by state.
The 2012 expanded NAMCS underwent two major changes, either of
which might have a negative impact on response rates. First, additional funding for the 2012 NAMCS permitted the sample size to be increased sufficiently to produce estimates for each of the U.S. Census Bureau divisions and the 34 most populous states. For this purpose, a list sample of physicians was used instead of an area sample. The other major change for 2012 was the mode of data collection. Prior to 2012, data were collected using paper questionnaires. Interviewers collected physician data through in-person interviews. Visit data were extracted by physicians or their staff as the preferred mode of collection, but interviewer abstraction from medical records had been increasing over time. In 2012, laptop-assisted data collection using automated survey instruments was initiated, with medical abstraction by interviewers as the predominant method of data collection.
In this report, the potential for nonresponse bias is evaluated for two types of NAMCS estimates: physician estimates and visit estimates. Physician estimates were evaluated in two ways: response to the physician induction interview (i.e., the collection of physician-level characteristics) and the receipt of at least one Patient Record Form (PRF) from that physician. Visit estimates were evaluated by comparing the number of visit records received with the number expected. Nonresponse bias for physician completion of the induction interview, for physician completion of at least one visit record, and for visits from the 2012 base NAMCS was evaluated by comparing response rates and distributions of
Page 1
Page 2 [ Series 2, No. 171
responding and nonresponding units by physician characteristics available for all in-scope sample physicians reported in master files of the AMA and AOA and updated during the survey. In addition to the AMA and AOA information, quartiles of annual visit volume were examined at the two levels of response for visit estimates because research found that physician response to PRFs was associated with annual visit volume (2). Items needed to estimate annual visit volume were collected in the induction interview for all in-scope physicians. Changes from prior years in physician visit-level response to the PRF were also explored by comparing NAMCS PRF response levels in 2010 through 2012.
Evaluation of potential nonresponse bias was conducted for physician estimates based on physicians completing the induction interview and on physicians completing any PRF. For these two sets of physician estimates, bias is defined as the difference between the estimated percentages based on the full in-scope sample of physicians and the estimated percentages based on survey respondents using sample weights adjusted for nonresponse. Potential biases in physician-level estimates were also examined by comparing NAMCS estimates with an external data source—the 2012 National Electronic Health Records Survey (NEHRS)—a survey similar in scope and timing to NAMCS (3). Potential visit-level bias was examined by comparing the estimated percentages of visits based on completed PRFs using sample weights adjusted for nonresponse and the estimated percentages of visits based on the full in-scope physician sample.
Background
2012 Sampling Design From its inception, NAMCS has
constructed its physician sampling frame from lists of physicians classified as office-based and nonfederally employed in the master files of the AMA and AOA. For 2012, four mutually exclusive stratified samples of physicians were
selected: a core sample and three supplemental samples. For the core sample, strata were defined by practice type (primary care or nonprimary care) and by the nine Census divisions and the 34 most populous states. In 2012, the 34 most populous states (in descending order) were California, Texas, New York, Florida, Illinois, Pennsylvania, Ohio, Michigan, New Jersey, Georgia, North Carolina, Virginia, Washington, Massachusetts, Indiana, Arizona, Tennessee, Missouri, Maryland, Wisconsin, Minnesota, Colorado, Alabama, South Carolina, Louisiana, Kentucky, Oregon, Oklahoma, Connecticut, Iowa, Mississippi, Arkansas, Kansas, and Utah. The core sample consisted 14,590 physicians. Three supplemental national samples consisting of 1,150 physicians (total) within the specialties of oncology, allergy, and pulmonology were selected to permit separate estimation for these groups. Each supplemental sample was stratified by Census division. Overall, 15,740 physicians were selected for the 2012 NAMCS sample. At the final sampling stage, patient visits were sampled within physicians’ practices. For this stage, physicians were randomly assigned to one of 52 reporting weeks throughout the year. A systematic random sample of visits was selected from those made to the physician’s practice during the assigned reporting week.
Data Collection The U.S. Census Bureau served as
the data collection agent for the 2012 NAMCS. Data regarding the physician’s practice were collected by Census interviewers (also referred to in this report as field representatives or FRs) through an in-person interview; data on sample visits were abstracted from the physician’s medical records. In 2012, NAMCS switched from its traditional paper-and-pencil mode of data collection to an automated survey tool at both the physician and visit levels. Consequently, most of the data collection and data processing systems developed over the years had to be redesigned. This included revised wording, answer choices, skip patterns, and range checks. Numerous help screens were created to
provide FRs additional information to aid the visit data abstraction. Hard and soft edits were also incorporated into the automated tool. Soft edits prompted field staff to double-check a questionable entry but allowed them to proceed if the entry was thought to be correct, whereas hard edits resulted in strict range restrictions.
Physician induction interview
Survey questions about physician eligibility and physician and practice characteristics, previously collected using a physician induction interview paper form, were incorporated in the automated survey tool and collected by FRs. The induction interview was used to screen sample physicians to ensure they were eligible for NAMCS. Eligible physicians included nonfederally employed physicians providing direct patient care in office-based settings; anesthesiologists, pathologists, and radiologists were excluded. Information sufficient to determine eligibility status was obtained for every sampled physician, regardless of whether the physician agreed to complete the induction interview. A total of 6,166 sample physicians were ineligible for the study. The most frequent reasons for being ineligible or ‘‘out-of-scope’’ were that the physician either was retired or was employed in a hospital emergency department, outpatient department, or institutional setting.
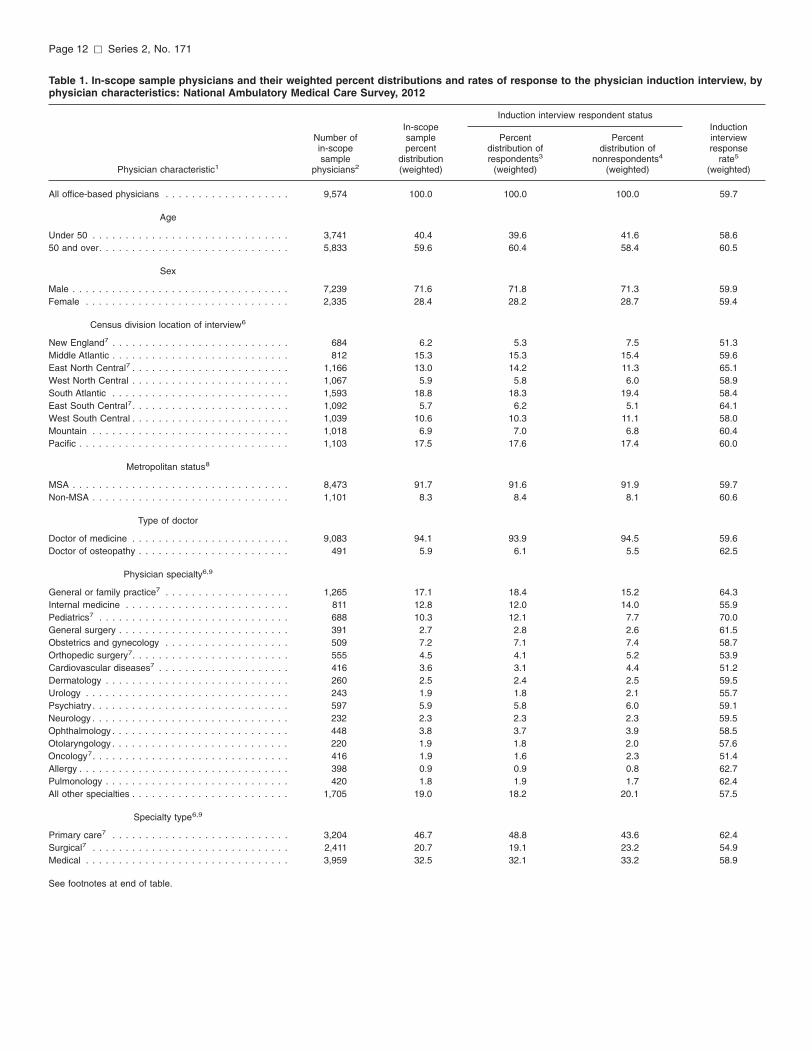
For eligible physicians, information about the physician and his or her practice, as well as contacts for collecting visit data, were also obtained in the induction interview. Of the 9,574 in-scope (eligible) sample physicians, 5,622 met the criteria for being considered respondents to the physician induction interview, for an unweighted response rate of 58.7% (59.7% weighted) (Table 1). To be considered a respondent to the induction interview, eligible physicians were required to:
+ Report characteristics of at least one practice office, including numbers of physicians and specialties, ownership, staffing, capabilities for selected medical tests, and evening and weekend hours.
Series 2, No. 171 [ Page 3
+ Report whether the practice uses any electronic health record (EHR) or electronic medical record (EMR) systems and, if the response was yes, answer at least 9 of the following 17 questions about the capabilities and use of those systems: C Recording patient history and
demographic information? C Recording and charting vital
signs? C Recording patient smoking status? C Recording clinical notes? C Ordering prescriptions? C Providing reminders for
guideline-based interventions or screening tests?
C Providing standard order sets related to a particular condition or procedure?
C Ordering laboratory tests? C Viewing laboratory results? C Viewing imaging results? C Viewing data on quality-of-care
measures? C Reporting clinical quality
measures to federal or state agencies (such as the Centers for Medicare & Medicaid Services [CMS] or Medicaid)?
C Generating lists of patients with particular health conditions?
C Reporting electronically to immunization registries?
C Providing patients with clinical summaries for each visit?
C Exchanging secure messages with patients?
C Providing patients with an electronic copy of their health information?
Patient Record Form
In past years, data collection of visit information was expected to be carried out by the physician or the physician’s staff using a paper questionnaire, the Patient Record Form or PRF. Over time, abstraction from medical charts by Census FRs became the predominant mode (55% of PRF data were abstracted by FRs in 2010). For 2012, Census FR abstraction using laptop computers and the automated instrument became the preferred mode for data collection. For physicians who preferred to do their own data abstraction, a Web portal
containing a modified version of the automated tool was available, or a Census laptop was left behind for physician use. In 2012, 98% of records were obtained through Census FR abstraction and 2% were obtained by physician or medical staff abstraction.
For visit sampling, physicians were instructed to keep a daily listing of all patient visits during the assigned reporting week by using an arrival log, optional worksheet, or similar method. The list was to include both scheduled and unscheduled patients; cancellations and no-shows were excluded. Visits were selected from the list by either Census FRs or medical staff using a random start and a sampling interval that was determined based on the physician’s estimated visits for the week and the number of days the physician was expected to see patients that week. In this way, a systematic random sample of visits was obtained. The sampling procedures were designed so that about 30 visits would on average be selected from the assigned reporting week. This controlled the data collection workload and maintained about equal reporting levels among sample physicians, regardless of visit volume. Sampled visits were to be selected at all offices where the physician saw patients in the sample week. During data processing, sampled visits were assigned to the office location where the visit occurred.
Data for sampled visits were recorded on laptops using the automated survey tool, which emulated the traditional PRF survey instrument. The 2012 Patient Record Sample Card presenting data items included in the survey is available from the Ambulatory Health Care Data website at http://www.cdc.gov/nchs/ahcd/ ahcd_survey_instruments.htm#namcs.
In this report, ‘‘PRF completers’’ are physicians with any completed PRFs (or more precisely, physicians for whom PRFs were completed by Census FRs or by the physician and office staff; the same distinction applies throughout the rest of the report, but response is characterized in terms of physicians for convenience). For analysis of potential bias in this report, the PRF completion rate (percentage of in-scope sample
physicians who were PRF completers) is examined because the PRF-completing physicians are the only ones with records in the visit-level file.
Methods
In this study, two sets of physician-level response rates are examined: response to induction interview questions and response to any PRF. The second set is examined because visit-level files only include records for physicians who completed any PRF. In addition to examining response for the physician-level estimates, response rates for visit-level estimates (as measured by the percentage of expected PRFs that were completed) were also examined. Data analyses were performed using the statistical packages SAS, version 9.3 (SAS Institute, Cary, N.C.) and SUDAAN, version 11.0 (RTI International, Research Triangle Park, N.C.). Statements of differences in estimates were tested for significance at the p < 0.05 level. Differences by selected physician characteristics were examined using t tests for differences in rates, and chi-square tests were used for differences in percent distributions. Terms relating to differences, such as ‘‘greater than’’ or ‘‘less than,’’ indicate that the difference is statistically significant. A lack of comment regarding the difference between any two estimates does not mean that the difference was tested and found to be not significant.
Response Analysis Similar methods are used to
evaluate response for both sets of the physician-level estimates (induction interview and physicians with completed PRFs) and for visit-level estimates (4,5). First, response rates and differences between responders and nonresponders in percent distributions are compared by subgroups defined by physician characteristics obtained from AMA and AOA and updated during data collection. Subgroups used in these comparisons include physician age
Page 4 [ Series 2, No. 171
category (under age 50, aged 50 and over), sex, type of doctor (Doctor of Medicine [M.D.] or Doctor of Osteopathy [D.O.]), physician specialty (General or family practice, Internal medicine, Pediatrics, General surgery, Obstetrics and gynecology, Orthopedic surgery, Cardiovascular diseases, Dermatology, Urology, Psychiatry, Neurology, Ophthalmology, Otolaryngology, Oncology, Allergy, Pulmonology, and a residual category of Other specialties), specialty type (Primary care, Surgical, and Medical), practice type (Solo, Partner, Group or health maintenance organization [HMO], Medical school or government, Other, and Unclassified), and location: metropolitan statistical area (MSA) status (MSA or non-MSA), Census division (New England, Middle Atlantic, East North Central, West North Central, South Atlantic, East South Central, West South Central, Mountain, Pacific), and the 34 targeted states.
In addition to the previously listed physician characteristics, quartiles of annual visit volume were used to compare percent distributions of total sampled in-scope physicians and those completing any PRF (see Appendix I for details). Starting in 2003, a nonresponse adjustment factor taking into account annual visit volume has been included in NAMCS weighting procedures for visits because research has shown that physician response to PRFs is associated with annual visit volume (2). Annual visit volumes are estimated as the products of the numbers of weeks physicians see patients and the numbers of visits seen during normal practice weeks, both of which are collected during the induction interview for all in-scope physicians.
For comparisons between responders and nonresponders, estimates were weighted by calibrated sampling weights, which are the inverses of sampling probabilities multiplied by ratios that adjust the numbers of physicians in the sampling frame at the time of sample selection to the numbers of physicians eligible for inclusion in the sampling frame at the time of data collection. Associations between distributions of physician characteristics by response status were assessed using
the chi-square test of association. Response rate differences from the overall response rate were also assessed.
For analysis of response in visit-level statistics, no external data source is available for comparison with NAMCS visit estimates. Other than characteristics of the physicians who saw the patients for sampled visits, no information is available about the sample visits for which PRFs are missing (i.e., nonrespondent sample visits). Hence, to examine the potential for nonresponse bias in visit-level statistics, differences in numbers and percent distributions between expected and completed PRFs are examined by physician characteristics. No PRFs were expected from 750 sampled physicians who saw no patients during their assigned reporting week. For the remaining physicians, the number of sample visits, and hence PRFs, for those visits expected from each sampled physician was estimated by dividing the total visits the physician saw during his or her assigned reporting week by the sampling interval, determined during the induction interview on the basis of visits expected and days the physician expected to see patients during the reporting week.
Because values for visit counts or sampling intervals were not always reported in the induction interview, especially for most of the nonrespondents to the induction interview, the following alternative methods were used to estimate expected numbers of sampled visits:
+ For cases when the sampling interval was missing from the induction interview, the expected number of sample visits for a physician was estimated to be the minimum of 24 or the number of visits seen during the physician’s reporting week. In prior years, the average number of PRFs sampled from each physician with any PRF was 24 using the same visit sampling instructions as used in the 2012 NAMCS.
+ For cases when the number of visits seen in the reporting week was unknown, that number was replaced with the known or imputed number of visits the physician saw during the
last normal week of practice. Imputation was done by linear regression using visit numbers reported by similar physicians, where similar is in terms of physician specialty, Census division, MSA status, physician age and race, and reported practice size (see Appendix I for details).
The total of expected sample visits approximates the potential size of the total visit sample had visits been sampled correctly from every in-scope sample physician who saw visits (or saw patients) in the reporting week, regardless of the physician’s response to either the induction interview or PRFs. The imputed number of visits during the last normal practice week was used in this estimate because the amount of missing data was large and the imputed number of visits seen during the last normal week of practice was also used in final visit estimation procedures. Research conducted prior to finalizing the weighting procedures showed that if the mean of reported visits (used in prior year estimates) had been used instead of using regression methods to impute the missing numbers of visits seen in the physician’s last normal practice week, the final estimate of total visits would have understated visit estimates compared with those for prior years.
Note that the evaluation of visit response bias is highly dependent on the adequacy of the imputation methods used. Although the most reasonable imputation methods were applied, it is possible that imputation results may differ from true values. If this happened, the estimated visit response rate and bias will be inaccurate.
Bias Analysis For the second evaluation method,
comparisons are made between percent distributions. In each comparison, one of the percent distributions is estimated only on the basis of survey respondents, using survey weights that are adjusted to correct for nonresponse, while the other distribution is estimated on the basis of the total in-scope sample using only calibrated sampling weights. Membership
Series 2, No. 171 [ Page 5
in the total in-scope sample was determined for every sampled physician, regardless of the physician’s response status. See Appendix II for details about the nonresponse-adjusted survey weights.
Bias analysis in physician-level estimates
Biases in the two sets of physician-level estimates are computed as the differences between estimates based on the full in-scope sample and estimates based on (a) only the physicians completing the induction interview and (b) only the physicians completing any PRFs. Bias estimates at the physician level were also derived by comparing both sets of NAMCS physician-level estimates with comparable estimates from a separate nationally representative physician survey: the 2012 NEHRS. NAMCS estimates are compared with NEHRS estimates because the two surveys are identical in scope and share the same sampling frame source (physicians classified as being in nonfederal office-based practices in the master files of AMA and AOA). The NEHRS mode of data collection, however, differs from that of NAMCS. NEHRS is conducted by mail, whereas the 2012 NAMCS was conducted by computer-assisted personal interview. The unweighted response rate for the 2012 NEHRS was 67% (65% weighted) (6). Bias estimates were derived as the differences between the corresponding physician-level estimates between the two surveys.
It is possible, but unknown, whether mode or respondent type affected differences in estimates from the 2012 NEHRS and 2012 NAMCS. A previous study comparing 2008 EHR mail survey estimates with NAMCS found no differences in rates of missing data for practice size, employee or ownership of practice, and whether the practice was a multispecialty practice. Respondent effects are possible, however, because a majority of NEHRS respondents were the sampled physician, while a majority of NAMCS induction interview respondents were office staff (7,8). In addition, both studies compared mail survey data with NAMCS data collected
during personal interview using a paper form.
Bias analysis in visit-level estimates
To assess the potential for bias in visit-level estimates due to PRF nonresponse for sampled visits, two sets of estimated percent distributions for annual numbers of office-based visits by physician characteristics are presented. One set is based on the estimated annual visit volumes (see Appendix I for definition) for the total in-scope physician sample weighted with the physician-calibrated sampling weights only. The other set is based on the completed PRFs using nonresponse-
adjusted weights (see Appendix II for details). Because nonresponse adjustments at the national level differ from those at the state level, there are two visit-level weights. Weights designed for national visit estimates were used in estimating percent distributions by physician characteristics other than by state, while weights for state estimates were used to estimate percent distributions of visits by the 34 targeted states.
Results
Response to Induction Interview
Information on response to the induction interview was examined by comparing percent distributions of responders and nonresponders by physician characteristics (Tables 1 and 2). The overall weighted response rate to the induction interview was 59.7% (Table 1). Distributions of responders and nonresponders did not vary by physician age, sex, type of doctor (M.D. or D.O.), or practice type. However, distributions did vary between respondents and nonrespondents by physician specialty, specialty type, Census division (Table 1), and selected states (Table 2). Compared with the national average, the response rate was lower among physicians in New England (51.3%) and higher in the East
North Central Division (65.1%) and the East South Central Division (64.1%). Again, compared with the national average, response rates were higher among general or family practitioners (64.3%) and pediatricians (70.0%), but were lower among orthopedic surgeons (53.9%), specialists in cardiovascular diseases (51.2%), and oncologists (51.4%). Compared with the national average, physicians in primary care specialties responded more frequently (62.4%), while those in surgical specialties responded less frequently (54.9%). The response rate for physicians in solo practice (63.2%) was significantly higher than the national average (Table 1).
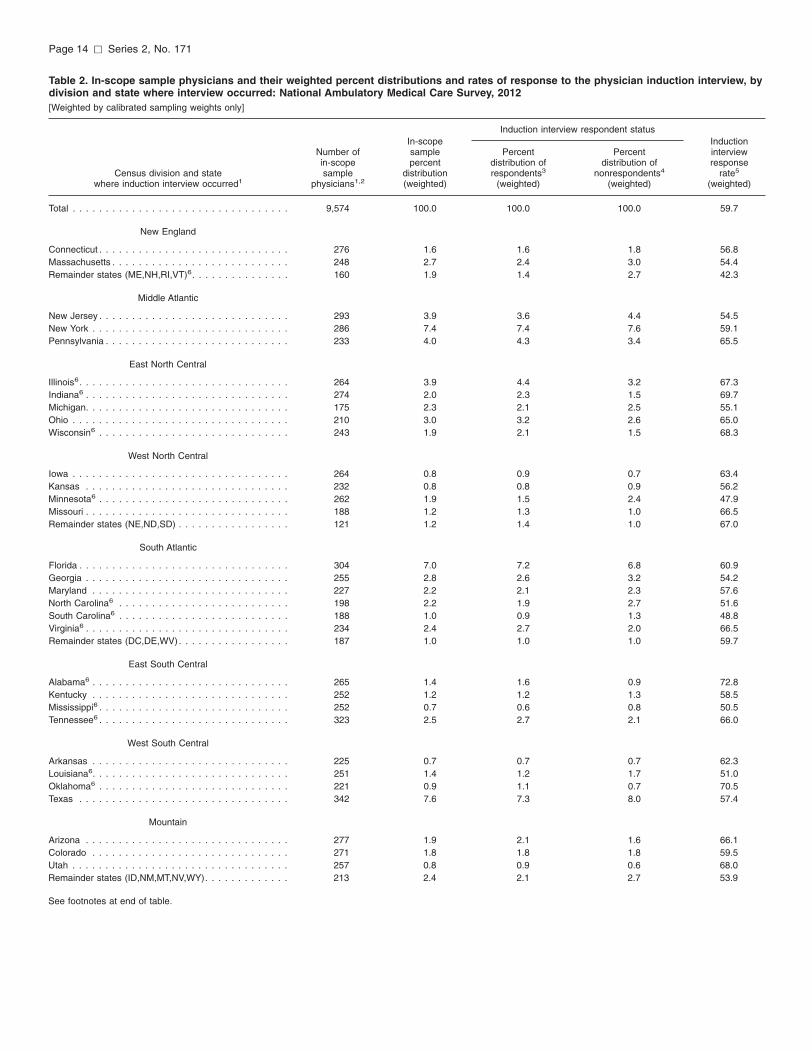
The induction interview response rate varied widely among the 34 most populous states (Table 2). Compared with the national average, response rates were higher among physicians in eight states (Illinois, Indiana, Wisconsin, Virginia, Alabama, Tennessee, Oklahoma, and Utah) and were lower than the national rate in five states (Minnesota, North Carolina, South Carolina, Mississippi, and Louisiana).
Response to Patient Record Forms
Response for physician-level estimates
The first level of response for completing PRFs is at the physician level. Of the 9,574 in-scope (eligible) physicians, 37.4% unweighted (38.4%, weighted) or 3,583 physicians completed any PRF. This is 63.7% unweighted (64.3% weighted) of the in-scope physicians who completed the induction interview. Table 3 gives percent distributions of physicians by PRF completion status and physician characteristics. Overall, a statistically significant association was seen between distributions of physicians by PRF completion status and Census division and by MSA status. Compared with the national average, the PRF completion rate was higher in the East South Central Division (44.3%) but was lower in the New England Division (32.7%). The PRF completion rate outside of
Page 6 [ Series 2, No. 171
MSAs (43.3%) was also higher than the national average.
Statistically significant chi-square associations were found between PRF completion status and the following characteristics: physician specialty, specialty type, practice type, and annual visit volume. PRFs were completed more frequently than the national average by general or family practitioners (44.1%) and pediatricians (48.6%) but were completed less frequently by specialists in cardiovascular diseases (31.9%) and oncologists (31.6%). Physicians in primary care specialties completed PRFs (41.7%) at a higher rate than nationally, while the reverse was found for physicians in surgical specialties (34.6%). A higher-than-national PRF completion rate was observed among solo practitioners (42.3%). PRF completion rates in the 26th–50th percentile and in the 51st–75th percentile of annual visit volumes were significantly lower than the national rate (30.2% and 27.5%, respectively), while completion rates in the 0–25th percentile and the 67th–100th percentile were significantly higher than the national rate (49.5% and 46.3%, respectively).
The association between distributions by PRF completion status and state location of the office where the physician saw the most visits during his or her reporting week was statistically significant. Compared with the national average, the PRF completion rate was higher in five states: Iowa, Alabama, Tennessee, Oklahoma, and Utah. The reverse was found in four states: Ohio, Minnesota, Maryland, and South Carolina. The higher-than-national PRF completion rates in Alabama (51.9%) and Tennessee (46.0%) (Table 4) contributed to the higher-than-national PRF completion rate in the East South Central Division (Table 3).
Response for visit-level estimates
To evaluate the potential for nonresponse bias in visit-level statistics, weighted percentages of expected PRFs were compared with percentages of
completed PRFs by physician characteristic. Overall, an estimated 221,081 PRFs could have been completed if all in-scope sample physicians had completed their expected numbers of PRFs; however, only 76,330 PRFs were completed. Differences observed in the weighted distributions of expected and completed PRFs (Tables 5 and 6) were somewhat similar to those observed among physicians providing any PRFs (Tables 3 and 4). That is, percentages of expected PRFs differed from the corresponding percentages of completed PRFs for each Census division (with the exception of East North Central and Mountain); each MSA status; the specialties of pediatrics, psychiatry, oncology, and other specialties; each specialty type; and each annual visit quartile (Table 5). Similarly, the percentages of expected PRFs differed from the corresponding percentages of completed PRFs in 15 states (Table 6), and differences were observed between physicians completing and not completing PRFs in 13 states (Table 4).
Completion of PRFs represents response at the visit level (Tables 5 and 6). Compared with the percentage of expected PRFs completed nationally (35.0% weighted), the percentage of expected PRFs completed in the West North Central Division was higher, while lower percentages were completed in the Middle Atlantic and South Atlantic divisions. Compared with the national percentage, the percentage completed outside of MSAs was higher. PRF completion percentages also varied by physician specialty. Compared with the national percentage, higher percentages of expected PRFs were completed by general or family practitioners and pediatricians, and lower percentages were completed by orthopedic surgeons, psychiatrists, oncologists, and other specialties. Consequently, physicians in primary care specialties completed a higher percentage of expected PRFs than the percentage completed nationally, while lower percentages of expected PRFs were completed by physicians in the other two specialty types. Compared with the national percentage, higher percentages of expected PRFs were
completed by physicians in the first and fourth quartiles for annual visit volume, and lower percentages were completed by physicians in the second and third quartiles for annual visit volume.
Compared with the national percentage, lower percentages of expected PRFs were completed in Florida and Maryland, which may have contributed to the low percentages of PRFs completed in the South Atlantic Division. Compared with the national percentage, higher percentages of expected PRFs were completed in Iowa, Kansas, Oklahoma, and Utah, and lower percentages were completed in Oregon (Table 6).
2010–2012 PRF completion, participation, and response rates
Historically, NAMCS reports have defined three groups of physicians by the extent of their response to PRFs: participating physicians, physicians completing any PRF, and physicians with full or adequate PRF response (Appendix I). Thus far, this study has focused on physicians completing any PRF, to assess potential nonresponse biases among these physicians compared with the full sample of in-scope physicians.
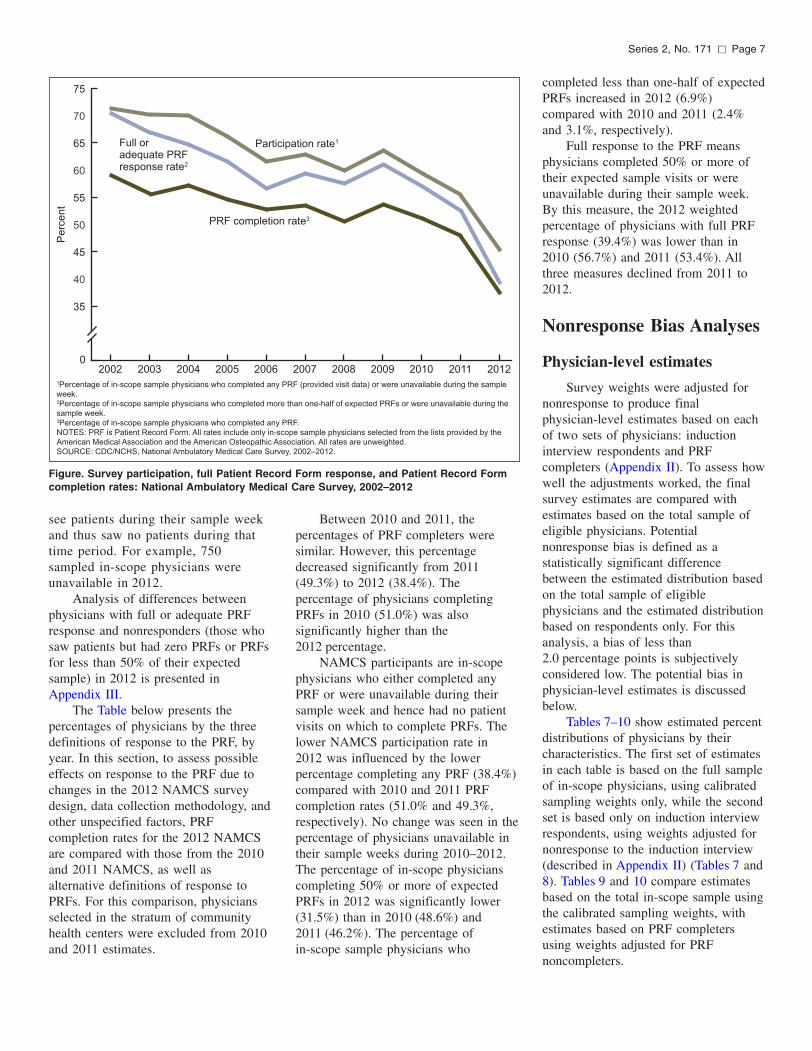
Prior to 2002, NAMCS response rates were identical to that of participating physicians, defined as physicians who either completed any PRF or saw no patients because they were unavailable during their sample week (Appendix I). Starting in 2002, NAMCS response rates were defined as physicians with full or adequate PRF response, to better reflect changes in the nonresponse adjustments included in visit survey weights. The following Figure shows that since 2002, the rates of NAMCS participation, PRF completion, and full PRF response (unweighted) have all been declining. Regardless of year, the percentage of physicians completing any PRF is less than the percentage of participating physicians and the percentage of physicians with full or adequate PRF response because the latter two definitions of physicians include physicians who were unavailable to
50
55
60
65
Series 2, No. 171 [ Page 7
75
70
Perc
ent
1Percentage of in-scope sample physicians who completed any PRF (provided visit data) or were unavailable during the sample
week. 2Percentage of in-scope sample physicians who completed more than one-half of expected PRFs or were unavailable during the
sample week. 3Percentage of in-scope sample physicians who completed any PRF.
NOTES: PRF is Patient Record Form. All rates include only in-scope sample physicians selected from the lists provided by the
American Medical Association and the American Osteopathic Association. All rates are unweighted.
SOURCE: CDC/NCHS, National Ambulatory Medical Care Survey, 2002–2012.
PRF completion rate3
Full or adequate PRF response rate2
Participation rate1
2002 2003 2004 2005 2006 2007 2008 2009 2010 2011 2012
45
40
35
0
Figure. Survey participation, full Patient Record Form response, and Patient Record Form completion rates: National Ambulatory Medical Care Survey, 2002–2012
see patients during their sample week and thus saw no patients during that time period. For example, 750 sampled in-scope physicians were unavailable in 2012.
Analysis of differences between physicians with full or adequate PRF response and nonresponders (those who saw patients but had zero PRFs or PRFs for less than 50% of their expected sample) in 2012 is presented in Appendix III.
The Table below presents the percentages of physicians by the three definitions of response to the PRF, by year. In this section, to assess possible effects on response to the PRF due to changes in the 2012 NAMCS survey design, data collection methodology, and other unspecified factors, PRF completion rates for the 2012 NAMCS are compared with those from the 2010 and 2011 NAMCS, as well as alternative definitions of response to PRFs. For this comparison, physicians selected in the stratum of community health centers were excluded from 2010 and 2011 estimates.
Between 2010 and 2011, the percentages of PRF completers were similar. However, this percentage decreased significantly from 2011 (49.3%) to 2012 (38.4%). The percentage of physicians completing PRFs in 2010 (51.0%) was also significantly higher than the 2012 percentage.
NAMCS participants are in-scope physicians who either completed any PRF or were unavailable during their sample week and hence had no patient visits on which to complete PRFs. The lower NAMCS participation rate in 2012 was influenced by the lower percentage completing any PRF (38.4%) compared with 2010 and 2011 PRF completion rates (51.0% and 49.3%, respectively). No change was seen in the percentage of physicians unavailable in their sample weeks during 2010–2012. The percentage of in-scope physicians completing 50% or more of expected PRFs in 2012 was significantly lower (31.5%) than in 2010 (48.6%) and 2011 (46.2%). The percentage of in-scope sample physicians who
completed less than one-half of expected PRFs increased in 2012 (6.9%) compared with 2010 and 2011 (2.4% and 3.1%, respectively).
Full response to the PRF means physicians completed 50% or more of their expected sample visits or were unavailable during their sample week. By this measure, the 2012 weighted percentage of physicians with full PRF response (39.4%) was lower than in 2010 (56.7%) and 2011 (53.4%). All three measures declined from 2011 to 2012.
Nonresponse Bias Analyses
Physician-level estimates
Survey weights were adjusted for nonresponse to produce final physician-level estimates based on each of two sets of physicians: induction interview respondents and PRF completers (Appendix II). To assess how well the adjustments worked, the final survey estimates are compared with estimates based on the total sample of eligible physicians. Potential nonresponse bias is defined as a statistically significant difference between the estimated distribution based on the total sample of eligible physicians and the estimated distribution based on respondents only. For this analysis, a bias of less than 2.0 percentage points is subjectively considered low. The potential bias in physician-level estimates is discussed below.
Tables 7–10 show estimated percent distributions of physicians by their characteristics. The first set of estimates in each table is based on the full sample of in-scope physicians, using calibrated sampling weights only, while the second set is based only on induction interview respondents, using weights adjusted for nonresponse to the induction interview (described in Appendix II) (Tables 7 and 8). Tables 9 and 10 compare estimates based on the total in-scope sample using the calibrated sampling weights, with estimates based on PRF completers using weights adjusted for PRF noncompleters.
Page 8 [ Series 2, No. 171
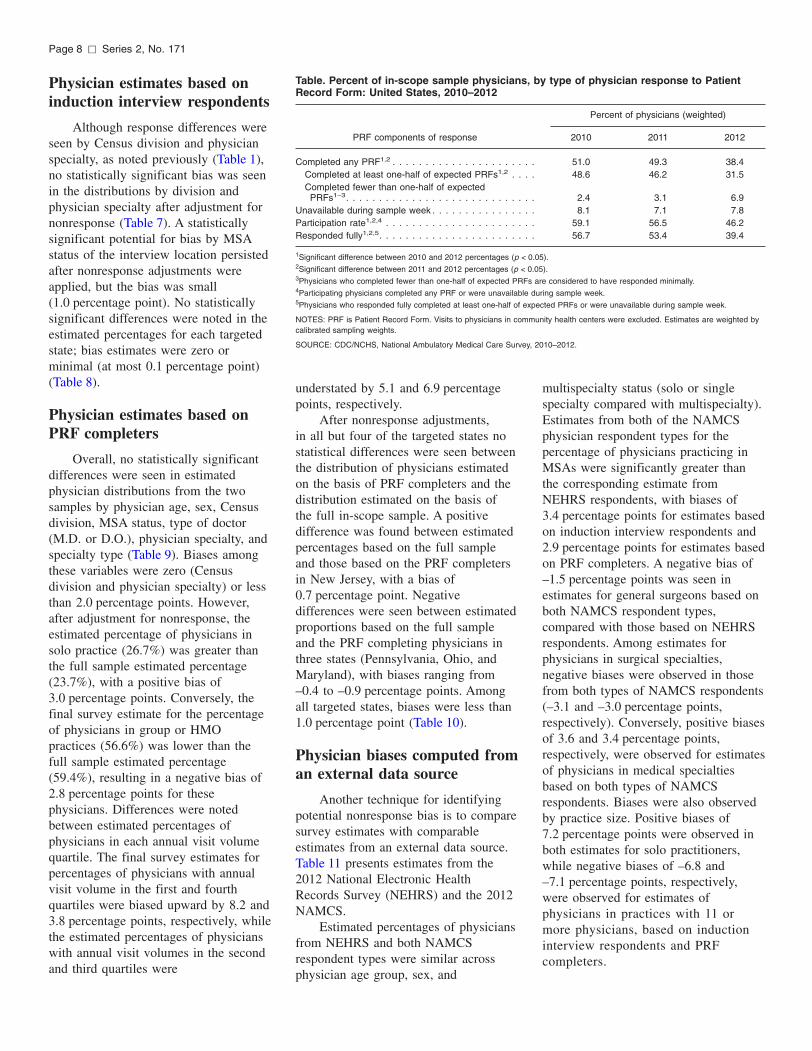
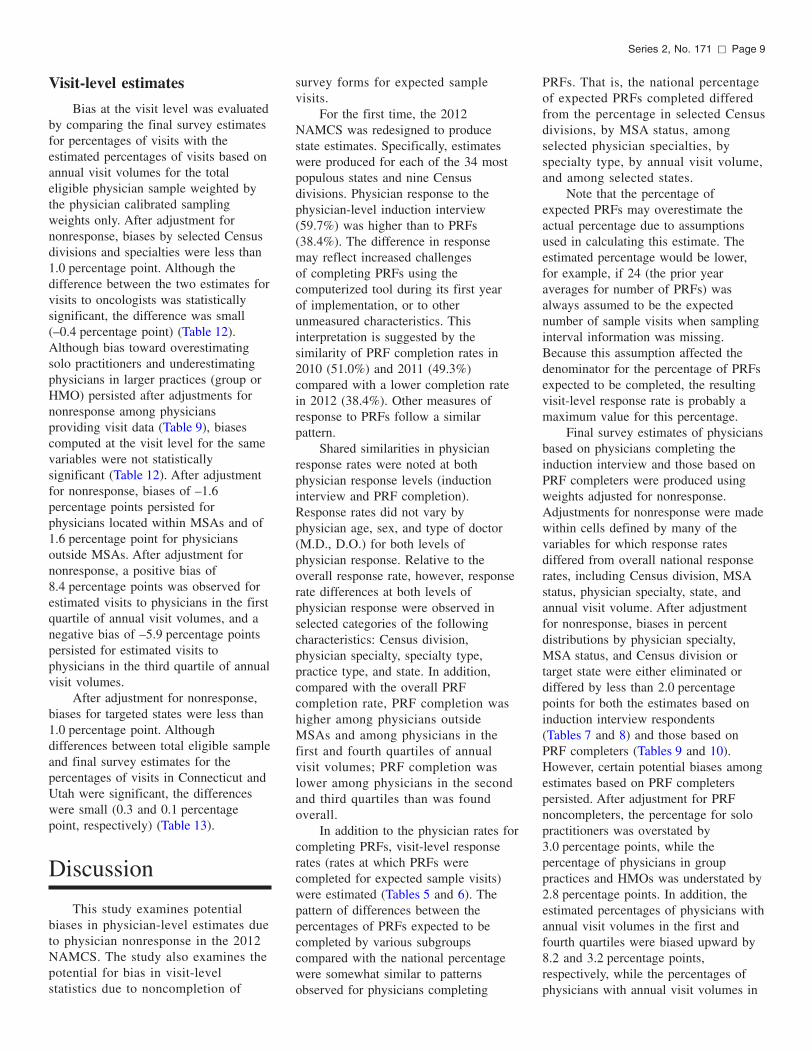
Table. Percent of in-scope sample physicians, by type of physician response to Patient Record Form: United States, 2010–2012
Percent of physicians (weighted)
PRF components of response 2010 2011 2012
Completed any PRF1,2 . . . . . . . . . . . . . . . . . . . . . . 51.0 49.3 38.4 Completed at least one-half of expected PRFs1,2 . . . . 48.6 46.2 31.5 Completed fewer than one-half of expected PRFs1–3. . . . . . . . . . . . . . . . . . . . . . . . . . . . . 2.4 3.1 6.9
Unavailable during sample week . . . . . . . . . . . . . . . . 8.1 7.1 7.8 Participation rate1,2,4 . . . . . . . . . . . . . . . . . . . . . . . 59.1 56.5 46.2 Responded fully1,2,5. . . . . . . . . . . . . . . . . . . . . . . . 56.7 53.4 39.4
1Significant difference between 2010 and 2012 percentages (p < 0.05). 2Significant difference between 2011 and 2012 percentages (p < 0.05). 3Physicians who completed fewer than one-half of expected PRFs are considered to have responded minimally. 4Participating physicians completed any PRF or were unavailable during sample week. 5Physicians who responded fully completed at least one-half of expected PRFs or were unavailable during sample week.
NOTES: PRF is Patient Record Form. Visits to physicians in community health centers were excluded. Estimates are weighted by calibrated sampling weights.
SOURCE: CDC/NCHS, National Ambulatory Medical Care Survey, 2010–2012.
Physician estimates based on induction interview respondents
Although response differences were seen by Census division and physician specialty, as noted previously (Table 1), no statistically significant bias was seen in the distributions by division and physician specialty after adjustment for nonresponse (Table 7). A statistically significant potential for bias by MSA status of the interview location persisted after nonresponse adjustments were applied, but the bias was small (1.0 percentage point). No statistically significant differences were noted in the estimated percentages for each targeted state; bias estimates were zero or minimal (at most 0.1 percentage point) (Table 8).
Physician estimates based on PRF completers
Overall, no statistically significant differences were seen in estimated physician distributions from the two samples by physician age, sex, Census division, MSA status, type of doctor (M.D. or D.O.), physician specialty, and specialty type (Table 9). Biases among these variables were zero (Census division and physician specialty) or less than 2.0 percentage points. However, after adjustment for nonresponse, the estimated percentage of physicians in solo practice (26.7%) was greater than the full sample estimated percentage (23.7%), with a positive bias of 3.0 percentage points. Conversely, the final survey estimate for the percentage of physicians in group or HMO practices (56.6%) was lower than the full sample estimated percentage (59.4%), resulting in a negative bias of 2.8 percentage points for these physicians. Differences were noted between estimated percentages of physicians in each annual visit volume quartile. The final survey estimates for percentages of physicians with annual visit volume in the first and fourth quartiles were biased upward by 8.2 and 3.8 percentage points, respectively, while the estimated percentages of physicians with annual visit volumes in the second and third quartiles were
understated by 5.1 and 6.9 percentage points, respectively.
After nonresponse adjustments, in all but four of the targeted states no statistical differences were seen between the distribution of physicians estimated on the basis of PRF completers and the distribution estimated on the basis of the full in-scope sample. A positive difference was found between estimated percentages based on the full sample and those based on the PRF completers in New Jersey, with a bias of 0.7 percentage point. Negative differences were seen between estimated proportions based on the full sample and the PRF completing physicians in three states (Pennsylvania, Ohio, and Maryland), with biases ranging from –0.4 to –0.9 percentage points. Among all targeted states, biases were less than 1.0 percentage point (Table 10).
Physician biases computed from an external data source
Another technique for identifying potential nonresponse bias is to compare survey estimates with comparable estimates from an external data source. Table 11 presents estimates from the 2012 National Electronic Health Records Survey (NEHRS) and the 2012 NAMCS.
Estimated percentages of physicians from NEHRS and both NAMCS respondent types were similar across physician age group, sex, and
multispecialty status (solo or single specialty compared with multispecialty). Estimates from both of the NAMCS physician respondent types for the percentage of physicians practicing in MSAs were significantly greater than the corresponding estimate from NEHRS respondents, with biases of 3.4 percentage points for estimates based on induction interview respondents and 2.9 percentage points for estimates based on PRF completers. A negative bias of –1.5 percentage points was seen in estimates for general surgeons based on both NAMCS respondent types, compared with those based on NEHRS respondents. Among estimates for physicians in surgical specialties, negative biases were observed in those from both types of NAMCS respondents (–3.1 and –3.0 percentage points, respectively). Conversely, positive biases of 3.6 and 3.4 percentage points, respectively, were observed for estimates of physicians in medical specialties based on both types of NAMCS respondents. Biases were also observed by practice size. Positive biases of 7.2 percentage points were observed in both estimates for solo practitioners, while negative biases of –6.8 and –7.1 percentage points, respectively, were observed for estimates of physicians in practices with 11 or more physicians, based on induction interview respondents and PRF completers.
Series 2, No. 171 [ Page 9
Visit-level estimates
Bias at the visit level was evaluated by comparing the final survey estimates for percentages of visits with the estimated percentages of visits based on annual visit volumes for the total eligible physician sample weighted by the physician calibrated sampling weights only. After adjustment for nonresponse, biases by selected Census divisions and specialties were less than 1.0 percentage point. Although the difference between the two estimates for visits to oncologists was statistically significant, the difference was small (–0.4 percentage point) (Table 12). Although bias toward overestimating solo practitioners and underestimating physicians in larger practices (group or HMO) persisted after adjustments for nonresponse among physicians providing visit data (Table 9), biases computed at the visit level for the same variables were not statistically significant (Table 12). After adjustment for nonresponse, biases of –1.6 percentage points persisted for physicians located within MSAs and of 1.6 percentage point for physicians outside MSAs. After adjustment for nonresponse, a positive bias of 8.4 percentage points was observed for estimated visits to physicians in the first quartile of annual visit volumes, and a negative bias of –5.9 percentage points persisted for estimated visits to physicians in the third quartile of annual visit volumes.
After adjustment for nonresponse, biases for targeted states were less than 1.0 percentage point. Although differences between total eligible sample and final survey estimates for the percentages of visits in Connecticut and Utah were significant, the differences were small (0.3 and 0.1 percentage point, respectively) (Table 13).
Discussion
This study examines potential biases in physician-level estimates due to physician nonresponse in the 2012 NAMCS. The study also examines the potential for bias in visit-level statistics due to noncompletion of
survey forms for expected sample visits.
For the first time, the 2012 NAMCS was redesigned to produce state estimates. Specifically, estimates were produced for each of the 34 most populous states and nine Census divisions. Physician response to the physician-level induction interview (59.7%) was higher than to PRFs (38.4%). The difference in response may reflect increased challenges of completing PRFs using the computerized tool during its first year of implementation, or to other unmeasured characteristics. This interpretation is suggested by the similarity of PRF completion rates in 2010 (51.0%) and 2011 (49.3%) compared with a lower completion rate in 2012 (38.4%). Other measures of response to PRFs follow a similar pattern.
Shared similarities in physician response rates were noted at both physician response levels (induction interview and PRF completion). Response rates did not vary by physician age, sex, and type of doctor (M.D., D.O.) for both levels of physician response. Relative to the overall response rate, however, response rate differences at both levels of physician response were observed in selected categories of the following characteristics: Census division, physician specialty, specialty type, practice type, and state. In addition, compared with the overall PRF completion rate, PRF completion was higher among physicians outside MSAs and among physicians in the first and fourth quartiles of annual visit volumes; PRF completion was lower among physicians in the second and third quartiles than was found overall.
In addition to the physician rates for completing PRFs, visit-level response rates (rates at which PRFs were completed for expected sample visits) were estimated (Tables 5 and 6). The pattern of differences between the percentages of PRFs expected to be completed by various subgroups compared with the national percentage were somewhat similar to patterns observed for physicians completing
PRFs. That is, the national percentage of expected PRFs completed differed from the percentage in selected Census divisions, by MSA status, among selected physician specialties, by specialty type, by annual visit volume, and among selected states.
Note that the percentage of expected PRFs may overestimate the actual percentage due to assumptions used in calculating this estimate. The estimated percentage would be lower, for example, if 24 (the prior year averages for number of PRFs) was always assumed to be the expected number of sample visits when sampling interval information was missing. Because this assumption affected the denominator for the percentage of PRFs expected to be completed, the resulting visit-level response rate is probably a maximum value for this percentage.
Final survey estimates of physicians based on physicians completing the induction interview and those based on PRF completers were produced using weights adjusted for nonresponse. Adjustments for nonresponse were made within cells defined by many of the variables for which response rates differed from overall national response rates, including Census division, MSA status, physician specialty, state, and annual visit volume. After adjustment for nonresponse, biases in percent distributions by physician specialty, MSA status, and Census division or target state were either eliminated or differed by less than 2.0 percentage points for both the estimates based on induction interview respondents (Tables 7 and 8) and those based on PRF completers (Tables 9 and 10). However, certain potential biases among estimates based on PRF completers persisted. After adjustment for PRF noncompleters, the percentage for solo practitioners was overstated by 3.0 percentage points, while the percentage of physicians in group practices and HMOs was understated by 2.8 percentage points. In addition, the estimated percentages of physicians with annual visit volumes in the first and fourth quartiles were biased upward by 8.2 and 3.2 percentage points, respectively, while the percentages of physicians with annual visit volumes in
Page 10 [ Series 2, No. 171
the second and third quartiles were understated by 5.1 and 6.9 percentage points, respectively.
After adjustment for nonresponse, biases in percentage estimates of visits (compared to the weighted annual visit volume based on the total in-scope physician sample) by physician specialty, MSA status, and Census division or targeted state were either eliminated or differed by less than 2.0 percentage points (1.6% among MSA visits, –1.6% among non-MSA visits, –0.4% among oncologist visits, and 0.2% among Utah visits). Biases in visit estimates were nearly eliminated among visits in the second and fourth quartiles of annual visit volume after adjustments for nonresponse were applied. Biases in the first (8.4%) and third (–5.9%) annual visit volume quartiles, however, persisted.
Note that although bias toward overestimating solo practitioners and underestimating physicians in larger practices (group or HMO) persisted after adjustments for nonresponse among physicians completing PRFs, biases computed at the visit level for the same variables were not statistically significant (Table 12). In addition, when 2010 through 2012 NAMCS visit estimates were compared, no statistically significant differences were seen between percentages of visits by practice size category (solo, 2 physicians, 3–5 physicians, 6–10 physicians, and 11 or more physicians) (9–11).
To benchmark 2012 NAMCS estimates to an external data source, physician-level percentage estimates based on both NAMCS respondent types were compared with estimates from the 2012 NEHRS. Similar to comparisons with estimates based on the full NAMCS in-scope sample, biases based on NEHRS as the reference were observed by MSA status, physician specialty, and specialty type. The biases, however, were larger in magnitude. For example, compared with NEHRS estimates, NAMCS estimates were biased by 2.9 percentage points within or outside MSAs (Table 11). These differences were larger than those
observed between estimates based on the full NAMCS sample and the induction interview respondents (1.0 percentage point) (Table 7) or the PRF completers (0.5 percentage point) (Table 9). Similarly, biases of larger magnitude between NEHRS and NAMCS estimates were also observed by physician specialty and specialty type. Biases between the two surveys’ estimates were observed by practice size. Compared with NEHRS estimates, NAMCS estimates based on both respondent types were biased toward solo practitioners by 7.2 percentage points, and were understated by 6.8 and 7.1 percentage points among the two respondent types, respectively, for physicians in practices with 11 or more physicians. Due to differences in data collection mode, respondent type, and other survey differences, however, it is not clear which set of distributions is the correct distribution.
Limitations
Results of this study are subject to several limitations. First, with the exception of annual visit volumes, physician characteristics used in this study were limited to those available in the sampling frame, with updates from the survey. Second, unforeseen challenges encountered in data collection and processing during this first year of computerized data collection for NAMCS may have affected response, as indicated by the PRF completion rates from 2010 through 2012. Third, information on numbers of visits seen by physicians in normal practice weeks, and thus numbers of sample visits to expect, was missing a greater percentage of the time than experienced in prior years, which affected estimates for visit response rates and visit estimates. Finally, comparison of estimates from the external NEHRS data source may be subject to response bias and should not be considered the ‘‘gold standard.’’ Further research is needed to both measure and evaluate the effect of these aspects on physician response.
Conclusions
The 2012 NAMCS sample was redesigned to produce state estimates for the first time in the survey’s history. Also for the first time, a computerized survey instrument was used to collect NAMCS data. Implementation of the new data collection mode may have influenced lower physician completion of PRFs (for visit-level data) compared with 2010 and 2011. After adjustment for nonresponse by MSA status, Census division or targeted state, and physician specialty categories, no or minimal biases (less than 2.0 percentage points) were observed by these characteristics between physician estimates based on the full in-scope physician sample and physician estimates based on either of the two NAMCS respondent types (induction interview respondents and PRF completers). After adjustment for nonresponse among sample visits, no or minimal biases (less than 2.0 percentage points) were observed by the same characteristics. Biases may exist for characteristics that were not used in adjusting for nonresponse.
References
1. National Center for Health Statistics. 2012 NAMCS microdata file documentation. Hyattsville, MD. 2015. Available from: ftp://ftp.cdc.gov/pub/ Health_Statistics/NCHS/Datasets/ NAMCS.
2. Hing E, Cherry DK, Woodwell DA. National Ambulatory Medical Care Survey: 2003 summary. Advance data from vital and health statistics; no 365. Hyattsville, MD: National Center for Health Statistics. 2005. Available from: http://www.cdc.gov/nchs/data/ad/ ad365.pdf.
3. Hsiao CJ, Hing E, Ashman JJ. Trends in electronic health record system use among office-based physicians: United States, 2007–2012. National health statistics reports; no 75. Hyattsville, MD: National Center for Health Statistics. 2014. Available from: http://www.cdc.gov/nchs/data/nhsr/ nhsr075.pdf.
Series 2, No. 171 [ Page 11
4. Groves RM. Nonresponse rates and nonresponse bias in household surveys. Public Opin Q 70(5):646–75. 2006.
5. Johnson TP, Wislar JS. Response rates and nonresponse errors in surveys. JAMA 307(17):1805–6. 2012.
6. Hsiao CJ, Hing E. Use and characteristics of electronic health record systems among office-based physician practices: United States, 2001–2012. NCHS data brief, no 111. Hyattsville, MD: National Center for Health Statistics. 2012. Available from: http://www.cdc.gov/nchs/data/databriefs/ db111.htm.pdf.
7. Hing E, Hsiao CJ, Beatty P. A comparison of mail and face-to-face responses in a dual-mode survey of physicians. Proceedings of the American Statistical Association Section on Survey Research Methods. 2010.
8. Hing E, Hsiao CJ, Beatty P, Decker SL. Mode and respondent effects in a dual-mode survey of physicians: 2008–2009. Proceedings of the American Statistical Association Section on Survey Research Methods. 2011.
9. National Center for Health Statistics. 2010 NAMCS microdata file. 2012. Available from: ftp://ftp.cdc.gov/pub/ Health_Statistics/NCHS/Datasets/ NAMCS/.
10. National Center for Health Statistics. 2011 NAMCS microdata file. 2015. Available from: ftp://ftp.cdc.gov/pub/ Health_Statistics/NCHS/Datasets/ NAMCS/.
11. National Center for Health Statistics. National Ambulatory Medical Care Survey: 2012 state and national summary tables. 2015. Available from: http://www.cdc.gov/nchs/data/ahcd/ namcs_summary/2012_namcs_web_ tables.pdf.
Page 12 [ Series 2, No. 171
Table 1. In-scope sample physicians and their weighted percent distributions and rates of response to the physician induction interview, by physician characteristics: National Ambulatory Medical Care Survey, 2012
Induction interview respondent status In-scope Induction
Number of sample Percent Percent interview in-scope percent distribution of distribution of response sample distribution respondents3 nonrespondents4 rate5
Physician characteristic1 physicians2 (weighted) (weighted) (weighted) (weighted)
All office-based physicians . . . . . . . . . . . . . . . . . . . 9,574 100.0 100.0 100.0 59.7
Age
Under 50 . . . . . . . . . . . . . . . . . . . . . . . . . . . . . . 3,741 40.4 39.6 41.6 58.6 50 and over. . . . . . . . . . . . . . . . . . . . . . . . . . . . . 5,833 59.6 60.4 58.4 60.5
Sex
Male . . . . . . . . . . . . . . . . . . . . . . . . . . . . . . . . . 7,239 71.6 71.8 71.3 59.9 Female . . . . . . . . . . . . . . . . . . . . . . . . . . . . . . . 2,335 28.4 28.2 28.7 59.4
Census division location of interview6
New England7 . . . . . . . . . . . . . . . . . . . . . . . . . . . 684 6.2 5.3 7.5 51.3 Middle Atlantic . . . . . . . . . . . . . . . . . . . . . . . . . . . 812 15.3 15.3 15.4 59.6 East North Central7 . . . . . . . . . . . . . . . . . . . . . . . . 1,166 13.0 14.2 11.3 65.1 West North Central . . . . . . . . . . . . . . . . . . . . . . . . 1,067 5.9 5.8 6.0 58.9 South Atlantic . . . . . . . . . . . . . . . . . . . . . . . . . . . 1,593 18.8 18.3 19.4 58.4 East South Central7 . . . . . . . . . . . . . . . . . . . . . . . . 1,092 5.7 6.2 5.1 64.1 West South Central . . . . . . . . . . . . . . . . . . . . . . . . 1,039 10.6 10.3 11.1 58.0 Mountain . . . . . . . . . . . . . . . . . . . . . . . . . . . . . . 1,018 6.9 7.0 6.8 60.4 Pacific . . . . . . . . . . . . . . . . . . . . . . . . . . . . . . . . 1,103 17.5 17.6 17.4 60.0
Metropolitan status8
MSA . . . . . . . . . . . . . . . . . . . . . . . . . . . . . . . . . 8,473 91.7 91.6 91.9 59.7 Non-MSA . . . . . . . . . . . . . . . . . . . . . . . . . . . . . . 1,101 8.3 8.4 8.1 60.6
Type of doctor
Doctor of medicine . . . . . . . . . . . . . . . . . . . . . . . . 9,083 94.1 93.9 94.5 59.6 Doctor of osteopathy . . . . . . . . . . . . . . . . . . . . . . . 491 5.9 6.1 5.5 62.5
Physician specialty6,9
General or family practice7 . . . . . . . . . . . . . . . . . . . 1,265 17.1 18.4 15.2 64.3 Internal medicine . . . . . . . . . . . . . . . . . . . . . . . . . 811 12.8 12.0 14.0 55.9 Pediatrics7 . . . . . . . . . . . . . . . . . . . . . . . . . . . . . 688 10.3 12.1 7.7 70.0 General surgery . . . . . . . . . . . . . . . . . . . . . . . . . . 391 2.7 2.8 2.6 61.5 Obstetrics and gynecology . . . . . . . . . . . . . . . . . . . 509 7.2 7.1 7.4 58.7 Orthopedic surgery7 . . . . . . . . . . . . . . . . . . . . . . . . 555 4.5 4.1 5.2 53.9 Cardiovascular diseases7 . . . . . . . . . . . . . . . . . . . . 416 3.6 3.1 4.4 51.2 Dermatology . . . . . . . . . . . . . . . . . . . . . . . . . . . . 260 2.5 2.4 2.5 59.5 Urology . . . . . . . . . . . . . . . . . . . . . . . . . . . . . . . 243 1.9 1.8 2.1 55.7 Psychiatry . . . . . . . . . . . . . . . . . . . . . . . . . . . . . . 597 5.9 5.8 6.0 59.1 Neurology . . . . . . . . . . . . . . . . . . . . . . . . . . . . . . 232 2.3 2.3 2.3 59.5 Ophthalmology . . . . . . . . . . . . . . . . . . . . . . . . . . . 448 3.8 3.7 3.9 58.5 Otolaryngology . . . . . . . . . . . . . . . . . . . . . . . . . . . 220 1.9 1.8 2.0 57.6 Oncology7 . . . . . . . . . . . . . . . . . . . . . . . . . . . . . . 416 1.9 1.6 2.3 51.4 Allergy . . . . . . . . . . . . . . . . . . . . . . . . . . . . . . . . 398 0.9 0.9 0.8 62.7 Pulmonology . . . . . . . . . . . . . . . . . . . . . . . . . . . . 420 1.8 1.9 1.7 62.4 All other specialties . . . . . . . . . . . . . . . . . . . . . . . . 1,705 19.0 18.2 20.1 57.5
Specialty type6,9
Primary care7 . . . . . . . . . . . . . . . . . . . . . . . . . . . 3,204 46.7 48.8 43.6 62.4 Surgical7 . . . . . . . . . . . . . . . . . . . . . . . . . . . . . . 2,411 20.7 19.1 23.2 54.9 Medical . . . . . . . . . . . . . . . . . . . . . . . . . . . . . . . 3,959 32.5 32.1 33.2 58.9
See footnotes at end of table.
Series 2, No. 171 [ Page 13
Table 1. In-scope sample physicians and their weighted percent distributions and rates of response to the physician induction interview, by physician characteristics: National Ambulatory Medical Care Survey, 2012—Con.
Induction interview respondent status In-scope Induction
Number of sample Percent Percent interview in-scope percent distribution of distribution of response sample distribution respondents3 nonrespondents4 rate5
Physician characteristic1 physicians2 (weighted) (weighted) (weighted) (weighted)
Practice type
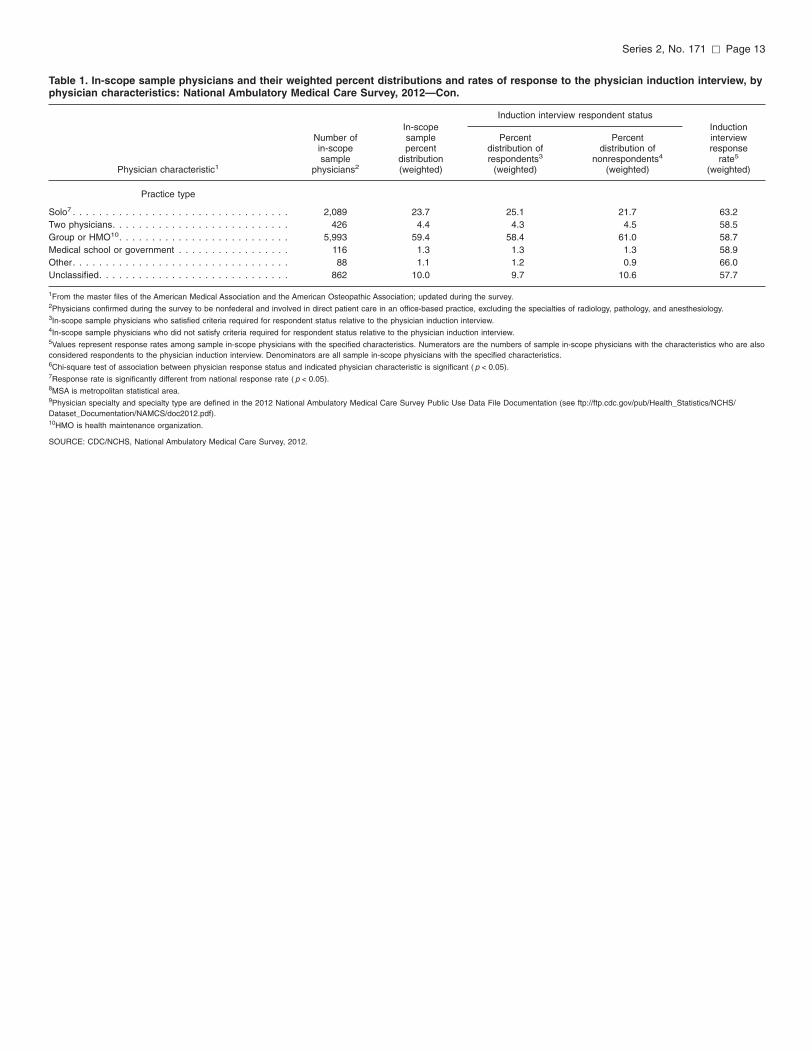
Solo7 . . . . . . . . . . . . . . . . . . . . . . . . . . . . . . . . . 2,089 23.7 25.1 21.7 63.2 Two physicians. . . . . . . . . . . . . . . . . . . . . . . . . . . 426 4.4 4.3 4.5 58.5 Group or HMO10. . . . . . . . . . . . . . . . . . . . . . . . . . 5,993 59.4 58.4 61.0 58.7 Medical school or government . . . . . . . . . . . . . . . . . 116 1.3 1.3 1.3 58.9 Other. . . . . . . . . . . . . . . . . . . . . . . . . . . . . . . . . 88 1.1 1.2 0.9 66.0 Unclassified. . . . . . . . . . . . . . . . . . . . . . . . . . . . . 862 10.0 9.7 10.6 57.7
1From the master files of the American Medical Association and the American Osteopathic Association; updated during the survey. 2Physicians confirmed during the survey to be nonfederal and involved in direct patient care in an office-based practice, excluding the specialties of radiology, pathology, and anesthesiology. 3In-scope sample physicians who satisfied criteria required for respondent status relative to the physician induction interview. 4In-scope sample physicians who did not satisfy criteria required for respondent status relative to the physician induction interview. 5Values represent response rates among sample in-scope physicians with the specified characteristics. Numerators are the numbers of sample in-scope physicians with the characteristics who are also considered respondents to the physician induction interview. Denominators are all sample in-scope physicians with the specified characteristics. 6Chi-square test of association between physician response status and indicated physician characteristic is significant ( p < 0.05). 7Response rate is significantly different from national response rate ( p < 0.05). 8MSA is metropolitan statistical area. 9Physician specialty and specialty type are defined in the 2012 National Ambulatory Medical Care Survey Public Use Data File Documentation (see ftp://ftp.cdc.gov/pub/Health_Statistics/NCHS/ Dataset_Documentation/NAMCS/doc2012.pdf). 10HMO is health maintenance organization.
SOURCE: CDC/NCHS, National Ambulatory Medical Care Survey, 2012.
Page 14 [ Series 2, No. 171
Table 2. In-scope sample physicians and their weighted percent distributions and rates of response to the physician induction interview, by division and state where interview occurred: National Ambulatory Medical Care Survey, 2012 [Weighted by calibrated sampling weights only]
Induction interview respondent status In-scope Induction
Number of sample Percent Percent interview in-scope percent distribution of distribution of response
Census division and state sample distribution respondents3 nonrespondents4 rate5
where induction interview occurred1 physicians1,2 (weighted) (weighted) (weighted) (weighted)
Total . . . . . . . . . . . . . . . . . . . . . . . . . . . . . . . . . 9,574 100.0 100.0 100.0 59.7
New England
Connecticut . . . . . . . . . . . . . . . . . . . . . . . . . . . . . 276 1.6 1.6 1.8 56.8 Massachusetts . . . . . . . . . . . . . . . . . . . . . . . . . . . 248 2.7 2.4 3.0 54.4 Remainder states (ME,NH,RI,VT)6 . . . . . . . . . . . . . . . 160 1.9 1.4 2.7 42.3
Middle Atlantic
New Jersey . . . . . . . . . . . . . . . . . . . . . . . . . . . . . 293 3.9 3.6 4.4 54.5 New York . . . . . . . . . . . . . . . . . . . . . . . . . . . . . . 286 7.4 7.4 7.6 59.1 Pennsylvania . . . . . . . . . . . . . . . . . . . . . . . . . . . . 233 4.0 4.3 3.4 65.5
East North Central
Illinois6 . . . . . . . . . . . . . . . . . . . . . . . . . . . . . . . . 264 3.9 4.4 3.2 67.3 Indiana6 . . . . . . . . . . . . . . . . . . . . . . . . . . . . . . . 274 2.0 2.3 1.5 69.7 Michigan. . . . . . . . . . . . . . . . . . . . . . . . . . . . . . . 175 2.3 2.1 2.5 55.1 Ohio . . . . . . . . . . . . . . . . . . . . . . . . . . . . . . . . . 210 3.0 3.2 2.6 65.0 Wisconsin6 . . . . . . . . . . . . . . . . . . . . . . . . . . . . . 243 1.9 2.1 1.5 68.3
West North Central
Iowa . . . . . . . . . . . . . . . . . . . . . . . . . . . . . . . . . 264 0.8 0.9 0.7 63.4 Kansas . . . . . . . . . . . . . . . . . . . . . . . . . . . . . . . 232 0.8 0.8 0.9 56.2 Minnesota6 . . . . . . . . . . . . . . . . . . . . . . . . . . . . . 262 1.9 1.5 2.4 47.9 Missouri . . . . . . . . . . . . . . . . . . . . . . . . . . . . . . . 188 1.2 1.3 1.0 66.5 Remainder states (NE,ND,SD) . . . . . . . . . . . . . . . . . 121 1.2 1.4 1.0 67.0
South Atlantic
Florida . . . . . . . . . . . . . . . . . . . . . . . . . . . . . . . . 304 7.0 7.2 6.8 60.9 Georgia . . . . . . . . . . . . . . . . . . . . . . . . . . . . . . . 255 2.8 2.6 3.2 54.2 Maryland . . . . . . . . . . . . . . . . . . . . . . . . . . . . . . 227 2.2 2.1 2.3 57.6 North Carolina6 . . . . . . . . . . . . . . . . . . . . . . . . . . 198 2.2 1.9 2.7 51.6 South Carolina6 . . . . . . . . . . . . . . . . . . . . . . . . . . 188 1.0 0.9 1.3 48.8 Virginia6 . . . . . . . . . . . . . . . . . . . . . . . . . . . . . . . 234 2.4 2.7 2.0 66.5 Remainder states (DC,DE,WV) . . . . . . . . . . . . . . . . . 187 1.0 1.0 1.0 59.7
East South Central
Alabama6 . . . . . . . . . . . . . . . . . . . . . . . . . . . . . . 265 1.4 1.6 0.9 72.8 Kentucky . . . . . . . . . . . . . . . . . . . . . . . . . . . . . . 252 1.2 1.2 1.3 58.5 Mississippi6 . . . . . . . . . . . . . . . . . . . . . . . . . . . . . 252 0.7 0.6 0.8 50.5 Tennessee6 . . . . . . . . . . . . . . . . . . . . . . . . . . . . . 323 2.5 2.7 2.1 66.0
West South Central
Arkansas . . . . . . . . . . . . . . . . . . . . . . . . . . . . . . 225 0.7 0.7 0.7 62.3 Louisiana6 . . . . . . . . . . . . . . . . . . . . . . . . . . . . . . 251 1.4 1.2 1.7 51.0 Oklahoma6 . . . . . . . . . . . . . . . . . . . . . . . . . . . . . 221 0.9 1.1 0.7 70.5 Texas . . . . . . . . . . . . . . . . . . . . . . . . . . . . . . . . 342 7.6 7.3 8.0 57.4
Mountain
Arizona . . . . . . . . . . . . . . . . . . . . . . . . . . . . . . . 277 1.9 2.1 1.6 66.1 Colorado . . . . . . . . . . . . . . . . . . . . . . . . . . . . . . 271 1.8 1.8 1.8 59.5 Utah . . . . . . . . . . . . . . . . . . . . . . . . . . . . . . . . . 257 0.8 0.9 0.6 68.0 Remainder states (ID,NM,MT,NV,WY). . . . . . . . . . . . . 213 2.4 2.1 2.7 53.9
See footnotes at end of table.
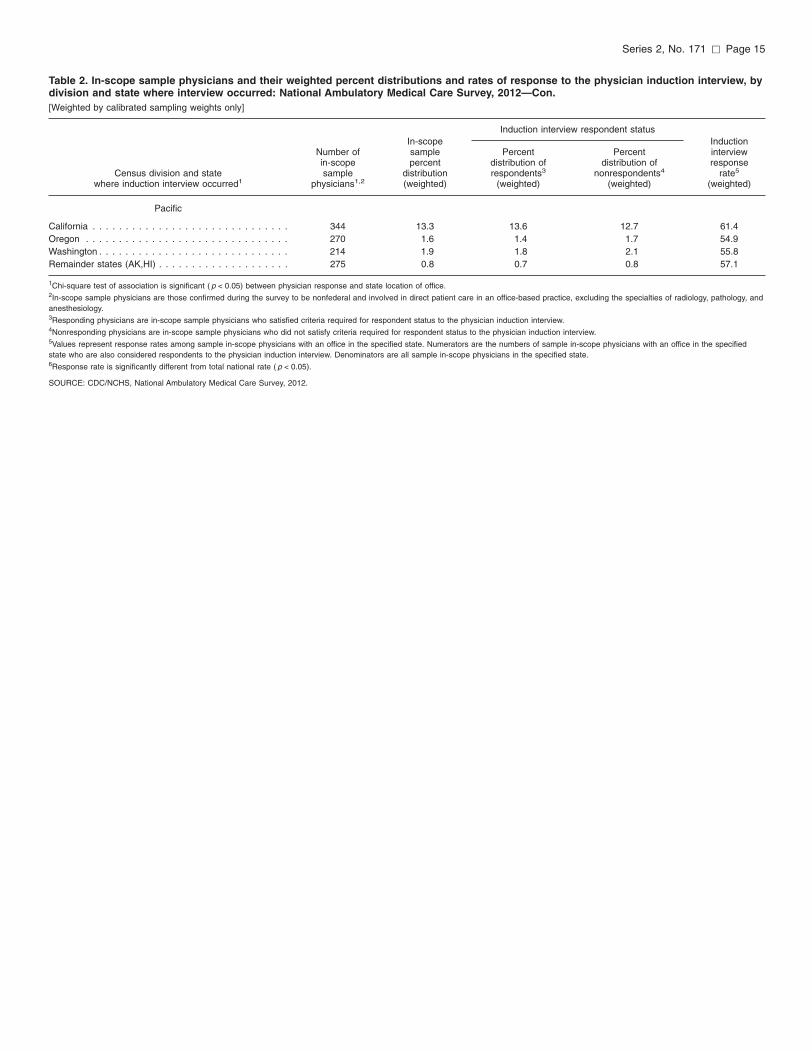
Series 2, No. 171 [ Page 15
Table 2. In-scope sample physicians and their weighted percent distributions and rates of response to the physician induction interview, by division and state where interview occurred: National Ambulatory Medical Care Survey, 2012—Con. [Weighted by calibrated sampling weights only]
Induction interview respondent status In-scope Induction
Number of sample Percent Percent interview in-scope percent distribution of distribution of response
Census division and state sample distribution respondents3 nonrespondents4 rate5
where induction interview occurred1 physicians1,2 (weighted) (weighted) (weighted) (weighted)
Pacific
California . . . . . . . . . . . . . . . . . . . . . . . . . . . . . . 344 13.3 13.6 12.7 61.4 Oregon . . . . . . . . . . . . . . . . . . . . . . . . . . . . . . . 270 1.6 1.4 1.7 54.9 Washington . . . . . . . . . . . . . . . . . . . . . . . . . . . . . 214 1.9 1.8 2.1 55.8 Remainder states (AK,HI) . . . . . . . . . . . . . . . . . . . . 275 0.8 0.7 0.8 57.1
1Chi-square test of association is significant ( p < 0.05) between physician response and state location of office. 2In-scope sample physicians are those confirmed during the survey to be nonfederal and involved in direct patient care in an office-based practice, excluding the specialties of radiology, pathology, and anesthesiology. 3Responding physicians are in-scope sample physicians who satisfied criteria required for respondent status to the physician induction interview. 4Nonresponding physicians are in-scope sample physicians who did not satisfy criteria required for respondent status to the physician induction interview. 5Values represent response rates among sample in-scope physicians with an office in the specified state. Numerators are the numbers of sample in-scope physicians with an office in the specified state who are also considered respondents to the physician induction interview. Denominators are all sample in-scope physicians in the specified state. 6Response rate is significantly different from total national rate ( p < 0.05).
SOURCE: CDC/NCHS, National Ambulatory Medical Care Survey, 2012.
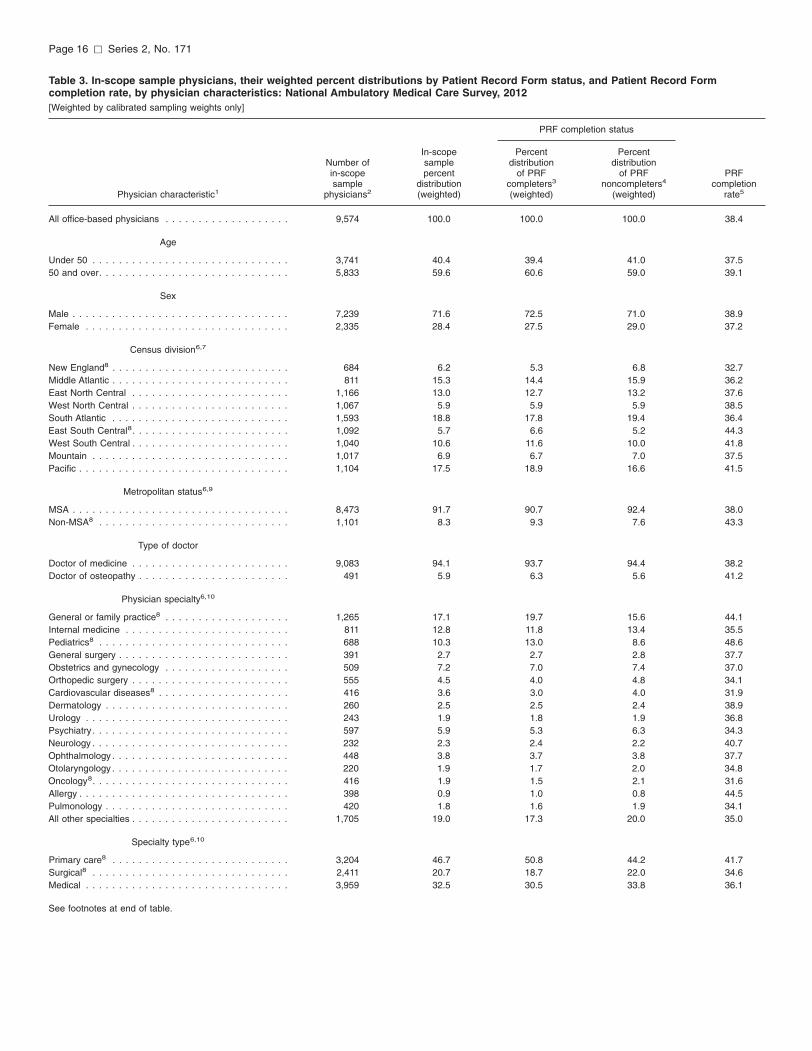
Page 16 [ Series 2, No. 171
Table 3. In-scope sample physicians, their weighted percent distributions by Patient Record Form status, and Patient Record Form completion rate, by physician characteristics: National Ambulatory Medical Care Survey, 2012 [Weighted by calibrated sampling weights only]
PRF completion status
In-scope Percent Percent Number of sample distribution distribution in-scope percent of PRF of PRF PRF sample distribution completers3 noncompleters4 completion
Physician characteristic1 physicians2 (weighted) (weighted) (weighted) rate5
All office-based physicians . . . . . . . . . . . . . . . . . . . 9,574 100.0 100.0 100.0 38.4
Age
Under 50 . . . . . . . . . . . . . . . . . . . . . . . . . . . . . . 3,741 40.4 39.4 41.0 37.5 50 and over. . . . . . . . . . . . . . . . . . . . . . . . . . . . . 5,833 59.6 60.6 59.0 39.1
Sex
Male . . . . . . . . . . . . . . . . . . . . . . . . . . . . . . . . . 7,239 71.6 72.5 71.0 38.9 Female . . . . . . . . . . . . . . . . . . . . . . . . . . . . . . . 2,335 28.4 27.5 29.0 37.2
Census division6,7
New England8 . . . . . . . . . . . . . . . . . . . . . . . . . . . 684 6.2 5.3 6.8 32.7 Middle Atlantic . . . . . . . . . . . . . . . . . . . . . . . . . . . 811 15.3 14.4 15.9 36.2 East North Central . . . . . . . . . . . . . . . . . . . . . . . . 1,166 13.0 12.7 13.2 37.6 West North Central . . . . . . . . . . . . . . . . . . . . . . . . 1,067 5.9 5.9 5.9 38.5 South Atlantic . . . . . . . . . . . . . . . . . . . . . . . . . . . 1,593 18.8 17.8 19.4 36.4 East South Central8 . . . . . . . . . . . . . . . . . . . . . . . . 1,092 5.7 6.6 5.2 44.3 West South Central . . . . . . . . . . . . . . . . . . . . . . . . 1,040 10.6 11.6 10.0 41.8 Mountain . . . . . . . . . . . . . . . . . . . . . . . . . . . . . . 1,017 6.9 6.7 7.0 37.5 Pacific . . . . . . . . . . . . . . . . . . . . . . . . . . . . . . . . 1,104 17.5 18.9 16.6 41.5
Metropolitan status6,9
MSA . . . . . . . . . . . . . . . . . . . . . . . . . . . . . . . . . 8,473 91.7 90.7 92.4 38.0 Non-MSA8 . . . . . . . . . . . . . . . . . . . . . . . . . . . . . 1,101 8.3 9.3 7.6 43.3
Type of doctor
Doctor of medicine . . . . . . . . . . . . . . . . . . . . . . . . 9,083 94.1 93.7 94.4 38.2 Doctor of osteopathy . . . . . . . . . . . . . . . . . . . . . . . 491 5.9 6.3 5.6 41.2
Physician specialty6,10
General or family practice8 . . . . . . . . . . . . . . . . . . . 1,265 17.1 19.7 15.6 44.1 Internal medicine . . . . . . . . . . . . . . . . . . . . . . . . . 811 12.8 11.8 13.4 35.5 Pediatrics8 . . . . . . . . . . . . . . . . . . . . . . . . . . . . . 688 10.3 13.0 8.6 48.6 General surgery . . . . . . . . . . . . . . . . . . . . . . . . . . 391 2.7 2.7 2.8 37.7 Obstetrics and gynecology . . . . . . . . . . . . . . . . . . . 509 7.2 7.0 7.4 37.0 Orthopedic surgery . . . . . . . . . . . . . . . . . . . . . . . . 555 4.5 4.0 4.8 34.1 Cardiovascular diseases8 . . . . . . . . . . . . . . . . . . . . 416 3.6 3.0 4.0 31.9 Dermatology . . . . . . . . . . . . . . . . . . . . . . . . . . . . 260 2.5 2.5 2.4 38.9 Urology . . . . . . . . . . . . . . . . . . . . . . . . . . . . . . . 243 1.9 1.8 1.9 36.8 Psychiatry . . . . . . . . . . . . . . . . . . . . . . . . . . . . . . 597 5.9 5.3 6.3 34.3 Neurology . . . . . . . . . . . . . . . . . . . . . . . . . . . . . . 232 2.3 2.4 2.2 40.7 Ophthalmology . . . . . . . . . . . . . . . . . . . . . . . . . . . 448 3.8 3.7 3.8 37.7 Otolaryngology . . . . . . . . . . . . . . . . . . . . . . . . . . . 220 1.9 1.7 2.0 34.8 Oncology8 . . . . . . . . . . . . . . . . . . . . . . . . . . . . . . 416 1.9 1.5 2.1 31.6 Allergy . . . . . . . . . . . . . . . . . . . . . . . . . . . . . . . . 398 0.9 1.0 0.8 44.5 Pulmonology . . . . . . . . . . . . . . . . . . . . . . . . . . . . 420 1.8 1.6 1.9 34.1 All other specialties . . . . . . . . . . . . . . . . . . . . . . . . 1,705 19.0 17.3 20.0 35.0
Specialty type6,10
Primary care8 . . . . . . . . . . . . . . . . . . . . . . . . . . . 3,204 46.7 50.8 44.2 41.7 Surgical8 . . . . . . . . . . . . . . . . . . . . . . . . . . . . . . 2,411 20.7 18.7 22.0 34.6 Medical . . . . . . . . . . . . . . . . . . . . . . . . . . . . . . . 3,959 32.5 30.5 33.8 36.1
See footnotes at end of table.
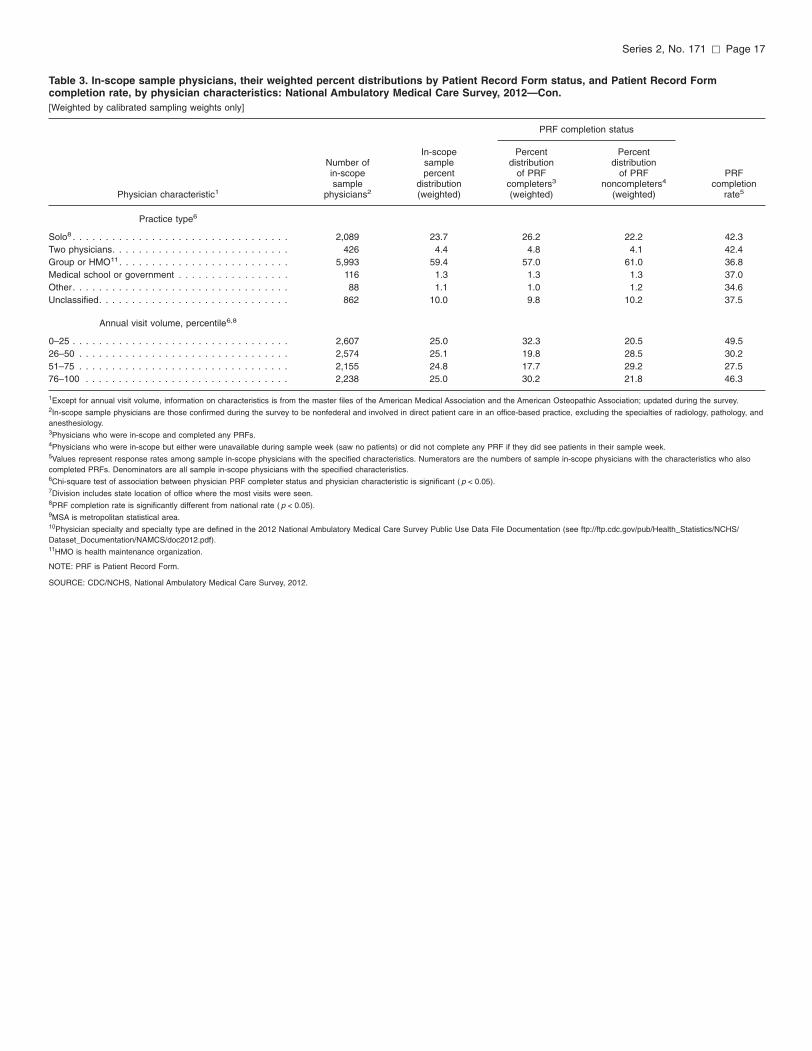
Series 2, No. 171 [ Page 17
Table 3. In-scope sample physicians, their weighted percent distributions by Patient Record Form status, and Patient Record Form completion rate, by physician characteristics: National Ambulatory Medical Care Survey, 2012—Con. [Weighted by calibrated sampling weights only]
PRF completion status
In-scope Percent Percent Number of sample distribution distribution in-scope percent of PRF of PRF PRF sample distribution completers3 noncompleters4 completion
Physician characteristic1 physicians2 (weighted) (weighted) (weighted) rate5
Practice type6
Solo8 . . . . . . . . . . . . . . . . . . . . . . . . . . . . . . . . . 2,089 23.7 26.2 22.2 42.3 Two physicians. . . . . . . . . . . . . . . . . . . . . . . . . . . 426 4.4 4.8 4.1 42.4 Group or HMO11 . . . . . . . . . . . . . . . . . . . . . . . . . . 5,993 59.4 57.0 61.0 36.8 Medical school or government . . . . . . . . . . . . . . . . . 116 1.3 1.3 1.3 37.0 Other. . . . . . . . . . . . . . . . . . . . . . . . . . . . . . . . . 88 1.1 1.0 1.2 34.6 Unclassified. . . . . . . . . . . . . . . . . . . . . . . . . . . . . 862 10.0 9.8 10.2 37.5
Annual visit volume, percentile6,8
0–25 . . . . . . . . . . . . . . . . . . . . . . . . . . . . . . . . . 2,607 25.0 32.3 20.5 49.5 26–50 . . . . . . . . . . . . . . . . . . . . . . . . . . . . . . . . 2,574 25.1 19.8 28.5 30.2 51–75 . . . . . . . . . . . . . . . . . . . . . . . . . . . . . . . . 2,155 24.8 17.7 29.2 27.5 76–100 . . . . . . . . . . . . . . . . . . . . . . . . . . . . . . . 2,238 25.0 30.2 21.8 46.3
1Except for annual visit volume, information on characteristics is from the master files of the American Medical Association and the American Osteopathic Association; updated during the survey. 2In-scope sample physicians are those confirmed during the survey to be nonfederal and involved in direct patient care in an office-based practice, excluding the specialties of radiology, pathology, and anesthesiology. 3Physicians who were in-scope and completed any PRFs. 4Physicians who were in-scope but either were unavailable during sample week (saw no patients) or did not complete any PRF if they did see patients in their sample week. 5Values represent response rates among sample in-scope physicians with the specified characteristics. Numerators are the numbers of sample in-scope physicians with the characteristics who also completed PRFs. Denominators are all sample in-scope physicians with the specified characteristics. 6Chi-square test of association between physician PRF completer status and physician characteristic is significant ( p < 0.05). 7Division includes state location of office where the most visits were seen. 8PRF completion rate is significantly different from national rate ( p < 0.05). 9MSA is metropolitan statistical area. 10Physician specialty and specialty type are defined in the 2012 National Ambulatory Medical Care Survey Public Use Data File Documentation (see ftp://ftp.cdc.gov/pub/Health_Statistics/NCHS/ Dataset_Documentation/NAMCS/doc2012.pdf). 11HMO is health maintenance organization.
NOTE: PRF is Patient Record Form.
SOURCE: CDC/NCHS, National Ambulatory Medical Care Survey, 2012.
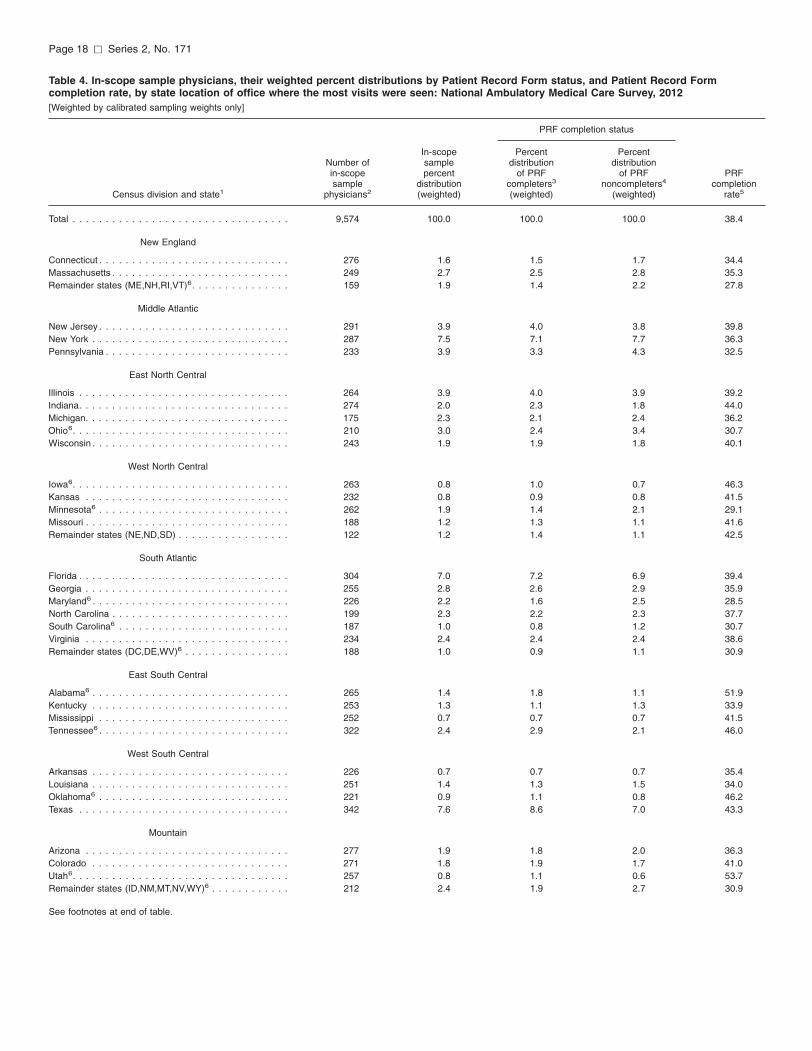
Page 18 [ Series 2, No. 171
Table 4. In-scope sample physicians, their weighted percent distributions by Patient Record Form status, and Patient Record Form completion rate, by state location of office where the most visits were seen: National Ambulatory Medical Care Survey, 2012 [Weighted by calibrated sampling weights only]
PRF completion status
Census division and state1
Number of in-scope sample
physicians2
In-scope sample percent
distribution (weighted)
Percent distribution
of PRF completers3
(weighted)
Percent distribution
of PRF noncompleters4
(weighted)
PRF completion
rate5
Total . . . . . . . . . . . . . . . . . . . . . . . . . . . . . . . . . 9,574 100.0 100.0 100.0 38.4
New England
Connecticut . . . . . . . . . . . . . . . . . . . . . . . . . . . . . 276 1.6 1.5 1.7 34.4 Massachusetts . . . . . . . . . . . . . . . . . . . . . . . . . . . 249 2.7 2.5 2.8 35.3 Remainder states (ME,NH,RI,VT)6 . . . . . . . . . . . . . . . 159 1.9 1.4 2.2 27.8
Middle Atlantic
New Jersey . . . . . . . . . . . . . . . . . . . . . . . . . . . . . 291 3.9 4.0 3.8 39.8 New York . . . . . . . . . . . . . . . . . . . . . . . . . . . . . . 287 7.5 7.1 7.7 36.3 Pennsylvania . . . . . . . . . . . . . . . . . . . . . . . . . . . . 233 3.9 3.3 4.3 32.5
East North Central
Illinois . . . . . . . . . . . . . . . . . . . . . . . . . . . . . . . . 264 3.9 4.0 3.9 39.2 Indiana. . . . . . . . . . . . . . . . . . . . . . . . . . . . . . . . 274 2.0 2.3 1.8 44.0 Michigan. . . . . . . . . . . . . . . . . . . . . . . . . . . . . . . 175 2.3 2.1 2.4 36.2 Ohio6 . . . . . . . . . . . . . . . . . . . . . . . . . . . . . . . . . 210 3.0 2.4 3.4 30.7 Wisconsin . . . . . . . . . . . . . . . . . . . . . . . . . . . . . . 243 1.9 1.9 1.8 40.1
West North Central
Iowa6 . . . . . . . . . . . . . . . . . . . . . . . . . . . . . . . . . 263 0.8 1.0 0.7 46.3 Kansas . . . . . . . . . . . . . . . . . . . . . . . . . . . . . . . 232 0.8 0.9 0.8 41.5 Minnesota6 . . . . . . . . . . . . . . . . . . . . . . . . . . . . . 262 1.9 1.4 2.1 29.1 Missouri . . . . . . . . . . . . . . . . . . . . . . . . . . . . . . . 188 1.2 1.3 1.1 41.6 Remainder states (NE,ND,SD) . . . . . . . . . . . . . . . . . 122 1.2 1.4 1.1 42.5
South Atlantic
Florida . . . . . . . . . . . . . . . . . . . . . . . . . . . . . . . . 304 7.0 7.2 6.9 39.4 Georgia . . . . . . . . . . . . . . . . . . . . . . . . . . . . . . . 255 2.8 2.6 2.9 35.9 Maryland6 . . . . . . . . . . . . . . . . . . . . . . . . . . . . . . 226 2.2 1.6 2.5 28.5 North Carolina . . . . . . . . . . . . . . . . . . . . . . . . . . . 199 2.3 2.2 2.3 37.7 South Carolina6 . . . . . . . . . . . . . . . . . . . . . . . . . . 187 1.0 0.8 1.2 30.7 Virginia . . . . . . . . . . . . . . . . . . . . . . . . . . . . . . . 234 2.4 2.4 2.4 38.6 Remainder states (DC,DE,WV)6 . . . . . . . . . . . . . . . . 188 1.0 0.9 1.1 30.9
East South Central
Alabama6 . . . . . . . . . . . . . . . . . . . . . . . . . . . . . . 265 1.4 1.8 1.1 51.9 Kentucky . . . . . . . . . . . . . . . . . . . . . . . . . . . . . . 253 1.3 1.1 1.3 33.9 Mississippi . . . . . . . . . . . . . . . . . . . . . . . . . . . . . 252 0.7 0.7 0.7 41.5 Tennessee6 . . . . . . . . . . . . . . . . . . . . . . . . . . . . . 322 2.4 2.9 2.1 46.0
West South Central
Arkansas . . . . . . . . . . . . . . . . . . . . . . . . . . . . . . 226 0.7 0.7 0.7 35.4 Louisiana . . . . . . . . . . . . . . . . . . . . . . . . . . . . . . 251 1.4 1.3 1.5 34.0 Oklahoma6 . . . . . . . . . . . . . . . . . . . . . . . . . . . . . 221 0.9 1.1 0.8 46.2 Texas . . . . . . . . . . . . . . . . . . . . . . . . . . . . . . . . 342 7.6 8.6 7.0 43.3
Mountain
Arizona . . . . . . . . . . . . . . . . . . . . . . . . . . . . . . . 277 1.9 1.8 2.0 36.3 Colorado . . . . . . . . . . . . . . . . . . . . . . . . . . . . . . 271 1.8 1.9 1.7 41.0 Utah6 . . . . . . . . . . . . . . . . . . . . . . . . . . . . . . . . . 257 0.8 1.1 0.6 53.7 Remainder states (ID,NM,MT,NV,WY)6 . . . . . . . . . . . . 212 2.4 1.9 2.7 30.9
See footnotes at end of table.
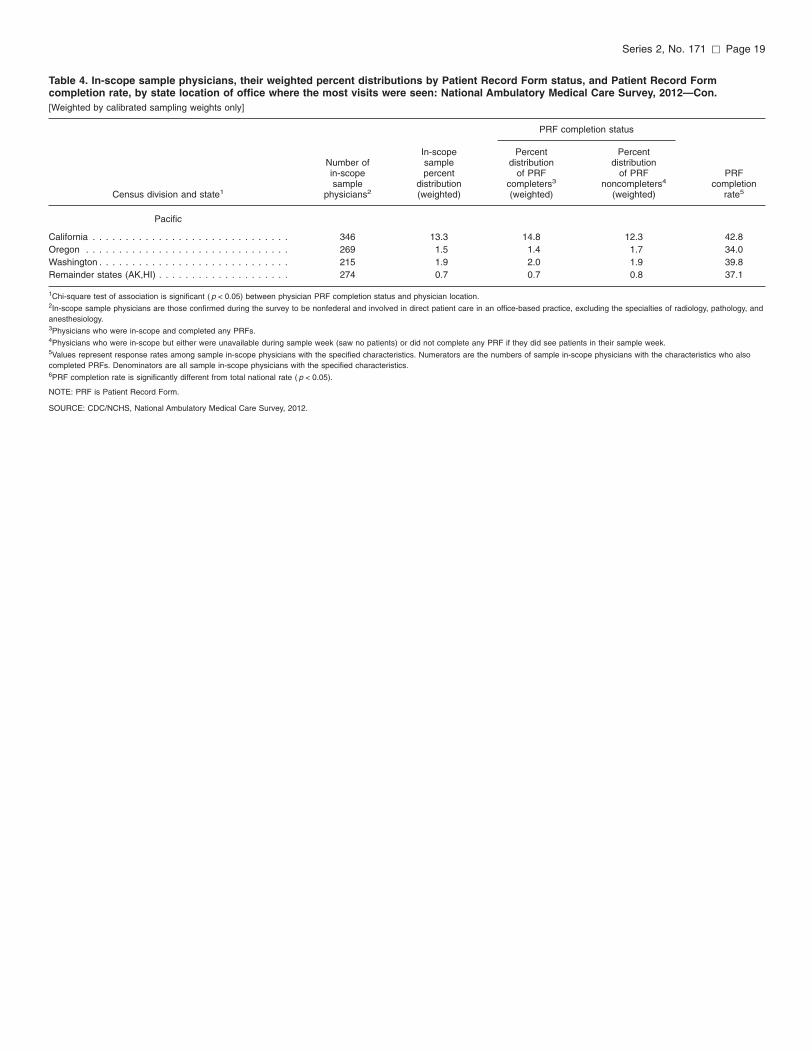
Series 2, No. 171 [ Page 19
Table 4. In-scope sample physicians, their weighted percent distributions by Patient Record Form status, and Patient Record Form completion rate, by state location of office where the most visits were seen: National Ambulatory Medical Care Survey, 2012—Con. [Weighted by calibrated sampling weights only]
PRF completion status
Census division and state1
Number of in-scope sample
physicians2
In-scope sample percent
distribution (weighted)
Percent distribution
of PRF completers3
(weighted)
Percent distribution
of PRF noncompleters4
(weighted)
PRF completion
rate5
Pacific
California . . . . . . . . . . . . . . . . . . . . . . . . . . . . . . 346 13.3 14.8 12.3 42.8 Oregon . . . . . . . . . . . . . . . . . . . . . . . . . . . . . . . 269 1.5 1.4 1.7 34.0 Washington . . . . . . . . . . . . . . . . . . . . . . . . . . . . . 215 1.9 2.0 1.9 39.8 Remainder states (AK,HI) . . . . . . . . . . . . . . . . . . . . 274 0.7 0.7 0.8 37.1
1Chi-square test of association is significant ( p < 0.05) between physician PRF completion status and physician location. 2In-scope sample physicians are those confirmed during the survey to be nonfederal and involved in direct patient care in an office-based practice, excluding the specialties of radiology, pathology, and anesthesiology. 3Physicians who were in-scope and completed any PRFs. 4Physicians who were in-scope but either were unavailable during sample week (saw no patients) or did not complete any PRF if they did see patients in their sample week. 5Values represent response rates among sample in-scope physicians with the specified characteristics. Numerators are the numbers of sample in-scope physicians with the characteristics who also completed PRFs. Denominators are all sample in-scope physicians with the specified characteristics. 6PRF completion rate is significantly different from total national rate ( p < 0.05).
NOTE: PRF is Patient Record Form.
SOURCE: CDC/NCHS, National Ambulatory Medical Care Survey, 2012.
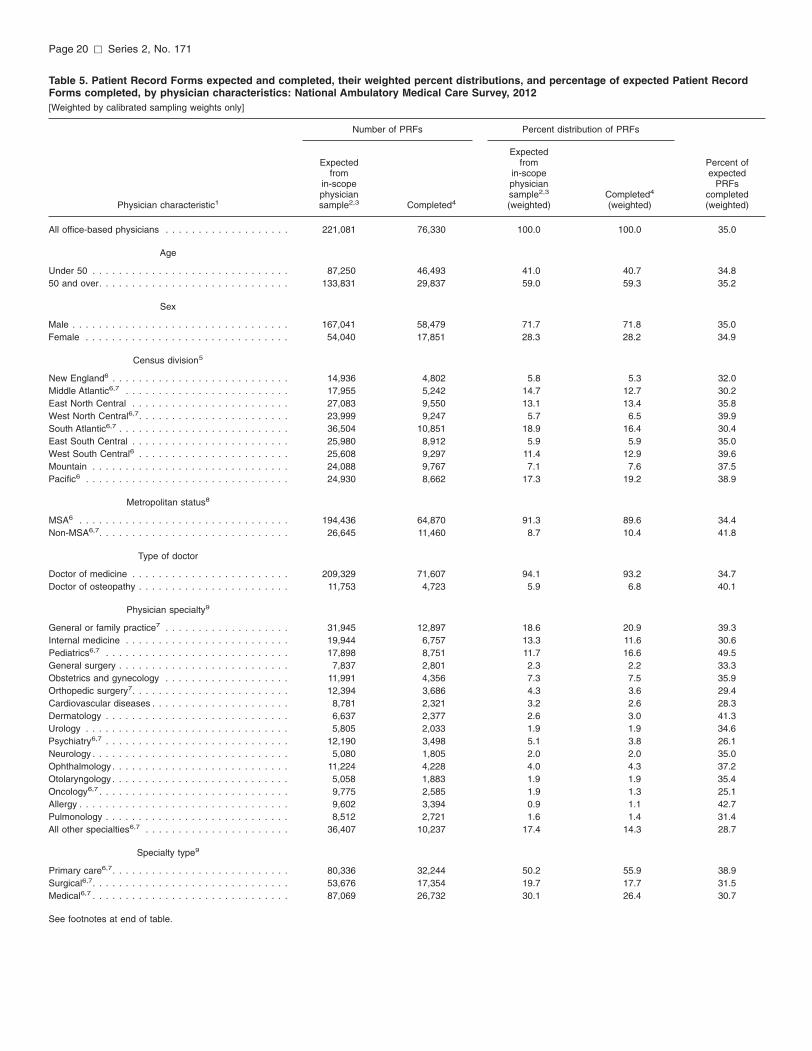
Page 20 [ Series 2, No. 171
Table 5. Patient Record Forms expected and completed, their weighted percent distributions, and percentage of expected Patient Record Forms completed, by physician characteristics: National Ambulatory Medical Care Survey, 2012 [Weighted by calibrated sampling weights only]
Number of PRFs Percent distribution of PRFs
Physician characteristic1
Expected from
in-scope physician sample2,3 Completed4
Expected from
in-scope physician sample2,3
(weighted) Completed4
(weighted)
Percent of expected
PRFs completed (weighted)
All office-based physicians . . . . . . . . . . . . . . . . . . . 221,081 76,330 100.0 100.0 35.0
Age
Under 50 . . . . . . . . . . . . . . . . . . . . . . . . . . . . . . 87,250 46,493 41.0 40.7 34.8 50 and over. . . . . . . . . . . . . . . . . . . . . . . . . . . . . 133,831 29,837 59.0 59.3 35.2
Sex
Male . . . . . . . . . . . . . . . . . . . . . . . . . . . . . . . . . 167,041 58,479 71.7 71.8 35.0 Female . . . . . . . . . . . . . . . . . . . . . . . . . . . . . . . 54,040 17,851 28.3 28.2 34.9
Census division5
New England6 . . . . . . . . . . . . . . . . . . . . . . . . . . . 14,936 4,802 5.8 5.3 32.0 Middle Atlantic6,7 . . . . . . . . . . . . . . . . . . . . . . . . . 17,955 5,242 14.7 12.7 30.2 East North Central . . . . . . . . . . . . . . . . . . . . . . . . 27,083 9,550 13.1 13.4 35.8 West North Central6,7 . . . . . . . . . . . . . . . . . . . . . . . 23,999 9,247 5.7 6.5 39.9 South Atlantic6,7 . . . . . . . . . . . . . . . . . . . . . . . . . . 36,504 10,851 18.9 16.4 30.4 East South Central . . . . . . . . . . . . . . . . . . . . . . . . 25,980 8,912 5.9 5.9 35.0 West South Central6 . . . . . . . . . . . . . . . . . . . . . . . 25,608 9,297 11.4 12.9 39.6 Mountain . . . . . . . . . . . . . . . . . . . . . . . . . . . . . . 24,088 9,767 7.1 7.6 37.5 Pacific6 . . . . . . . . . . . . . . . . . . . . . . . . . . . . . . . 24,930 8,662 17.3 19.2 38.9
Metropolitan status8
MSA6 . . . . . . . . . . . . . . . . . . . . . . . . . . . . . . . . 194,436 64,870 91.3 89.6 34.4 Non-MSA6,7 . . . . . . . . . . . . . . . . . . . . . . . . . . . . . 26,645 11,460 8.7 10.4 41.8
Type of doctor
Doctor of medicine . . . . . . . . . . . . . . . . . . . . . . . . 209,329 71,607 94.1 93.2 34.7 Doctor of osteopathy . . . . . . . . . . . . . . . . . . . . . . . 11,753 4,723 5.9 6.8 40.1
Physician specialty9
General or family practice7 . . . . . . . . . . . . . . . . . . . 31,945 12,897 18.6 20.9 39.3 Internal medicine . . . . . . . . . . . . . . . . . . . . . . . . . 19,944 6,757 13.3 11.6 30.6 Pediatrics6,7 . . . . . . . . . . . . . . . . . . . . . . . . . . . . 17,898 8,751 11.7 16.6 49.5 General surgery . . . . . . . . . . . . . . . . . . . . . . . . . . 7,837 2,801 2.3 2.2 33.3 Obstetrics and gynecology . . . . . . . . . . . . . . . . . . . 11,991 4,356 7.3 7.5 35.9 Orthopedic surgery7 . . . . . . . . . . . . . . . . . . . . . . . . 12,394 3,686 4.3 3.6 29.4 Cardiovascular diseases . . . . . . . . . . . . . . . . . . . . . 8,781 2,321 3.2 2.6 28.3 Dermatology . . . . . . . . . . . . . . . . . . . . . . . . . . . . 6,637 2,377 2.6 3.0 41.3 Urology . . . . . . . . . . . . . . . . . . . . . . . . . . . . . . . 5,805 2,033 1.9 1.9 34.6 Psychiatry6,7 . . . . . . . . . . . . . . . . . . . . . . . . . . . . 12,190 3,498 5.1 3.8 26.1 Neurology . . . . . . . . . . . . . . . . . . . . . . . . . . . . . . 5,080 1,805 2.0 2.0 35.0 Ophthalmology . . . . . . . . . . . . . . . . . . . . . . . . . . . 11,224 4,228 4.0 4.3 37.2 Otolaryngology . . . . . . . . . . . . . . . . . . . . . . . . . . . 5,058 1,883 1.9 1.9 35.4 Oncology6,7 . . . . . . . . . . . . . . . . . . . . . . . . . . . . . 9,775 2,585 1.9 1.3 25.1 Allergy . . . . . . . . . . . . . . . . . . . . . . . . . . . . . . . . 9,602 3,394 0.9 1.1 42.7 Pulmonology . . . . . . . . . . . . . . . . . . . . . . . . . . . . 8,512 2,721 1.6 1.4 31.4 All other specialties6,7 . . . . . . . . . . . . . . . . . . . . . . 36,407 10,237 17.4 14.3 28.7
Specialty type9
Primary care6,7 . . . . . . . . . . . . . . . . . . . . . . . . . . . 80,336 32,244 50.2 55.9 38.9 Surgical6,7 . . . . . . . . . . . . . . . . . . . . . . . . . . . . . . 53,676 17,354 19.7 17.7 31.5 Medical6,7 . . . . . . . . . . . . . . . . . . . . . . . . . . . . . . 87,069 26,732 30.1 26.4 30.7
See footnotes at end of table.
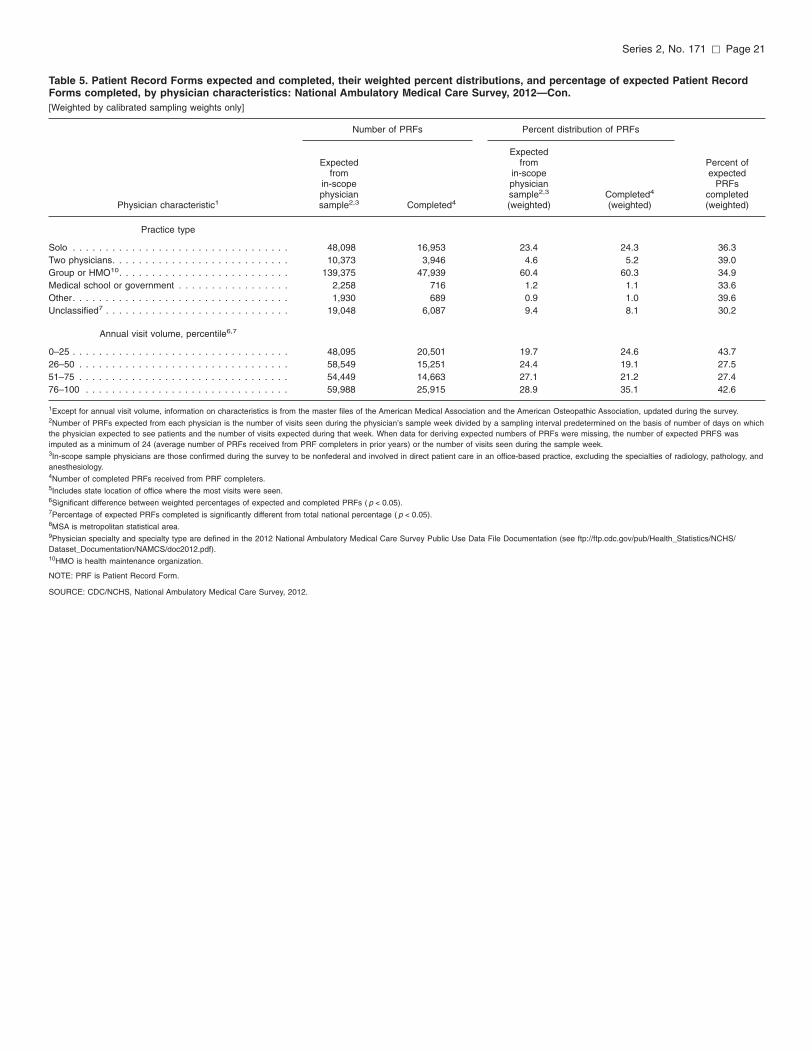
Series 2, No. 171 [ Page 21
Table 5. Patient Record Forms expected and completed, their weighted percent distributions, and percentage of expected Patient Record Forms completed, by physician characteristics: National Ambulatory Medical Care Survey, 2012—Con. [Weighted by calibrated sampling weights only]
Number of PRFs Percent distribution of PRFs
Physician characteristic1
Expected from
in-scope physician sample2,3 Completed4
Expected from
in-scope physician sample2,3
(weighted) Completed4
(weighted)
Percent of expected
PRFs completed (weighted)
Practice type
Solo . . . . . . . . . . . . . . . . . . . . . . . . . . . . . . . . . 48,098 16,953 23.4 24.3 36.3 Two physicians. . . . . . . . . . . . . . . . . . . . . . . . . . . 10,373 3,946 4.6 5.2 39.0 Group or HMO10 . . . . . . . . . . . . . . . . . . . . . . . . . . 139,375 47,939 60.4 60.3 34.9 Medical school or government . . . . . . . . . . . . . . . . . 2,258 716 1.2 1.1 33.6 Other. . . . . . . . . . . . . . . . . . . . . . . . . . . . . . . . . 1,930 689 0.9 1.0 39.6 Unclassified7 . . . . . . . . . . . . . . . . . . . . . . . . . . . . 19,048 6,087 9.4 8.1 30.2
Annual visit volume, percentile6,7
0–25 . . . . . . . . . . . . . . . . . . . . . . . . . . . . . . . . . 48,095 20,501 19.7 24.6 43.7 26–50 . . . . . . . . . . . . . . . . . . . . . . . . . . . . . . . . 58,549 15,251 24.4 19.1 27.5 51–75 . . . . . . . . . . . . . . . . . . . . . . . . . . . . . . . . 54,449 14,663 27.1 21.2 27.4 76–100 . . . . . . . . . . . . . . . . . . . . . . . . . . . . . . . 59,988 25,915 28.9 35.1 42.6
1Except for annual visit volume, information on characteristics is from the master files of the American Medical Association and the American Osteopathic Association, updated during the survey. 2Number of PRFs expected from each physician is the number of visits seen during the physician’s sample week divided by a sampling interval predetermined on the basis of number of days on which the physician expected to see patients and the number of visits expected during that week. When data for deriving expected numbers of PRFs were missing, the number of expected PRFS was imputed as a minimum of 24 (average number of PRFs received from PRF completers in prior years) or the number of visits seen during the sample week. 3In-scope sample physicians are those confirmed during the survey to be nonfederal and involved in direct patient care in an office-based practice, excluding the specialties of radiology, pathology, and anesthesiology. 4Number of completed PRFs received from PRF completers. 5Includes state location of office where the most visits were seen. 6Significant difference between weighted percentages of expected and completed PRFs ( p < 0.05). 7Percentage of expected PRFs completed is significantly different from total national percentage ( p < 0.05). 8MSA is metropolitan statistical area. 9Physician specialty and specialty type are defined in the 2012 National Ambulatory Medical Care Survey Public Use Data File Documentation (see ftp://ftp.cdc.gov/pub/Health_Statistics/NCHS/ Dataset_Documentation/NAMCS/doc2012.pdf). 10HMO is health maintenance organization.
NOTE: PRF is Patient Record Form.
SOURCE: CDC/NCHS, National Ambulatory Medical Care Survey, 2012.
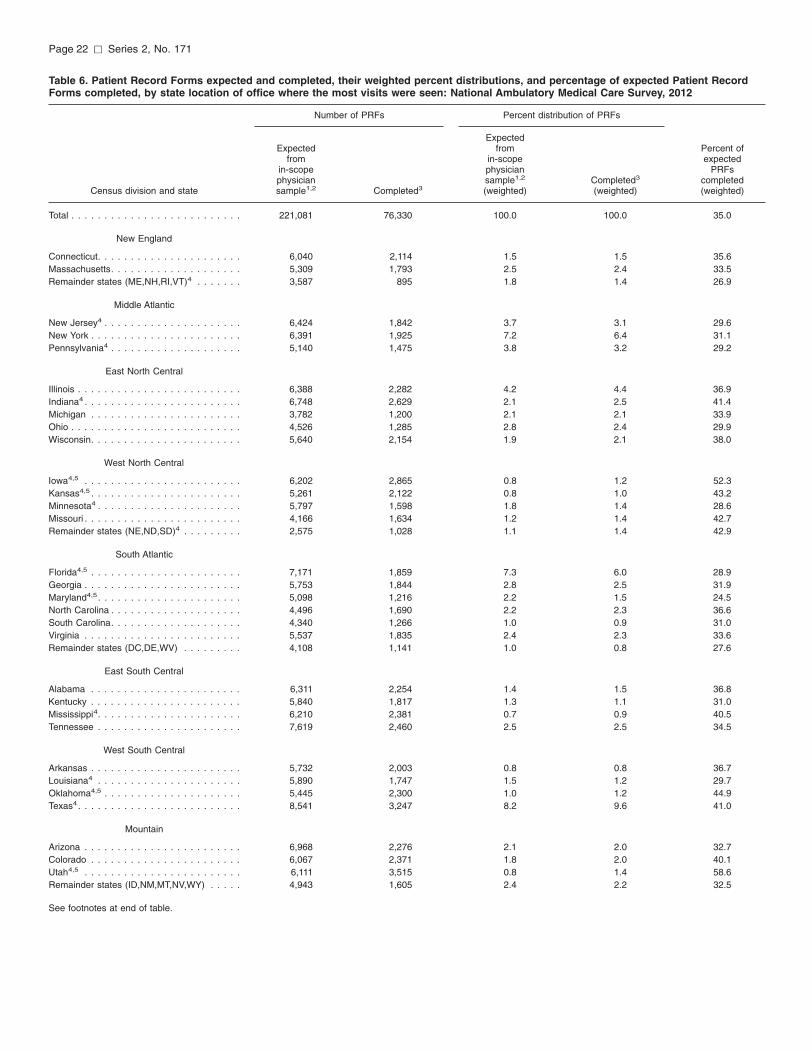
Page 22 [ Series 2, No. 171
Table 6. Patient Record Forms expected and completed, their weighted percent distributions, and percentage of expected Patient Record Forms completed, by state location of office where the most visits were seen: National Ambulatory Medical Care Survey, 2012
Number of PRFs Percent distribution of PRFs
Census division and state
Expected from
in-scope physician sample1,2 Completed3
Expected from
in-scope physician sample1,2
(weighted) Completed3
(weighted)
Percent of expected
PRFs completed (weighted)
Total . . . . . . . . . . . . . . . . . . . . . . . . . . 221,081 76,330 100.0 100.0 35.0
New England
Connecticut. . . . . . . . . . . . . . . . . . . . . . Massachusetts. . . . . . . . . . . . . . . . . . . . Remainder states (ME,NH,RI,VT)4 . . . . . . .
6,040 5,309 3,587
2,114 1,793
895
1.5 2.5 1.8
1.5 2.4 1.4
35.6 33.5 26.9
Middle Atlantic
New Jersey4 . . . . . . . . . . . . . . . . . . . . . New York . . . . . . . . . . . . . . . . . . . . . . . Pennsylvania4 . . . . . . . . . . . . . . . . . . . .
6,424 6,391 5,140
1,842 1,925 1,475
3.7 7.2 3.8
3.1 6.4 3.2
29.6 31.1 29.2
East North Central
Illinois . . . . . . . . . . . . . . . . . . . . . . . . . Indiana4 . . . . . . . . . . . . . . . . . . . . . . . . Michigan . . . . . . . . . . . . . . . . . . . . . . . Ohio . . . . . . . . . . . . . . . . . . . . . . . . . . Wisconsin. . . . . . . . . . . . . . . . . . . . . . .
6,388 6,748 3,782 4,526 5,640
2,282 2,629 1,200 1,285 2,154
4.2 2.1 2.1 2.8 1.9
4.4 2.5 2.1 2.4 2.1
36.9 41.4 33.9 29.9 38.0
West North Central
Iowa4,5 . . . . . . . . . . . . . . . . . . . . . . . . Kansas4,5 . . . . . . . . . . . . . . . . . . . . . . . Minnesota4 . . . . . . . . . . . . . . . . . . . . . . Missouri . . . . . . . . . . . . . . . . . . . . . . . . Remainder states (NE,ND,SD)4 . . . . . . . . .
6,202 5,261 5,797 4,166 2,575
2,865 2,122 1,598 1,634 1,028
0.8 0.8 1.8 1.2 1.1
1.2 1.0 1.4 1.4 1.4
52.3 43.2 28.6 42.7 42.9
South Atlantic
Florida4,5 . . . . . . . . . . . . . . . . . . . . . . . Georgia . . . . . . . . . . . . . . . . . . . . . . . . Maryland4,5 . . . . . . . . . . . . . . . . . . . . . . North Carolina . . . . . . . . . . . . . . . . . . . . South Carolina. . . . . . . . . . . . . . . . . . . . Virginia . . . . . . . . . . . . . . . . . . . . . . . . Remainder states (DC,DE,WV) . . . . . . . . .
7,171 5,753 5,098 4,496 4,340 5,537 4,108
1,859 1,844 1,216 1,690 1,266 1,835 1,141
7.3 2.8 2.2 2.2 1.0 2.4 1.0
6.0 2.5 1.5 2.3 0.9 2.3 0.8
28.9 31.9 24.5 36.6 31.0 33.6 27.6
East South Central
Alabama . . . . . . . . . . . . . . . . . . . . . . . Kentucky . . . . . . . . . . . . . . . . . . . . . . . Mississippi4 . . . . . . . . . . . . . . . . . . . . . . Tennessee . . . . . . . . . . . . . . . . . . . . . .
6,311 5,840 6,210 7,619
2,254 1,817 2,381 2,460
1.4 1.3 0.7 2.5
1.5 1.1 0.9 2.5
36.8 31.0 40.5 34.5
West South Central
Arkansas . . . . . . . . . . . . . . . . . . . . . . . Louisiana4 . . . . . . . . . . . . . . . . . . . . . . Oklahoma4,5 . . . . . . . . . . . . . . . . . . . . . Texas4 . . . . . . . . . . . . . . . . . . . . . . . . .
5,732 5,890 5,445 8,541
2,003 1,747 2,300 3,247
0.8 1.5 1.0 8.2
0.8 1.2 1.2 9.6
36.7 29.7 44.9 41.0
Mountain
Arizona . . . . . . . . . . . . . . . . . . . . . . . . Colorado . . . . . . . . . . . . . . . . . . . . . . . Utah4,5 . . . . . . . . . . . . . . . . . . . . . . . . Remainder states (ID,NM,MT,NV,WY) . . . . .
6,968 6,067 6,111 4,943
2,276 2,371 3,515 1,605
2.1 1.8 0.8 2.4
2.0 2.0 1.4 2.2
32.7 40.1 58.6 32.5
See footnotes at end of table.
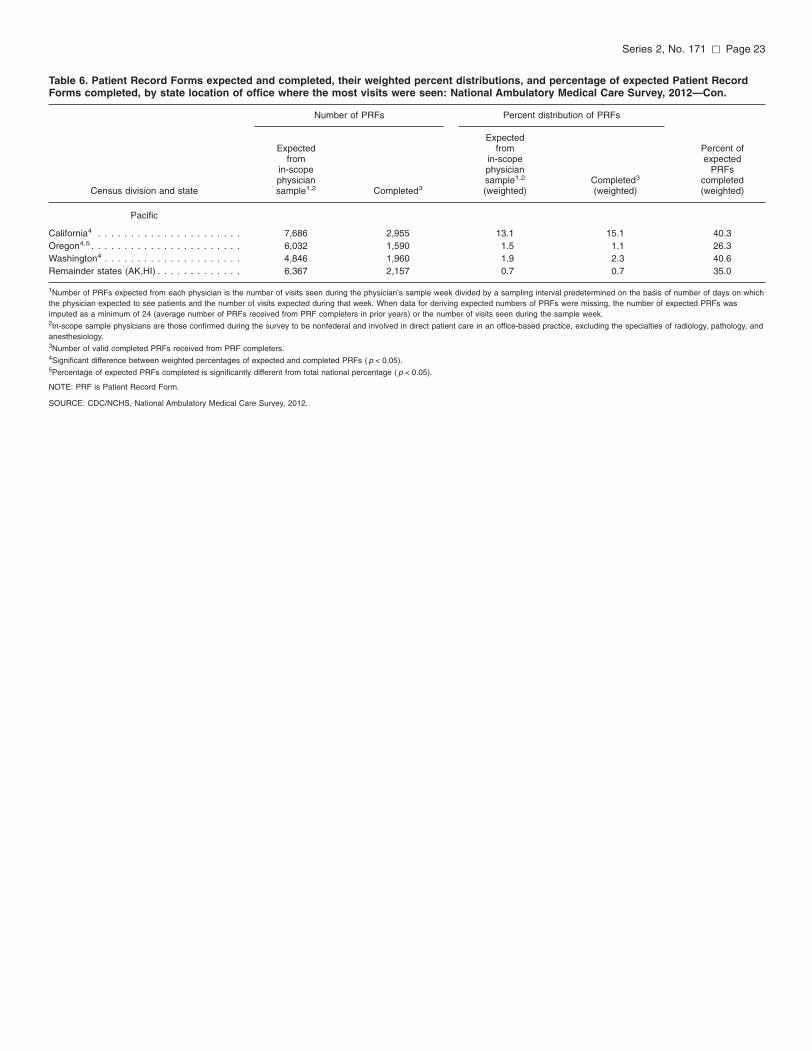
Series 2, No. 171 [ Page 23
Table 6. Patient Record Forms expected and completed, their weighted percent distributions, and percentage of expected Patient Record Forms completed, by state location of office where the most visits were seen: National Ambulatory Medical Care Survey, 2012—Con.
Number of PRFs Percent distribution of PRFs
Census division and state
Expected from
in-scope physician sample1,2 Completed3
Expected from
in-scope physician sample1,2
(weighted) Completed3
(weighted)
Percent of expected
PRFs completed (weighted)
Pacific
California4 . . . . . . . . . . . . . . . . . . . . . . Oregon4,5 . . . . . . . . . . . . . . . . . . . . . . . Washington4 . . . . . . . . . . . . . . . . . . . . . Remainder states (AK,HI) . . . . . . . . . . . . .
7,686 6,032 4,846 6,367
2,955 1,590 1,960 2,157
13.1 1.5 1.9 0.7
15.1 1.1 2.3 0.7
40.3 26.3 40.6 35.0
1Number of PRFs expected from each physician is the number of visits seen during the physician’s sample week divided by a sampling interval predetermined on the basis of number of days on which the physician expected to see patients and the number of visits expected during that week. When data for deriving expected numbers of PRFs were missing, the number of expected PRFs was imputed as a minimum of 24 (average number of PRFs received from PRF completers in prior years) or the number of visits seen during the sample week. 2In-scope sample physicians are those confirmed during the survey to be nonfederal and involved in direct patient care in an office-based practice, excluding the specialties of radiology, pathology, and anesthesiology. 3Number of valid completed PRFs received from PRF completers. 4Significant difference between weighted percentages of expected and completed PRFs ( p < 0.05). 5Percentage of expected PRFs completed is significantly different from total national percentage ( p < 0.05).
NOTE: PRF is Patient Record Form.
SOURCE: CDC/NCHS, National Ambulatory Medical Care Survey, 2012.

Page 24 [ Series 2, No. 171
Table 7. Percent distributions of in-scope sample, numbers of respondents to physician induction interview, and potential bias in nonresponse-adjusted estimates of percent distributions based on those respondents, by physician characteristic: National Ambulatory Medical Care Survey, 2012
Physician induction interview respondents In-scope
sample percent Percent distribution distribution
using using calibrated nonresponse-
Physician characteristic1 sampling weights2 Number adjusted weights3 Bias4
Total . . . . . . . . . . . . . . . . . . . . . . . . . . . . . . . 100.0 5,622 100.0 . . .
Age
Under 50 . . . . . . . . . . . . . . . . . . . . . . . . . . . . 40.4 2,163 39.7 –0.7 50 and over . . . . . . . . . . . . . . . . . . . . . . . . . . 59.6 3,459 60.3 0.7
Sex
Male . . . . . . . . . . . . . . . . . . . . . . . . . . . . . . . 71.6 4,265 72.3 0.7 Female . . . . . . . . . . . . . . . . . . . . . . . . . . . . . 28.4 1,357 27.7 –0.7
Census division location of interview
New England . . . . . . . . . . . . . . . . . . . . . . . . . 6.2 347 6.2 0.0 Middle Atlantic. . . . . . . . . . . . . . . . . . . . . . . . . 15.3 469 15.3 0.0 East North Central . . . . . . . . . . . . . . . . . . . . . . 13.0 756 13.0 0.0 West North Central . . . . . . . . . . . . . . . . . . . . . . 5.9 611 5.9 0.0 South Atlantic . . . . . . . . . . . . . . . . . . . . . . . . . 18.8 899 18.8 0.0 East South Central . . . . . . . . . . . . . . . . . . . . . . 5.7 656 5.7 0.0 West South Central . . . . . . . . . . . . . . . . . . . . . 10.6 611 10.6 0.0 Mountain . . . . . . . . . . . . . . . . . . . . . . . . . . . . 6.9 637 6.9 0.0 Pacific. . . . . . . . . . . . . . . . . . . . . . . . . . . . . . 17.5 636 17.5 0.0
Metropolitan status5
MSA6 . . . . . . . . . . . . . . . . . . . . . . . . . . . . . . 91.7 4,932 92.7 1.0 Non-MSA6 . . . . . . . . . . . . . . . . . . . . . . . . . . . 8.3 690 7.3 –1.0
Type of doctor
Doctor of medicine . . . . . . . . . . . . . . . . . . . . . . 94.1 5,310 94.0 –0.1 Doctor of osteopathy. . . . . . . . . . . . . . . . . . . . . 5.9 312 6.0 0.1
Physician specialty7
General or family practice. . . . . . . . . . . . . . . . . . 17.1 803 17.1 0.0 Internal medicine . . . . . . . . . . . . . . . . . . . . . . . 12.8 473 12.8 0.0 Pediatrics. . . . . . . . . . . . . . . . . . . . . . . . . . . . 10.3 473 10.3 0.0 General surgery. . . . . . . . . . . . . . . . . . . . . . . . 2.7 244 2.7 0.0 Obstetrics and gynecology . . . . . . . . . . . . . . . . . 7.2 299 7.2 0.0 Orthopedic surgery . . . . . . . . . . . . . . . . . . . . . . 4.5 294 4.5 0.0 Cardiovascular diseases . . . . . . . . . . . . . . . . . . 3.6 210 3.6 0.0 Dermatology . . . . . . . . . . . . . . . . . . . . . . . . . . 2.5 150 2.5 0.0 Urology . . . . . . . . . . . . . . . . . . . . . . . . . . . . . 1.9 136 1.9 0.0 Psychiatry . . . . . . . . . . . . . . . . . . . . . . . . . . . 5.9 358 5.9 0.0 Neurology . . . . . . . . . . . . . . . . . . . . . . . . . . . 2.3 138 2.3 0.0 Ophthalmology . . . . . . . . . . . . . . . . . . . . . . . . 3.8 265 3.8 0.0 Otolaryngology . . . . . . . . . . . . . . . . . . . . . . . . 1.9 126 1.9 0.0 Oncology . . . . . . . . . . . . . . . . . . . . . . . . . . . . 1.9 213 1.9 0.0 Allergy . . . . . . . . . . . . . . . . . . . . . . . . . . . . . 0.9 219 0.9 0.0 Pulmonology. . . . . . . . . . . . . . . . . . . . . . . . . . 1.8 259 1.8 0.0 All other specialties. . . . . . . . . . . . . . . . . . . . . . 19.0 962 19.0 0.0
Specialty type7
Primary care . . . . . . . . . . . . . . . . . . . . . . . . . . 46.7 2,005 46.8 0.1 Surgical . . . . . . . . . . . . . . . . . . . . . . . . . . . . . 20.7 1,355 20.0 –0.7 Medical . . . . . . . . . . . . . . . . . . . . . . . . . . . . . 32.5 2,262 33.2 0.7
See footnotes at end of table.
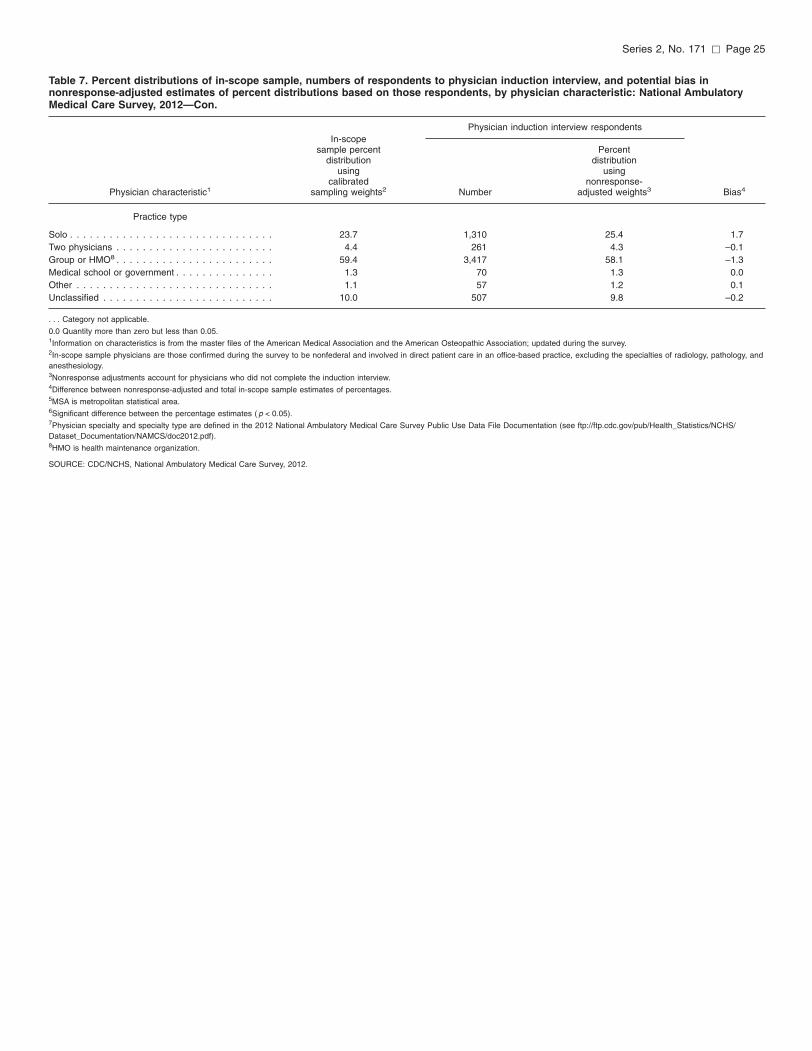
Series 2, No. 171 [ Page 25
Table 7. Percent distributions of in-scope sample, numbers of respondents to physician induction interview, and potential bias in nonresponse-adjusted estimates of percent distributions based on those respondents, by physician characteristic: National Ambulatory Medical Care Survey, 2012—Con.
Physician induction interview respondents In-scope
sample percent Percent distribution distribution
using using calibrated nonresponse-
Physician characteristic1 sampling weights2 Number adjusted weights3 Bias4
Practice type
Solo . . . . . . . . . . . . . . . . . . . . . . . . . . . . . . . 23.7 1,310 25.4 1.7 Two physicians . . . . . . . . . . . . . . . . . . . . . . . . 4.4 261 4.3 –0.1 Group or HMO8 . . . . . . . . . . . . . . . . . . . . . . . . 59.4 3,417 58.1 –1.3 Medical school or government . . . . . . . . . . . . . . . 1.3 70 1.3 0.0 Other . . . . . . . . . . . . . . . . . . . . . . . . . . . . . . 1.1 57 1.2 0.1 Unclassified . . . . . . . . . . . . . . . . . . . . . . . . . . 10.0 507 9.8 –0.2
. . . Category not applicable.
0.0 Quantity more than zero but less than 0.05. 1Information on characteristics is from the master files of the American Medical Association and the American Osteopathic Association; updated during the survey. 2In-scope sample physicians are those confirmed during the survey to be nonfederal and involved in direct patient care in an office-based practice, excluding the specialties of radiology, pathology, and anesthesiology. 3Nonresponse adjustments account for physicians who did not complete the induction interview. 4Difference between nonresponse-adjusted and total in-scope sample estimates of percentages. 5MSA is metropolitan statistical area. 6Significant difference between the percentage estimates ( p < 0.05). 7Physician specialty and specialty type are defined in the 2012 National Ambulatory Medical Care Survey Public Use Data File Documentation (see ftp://ftp.cdc.gov/pub/Health_Statistics/NCHS/ Dataset_Documentation/NAMCS/doc2012.pdf). 8HMO is health maintenance organization.
SOURCE: CDC/NCHS, National Ambulatory Medical Care Survey, 2012.
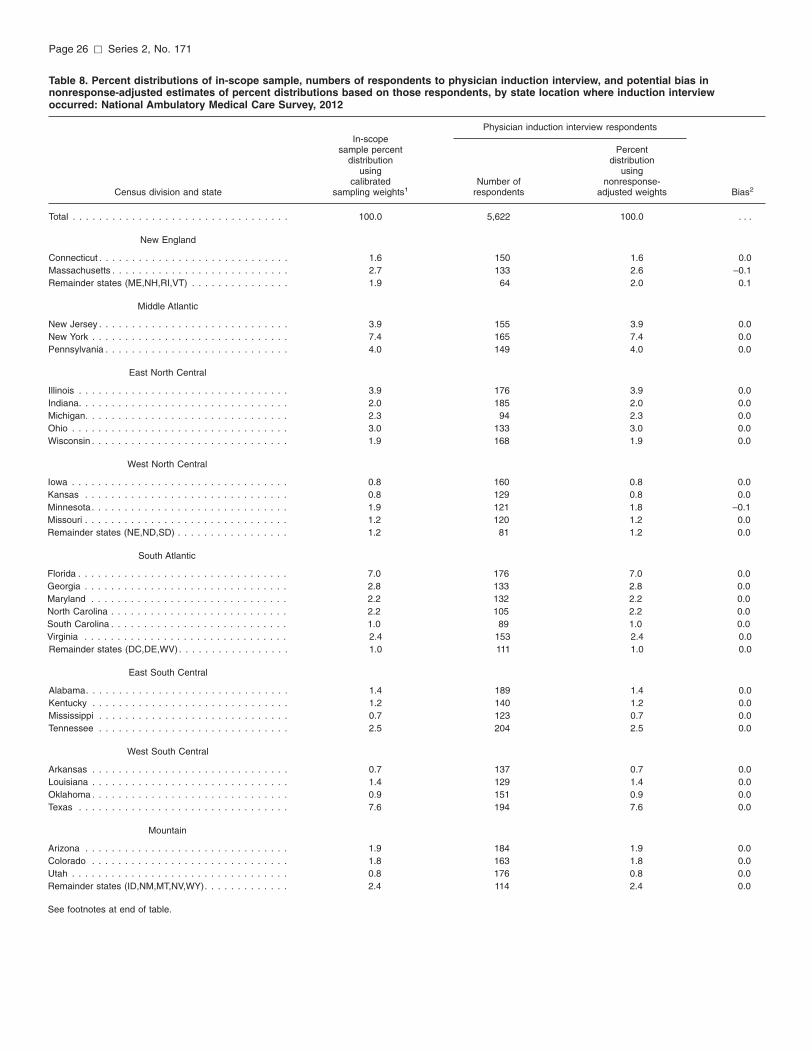
Page 26 [ Series 2, No. 171
Table 8. Percent distributions of in-scope sample, numbers of respondents to physician induction interview, and potential bias in nonresponse-adjusted estimates of percent distributions based on those respondents, by state location where induction interview occurred: National Ambulatory Medical Care Survey, 2012
Physician induction interview respondents In-scope
sample percent Percent distribution distribution
using using calibrated Number of nonresponse-
Census division and state sampling weights1 respondents adjusted weights Bias2
Total . . . . . . . . . . . . . . . . . . . . . . . . . . . . . . . . . 100.0 5,622 100.0 . . .
New England
Connecticut . . . . . . . . . . . . . . . . . . . . . . . . . . . . . 1.6 150 1.6 0.0 Massachusetts . . . . . . . . . . . . . . . . . . . . . . . . . . . 2.7 133 2.6 –0.1 Remainder states (ME,NH,RI,VT) . . . . . . . . . . . . . . . 1.9 64 2.0 0.1
Middle Atlantic
New Jersey . . . . . . . . . . . . . . . . . . . . . . . . . . . . . 3.9 155 3.9 0.0 New York . . . . . . . . . . . . . . . . . . . . . . . . . . . . . . 7.4 165 7.4 0.0 Pennsylvania . . . . . . . . . . . . . . . . . . . . . . . . . . . . 4.0 149 4.0 0.0
East North Central
Illinois . . . . . . . . . . . . . . . . . . . . . . . . . . . . . . . . 3.9 176 3.9 0.0 Indiana. . . . . . . . . . . . . . . . . . . . . . . . . . . . . . . . 2.0 185 2.0 0.0 Michigan. . . . . . . . . . . . . . . . . . . . . . . . . . . . . . . 2.3 94 2.3 0.0 Ohio . . . . . . . . . . . . . . . . . . . . . . . . . . . . . . . . . 3.0 133 3.0 0.0 Wisconsin . . . . . . . . . . . . . . . . . . . . . . . . . . . . . . 1.9 168 1.9 0.0
West North Central
Iowa . . . . . . . . . . . . . . . . . . . . . . . . . . . . . . . . . 0.8 160 0.8 0.0 Kansas . . . . . . . . . . . . . . . . . . . . . . . . . . . . . . . 0.8 129 0.8 0.0 Minnesota. . . . . . . . . . . . . . . . . . . . . . . . . . . . . . 1.9 121 1.8 –0.1 Missouri . . . . . . . . . . . . . . . . . . . . . . . . . . . . . . . 1.2 120 1.2 0.0 Remainder states (NE,ND,SD) . . . . . . . . . . . . . . . . . 1.2 81 1.2 0.0
South Atlantic
Florida . . . . . . . . . . . . . . . . . . . . . . . . . . . . . . . . 7.0 176 7.0 0.0 Georgia . . . . . . . . . . . . . . . . . . . . . . . . . . . . . . . 2.8 133 2.8 0.0 Maryland . . . . . . . . . . . . . . . . . . . . . . . . . . . . . . 2.2 132 2.2 0.0 North Carolina . . . . . . . . . . . . . . . . . . . . . . . . . . . 2.2 105 2.2 0.0 South Carolina . . . . . . . . . . . . . . . . . . . . . . . . . . . 1.0 89 1.0 0.0 Virginia . . . . . . . . . . . . . . . . . . . . . . . . . . . . . . . 2.4 153 2.4 0.0 Remainder states (DC,DE,WV) . . . . . . . . . . . . . . . . . 1.0 111 1.0 0.0
East South Central
Alabama. . . . . . . . . . . . . . . . . . . . . . . . . . . . . . . 1.4 189 1.4 0.0 Kentucky . . . . . . . . . . . . . . . . . . . . . . . . . . . . . . 1.2 140 1.2 0.0 Mississippi . . . . . . . . . . . . . . . . . . . . . . . . . . . . . 0.7 123 0.7 0.0 Tennessee . . . . . . . . . . . . . . . . . . . . . . . . . . . . . 2.5 204 2.5 0.0
West South Central
Arkansas . . . . . . . . . . . . . . . . . . . . . . . . . . . . . . 0.7 137 0.7 0.0 Louisiana . . . . . . . . . . . . . . . . . . . . . . . . . . . . . . 1.4 129 1.4 0.0 Oklahoma . . . . . . . . . . . . . . . . . . . . . . . . . . . . . . 0.9 151 0.9 0.0 Texas . . . . . . . . . . . . . . . . . . . . . . . . . . . . . . . . 7.6 194 7.6 0.0
Mountain
Arizona . . . . . . . . . . . . . . . . . . . . . . . . . . . . . . . 1.9 184 1.9 0.0 Colorado . . . . . . . . . . . . . . . . . . . . . . . . . . . . . . 1.8 163 1.8 0.0 Utah . . . . . . . . . . . . . . . . . . . . . . . . . . . . . . . . . 0.8 176 0.8 0.0 Remainder states (ID,NM,MT,NV,WY). . . . . . . . . . . . . 2.4 114 2.4 0.0
See footnotes at end of table.
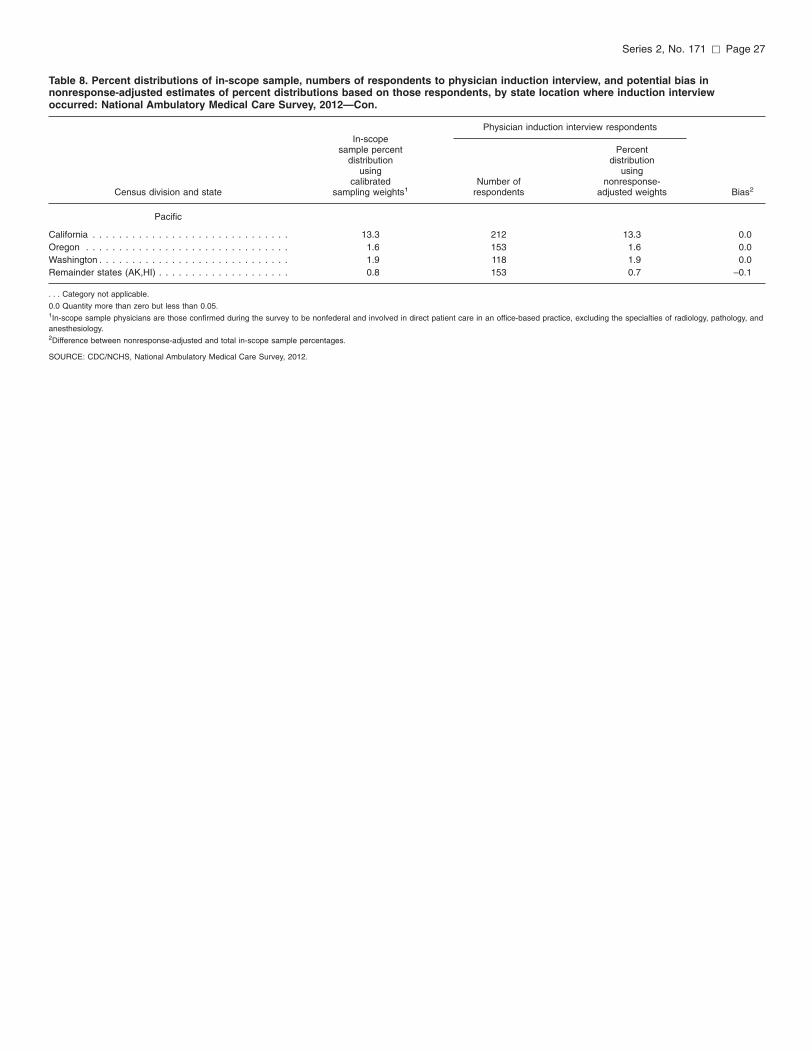
Series 2, No. 171 [ Page 27
Table 8. Percent distributions of in-scope sample, numbers of respondents to physician induction interview, and potential bias in nonresponse-adjusted estimates of percent distributions based on those respondents, by state location where induction interview occurred: National Ambulatory Medical Care Survey, 2012—Con.
Physician induction interview respondents In-scope
sample percent Percent distribution distribution
using using calibrated Number of nonresponse-
Census division and state sampling weights1 respondents adjusted weights Bias2
Pacific
California . . . . . . . . . . . . . . . . . . . . . . . . . . . . . . 13.3 212 13.3 0.0 Oregon . . . . . . . . . . . . . . . . . . . . . . . . . . . . . . . 1.6 153 1.6 0.0 Washington . . . . . . . . . . . . . . . . . . . . . . . . . . . . . 1.9 118 1.9 0.0 Remainder states (AK,HI) . . . . . . . . . . . . . . . . . . . . 0.8 153 0.7 –0.1
. . . Category not applicable.
0.0 Quantity more than zero but less than 0.05. 1In-scope sample physicians are those confirmed during the survey to be nonfederal and involved in direct patient care in an office-based practice, excluding the specialties of radiology, pathology, and anesthesiology. 2Difference between nonresponse-adjusted and total in-scope sample percentages.
SOURCE: CDC/NCHS, National Ambulatory Medical Care Survey, 2012.
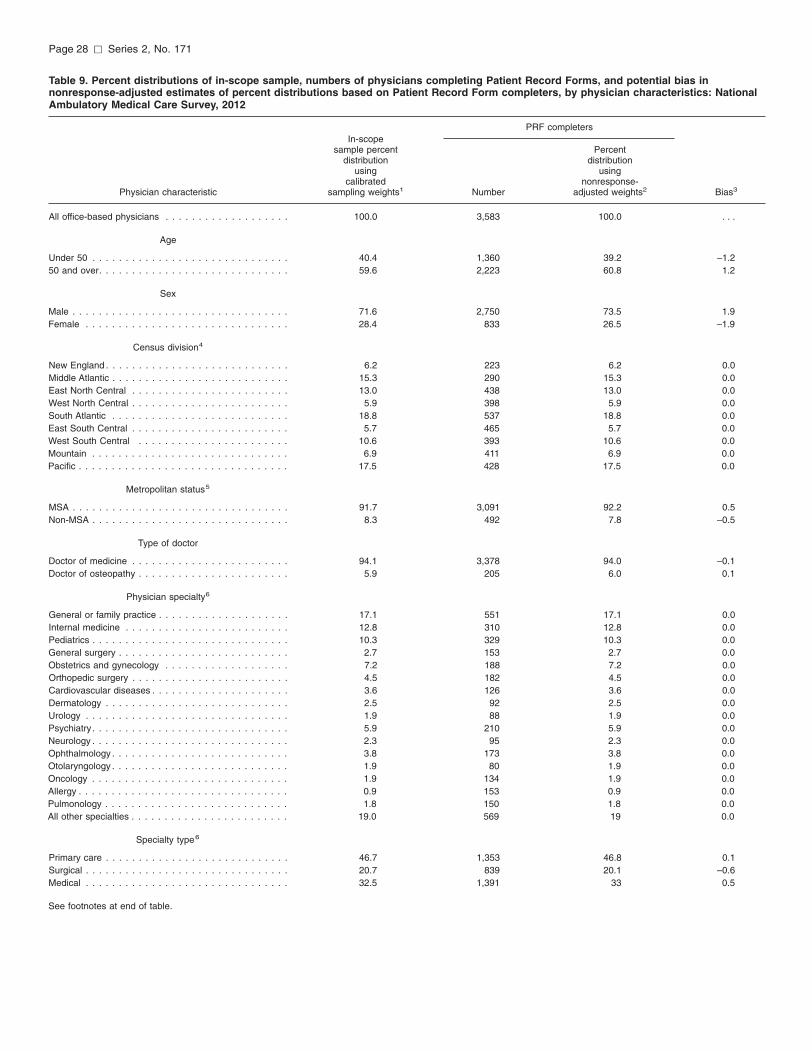
Page 28 [ Series 2, No. 171
Table 9. Percent distributions of in-scope sample, numbers of physicians completing Patient Record Forms, and potential bias in nonresponse-adjusted estimates of percent distributions based on Patient Record Form completers, by physician characteristics: National Ambulatory Medical Care Survey, 2012
PRF completers In-scope
sample percent Percent distribution distribution
using using calibrated nonresponse-
Physician characteristic sampling weights1 Number adjusted weights2 Bias3
All office-based physicians . . . . . . . . . . . . . . . . . . . 100.0 3,583 100.0 . . .
Age
Under 50 . . . . . . . . . . . . . . . . . . . . . . . . . . . . . . 40.4 1,360 39.2 –1.2 50 and over. . . . . . . . . . . . . . . . . . . . . . . . . . . . . 59.6 2,223 60.8 1.2
Sex
Male . . . . . . . . . . . . . . . . . . . . . . . . . . . . . . . . . 71.6 2,750 73.5 1.9 Female . . . . . . . . . . . . . . . . . . . . . . . . . . . . . . . 28.4 833 26.5 –1.9
Census division4
New England . . . . . . . . . . . . . . . . . . . . . . . . . . . . 6.2 223 6.2 0.0 Middle Atlantic . . . . . . . . . . . . . . . . . . . . . . . . . . . 15.3 290 15.3 0.0 East North Central . . . . . . . . . . . . . . . . . . . . . . . . 13.0 438 13.0 0.0 West North Central . . . . . . . . . . . . . . . . . . . . . . . . 5.9 398 5.9 0.0 South Atlantic . . . . . . . . . . . . . . . . . . . . . . . . . . . 18.8 537 18.8 0.0 East South Central . . . . . . . . . . . . . . . . . . . . . . . . 5.7 465 5.7 0.0 West South Central . . . . . . . . . . . . . . . . . . . . . . . 10.6 393 10.6 0.0 Mountain . . . . . . . . . . . . . . . . . . . . . . . . . . . . . . 6.9 411 6.9 0.0 Pacific . . . . . . . . . . . . . . . . . . . . . . . . . . . . . . . . 17.5 428 17.5 0.0
Metropolitan status5
MSA . . . . . . . . . . . . . . . . . . . . . . . . . . . . . . . . . 91.7 3,091 92.2 0.5 Non-MSA . . . . . . . . . . . . . . . . . . . . . . . . . . . . . . 8.3 492 7.8 –0.5
Type of doctor
Doctor of medicine . . . . . . . . . . . . . . . . . . . . . . . . 94.1 3,378 94.0 –0.1 Doctor of osteopathy . . . . . . . . . . . . . . . . . . . . . . . 5.9 205 6.0 0.1
Physician specialty6
General or family practice . . . . . . . . . . . . . . . . . . . . 17.1 551 17.1 0.0 Internal medicine . . . . . . . . . . . . . . . . . . . . . . . . . 12.8 310 12.8 0.0 Pediatrics . . . . . . . . . . . . . . . . . . . . . . . . . . . . . . 10.3 329 10.3 0.0 General surgery . . . . . . . . . . . . . . . . . . . . . . . . . . 2.7 153 2.7 0.0 Obstetrics and gynecology . . . . . . . . . . . . . . . . . . . 7.2 188 7.2 0.0 Orthopedic surgery . . . . . . . . . . . . . . . . . . . . . . . . 4.5 182 4.5 0.0 Cardiovascular diseases . . . . . . . . . . . . . . . . . . . . . 3.6 126 3.6 0.0 Dermatology . . . . . . . . . . . . . . . . . . . . . . . . . . . . 2.5 92 2.5 0.0 Urology . . . . . . . . . . . . . . . . . . . . . . . . . . . . . . . 1.9 88 1.9 0.0 Psychiatry . . . . . . . . . . . . . . . . . . . . . . . . . . . . . . 5.9 210 5.9 0.0 Neurology . . . . . . . . . . . . . . . . . . . . . . . . . . . . . . 2.3 95 2.3 0.0 Ophthalmology . . . . . . . . . . . . . . . . . . . . . . . . . . . 3.8 173 3.8 0.0 Otolaryngology . . . . . . . . . . . . . . . . . . . . . . . . . . . 1.9 80 1.9 0.0 Oncology . . . . . . . . . . . . . . . . . . . . . . . . . . . . . . 1.9 134 1.9 0.0 Allergy . . . . . . . . . . . . . . . . . . . . . . . . . . . . . . . . 0.9 153 0.9 0.0 Pulmonology . . . . . . . . . . . . . . . . . . . . . . . . . . . . 1.8 150 1.8 0.0 All other specialties . . . . . . . . . . . . . . . . . . . . . . . . 19.0 569 19 0.0
Specialty type6
Primary care . . . . . . . . . . . . . . . . . . . . . . . . . . . . 46.7 1,353 46.8 0.1 Surgical . . . . . . . . . . . . . . . . . . . . . . . . . . . . . . . 20.7 839 20.1 –0.6 Medical . . . . . . . . . . . . . . . . . . . . . . . . . . . . . . . 32.5 1,391 33 0.5
See footnotes at end of table.
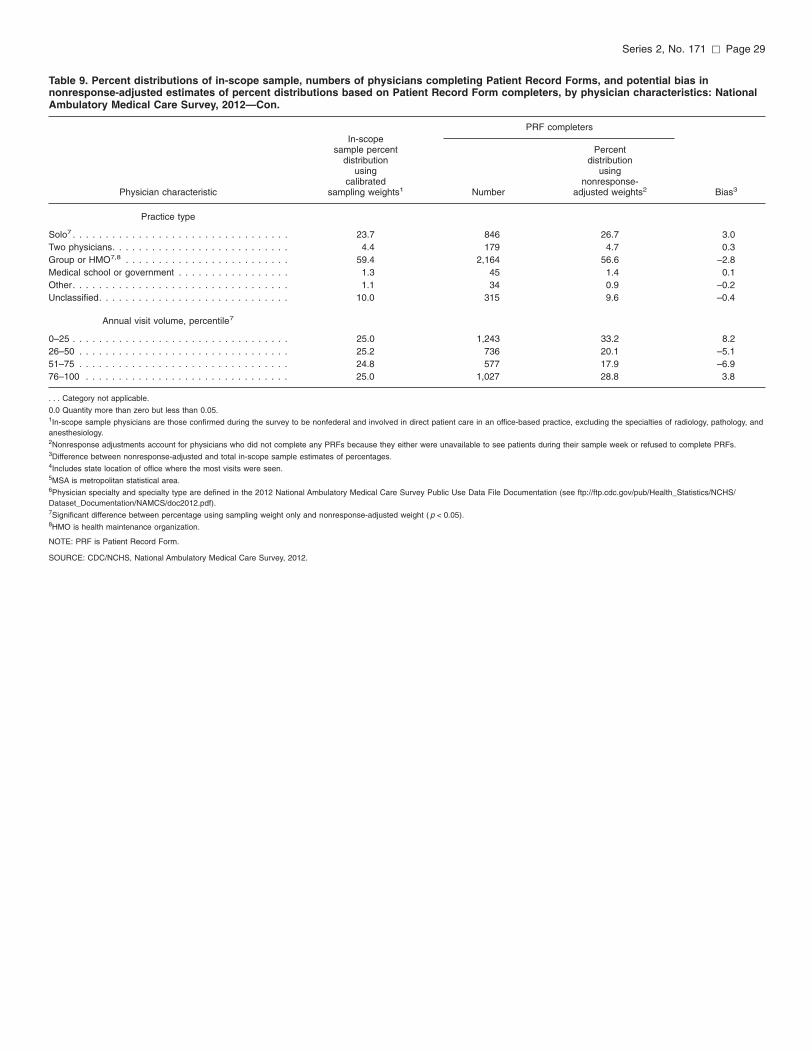
Series 2, No. 171 [ Page 29
Table 9. Percent distributions of in-scope sample, numbers of physicians completing Patient Record Forms, and potential bias in nonresponse-adjusted estimates of percent distributions based on Patient Record Form completers, by physician characteristics: National Ambulatory Medical Care Survey, 2012—Con.
PRF completers In-scope
sample percent Percent distribution distribution
using using calibrated nonresponse-
Physician characteristic sampling weights1 Number adjusted weights2 Bias3
Practice type
Solo7 . . . . . . . . . . . . . . . . . . . . . . . . . . . . . . . . . 23.7 846 26.7 3.0 Two physicians. . . . . . . . . . . . . . . . . . . . . . . . . . . 4.4 179 4.7 0.3 Group or HMO7,8 . . . . . . . . . . . . . . . . . . . . . . . . . 59.4 2,164 56.6 –2.8 Medical school or government . . . . . . . . . . . . . . . . . 1.3 45 1.4 0.1 Other. . . . . . . . . . . . . . . . . . . . . . . . . . . . . . . . . 1.1 34 0.9 –0.2 Unclassified. . . . . . . . . . . . . . . . . . . . . . . . . . . . . 10.0 315 9.6 –0.4
Annual visit volume, percentile7
0–25 . . . . . . . . . . . . . . . . . . . . . . . . . . . . . . . . . 25.0 1,243 33.2 8.2 26–50 . . . . . . . . . . . . . . . . . . . . . . . . . . . . . . . . 25.2 736 20.1 –5.1 51–75 . . . . . . . . . . . . . . . . . . . . . . . . . . . . . . . . 24.8 577 17.9 –6.9 76–100 . . . . . . . . . . . . . . . . . . . . . . . . . . . . . . . 25.0 1,027 28.8 3.8
. . . Category not applicable.
0.0 Quantity more than zero but less than 0.05. 1In-scope sample physicians are those confirmed during the survey to be nonfederal and involved in direct patient care in an office-based practice, excluding the specialties of radiology, pathology, and anesthesiology. 2Nonresponse adjustments account for physicians who did not complete any PRFs because they either were unavailable to see patients during their sample week or refused to complete PRFs. 3Difference between nonresponse-adjusted and total in-scope sample estimates of percentages. 4Includes state location of office where the most visits were seen. 5MSA is metropolitan statistical area. 6Physician specialty and specialty type are defined in the 2012 National Ambulatory Medical Care Survey Public Use Data File Documentation (see ftp://ftp.cdc.gov/pub/Health_Statistics/NCHS/ Dataset_Documentation/NAMCS/doc2012.pdf). 7Significant difference between percentage using sampling weight only and nonresponse-adjusted weight ( p < 0.05). 8HMO is health maintenance organization.
NOTE: PRF is Patient Record Form.
SOURCE: CDC/NCHS, National Ambulatory Medical Care Survey, 2012.
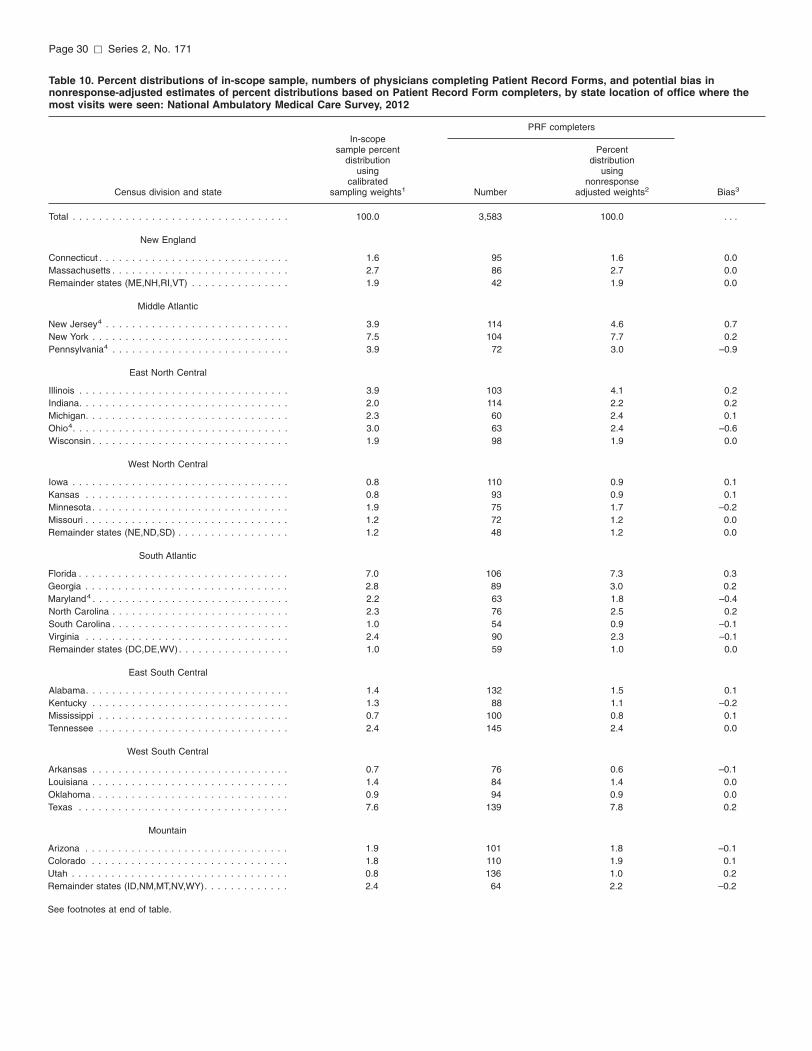
Page 30 [ Series 2, No. 171
Table 10. Percent distributions of in-scope sample, numbers of physicians completing Patient Record Forms, and potential bias in nonresponse-adjusted estimates of percent distributions based on Patient Record Form completers, by state location of office where the most visits were seen: National Ambulatory Medical Care Survey, 2012
PRF completers In-scope
sample percent Percent distribution distribution
using using calibrated nonresponse
Census division and state sampling weights1 Number adjusted weights2 Bias3
Total . . . . . . . . . . . . . . . . . . . . . . . . . . . . . . . . . 100.0 3,583 100.0 . . .
New England
Connecticut . . . . . . . . . . . . . . . . . . . . . . . . . . . . . 1.6 95 1.6 0.0 Massachusetts . . . . . . . . . . . . . . . . . . . . . . . . . . . 2.7 86 2.7 0.0 Remainder states (ME,NH,RI,VT) . . . . . . . . . . . . . . . 1.9 42 1.9 0.0
Middle Atlantic
New Jersey4 . . . . . . . . . . . . . . . . . . . . . . . . . . . . 3.9 114 4.6 0.7 New York . . . . . . . . . . . . . . . . . . . . . . . . . . . . . . 7.5 104 7.7 0.2 Pennsylvania4 . . . . . . . . . . . . . . . . . . . . . . . . . . . 3.9 72 3.0 –0.9
East North Central
Illinois . . . . . . . . . . . . . . . . . . . . . . . . . . . . . . . . 3.9 103 4.1 0.2 Indiana. . . . . . . . . . . . . . . . . . . . . . . . . . . . . . . . 2.0 114 2.2 0.2 Michigan. . . . . . . . . . . . . . . . . . . . . . . . . . . . . . . 2.3 60 2.4 0.1 Ohio4 . . . . . . . . . . . . . . . . . . . . . . . . . . . . . . . . . 3.0 63 2.4 –0.6 Wisconsin . . . . . . . . . . . . . . . . . . . . . . . . . . . . . . 1.9 98 1.9 0.0
West North Central
Iowa . . . . . . . . . . . . . . . . . . . . . . . . . . . . . . . . . 0.8 110 0.9 0.1 Kansas . . . . . . . . . . . . . . . . . . . . . . . . . . . . . . . 0.8 93 0.9 0.1 Minnesota. . . . . . . . . . . . . . . . . . . . . . . . . . . . . . 1.9 75 1.7 –0.2 Missouri . . . . . . . . . . . . . . . . . . . . . . . . . . . . . . . 1.2 72 1.2 0.0 Remainder states (NE,ND,SD) . . . . . . . . . . . . . . . . . 1.2 48 1.2 0.0
South Atlantic
Florida . . . . . . . . . . . . . . . . . . . . . . . . . . . . . . . . 7.0 106 7.3 0.3 Georgia . . . . . . . . . . . . . . . . . . . . . . . . . . . . . . . 2.8 89 3.0 0.2 Maryland4 . . . . . . . . . . . . . . . . . . . . . . . . . . . . . . 2.2 63 1.8 –0.4 North Carolina . . . . . . . . . . . . . . . . . . . . . . . . . . . 2.3 76 2.5 0.2 South Carolina . . . . . . . . . . . . . . . . . . . . . . . . . . . 1.0 54 0.9 –0.1 Virginia . . . . . . . . . . . . . . . . . . . . . . . . . . . . . . . 2.4 90 2.3 –0.1 Remainder states (DC,DE,WV) . . . . . . . . . . . . . . . . . 1.0 59 1.0 0.0
East South Central
Alabama. . . . . . . . . . . . . . . . . . . . . . . . . . . . . . . 1.4 132 1.5 0.1 Kentucky . . . . . . . . . . . . . . . . . . . . . . . . . . . . . . 1.3 88 1.1 –0.2 Mississippi . . . . . . . . . . . . . . . . . . . . . . . . . . . . . 0.7 100 0.8 0.1 Tennessee . . . . . . . . . . . . . . . . . . . . . . . . . . . . . 2.4 145 2.4 0.0
West South Central
Arkansas . . . . . . . . . . . . . . . . . . . . . . . . . . . . . . 0.7 76 0.6 –0.1 Louisiana . . . . . . . . . . . . . . . . . . . . . . . . . . . . . . 1.4 84 1.4 0.0 Oklahoma . . . . . . . . . . . . . . . . . . . . . . . . . . . . . . 0.9 94 0.9 0.0 Texas . . . . . . . . . . . . . . . . . . . . . . . . . . . . . . . . 7.6 139 7.8 0.2
Mountain
Arizona . . . . . . . . . . . . . . . . . . . . . . . . . . . . . . . 1.9 101 1.8 –0.1 Colorado . . . . . . . . . . . . . . . . . . . . . . . . . . . . . . 1.8 110 1.9 0.1 Utah . . . . . . . . . . . . . . . . . . . . . . . . . . . . . . . . . 0.8 136 1.0 0.2 Remainder states (ID,NM,MT,NV,WY). . . . . . . . . . . . . 2.4 64 2.2 –0.2
See footnotes at end of table.
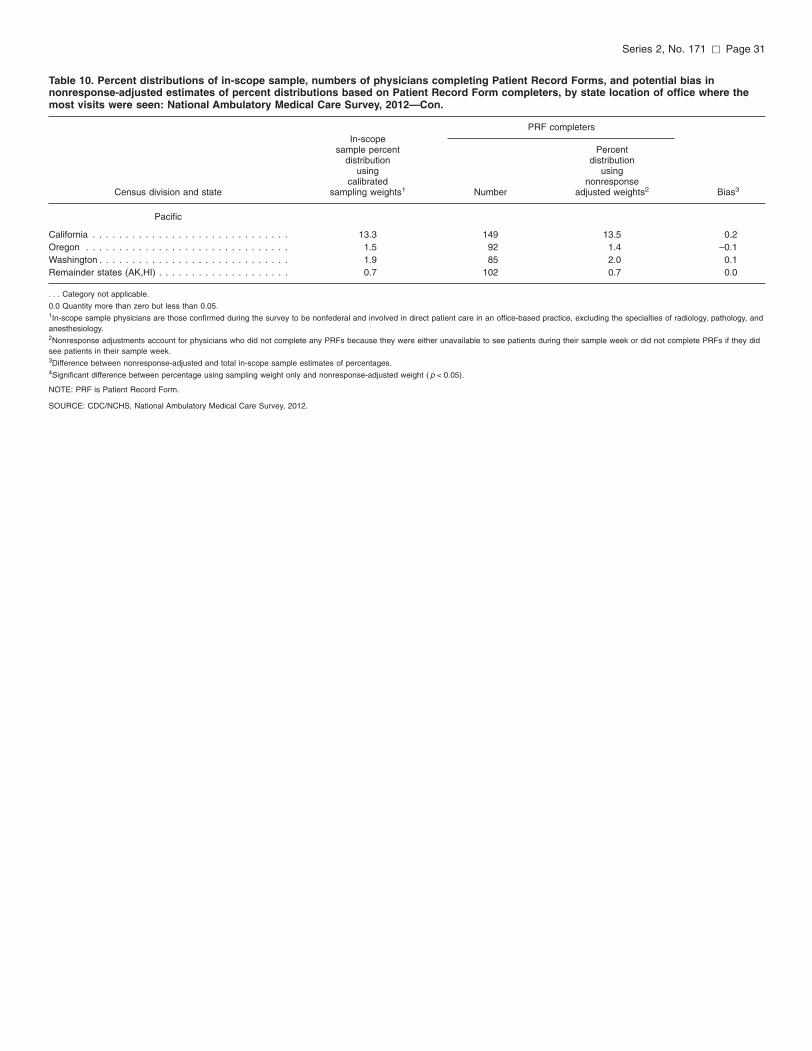
Series 2, No. 171 [ Page 31
Table 10. Percent distributions of in-scope sample, numbers of physicians completing Patient Record Forms, and potential bias in nonresponse-adjusted estimates of percent distributions based on Patient Record Form completers, by state location of office where the most visits were seen: National Ambulatory Medical Care Survey, 2012—Con.
PRF completers In-scope
sample percent Percent distribution distribution
using using calibrated nonresponse
Census division and state sampling weights1 Number adjusted weights2 Bias3
Pacific
California . . . . . . . . . . . . . . . . . . . . . . . . . . . . . . 13.3 149 13.5 0.2 Oregon . . . . . . . . . . . . . . . . . . . . . . . . . . . . . . . 1.5 92 1.4 –0.1 Washington . . . . . . . . . . . . . . . . . . . . . . . . . . . . . 1.9 85 2.0 0.1 Remainder states (AK,HI) . . . . . . . . . . . . . . . . . . . . 0.7 102 0.7 0.0
. . . Category not applicable.
0.0 Quantity more than zero but less than 0.05. 1In-scope sample physicians are those confirmed during the survey to be nonfederal and involved in direct patient care in an office-based practice, excluding the specialties of radiology, pathology, and anesthesiology. 2Nonresponse adjustments account for physicians who did not complete any PRFs because they were either unavailable to see patients during their sample week or did not complete PRFs if they did see patients in their sample week. 3Difference between nonresponse-adjusted and total in-scope sample estimates of percentages. 4Significant difference between percentage using sampling weight only and nonresponse-adjusted weight ( p < 0.05).
NOTE: PRF is Patient Record Form.
SOURCE: CDC/NCHS, National Ambulatory Medical Care Survey, 2012.
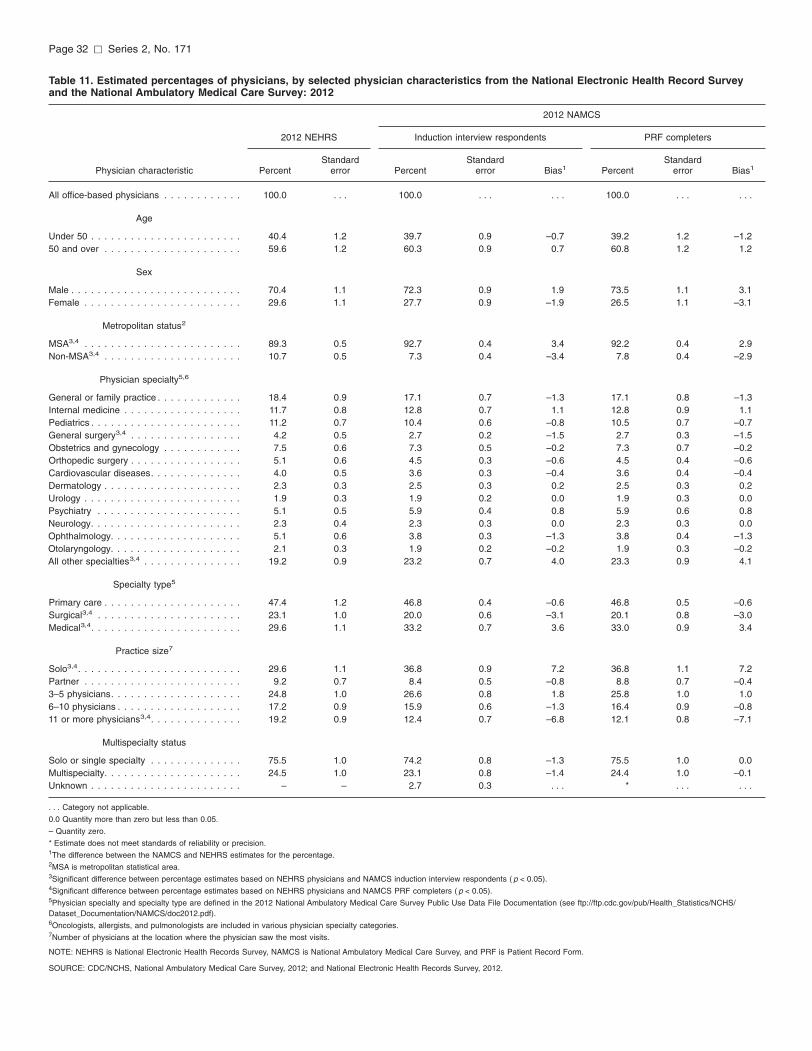
Page 32 [ Series 2, No. 171
Table 11. Estimated percentages of physicians, by selected physician characteristics from the National Electronic Health Record Survey and the National Ambulatory Medical Care Survey: 2012
2012 NAMCS
2012 NEHRS Induction interview respondents PRF completers
Physician characteristic Percent Standard
error Percent Standard
error Bias1 Percent Standard
error Bias1
All office-based physicians . . . . . . . . . . . . 100.0 . . . 100.0 . . . . . . 100.0 . . . . . .
Age
Under 50 . . . . . . . . . . . . . . . . . . . . . . . 50 and over . . . . . . . . . . . . . . . . . . . . .
40.4 59.6
1.2 1.2
39.7 60.3
0.9 0.9
–0.7 0.7
39.2 60.8
1.2 1.2
–1.2 1.2
Sex
Male . . . . . . . . . . . . . . . . . . . . . . . . . . Female . . . . . . . . . . . . . . . . . . . . . . . .
70.4 29.6
1.1 1.1
72.3 27.7
0.9 0.9
1.9 –1.9
73.5 26.5
1.1 1.1
3.1 –3.1
Metropolitan status2
MSA3,4 . . . . . . . . . . . . . . . . . . . . . . . . Non-MSA3,4 . . . . . . . . . . . . . . . . . . . . .
89.3 10.7
0.5 0.5
92.7 7.3
0.4 0.4
3.4 –3.4
92.2 7.8
0.4 0.4
2.9 –2.9
Physician specialty5,6
General or family practice . . . . . . . . . . . . . Internal medicine . . . . . . . . . . . . . . . . . . Pediatrics . . . . . . . . . . . . . . . . . . . . . . . General surgery3,4 . . . . . . . . . . . . . . . . . Obstetrics and gynecology . . . . . . . . . . . . Orthopedic surgery . . . . . . . . . . . . . . . . . Cardiovascular diseases. . . . . . . . . . . . . . Dermatology . . . . . . . . . . . . . . . . . . . . . Urology . . . . . . . . . . . . . . . . . . . . . . . . Psychiatry . . . . . . . . . . . . . . . . . . . . . . Neurology. . . . . . . . . . . . . . . . . . . . . . . Ophthalmology. . . . . . . . . . . . . . . . . . . . Otolaryngology. . . . . . . . . . . . . . . . . . . . All other specialties3,4 . . . . . . . . . . . . . . .
18.4 11.7 11.2 4.2 7.5 5.1 4.0 2.3 1.9 5.1 2.3 5.1 2.1
19.2
0.9 0.8 0.7 0.5 0.6 0.6 0.5 0.3 0.3 0.5 0.4 0.6 0.3 0.9
17.1 12.8 10.4 2.7 7.3 4.5 3.6 2.5 1.9 5.9 2.3 3.8 1.9
23.2
0.7 0.7 0.6 0.2 0.5 0.3 0.3 0.3 0.2 0.4 0.3 0.3 0.2 0.7
–1.3 1.1
–0.8 –1.5 –0.2 –0.6 –0.4 0.2 0.0 0.8 0.0
–1.3 –0.2
4.0
17.1 12.8 10.5 2.7 7.3 4.5 3.6 2.5 1.9 5.9 2.3 3.8 1.9
23.3
0.8 0.9 0.7 0.3 0.7 0.4 0.4 0.3 0.3 0.6 0.3 0.4 0.3 0.9
–1.3 1.1
–0.7 –1.5 –0.2 –0.6 –0.4 0.2 0.0 0.8 0.0
–1.3 –0.2
4.1
Specialty type5
Primary care . . . . . . . . . . . . . . . . . . . . . Surgical3,4 . . . . . . . . . . . . . . . . . . . . . . Medical3,4 . . . . . . . . . . . . . . . . . . . . . . .
47.4 23.1 29.6
1.2 1.0 1.1
46.8 20.0 33.2
0.4 0.6 0.7
–0.6 –3.1 3.6
46.8 20.1 33.0
0.5 0.8 0.9
–0.6 –3.0 3.4
Practice size7
Solo3,4 . . . . . . . . . . . . . . . . . . . . . . . . . Partner . . . . . . . . . . . . . . . . . . . . . . . . 3–5 physicians. . . . . . . . . . . . . . . . . . . . 6–10 physicians . . . . . . . . . . . . . . . . . . . 11 or more physicians3,4 . . . . . . . . . . . . . .
29.6 9.2
24.8 17.2 19.2
1.1 0.7 1.0 0.9 0.9
36.8 8.4
26.6 15.9 12.4
0.9 0.5 0.8 0.6 0.7
7.2 –0.8 1.8
–1.3 –6.8
36.8 8.8
25.8 16.4 12.1
1.1 0.7 1.0 0.9 0.8
7.2 –0.4 1.0
–0.8 –7.1
Multispecialty status
Solo or single specialty . . . . . . . . . . . . . . Multispecialty. . . . . . . . . . . . . . . . . . . . . Unknown . . . . . . . . . . . . . . . . . . . . . . .
75.5 24.5
–
1.0 1.0
–
74.2 23.1 2.7
0.8 0.8 0.3
–1.3 –1.4 . . .
75.5 24.4
*
1.0 1.0 . . .
0.0 –0.1 . . .
. . . Category not applicable.
0.0 Quantity more than zero but less than 0.05.
– Quantity zero.
* Estimate does not meet standards of reliability or precision. 1The difference between the NAMCS and NEHRS estimates for the percentage. 2MSA is metropolitan statistical area. 3Significant difference between percentage estimates based on NEHRS physicians and NAMCS induction interview respondents ( p < 0.05). 4Significant difference between percentage estimates based on NEHRS physicians and NAMCS PRF completers ( p < 0.05). 5Physician specialty and specialty type are defined in the 2012 National Ambulatory Medical Care Survey Public Use Data File Documentation (see ftp://ftp.cdc.gov/pub/Health_Statistics/NCHS/ Dataset_Documentation/NAMCS/doc2012.pdf). 6Oncologists, allergists, and pulmonologists are included in various physician specialty categories. 7Number of physicians at the location where the physician saw the most visits.
NOTE: NEHRS is National Electronic Health Records Survey, NAMCS is National Ambulatory Medical Care Survey, and PRF is Patient Record Form.
SOURCE: CDC/NCHS, National Ambulatory Medical Care Survey, 2012; and National Electronic Health Records Survey, 2012.
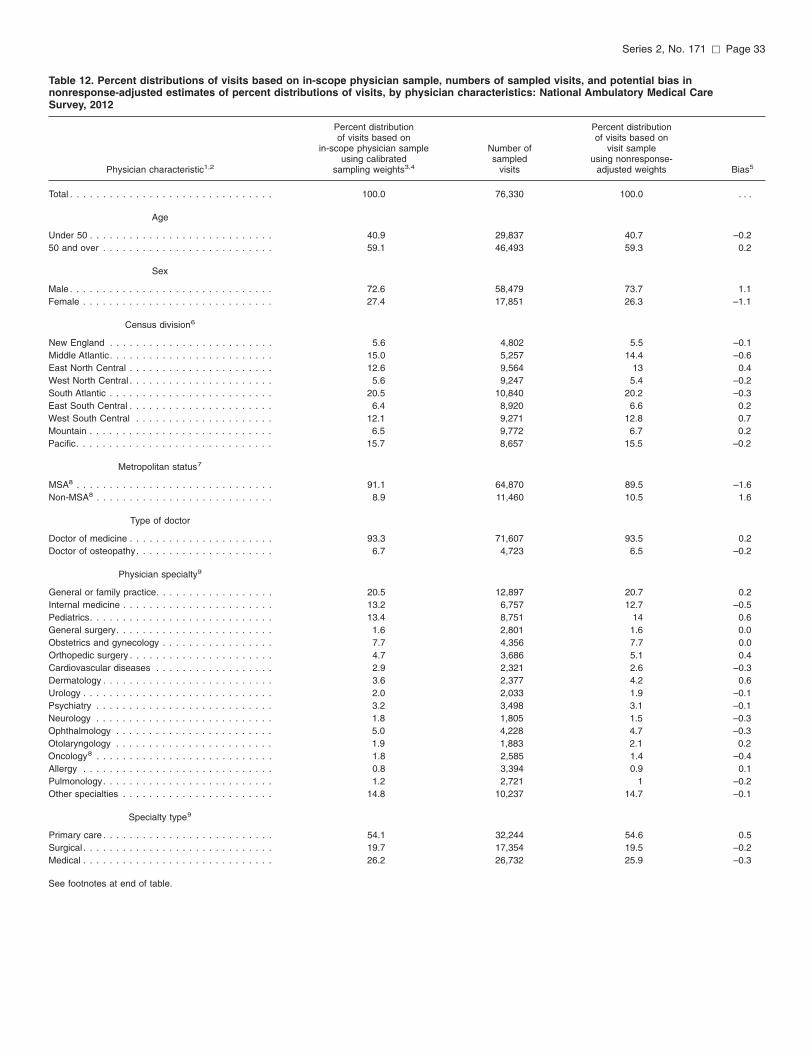
Series 2, No. 171 [ Page 33
Table 12. Percent distributions of visits based on in-scope physician sample, numbers of sampled visits, and potential bias in nonresponse-adjusted estimates of percent distributions of visits, by physician characteristics: National Ambulatory Medical Care Survey, 2012
Percent distribution Percent distribution of visits based on of visits based on
in-scope physician sample Number of visit sample using calibrated sampled using nonresponse-
Physician characteristic1,2 sampling weights3,4 visits adjusted weights Bias5
Total . . . . . . . . . . . . . . . . . . . . . . . . . . . . . . . 100.0 76,330 100.0 . . .
Age
Under 50 . . . . . . . . . . . . . . . . . . . . . . . . . . . . 40.9 29,837 40.7 –0.2 50 and over . . . . . . . . . . . . . . . . . . . . . . . . . . 59.1 46,493 59.3 0.2
Sex
Male . . . . . . . . . . . . . . . . . . . . . . . . . . . . . . . 72.6 58,479 73.7 1.1 Female . . . . . . . . . . . . . . . . . . . . . . . . . . . . . 27.4 17,851 26.3 –1.1
Census division6
New England . . . . . . . . . . . . . . . . . . . . . . . . . 5.6 4,802 5.5 –0.1 Middle Atlantic. . . . . . . . . . . . . . . . . . . . . . . . . 15.0 5,257 14.4 –0.6 East North Central . . . . . . . . . . . . . . . . . . . . . . 12.6 9,564 13 0.4 West North Central . . . . . . . . . . . . . . . . . . . . . . 5.6 9,247 5.4 –0.2 South Atlantic . . . . . . . . . . . . . . . . . . . . . . . . . 20.5 10,840 20.2 –0.3 East South Central . . . . . . . . . . . . . . . . . . . . . . 6.4 8,920 6.6 0.2 West South Central . . . . . . . . . . . . . . . . . . . . . 12.1 9,271 12.8 0.7 Mountain . . . . . . . . . . . . . . . . . . . . . . . . . . . . 6.5 9,772 6.7 0.2 Pacific. . . . . . . . . . . . . . . . . . . . . . . . . . . . . . 15.7 8,657 15.5 –0.2
Metropolitan status7
MSA8 . . . . . . . . . . . . . . . . . . . . . . . . . . . . . . 91.1 64,870 89.5 –1.6 Non-MSA8 . . . . . . . . . . . . . . . . . . . . . . . . . . . 8.9 11,460 10.5 1.6
Type of doctor
Doctor of medicine . . . . . . . . . . . . . . . . . . . . . . 93.3 71,607 93.5 0.2 Doctor of osteopathy. . . . . . . . . . . . . . . . . . . . . 6.7 4,723 6.5 –0.2
Physician specialty9
General or family practice. . . . . . . . . . . . . . . . . . 20.5 12,897 20.7 0.2 Internal medicine . . . . . . . . . . . . . . . . . . . . . . . 13.2 6,757 12.7 –0.5 Pediatrics. . . . . . . . . . . . . . . . . . . . . . . . . . . . 13.4 8,751 14 0.6 General surgery. . . . . . . . . . . . . . . . . . . . . . . . 1.6 2,801 1.6 0.0 Obstetrics and gynecology . . . . . . . . . . . . . . . . . 7.7 4,356 7.7 0.0 Orthopedic surgery . . . . . . . . . . . . . . . . . . . . . . 4.7 3,686 5.1 0.4 Cardiovascular diseases . . . . . . . . . . . . . . . . . . 2.9 2,321 2.6 –0.3 Dermatology . . . . . . . . . . . . . . . . . . . . . . . . . . 3.6 2,377 4.2 0.6 Urology . . . . . . . . . . . . . . . . . . . . . . . . . . . . . 2.0 2,033 1.9 –0.1 Psychiatry . . . . . . . . . . . . . . . . . . . . . . . . . . . 3.2 3,498 3.1 –0.1 Neurology . . . . . . . . . . . . . . . . . . . . . . . . . . . 1.8 1,805 1.5 –0.3 Ophthalmology . . . . . . . . . . . . . . . . . . . . . . . . 5.0 4,228 4.7 –0.3 Otolaryngology . . . . . . . . . . . . . . . . . . . . . . . . 1.9 1,883 2.1 0.2 Oncology8 . . . . . . . . . . . . . . . . . . . . . . . . . . . 1.8 2,585 1.4 –0.4 Allergy . . . . . . . . . . . . . . . . . . . . . . . . . . . . . 0.8 3,394 0.9 0.1 Pulmonology. . . . . . . . . . . . . . . . . . . . . . . . . . 1.2 2,721 1 –0.2 Other specialties . . . . . . . . . . . . . . . . . . . . . . . 14.8 10,237 14.7 –0.1
Specialty type9
Primary care . . . . . . . . . . . . . . . . . . . . . . . . . . 54.1 32,244 54.6 0.5 Surgical . . . . . . . . . . . . . . . . . . . . . . . . . . . . . 19.7 17,354 19.5 –0.2 Medical . . . . . . . . . . . . . . . . . . . . . . . . . . . . . 26.2 26,732 25.9 –0.3
See footnotes at end of table.
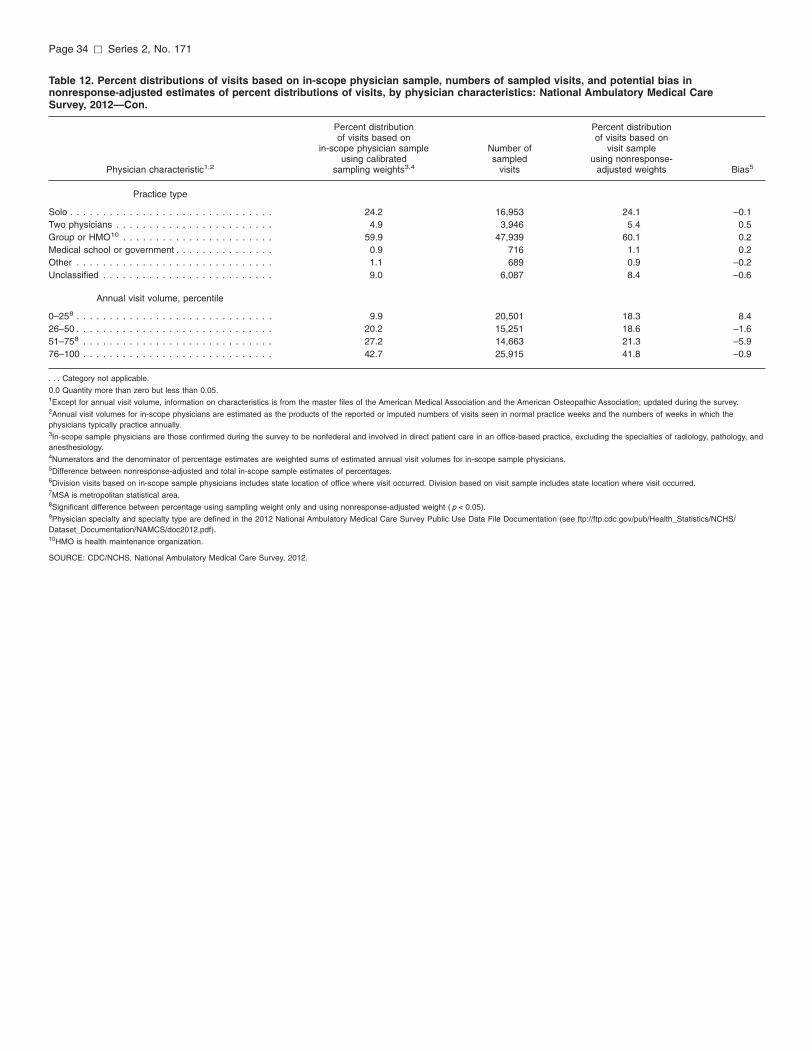
Page 34 [ Series 2, No. 171
Table 12. Percent distributions of visits based on in-scope physician sample, numbers of sampled visits, and potential bias in nonresponse-adjusted estimates of percent distributions of visits, by physician characteristics: National Ambulatory Medical Care Survey, 2012—Con.
Percent distribution Percent distribution of visits based on of visits based on
in-scope physician sample Number of visit sample using calibrated sampled using nonresponse-
Physician characteristic1,2 sampling weights3,4 visits adjusted weights Bias5
Practice type
Solo . . . . . . . . . . . . . . . . . . . . . . . . . . . . . . . 24.2 16,953 24.1 –0.1 Two physicians . . . . . . . . . . . . . . . . . . . . . . . . 4.9 3,946 5.4 0.5 Group or HMO10 . . . . . . . . . . . . . . . . . . . . . . . 59.9 47,939 60.1 0.2 Medical school or government . . . . . . . . . . . . . . . 0.9 716 1.1 0.2 Other . . . . . . . . . . . . . . . . . . . . . . . . . . . . . . 1.1 689 0.9 –0.2 Unclassified . . . . . . . . . . . . . . . . . . . . . . . . . . 9.0 6,087 8.4 –0.6
Annual visit volume, percentile
0–258 . . . . . . . . . . . . . . . . . . . . . . . . . . . . . . 9.9 20,501 18.3 8.4 26–50 . . . . . . . . . . . . . . . . . . . . . . . . . . . . . . 20.2 15,251 18.6 –1.6 51–758 . . . . . . . . . . . . . . . . . . . . . . . . . . . . . 27.2 14,663 21.3 –5.9 76–100 . . . . . . . . . . . . . . . . . . . . . . . . . . . . . 42.7 25,915 41.8 –0.9
. . . Category not applicable.
0.0 Quantity more than zero but less than 0.05. 1Except for annual visit volume, information on characteristics is from the master files of the American Medical Association and the American Osteopathic Association; updated during the survey. 2Annual visit volumes for in-scope physicians are estimated as the products of the reported or imputed numbers of visits seen in normal practice weeks and the numbers of weeks in which the physicians typically practice annually. 3In-scope sample physicians are those confirmed during the survey to be nonfederal and involved in direct patient care in an office-based practice, excluding the specialties of radiology, pathology, and anesthesiology. 4Numerators and the denominator of percentage estimates are weighted sums of estimated annual visit volumes for in-scope sample physicians. 5Difference between nonresponse-adjusted and total in-scope sample estimates of percentages. 6Division visits based on in-scope sample physicians includes state location of office where visit occurred. Division based on visit sample includes state location where visit occurred. 7MSA is metropolitan statistical area. 8Significant difference between percentage using sampling weight only and using nonresponse-adjusted weight ( p < 0.05). 9Physician specialty and specialty type are defined in the 2012 National Ambulatory Medical Care Survey Public Use Data File Documentation (see ftp://ftp.cdc.gov/pub/Health_Statistics/NCHS/ Dataset_Documentation/NAMCS/doc2012.pdf). 10HMO is health maintenance organization.
SOURCE: CDC/NCHS, National Ambulatory Medical Care Survey, 2012.
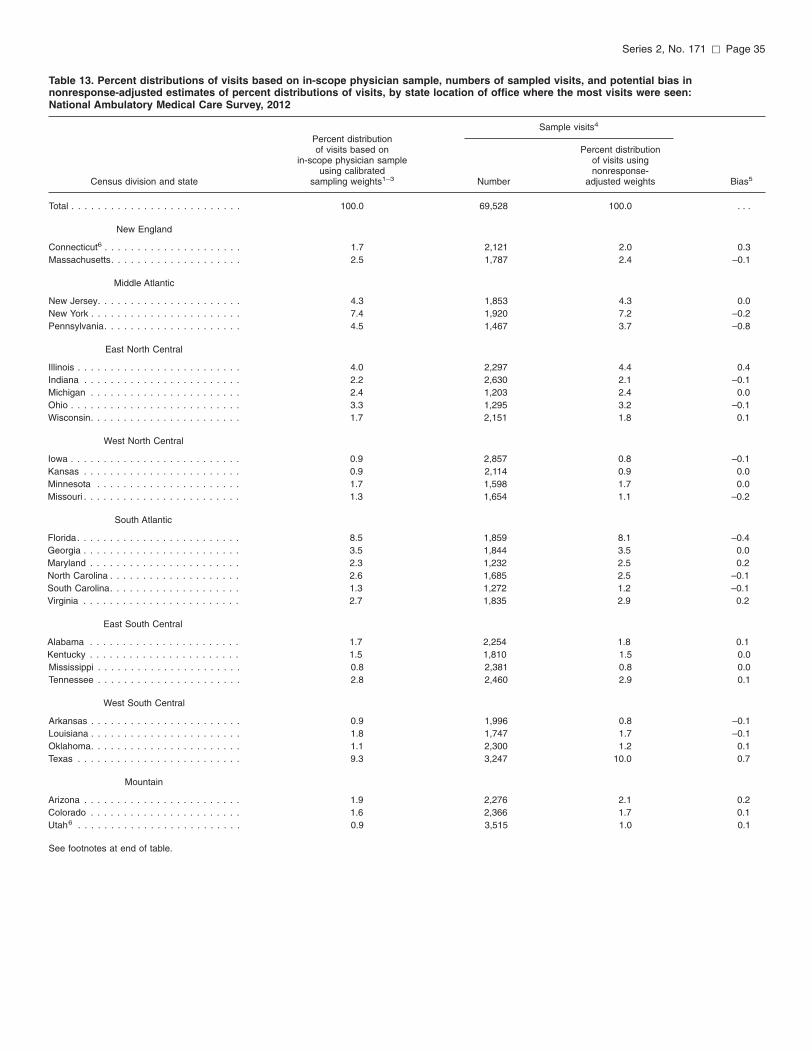
Series 2, No. 171 [ Page 35
Table 13. Percent distributions of visits based on in-scope physician sample, numbers of sampled visits, and potential bias in nonresponse-adjusted estimates of percent distributions of visits, by state location of office where the most visits were seen: National Ambulatory Medical Care Survey, 2012
Sample visits4
Percent distribution of visits based on Percent distribution
in-scope physician sample of visits using using calibrated nonresponse-
Census division and state sampling weights1–3 Number adjusted weights Bias5
Total . . . . . . . . . . . . . . . . . . . . . . . . . . 100.0 69,528 100.0 . . .
New England
Connecticut6 . . . . . . . . . . . . . . . . . . . . . 1.7 2,121 2.0 0.3 Massachusetts. . . . . . . . . . . . . . . . . . . . 2.5 1,787 2.4 –0.1
Middle Atlantic
New Jersey. . . . . . . . . . . . . . . . . . . . . . 4.3 1,853 4.3 0.0 New York . . . . . . . . . . . . . . . . . . . . . . . 7.4 1,920 7.2 –0.2 Pennsylvania. . . . . . . . . . . . . . . . . . . . . 4.5 1,467 3.7 –0.8
East North Central
Illinois . . . . . . . . . . . . . . . . . . . . . . . . . 4.0 2,297 4.4 0.4 Indiana . . . . . . . . . . . . . . . . . . . . . . . . 2.2 2,630 2.1 –0.1 Michigan . . . . . . . . . . . . . . . . . . . . . . . 2.4 1,203 2.4 0.0 Ohio . . . . . . . . . . . . . . . . . . . . . . . . . . 3.3 1,295 3.2 –0.1 Wisconsin. . . . . . . . . . . . . . . . . . . . . . . 1.7 2,151 1.8 0.1
West North Central
Iowa . . . . . . . . . . . . . . . . . . . . . . . . . . 0.9 2,857 0.8 –0.1 Kansas . . . . . . . . . . . . . . . . . . . . . . . . 0.9 2,114 0.9 0.0 Minnesota . . . . . . . . . . . . . . . . . . . . . . 1.7 1,598 1.7 0.0 Missouri . . . . . . . . . . . . . . . . . . . . . . . . 1.3 1,654 1.1 –0.2
South Atlantic
Florida. . . . . . . . . . . . . . . . . . . . . . . . . 8.5 1,859 8.1 –0.4 Georgia . . . . . . . . . . . . . . . . . . . . . . . . 3.5 1,844 3.5 0.0 Maryland . . . . . . . . . . . . . . . . . . . . . . . 2.3 1,232 2.5 0.2 North Carolina . . . . . . . . . . . . . . . . . . . . 2.6 1,685 2.5 –0.1 South Carolina. . . . . . . . . . . . . . . . . . . . 1.3 1,272 1.2 –0.1 Virginia . . . . . . . . . . . . . . . . . . . . . . . . 2.7 1,835 2.9 0.2
East South Central
Alabama . . . . . . . . . . . . . . . . . . . . . . . 1.7 2,254 1.8 0.1 Kentucky . . . . . . . . . . . . . . . . . . . . . . . 1.5 1,810 1.5 0.0 Mississippi . . . . . . . . . . . . . . . . . . . . . . 0.8 2,381 0.8 0.0 Tennessee . . . . . . . . . . . . . . . . . . . . . . 2.8 2,460 2.9 0.1
West South Central
Arkansas . . . . . . . . . . . . . . . . . . . . . . . 0.9 1,996 0.8 –0.1 Louisiana . . . . . . . . . . . . . . . . . . . . . . . 1.8 1,747 1.7 –0.1 Oklahoma. . . . . . . . . . . . . . . . . . . . . . . 1.1 2,300 1.2 0.1 Texas . . . . . . . . . . . . . . . . . . . . . . . . . 9.3 3,247 10.0 0.7
Mountain
Arizona . . . . . . . . . . . . . . . . . . . . . . . . 1.9 2,276 2.1 0.2 Colorado . . . . . . . . . . . . . . . . . . . . . . . 1.6 2,366 1.7 0.1 Utah6 . . . . . . . . . . . . . . . . . . . . . . . . . 0.9 3,515 1.0 0.1
See footnotes at end of table.
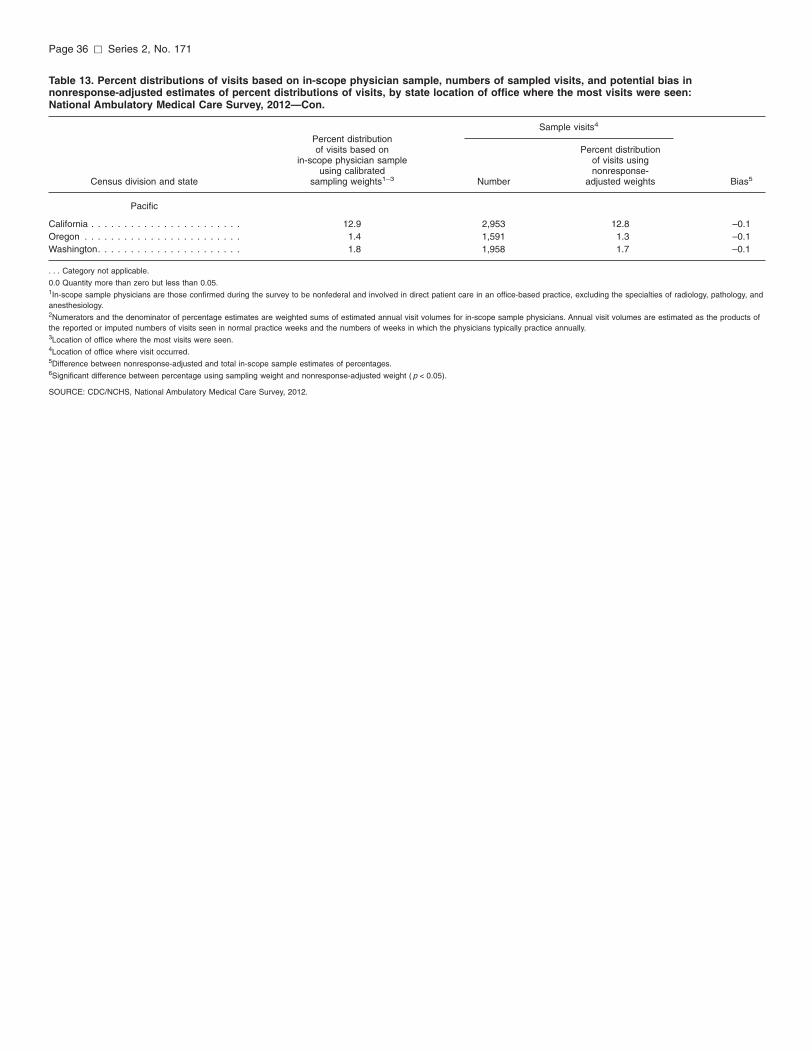
Page 36 [ Series 2, No. 171
Table 13. Percent distributions of visits based on in-scope physician sample, numbers of sampled visits, and potential bias in nonresponse-adjusted estimates of percent distributions of visits, by state location of office where the most visits were seen: National Ambulatory Medical Care Survey, 2012—Con.
Sample visits4
Percent distribution of visits based on Percent distribution
in-scope physician sample of visits using using calibrated nonresponse-
Census division and state sampling weights1–3 Number adjusted weights Bias5
Pacific
California . . . . . . . . . . . . . . . . . . . . . . . 12.9 2,953 12.8 –0.1 Oregon . . . . . . . . . . . . . . . . . . . . . . . . 1.4 1,591 1.3 –0.1 Washington. . . . . . . . . . . . . . . . . . . . . . 1.8 1,958 1.7 –0.1
. . . Category not applicable.
0.0 Quantity more than zero but less than 0.05. 1In-scope sample physicians are those confirmed during the survey to be nonfederal and involved in direct patient care in an office-based practice, excluding the specialties of radiology, pathology, and anesthesiology. 2Numerators and the denominator of percentage estimates are weighted sums of estimated annual visit volumes for in-scope sample physicians. Annual visit volumes are estimated as the products of the reported or imputed numbers of visits seen in normal practice weeks and the numbers of weeks in which the physicians typically practice annually. 3Location of office where the most visits were seen. 4Location of office where visit occurred. 5Difference between nonresponse-adjusted and total in-scope sample estimates of percentages. 6Significant difference between percentage using sampling weight and nonresponse-adjusted weight ( p < 0.05).
SOURCE: CDC/NCHS, National Ambulatory Medical Care Survey, 2012.
Series 2, No. 171 [ Page 37
Appendix I. Glossary
Annual visit volumes—Estimated as the products of the reported numbers of visits the physicians saw during their last normal weeks of practice, multiplied by the numbers of weeks they typically practiced during the year. Questions about visit numbers and numbers of weeks were asked of in-scope physicians during the induction interview. Missing values for the numbers of visits in the last normal week were imputed using linear regression in the SUDAAN 11 PROC IMPUTE procedure with independent variables that were determined through trial and error to be associated with the visit volumes reported. The independent variables used were the physician’s specialty (19 groups), Census division, metropolitan statistical area status, age, race, and (if known) whether the physician’s largest (in terms of visits seen) practice is in a multispecialty or single-specialty office. Other than data on multi- or single-specialty office obtained from the induction interview, the data used for the independent variables were from the American Medical Association and the American Osteopathic Association. Missing numbers for weeks in which physicians saw patients annually in their practice were imputed using averages of those numbers among the physicians who did report numbers of practice weeks.
Calibrated sampling weights—The inverses of sampling probabilities multiplied by calibration ratios that adjust the numbers of physicians in the sampling frame at the time the sample was selected to the numbers of physicians eligible for inclusion in that sampling frame at the time when NAMCS data were collected.
Division for induction interview respondents—The Census division location of the office where the physician was interviewed.
Division for physician-level estimates based on Patient Record Form (PRF) completers—The Census division location of the office where the physician saw the most visits during his or her assigned reporting week, if known: otherwise, the location where the physician was interviewed.
NAMCS participating physicians— Physicians who either completed any PRF or saw no patients (were unavailable to see patients) and hence had no patient visits on which to complete PRFs during their sample week due to vacation, conference attendance, illness, or other reasons.
Physicians with full or adequate PRF response—Physicians who (a) were PRF completers who completed PRFs for 50% or more of their expected sample visits; or (b) saw no patients during their sample week. This definition has been used to define NAMCS visit-level response rates since 2002.
PRF completers—Physicians with any completed PRFs (more precisely, physicians for whom PRFs were completed by Census field representatives or by the physician or office staff).
State for induction interview respondents—The state location of the office where the physician was interviewed.
State for physician-level estimates based on PRF completers—The state location of the office where the physician saw the most visits during his or her assigned reporting week.
Page 38 [ Series 2, No. 171
Appendix II. NAMCS Estimation Procedures
Physician Estimation Procedures
The estimator for physician-level estimates based on physician induction interview respondents (or physicians who completed Patient Record Forms [PRFs]) in the 2012 NAMCS includes four components:
+ Inflation by the reciprocal of the physician’s selection probability.
+ Adjustment for nonresponse, which adjusts for in-scope physicians who did not complete the induction interview or physicians who did not complete any PRFs. This adjustment is done within cells defined by Census division or targeted state and physician specialty.
+ Ratio adjustment within cells defined by Census division or targeted state and by physician specialty. This adjusts the number of physicians in the sampling frame at the time of sample selection to known totals for the frame at the time of the survey.
+ Weight smoothing.
Visit Estimation Procedures
The estimator for visit-level estimates based on completed PRFs for the 2012 NAMCS includes the following components:
+ Inflation by the reciprocals of the selection probabilities for the physicians and the visits within physicians’ practices.
+ Ratio adjustment (described earlier) for calibrating physician-level sampling weights.
+ Adjustment for nonresponse, which includes: C Adjustment for missing PRFs from
PRF completers: u Accounting for visits seen in the
physician’s practice during the reporting week and for the number of weeks in a year when the physician sees patients.
u Accounting for missing expected PRFs: – Within a physician’s practice
for up to one-half of expected PRFs.
– Within cells defined by physician specialty, Census division or targeted state, and metropolitan statistical area (MSA) status for missing PRFs in excess of one-half of PRFs expected from the practice.
C Adjustment for visits to PRF noncompleters are made within cells defined by physician specialty, Census division or targeted state, and MSA status. This adjustment used estimated annual visit volumes, which were calculated as the products of the visit volumes for normal practice weeks and the numbers of weeks in which the physicians saw patients annually. When the weekly visit volumes needed in these annual visit volume calculations were missing, they were imputed (as described earlier in Methods).
+ Weight smoothing.
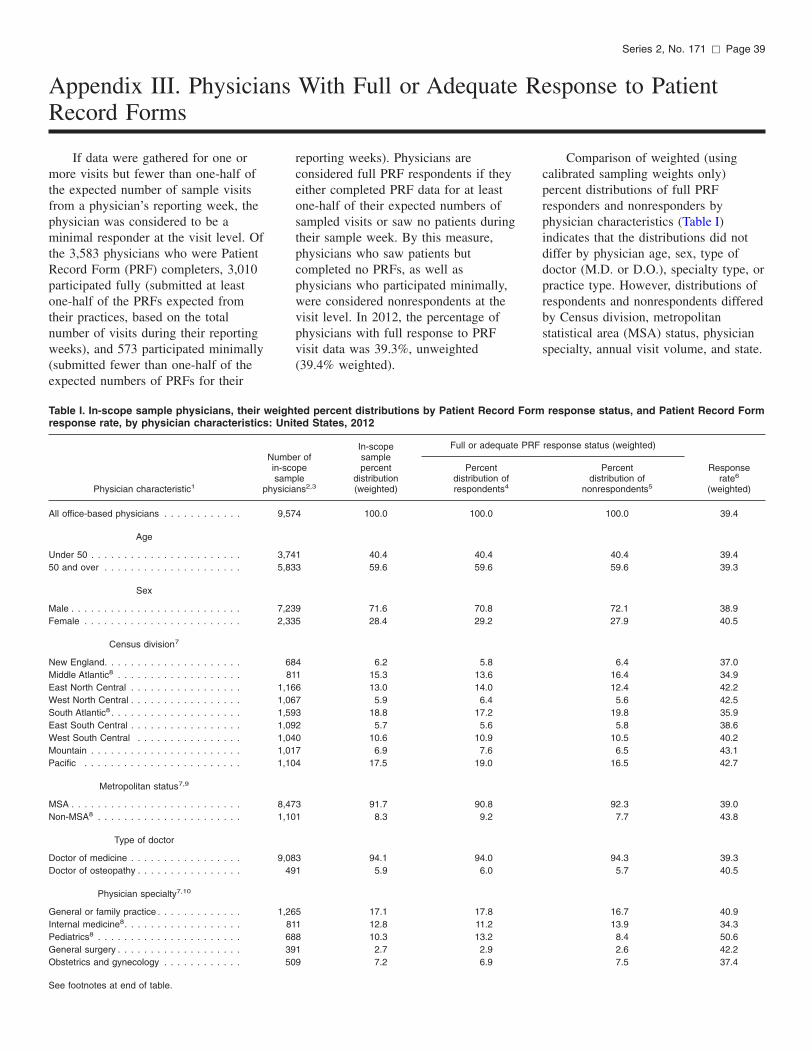
Series 2, No. 171 [ Page 39
Appendix III. Physicians With Full or Adequate Response to Patient Record Forms
If data were gathered for one or more visits but fewer than one-half of the expected number of sample visits from a physician’s reporting week, the physician was considered to be a minimal responder at the visit level. Of the 3,583 physicians who were Patient Record Form (PRF) completers, 3,010 participated fully (submitted at least one-half of the PRFs expected from their practices, based on the total number of visits during their reporting weeks), and 573 participated minimally (submitted fewer than one-half of the expected numbers of PRFs for their
Table I. In-scope sample physicians, their weiresponse rate, by physician characteristics: U
Numin-sa
Physician characteristic1 phys
All office-based physicians . . . . . . . . . . . . 9
Age
Under 50 . . . . . . . . . . . . . . . . . . . . . . . 3
50 and over . . . . . . . . . . . . . . . . . . . . . 5
Sex
Male . . . . . . . . . . . . . . . . . . . . . . . . . . 7
Female . . . . . . . . . . . . . . . . . . . . . . . . 2
Census division7
New England. . . . . . . . . . . . . . . . . . . . . Middle Atlantic8 . . . . . . . . . . . . . . . . . . . East North Central . . . . . . . . . . . . . . . . . 1
West North Central . . . . . . . . . . . . . . . . . 1
South Atlantic8 . . . . . . . . . . . . . . . . . . . . 1
East South Central . . . . . . . . . . . . . . . . . 1
West South Central . . . . . . . . . . . . . . . . 1
Mountain . . . . . . . . . . . . . . . . . . . . . . . 1
Pacific . . . . . . . . . . . . . . . . . . . . . . . . 1
Metropolitan status7,9
MSA . . . . . . . . . . . . . . . . . . . . . . . . . . 8
Non-MSA8 . . . . . . . . . . . . . . . . . . . . . . 1
Type of doctor
Doctor of medicine . . . . . . . . . . . . . . . . . 9
Doctor of osteopathy . . . . . . . . . . . . . . . .
Physician specialty7,10
General or family practice . . . . . . . . . . . . . 1
Internal medicine8 . . . . . . . . . . . . . . . . . . Pediatrics8 . . . . . . . . . . . . . . . . . . . . . . General surgery . . . . . . . . . . . . . . . . . . . Obstetrics and gynecology . . . . . . . . . . . .
See footnotes at end of table.
reporting weeks). Physicians are considered full PRF respondents if they either completed PRF data for at least one-half of their expected numbers of sampled visits or saw no patients during their sample week. By this measure, physicians who saw patients but completed no PRFs, as well as physicians who participated minimally, were considered nonrespondents at the visit level. In 2012, the percentage of physicians with full response to PRF visit data was 39.3%, unweighted (39.4% weighted).
ghted percent distributions by Patient Record Fornited States, 2012
In-scope Full or adequate PRF
ber of sample scope percent Percent mple distribution distribution of icians2,3 (weighted) respondents4
,574 100.0 100.0
,741 40.4 40.4 ,833 59.6 59.6
,239 71.6 70.8 ,335 28.4 29.2
684 6.2 5.8 811 15.3 13.6
,166 13.0 14.0 ,067 5.9 6.4 ,593 18.8 17.2 ,092 5.7 5.6 ,040 10.6 10.9 ,017 6.9 7.6 ,104 17.5 19.0
,473 91.7 90.8 ,101 8.3 9.2
,083 94.1 94.0 491 5.9 6.0
,265 17.1 17.8 811 12.8 11.2 688 10.3 13.2 391 2.7 2.9 509 7.2 6.9
Comparison of weighted (using calibrated sampling weights only) percent distributions of full PRF responders and nonresponders by physician characteristics (Table I) indicates that the distributions did not differ by physician age, sex, type of doctor (M.D. or D.O.), specialty type, or practice type. However, distributions of respondents and nonrespondents differed by Census division, metropolitan statistical area (MSA) status, physician specialty, annual visit volume, and state.
m response status, and Patient Record Form
response status (weighted)
Percent Response distribution of rate6
nonrespondents5 (weighted)
100.0 39.4
40.4 39.4 59.6 39.3
72.1 38.9 27.9 40.5
6.4 37.0 16.4 34.9 12.4 42.2 5.6 42.5
19.8 35.9 5.8 38.6
10.5 40.2 6.5 43.1
16.5 42.7
92.3 39.0 7.7 43.8
94.3 39.3 5.7 40.5
16.7 40.9 13.9 34.3 8.4 50.6 2.6 42.2 7.5 37.4
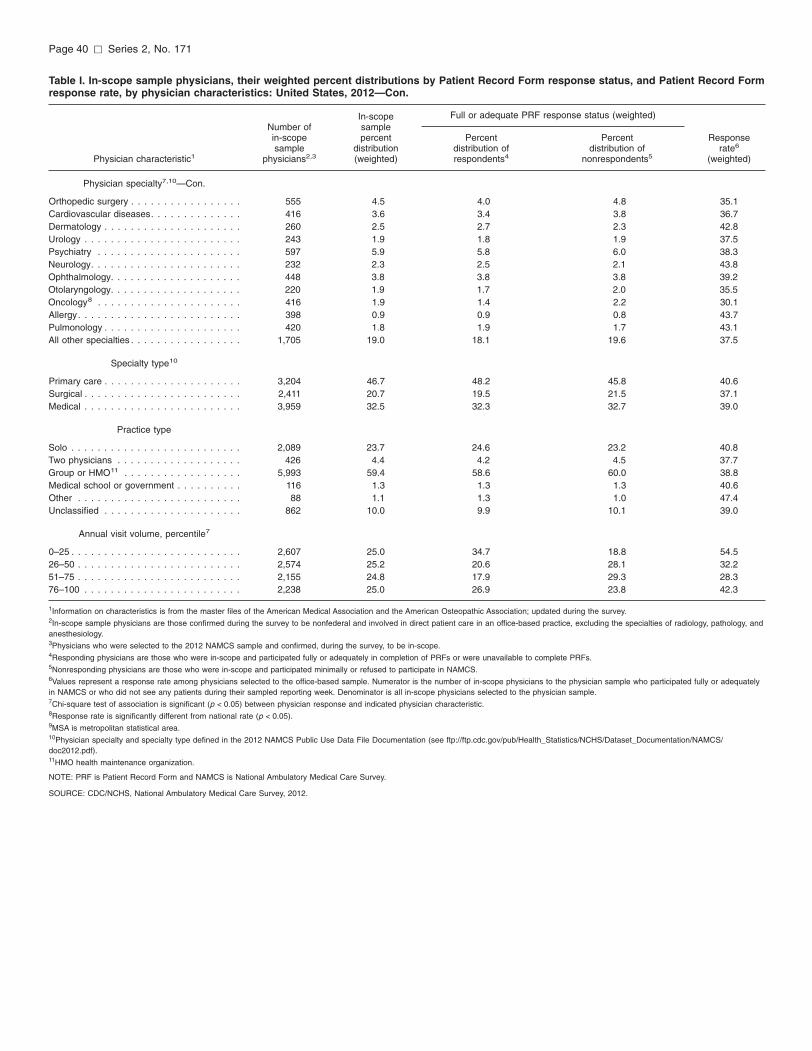
Page 40 [ Series 2, No. 171
Table I. In-scope sample physicians, their weighted percent distributions by Patient Record Form response status, and Patient Record Form response rate, by physician characteristics: United States, 2012—Con.
In-scope Full or adequate PRF response status (weighted) Number of sample in-scope percent Percent Percent Response sample distribution distribution of distribution of rate6
Physician characteristic1 physicians2,3 (weighted) respondents4 nonrespondents5 (weighted)
Physician specialty7,10—Con.
Orthopedic surgery . . . . . . . . . . . . . . . . . 555 4.5 4.0 4.8 35.1 Cardiovascular diseases. . . . . . . . . . . . . . 416 3.6 3.4 3.8 36.7 Dermatology . . . . . . . . . . . . . . . . . . . . . 260 2.5 2.7 2.3 42.8 Urology . . . . . . . . . . . . . . . . . . . . . . . . 243 1.9 1.8 1.9 37.5 Psychiatry . . . . . . . . . . . . . . . . . . . . . . 597 5.9 5.8 6.0 38.3 Neurology. . . . . . . . . . . . . . . . . . . . . . . 232 2.3 2.5 2.1 43.8 Ophthalmology. . . . . . . . . . . . . . . . . . . . 448 3.8 3.8 3.8 39.2 Otolaryngology. . . . . . . . . . . . . . . . . . . . 220 1.9 1.7 2.0 35.5 Oncology8 . . . . . . . . . . . . . . . . . . . . . . 416 1.9 1.4 2.2 30.1 Allergy. . . . . . . . . . . . . . . . . . . . . . . . . 398 0.9 0.9 0.8 43.7 Pulmonology . . . . . . . . . . . . . . . . . . . . . 420 1.8 1.9 1.7 43.1 All other specialties . . . . . . . . . . . . . . . . . 1,705 19.0 18.1 19.6 37.5
Specialty type10
Primary care . . . . . . . . . . . . . . . . . . . . . 3,204 46.7 48.2 45.8 40.6 Surgical . . . . . . . . . . . . . . . . . . . . . . . . 2,411 20.7 19.5 21.5 37.1 Medical . . . . . . . . . . . . . . . . . . . . . . . . 3,959 32.5 32.3 32.7 39.0
Practice type
Solo . . . . . . . . . . . . . . . . . . . . . . . . . . 2,089 23.7 24.6 23.2 40.8 Two physicians . . . . . . . . . . . . . . . . . . . 426 4.4 4.2 4.5 37.7 Group or HMO11 . . . . . . . . . . . . . . . . . . 5,993 59.4 58.6 60.0 38.8 Medical school or government . . . . . . . . . . 116 1.3 1.3 1.3 40.6 Other . . . . . . . . . . . . . . . . . . . . . . . . . 88 1.1 1.3 1.0 47.4 Unclassified . . . . . . . . . . . . . . . . . . . . . 862 10.0 9.9 10.1 39.0
Annual visit volume, percentile7
0–25 . . . . . . . . . . . . . . . . . . . . . . . . . . 2,607 25.0 34.7 18.8 54.5 26–50 . . . . . . . . . . . . . . . . . . . . . . . . . 2,574 25.2 20.6 28.1 32.2 51–75 . . . . . . . . . . . . . . . . . . . . . . . . . 2,155 24.8 17.9 29.3 28.3 76–100 . . . . . . . . . . . . . . . . . . . . . . . . 2,238 25.0 26.9 23.8 42.3
1Information on characteristics is from the master files of the American Medical Association and the American Osteopathic Association; updated during the survey. 2In-scope sample physicians are those confirmed during the survey to be nonfederal and involved in direct patient care in an office-based practice, excluding the specialties of radiology, pathology, and anesthesiology. 3Physicians who were selected to the 2012 NAMCS sample and confirmed, during the survey, to be in-scope. 4Responding physicians are those who were in-scope and participated fully or adequately in completion of PRFs or were unavailable to complete PRFs. 5Nonresponding physicians are those who were in-scope and participated minimally or refused to participate in NAMCS. 6Values represent a response rate among physicians selected to the office-based sample. Numerator is the number of in-scope physicians to the physician sample who participated fully or adequately in NAMCS or who did not see any patients during their sampled reporting week. Denominator is all in-scope physicians selected to the physician sample. 7Chi-square test of association is significant (p < 0.05) between physician response and indicated physician characteristic. 8Response rate is significantly different from national rate (p < 0.05). 9MSA is metropolitan statistical area. 10Physician specialty and specialty type defined in the 2012 NAMCS Public Use Data File Documentation (see ftp://ftp.cdc.gov/pub/Health_Statistics/NCHS/Dataset_Documentation/NAMCS/ doc2012.pdf). 11HMO health maintenance organization.
NOTE: PRF is Patient Record Form and NAMCS is National Ambulatory Medical Care Survey.
SOURCE: CDC/NCHS, National Ambulatory Medical Care Survey, 2012.
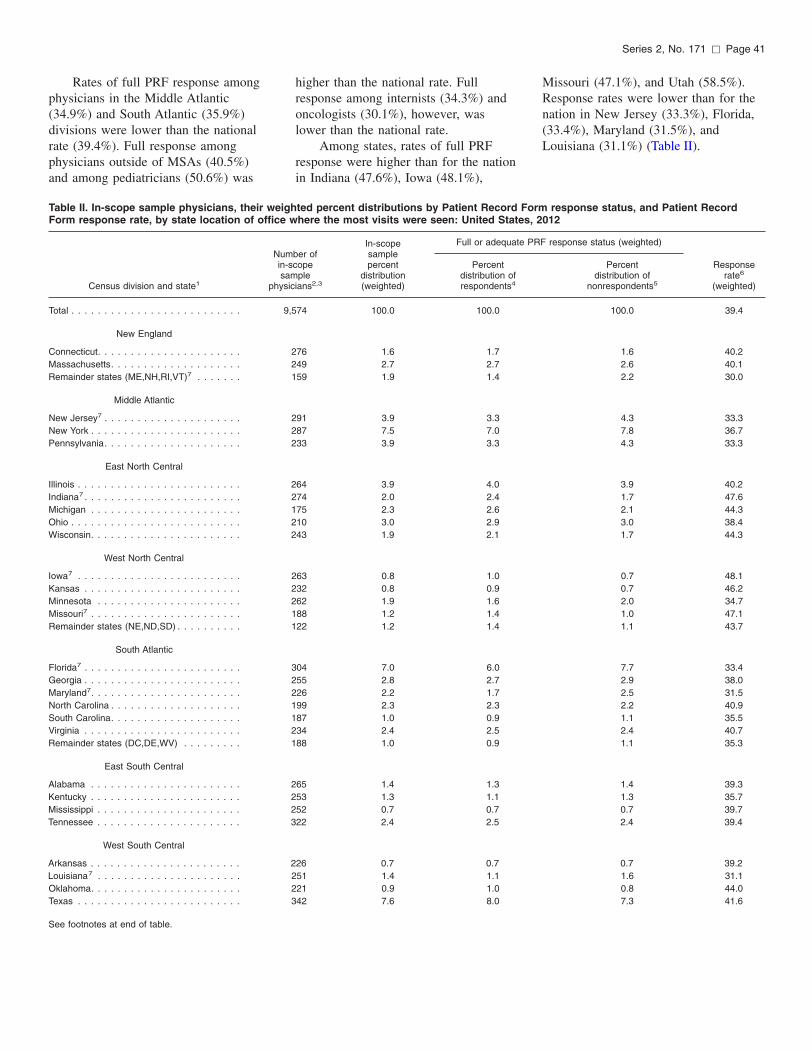
Series 2, No. 171 [ Page 41
Rates of full PRF response among higher than the national rate. Full Missouri (47.1%), and Utah (58.5%). physicians in the Middle Atlantic response among internists (34.3%) and Response rates were lower than for the (34.9%) and South Atlantic (35.9%) oncologists (30.1%), however, was nation in New Jersey (33.3%), Florida, divisions were lower than the national lower than the national rate. (33.4%), Maryland (31.5%), and rate (39.4%). Full response among Among states, rates of full PRF Louisiana (31.1%) (Table II). physicians outside of MSAs (40.5%) response were higher than for the nation and among pediatricians (50.6%) was in Indiana (47.6%), Iowa (48.1%),
Table II. In-scope sample physicians, their weighted percent distributions by Patient Record Form response status, and Patient Record Form response rate, by state location of office where the most visits were seen: United States, 2012
In-scope Full or adequate PRF response status (weighted) Number of sample in-scope percent Percent Percent Response sample distribution distribution of distribution of rate6
Census division and state1 physicians2,3 (weighted) respondents4 nonrespondents5 (weighted)
Total . . . . . . . . . . . . . . . . . . . . . . . . . . 9,574 100.0 100.0 100.0 39.4
New England
Connecticut. . . . . . . . . . . . . . . . . . . . . . 276 1.6 1.7 1.6 40.2 Massachusetts. . . . . . . . . . . . . . . . . . . . 249 2.7 2.7 2.6 40.1 Remainder states (ME,NH,RI,VT)7 . . . . . . . 159 1.9 1.4 2.2 30.0
Middle Atlantic
New Jersey7 . . . . . . . . . . . . . . . . . . . . . 291 3.9 3.3 4.3 33.3 New York . . . . . . . . . . . . . . . . . . . . . . . 287 7.5 7.0 7.8 36.7 Pennsylvania. . . . . . . . . . . . . . . . . . . . . 233 3.9 3.3 4.3 33.3
East North Central
Illinois . . . . . . . . . . . . . . . . . . . . . . . . . 264 3.9 4.0 3.9 40.2 Indiana7 . . . . . . . . . . . . . . . . . . . . . . . . 274 2.0 2.4 1.7 47.6 Michigan . . . . . . . . . . . . . . . . . . . . . . . 175 2.3 2.6 2.1 44.3 Ohio . . . . . . . . . . . . . . . . . . . . . . . . . . 210 3.0 2.9 3.0 38.4 Wisconsin. . . . . . . . . . . . . . . . . . . . . . . 243 1.9 2.1 1.7 44.3
West North Central
Iowa7 . . . . . . . . . . . . . . . . . . . . . . . . . 263 0.8 1.0 0.7 48.1 Kansas . . . . . . . . . . . . . . . . . . . . . . . . 232 0.8 0.9 0.7 46.2 Minnesota . . . . . . . . . . . . . . . . . . . . . . 262 1.9 1.6 2.0 34.7 Missouri7 . . . . . . . . . . . . . . . . . . . . . . . 188 1.2 1.4 1.0 47.1 Remainder states (NE,ND,SD) . . . . . . . . . . 122 1.2 1.4 1.1 43.7
South Atlantic
Florida7 . . . . . . . . . . . . . . . . . . . . . . . . 304 7.0 6.0 7.7 33.4 Georgia . . . . . . . . . . . . . . . . . . . . . . . . 255 2.8 2.7 2.9 38.0 Maryland7 . . . . . . . . . . . . . . . . . . . . . . . 226 2.2 1.7 2.5 31.5 North Carolina . . . . . . . . . . . . . . . . . . . . 199 2.3 2.3 2.2 40.9 South Carolina. . . . . . . . . . . . . . . . . . . . 187 1.0 0.9 1.1 35.5 Virginia . . . . . . . . . . . . . . . . . . . . . . . . 234 2.4 2.5 2.4 40.7 Remainder states (DC,DE,WV) . . . . . . . . . 188 1.0 0.9 1.1 35.3
East South Central
Alabama . . . . . . . . . . . . . . . . . . . . . . . 265 1.4 1.3 1.4 39.3 Kentucky . . . . . . . . . . . . . . . . . . . . . . . 253 1.3 1.1 1.3 35.7 Mississippi . . . . . . . . . . . . . . . . . . . . . . 252 0.7 0.7 0.7 39.7 Tennessee . . . . . . . . . . . . . . . . . . . . . . 322 2.4 2.5 2.4 39.4
West South Central
Arkansas . . . . . . . . . . . . . . . . . . . . . . . 226 0.7 0.7 0.7 39.2 Louisiana7 . . . . . . . . . . . . . . . . . . . . . . 251 1.4 1.1 1.6 31.1 Oklahoma. . . . . . . . . . . . . . . . . . . . . . . 221 0.9 1.0 0.8 44.0 Texas . . . . . . . . . . . . . . . . . . . . . . . . . 342 7.6 8.0 7.3 41.6
See footnotes at end of table.
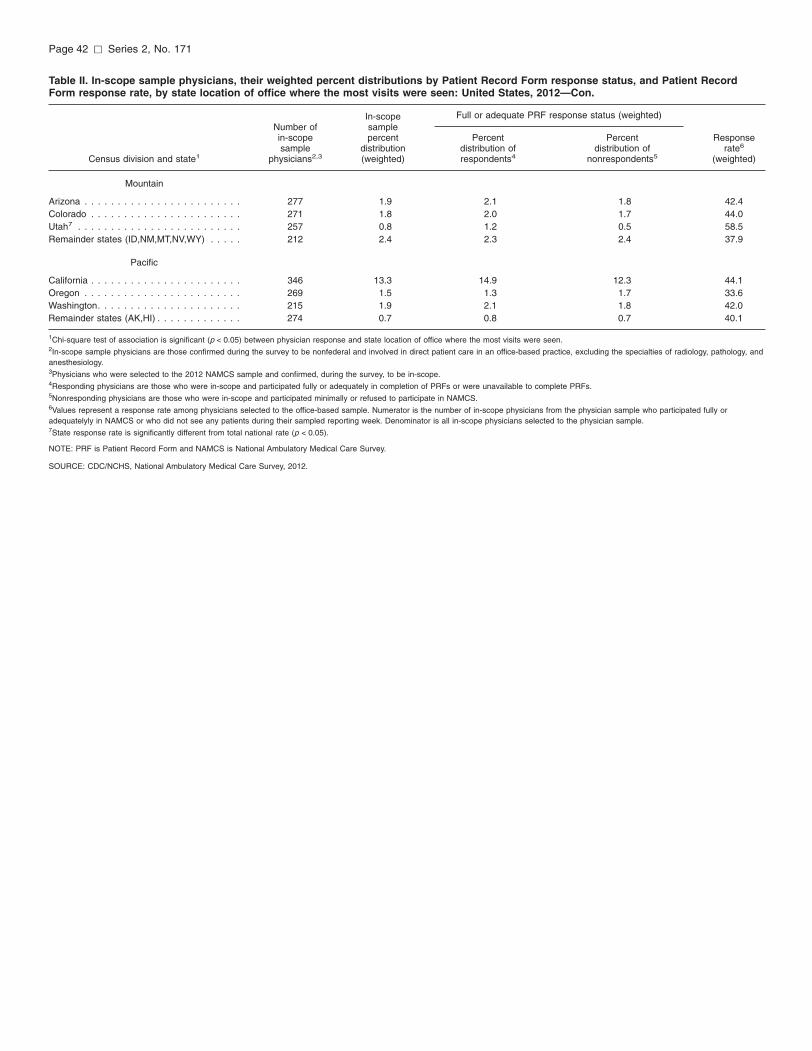
Page 42 [ Series 2, No. 171
Table II. In-scope sample physicians, their weighted percent distributions by Patient Record Form response status, and Patient Record Form response rate, by state location of office where the most visits were seen: United States, 2012—Con.
In-scope Full or adequate PRF response status (weighted) Number of sample in-scope percent Percent Percent Response sample distribution distribution of distribution of rate6
Census division and state1 physicians2,3 (weighted) respondents4 nonrespondents5 (weighted)
Mountain
Arizona . . . . . . . . . . . . . . . . . . . . . . . . 277 1.9 2.1 1.8 42.4 Colorado . . . . . . . . . . . . . . . . . . . . . . . 271 1.8 2.0 1.7 44.0 Utah7 . . . . . . . . . . . . . . . . . . . . . . . . . 257 0.8 1.2 0.5 58.5 Remainder states (ID,NM,MT,NV,WY) . . . . . 212 2.4 2.3 2.4 37.9
Pacific
California . . . . . . . . . . . . . . . . . . . . . . . 346 13.3 14.9 12.3 44.1 Oregon . . . . . . . . . . . . . . . . . . . . . . . . 269 1.5 1.3 1.7 33.6 Washington. . . . . . . . . . . . . . . . . . . . . . 215 1.9 2.1 1.8 42.0 Remainder states (AK,HI) . . . . . . . . . . . . . 274 0.7 0.8 0.7 40.1
1Chi-square test of association is significant (p < 0.05) between physician response and state location of office where the most visits were seen. 2In-scope sample physicians are those confirmed during the survey to be nonfederal and involved in direct patient care in an office-based practice, excluding the specialties of radiology, pathology, and anesthesiology. 3Physicians who were selected to the 2012 NAMCS sample and confirmed, during the survey, to be in-scope. 4Responding physicians are those who were in-scope and participated fully or adequately in completion of PRFs or were unavailable to complete PRFs. 5Nonresponding physicians are those who were in-scope and participated minimally or refused to participate in NAMCS. 6Values represent a response rate among physicians selected to the office-based sample. Numerator is the number of in-scope physicians from the physician sample who participated fully or adequatelyly in NAMCS or who did not see any patients during their sampled reporting week. Denominator is all in-scope physicians selected to the physician sample. 7State response rate is significantly different from total national rate (p < 0.05).
NOTE: PRF is Patient Record Form and NAMCS is National Ambulatory Medical Care Survey.
SOURCE: CDC/NCHS, National Ambulatory Medical Care Survey, 2012.
Vital and Health Statistics Series Descriptions
ACTIVE SERIES
Series 1. Programs and Collection Procedures—This type of report describes the data collection programs of the National Center for Health Statistics. Series 1 includes descriptions of the methods used to collect and process the data, definitions, and other material necessary for understanding the data.
Series 2. Data Evaluation and Methods Research—This type of report concerns statistical methods and includes analytical techniques, objective evaluations of reliability of collected data, and contributions to statistical theory. Also included are experimental tests of new survey methods, comparisons of U.S. methodologies with those of other countries, and as of 2009, studies of cognition and survey measurement, and final reports of major committees concerning vital and health statistics measurement and methods.
Series 3. Analytical and Epidemiological Studies—This type of report presents analytical or interpretive studies based on vital and health statistics. As of 2009, Series 3 also includes studies based on surveys that are not part of continuing data systems of the National Center for Health Statistics and international vital and health statistics reports.
Series 10. Data From the National Health Interview Survey—This type of report contains statistics on illness; unintentional injuries; disability; use of hospital, medical, and other health services; and a wide range of special current health topics covering many aspects of health behaviors, health status, and health care utilization. Series 10 is based on data collected in this continuing national household interview survey.
Series 11. Data From the National Health Examination Survey, the National Health and Nutrition Examination Surveys, and the Hispanic Health and Nutrition Examination Survey— In this type of report, data from direct examination, testing, and measurement on representative samples of the civilian noninstitutionalized population provide the basis for (1) medically defined total prevalence of specific diseases or conditions in the United States and the distributions of the population with respect to physical, physiological, and psychological characteristics, and (2) analyses of trends and relationships among various measurements and between survey periods.
Series 13. Data From the National Health Care Survey—This type of report contains statistics on health resources and the public’s use of health care resources including ambulatory, hospital, and long-term care services based on data collected directly from health care providers and provider records.
Series 20. Data on Mortality—This type of report contains statistics on mortality that are not included in regular, annual, or monthly reports. Special analyses by cause of death, age, other demographic variables, and geographic and trend analyses are included.
Series 21. Data on Natality, Marriage, and Divorce—This type of report contains statistics on natality, marriage, and divorce that are not included in regular, annual, or monthly reports. Special analyses by health and demographic variables and geographic and trend analyses are included.
Series 23. Data From the National Survey of Family Growth—These reports contain statistics on factors that affect birth rates, including contraception and infertility; factors affecting the formation and dissolution of families, including cohabitation, marriage, divorce, and remarriage; and behavior related to the risk of HIV and other sexually transmitted diseases. These statistics are based on national surveys of women and men of childbearing age.
DISCONTINUED SERIES
Series 4. Documents and Committee Reports—These are final reports of major committees concerned with vital and health statistics and documents. The last Series 4 report was published in 2002. As of 2009, this type of report is included in Series 2 or another appropriate series, depending on the report topic.
Series 5. International Vital and Health Statistics Reports—This type of report compares U.S. vital and health statistics with those of other countries or presents other international data of relevance to the health statistics system of the United States. The last Series 5 report was published in 2003. As of 2009, this type of report is included in Series 3 or another series, depending on the report topic.
Series 6. Cognition and Survey Measurement—This type of report uses methods of cognitive science to design, evaluate, and test survey instruments. The last Series 6 report was published in 1999. As of 2009, this type of report is included in Series 2.
Series 12. Data From the Institutionalized Population Surveys— The last Series 12 report was published in 1974. Reports from these surveys are included in Series 13.
Series 14. Data on Health Resources: Manpower and Facilities— The last Series 14 report was published in 1989. Reports on health resources are included in Series 13.
Series 15. Data From Special Surveys—This type of report contains statistics on health and health-related topics collected in special surveys that are not part of the continuing data systems of the National Center for Health Statistics. The last Series 15 report was published in 2002. As of 2009, reports based on these surveys are included in Series 3.
Series 16. Compilations of Advance Data From Vital and Health Statistics—The last Series 16 report was published in 1996. All reports are available online, and so compilations of Advance Data reports are no longer needed.
Series 22. Data From the National Mortality and Natality Surveys— The last Series 22 report was published in 1973. Reports from these sample surveys, based on vital records, are published in Series 20 or 21.
Series 24. Compilations of Data on Natality, Mortality, Marriage, and Divorce—The last Series 24 report was published in 1996. All reports are available online, and so compilations of reports are no longer needed.
For answers to questions about this report or for a list of reports published in these series, contact:
Information Dissemination Staff National Center for Health Statistics Centers for Disease Control and Prevention 3311 Toledo Road, Room 5419 Hyattsville, MD 20782
Tel: 1–800–CDC–INFO (1–800–232–4636) TTY: 1–888–232–6348 Internet: http://www.cdc.gov/nchs Online request form: http://www.cdc.gov/cdc-info For e-mail updates on NCHS publication releases, subscribe
online at: http://www.cdc.gov/nchs/govdelivery.htm.
U.S. DEPARTMENT OF HEALTH & HUMAN SERVICES
Centers for Disease Control and Prevention National Center for Health Statistics 3311 Toledo Road, Room 5419 Hyattsville, MD 20782–2064
OFFICIAL BUSINESS PENALTY FOR PRIVATE USE, $300
For more NCHS
Series Reports, visit:
http://www.cdc.gov/nchs/products/series.htm
FIRST CLASS MAIL POSTAGE & FEES PAID
CDC/NCHS PERMIT NO. G-284
DHHS Publication No. 2016–1371, Series 2, No. 171 CS260963