noosa district state high school (2088) queensland state
TRANSCRIPT
T
DEPARTMENT OF EDUCATION, TRAINING AND EMPLOYMENT
Noosa District State High School (2088)
Queensland State School Reporting
2012 School Annual Report
YPEOVER TO INSERT SCHOOL NAME
Postal address PO Box 564 Cooroy 4563
Phone (07) 5472 2222
Fax (07) 5472 2200
Email [email protected]
Webpages Additional reporting information pertaining to Queensland state schools is located on the My School website and the Queensland Government data website.
Contact Person Principal - Chris Roff [email protected]
Principal’s foreword
Introduction
Noosa District State High School is a student-centred learning community, which fosters care and compassion. We aspire to be aware of others and their cultures, accept diversity within a democratic society, and acknowledge and enjoy the rights and privileges of Australian Citizenship. These aspirations are reflected in the three core values which underpin the school philosophy: • Be Responsible: be accountable for your own actions, resolve differences in constructive, non-aggressive and peaceful ways, contribute to society and to civic life, take care of the environment. • Be Respectful: treat self and others with consideration and regard, respect another person’s point of view. • Be an Active Learner: seek to accomplish individual excellence, reach worthy and admirable goals through participation in academic, community and sporting pursuits. Our strength lies in our vibrant multi-campus educational community. The campuses at Cooroy and Pomona enable all of our students to engage in a broad range of educational experiences in the pursuit of “Excellence through Diversity”. We are also blessed with a very highly qualified, talented and resourceful teaching staff, who work together to develop valuable and interesting learning opportunities for our students. In the Junior Secondary phase, our students study a course including English, Mathematics, Science, SOSE, LOTE (Japanese and French), Technology (Industrial Skills, Life Technology, Business, Agriculture), The Arts (Visual Art, Dance, Drama, Music) and Heath & Physical Education. Students and parents are invited to nominate themed core classes that suit the particular student strengths and needs
Summit classes – academic focus with an emphasis on extension activities designed to deepen understanding
Cultural classes – opportunity for “arts” oriented students to group, and for teaching to emphasise a pedagogy designed around performance and creativity – students can choose more elective subjects in “the Arts”.
General classes – all round courses that emphasise consolidation of strong basic numeracy and literacy, with a broad range of experiences and electives offered
Focus classes – an overt emphasis on ensuring basic skills are taught and learned well, whilst delivering electives in a more concrete and directed way
DEPARTMENT OF EDUCATION, TRAINING AND EMPLOYMENT
Queensland State School Reporting
2012 School Annual Report
In the Senior Phase students are able to launch from this platform into diverse academic and vocational pathways. Senior students are also further encouraged through a range of programs and initiatives to develop high ideals and a sense of community service. We are a school that “cares” with a rich Special Education program catering for 55 students with disability. Other students with particular needs are also supported to achieve their full potential and gifted students are encouraged to extend themselves We offer a rich variety of support programs designed to facilitate teamwork and encourage individual development of all students, including work placement, work experience, structured work place learning, Rock and Water personal development courses, Duke of Edinburgh program at Bronze, Silver and Gold level and other Life Coaching courses to suit student needs. Our school has forged close alliances with youth support agencies such as United Synergies to enable our ‘at risk’ students to follow alternate pathways to active and informed citizenship. Our Chaplain, School Based Youth Health Nurse, Year Level coordinators and Youth Coordinator also play significant roles in the delivery of proactive programmes addressing individual needs.
We also have a whole school program called “Planning for Excellence” that engages every student in setting personal improvement targets at the end of each reporting period. This report outlines our 2012 progress towards individual excellence for every learner.
School progress towards its goals in 2012
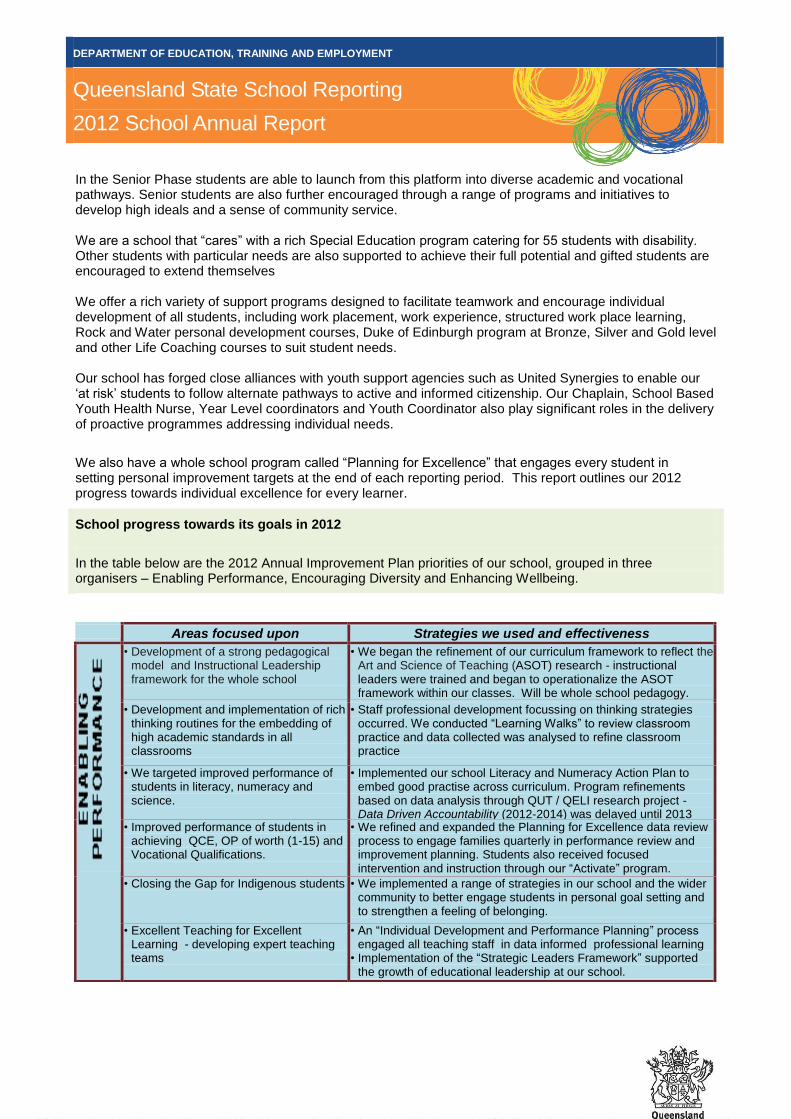
In the table below are the 2012 Annual Improvement Plan priorities of our school, grouped in three organisers – Enabling Performance, Encouraging Diversity and Enhancing Wellbeing.
Areas focused upon Strategies we used and effectiveness
• Development of a strong pedagogical model and Instructional Leadership framework for the whole school
• We began the refinement of our curriculum framework to reflect the Art and Science of Teaching (ASOT) research - instructional leaders were trained and began to operationalize the ASOT framework within our classes. Will be whole school pedagogy.
• Development and implementation of rich thinking routines for the embedding of high academic standards in all classrooms
• Staff professional development focussing on thinking strategies occurred. We conducted “Learning Walks” to review classroom practice and data collected was analysed to refine classroom practice
• We targeted improved performance of students in literacy, numeracy and science.
• Implemented our school Literacy and Numeracy Action Plan to embed good practise across curriculum. Program refinements based on data analysis through QUT / QELI research project - Data Driven Accountability (2012-2014) was delayed until 2013
• Improved performance of students in achieving QCE, OP of worth (1-15) and Vocational Qualifications.
• We refined and expanded the Planning for Excellence data review process to engage families quarterly in performance review and improvement planning. Students also received focused intervention and instruction through our “Activate” program. • Closing the Gap for Indigenous students • We implemented a range of strategies in our school and the wider community to better engage students in personal goal setting and to strengthen a feeling of belonging.
• Excellent Teaching for Excellent Learning - developing expert teaching teams
• An “Individual Development and Performance Planning” process engaged all teaching staff in data informed professional learning
• Implementation of the “Strategic Leaders Framework” supported the growth of educational leadership at our school.
• Student input into reflecting on classroom practice and curriculum delivery (2012-2015)

DEPARTMENT OF EDUCATION, TRAINING AND EMPLOYMENT
Queensland State School Reporting
2012 School Annual Report
In 2012, Noosa District State High School was selected to become one of the first Independent Public Schools in Queensland, commencing in the 2013 school year. A considerable amount of time was spent planning for this increased devolution of responsibility for school management and processes.
• We reviewed learning delivery options across the two campuses in preparation for Flying Start (Junior Secondary) reforms commencing in 2015
• A briefing paper was developed seeking approval to begin a community engagement program to determine a future vision for a multi-campus model that best meets the needs of our expanding student 2015 cohort (First year of year 7 students in high school)
• We reviewed the diversity of curriculum offerings across Junior and Senior Secondary programs (including Gateway programs - Aerospace and Manufacturing)
• We refined our curriculum frameworks to reflect Australian Curriculum, Queensland Studies Authority (QSA) offerings and localised vocational and learning support offerings
• We implementation of “like-minded” academic class groupings to engage students in preferred pathway studies and academically talented student programs – successful outcomes and support
• Integration of Learning Technologies • We expanded National Secondary Schools Computer Funding supported 1:1 laptop program in the school to all year 10, 11 and 12 students. Planning completed for year 9 in 2013.
• We enhanced the diversity of technology rich learning options for students and staff and further developed online learning pathways and resources to enhance flexible learning pathways for all (eg Virtual Library)
• We targeted the transition of students across learning junctures (Primary to Junior Secondary, Junior Secondary to Senior, Exit to Post School Destinations)
• Continued implementation and refinement of Senior Education and Training planning for excellence processes to inform analysis of individualized transition between phases
• We continued to refine our vocational pathway options as informed by labour market information and “Next Steps Survey” data
• We focused upon establishing and maintaining effective relationships with students
• We continued the implementation of a reviewed “Responsible Behaviour Plan for Students” and many senior staff members attended professional learning in Restorative Practices
• Implementation of Art and Science of Teaching pedagogical framework (Q8) across all classrooms (2012-2013)
• Student Voice enhanced through Junior and Senior Leadership programs, Student Council and School Council (Ongoing)
• We reviewed and refined Staff wellbeing processes to support all staff
• We expanded our communication options and embedded these into the organisational culture of the school to ensure effective and efficient information flow.
• We re-established the staff social club and started work on a new whole cooroy campus staff room to encourage collegiality
• The Staff Services HOD provided pathways for staff to internal and external support options as needed
• Embedding of common language of instruction to enable open and reflective conversation of practice in order to support staff growth
• Celebration of Excellence • We supported and expanded processes to recognise and celebrate success of all students, staff and partners across our community
• We continued to embed sustainable practices within our workplace
• Paper recycling, solar panel use, energy and water reduction processes continued
• Great efforts were made to improve school facilities and grounds
• We discussed a school facilities improvement master plan to reflect transition of year 7 in 2015
• Repairs and tree trimming/hedging were prioritized in 2012
Future outlook
In 2013, the school will celebrate our Golden Jubilee – 50 years of quality education to the communities we serve, from Noosa to the Hinterland. A spectacular birthday celebration is planned for May 24
th/25
th that
will showcase the achievements of the school to date, the current talent within our staff and students and foreshadow future plans and ambitions for further growth in curriculum offerings and student support.

DEPARTMENT OF EDUCATION, TRAINING AND EMPLOYMENT
Queensland State School Reporting
2012 School Annual Report
The 2013 Implementation Plan continues the focus on “Excellent Teaching for Excellent Learning” with an overt focus on embedding the guiding questions of the Art and Science of Teaching, (a pedagogical model for promoting more deep understanding and increasing effective teaching and learning). This will inform the writing of the “School Pedagogical Framework” in 2013. We will continue to develop and devise strategies to improve student achievement in Literacy and Numeracy, through effective data analysis, focussed teaching, identifying learning gaps and addressing these, and increasing familiarisation with requirements of various genres and test protocols. A strategic alliance with “Mighty Minds” will enable focussed teaching of skills to our year 8 and 9 students in 2013. The school will expand its 1:1 laptop program to all year 9 students in 2013, thus encouraging parent take up of this take home option for all students in years 9 to 12. This will underpin focussed professional development of teachers to increase their understanding and engagement with the new paradigm of teaching that enhances 21
st Century fluencies in our students. Virtual Library lessons will be written by our
teachers, reflecting Australian Curriculum requirements, and will be shared with colleagues.
The new Australian Curriculum units in History will be introduced in 2013. The educational reforms of “A Flying Start for Queensland” will also be enacted at both campuses, especially moving towards defining and establishing our concept of Junior Secondary School education. Deeper understanding of adolescence will underwrite an overt focus upon the learning needs of year 8 students in 2013, which will grow to years 7-9 by 2015 – this will include separated territory within the school for year 8 students, and carefully selected teachers with talent in developing this age group intellectually and supporting them emotionally.
In 2013, we will formalise our approach to building partnerships through development of a “Community Engagement Framework”. This will complement the work of the newly revamped “School Council”, as part of our Independent Public School governance structures. We envisage more freedom to engage the local community and parents in a rich conversation about the future structure, directions and priorities of our school as we enter our second 50 years of existence as a quality place of learning for all.
We will continue to support our programs of excellence in Aviation, Formula One Engineering, Hospitality, Live Production, Farming, Cattle Showing, Sport (basketball, touch football, volleyball and soccer in particular), Australian Business Week, VINCIT week, Marine Education, Duke of Edinburgh, etc.
We will also begin our new Junior Summit program – working with local feeder primary schools to identify gifted students in years 5-7 to join a range of programs offered by our teachers to stretch their understanding in such fields as Science Agriculture, Digital Design and Multimedia, Performing Arts, Aerospace, F1 in Schools and Marine Science. This is a key component of our planning for Junior Secondary education, providing opportunities for academically able students to experience our school, staff and facilities whilst still at Primary school.
In 2013, we will also join Education Queensland International (EQI) as an accredited Study Tour school for students from other countries – building on our successful sister school relationship with
In 2013, our core priorities are encapsulated in the acronym “MITCh”, focussing staff upon
* Marketing * Innovation * Talent identification and development * Community partnerships
Our school at a glance
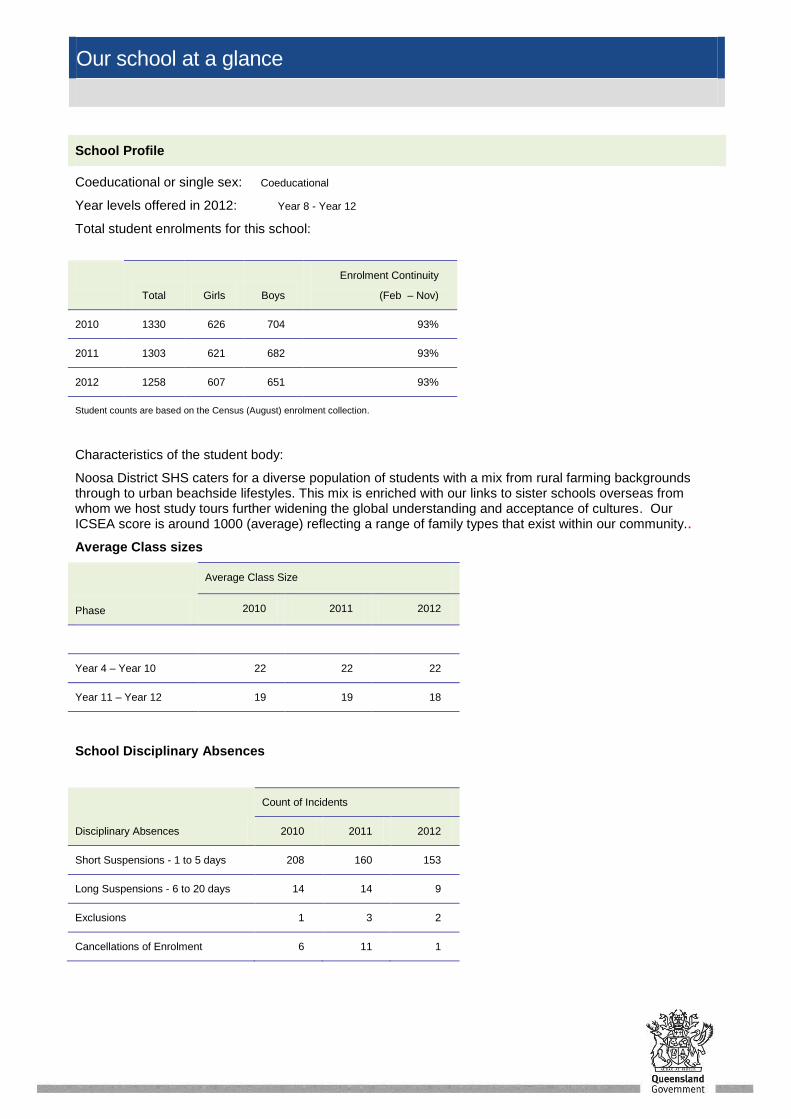
School Profile
Coeducational or single sex: Coeducational
Year levels offered in 2012: Year 8 - Year 12
Total student enrolments for this school:
Total Girls Boys
Enrolment Continuity
(Feb – Nov)
2010 1330 626 704 93%
2011 1303 621 682 93%
2012 1258 607 651 93%
Student counts are based on the Census (August) enrolment collection.
Characteristics of the student body:
Noosa District SHS caters for a diverse population of students with a mix from rural farming backgrounds through to urban beachside lifestyles. This mix is enriched with our links to sister schools overseas from whom we host study tours further widening the global understanding and acceptance of cultures. Our ICSEA score is around 1000 (average) reflecting a range of family types that exist within our community..
Average Class sizes
Phase
Average Class Size
2010 2011 2012
Year 4 – Year 10 22 22 22
Year 11 – Year 12 19 19 18
School Disciplinary Absences
Disciplinary Absences
Count of Incidents
2010 2011 2012
Short Suspensions - 1 to 5 days 208 160 153
Long Suspensions - 6 to 20 days 14 14 9
Exclusions 1 3 2
Cancellations of Enrolment 6 11 1

Our school at a glance
Curriculum offerings
Our distinctive curriculum offerings
We are a Gateway School in Aerospace and Aviation (from 2010)
• Gateway School in Engineering and Manufacturing
• Marine Studies and Marine & Aquatic Practices
• Agriculture and Rural Operations
• Hospitality, Tourism and Child Care
• Live Performance, Theatre and Events (Live Production Cert 3 offered)
• Duke of Edinburgh Program – Bronze, Silver and Gold class groups
• S.W.A.N. program - Students With Additional Needs: Literacy, Numeracy and Duke of Edinburgh
Extra curricula activities
• VINCIT Week - (Vocational Investigations, Nurturing Civics, Initiating Teamwork) - targeted programs for each year level
• Australian Business Week (National Champion School 2009, Awards also in 2006 to 2008) All year 11 students engage in this weeklong business and leadership Enterprise Education program. The program develops understanding of the skills to generate individual and team success. Whilst building stronger teamwork amongst our year 11 students, this program is strongly supported by the community and businesses, with impressive sponsorship and mentor support.
• Our Agriculture program enables students to join our Award Winning Cattle Show Team
• Biennial Variety Show / Fashion Show / Musical and performance opportunities in Drama, Dance, Orchestra, Stage Band, Choir.
• Formula 1 and carbon dioxide Car Program – International Finalist in 2009 (2nd and 3rd), National Finalist (2010 and 2012) and State Award winners in 2012 (Engineering Challenge to design, build, race and market model formula one vehicles)
How Information and Communication Technologies are used to assist learning
Our school embraces the use of a range of digital technologies to enrich the curriculum delivery for all students. Desktop PCs, Laptops and iPod Touch technologies are utilised along with Smart boards and the departments’ online learning environment to broaden the scope of the classroom. Our focus is on widening the digital pedagogies used by our teachers to enable digitally rich blended learning experiences for all students. The school is moving towards a mobile learning approach with all senior students having access to personal laptops.
Social climate
Student care and welfare is a prime focus of Noosa District State High School. At the core of this support is the development of strong relationships. Our home group system enables students to travel through their five years with the same core group of students, teachers and year level coordinators – thus enabling the development of relationships that support both academic and social growth of our students.

Our school at a glance
Additional support is offered by staff members including: Guidance Officers, School Based Youth Health Nurse, School Chaplains, Client Services Heads of Department (Middle Phase, Senior Phase, Student Services and School Management), Faculty Heads of Department, Special Education and Support Staff.
Because our students come from a diverse range of social and economic backgrounds, we have a strong student support network that endorses and promotes socially just practices within a supportive school environment. This network provides a range of services including inter-agency support networks, career and personal development programs, resilience programs (Rock and Water), life skills (Life Coaching) and transition programs to the workforce.
Our Support Services team focuses on providing students with a disability with a structured, caring environment offering appropriate challenges to all students. The focus is on personal development, which is scaffolded by the Duke of Edinburgh program, a highlight for all involved.
Student Council programs enrich the general school climate. Our student leaders work with administration and staff to deliver lunchtime sporting, civic and cultural enrichment programs for students.
Parent, student and staff satisfaction with the school
When compared with schools across the state, our levels of parent, student and staff satisfaction with the school are similar in nature. Solid achievement performance results at the end of 2010 and into 2011 supported the work being done to continually improve the trends reflected in this satisfaction data. As a school we embrace feedback and suggestions from all members of our community. Students and parents believe that we have a relatively safe school environment, which is pleasing as this confirms our efforts to build a sense of community and belonging within the school are meeting some success.

Our school at a glance
Performance measure (Nationally agreed items shown*)
Percentage of parents/caregivers who agree that: 2012#
their child is getting a good education at school 77.1%
this is a good school 86.1%
their child likes being at this school* 86.1%
their child feels safe at this school* 91.7%
their child's learning needs are being met at this school* 83.3%
their child is making good progress at this school* 80.6%
teachers at this school expect their child to do his or her best* 88.9%
teachers at this school provide their child with useful feedback about his or her school work* 82.9%
teachers at this school motivate their child to learn* 75.0%
teachers at this school treat students fairly* 85.3%
they can talk to their child's teachers about their concerns* 91.2%
this school works with them to support their child's learning* 85.3%
this school takes parents' opinions seriously* 77.4%
student behaviour is well managed at this school* 71.4%
this school looks for ways to improve* 85.3%
this school is well maintained* 94.3%
Performance measure (Nationally agreed items shown*)
Percentage of students who agree that: 2012#
they are getting a good education at school 83.9%
they like being at their school* 72.1%
they feel safe at their school* 84.0%
their teachers motivate them to learn* 72.4%
their teachers expect them to do their best* 90.2%
their teachers provide them with useful feedback about their school work* 78.9%
teachers treat students fairly at their school* 68.2%
they can talk to their teachers about their concerns* 61.6%
their school takes students' opinions seriously* 60.5%
Our school at a glance
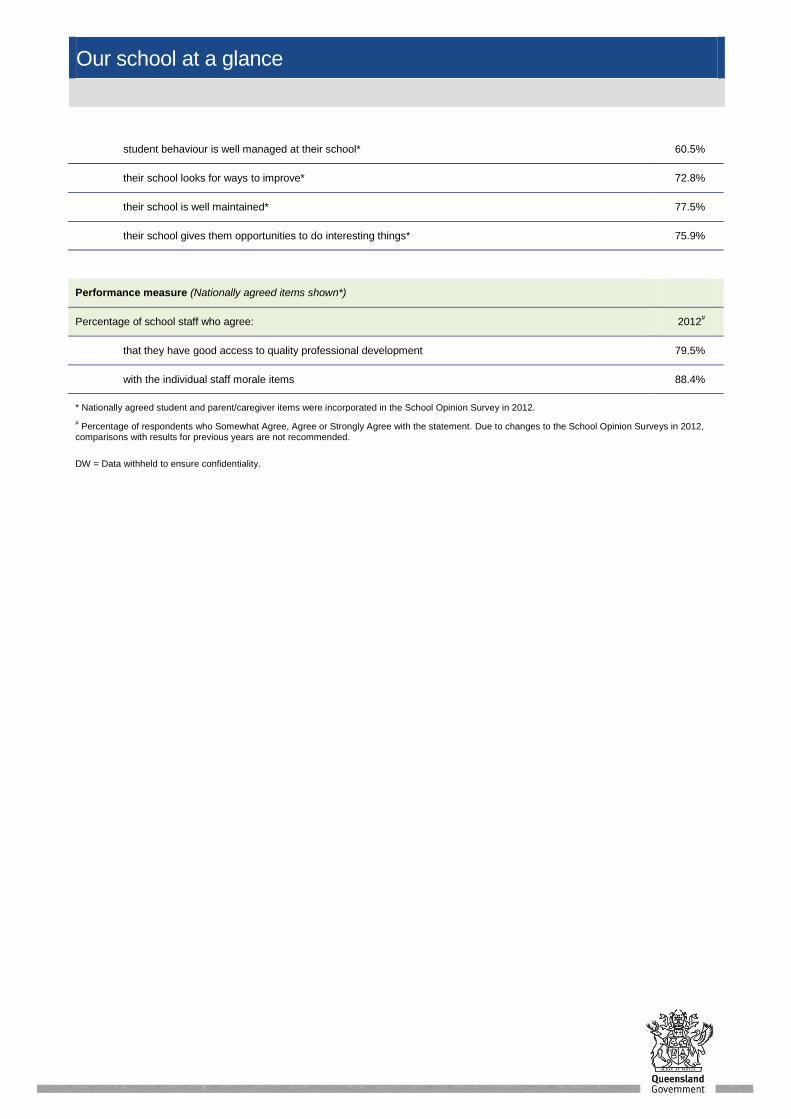
student behaviour is well managed at their school* 60.5%
their school looks for ways to improve* 72.8%
their school is well maintained* 77.5%
their school gives them opportunities to do interesting things* 75.9%
Performance measure (Nationally agreed items shown*)
Percentage of school staff who agree: 2012#
that they have good access to quality professional development 79.5%
with the individual staff morale items 88.4%
* Nationally agreed student and parent/caregiver items were incorporated in the School Opinion Survey in 2012.
# Percentage of respondents who Somewhat Agree, Agree or Strongly Agree with the statement. Due to changes to the School Opinion Surveys in 2012,
comparisons with results for previous years are not recommended.
DW = Data withheld to ensure confidentiality.

Our school at a glance
Involving parents in their child’s education
Parents are an integral part of learning and are encouraged to be part of their child’s secondary schooling at our school. The School Council and Parents & Citizens Association groups support parents to engage with their child’s learning. As a school we communicate regularly through our website, electronic newsletters, letters home, emails, text messages and teacher phone calls. We invite parents to be part of information evenings, interviews and celebratory parades. Across the curriculum parents as volunteers enrich the learning opportunities we offer. The P&C operates the school canteen and uniform shop that form the basis of financial support for student learning – the success of these operations is also a testament to the parent volunteers that enjoy contributing this way. The School Council provides another opportunity for parent representatives to have input into the strategic direction and priorities of the school. We are open and welcoming of any and all parent interaction – we exist to serve our community, and see the value in hearing feedback from our client parents to shape further our efforts to be responsive and inclusive of all views. Our goal is successful educational outcomes for all our students – working collaboratively with parents in this endeavour enhances our school immeasurably.
Reducing the school’s environmental footprint
Data is sourced from school's annual utilities return and is reliant on the accuracy of these returns. Water usage was a key focus during 2012, and will continue to engage our actions in 2013. Across both campuses we are implementing programs to reduce electricity use with Solar installed at Cooroy and planned for Pomona. Environmental footprint indicators, 2009-2012
Environmental footprint indicators
Electricity kWh
Water kL
2009-2010 648,903 5,761
2010-2011 585,990 5,916
2011-2012 627,440 7,759
Our staff profile
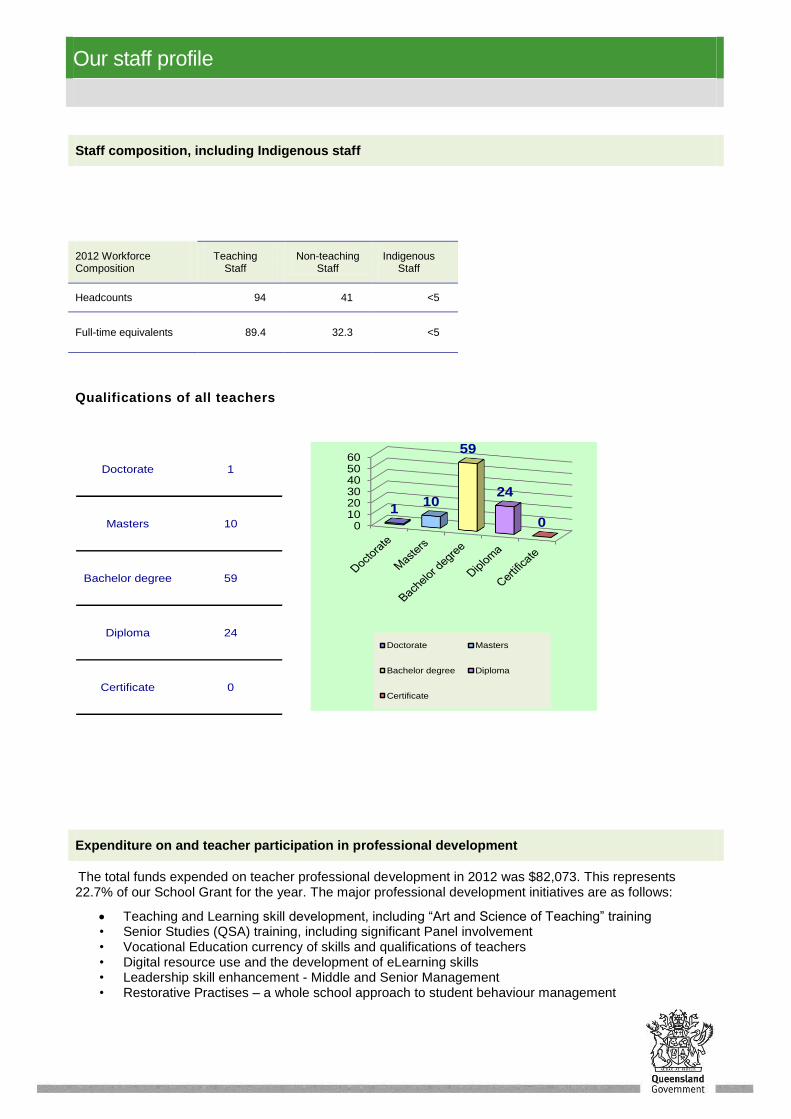
Staff composition, including Indigenous staff
2012 Workforce Composition
Teaching Staff
Non-teaching Staff
Indigenous Staff
Headcounts 94 41 <5
Full-time equivalents 89.4 32.3 <5
Qualifications of all teachers
Doctorate 1
Masters 10
Bachelor degree 59
Diploma 24
Certificate 0
0102030405060
110
59
24
0
Doctorate Masters
Bachelor degree Diploma
Certificate
Expenditure on and teacher participation in professional development
The total funds expended on teacher professional development in 2012 was $82,073. This represents 22.7% of our School Grant for the year. The major professional development initiatives are as follows:
Teaching and Learning skill development, including “Art and Science of Teaching” training • Senior Studies (QSA) training, including significant Panel involvement • Vocational Education currency of skills and qualifications of teachers • Digital resource use and the development of eLearning skills • Leadership skill enhancement - Middle and Senior Management • Restorative Practises – a whole school approach to student behaviour management

Our staff profile
The proportion of the teaching staff involved in professional development activities during 2011 was 100%.
Average staff attendance 2010 2011 2012
Staff attendance for permanent and temporary staff and school leaders. 95.7% 96% 95.8%
Proportion of staff retained from the previous school year
From the end of the previous school year, 95.7% of staff was retained by the school for the entire 2012 school year.
School income broken down by funding source
School income broken down by funding source is available via the My School website at http://www.myschool.edu.au/.
To access our income details, click on the My School link above. You will then be taken to the My School website with the following ‘Find a school’ text box.
Where it says ‘Search by school name’, type in the name of the school you wish to view, and select <GO>. Read and follow the instructions on the next screen; you will be asked to accept the Terms of Use and Privacy Policy before being given access to the school’s My School entry web page.
School financial information is available by selecting ‘School finances’ in the menu box in the top left corner of the school’s entry web page. If you are unable to access the internet, please contact the school for a paper copy of income by funding source.

Performance of our students
Key student outcomes
Student attendance 2010 2011 2012
The overall attendance rate for the students at this school (shown as a percentage). 90% 90% 88%
The overall attendance rate in 2012 for all Queensland state Secondary schools was 88%.
Student attendance rate for each year level (shown as a percentage)
Year 8
Year 9
Year 10
Year 11
Year 12
2010 91% 88% 90% 89% 91%
2011 91% 87% 90% 91% 91%
2012 90% 86% 87% 89% 91%
DW = Data withheld to ensure confidentiality.
Student Attendance Distribution
The proportions of students by attendance range.
22
21
25
18
20
21
33
29
33
28
30
21
0% 20% 40% 60% 80% 100%
2010
2011
2012
Proportion of Students
0% to <85% 85% to <90% 90% to <95% 95% to 100%Attendance:
Description of how non-attendance is managed by the school
Non-attendance is managed in state schools in line with the DET policies, SMS-PR-029: Managing Student Absences and SMS-PR-036: Roll Marking in State Schools, which outline processes for managing and recording student attendance and absenteeism. This policy is implemented in the school through the use of formal and class roll marking which enables the tracking of students from lesson to lesson. Staff members collate the data across the day. The school contacts parents who do not explain a student absence on the day of absence. Teachers and administration carry out follow up contact to seek understanding of prolonged absences. The aim is to ensure 100% attendance; in special circumstance it may be deemed necessary to support parents and students through use of flexible attendance and exemption processes.
In 2012 we introduced a computer based program called “ID Attend”. This provides a quick and easy way to track each student each lesson of each day, and then for absent students the program initiates a text message to the parents letting them know by 2pm that day. Our hope is that this information enables parents to contact us if there has been a mistake, or to be instantly aware if their child is not at school when
Performance of our students
they expect.
Year level coordinators have a key role in calling parents of persistent non attending students to identify any reasons and to remind parents of their obligation to ensure that their child attends every day.
National Assessment Program – Literacy and Numeracy (NAPLAN) results – our reading, writing, spelling, grammar and punctuation, and numeracy results for the Years 3, 5, 7 and 9.
Our reading, writing, spelling, grammar and punctuation, and numeracy results for the Years 3, 5, 7 and 9 are available via the My School website at http://www.myschool.edu.au/.
To access our NAPLAN results, click on the My School link above. You will then be taken to the My School website with the following ‘Find a school’ text box.
Where it says ‘Search by school name’, type in the name of the school whose NAPLAN results you wish to view, and select <GO>.
Read and follow the instructions on the next screen; you will be asked to accept the Terms of Use and Privacy Policy before being able to access NAPLAN data.
If you are unable to access the internet, please contact the school for a paper copy of our school’s NAPLAN results.
Achievement – Closing the Gap
Indigenous students continue to achieve at similar levels to all students within the Noosa District community. Due to the small population of indigenous students our focus remains on individual progress rather than group data. The school is working towards implementing the EATSIPS strategy and has been working closely with our Aboriginal Liaison Officer and the community to expand the number and range of opportunities for our indigenous students. Indigenous student attendance rates are only very slightly below that of the whole school cohort, and levels of retention are also good.

Performance of our students
Apparent retention rates Year 10 to Year 12 2010 2011 2012
Year 12 student enrolment as a percentage of the Year 10 student cohort. 77% 70% 74%
Outcomes for our Year 12 cohorts 2010 2011 2012
Number of students receiving a Senior Statement. 231 191 186
Number of students awarded a Queensland Certificate Individual Achievement. 0 3 1
Number of students receiving an Overall Position (OP). 118 98 93
Number of students who are completing/continuing a School-based Apprenticeship or Traineeship (SAT).
59 40 39
Number of students awarded one or more Vocational Educational Training (VET) qualifications
(incl. SAT). 177 147 147
Number of students awarded an Australian Qualification Framework Certificate II or above. 134 107 123
Number of students awarded a Queensland Certificate of Education (QCE) at the end of Year 12. 180 145 143
Number of students awarded an International Baccalaureate Diploma (IBD). 0 0 0
Percentage of OP/IBD eligible students with OP 1-15 or an IBD. 81% 80% 71%
Percentage of Year 12 students who are completing or completed a SAT or were awarded one or more of the following: QCE, IBD, VET qualification.
96% 97% 97%
Percentage of Queensland Tertiary Admissions Centre (QTAC) applicants receiving an offer. 89% 96% 98%
As at 2 May 2013. The above values exclude VISA students.
Overall Position Bands (OP)
Number of students in each Band for OP 1 to 25.
OP 1-5 OP 6-10 OP 11-15 OP 16-20 OP 21-25
2010 20 36 39 21 2
2011 13 31 34 19 1
2012 11 26 29 23 4
As at 2 May 2013. The above values exclude VISA students.
Vocational Educational Training qualification (VET)
Number of students awarded certificates under the Australian Qualification Framework (AQF).
Certificate I Certificate II Certificate III or above
2010 121 125 25

Performance of our students
2011 105 96 23
2012 105 115 27
As at 2 May 2013. The above values exclude VISA students.
The majority of the Certificate I qualifications awarded were in the area of Furnishing and Engineering. Students also received Certificate I qualifications in Information Technology, Business and Work Education.
Post-school destination information
At the time of publishing this School Annual Report, the results of the 2012 Year 12 cohort's post-school destinations survey, Next Step – Student Destination Report for the school were not available. Information about these post-school destinations of our students will be incorporated into this Report in September.
Early leavers information
The destinations of young people who left the school in Years 10, 11 and prior to completing Year 12 are closely tracked. The majority of students that do leave our school early do so because of the movement of the family away from the area. However it is our focus on the individual that is applied to assist those students who are looking for alternate pathways. These students are supported by our Welfare team and Senior Administration to transition to alternate senior learning pathways including TAFE, Get Set for Work, Community Classrooms and work.